Haemodynamic monitoring and management - PACT - ESICM
Haemodynamic monitoring and management - PACT - ESICM
Haemodynamic monitoring and management - PACT - ESICM

You also want an ePaper? Increase the reach of your titles
YUMPU automatically turns print PDFs into web optimized ePapers that Google loves.
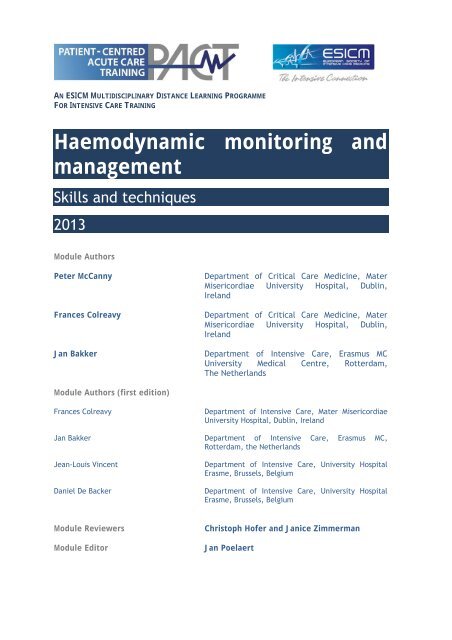
AN <strong>ESICM</strong> MULTIDISCIPLINARY DISTANCE LEARNING PROGRAMMEFOR INTENSIVE CARE TRAINING<strong>Haemodynamic</strong> <strong>monitoring</strong> <strong>and</strong><strong>management</strong>Skills <strong>and</strong> techniques2013Module AuthorsPeter McCannyFrances ColreavyJan BakkerDepartment of Critical Care Medicine, MaterMisericordiae University Hospital, Dublin,Irel<strong>and</strong>Department of Critical Care Medicine, MaterMisericordiae University Hospital, Dublin,Irel<strong>and</strong>Department of Intensive Care, Erasmus MCUniversity Medical Centre, Rotterdam,The Netherl<strong>and</strong>sModule Authors (first edition)Frances ColreavyDepartment of Intensive Care, Mater MisericordiaeUniversity Hospital, Dublin, Irel<strong>and</strong>Jan Bakker Department of Intensive Care, Erasmus MC,Rotterdam, the Netherl<strong>and</strong>sJean-Louis VincentDaniel De BackerDepartment of Intensive Care, University HospitalErasme, Brussels, BelgiumDepartment of Intensive Care, University HospitalErasme, Brussels, BelgiumModule ReviewersModule EditorChristoph Hofer <strong>and</strong> Janice ZimmermanJan Poelaert
LEARNING OBJECTIVESAfter studying this module on <strong>Haemodynamic</strong> <strong>monitoring</strong> <strong>and</strong> <strong>management</strong>, you should beable to:1. Determine the appropriate haemodynamic <strong>monitoring</strong> for diagnosis <strong>and</strong> assessment oftissue hypoperfusion in the clinical context.2. Describe the correct set-up of specific haemodynamic monitors <strong>and</strong> the treatmentslikely to be indicated by the findings.3. Discuss the complications <strong>and</strong> limitations of haemodynamic monitors.4. Interpret advanced haemodynamic data appropriately for diagnosis <strong>and</strong> therapy in themajor types of circulatory dysfunction.FACULTY DISCLOSURESThe authors reported the following disclosures: Jan Bakker received a research grant fromPulsion Benelux in support of a multi-centre study. Frances Colreavy reported nodisclosures. Peter McCanny reported no disclosures.DURATION 10 hoursCopyright©2013. European Society of Intensive Care Medicine. All rights reserved.
ContentsIntroduction .......................................................................................................... 11/ How do I choose the appropriate haemodynamic <strong>monitoring</strong>? ........................................... 2Step 1: Clinical assessment ..................................................................................... 2Step 2: Basic <strong>monitoring</strong> <strong>and</strong> assessment of global perfusion ............................................. 4ECG <strong>monitoring</strong> ................................................................................................ 4Blood pressure <strong>monitoring</strong> ................................................................................... 4SpO 2 <strong>monitoring</strong> ............................................................................................... 6Serum lactate .................................................................................................. 6Step 3: Preload <strong>and</strong> fluid responsiveness ..................................................................... 8Static measures of preload: Central venous pressure .................................................. 11Dynamic measures of preload: predicting fluid responsiveness ...................................... 14Volumetric parameters: Extravascular lung water (EVLW) ............................................ 16Step 4: Cardiac output <strong>monitoring</strong> ........................................................................... 19Overview of available devices .............................................................................. 19Basic principles of thermodilution <strong>and</strong> indicator dilution methods .................................. 20From basic principles to bedside for thermodilution <strong>and</strong> indicator dilution methods ............ 23Continuous cardiac output measurement: arterial pressure waveform analysis ................... 24Echocardiography <strong>and</strong> Doppler technology to measure cardiac output ............................. 26Newer devices to measure cardiac output ............................................................... 27Step 5: Assessment of cardiac contractility ................................................................. 28Echocardiography ............................................................................................ 28Arterial pressure waveform analysis to measure contractility ........................................ 29Step 6: Assessment of tissue perfusion ...................................................................... 29Assessing the microcirculation ............................................................................. 292/ How do I set up the chosen types of haemodynamic <strong>monitoring</strong>? ...................................... 31Electrocardiography ............................................................................................. 31Monitoring lead systems ..................................................................................... 31Non-invasive <strong>monitoring</strong> of arterial blood pressure ........................................................ 32Invasive <strong>monitoring</strong> of arterial blood pressure ............................................................. 33General principles of invasive pressure measurements ................................................ 34Pulse pressure variation ........................................................................................ 37Invasive <strong>monitoring</strong> of central venous pressure ............................................................ 37General principles of central venous catheterisation .................................................. 38Echocardiography................................................................................................ 39Pulse contour analysis .......................................................................................... 39PiCCO plus .................................................................................................... 39LiDCO plus ................................................................................................... 39Volume clamp method (e.g. Finapres , Nexfin ) ....................................................... 40
Transpulmonary thermodilution technique ................................................................. 40Pulmonary artery catheter ..................................................................................... 41Flotation of the pulmonary artery catheter .............................................................. 433/ Limitations <strong>and</strong> complications of haemodynamic <strong>monitoring</strong> ........................................... 50Electrocardiography ............................................................................................. 50Common ECG artefacts ...................................................................................... 51Pulse oximetry ................................................................................................... 53Venous oximetry ................................................................................................. 54Relationship between SvO 2 <strong>and</strong> ScvO 2 ..................................................................... 56Non-invasive <strong>monitoring</strong> of arterial blood pressure ........................................................ 57Invasive pressure <strong>monitoring</strong> .................................................................................. 57Complications during insertion <strong>and</strong> removal of <strong>monitoring</strong> catheters ............................... 57Complications occurring with <strong>monitoring</strong> devices in situ .............................................. 59Complications related to incorrect collection or interpretation of data ............................ 60Limitations of pulse contour analysis <strong>and</strong> transpulmonary thermodilution ......................... 63Minimally invasive methods of measuring cardiac output <strong>and</strong> cardiac contractility .............. 634/ Interpreting advanced haemodynamic data in the major types of circulatory dysfunction ........ 64Stroke volume/cardiac output/cardiac contractility ...................................................... 64Pulmonary artery catheter ..................................................................................... 65<strong>Haemodynamic</strong> data from the PAC in different clinical scenarios ................................... 66Conclusion ........................................................................................................... 69Patient Challenges ................................................................................................. 70
INTRODUCTION<strong>Haemodynamic</strong> instability is common in critically ill patients. Whenassociated with signs of inadequate organ or tissue perfusion,whatever the cause, it may present as shock; a constellation ofsymptoms, signs <strong>and</strong> laboratory abnormalities that are amanifestation of tissue hypoperfusion.<strong>Haemodynamic</strong>instability,whatever thecause, is calledcirculatory shock.Patients who survive the initial phase of shock may then develop the multiple org<strong>and</strong>ysfunction syndrome (MODS), which is a major cause of late death in the intensivecare unit (ICU). Although the pathophysiology of MODS is multifactorial <strong>and</strong> notalways precisely defined, haemodynamic instability, reduced organ perfusion <strong>and</strong>alterations in tissue microcirculation resulting in tissue hypoxia play key roles in theonset <strong>and</strong> maintenance of the syndrome.<strong>Haemodynamic</strong> <strong>monitoring</strong> is necessary for assessing global <strong>and</strong> regional tissueperfusion. Timely <strong>and</strong> adequate correction of instability <strong>and</strong> tissue hypoperfusion isessential to prevent progression to MODS. Intensive care practice is characterised bya very close temporal relationship between <strong>monitoring</strong>, decision-making <strong>and</strong>treatment. Appropriate <strong>and</strong> early application of diagnostic information fromhaemodynamic <strong>monitoring</strong> has been shown to reduce mortality in septic shock.Rivers E, Nguyen B, Havstad S, Ressler J, Muzzin A, Knoblich B, et al. Earlygoal-directed therapy in the treatment of severe sepsis <strong>and</strong> septicshock. N Engl J Med 2001; 345(19): 1368-1377. PMID 117941691
1/ HOW DO I CHOOSE THE APPROPRIATE HAEMODYNAMICMONITORING?At the bedside, haemodynamic stability <strong>and</strong> tissue perfusion are monitored by acombination of clinical examination, <strong>monitoring</strong> devices <strong>and</strong> laboratory results. Thedata obtained are used to direct a clinical <strong>management</strong> plan. The focus is patient nottechnology centred. In practice, the <strong>monitoring</strong> devices are employed in a series ofincreasingly invasive <strong>and</strong> complex steps based on clinical examination <strong>and</strong> thepatient’s response to treatment.<strong>Haemodynamic</strong> <strong>monitoring</strong> per se has no favourable impact on outcome. Onlythe interventions based on haemodynamic data will impact outcome.At the bedside, haemodynamic <strong>monitoring</strong> can be approached in a series of stepsaimed at assessing global <strong>and</strong> regional perfusion:Initial steps1. Clinical assessment2. Basic <strong>monitoring</strong> <strong>and</strong> assessment of global perfusion3. Preload <strong>monitoring</strong> <strong>and</strong> fluid responsivenessAdvanced <strong>monitoring</strong> measures4. Cardiac output <strong>monitoring</strong>5. Assessment of cardiac contractility6. Assessment of tissue perfusion.Step 1: Clinical assessmentA clinical examination is the fastest <strong>and</strong> least invasivehaemodynamic monitor available. Thirst, cold extremities, poorperipheral pulses <strong>and</strong> impaired capillary refill are useful immediateindices of hypoperfusion. A patient with inadequate global perfusionoften presents with one or several of these features: tachypnoea,tachycardia, confusion, altered skin perfusion <strong>and</strong> oliguria. Anawake, adequately talking patient is the best indicator of adequatecerebral perfusion. A patient complaining of ischaemic chest pain isindicating an imbalance between myocardial oxygen supply <strong>and</strong>dem<strong>and</strong>. Occasionally bradycardia (heart rate
MOTTLING SCOREGRADE 2 MOTTLINGScore 0= no mottlingScore 1= small area of mottling, localised to centre of kneeScore 2= modest mottling area that does not extend beyond superior border of kneecapScore 3= mild mottling area that does not extend beyond the mid- thighScore 4= severe mottling area, not going beyond the groin foldScore 5= extremely severe mottling area, extending beyond groin foldFor more information, see the <strong>PACT</strong> modules on Clinical examination <strong>and</strong> Oliguria<strong>and</strong> anuria (AKI Part I) <strong>and</strong> the following references.Talley NJ, O’Connor SO. Clinical examination. Sydney, Australia: MacLennan<strong>and</strong> Petty; 1992. p. 42Lima A, Bakker J. Noninvasive <strong>monitoring</strong> of peripheral perfusion. IntensiveCare Med 2005; 31(10): 1316–1326. PMID 16170543Ait-Oufella H, Lemoinne S, Boelle PY, Galbois A, Baudel JL, Lemant J, et al.Mottling score predicts survival in septic shock. Intensive Care Med 2011;37(5): 801–807. PMID 21373821Examine the next ten patients admitted to the intensive care unit <strong>and</strong>evaluate for evidence of tissue hypoperfusion. Discuss your findings with the ICUconsultant or colleague.3
Step 2: Basic <strong>monitoring</strong> <strong>and</strong> assessment of globalperfusionAll critically ill patients should have electrocardiographic (ECG), arterial bloodpressure (AP) <strong>and</strong> pulse oximetry (SpO 2 ) <strong>monitoring</strong>. Baseline serum lactatemeasurements <strong>and</strong> biochemical variables should be measured.ECG <strong>monitoring</strong>Heart rate is an important determinant of cardiac output.Tachyarrhythmias are the commonest finding in hypoperfusionstates. A 12-lead ECG performed on admission to the ICU confirmscardiac rhythm <strong>and</strong> provides baseline information on ST segments<strong>and</strong> T waves. Continuous <strong>monitoring</strong> of ST segments <strong>and</strong> the relatedalterations allows early recognition of myocardial ischaemia.Cardiac output =Stroke volume xHeart rateIn patients with temporary cardiac pacing, check the underlying cardiacrhythm.A 60-year-old female was paced via temporary epicardial pacing wirespost aortic valve replacement. When pacing output was suppressed, underlyingasystole was revealed <strong>and</strong> the arterial pressure trace disappeared. This patient wasmonitored in the High Dependency Unit until spontaneous rhythm resumed.ASYSTOLE UNDERLYING DDD PACINGDay 1Blood pressure <strong>monitoring</strong>Measuring arterial blood pressure (AP) is a cornerstone ofhaemodynamic assessment. The definition of low AP is patientspecific <strong>and</strong> interpreted in the context of the patient’s usual AP.Mean arterial blood pressure (MAP) is an approximation of organperfusion pressure. When stroke volume falls, MAP can initially bemaintained by increasing heart rate or peripheral vasomotor tone.Arterial bloodpressure = Cardiacoutput x Systemicvascular resistance4
Elevated AP, especially if acute, is associated with increased vascular resistance <strong>and</strong>may be associated with tissue malperfusion e.g. hypertensive encephalopathy oracute renal failure. For more information, see the <strong>PACT</strong> modules on Hypotension <strong>and</strong>Hypertension.Arterial blood pressure may be maintained by increasing heart rate toimprove cardiac output despite severe hypovolaemia, especially in younger patients.Blood pressure may be measured non-invasively with a cuff placedaround a limb <strong>and</strong> attached to a sphygmomanometer or anoscillometric device, or invasively using an indwelling catheter in anartery. Refer to Task 2.Tissuehypoperfusionmay exist in thepresence ofreduced, normalor elevated bloodpressure.Q. List the indications <strong>and</strong> relative indications for invasive blood pressure<strong>monitoring</strong>.A. Indications for invasive arterial pressure <strong>monitoring</strong>:Unstable blood pressure or anticipation of unstable blood pressureSevere hypotensionUse of rapidly acting vasoactive drugs; vasodilators, vasopressors, inotropesFrequent sampling of arterial blood.Relative indications for invasive blood pressure <strong>monitoring</strong>:Severe hypertensionPresence of an intra-aortic balloon pumpPatients with unreliable, or difficult to obtain, non-invasive BP.Q. List the contraindications to invasive blood pressure <strong>monitoring</strong>.A. Relative contraindications to invasive arterial pressure <strong>monitoring</strong>:Anticipation of thrombolytic therapySevere peripheral vascular disease preventing catheter insertionVascular anomalies – AV fistula, local aneurysm, local haematoma, Raynaud’sdiseaseLack of collateral blood flow distally (e.g. radial artery previously used forcoronary artery bypass surgery).Invasive <strong>monitoring</strong> allows beat-to-beat determination of AP. Hereis an example of the variability in AP <strong>and</strong> stroke volume that occursin atrial fibrillation.5Simultaneousrecording of ECG<strong>and</strong> invasive APtrace may revealimportantinformation aboutstroke volume.
ATRIAL FIBRILLATIONA 70-year-old male presented with an exacerbation of COPD. Non-invasiveAP measured in the right arm was 70/40 mmHg. Invasively-measured AP (same side)recorded similar pressure. A central venous catheter was inserted <strong>and</strong> noradrenaline(norepinephrine) infusion commenced. A nursing shift change occurred <strong>and</strong> noninvasiveAP was measured from the left arm; recorded at 160/80 mmHg. The patientwas weaned off the noradrenaline infusion. He had right subclavian artery stenosissecondary to peripheral vascular disease. Routinely measure AP in both arms onadmission to the ICU, especially if there is discordance between clinical assessment<strong>and</strong> AP. If there is a difference consider peripheral vascular disease, aortic dissectionor congenital heart disease.SpO 2 <strong>monitoring</strong>Continuous SpO 2 <strong>monitoring</strong> enables almost immediate detection ofeven a small reduction in arterial oxygen saturation, which is anintegral part of oxygen delivery. However, based on the sigmoidshape of the dissociation curve there is a time delay of thedetection of acute oxygenation failure. Taking into account theshape of the O 2 dissociation curve, SpO 2 should be maintained >92%in most critically ill patients. See the <strong>PACT</strong> module on RespiratoryAssessment <strong>and</strong> Monitoring for additional information.Serum lactateThe normal serum lactate level in resting humans is approximately 1mmol/L (0.7-2.0). The value is the same whether measured invenous or arterial blood (in the absence of a tourniquet). Elevatedserum lactate levels may represent poor tissue perfusion. Theassociation of increased lactate levels with circulatory failure,anaerobic metabolism <strong>and</strong> the presence of tissue hypoxia has led toits utility as a monitor of tissue perfusion in critically ill patients.The SpO 2 signal isoften inaccurate inthe presence ofaltered skinperfusion. Theinability to measureSpO 2 is an indicatorof abnormalperipheralperfusion.In carbon monoxidepoisoning, pulseoximetry does notprovide accuratemeasurement of O 2saturation.Know the normalrange of your locallaboratory or‘near-patienttesting’ unit.6
Increased serum lactate levels at admission to ICU <strong>and</strong> a failure to normaliselevels during treatment have been associated with increased morbidity <strong>and</strong>mortality.Factors that may contribute to hyperlactataemia: Increased production of lactate: tissue hypoxia Increased aerobic glycolysis Inhibition of pyruvate dehydrogenase (in sepsis) Methanol/ethylene glycol/propofol toxicity Thiamine deficiency Decreased clearance of lactate: liver dysfunction or failure,cardiopulmonary bypass (minor reduction in clearance) Exogenous sources of lactate:o Lactate buffered solutions used in continuousveno-venous haemodiafiltration (CVVHDF)o Medications (metformin, nucleosidic reversetranscriptase inhibitors, long-term linezolid use,intravenous lorazepam, valproic acido Haematologic malignancies.Repeatedmeasurements oflactateconcentrationsover time areparticularly usefulfor <strong>monitoring</strong> theresponse totherapy.The liver accountsfor approximately50% of lactateclearance.A 45-year-old male with an acute asthmatic attack had bilateral wheeze,a peak expiratory flow (PEFR) of 150 L/min <strong>and</strong> PaCO 2 4.0 kPa (32 mmHg), serumlactate 1.0 mmol/L. Nebulised salbutamol/ipraprotropium half hourly <strong>and</strong>hydrocortisone 200 mg i.v. six hourly were given. Concern about the PEFR led to i.v.salbutamol (15 mg/kg/min) treatment. Two hours later the patient lookedcomfortable, had mild expiratory wheeze <strong>and</strong> PEFR measured 150 L/min. The PaCO 2was 4.1 kPa (33 mmHg) <strong>and</strong> serum lactate 7 mmol/L. The patient was weaned off thei.v. salbutamol <strong>and</strong> within six hours serum lactate normalised. The PEFR meter waslater found to be faulty. Beta2-agonists e.g. salbutamol (or adrenaline) stimulateaerobic glycolysis producing increased pyruvate which may be metabolised tolactate.In this anecdote increased lactate level was not related to tissue hypoxia.Bakker J, Coffernils M, Leon M, Gris P, Vincent JL. Blood lactate levels aresuperior to oxygen-derived variables in predicting outcome in humanseptic shock. Chest 1991; 99(4): 956–962. PMID 2009802Bakker J. Lactate: may I have your votes please? Intensive Care Med 2001;27(1): 6–11. PMID 11280675Smith I, Kumar P, Molloy S, Rhodes A, Newman PJ, Grounds RM, et al. Baseexcess <strong>and</strong> lactate as prognostic indicators for patients admitted tointensive care. Intensive Care Med 2001; 27(1): 74–83. PMID 112806777
Wacharasint P, Nakada TA, Boyd JH, Russell JA, Walley KR. Normal-range bloodlactate concentration in septic shock is prognostic <strong>and</strong> predictive. Shock2012; 38(1): 4–10. PMID 22552014Nichol AD, Egi M, Pettilä V, Bellomo R, French C, Hart G, et al. Relativehyperlactatemia <strong>and</strong> hospital mortality in critically ill patients: aretrospective multi-centre study. Crit Care 2010; 14(1): R25. PMID20181242An initial assessment of the circulation is completed with the use of the described<strong>monitoring</strong> tools. If tissue malperfusion is suspected, measure haemoglobin <strong>and</strong>oxygen (PaO 2 ) levels <strong>and</strong> treat if necessary.Q. Describe how oxygen is delivered to tissues.A. Oxygen delivery depends on blood flow (systemically regarded as cardiac output)<strong>and</strong> arterial oxygen content.Oxygen delivery = cardiac output x arterial oxygen content.Q. If Hb is haemoglobin concentration <strong>and</strong> 1.39 is the volume of oxygen (mL) thatcombines with 1 gram of haemoglobin <strong>and</strong> SaO 2 is the percentage of Hb in arterialblood saturated with O 2 (normally 97% ± 2%), describe the oxygen contentequation.A. Arterial oxygen content = (Hb x 1.39 x SaO 2 ) + (0.003 x PaO 2 ) per 100 mLs ofblood.Arterial O 2 content consists mainly of O 2 combined with Hb. A very small additionalamount of O 2 is carried independently of Hb in physical solution. This is of the order0.003 times the arterial oxygen tension (PaO 2 ); normally 95 ± 5 mmHg (12.7 ± 0.7kPa).No physical sign or haemodynamic value is absolutely specific for circulatoryshock. The diagnosis should not be ruled out because a single finding, such ashypotension or lactic acidosis, is not present.If hypotension or hypoperfusion is present, commence empiric therapy (e.g.i.v. fluid administration) while instituting more advanced <strong>monitoring</strong>.Step 3: Preload <strong>and</strong> fluid responsivenessIn the presence of hypotension, an important step is the assessment of preload <strong>and</strong>fluid responsiveness.Preload is defined as end-diastolic myocardial stretch (wall tension)<strong>and</strong> is often estimated at the bedside by a single/staticmeasurement e.g. central venous pressure, CVP. More recently,assessment of fluid responsiveness (e.g. pulse pressure variation,8Preload can bedefined as thevolume present atthe end of diastolebefore contractionof the ventriclehas started.
PPV, systolic pressure variation, SPV) has been utilised in the careof critically ill patients.Clinically, preload may be separated into right ventricular (RV) <strong>and</strong> left ventricular(LV) preload. Jugular venous pressure (JVP) <strong>and</strong> CVP are used as surrogate estimatesof RV preload. Pulmonary artery occlusion pressure (obtained using pulmonary arterycatheter, see below) is used as a surrogate estimate of LV preload.Dynamic measures such as SPV are more accurate than static measurements forassessing fluid responsiveness in mechanically ventilated patients. In simple terms,assessing fluid responsiveness asks the question: will the cardiac output increase withfluid administration? The principle behind dynamic measures is that swings inintrathoracic pressure, imposed by mechanical ventilation, affect venous return <strong>and</strong>as a consequence cardiac output. These swings in cardiac output are exaggerated inhypovolaemia indicating that the heart is operating on the ascending limb of theFrank-Starling (FS) curve.STATIC AND DYNAMIC MEASURE OF PRELOAD AND THE DEVICES USED FOR MEASUREMENTPRELOADSTATICDYNAMICPRESSUREVOLUMECVPPAOPCVP= Central venouspressureMeasurement device:Central venouscatheterPAOP=Pulmonaryartery occlusionpressureMeasurement device:Pulmonary arterycatheterGEDVLVEDVGEDV= Global enddiastolicvolume(transpulmonarythermodilution)Measurement device:PiCCO , VolumeView LVEDV= Left ventricularend‐ diastolic volumeMeasurement device:EchocardiographyPPVSPVSVVIVC/ SVC‘collapsibility’PPV= pulse pressure variationMeasurement device:PiCCO , LiDCOplus ,Mostcare SPV= systolic pressurevariationMeasurement device:PiCCO , LiDCOplus ,Mostcare SVV= stroke volume variationMeasurement device:PiCCO , LiDCOplus ,Flotrac/Vigileo , Mostcare ,Volume clamp method (e.g.Finapres , Nexfin ),Oesophageal Doppler, Echo‐DopplerIVC= inferior vena cavaSVC= superior vena cava9
Fluid responsiveness is frequently defined as an increase in cardiac output(≥15% from baseline) with a fluid challenge.At the bedside, a rapid <strong>and</strong> easy way to assess fluid responsivenessis to give fluid, called a ‘fluid challenge’. A patient whose strokevolume increases following a fluid challenge is on the ascendinglimb of the Frank-Starling (FS) curve. In certain cases however, thepatient may lie on the flat part of the FS curve, <strong>and</strong> administrationof fluid may be harmful (e.g. poor LV function).FRANK-STARLING CURVE AND FLUID RESPONSEFLUID CHALLENGE:give 500 mL ofcrystalloid (or 250mL colloid) over10-15 minutes <strong>and</strong>observe effect onblood pressure <strong>and</strong>jugularvenous/centralvenous pressure, orstroke volume.An alternative to a fluid challenge is to perform a ‘passive leg raise’ manoeuvre. Thisproduces an ‘autotransfusion’ of blood from the venous compartments in theabdomen <strong>and</strong> lower limbs. It has the advantage of being easily reversible, <strong>and</strong> can beused in spontaneously breathing patients.The patient is transferred from 45 degrees semirecumbent position to the passive legraise (PLR) position, by using the automatic pivotal motion of the patient’s bed (seeimage below). For adequate autotransfusion to occur the patient should bemaintained in the PLR position for at least one minute, when the haemodynamiceffects should be observed.10
PASSIVE LEG RAISE MANOEUVRECavallaro F, S<strong>and</strong>roni C, Marano C, La Torre G, Mannocci A, De Waure C, et al.Diagnostic accuracy of passive leg raising for prediction of fluidresponsiveness in adults: systematic review <strong>and</strong> meta-analysis of clinicalstudies. Intensive Care Med 2010; 36(9): 1475–1483. PMID 20502865Monnet X, Teboul JL. Passive leg raising. Intensive Care Med 2008; 34(4): 659–663. PMID 18214429For the next ten patients in the ICU receiving a fluid bolus, think about theirposition on the Frank-Starling curve. Observe their response to a fluid challenge <strong>and</strong>discuss your findings with the ICU consultant or colleague.Static measures of preload: Central venous pressureCentral venous pressure (CVP) is considered a method of assessingright atrial pressure (RAP). It can be measured directly by placing acatheter in the superior vena cava. Traditionally, CVP has been usedby intensivists to guide fluid <strong>management</strong>, but it is a poor predictorof fluid responsiveness <strong>and</strong> may not accurately reflect preload: dueto the changes in venous tone, intrathoracic pressures, LV <strong>and</strong> RVcompliance, <strong>and</strong> geometry that occur in critically ill patients, thereis a poor relationship between the CVP <strong>and</strong> RV end-diastolic volume.An elevated CVPdoes not necessarilyindicate adequatepreload <strong>and</strong> shouldnot prevent a fluidchallenge ifindicated.CVP is used frequently in ICU as a central line is often needed for other reasons (e.g.administration of vasopressors, parenteral nutrition). CVP is at best a general guideto preload with greater emphasis on dynamic values (<strong>monitoring</strong> trends in CVP overtime) rather than single measurements. Despite this, it can provide importantinformation about cardiac performance.11
Clinical use of CVPThis can be approached in a stepwise manner:Observe morphology of traceThe classic ‘a, c, v’ pattern may not always be obvious. CVP morphology may give aclue to an underlying pathological process.CVP CLASSIC TRACEa wave= atrial contractionc wave= right ventricular contractionv wave= passive atrial fillingCVP SEVERE TRICUSPID REGURGITATIONGiant V wave: this occurs with severe tricuspid regurgitation, due to retrograde blood flowinto the right atrium during ventricular systole.Assess value of CVP after zeroingNormal mean CVP = 0-5 mmHg in spontaneously breathing patient.Upper normal limit CVP = 10 mmHg in mechanically ventilatedpatient.CVP >15 mmHg = always pathological (e.g. volume overload, rightventricular failure, cor pulmonale, congestive cardiac failure,cardiac tamponade, tension pneumothorax).Otherinterventions mayinfluence CVPvalue such asvasopressor dosechange or alteringpatient position.Observe response to fluid therapyA marked rise in CVP with fluid challenge indicates a failing ventricle.12
A 65-year-old lady who underwent aortic <strong>and</strong> mitral valve replacementdeveloped hypotension suddenly on day five postoperatively. CVP rose markedly from8 mmHg to 18 mmHg over a short period of time. This prompted resuscitation with IVfluid <strong>and</strong> vasoactive medications. Urgent bedside TTE (transthoracicechocardiography) revealed pericardial tamponade, prompting emergent sternotomy<strong>and</strong> surgical evacuation.Q. List four other causes of an elevated CVP.A. Acute heart failure, constrictive pericarditis, restrictive cardiomyopathy, tricuspidstenosis or regurgitation, pulmonary hypertension.Q. List the routes of placement of a central venous catheter.A. Central venous catheters can be inserted via several routes: internal jugular vein,subclavian vein, femoral vein.Q. List the indications for, <strong>and</strong> relative contraindications to, insertion of a centralvenous catheter.A. Indications for insertion of central venous catheter:Measurement of central venous pressure (providing catheter tip locatedproximal superior vena cava)Infusion of vasoactive drugs, hyperosmolar fluids (including parenteralnutrition), antibiotics, e.g. vancomycinInability to obtain peripheral intravenous accessHaemodialysis, plasmapheresis, transvenous pacing.Relative contraindications to insertion of a central venous catheter:Severe coagulopathy or anticipation of need for thrombolysisObvious infection of overlying skinThrombosis of superior vena cava or subclavian vein.Marik PE, Baram M, Vahid B. Does central venous pressure predict fluidresponsiveness? A systematic review of the literature <strong>and</strong> the tale ofseven mares. Chest 2008; 134(1): 172–178. PMID 18628220Vignon P. Evaluation of fluid responsiveness in ventilated septic patients: backto venous return. Intensive Care Med 2004; 30(9): 1699–1701. PMID15221127Magder S. Central venous pressure: A useful but not so simple measurement.Crit Care Med 2006; 34(8): 2224–2227. PMID 16763509Vallée F, Mari A, Perner A, Vallet B. Combined analysis of cardiac output <strong>and</strong>CVP changes remains the best way to titrate fluid administration inshocked patients. Intensive Care Med 2010; 36(6): 912–914. PMID2022174713
ScvO 2 (Central venous oxygen saturation)Insertion of a central venous catheter for CVP assessment alsoallows measurement of central venous oxygenation saturation, theoxygen saturation of blood in the superior vena cava. Alternatively,a ScvO 2 probe may be connected to a st<strong>and</strong>ard CVC for continuousmeasurement. ScvO 2 is a global indicator of tissue oxygenation <strong>and</strong>has been shown to be useful in guiding resuscitation in the earlystages of septic shock.The normal rangeof ScvO 2 incritically illpatients is 70-75%ScvO 2 value
PULSE PRESSURE VARIATIONA PPV of ≥13% has been shown to be a specific <strong>and</strong> sensitive indicator of preloadresponsiveness.Michard F, Boussat S, Chemla D, Anguel N, Mercat A, Lecarpentier Y, et al.Relation between respiratory changes in arterial pulse pressure <strong>and</strong> fluidresponsiveness in septic patients with acute circulatory failure. Am JRespir Crit Care Med 2000; 162(1): 134–138. PMID 10903232Prerequisites for the adequate use of PPV include sinus rhythm, absence ofspontaneous ventilatory effort (sedated), absence of right heart failure <strong>and</strong> a tidalvolume ≥8 mL/kg.Systolic pressure variation The change in systolic pressure over one mechanicalbreath is termed systolic pressure variation. Changes in systolic pressure withmechanical inspiration may predict response to volume expansion, but with lesssensitivity <strong>and</strong> specificity than PPV.Marik PE, Cavallazzi R, Vasu T, Hirani A. Dynamic changes in arterial waveformderived variables <strong>and</strong> fluid responsiveness in mechanically ventilatedpatients: a systematic review of the literature. Crit Care Med 2009;37(9): 2642–2647. PMID 19602972Stroke volume variation Stroke volume can be measured by arterial waveformanalysis. It can also be measured using oesophageal Doppler technology <strong>and</strong>echocardiography.15
SVV of ≥10% has also been shown to be a specific <strong>and</strong> sensitive predictor of fluidresponsiveness.De Backer D, Pinsky MR. Can one predict fluid responsiveness in spontaneouslybreathing patients? Intensive Care Med 2007; 33(7): 1111–1113. PMID17508200Bendjelid K, Rom<strong>and</strong> JA. Fluid responsiveness in mechanically ventilatedpatients: a review of indices used in intensive care. Intensive Care Med2003; 29(3): 352–360. PMID 12536268Pinsky MR, Payen D. Functional hemodynamic <strong>monitoring</strong>. Crit Care 2005; 9(6):566–572. PMID 16356240IVC/ SVC Collapsibility by transthoracic/transoesophageal echocardiographyPositive pressure ventilation also produces change in both superior vena cava (SVC)<strong>and</strong> inferior vena caval (IVC) diameter. Cyclical changes in SVC <strong>and</strong> IVC diameter,termed ‘collapsibility’, during mechanical ventilation may therefore be used topredict fluid responsiveness.The normal healthy heart is fluid responsive. The demonstration of fluidresponsiveness is not an indication, by itself, to administer fluids. Fluid therapyshould only be given if the patient is fluid responsive <strong>and</strong> there is evidence ofhypoperfusion.Vieillard-Baron A, Chergui K, Rabiller A, Peyrouset O, Page B, Beauchet A, etal. Superior vena caval collapsibility as a gauge of volume status inventilated septic patients. Intensive Care Med 2004; 30(9): 1734–1739.PMID 15375649Kircher BJ, Himelman RB, Schiller NB. Noninvasive estimation of right atrialpressure from the inspiratory collapse of the inferior vena cava. Am JCardiol 1990; 66(4): 493–496. PMID 2386120Volumetric parameters: Extravascular lung water (EVLW)Transpulmonary thermodilution has enabled measurement of several new volumetricparameters, which can be obtained with the PiCCO <strong>and</strong> VolumeView devices. Therelationship of these parameters is explained in the diagram below.16
VOLUMETRIC PARAMETERS MEASURED BY THERMODILUTIONThe most useful of these parameters is extravascular lung water (EVLW). This is anestimation of pulmonary oedema, the fluid accumulated in the interstitial <strong>and</strong>alveolar spaces. It is calculated indirectly from the thermodilution measurements ofintrathoracic thermal volume (ITTV - see below) <strong>and</strong> pulmonary thermal volume (PTV- see below), by subtracting the intrathoracic blood volume from the intrathoracicthermal volume.EVLW is indexed to ‘ideal’ body weight to produce an EVLW index (EVLWI)measurement. At the bedside, EVLWI measurements are useful in the detection ofpulmonary oedema, <strong>and</strong> in guiding the intensivist with fluid <strong>management</strong>.Intrathoracic thermal volume (ITTV) This is the volume of distribution of thethermal indicator, including: the heart (four cardiac chambers) <strong>and</strong> lungs (made upof intravascular volume, interstitial volume, <strong>and</strong> alveolar volume).Pulmonary thermal volume (PTV) Consists of the intravascular, interstitial, <strong>and</strong>alveolar volumes in the lungs.17
Global end-diastolic volume (GEDV) A volumetric measure of preload, <strong>and</strong> includesthe volume in the four cardiac chambers. It is calculated by subtracting PTV fromITTV. GEDV is also indexed to ideal body surface area <strong>and</strong> weight, to produce Globalend-diastolic volume index (GEDI) for use at the bedside.Intrathoracic blood volume (ITBV) The volume of blood in the thoracic vasculature,including the four cardiac chambers <strong>and</strong> the pulmonary vessels. It is calculated bymultiplying GEDV by 1.25. It is indexed to give an intrathoracic blood volume index(ITBI) measurement.Pulmonary vascular permeability index (PVPI) This is the ratio of EVLW topulmonary thermal volume, <strong>and</strong> reflects the permeability of the capillary-alveolarbarrier. Thus PVPI is higher in ALI/ARDS (meaning that EVLW is high compared toPBV) than in hydrostatic pulmonary oedema.Right ventricular end-diastolic volume (RVEDV) RVEDV is a volumetric measure ofcardiac preload. A recently available pulmonary artery catheter, with a rapidresponse thermistor permits nearly continuous assessment of RVEDV, right ventricularejection fraction <strong>and</strong> cardiac output.NORMAL VALUES FOR VOLUMETRIC PARAMETERSVolumetric parameterEVLWINormal values3.0- 7.0 mL/kgGEDI 600–800 mL/ m 2ITBI 850–1000 mL/ m 2PVPI 1–3RVEDVI 60–100 mL/m 2Sakka SG, Klein M, Reinhart K, Meier-Hellmann A. Prognostic value ofextravascular lung water in critically ill patients. Chest 2002; 122(6):2080–2086. PMID 12475851Sakka SG, Rühl CC, Pfeiffer UJ, Beale R, McLuckie A, Reinhart K, et al.Assessment of cardiac preload <strong>and</strong> extravascular lung water by singletranspulmonary thermodilution. Intensive Care Med 2000; 26(2): 180–187. PMID 10784306Monnet X, Anguel N, Osman D, Hamzaoui O, Richard C, Teboul JL. Assessingpulmonary permeability by transpulmonary thermodilution allowsdifferentiation of hydrostatic pulmonary edema from ALI/ARDS.Intensive Care Med 2007; 33(3): 448–453. PMID 1722118918
Belda FJ, Aguilar G, Perel A. Transpulmonary thermodilution for advancedcardiorespiratory <strong>monitoring</strong>. In: JL Vincent, ed. Yearbook of IntensiveCare <strong>and</strong> Emergency Medicine 2007. Berlin Heidelberg: Springer–Verlag;2007. pp. 501–510Oren-Grinberg A. The PiCCO monitor. Int Anesthesiol Clin 2010; 48(1): 57–85.PMID 20065727Step 4: Cardiac output <strong>monitoring</strong>Overview of available devicesCardiac output (CO) <strong>monitoring</strong> plays an essential role in critical care. Directmeasurement of CO should be considered when a patient remains hypotensivedespite adequate fluid resuscitation or when there is ongoing evidence of globaltissue hypoperfusion.There are many CO <strong>monitoring</strong> devices available today. These include devices whichuse methodologies based on indicator dilution, thermodilution, pulse pressureanalysis, Doppler principles, <strong>and</strong> also Fick principle. Patient status dictates the typeof CO <strong>monitoring</strong> required.CARDIAC OUTPUT MONITORING DEVICESMethodPulmonary thermodilutionTranspulmonarythermodilution dilutionTranspulmonary indicatordilutionArterial pressure waveformderivedOesophageal DopplerMonitoring SystemPulmonary artery catheter(PAC)PiCCO VolumeView LiDCO PiCCO LiDCO Flotrac/Vigileo Volume clamp method(Finapres , Nexfin )CardioQ Echocardiography (TTE <strong>and</strong>TOE)Applied Fick (Partial CO 2rebreathing)BioimpedanceBioreactanceNICO Lifegard TEBCO HOTMAN BioZ NICOM 19
Although not perfect, the pulmonary artery catheter (PAC, or right heart catheter, orSwan-Ganz Catheter) has long been considered the optimal form of haemodynamic<strong>monitoring</strong>. It allows for near continuous, simultaneous measurement of pulmonaryartery <strong>and</strong> cardiac filling pressures, cardiac output, <strong>and</strong> Sv̄O 2 (mixed venous oxygensaturation). Despite the relatively low risk of complications with the PAC (2-9%), thetechnique is invasive <strong>and</strong> its use has not been shown to clearly improve outcomes ofcritically ill patients (refer to PAC-Man study by Harvey et al, below). This has led tomarked interest in other techniques to assess <strong>and</strong> monitor CO. Each of these newertechniques has its own limitations which need to be considered when interpretingbedside data. It must be remembered that the PAC (the ‘clinical st<strong>and</strong>ard’ ofmeasuring CO) has an estimated precision of +/-20.Changes in serial cardiac output determinations within 10% are within therange of measurement errors. A greater variation can be expected in patients withpronounced variability in heart rate (e.g. atrial fibrillation).Binanay C, Califf RM, Hasselblad V, O’Connor CM, Shah MR, Sopko G, et al;ESCAPE Investigators <strong>and</strong> ESCAPE Study Coordinators. Evaluation studyof congestive heart failure <strong>and</strong> pulmonary artery catheterizationeffectiveness: the ESCAPE trial. JAMA 2005; 294(13): 1625–1633. PMID16204662Rhodes A, Cusack RJ, Newman PJ, Grounds RM, Bennett ED: A r<strong>and</strong>omised,controlled trial of the pulmonary artery catheter in critically illpatients. Intensive Care Med 2002; 28(3): 256–264. PMID 11904653Harvey S, Harrison DA, Singer M, Ashcroft J, Jones CM, Elbourne D, et al.Assessment of the clinical effectiveness of pulmonary artery catheters in<strong>management</strong> of patients in intensive care (PAC-Man): a r<strong>and</strong>omisedcontrolled trial. Lancet 2005; 366(9484): 472–477. PMID 16084255Vincent JL, Rhodes A, Perel A, Martin GS, Della Rocca G, Vallet B, et al. Clinicalreview: Update on hemodynamic <strong>monitoring</strong>- a consensus of 16. CritCare 2011; 15(4): 229. PMID 21884645De Backer D, Marx G, Tan A, Junker C, Van Nuffelen M, Hüter L, et al. Arterialpressure-based cardiac output <strong>monitoring</strong>: a multicenter validation ofthe third-generation software in septic patients. Intensive Care Med2011; 37(2): 233-240. PMID 21153399Basic principles of thermodilution <strong>and</strong> indicator dilution methodsThe principles underlying these techniques are essentially the same. For indicatordilution (e.g. LiDCO ) a change in indicator concentration is measured over time.20
INDICATOR DILUTION METHODThe change in concentration of indicator over time produces an indicator dilutioncurve.INDICATOR DILUTION CURVEFor thermodilution methods (e.g. pulmonary artery catheter, PiCCO , VolumeView )a drop in temperature is used instead of an injected indicator. A temperature–timecurve is thus produced.21
THERMODILUTION CURVE FOR PULMONARY ARTERY CATHETERThe temperature–time curves for the PAC <strong>and</strong> PiCCO /VolumeView will look slightlydifferent because of the different sites where the change in temperature is measured(pulmonary artery for PAC; femoral artery for PiCCO /VolumeView ).THERMODILUTION CURVE FOR PAC VERSUS PICCO22
SITES OF INJECTION AND TEMPERATURE MEASUREMENT: PAC VERSUS PICCOFrom basic principles to bedside for thermodilution <strong>and</strong> indicatordilution methodsPulmonary thermodilution (pulmonary artery catheter, PAC)Single measurement of CO: the original PAC measures CO by an intermittentthermodilution technique. A bolus of saline at room temperature is injected into theright atrium via a port in the PAC <strong>and</strong> mixes with body temperature blood in thecirculation. The change in temperature of blood in the pulmonary artery is measuredusing a thermistor at the tip of the PAC. The temperature drop over time is used tocalculate CO.Continuous CO: one type of PAC incorporates a thermal filament that warms blood inthe superior vena cava (SVC). The change in blood temperature at the PAC tip ismeasured <strong>and</strong> provides a continuous measurement of CO (See temperature–timecurve above). The displayed value represents an average of values over the previous60–120 seconds, rather than a ‘beat-to-beat’ or ‘minute-to-minute’ measurement.The device also has a STAT mode that allows inspection of the thermodilution curve.Transpulmonary thermodilutionThe PiCCO (Pulsion Medical Systems, Munich, Germany) <strong>and</strong> VolumeView (EdwardsLife Sciences) devices allow CO to be measured less invasively, using a central venous<strong>and</strong> a femoral arterial catheter, rather than a catheter in the pulmonary artery.Similar to the PAC, the devices measure a drop in temperature, using a thermistor inthe arterial line, to measure the cardiac output which is then utilised for calibration–see below. Brachial <strong>and</strong> axillary lines are also available.PiCCO <strong>and</strong> VolumeView also provide additional information that is used tocalculate likelihood of developing pulmonary oedema, by calculating extravascularlung water (EVLW) – see above.23
Single measurement of CO: Ice cold fluid is injected into the central line <strong>and</strong> thechange in temperature measured downstream to calculate CO. Thus they arereferred to as ‘transpulmonary’. This single measurement is used to calibrate thedevice <strong>and</strong> is recommended on set-up, every eight hours <strong>and</strong> in periods ofhaemodynamic instability or after adjustment of vasopressor infusion rates.Continuous CO: this is derived by analysing the arterial pressure waveform (seebelow).Jansen JR. The thermodilution method for the clinical assessment of cardiacoutput. Intensive Care Med 1995; 21(8): 691–697. PMID 8522677Transpulmonary indicator dilutionThe LiDCO (LiDCO , London, UK) device uses an indicator substance (lithiumchloride) rather than a temperature drop to measure CO.Single CO measurement: A small volume of lithium chloride is injected through acentral or peripheral line <strong>and</strong> measured downstream using a lithium-selectiveelectrode attached to the patient’s arterial line. This single measurement is used tocalibrate the device <strong>and</strong> is recommended on set-up, every eight hours <strong>and</strong> in periodsof haemodynamic instability or after adjustment of vasopressor infusion rates.Continuous CO: this is derived by analysing the arterial pressure waveform (seebelow).Continuous cardiac output measurement: arterial pressure waveformanalysisThe PiCCO <strong>and</strong> LiDCO <strong>and</strong> Flotrac/Vigileo systems provide continuous COmeasurement using the arterial pressure waveform. These systems analyse thearterial waveform <strong>and</strong> use algorithms to calculate the CO. The newer versions LiDCO (LiDCOrapid ) <strong>and</strong> Flotrac/Vigileo do not require calibration.The main advantage of the arterial pressure trace-derived systems is that they areless invasive than the PAC. However they have weaknesses which limit their use incertain clinical situations.The way in which the arterial pressure waveform is analysed is slightly different witheach device. PiCCO analyses the systolic portion of the arterial waveform. LiDCO analyses the waveform with what is called pulse power analysis. Flotrac/Vigileo analyses the waveform 100 times/second over 20 seconds, capturing 2000 data pointsfor analysis. This is then incorporated into a proprietary formula to calculate CO.24
ARTERIAL WAVEFORM ANALYSIS METHODSVolume clamp method This newer non-invasive technique uses an inflatable fingercuff. Photoelectric plethysmography in combination with a volume clamp technique(inflatable finger cuff) is used to produce a brachial arterial waveform, allowingcontinuous CO to be measured. Data to date on the usefulness of this technique inthe critically ill is limited.VOLUME CLAMP TECHNIQUE (NEXFIN ) AT THE BEDSIDE25
Echocardiography <strong>and</strong> Doppler technology to measure cardiac outputEchocardiography has become an important diagnostic <strong>and</strong><strong>monitoring</strong> tool in critical care.Cardiac output can be measured by 2D echocardiography <strong>and</strong>Doppler technology, using either a transthoracic (TTE) ortransoesophageal (TOE) technique. TTE has the advantage of beingrapid <strong>and</strong> non-invasive, but images may sometimes be limited inventilated ICU patients. TOE provides high quality images but ismore invasive than TTE.Stroke volume is calculated using Doppler to measure the velocitytime integral (VTi) of the flow signal at a given site, <strong>and</strong> 2D echo tomeasure the cross sectional area of the same site. Thesemeasurements of flow <strong>and</strong> diameter are usually obtained at thelevel of the left ventricular outflow tract (LVOT), <strong>and</strong> then used tocalculate CO. Many modern machines will compute this informationautomatically when measurements are entered. Echo-Dopplercalculation of CO is operator dependent, <strong>and</strong> continuousmeasurement of CO cannot be performed using this technique.Echocardiography isthe haemodynamicmonitor of choice indiagnosinghypotension ofunknown aetiology incritically ill patients.Consider performingan echocardiogram inany critically illpatient notresponding totherapy.TRANSTHORACIC ECHOCARDIOGRAPHY MEASUREMENT OF VELOCITY TIME INTEGRAL (APICAL 5 CHAMBERVIEW OF LVOT)26
TRANSTHORACIC ECHOCARDIOGRAPHY MEASUREMENT OF LVOT DIAMETER (PARASTERNAL LONG AXISVIEW)For further information on the use of TTE see the references below.Continuous transoesophageal echocardiography (hTEE) The hTEE (ImaCor inc,Garden City, New York, USA) is a miniaturised TOE probe which allows continuousqualitative haemodynamic assessment from a transverse plane, allowing visualassessment of cardiac performance <strong>and</strong> fluid status. It consists of a disposable probe(licenced for use up to 72 hours) which is connected to the echocardiographymachine. Although smaller than a conventional TOE probe, some of thecontraindications to TOE use may still apply with this device. There has been limitedevaluation of this technique to date in critically ill patients.Oesophageal Doppler <strong>monitoring</strong> Oesophageal Doppler (ODM) measures blood flowvelocity in the descending aorta by using a Doppler transducer at the tip of a probe,which is inserted into the oesophagus via the mouth or nose.Kaddoura S. Echo made easy, 2 nd edition. Churchill Livingstone, Elsevier 2009.ISBN 978-0-443-10363-6DeBacker, Cholley, Slama, Vieillard- Baron, Vignon. <strong>Haemodynamic</strong> <strong>monitoring</strong>using echocardiography in the critically ill, 1 st edition. Springer 2011.ISBN 978-3-540-87954-1Newer devices to measure cardiac outputApplied Fick principle This technique applies the Fick principle to CO 2 in order toobtain a cardiac output measurement in intubated, mechanically ventilated, <strong>and</strong>27
sedated patients using a disposable rebreathing loop attached to the ventilatorcircuit. The method may only be applied accurately in a precisely defined clinicalsetting (controlled mechanical ventilation with no variation in settings,haemodynamic stability, minimal abnormality of gas exchange, minimal deadspace),<strong>and</strong> therefore its usefulness in the critical care setting may be limited.Electrical Bioimpedance <strong>and</strong> Bioreactance Bioimpedance uses electrical currentstimulation to identify thoracic or body impedance variations induced by cyclicalchanges in blood flow. CO is estimated continuously using skin electrodes orelectrodes placed on an endotracheal tube, by analysing the signal variation withdifferent mathematical models. The Bioreactance technique analyses the variationsin the frequency of a delivered oscillating current occurring when the currenttraverses the thoracic cavity. Data on the reliability <strong>and</strong> impact on patient care ofthese devices in the critically ill are lacking.Step 5: Assessment of cardiac contractilityAssessing cardiac contractility is important in establishing the aetiology of shock, <strong>and</strong>in guiding further therapy. For example, a patient in cardiogenic shock with poor LVfunction is likely to require inotropy with adrenaline or dobutamine infusion, whereasa septic patient with a hyperdynamic heart is more likely to benefit from avasopressor infusion such as noradrenaline.EchocardiographyCardiac performance may be rapidly assessed at the bedside using transthoracicechocardiography (TTE). A visual assessment of LV function will often reveal anysignificant abnormality. Formal estimation of LV contractility can be performed bymeasuring ejection fraction (EF). The EF is the percentage of LV diastolic volumeejected with each heart beat (normal >55%).EF (%) = {(EDV- ESV)/ EDV} x 100LEFT VENTRICULAR EJECTION FRACTION RANGESEjection fraction (EF)ValueNormal ≥55%Mild impairment 45–54%Moderate impairment 30–44%Severe impairment
Echocardiography should not be viewed simply in the context of cardiacoutput or ejection fraction. It can provide an assessment of preload <strong>and</strong> diagnosepotentially reversible ventricular or valvular pathologies, cardiac tamponade, ormassive pulmonary embolism.Price S, Nicol E, Gibson DG, Evans T. Echocardiography in the critically ill:current <strong>and</strong> potential roles. Intensive Care Med 2006; 32(1): 48–59. PMID16292626Donovan KD, Colreavy FB. In: Bernsten A, Soni N, Oh TE, editors. Oh’s IntensiveCare Manual. 5th ed. Butterworth-Heinemann; 2003. p 265. ISBN-10 0-7506-5184-9Colreavy FB, Donovan K, Lee KY, Weekes J. Transesophageal echocardiographyin critically ill patients. Crit Care Med 2002; 30(5): 989–996. PMID12006793Joseph MX, Disney PJ, Da Costa R, Hutchison SJ. Transthoracicechocardiography to identify or exclude cardiac cause of shock. Chest2004; 126(5): 1592–1597. PMID 15539732Arterial pressure waveform analysis to measure contractilityLeft ventricular contractility can also be estimated by analysis of the arterialwaveform. It is derived from the maximum speed of the arterial pressure curve(dP/dt max ) during the ejection phase.Step 6: Assessment of tissue perfusionAssessing the adequacy of tissue perfusion has traditionally focused on globalparameters of perfusion such as: clinical examination, arterial blood pressure, urineoutput, serum lactate <strong>and</strong> base deficit measurements, central <strong>and</strong> mixed venousoxygen saturation.In sepsis however, tissue hypoperfusion may result from a reduction in perfusionpressure due to both hypotension, <strong>and</strong> abnormal distribution of flow to the tissues.Regional flow to tissues is regulated by the ‘microcirculation’.Microcirculatory failure during septic shock is characterised byoxygen shunting, vasoconstriction, tissue oedema, <strong>and</strong> thrombosis,resulting in impairment in flow distribution within the tissues. Thereis now strong evidence that failure of the microcirculation plays animportant role in end-organ dysfunction, <strong>and</strong> has adverse prognosticimplications in patients with septic shock.Microcirculation isthe vascularnetwork withinmuscles <strong>and</strong> tissues,comprising thearterioles, venules,<strong>and</strong> capillary beds.Assessing the microcirculationThe microcirculation can be directly visualised using orthogonal polarisation spectral(OPS) <strong>and</strong> sidestream dark field (SDF) imaging devices. These devices use theprinciple that green light illuminates the depth of a tissue, <strong>and</strong> that scattered light is29
absorbed by haemoglobin of red cells contained in superficial vessels. This enablesthe visualisation of capillaries <strong>and</strong> venules. These devices have been used in clinicalresearch to evaluate the microcirculation but have not yet found a role in clinicalpractice.Near infra-red spectroscopy (NIRS) uses the principle that the differentchromophores present in skeletal muscle (such as oxy-haemoglobin, deoxyhaemoglobin,<strong>and</strong> myoglobin) have differing absorption properties of light, thusallowing tissue oxygen saturation (StO 2 ) to be derived. Non-invasive measurements ofStO 2 using NIRS has been shown to be a reliable way of measuring themicrocirculation in both septic <strong>and</strong> trauma patients. StO 2 measurements may beperformed using a non-invasive probe either sublingually, at the thenar eminence, orat the knee (see study by Ait-Oufella et al below).Abnormalities of the microcirculation initially or persisting following macrohaemodynamic optimisation, as measured by OPS, SDF <strong>and</strong> NIRS, have been shown tobe associated with poor prognosis in sepsis, trauma <strong>and</strong> general ICU patients, buttargeting these regional measures of perfusion has not yet been shown to improveoutcome. As a result these devices are not currently used in routine clinical practice.See the references below for further information on the microcirculation.Hollenberg SM. Think locally: evaluation of the microcirculation in sepsis.Intensive Care Med 2010; 36(11): 1807–1809. PMID 20725822De Backer D, Hollenberg S, Boerma C, Goedhart P, Büchele G, Ospina-Tascon G,et al. How to evaluate the microcirculation: report of a round tableconference. Crit Care 2007; 11(5): R101. PMID 17845716Mesquida J, Espinal C, Gruartmoner G, Masip J, Sabatier C, Baigorri F, et al.Prognostic implications of tissue oxygen saturation in human septicshock. Intensive Care Med 2012; 38(4): 592–597. PMID 22310873Ait-Oufella H, Joffre J, Boelle PY, Galbois A, Bourcier S, Baudel JL, et al. Kneearea tissue oxygen saturation is predictive of 14-day mortality in septicshock. Intensive Care Med 2012; 38(6): 976–983. PMID 22527071Lima A, van Bommel J, Jansen TC, Ince C, Bakker J. Low tissue oxygensaturation at the end of early goal-directed therapy is associated withworse outcome in critically ill patients.Crit Care 2009; 13 Suppl 5:S13.PMID 1995138530
2/ HOW DO I SET UP THE CHOSEN TYPES OF HAEMODYNAMICMONITORING?ElectrocardiographyHeart rate, most frequently obtained from an ECG tracing, is availablesimultaneously from pulse oximetry <strong>and</strong> intra-arterial blood pressure <strong>monitoring</strong>.Heart rate is calculated from the R-R interval <strong>and</strong> care should be taken tohave the monitor distinguish the R wave from the T wave. Choose a lead where theQRS either is completely above or below the baseline <strong>and</strong> is not biphasic.ECG calibrationECG paper st<strong>and</strong>ardisationVerticallyan impulse of 1 mV causes a deflection of 10 mm in height (2 largesquares)Horizontallyeach mm (1 small square) represents a unit of time: 0.04 sec. One largesquare (5 small squares) = 0.20 secsMonitoring lead systemsThe <strong>monitoring</strong> lead system most commonly used in clinical practice is a 3-electrodebipolar system that can display leads I, II, III <strong>and</strong> a modified chest lead (e.g. V1).Lead II is commonly used for continuous ECG display.3-LEAD ECGECG 3-lead Placements: RA (right arm): directly below the clavicle <strong>and</strong> near right shoulder,LA (left arm): directly below the clavicle <strong>and</strong> near the left shoulder, LL (left lower): on theleft lower abdomen.31
Alternatively, a 5-electrode system that can display the six limbleads (I, II, III, aVR, aVL, or aVF) <strong>and</strong> any one of the st<strong>and</strong>ard V1-V6leads (depending on location of chest electrode) is used. AccurateST-segment displacement <strong>monitoring</strong> requires multi-lead <strong>monitoring</strong><strong>and</strong> precordial leads. For more information, see the <strong>PACT</strong> moduleon Arrhythmia.5-LEAD ECGIn a 5-electrode ECGsystem, lead V1location is mostaccurate fordiagnosing left <strong>and</strong>right bundle branchblock <strong>and</strong> fordistinguishingventricular tachycardiafrom supraventriculartachycardia withaberrant conduction5-lead ECG Placements: RA, LA, LL as for the 3-lead placement system. RL (rightlower): on the right lower abdomen, C: on the chest, the position depends on therequired lead selection.Drew BJ, Califf RM, Funk M, Kaufman ES, Krucoff MW, Laks MM, et al. Practicest<strong>and</strong>ards for electrocardiographic <strong>monitoring</strong> in hospital settings: anAmerican Heart Association scientific statement. Circulation 2004;110(17): 2721–2746. PMID 15505110Non-invasive <strong>monitoring</strong> of arterial blood pressurePalpation This provides a qualitative measure of systolic arterialpressure.Auscultation Brachial artery occluded by a cuff placed around theupper arm <strong>and</strong> inflated above systolic pressure. As the cuff isdeflated, the return of pulsatile blood flow is accompanied bysounds that can be heard with a stethoscope placed over the artery.Most automatednon-invasive bloodpressure <strong>monitoring</strong>systems useoscillometry.32
Oscillometric techniques A cuff with an inflatable bladder is placedwith the centre over the brachial artery or mid-thigh, or mid-calf.The oscillations of pressure in a sphygmomanometer cuff arerecorded during inflation; the point of maximal oscillationcorresponds to mean arterial pressure measurement. Theoscillations begin above systolic <strong>and</strong> continue below diastolic;systolic <strong>and</strong> diastolic pressures are estimated from an algorithm.Non-invasive<strong>monitoring</strong> ofarterial bloodpressure isunreliable incirculatory shock.Pickering TG, Hall JE, Appel LJ, Falkner BE, Graves J, Hill MN, et al.Recommendations for blood pressure measurement in humans <strong>and</strong>experimental animals: part 1: blood pressure measurement in humans.Circulation 2005; 111(5): 697–716. PMID 15699287Jones DW, Appel LJ, Sheps SG, Roccella EJ, Lenfant C. Measuring bloodpressure accurately: new <strong>and</strong> persistent challenges. JAMA 2003; 289(8):1027–1030. PMID 12597757Invasive <strong>monitoring</strong> of arterial blood pressureInvasive arterial blood pressure <strong>monitoring</strong> is m<strong>and</strong>atory in shock states; it involvesAn intravascular catheter.A fluid-filled electro-mechanic <strong>monitoring</strong> system containingtubing, pressure transducer, <strong>and</strong> flush system.A monitor containing an amplifier to convert the smallelectronic signal generated by the transducer to a waveformthat is displayed on a screen.HAEMODYNAMIC MONITORING SYSTEMThe ideal artery for<strong>monitoring</strong> pressurehas adequatecollateralcirculation. Radial,brachial, femoral<strong>and</strong> dorsalis pedissites can be used.33
The systolic AP increases progressively from the ascending aorta to theperipheral arteries. Thus, the systolic pressure may be 20-30 mmHg higher in thefemoral artery than in the brachial or ulnar arteries.General principles of invasive pressure measurementsThe catheter is inserted into the vessel to be monitored <strong>and</strong> theexternal end connected to fluid-filled stiff connecting tubing.Pulsatile pressure signals at the catheter tip are propagated throughthe fluid in the tubing to the transducer. A pressure-sensitivediaphragm within the transducer is displaced each time it is struckby a fluid transmitted pressure pulsation. An electrical cableconnects the transducer to the monitor. A pressurised flush systemis designed to keep the catheter free from clots <strong>and</strong> provides aconvenient means to flush or test the system. The flush bag ispressurised to 200–300 mmHg.A transducer is adevice that convertsenergy from one formto another; in thiscase a pressure signalinto an electricalsignal displayed on amonitor.Of particular importance:Zero reference ‘Zeroing’ a transducer defines a reference levelfrom which all vascular pressures will be measured. By convention,pressures are measured relative to the level of the right atrium.‘Zeroing’ involves opening the transducer stopcock to atmosphere<strong>and</strong> placing the air-reference port of the stopcock at the level ofthe midaxillary line 4th intercostal space, corresponding to the levelof the estimated level of the right atrium. With the stopcock openat this level, the monitor displays 0. The stopcock is then closed toatmosphere <strong>and</strong> opened to the catheter for measurement ofintravascular pressures devoid of either atmospheric or hydrostaticpressure influences. The transducer <strong>and</strong> air-reference stopcockmust be kept at this level for subsequent accurate measurement ofall pressures.Changes in thepatient’s positionmust beaccompanied byappropriatetransducer/airreferencestopcockrepositioning <strong>and</strong>re-zeroing.Dynamic response of the fluid-filled <strong>monitoring</strong> system refers to the ability of thesystem to accurately reproduce the patient’s haemodynamic waveform. Twofeatures, resonant frequency <strong>and</strong> damping coefficent, determine the dynamicresponse of the <strong>monitoring</strong> system. The resonant frequency of the system is thefrequency at which it oscillates when stimulated. The resonant or natural frequencyof the system must be greater than the highest frequency of the incoming pulsatilesignal, otherwise components of the waveform will be exaggerated. A resonantfrequency greater than 20 Hertz (Hz) is needed to faithfully reproduce an arterialpressure having a frequency of 120 bpm, or 2 Hz. (a heart rate of 60 bpm has afrequency of 1 Hz). Nowadays most transducers <strong>and</strong> tubing sets are disposable <strong>and</strong>sold together, therefore the chance of connecting tubing which is inappropriate (interms of resonance frequency) for measurement is unlikely.Damping coefficient refers to how quickly the oscillating, fluid-filled system comesto rest. A system with a high damping coefficient will result in diminution of thearterial waveform. A system with a low damping coefficient will cause systolic <strong>and</strong>diastolic overshoot of the signal. Dynamic response testing is easily performed usingthe fast-flush test; briefly open <strong>and</strong> close the fast-flush system to produce a square34
wave that is followed by one or two rapid small oscillations before returning tobaseline.FAST-FLUSH TESTQ. What is the ‘damping coefficient’?A. Damping can be expressed as damping coefficient zeta. Zeta can be calculated fora system as follows: Zeta = 4µ/r 3 SR(ρL/πE).Where µ = fluid viscosity, r = radius of tubing, SR = square root, ρ = density, L =length of tubing, E = elasticity of tubing. Changes in any of these elements will affectdamping.Q. What factors may cause overdamped pressure tracings?A. In clinical practice an overdamped tracing (blunted) is usually caused by:Air bubbles, kinks or clot formation in the pressure tubing.Loose connections in the fluid-filled electronic <strong>monitoring</strong> system.Inadequate stiffness of the pressure tubing; soft low-compliance tubingresults in a decrease in the natural frequency of the system such that it fallsbelow the limit needed to record all the elements of the waveform.An underinflated pressure bag.An overdamped waveform displays a falsely decreased systolic pressure <strong>and</strong> a falsehighdiastolic pressure, in addition to an absent or diminished dicrotic notch.Q. What factors may cause underdamped pressure tracings?A. An underdamped tracing (exaggerated) can be secondary to:Uses of soft, compliant tubing resulting in decreased natural frequency thatmay be exactly equal to one of the harmonics of transmitted pressure wavecausing the tubing to vibrate more intensely. The result is artefact withovershoot of systolic pressure <strong>and</strong> ringing or vibration spikes that can obscurethe waveform morphology.35
Excessive tubing length; longer tubing systems will have a lower naturalfrequency. Patient factors such as a hyperdynamic circulation (sepsis, aorticregurgitation) require a higher frequency response of the <strong>monitoring</strong> system.Hypertension <strong>and</strong> atherosclerosis also require a higher frequency response.Tachycardia: generates increased pressure signals per minute requiring ahigher frequency response from the system. For example, if a patient’s heartrate increases from 60 bpm (1 Hz or pressure signal per second) to 180 bpm (3Hz or pressure signal per second) a <strong>monitoring</strong> system that is capable ofreproducing a minimum natural frequency of 20 Hz may be overwhelmed.An underdamped wave displays a false-high systolic pressure overshoot, possibly afalse-low diastolic pressure <strong>and</strong> a ringing artefact. The latter are multiple smallspikes in the down stroke of the waveform.OPTIMALLY DAMPED ARTERIAL WAVEFORMOVERDAMPED ARTERIAL WAVEFORMInvasive pressure <strong>monitoring</strong> is subject to numerous potential pitfalls. If indoubt about the validity of an invasive arterial pressure reading, check the resonantfrequency <strong>and</strong> damping coefficient. If possible, cross check the value using a noninvasivemethod at the same site.Rippe JM, Irwin RS, Fink MP, Cerra F, editors. Intensive Care Medicine.Lippincott Willliams & Wilkins; 6th edition, 2007. ISBN-10 0781791537ISBN-13 978-0781791533Tobin MJ, ed. Principles <strong>and</strong> Practice of Intensive Care Monitoring. McGraw–Hill; 1998. p. 91. ISBN-10 007065094236
Pulse pressure variationPulse pressure is the difference between arterial systolic <strong>and</strong> diastolic pressure.Refer to Task 1. In the example below, PP max <strong>and</strong> PP min are indicated by the boldlines. In this case the pulse pressure variation was calculated to be 25% indicatinglikely fluid responsiveness in a mechanically ventilated patient. See Task 1. Thepatient was in sinus rhythm <strong>and</strong> the CVP was 6 mmHg at the time of recording.Invasive <strong>monitoring</strong> of central venous pressureCentral venous pressure <strong>monitoring</strong> involves a catheter with the tip in the proximalsuperior vena cava <strong>and</strong> a fluid-filled electronic <strong>monitoring</strong> system to measure thepressure.Site selection; two routes are available: internal jugular or subclavian vein. Femoralvein catheterisation allows measurements of the pressure in the inferior vena cava.Central venous pressure measurement via the femoral route may correlate withsuperior vena cava pressure measurement, provided the patient is in the supineposition <strong>and</strong> intra-abdominal pressure is normal.Dillon PJ, Columb MO, Hume DD. Comparison of superior vena caval <strong>and</strong>femoroiliac venous pressure measurements during normal <strong>and</strong> inverseratio ventilation. Crit Care Med 2001; 29(1): 37–39. PMID 1117615637
Ait-Oufella H, Boelle PY, Galbois A, Baudel JL, Margetis D, Alves M, et al.Comparison of superior vena cava <strong>and</strong> femoroiliac vein pressureaccording to intra-abdominal pressure. Ann Intensive Care 2012; 2(1):21. PMID 22742667General principles of central venous catheterisationECG <strong>monitoring</strong> during insertion of a central venous catheter isrecommended as arrhythmias may occur during guide wireinsertion.Full barrier, sterile technique (surgical gown, gloves <strong>and</strong> mask)is required for central catheter placement. Allow sufficienttime (2-3 minutes) for the antiseptic to dry. A sterile drapeshould cover at least half the body to allow manipulation ofthe guide wire within a sterile field.Placing the patient in head down position allows centralthoracic veins to distend <strong>and</strong> makes cannulation of the jugularor subclavian veins easier. It also reduces the risk of airembolism.A seeker or finder needle (22-25-gauge) attached to a 5 mLsyringe may be used to locate the vein before a largercatheter/needle is used. Two-dimensional ultrasound also isuseful <strong>and</strong> has been shown to reduce the rate of mechanicalcomplications associated with central venous cannulation.A Seldinger technique is used for central venous cannulation.The vessel is cannulated <strong>and</strong> a guide wire advanced; theinsertion site is enlarged with a small skin incision <strong>and</strong> a vesseldilator is advanced over the guide wire, presuming resistanceis not encountered. The dilator is removed <strong>and</strong> the centralcatheter is advanced over the guide wire to the superior venacava. The guide wire is removed <strong>and</strong> the catheter is connectedto a fluid-filled <strong>monitoring</strong> system. Always ensure the guidewire protrudes through the distal end of the introducingneedle/catheter to allow retrieval.Central venousversus arteriallocation can bedifferentiated byperforming a bloodgas analysis <strong>and</strong>comparingsaturations <strong>and</strong>PaO 2 .Alternatively, theintravascularpressure may betransduced <strong>and</strong> thewaveformobserved. If indoubt call for helpprior to attempteddilatation.Resuscitationequipmentincluding airway<strong>management</strong> <strong>and</strong>defibrillationequipment shouldbe immediatelyavailable.Volume resuscitation is not an indication for insertion of a central venouscatheter as fluid can be delivered faster through a short wide-bore peripheralcatheter.Graham AS, Ozment C, Tegtmeyer K, Lai S, Braner DA. Videos in clinicalmedicine. Central venous catheterization. N Engl J Med 2007; 356(21):e21. PMID 17522396Maecken T, Grau T. Ultrasound imaging in vascular access. Crit Care Med 2007;35(5 Suppl): S178–S185. PMID 1744677738
Hind D, Calvert N, McWilliams R, Davidson A, Paisley S, Beverley C et al.Ultrasonic locating devices for central venous cannulation: metaanalysis.BMJ 2003; 327(7411): 361. PMID 12919984EchocardiographyEchocardiography can be a life-saving tool in critically ill patients.Hypotension associated with a large pericardial effusion, severe LVdysfunction or acute RV dilatation can be quite easily recognised ontwo-dimensional echocardiography.It has been suggestedthat all critical carephysicians should beable to perform a basicultrasound examinationwhen the aetiology ofhaemodynamic shock isunclear.Information on echocardiography training, courses <strong>and</strong> accreditation is available fromthe sources below. The expert statement provides a consensus document onst<strong>and</strong>ards for critical care echocardiography training.Expert Round Table on Ultrasound in ICU. International expert statement ontraining st<strong>and</strong>ards for critical care ultrasonography. Intensive Care Med2011; 37(7): 1077–1083. PMID 21614639Cholley B, Vieillard-Baron A, Mebazaa A. Echocardiography in the ICU: time forwidespread use! Intensive Care Med 2006; 32(1): 9–10. PMID 16292627http://www.esicm.org/http://www.intensive.org/http://www.asecho.org/http://www.escardio.org/bodies/associations/EAEPulse contour analysisPiCCO plusSee transpulmonary thermodilution technique (Task 1 <strong>and</strong> below).LiDCO plusEquipment A peripheral arterial catheter, calibration disposables (lithium sensor,lithium chloride ampoule (0.15 mmol/mL), disposable blood collection bag), flowregulator pump (battery operated), st<strong>and</strong>-alone LiDCO haemodynamic monitor.Calibration involves measurement of the CO via indicator dilution technique in which2 mL (0.3 mmol) of lithium is injected into a central or peripheral venous catheter.The arterial catheter is opened to the lithium sensor via a three-way stopcock <strong>and</strong>flow regulator pump allows the blood to pass the sensor at a determined rate. Alithium dilution curve is generated which serves as a calibration CO. Calibrationshould be performed once each shift <strong>and</strong> before initiating any major treatmentchanges.39
Continuous stroke volume <strong>and</strong> cardiac output beat-to-beat stroke volume iscalculated based on an algorithm which uses the calibration CO measurement <strong>and</strong>harmonic waveform analysis (Fourier transformation). CO is determined from thecomputed stroke volume <strong>and</strong> heart rate.Cholley BP, Payen D. Noninvasive techniques for measurements of cardiacoutput. Curr Opin Crit Care 2005; 11(5): 424–429. PMID 16175028Sakka SG, Reinhart K, Meier-Hellmann A. Comparison of pulmonary artery <strong>and</strong>arterial thermodilution cardiac output in critically ill patients. IntensiveCare Med 1999; 25(8): 843–846. PMID 10447543Rhodes A, Sunderl<strong>and</strong> R. Arterial Pulse Power Analysis: The LiDCO plusSystem. In: Pinsky MR, Payen D, eds. Functional HemodynamicMonitoring. Update in Intensive Care <strong>and</strong> Emergency Medicine 2005; 42:183-192. Berlin Heidelberg: Springer–Verlag. Reprint available atwww.LiDCO.comhttp://www.lidco.com/archives/LiDCOplus_brochure_1914.pdf (fig. 1 LiDCOinjection site; fig 2 LiDCO arterial line site)Volume clamp method (e.g. Finapres , Nexfin )Equipment Inflatable finger cuff (consisting of bladder with an infraredplethysmograph) <strong>and</strong> st<strong>and</strong>-alone monitor.Calibration The cuff is attached to the middle phalynx of the finger, <strong>and</strong> the system‘zeroed’ at the level of the right atrium.Beat-to-beat continuous blood pressure is measured by repeated cuff inflation.Continuous stroke volume <strong>and</strong> cardiac output is calculated from the systolic pressurearea using a physiological three-element Windkessel model. Stroke volume variation<strong>and</strong> pulse pressure variation are also measured.Transpulmonary thermodilution techniqueEquipment A st<strong>and</strong>ard central venous catheter <strong>and</strong> a thermistor-tipped arterialcatheter.Site The arterial catheter is inserted in the femoral artery. The brachial or radialartery may be used in patients where femoral cannulation is contraindicated e.g.aorta-femoral bypass.Calibration Transpulmonary thermodilution measurement requires the centralinjection of a cold (
Cardiac output Continuous measurement of CO by the pulse contour method iscalculated using an algorithm measuring the area under the systolic part of arterialpressure curve (Wesseling’s method). See Task 1.PICCO FEMORAL ARTERY SITE.PICCO CENTRAL VENOUS SITEPICCO MEASUREMENTSMeasuring static <strong>and</strong> dynamic volumetric parametersStatic volumetric parameters, including ITBV <strong>and</strong> GEDV, are obtained by advancedanalysis of the thermodilution curve. For the calculation of volumes, mean transittime <strong>and</strong> down slope time of the thermodilution curve are important. Mean transittime is the time when half of the indicator has passed the point of detection in theartery. Down slope time is the exponential down slope time of the thermodilutioncurve. EVLW is calculated using the same approach. See Task 1 step 5. Dynamicparameters of preload, PPV <strong>and</strong> SVV are automatically calculated on a beat-to-beatbasis using the pulse contour analysis.Cardiac contractility Left ventricular contractility can be assessed by measurementof dP/dt max , derived from the maximum speed of the arterial pressure curve duringthe ejection phase.Pulmonary artery catheterThe PAC is passed aseptically through a sheath introducer device, which may beinserted from internal jugular, subclavian or, less frequently, femoral approaches.There are several types of pulmonary artery catheter (PAC) available groupedaccording to their <strong>monitoring</strong> capabilities:41
Basic thermodilution model: measurement of right atrial pressure (RAP),pulmonary artery pressure (PAP), pulmonary artery occlusion pressure (PAOP)with or without intermittent thermodilution CO measurement. Basic thermodilution model with addition of infusion ports: Basicthermodilution catheter with additional lumens that open into right atrium orright ventricle for continuous drug/fluid infusions. Continuous cardiac output catheters: measurement of RAP, PAP, PAOP plus athermal filament within the catheter that provides continuous stroke volume<strong>and</strong> CO measurements. Oximetry catheters: with fibre optics allowing continuous <strong>monitoring</strong> of mixedvenous oxygen saturation (Sv̄O 2 ). Fibre optic bundles within the cathetertransmit <strong>and</strong> receive red light near the catheter tip that allows measurementof saturated haemoglobin in the mixed venous blood. Right ventricular volumetric catheters: additional measurement of rightventricular ejection fraction (RVEF) via a fast response thermistor that cansense beat-to-beat temperature change. Derived parameters includecontinuous right ventricular end-diastolic volume (CEDV).Below is a picture of a thermodilution pulmonary artery catheter, designed tomeasure right atrial (RAP) <strong>and</strong> pulmonary artery pressures (PAP) <strong>and</strong> providecontinuous CO readings. Catheter markings occur every 10 cm (thin black line), the50 cm mark is denoted by a thick black line. A distal port opens to a lumen runningthe length of the catheter <strong>and</strong> terminating at the tip. This port measures PAP <strong>and</strong>PAOP; mixed venous blood may be drawn from this port when the catheter tip lieswithin the pulmonary artery. The balloon inflation port opens to a lumen thatterminates within the balloon located at the tip of the catheter. The balloon isinflated with 1.0-1.5 mL of air to facilitate passage through the heart <strong>and</strong> to wedgethe catheter to obtain a PAOP measurement. A proximal port opens 30 cm from thedistal tip <strong>and</strong> is used for RAP <strong>monitoring</strong> <strong>and</strong> infusion of fluids. Another proximalinfusion port is located 26 cm from the distal tip. A protective sheath is extendedalong the external length of the catheter <strong>and</strong> attached to the introducer.This catheter has a 10 cm long thermal filament that delivers pulses of heat whichthus heat up the surrounding blood. A thermistor located 4 cm from the catheter tipdetects blood temperature changes <strong>and</strong> correlates the data with the right ventricularthermal input to produce a thermodilution curve.42
CONTINUOUS CARDIAC OUTPUT PULMONARY ARTERY CATHETERFlotation of the pulmonary artery catheterAs the catheter is passed from the central venous circulation through the heart,pressure waveforms characteristic of the site being traversed are recorded; theshape of the haemodynamic waveform <strong>and</strong> the pressure measurement are noted.The natural curve of catheter may help flotation. Difficulty with flotation may occurwhen cardiac output is low (forward flow is limited), or with significant tricuspidvalve disease (for example, severe TR may limit forward flow), severe pulmonaryhypertension, or dilated right ventricle.In the diagram below, pressure waveform changes are noted as the catheter isadvanced from the right atrium (RA) to the PAOP position.43
PAC FLOTATIONIn this case, the cardiac rhythm is atrial fibrillation. A RAP waveform (similar to theCVP trace) is observed at 15-20 cm from an internal jugular insertion site. Theballoon is inflated with 1.0 mL of air <strong>and</strong> the catheter advanced. On entering theright ventricle (RV) there is a change in waveform morphology <strong>and</strong> an increase inpeak pressure. The RV is entered at approximately 25-30 cm from an internal jugularinsertion site. The RV waveform has a steep slope, a peak pressure that is 2-3 timeshigher than the mean RA pressure, <strong>and</strong> returns to a baseline RV end-diastolicpressure equal to the mean RAP. (Note the ventricular ectopic beat when thecatheter is in RV). As the catheter crosses into the pulmonary circulation the baselineof the waveform rises <strong>and</strong> a dicrotic notch can be observed on the down slope. Thepulmonary circulation is usually reached 40-55 cm from an internal jugular insertionsite. When the catheter is advanced into a segment of a pulmonary artery smallerthan the inflated balloon, forward flow is interrupted (‘wedge position’) <strong>and</strong> thedistal lumen records the pressure originating from the left atrium; this is thepulmonary artery occlusion pressure (PAOP). The shape of the PAOP waveformchanges to a low amplitude pressure waveform with a sine wave appearance similarto the RAP although slightly higher.When the balloon is deflated, the PAP waveform should reappear promptly. If thisdoes not occur, the catheter should be withdrawn several centimetres to assure thatit does not remain in a wedge position causing interrupted pulmonary blood flow.Never withdraw the catheter with the balloon inflated as it may damagecardiac structures.http://www.thoracic.org/clinical/critical-care/clinicaleducation/hemodynamic-<strong>monitoring</strong>/pulmonary-artery-catheterprimer/index.phpB<strong>and</strong>schapp O, Goff R, Mallin G, Loushin M, Iaizzo PA. The path of a pulmonaryartery catheter visualized through a beating human heart. Am J RespirCrit Care Med 2012; 186(4): 385. PMID 22896593Position of the catheterA chest radiograph should be taken to confirm the position of the PAC (without anyloops) <strong>and</strong> to rule out a pneumothorax. The catheter tip should not extend beyond44
the pulmonary hilum as in the first chest X-ray (CXR 1) below. In CXR 2, the PAC wasconsidered to be too distal <strong>and</strong> was withdrawn a few centimetres even though a PAPwaveform was transduced.CXR 1 CXR 2Q. Explain what is meant by West’s lung zones.A. West’s lung zones are a theoretical concept based on the fact that gravityinfluences blood flow within the lungs; pulmonary blood flow <strong>and</strong> vascular pressuresincrease progressively down the lung. Originally described by the pulmonaryphysiologist John B. West.Q. Describe Zone 1 <strong>and</strong> its effect on the PAOP.A. In a supine patient this is directly underneath the anterior sternum. In an erectpatient Zone 1 corresponds to the lung apex. In this zone, alveolar pressure exceedspulmonary artery <strong>and</strong> pulmonary venous pressure. Thus, a catheter wedged in thislocation would record alveolar pressure instead of reflecting left atrial pressure asthe pulmonary veins would be completely collapsed.Q. Describe Zone 2 <strong>and</strong> its effect on PAOP.A. It lies directly underneath Zone 1. In this zone, alveolar pressure exceedspulmonary artery diastolic pressure <strong>and</strong> pulmonary venous pressure. A catheterwedged in this position would record alveolar pressure, again because pulmonaryveins would be collapsed.Q. Describe Zone 3 <strong>and</strong> its effect on PAOP.A. This is the most dependent portion of the lung in the supine or erect position. Thepulmonary artery systolic <strong>and</strong> diastolic pressures <strong>and</strong> pulmonary venous pressures arealways greater than alveolar pressures in this zone. The pulmonary vessels do notcollapse <strong>and</strong> a catheter wedged in this position accurately measures PAOP.A zoning artefact occurs whenever alveolar pressure exceeds pulmonary venouspressure <strong>and</strong> the recorded measurement reflects alveolar pressure rather thanpressure in a pulmonary vein. Conditions that may lead to such an artefact includehypovolaemia, PEEP <strong>and</strong> position of the tip of the PAC in a West Zone 1 or 2. If the45
PAC lies in a vessel below the level of the left atrium it is almost always in a Zone 3area.Q. Describe a checklist for verifying position of PAC in Zone 3.A. PAD >PAOP, catheter tip location below the level of the left atrium on a portablelateral chest X-ray, A <strong>and</strong> V waves visible within trace (cardiac ripple), change inPAOP less than half the change in PEEP during a PEEP trial.On the American Thoracic Society’s website below, you will find a Pulmonary ArteryCatheter Primer [Clinical information/Critical care/Hemodynamic<strong>monitoring</strong>/Pulmonary artery catheter primerhttp://www.lcs.mgh.harvard.edu/projects/pacath.htmlhttp://www.thoracic.orgMixed venous oxygen saturation (Sv̄O 2 )A true mixed venous sample (called SvŌ 2 ) is drawn from the tip of the pulmonaryartery catheter, <strong>and</strong> includes all of the venous blood returning from the head <strong>and</strong>arms (via superior vena cava), the gut <strong>and</strong> lower extremities (via the inferior venacava) <strong>and</strong> the coronary veins (via the coronary sinus). By the time the blood reachesthe pulmonary artery, all venous blood has ‘mixed’ to reflect the average amount ofoxygen remaining after all tissues in the body have removed oxygen from thehaemoglobin. Mixed venous oxygen saturation (Sv̄O 2 ) can help to determine whetherthe cardiac output <strong>and</strong> oxygen delivery is high enough to meet a patient’s needs. Itcan be very useful if measured before <strong>and</strong> after changes are made to cardiacmedications or mechanical ventilation, particularly in unstable patients. Normal Sv̄O 2is 60-80%. If the Sv̄O 2 is low (
tip of the catheter with the balloon inflated <strong>and</strong> correlates with LA pressure. PCWP isobtained when the catheter is wedged with the balloon deflated <strong>and</strong> hence is closerto capillary pressure.Accurate, reliable measurement of haemodynamic pressures relative to therespiratory <strong>and</strong> cardiac cycles requires the ability to either freeze the monitorsweep, or, preferably, to acquire a paper printout of the ECG <strong>and</strong> correspondingpressure waveform from a 2-channel paper recorder.How to measure RAP <strong>and</strong> PAOP waveforms using the ECGIn RAP <strong>and</strong> PAOP waveforms with A <strong>and</strong> V waves that are of similarheight, it is permissible to simply average the high <strong>and</strong> the low ofthe two waves at end-expiration. However, frequently the V waveof the RAP <strong>and</strong>, more commonly, the PAOP, is dominant <strong>and</strong>elevated. In these situations, measuring the average of both waveswould provide an overestimate of the ventricular filling pressure.Measurement of the RAP <strong>and</strong> PAOP in these conditions requiresmeasuring the average of only the A wave, which can only be donewhen the pressure waveform is correlated to the simultaneouslyobtained ECG. The A wave of the RAP can be located in the PRinterval of the ECG, while the A wave of the PAOP can be found atthe end of or immediately after the QRS complex.Diastolicpulmonary arterypressure isnormally 2-4mmHg higher thanmean PAOP.Mean PAOP isnormally lowerthan mean PAP.PA systolic pressure occurs within the T wave of the ECG while the end-diastolicpressure occurs at the end of the QRS. Routinely assessing all haemodynamicwaveforms with the ECG is an invaluable way to avoid the consequences ofmisinterpreting a PAOP waveform with a high, dominant V wave for a PAP. If thepeak occurs well after the T wave, the waveform is that of a PAOP with a high Vwave, <strong>and</strong> not a PA waveform.Confirming accurate PAOP measurementSeveral factors must be assessed to ensure that the PAC is correctly positioned tomeasure the PAOP accurately.Change in the waveform from pulmonary artery (with systole <strong>and</strong> diastole) toa PAOP waveform. Although distinct A <strong>and</strong> V waves may not always beidentifiable, a low amplitude, oscillating baseline should be visible. A PAwaveform should immediately return on balloon deflation.Fall in mean pressure; normally, the mean PAOP is similar to or slightly lowerthan the diastolic PAP (usually within 0-4 mmHg). However, in conditions inwhich a large V wave is present in the PAOP waveform, the displayed meanvalue of the PAOP may be higher than diastolic PAP.Blood aspirated from the distal tip of a PAC in the wedge position is highlyoxygenated <strong>and</strong> resembles arterial blood. The PO 2 is slightly higher than PO 2of the systemic arterial blood.The catheter should flush easily to exclude catheter obstruction.47
In the ICU, identify five mechanically ventilated patients with pulmonaryartery catheters in situ. Note the difference in pressure readings between endinspiration<strong>and</strong> end-expiration. The value that is closest to transmural pressure is theend-expiratory reading.Effect of PEEP on measurement of PAOPPEEP (including autoPEEP) increases intrapleural pressure (during allstages of the respiratory cycle) causing the measured PAOP tooverestimate the actual transmural or filling pressure. With normallung <strong>and</strong> chest wall compliance, approximately 50% of the appliedPEEP is transmitted to the pleural space <strong>and</strong> PAOP will rise by lessthan 50%.A decreasedpercentage of PEEPis transmitted iflung compliance islow. Thus in severeARDS, applicationof PEEP will haveless effect on PAOPmeasurement.If PAOP increases >50% of the amount of applied PEEP, the measurement maybe in error or the catheter may be malpositioned.The normal pulmonary vascular network is a low-resistance circuit. Different factorsaffect the respective pulmonary artery pressures.Q. Which factors have the effect of increasing pulmonary artery ‘systolic’pressure?A. Any situation where there is increased pulmonary vascular resistance e.g.hypoxaemia, pre-existing chronic lung disease e.g. COPD, pulmonary embolism,ARDS, sepsis, primary pulmonary hypertension, large left-to-right shunts e.g. ASD,VSD.Q. Which factors have the effect of increasing pulmonary artery ‘diastolic’pressure?A . All conditions where systolic PAP is elevated: Hypervolaemia Left heart dysfunction of any cause; LV failure, mitral stenosis/regurgitation,decreased LV compliance Cardiac tamponade Constrictive or restrictive pericarditis.Q. How do you calculate pulmonary vascular resistance (PVR)?A. Pulmonary vascular resistance can be calculated as:48
Q. Name clinical conditions where PAOP does not accurately reflect leftventricular end-diastolic pressureA.Aortic regurgitationAny condition that produces obstruction in the pulmonary veins e.g. tumour,fibrosis, thrombosisLeft atrial mass e.g. large myxoma, thrombusMitral valve pathology; stenosis or regurgitation with elevated V waveSignificant tachycardia (heart rate >130 beats/min)Increased pleural pressure (e.g. PEEP, CPAP especially with associatedhypovolaemia or in patients with emphysema)Catheter placement in West Zone 1 or Zone 2 of the lung-see below.Some conditions result in a discrepancy between PAOP <strong>and</strong> left ventricular enddiastolicpressure (LVEDP).Q. When will the measured mean PAOP be lower than the true LVEDP?A. Decreased left ventricular compliance e.g. left ventricular hypertrophy ormyocardial ischaemia.Q. When will the measured PAOP be greater than the true LVEDP?A. Reduction of pulmonary tree; pneumonectomy, massive pulmonary embolism.West JB. Respiratory Physiology: The Essentials. Chapter Four; Blood Flow <strong>and</strong>Metabolism. 7th edition. Lippincott Williams & Wilkins. ISBN-10 0-7817-5152-7A mechanically ventilated patient with a PAC in situ has a central venouscatheter inserted (via left subclavian vein) for renal replacement therapy. Two hourspost-insertion, blood pressure falls rapidly <strong>and</strong> CVP, PAP <strong>and</strong> PAOP increase while COdecreases.It is noticed that CVP, diastolic PAP <strong>and</strong> PAOP values are almost equal. The absenceof normal breath sounds <strong>and</strong> hypertympanic percussion over the left thorax suggestedthe diagnosis of a tension pneumothorax. A chest tube was inserted <strong>and</strong> air drainedwith immediate improvement in blood pressure. <strong>Haemodynamic</strong> values must beinterpreted in the context of each patient’s history <strong>and</strong> physical findings.49
3/ LIMITATIONS AND COMPLICATIONS OF HAEMODYNAMICMONITORINGElectrocardiographyLike most clinical tests the ECG yields both false positive <strong>and</strong> false negative results.It is of great importance in clinical practice to be aware of these diagnosticlimitations.Conditions not excluded by a normal or non-diagnostic ECG: Prior MI Acute MI (the more common scenario is NSTEMI) Severe coronary artery disease Significant left or right ventricular hypertrophy Intermittent arrhythmias (e.g. ventricular tachycardia) Hyperkalemia Acute pulmonary embolism may be masked in presence of left bundle branchblock, pacemaker pattern ECG.Any ECG findings should be correlated with clinical observation of thepatient.Q. When may ECG signs be falsely positive for LVH?A. High voltage in the chest leads may be a normal finding, especially in young adultmales with thin chest walls. Therefore, high voltage (Sv1 + Rv5/Rv6 >35 mm) is not aspecific indicator of left ventricular hypertrophy <strong>and</strong> the diagnosis should not bemade on this finding alone.Q. When may ECG signs be falsely positive for myocardial ischaemia?A. Q waves may occur as a normal variant <strong>and</strong> do not always indicate heart disease.Q waves normally occur in leads I, aVL, V4, V5 <strong>and</strong> V6. They are narrow with nonotching or slurring <strong>and</strong> are the result of septal activation. With normal variance, thedepth of the Q wave is
If in doubt about the presence of acute myocardial ischaemia, repeat ECGs<strong>and</strong> correlate with the presence of chest pain <strong>and</strong> troponin rise.Q. When may ECG signs be falsely positive for dextrocardia?A. Limb lead reversal (not uncommon!). Reversal of the right <strong>and</strong> left arm electrodeswill cause an apparent rightward QRS axis shift that can lead to an incorrectdiagnosis of dextrocardia. As a general rule when lead I shows a negative P wave <strong>and</strong>QRS, suspect the right <strong>and</strong> left arm leads have been reversed.Remember: Always interpret data <strong>and</strong> signs in context of the overall clinicalpicture.Common ECG artefacts60 Hz cycle interference produced by alternating current generators (switchthe ECG plug to another outlet).Muscle tremor e.g. parkinsonism, shivering.Improper st<strong>and</strong>ardisation.ECG ARTEFACT SECONDARY TO DIALYSIS (CVVHD) ROLLER PUMP51
LIMB LEADS CORRECTLIMB LEADS INCORRECTECG MOVEMENT ARTEFACT NOTE NORMAL ARTERIAL PRESSURE TRACE52
Goldberger AL. Clinical electrocardiography: a simplified approach. Eighthedition. Mosby Elsevier; 2013. ISBN-13 978-0-323-04038-9Pulse oximetryAlthough pulse oximetry is a valuable <strong>monitoring</strong> tool usedthroughout the hospital <strong>and</strong> associated with few complications,there is often a lack of underst<strong>and</strong>ing of what is being measured.The measurements are often inaccurate in the presence ofalterations in skin perfusion. The fundamental principles of pulseoximetry are well explained in the references cited below.Pulse oximetrymeasures the per centsaturation ofhaemoglobin byoxygen (SpO 2 ) which isdifferent than PaO 2(partial pressure ofoxygen). The twomeasurements arerelated through theoxyhaemoglobindissociation curve.Jubran A. Pulse oximetry. Intensive Care Med 2004; 30(11): 2017–2020. PMID15278272Ortega R, Hansen CJ, Elterman K, Woo A. Videos in clinical medicine. Pulseoximetry. N Engl J Med. 2011; 364(16): e33. PMID 21506738The oxyhaemoglobin dissociation curve has a sigmoid shape. Near maximal(90-100%) oxygen saturation of haemoglobin occurs at a PaO 2 of 8.0 kPa (60 mmHg).Values above this only produce a modest increase in SpO 2 . Conversely, oxygensaturation values below 90% may rapidly decrease further <strong>and</strong> are associated withlow PaO 2 levels.Pulse oximetry reflects oxygenation of arterial blood. However, significantalveolar hypoventilation <strong>and</strong> hypercapnia can occur despite an unchanged SpO 2 ,particularly if the patient is receiving supplemental oxygen.53
A 70-year-old patient with past history of COPD <strong>and</strong> a recent fluvaccination is admitted to a medical ward with lower limb paraesthesia <strong>and</strong>weakness. Observations including heart rate, AP, respiratory rate <strong>and</strong> SpO 2 (2 L/minoxygen) are stable. However she is drowsy since admission <strong>and</strong> the intensive careteam is asked to evaluate her when she cannot be roused. On examination she isunresponsive to painful stimuli <strong>and</strong> her extremities are cold <strong>and</strong> mottled. Heart rate60 beats/min, AP 120/80 mmHg, respiratory rate 16/min <strong>and</strong> SpO 2 95%. Her tracheais immediately intubated. An arterial blood gas reveals profound respiratory acidosiswith pH 6.8, PCO 2 20 kPa (150 mmHg), PaO 2 14.0 kPa (105 mmHg), bicarbonateconcentration 15.3 mmol/L, base excess –14.0 mmol/L <strong>and</strong> serum lactate 1.5mmol/L. She is transferred to the intensive care unit <strong>and</strong> Guillain-Barré syndrome issubsequently diagnosed. Pulse oximetry measures the adequacy of arterialhaemoglobin saturation, not the adequacy of ventilation.Situations where the pulse oximeter will fail to detect true oxygen saturation ofhaemoglobin:Dyshaemoglobins. Carboxyhaemoglobin (COHb) produces an SpO 2 reading thatincludes both COHb <strong>and</strong> oxygenated haemoglobin (HbO 2 ), making the SpO 2reading falsely elevated. Similarly, the presence of significantmethhaemoglobin markedly reduces the accuracy of oximetry.In low perfusion states, hypothermia, cardiac arrhythmias <strong>and</strong> when excessivemotion is present the oximeter may fail to accurately differentiate true signalfrom background noise <strong>and</strong> thus may produce erroneous data.Dyes, e.g. methylene blue (used to treat methhaemoglobin toxicity) canfalsely lower SpO 2 reading.Anaemia does not reduce the accuracy of the pulse oximeter provided thathaematocrit remains >15%.Venous oximetryDecrease in Sv̄O 2 /ScvO 2 represents either an increase in oxygenconsumption (exercise, pyrexia, increased work of breathing,shivering, pain) or decreased oxygen delivery (decreased arterialoxygen content, e.g. anaemia, hypoxia) or inadequate cardiacoutput e.g. hypovolaemia, heart failure.Patients withchronic heart failuremay have chroniclow Sv̄O 2 /ScvO 2values withoutapparent tissuehypoxia presumablybecause they haveadapted with higheroxygen extraction inthe face of reducedCO.54
Q. Explain how whole body oxygen consumption is measured.A. Oxygen consumption (VO 2 ) is expressed mathematically by the Fick principle asthe product of cardiac output (CO) <strong>and</strong> arteriovenous O 2 content difference (CaO 2 –CvO 2 ).This may be rewritten as:CaO 2 = Arterial oxygen content = (Hb x 1.39 x SaO 2 ) + (0.003 x PaO 2 )Cv̄O 2 = Mixed venous oxygen content (Cv̄O 2 ) = (Hb x 1.39 x Sv̄O 2 ) + (0.003 x PaO 2 )Therefore the equation may be rewritten as:Because at st<strong>and</strong>ard atmospheric pressure, the quantity of dissolved oxygen is verysmall, it is acceptable to eliminate this component <strong>and</strong> re-write the equation as:As SaO 2 is maintained at near maximal saturation in most patients <strong>and</strong> is not rapidlychanging, the equation can be further reduced to:Thus Sv̄O 2 is directly proportional to the following; SaO 2 , the ratio of oxygenconsumption to cardiac output <strong>and</strong> haemoglobin. Therefore SvŌ 2 reflects therelationship between O 2 consumption <strong>and</strong> oxygen delivery.Q. Write the Fick equation <strong>and</strong> show how it is used to measure cardiac output.A. The determination of oxygen saturation in mixed venous blood (Sv̄O 2 ) enablesinterpretation of the cardiac output by considering oxygen transport in relation tooxygen consumption. From the Fick equation:Q. List three conditions associated with a low Sv̄O 2 /ScvO 2 .A. A low Sv̄O 2 can reflect three situations:55
Hypoxaemia (a fall in SaO 2 causes a direct fall in SvŌ 2 ) Anaemia (with incomplete compensation by the cardiac output) An increase in the relationship between oxygen consumption (VO 2 ) <strong>and</strong>cardiac output. In other words inadequate cardiac output in relation to theoxygen dem<strong>and</strong> e.g. cardiac failure, pulmonary embolism, hypovolaemia.During exercise, increased oxygen dem<strong>and</strong>s are met primarily by increasingcardiac output <strong>and</strong> only secondarily by increasing oxygen extraction. Thus Sv̄O 2 maydecrease somewhat during exercise but does not necessarily reflect tissue hypoxia.Relationship between SvŌ 2 <strong>and</strong> ScvO 2In health, Sv̄O 2 is 2-3% higher than ScvO 2 because the lower bodyextracts less oxygen than the upper body making the inferior venacava saturation higher. The primary cause is that the kidneys <strong>and</strong>liver receive a high proportion of cardiac output but oxygenconsumption is low relative to delivery.ScvO 2 values differ fromSv̄O 2 values <strong>and</strong> inhaemodynamic shockthis difference varies inboth magnitude <strong>and</strong>directionIn shock, this relationship changes <strong>and</strong> the ScvO 2 may exceed SvŌ 2 values by up to8%. This is because in shock states, splanchnic <strong>and</strong> renal circulation fall followed byan increase in O 2 extraction in these tissues. In septic shock, regional O 2 consumptionof the gastrointestinal tract increases. On the other h<strong>and</strong>, flow to the heart <strong>and</strong>brain is maintained. Hence ScvO 2 is a less reliable guide for Sv̄O 2 in critically illpatients.ScvO 2 should not be used alone in haemodynamic assessment but combinedwith other indicators of organ perfusion such as mental status, urinary output <strong>and</strong>serum lactate levels.The evidence for targeting an ScvO 2 value of >70% as a treatment goal inseptic shock comes from one study. The Rivers early goal-directed therapy studyshowed that ScvO 2 is useful in guiding the early resuscitation of septic shock using atarget of ScvO 2 >70% during the first six hours of treatment.Marx G, Reinhart K. Venous oximetry. Curr Opin Crit Care 2006; 12(3): 263–268.PMID 16672787Rivers E, Nguyen B, Havstad S, Ressler J, Muzzin A, Knoblich B, et al. Earlygoal-directed therapy in the treatment of severe sepsis <strong>and</strong> septicshock. N Engl J Med 2001; 345(19): 1368–1377. PMID 1179416956
Non-invasive <strong>monitoring</strong> of arterial blood pressureSources of error in taking non-invasive AP measurements include:‘Auscultatory gap’: in some, especially older <strong>and</strong> hypertensive patients, theKorotkoff sounds may disappear <strong>and</strong> then reappear at a lower pressure. This can leadto underestimation of true systolic AP.Optimum size of occluding cuff: the width of the bladder should be40% of the circumference of the upper arm at the midpoint <strong>and</strong> itslength should be twice the circumference of the upper arm.Arm position: requires patients to be in a supine position whenpressures are measured.Cuff bladders that aretoo small, in eitherwidth or length, resultin overestimation of thetrue blood pressure.Complications, although rare have been reported during noninvasiveAP measurement:Ulnar nerve palsies have been reported with frequent inflation <strong>and</strong>deflation of upper arm AP cuff.In patients with upper arm AV fistula for haemodialysis, cuffinflation may damage the fistula. In patients post mastectomy withextensive axillary clearance, upper limb oedema may develop withmultiple cuff inflations. The AP cuff should be placed on theopposite arm in these instances.With automateddevices, mean APrather than systolic ordiastolic, correlatesmost closely withinvasivemeasurements.Invasive pressure <strong>monitoring</strong>It is useful to consider complications associated with invasive pressure <strong>monitoring</strong> inthree categories:1. During insertion or removal of the <strong>monitoring</strong> catheter2. While the catheter is in situ3. Inaccurate or incorrectly interpreted data obtained from catheter.Complications during insertion <strong>and</strong> removal of <strong>monitoring</strong> cathetersInvasive arterial pressure cathetersCommon to all sites: pain, haemorrhage or haematoma, (traumaticarterial puncture), nerve damage.Individual sites: femoral artery site; retroperitoneal haematomaformation, bowel perforation.Central venous catheterPuncture of the femoralvein/artery superior tothe inguinal ligamentcan result inretroperitonealhaemorrhage.Common to all sites: as above.57
Arterial puncture <strong>and</strong> haemorrhage.Intrathoracic sites: pneumothorax (subclavian site > internal jugularsite).Arrhythmias during guide wire passage through RV.Perforation of mediastinal vessel or cardiac chamber.Venous air embolism, especially if the patient is generatingsignificant negative intrapleural pressure e.g. laboured breathing. Inthe presence of right-to-left shunt (e.g. ASD), air may cross to leftheart <strong>and</strong> cerebral circulation.Pulmonary artery catheterCommon to all sites (including intrathoracic sites): as above.Use of bedsideultrasound, comparedto use of st<strong>and</strong>ardanatomical l<strong>and</strong>marks,has been shown toreduce the risk ofmechanicalcomplications duringinsertion of centralcatheters.If venous air embolismis suspected, placepatient head down inleft lateral decubitusposition <strong>and</strong> aspiratethe lumen of thevenous catheter.Ventricular ectopy is common. Sustained arrhythmias usually occurin conditions leading to myocardial irritability (e.g. electrolyteimbalance, acidosis, myocardial ischaemia). A defibrillator shouldbe immediately available in the event of a sustained ventriculararrhythmia.Right bundle branch block (RBBB) may be induced by PAC contactwith the right side of interventricular septum – especially duringinsertion.Catheter coiling or knotting typically occurs during prolonged <strong>and</strong>difficult passage across the pulmonary valve (e.g. dilated RV or lowCO state) <strong>and</strong> is confirmed with chest X-ray. Removal often requiresuse of a fluoroscopy guided snare device.There is a small risk ofprecipitating completeheart block duringinsertion of PAC inpatients with LBBB onECG.Traumatic vessel puncture during cannulation can cause substantialhaemorrhage without overt evidence of a problem at the insertion site. For example,femoral artery/vein trauma causing massive retroperitoneal bleeding requires CT(computed tomography) scan to diagnose (not visible on ultrasound). Traumaticpuncture of internal jugular or subclavian vein may be complicated by mediastinalbleeding or haemothorax visible only on chest X-ray.Exercise caution during insertion of catheters with long dilators e.g. PACsheath <strong>and</strong> dialysis catheters. The rigid dilator may perforate a cardiac chamber orcentral vessel. Dilators do not need to be inserted completely, since their purpose isto dilate the skin <strong>and</strong> the vessel puncture site.58
Complications occurring with <strong>monitoring</strong> devices in situInvasive arterial pressure <strong>monitoring</strong>Common to all sites: catheter-related infection includes bothinsertion-site infection <strong>and</strong> catheter-related bloodstream infection(CRBSI). The majority of serious catheter-related infections areassociated with central venous catheters. The infection rate ishigher with catheters inserted in the internal jugular vein comparedto the subclavian vein. Refer to the <strong>PACT</strong> module on InfectionPrevention <strong>and</strong> Control.The most commonin-situ complicationof invasive<strong>monitoring</strong> devicesis infection.Heparin-associated – thrombocytopenia.Blood loss.Pseudaneurysm formation (requires surgical repair as it may rupture or causeembolisation).Thrombus formation in a patient with poor collateral flow may compromisecirculation <strong>and</strong> risk distal ischaemia.Individual sites: Femoral site insertion reduces mobility.Central venous catheterCommon to all sites: as above.Vascular erosion may occur 1-7 days following catheter insertion.Free aspiration of blood from the catheter does not rule outvascular perforation. Proper positioning of the catheter tip parallelto the vessel wall, should be checked post-insertion <strong>and</strong> on all chestX-rays.Central venous cathetervascular erosion is mostcommon when thecatheter is inserted fromthe left internal/externaljugular or subclavian siteas the tip is more likelyto be against the wall ofthe superior vena cava.Central venous thrombosis. This can lead to partial venous occlusion, <strong>and</strong> in a smallnumber of patients total occlusion of a vein can occur. Total occlusion may beclinically identified by oedema of the involved arm, neck or face.Pulmonary artery catheterRupture or perforation of a pulmonary artery may be manifested assudden haemoptysis (or blood from the tracheal tube) or as aninfiltrate on chest X-ray associated with the location of the cathetertip. Less commonly, PA perforation may cause haemothorax orcardiac tamponade.Pulmonary infarction can occur secondary to vascular occlusion dueto catheter or catheter-related thrombus or prolonged ballooninflation.Intracardiac injury to valves or ventricular surface. Balloon rupture,manifest as blood return from balloon port may lead to airembolism if the balloon port is not tightly closed off to air <strong>and</strong>/orfurther attempts are made to inflate the balloon.Risk factors forperforation of thepulmonary artery byPAC include: catheteradvanced or migratedtoo far distally,pulmonaryhypertension,excessivemanipulation orballoon inflation, <strong>and</strong>,hypothermia (catheterbecomes stiffer).59
Limiting the duration of PAC insertion, shortening duration of ballooninflation, continuous <strong>monitoring</strong> of waveform from the catheter tip <strong>and</strong> checkingcatheter position on chest X-ray reduce the incidence of PAC complications.Central venous catheter-related complications are discussed in detail in the followingreferences.Polderman KH. Girbes AJ. Central venous catheter use. Part 1: mechanicalcomplications. Part 2: infectious complications. Intensive Care Med2002; 28(1): 1–17, 18–28. PMID 11818994 <strong>and</strong> 11818995Porter JM, Page R, Wood AE, Phelan D. Ventricular perforation associated withcentral venous introducer-dilator systems. Can J Anaesth 1997; 44(3):317–320. PMID 9067053Complications related to incorrect collection or interpretation of dataMeticulous measurement technique <strong>and</strong> analysis of pressure waveforms, knowledgeof the pitfalls for invalid measurement <strong>and</strong> an underst<strong>and</strong>ing of the relationship ofpressure measurement to cardiovascular physiology are m<strong>and</strong>atory to ensure thathaemodynamic data obtained are reliable <strong>and</strong> effectively used at the bedside.Invasive arterial pressure <strong>monitoring</strong>Common to all fluid-filled <strong>monitoring</strong> systems: the ability toaccurately display measured pressure from the catheter tip dependson accurate transmission to an appropriately zeroed <strong>and</strong> calibratedmonitor. If the zero point is not set correctly, measurements will bebiased (consistently read high or low over the entire scale), knownas an offset error. Refer to Task 2.Consistency of zeroreference level (theright atrium) isessential.Tobin MJ, ed. Principles <strong>and</strong> Practice of Intensive Care Monitoring. McGraw–Hill; 1998. p 45-61. ISBN-10: 0070650942Central venous pressurePatient-related factors: Acute or chronically decreased rightventricular compliance may result in disproportionately highpressure values for a given filling volume. Tricuspid valve disease(stenosis/regurgitation) increases the CVP; in tricuspid regurgitationthe V wave becomes dominant <strong>and</strong> elevated, raising the meanpressure. Left-to-right intracardiac shunts (acute VSD) increase rightventricular volume <strong>and</strong>, thus, increase CVP.Trend analysis ofCVP, i.e.measurement overtime, is more usefulthan a single isolatedmeasurement.Measuring the mean A wave is necessary to assess right ventricularfilling pressure. Pericardial tamponade should also be considered.60
Mechanical ventilation factors: CVP may be overestimated inpatients receiving ventilatory support due to increased intrathoracicpressures surrounding the heart <strong>and</strong> great vessels. Refer to Task 2.Elevated intra-abdominal pressure may artefactually elevate CVPmeasurement.CVP has limited value in estimating LV preload.For more information see the <strong>PACT</strong> module on Abdomen in acute/critical caremedicine.Pulmonary artery catheterCatheter-related factors:Overdamping decreases systolic pressure <strong>and</strong> increases diastolic pressure.Catheter whip causes spike-like artefacts superimposed on the PAC waveform <strong>and</strong>may occur in a hyperdynamic circulation.Catheter tip may slip back into the RV. The waveform will differ in morphology witha notable fall in diastolic pressure to near baseline (0). Ventricular ectopy may benoted on the ECG (see Task 2). If in doubt, chest X-ray will confirm the position ofPAC tip.Overwedging may occur if balloon inflates unevenly <strong>and</strong> herniates over the cathetertip or the distal lumen becomes blocked against a wall. The resultant waveformappears damped <strong>and</strong> lacks any recognisable PA or PAOP morphology <strong>and</strong> the pressuregradually equilibrates with that in the flush system.Persistent wedging may occur if the catheter tip migrates distally into a smallsegment of the PA. This is more likely to occur with excessive catheter looping in theRV during insertion. Continuous <strong>monitoring</strong> of the pressure from the catheter tip isessential to recognise this occurrence.Correct recognition of PAOP waveform requires experience. Always discussyour findings with an experienced colleague. PAOP should not be interpreted inisolation but in the context of clinical findings.In the next ten patients with a PAC in situ, measure PAOP <strong>and</strong> then ask thebedside nurse to do the same. Now discuss the findings with the ICU consultant.There is large interobserver variability in interpretation of the PAOPwaveform.61
Limitations during measurement of PAOPPatient-related factors: The relationship between PAOP, left atrial pressure <strong>and</strong> leftventricular end-diastolic pressure may not be close in certain situations.Giant ‘V’ waves in the PAOP are often associated with acute mitral regurgitation dueto retrograde blood flow into the left atrium during ventricular systole. Asimultaneously recorded ECG <strong>and</strong> PAOP trace most reliably confirms a giant V wave.The V wave will be located later in the cardiac cycle (well after the T wave) thanpulmonary artery systolic wave. The presence of a large V wave will cause thedisplayed mean PAOP to be higher than the pulmonary artery diastolic pressure <strong>and</strong>the mean pressure displayed may change minimally with balloon inflation. Accuratemeasurement of the PAOP as a reflection of the LV filling pressure requiresmeasurement of the average height of the A wave of the PAOP at end-expiration.The A wave is located at the end of the QRS complex of the simultaneously obtainedECG.The PAOP V wave may also be slightly dominant <strong>and</strong> elevated with reduced left atrialcompliance. Giant V waves may be due to decreased left ventricular compliance orhypervolaemia.Large, or cannon A waves in the PAOP may be seen in patients with A-V dissociation,when atrial contraction occurs at the time of ventricular contraction. The presenceof cannon A waves elevates the PAOP <strong>and</strong> is not reflective of left ventricular enddiastolicpressure.Failure to identify a large V wave on a PAC waveform may create animpression that the catheter has failed to wedge, resulting in repeat attempts towedge <strong>and</strong> possible pulmonary artery damage. Careful inspection of the waveform inrelation to the ECG is essential to prevent this occurrence.Mitral stenosis or left atrial myxoma prevents diastolic equilibration of pressuresbetween the LA <strong>and</strong> the LV <strong>and</strong> hence neither the PA diastolic pressure nor the PAOPreflect the LVEDP.Tricuspid regurgitation may cause difficulty in advancing the PACacross the tricuspid valve. In addition, it interferes with the reliableestimate of CO by thermodilution leading to variability in the signalwhich may lead to under or overestimation of CO. Tricuspidregurgitation also produces large V waves in the RAP or CVP.Accurate reflection of RVEDP requires measurement of the averageheight of the end-expiratory RA or CVP A wave measured in the T-Pinterval of the simultaneously obtained ECG.Cardiac output:thermodilutiontechnique tends tooverestimate lowlevels of cardiacoutput (
Left ventricular end-diastolic volume (LVEDV) is the most accurate clinicalmeasure of LV preload. The PAC measures PAOP which is an estimate of LVEDP.However, there must be a linear <strong>and</strong> predictable relationship between LVEDP <strong>and</strong>LVEDV in order for the PAOP to be a reliable indicator of LV preload. Any change inLV compliance uncouples this pressure/volume relationship.In critically ill patients many of the factors that determine LV compliance arein a state of dynamic flux making it very difficult to estimate LVEDV from LVEDP.Mechanical ventilation factors: increased intrathoracic pressure associated with PEEPhas a significant effect on juxtacardiac pressure. This effect may artefactuallyincrease PAOP. See Task 2.Limitations of pulse contour analysis <strong>and</strong> transpulmonarythermodilutionA reliable arterial waveform trace is essential for accurate cardiac outputmeasurements. Over- or under-damping of the arterial waveform will lead toincorrect measurements of cardiac output.Intra-aortic balloon pump alters the arterial waveform.Arrhythmias, e.g. atrial fibrillation.Nirmalan M, Willard TM, Edwards DJ, Little RA, Dark PM. Estimation of errors indetermining intrathoracic blood volume using the single transpulmonarythermal dilution technique in hypovolemic shock. Anesthesiology 2005;103(4): 805–812. PMID 16192773Minimally invasive methods of measuring cardiac output <strong>and</strong> cardiaccontractilityThe new methods that challenge the PAC for measuring cardiac output are reviewedin the following reference.Vincent JL, Rhodes A, Perel A, Martin GS, Della Rocca G, Vallet B, et al. Clinicalreview: Update on hemodynamic <strong>monitoring</strong>- a consensus of 16. CritCare 2011; 15(4): 229. PMID 2188464563
4/ INTERPRETING ADVANCED HAEMODYNAMIC DATA IN THE MAJORTYPES OF CIRCULATORY DYSFUNCTIONStroke volume/cardiac output/cardiac contractilityMeasurement of stroke volume (or stroke index) or cardiac output (or cardiac index)<strong>and</strong> cardiac contractility are useful for differentiating the causes of haemodynamicshock according to traditional classifications: hyovolaemic, cardiogenic, sepsis(distributive) <strong>and</strong> obstructive (pulmonary embolism, dissecting aneurysm, pericardialtamponade). This classification has practical merits useful for treatment whilerecognising that it oversimplifies the pathophysiology of shock.The ‘normal’ range of stroke index is 25-45 mL/beat m 2 <strong>and</strong> 2.5-3.5 L/min/m 2 forcardiac index (cardiac output/body surface area). However, less importance shouldbe placed on a particular number <strong>and</strong> more on the combination of clinicalexamination <strong>and</strong> haemodynamic data for an individual patient. Stroke volume/indexor cardiac output/index is adequate if there is no evidence of tissue hypoperfusion.For more information see the <strong>PACT</strong> modules on Heart failure, Acute myocardialischaemia <strong>and</strong> Hypotension.The relationship between cardiac output, myocardial contractility<strong>and</strong> Sv̄O 2 in haemodynamic shock of different aetiologies is shown inthe following table. The changes in cardiac output are mirrored bychanges in ScvO 2 (or Sv̄O 2 ). In septic shock, although cardiac outputis elevated, ejection fraction is frequently decreased.The clinicaldefinition ofcardiogenic shock isdecreased cardiacoutput with evidenceof tissue hypoxia inthe presence ofadequateintravascularvolume.In critically ill patients, there may be overlap of signs <strong>and</strong> symptomsbetween the different categories of shock. Data from the SHOCK trial indicated that18% of patients with cardiogenic shock following MI were also suspected of havingsepsis as a cause of shock. Keep an open mind when interpreting haemodynamicdata.Rabuel C, Mebazza A. Septic shock: a heart story since the 1960s. IntensiveCare Med 2006, 32(6): 799–807. PMID 16570145Levy MM, Fink MP, Marshall JC, Abraham E, Angus D, Cook D, et al. 2001SCCM/<strong>ESICM</strong>/ACCP/ATS/SIS International Sepsis Definitions Conference.Intensive Care Med 2003; 29(4): 530–538. PMID 1266421964
Kohsaka S, Menon V, Lowe AM, Lange M, Dzavik V, Sleeper LA, et al. Systemicinflammatory response syndrome after acute myocardial infarctioncomplicated by cardiogenic shock. Arch Intern Med 2005; 165(14): 1643–1650. PMID 16043684Pulmonary artery catheterThe indications for insertion of a pulmonary artery catheter (PAC) are discussed inTask 1. It is useful to consider the haemodynamic data obtained from the PAC in theform of a schematic representation of the heart.NORMAL RESTING PRESSURES AT RIGHT HEART CATHETERISATIONVascular resistance is expressed as metric units (dynes/sec/cm -5 ) or resistanceunits (mmHg/L/min). The difference between them is that metric units are greaterby a factor of 80. Resistance units are also called Wood units after the cardiologistwho introduced them.Q. What are the normal oxygen saturation values encountered during right heartcatheterisation?A. Approximate normal oxygen saturation values during right heart catheterisation: Superior vena cava: 70% Right atrium: 75% Right ventricle: 75% Pulmonary artery: 75% Wedged position, blood aspirated from distal port: 98%65
<strong>Haemodynamic</strong> data from the PAC in different clinical scenariosCardiogenic shock: clinical signs of hypoperfusion in conjunction with haemodynamicdata demonstrating decreased cardiac index <strong>and</strong> markedly elevated PAOP.CARDIOGENIC SHOCKRight heart failure: increases in RV end-diastolic <strong>and</strong> mean RA pressures. If causedby LV failure, these increases will be accompanied by an increase in PAOP <strong>and</strong> adecreased cardiac index. In the setting of an isolated RV infarct, the RA pressureswill be disproportionately elevated compared to PAOP.RIGHT VENTRICULAR INFARCT CARDIOGENIC SHOCK66
Septic shock: in the early stages, in particular, low arterial pressure, normal or lowPAOP <strong>and</strong> increased stroke index/cardiac index may be manifest. LV failure mayoccur in the later stages of the disease.SEPTIC SHOCKVentricular septal defect: Acute ventricular septal rupture: right heartcatheterisation may show a step-up in oxygen saturations of blood (>7%) in thepulmonary artery compared to the right atrium.ACUTE VENTRICULAR SEPTAL DEFECT67
Acute mitral regurgitation: in addition to a systolic murmur, a giant V wave occursin the PAOP waveform. With a simultaneously recorded ECG, the PAOP V wave ofacute mitral regurgitation occurs (well after the T wave), while the peak PA systolicwave (occurs within the QRS). See Task 2.‘V’ WAVE PCWPAcute massive pulmonary embolism: moderate pulmonary hypertension is seen inacute pulmonary embolism. However, the RV <strong>and</strong> PA systolic pressures rarely exceed50-55 mmHg. At greater pressures in the acute setting the RV dilates <strong>and</strong> can fail.The finding of a pulmonary artery systolic pressure >55 mmHg indicates chronicity asthe thin walled RV requires time to hypertrophy to generate the higher pressure. TheRA pressure is elevated <strong>and</strong> greater than the PAOP which is usually normal or low.ACUTE MASSIVE PULMONARY EMBOLISM (PE)68
Cardiac tamponade: the haemodynamic hallmark is equalisation of the RA, RV <strong>and</strong>PA diastolic <strong>and</strong> PAOP pressures.CARDIAC TAMPONADECONCLUSIONThis module has highlighted how haemodynamic <strong>monitoring</strong> is used to assess global<strong>and</strong> regional tissue perfusion at the bedside in critically ill patients. Fundamental tothe use of haemodynamic <strong>monitoring</strong> is the principle that changes in outcomedepend on the treatment changes that are guided by the information obtained,rather than on the monitors per se. The process is patient – rather than technology –centred <strong>and</strong> repeated clinical assessment is an integral part of haemodynamic<strong>monitoring</strong>. The module is designed to reflect the clinical environment where<strong>monitoring</strong> <strong>and</strong> clinical assessment are used in a stepwise fashion. The least invasive<strong>monitoring</strong> system that can aid diagnosis <strong>and</strong> usefully guide treatment is the systemof choice. It is strongly recommended to assess changes in monitored values overtime <strong>and</strong> in response to treatment, rather than single values.69
PATIENT CHALLENGESPatient 1A 68-year-old obese (100 kg) male is admitted to the Emergency Department after aroad traffic accident. He is short of breath <strong>and</strong> complains of pain during breathing.Observations include respiratory rate 30/min, pulse 110/min, blood pressure (BP) 130/70mmHg <strong>and</strong> SpO 2 92%. Initial surveys <strong>and</strong> X-rays reveal sternal bruising, left-sided ribfractures, a compound left supracondylar fracture, a left femoral fracture <strong>and</strong> pelvicfractures. The past medical history is significant for hypertension <strong>and</strong> myocardialinfarction.http://www.facs.org/trauma/atls/index.html<strong>PACT</strong> module on Multiple traumaQ. Presuming pain relief has been adequately addressed, how would you interpret thehaemodynamic data?A. Tachycardia <strong>and</strong> tachypnoea in this setting may indicate the presence of compensatedhaemodynamic shock. Given the history of hypertension, the BP may be lower than normalfor this patient <strong>and</strong> should be interpreted in context.Pain may mask hypovolaemia <strong>and</strong> a decrease in blood pressure may be a latesign of severe blood loss.The spine X-ray series show no bony injury. A CT (computed tomography) scan of the chestshows a normal aorta, bilateral lung contusions, a small left haemothorax <strong>and</strong> nopneumothorax. The liver, spleen <strong>and</strong> kidneys are intact.The O 2 saturation (SpO 2 ) drops while the patient is supine in the CT scanner <strong>and</strong> a pelvicscan is ab<strong>and</strong>oned. Despite increases in FiO 2 the patient remains hypoxic <strong>and</strong> in increasingrespiratory distress <strong>and</strong> the decision is made to intubate the trachea.Q. What risk to the circulation is posed by intubation <strong>and</strong> mechanical ventilation in thispatient?A. Hypotension.70
Q. Give three possible mechanisms for the hypotension.A.1. Hypovolaemia may be unmasked (perhaps dramatically) when a patient is sedated asincreased sympathetic tone (due to pain <strong>and</strong> anxiety) may have been causing the bloodpressure to be maintained.2. Sedative/anaesthetic drugs may have a direct cardiodepressant <strong>and</strong>/or vasodilatoryeffect.3. Positive intrathoracic pressure from mechanical ventilation will also decrease venousreturn <strong>and</strong> cardiac output.During intubation, additional fluids are given to treat hypotension. On arrival in the ICU,the nurse attaches a pulse oximeter to the left h<strong>and</strong> but is unable to get a signal. Whenthe device is placed on the right h<strong>and</strong> there is a low amplitude waveform.Blood pressure is 85/60 mmHg <strong>and</strong> heart rate 120 beats/min.Q. Monitoring problems might be patient- or device- related. What patient factors mighthave compromised the signal from the pulse oximeter on the left h<strong>and</strong>?A. A patient factor may have been the left supracondylar fracture compromising thebrachial artery. (The CT scan ruled out aortic pathology). There is also likely to be asystemic problem (hypovolaemia) as evidenced by the poor signal on the right side.When haemodynamic <strong>monitoring</strong> data is inconsistent, re-examine the patientTobin MJ, ed. Principles <strong>and</strong> Practice of Intensive Care Monitoring. McGraw–Hill; 1998. pp. 261–287. ISBN-10: 0070650942Q. If you suspected a device-related factor, how would you check for this?A. Make sure that the probe, connections <strong>and</strong> set-up of the monitor are correct. You cancheck device-related problems quickly by connecting the probe to your own finger.Trouble-shooting a defective oximetry trace entails checking the devicePrinciples of pulse oximetry71
Q. If there was clinical evidence of brachial artery compromise, what would the priority benow?A. Decompression/revascularisation of the left upper limb. Urgent consultation to thevascular <strong>and</strong> orthopaedic surgeons is required.Manipulation of the supracondylar fracture under general anaesthesia achieves reperfusionof the left h<strong>and</strong>. Following internal fixation of the femoral fracture the patient returns tothe ICU. Hypotension, arterial pressure (AP) 85/45 mmHg, is a problem despite additionalfluid therapy perhaps because of covert bleeding from pelvic fractures.Q. What types of haemodynamic <strong>monitoring</strong> might you consider?A. The current state suggests hypovolaemia <strong>and</strong> you institute invasive AP (right-sided,given the left arm injury) <strong>and</strong> central venous pressure (CVP) <strong>monitoring</strong>.Indications for invasive haemodynamic <strong>monitoring</strong>Q. What are the advantages of invasive AP <strong>monitoring</strong> at this stage?A. Beat-to-beat AP <strong>and</strong> <strong>monitoring</strong> of pulse pressure variation <strong>and</strong> it allows serialmeasurements of gas exchange by blood gas analyses.Q. What are the advantages of CVP <strong>monitoring</strong> at this stage?A. The CVP response to fluid challenges is a useful guide to resuscitative therapy. Inaddition, the AP/CVP combination allows estimations of global tissue perfusion by seriallactate <strong>and</strong> ScvO 2 .Q. Is a pulmonary artery catheter warranted?A. A pulmonary artery catheter (PAC) is not indicated during initial resuscitation.Pulse pressure variationMarkers of global tissue perfusionPAC is not indicated during initial resuscitationDespite further fluid resuscitation, the patient remains hypotensive, with a lactate level of5.4 mmol/L <strong>and</strong> ScvO 2 of 58%.72
Q. Other than hypovolaemia, what are the other e.g. cardiopulmonary possible causes ofhypotension <strong>and</strong> global malperfusion?A. The sternal bruising may be associated with cardiac contusions or pericardial effusion.Pulmonary contusions may cause pulmonary hypertension (hypoxic pulmonaryvasoconstriction), increasing right ventricular afterload <strong>and</strong> contributing to right heartfailure. There may be underlying ventricular dysfunction from a previous (or indeed anacute) myocardial infarction.Q. If CVP is low, does this help to differentiate between the above mentioned possiblecauses of the patient’s hypotension?A. A low CVP means right heart contusion, tension pneumothorax <strong>and</strong> tamponade areunlikely. Although a low CVP is suggestive of hypovolaemia, remember that hypovolaemiamay not be the only clinical problem as heart failure may co-exist with hypovolaemia inthe presence of the low CVP.When measured, the CVP was 14 mmHg.Q. What simple intervention might you use to elucidate the nature of shock present?A. Administer a fluid challenge <strong>and</strong> assess the patient response. See Task 1.Q. What additional measures or <strong>monitoring</strong> could you use to establish whether heart failureis the problem?A. Echocardiography would enable assessment of right <strong>and</strong> left ventricular function, fillingstatus of the ventricles <strong>and</strong> rule out pericardial effusion. A pulmonary artery catheterwould give information on right- <strong>and</strong> left-sided filling pressures <strong>and</strong> cardiac output (CO).Echocardiography is the test of choice in a hypotensive trauma patient.Pericardial effusion <strong>and</strong> tamponade can be demonstrated. With cardiac contusionthere may be a reduction in ejection fraction <strong>and</strong> wall motion abnormalities may bepresent.Diagnosis of heart failure using a pulmonary artery catheterBecause of ongoing poor oxygenation <strong>and</strong> cardiovascular impairment, you insert apulmonary artery catheter that displays continuous cardiac output <strong>and</strong> SvO 2 . Body surfacearea measures 2.5 m 2 . <strong>Haemodynamic</strong> data:73
Heart rate 110 beats/min AP 90/55 mmHg SaO 2 95% Serum lactate 5.8 mmol/L Urinary output 5–10 mL during the last three hours Haemoglobin 7.0 g/dLQ. How do you interpret the pressure data with respect to right <strong>and</strong> left heart function?A. The moderate pulmonary hypertension is related to pulmonary contusion <strong>and</strong> not to leftventricular (LV) failure as PAOP is normal. The diastolic pulmonary artery pressure to PAOPgradient indicates increased pulmonary artery resistance secondary to acute lung injury.Right atrial pressure is higher than PAOP indicating right ventricular (RV) dysfunction dueto a combination of RV contusion <strong>and</strong> pulmonary hypertension.Pulmonary hypertension. In: Webb AR, Shapiro MJ, Singer M, Suter PM, eds.Oxford Textbook of Critical Care (OTCC). Oxford: Oxford UniversityPress; 1999. pp. 280–283. ISBN-10 01926273761. A gradient >5 mmHg between pulmonary artery diastolic pressure <strong>and</strong> PAOPindicates increased pulmonary artery resistance.2. Normally PAOP is higher than RAP by 2–3 mmHg, the reverse indicates RVdysfunction or pulmonary vasoconstriction.74
The ICM consultant performs a transoesophageal echocardiogram.TOE RV hypokinesis TOE RV 2RA = right atrium, RV = right ventricle, LV = left ventricleQ. Are the echo findings consistent with the PAC data? Give your reasons.A. Yes. There is RV hypokinesis. There is no evidence of cardiac tamponade.Echo diagnosis of right heart failureQ. Is the cardiac output adequate in this patient? Give reasons.A. No. The low SvO 2 <strong>and</strong> elevated serum lactate confirm global tissue hypoperfusion. Thecardiac index (CO÷BSA) of 2.0 L/min/m 2 is below normal range. A low CI combined withtachycardia indicates a low stroke volume index; in this case 16.7 mL/m 2 .Calculation of derived haemodynamic variables from pulmonary artery catheterTo increase CO <strong>and</strong> oxygen delivery, you ask the nurse to perform a fluid challenge (300mL of packed red blood cells over 30 min).You provide a simple decision rule for the nurse to terminate the fluid challenge.An acute <strong>and</strong> consistent increase in either RAP or PAOP without a concomitant increase instroke index indicates ventricular overload <strong>and</strong> fluid resuscitation should be stopped.Following three consecutive fluid challenges, the haemodynamic assessment shows:75
Heart rate 95 beats/min AP 95/60 mmHg SaO 2 95% Serum (blood) lactate 4.5 mmol/L Urine output 65 mL during the last two hours Haemoglobin 9.0 g/dLContinuous cardiac output <strong>monitoring</strong> facilitates assessment of a fluidchallenge.Q. The stroke volume index has increased (now 28 mL/m 2 ). Do you consider the overallchanges in values to meet the goals of your fluid challenge? Explain your answer withreference to the therapeutic goals you were using.A. Yes. Your goal was to increase CO by optimising stroke volume <strong>and</strong> thus improve oxygendelivery. This was associated with an increase in SvO 2 <strong>and</strong> a decrease in serum lactate.Urinary output has also improved, indicating improved perfusion to the kidneys.76
Q. If the SvO 2 remained below normal <strong>and</strong> serum lactate continued to rise, indicate twofurther pharmacologic interventions you could consider to improve cardiac output.A.1. Administration of dobutamine would increase stroke volume <strong>and</strong> cardiac output (1-agonist action) <strong>and</strong> decrease pulmonary vascular resistance.2. A pulmonary vasodilator such as inhaled nitric oxide might be considered to lowerpulmonary artery pressure <strong>and</strong>, by reducing RV afterload, lead to an improvement in rightventricular function.Q. Explain the reversal of the normal relationship between ScvO 2 <strong>and</strong> SvO 2 .A. There is a reduction in blood flow to the splanchnic <strong>and</strong> renal circulation, resulting in afall in oxygen content in the inferior vena cava. Therefore ScvO 2 , which is measured fromthe SVC, is greater than SvO 2 . See Task 2.ScvO 2 <strong>monitoring</strong>ScvO 2 may be greater than SvO 2 in shock states<strong>PACT</strong> module on Heart failureBloos F, Reinhart K. Venous oximetry. Intensive Care Med 2005; 31(7): 911–913.PMID 15937678The patient is haemodynamically stable. However, 24 hours later, on clinical examinationyou auscultate a new pansystolic murmur. There is an apical systolic thrill.Q. Can the central venous <strong>and</strong> pulmonary artery catheters help with diagnosing the causeof the murmur? Explain your answer.A. Yes. The possible causes of pansystolic murmur in this setting are tricuspidregurgitation, mitral regurgitation <strong>and</strong> ventricular septal defect. The central venous <strong>and</strong>pulmonary artery catheters may help differentiate between these possibilities.Central venous <strong>and</strong> pulmonary artery catheters may facilitate diagnosis of a pansystolicmurmur77
The following RAP trace is recorded from the PAC.Q. In this context, how do you interpret the RAP trace recorded from the PAC?A. There is no evidence of a large V wave. Therefore tricuspid regurgitation is unlikely.A large V wave on a CVP trace may indicate tricuspid regurgitationThe following PAOP trace is obtained.Q. In this context how do you interpret the PAOP trace?A. There is no evidence of a large V wave. Therefore mitral regurgitation is unlikely. Inaddition, the relative haemodynamic stability makes acute mitral regurgitation unlikely.A large V wave on a PAOP trace may indicate mitral regurgitationThe PAC shows the following O 2 saturations.78
Q. In this context how do you interpret the O 2 saturations obtained from the PAC?A. There is step-up in O 2 saturation of >8% between the right atrium <strong>and</strong> pulmonary artery.This indicates a left to right shunt at the level of the right ventricle. The cause is atraumatic ventricular septal defect (VSD). The apical thrill on clinical examination is verysuggestive of a VSD.A step-up in O 2 saturation >8% in the chamber before <strong>and</strong> after an intracardiacsite indicates a left to right shunt.Q. How would you confirm the diagnosis of VSD?A. Echocardiography is the haemodynamic monitor/diagnostic mode of choice to diagnosea VSD.EchocardiographyEchocardiography demonstrates dilated RV cavity with RV free wall hypokinesis (consistentwith contusions), <strong>and</strong> an apical traumatic VSD. Blood pressure begins to fall. An intraaorticballoon pump (IABP) is inserted as a bridge to surgery. Coronary angiographydemonstrates no critical coronary artery stenosis. The patient undergoes surgical closureof a traumatic VSD. The postoperative course is relatively smooth; the IABP is removed dayone <strong>and</strong> the patient extubated day five. He is subsequently discharged from hospital 23days post admission.79
Patient 2At 01.00 hours, you are called to the haematology ward to see a 20-year-old pregnant(18/40 gestation) patient who is tachycardic (heart rate 140/min) <strong>and</strong> tachypnoeic. Shehas non-Hodgkin’s lymphoma, <strong>and</strong> abdominal lymphadenopathy has caused obstructiveuropathy. Ten hours previously, bilateral nephrostomy tubes were inserted emergently.She is day eight post chemotherapy with cyclophosphamide, doxorubicin, vincristine <strong>and</strong>prednisolone. You notice that the patient is cold <strong>and</strong> ‘shut down’.Q. What is your initial <strong>management</strong>?A. High flow oxygen via face mask. You obtain a portable monitor displaying ECG, bloodpressure <strong>and</strong> oxygen saturation (SpO 2 ).Although the case is complex, this first line approach is the same in all critically illpatients. The non-invasive blood pressure (NIBP) measures 100/40 mmHg <strong>and</strong> the SpO 2 94%(8 L/min O 2 ). You transfer the patient to the ICU.Oxygen <strong>and</strong> basic <strong>monitoring</strong> is the first line <strong>monitoring</strong> approach in all critically illpatientsThe referring resident tells you the patient has sickle cell disease (compoundheterozygote) <strong>and</strong> a lower limb deep venous thrombosis, for which she is receiving lowmolecular weight heparin. On arrival in the ICU, a radial arterial catheter is inserteddemonstrating AP 85/35 mmHg <strong>and</strong> an arterial blood gas shows a pH of 7.20, PaO 2 4.5 kPa,<strong>and</strong> serum lactate 6.3 mmol/L.See the <strong>PACT</strong> module on Bleeding <strong>and</strong> thrombosisQ. How do you interpret the monitored data?A. The patient is hypotensive with evidence of global tissue hypoperfusion.See the <strong>PACT</strong> module on HypotensionQ. Given her recent procedure (nephrostomy tube insertion), what is the most likelydiagnosis?A. Severe sepsis <strong>and</strong> sepsis-associated tissue hypoperfusion. Septic shock needs to be ruledout.80
Dellinger RP, Levy MM, Rhodes A, Annane D, Gerlach H, Opal SM, et al;Surviving Sepsis Campaign Guidelines Committee including The PediatricSubgroup. Surviving Sepsis Campaign: international guidelines for<strong>management</strong> of severe sepsis <strong>and</strong> septic shock, 2012. Intensive Care Med2013; 39(2): 165–228. PMID 23361625Q. Is there a background predisposing factor for sepsis in this patient? What is the likelypathological process <strong>and</strong> category of pathogen?A. She is an immunosuppressed patient (post chemotherapy). She likely has a Gramnegativebacteraemia.Q. Outline two other aetiological possibilities?A.1. Hypovolaemia secondary to a retroperitoneal bleed; the procedure was performed whilethe patient was anticoagulated.2. Pulmonary embolism (PE) is possible despite anticoagulation. Sickle cell disease <strong>and</strong>malignancy create a prothrombotic tendency.More than one pathological process may be present; keep an open mind when interpretinghaemodynamic data<strong>PACT</strong> module on Sepsis <strong>and</strong> MODS<strong>PACT</strong> module on Immunocompromised patientsTreatment is commenced with fluid loading, normal saline (1,500 mL) being chosen in thisinstance. Blood pressure <strong>and</strong> heart rate respond. Haemoglobin measures 10 g/dL.Following blood <strong>and</strong> urine cultures, i.v. piperacillin/tazobactam <strong>and</strong> gentamicin arecommenced (safe in pregnancy). The patient becomes increasingly drowsy <strong>and</strong> is intubated<strong>and</strong> mechanically ventilated for airway protection. The AP drops to 80/35 mmHg, a centralvenous catheter is inserted <strong>and</strong> a noradrenaline infusion (0.1 mcg/kg/min) commenced.<strong>Haemodynamic</strong> data after the fluid therapy <strong>and</strong> the commencement of noradrenaline are: Heart rate 98 beats/min AP 90/50 mmHg CVP 25 mmHg SaO 2 98% ScvO 2 58% Serum lactate 7 mmol/L Urinary output 0–5 mL during the last 2 hours81
Begin empiric antibiotic treatment (after cultures taken) while institutinghaemodynamic treatment/<strong>monitoring</strong>.Q. How do you interpret the haemodynamic data?A. The circulatory hypoperfusion (lactate 7 mmol/L) <strong>and</strong> the failure of the hypotension torespond to fluid resuscitation defines (septic) shock.Dellinger RP, Levy MM, Rhodes A, Annane D, Gerlach H, Opal SM, et al;Surviving Sepsis Campaign Guidelines Committee including The PediatricSubgroup. Surviving Sepsis Campaign: international guidelines for<strong>management</strong> of severe sepsis <strong>and</strong> septic shock, 2012. Intensive Care Med2013; 39(2): 165–228. PMID 23361625Q. The elevated CVP is an unexpected finding. List a minimum of four possible reasons forthis finding in this patient.A.The measurement may be erroneousRight ± left ventricular failure secondary to severe sepsis or chemotherapeutic drugsPulmonary embolismTension pneumothorax post central catheter insertion in a ventilated patientCardiac tamponade due to malignant pericardial effusionConstrictive pericarditisdata.Assessment of an unexpected result involves rechecking the accuracy of theCentral venous pressure <strong>monitoring</strong>You re-zero the CVP <strong>and</strong> check the transducer position; the measurement is 22 mmHg. Thechest X-ray shows no evidence of pneumothorax. After discussion with the ICMconsultant/colleague, an echocardiogram is performed to rule out cardiac tamponade. Itshows very poor biventricular function, ejection fraction 20–25%.82
A dobutamine infusion is commenced <strong>and</strong> gradually increased to 7.5 mcg/kg/min.Continuous veno-venous haemodialysis (CVVHD) is started as the serum potassiummeasures over 6.0 mmol/L. After three hours, the haemodynamic data are: Heart rate 90 beats/min AP 100/40 mmHg CVP 18 mmHg SaO 2 98% ScvO 2 67% Serum lactate 5 mmol/L Urinary output 0 mLCardiac tamponade, if suspected in a shocked patient, needs to be urgentlyruled out.Q. Is the cardiac output (CO) improving or adequate?A. An increased ScvO 2 <strong>and</strong> falling serum lactate suggest an adequate CO. Urinary outputwould not necessarily increase due to a likely already established acute renal failure(despite relief of the urinary tract obstruction) <strong>and</strong> commencement of CVVHD.Assessing the adequacy of cardiac outputBlood cultures subsequently confirm Gram-negative bacteraemia <strong>and</strong> the patient isimproving with treatment.On day three however, a miscarriage is associated with massive blood loss (>3 litres). Lowmolecular weight heparin is ceased. Despite blood product transfusion <strong>and</strong> increasinginotrope support, hypotension (AP 80/40 mmHg) is a problem. The ICM consultant decidesto insert a pulmonary artery catheter when some stability has been achieved.<strong>Haemodynamic</strong> data: Heart rate 120 beats/min SpO 2 97% Serum lactate 6 mmol/L83
Q. When the PAOP was being measured, there was concern that the trace wasincompletely ‘wedged’. What is your assessment of the PAOP obtained?A. The pulmonary artery diastolic pressure is less than PAOP <strong>and</strong> therefore is likely anerroneous measurement.PAOP is usually 2–3 mmHg lower than pulmonary artery diastolic pressureCommon problems with pulmonary artery catheter waveformsYou reposition the pulmonary artery catheter <strong>and</strong> measure PAP; 45/18 mmHg <strong>and</strong> PAOP 13mmHg.Q. Other than checking the chest X-ray, what additional check could you use to ensure thevalidity of the PAOP reading?A. Aspiration of highly oxygenated (‘arterialised’) blood, when the balloon is inflated <strong>and</strong>the catheter wedged, is confirmation of the direct contact of the catheter tip with thepulmonary capillary bed <strong>and</strong> therefore of the validity of the recorded PAOP.84
Q. What therapeutic intervention would you make in this patient on obtaining the accuratePAOP (which measures 13 mmHg)?A. A fluid challenge. A PAOP of 13 mmHg in the presence of LV dysfunction may beinadequate.The patient responds to further fluid loading with an increase in AP, CI <strong>and</strong> ScvO 2 <strong>and</strong> a fallin serum lactate. However the gas exchange deteriorates in association with radiologicalchanges of pulmonary oedema. The inspiratory fraction of oxygen (FiO 2 ) is increased tomaintain SaO 2 >94% <strong>and</strong> PEEP is set at 10 mmHg. Tidal volume (450 mL) <strong>and</strong> respiratoryrate (15 mL/min) result in an inspiratory peak pressure of 38 mmHg <strong>and</strong> a plateau pressureof 30 mmHg in this patient.Q. What effect would the increase in PEEP have on the PAOP measurement?A. Positive juxtacardiac pressure at end-expiration (PEEP) will cause the measured PAOP tooverestimate transmural pressure, thus measured PAOP will overestimate left ventricularfilling pressure. Less compliant lungs will minimise the extent of this artefact.Bleeding resolves <strong>and</strong> the patient becomes haemodynamically stable. During the next 48hours excess fluid is gently removed via CVVHD. The patient is successfully extubated dayfive post admission <strong>and</strong> renal function begins to improve. A second cycle of chemotherapywas scheduled one month post discharge from ICU.85
Patient 3A junior doctor requests that you review a 45-year-old man with known alcoholic liverdisease, admitted 24 hours previously following a seizure. His past medical historyincludes oesophageal varices, ischaemic heart disease, <strong>and</strong> COPD. On initial assessment heis jaundiced, has clinical evidence of ascites, <strong>and</strong> his level of consciousness is reduced (helocalises to a painful stimulus, mumbles incomprehensible sounds, <strong>and</strong> opens eyes to pain).Despite oxygen therapy at 4 L/min via nasal prongs, his SpO 2 reads 85%. He is cold <strong>and</strong>clammy to touch. Non-invasive systolic blood pressure reads 70 mmHg <strong>and</strong> his heart rate is120 beats/minute.Q. What is your first step?A. You immediately increase his oxygen to high flow (10 L/min). While performing furtherassessment, you commence a fluid bolus with 500 mL crystalloid/colloid.Q. How would you interpret the clinical information given?A. This patient has evidence of tissue hypoperfusion <strong>and</strong> is shocked.Q. Why might his SpO 2 be low?A. The low oxygen saturation reading could be due to hypoxia from respiratory failure orcould be secondary to malperfusion.Initial approach to a critically ill patient necessitates rapid resuscitation measures inparallel with clinical assessment.Further clinical examination reveals that he is tachypnoeic (RR 24) <strong>and</strong> has bilateralcrepitations on auscultation. On exposing his lower limbs you note mottling around theknees. Arterial blood gas measurements: PaO 2 8.7 kPa (65 mmHg) PaCO 2 4.7 kPa (35 mmHg) pH 7.25 Lactate 9 mmol/L Base excess -7Clinical assessment, basic <strong>monitoring</strong> <strong>and</strong> assessment of global perfusion86
Q. What is the cause of shock in this case?A. Sepsis is likely, but further clinical information is required to determine the exactcause. You should keep an open mind at this stage.This patient is at high risk for spontaneous bacterial peritonitis, as well as pneumonia, <strong>and</strong>CNS infection. Differential <strong>and</strong> additional diagnoses should include hypovolaemic shockfrom upper GI bleeding, cardiogenic shock following a possible recent cardiac event, acutedecompensated liver failure with hepatic encephalopathy.Remember, more than one cause of haemodynamic shock may exist at the same time.Irrespective of the underlying cause, the initial steps in resuscitation will be similar.<strong>PACT</strong> module on Heart failure<strong>PACT</strong> module on Acute hepatic failure<strong>PACT</strong> module on Sepsis <strong>and</strong> MODSQ. What is your next step?A. In the setting of respiratory failure <strong>and</strong> haemodynamic shock, along with reduced levelof consciousness, emergent intubation <strong>and</strong> mechanical ventilation is m<strong>and</strong>ated.Q. How might intubation be approached? Name a potential hazard?A. It should be approached with care as shock is already present <strong>and</strong> circulatory collapsecould occur with sedative drug administration.Q. Where might it be done?A. The patient should ideally be transferred to the intensive care setting for this, if time<strong>and</strong> resources permit.<strong>PACT</strong> module on Acute respiratory failureYou intubate the patient in ICU, <strong>and</strong> continue fluid resuscitation while nursing staffprepare arterial <strong>and</strong> central venous catheters to site. After taking blood cultures youadminister broad spectrum antibiotics to cover possible aspiration pneumonitis <strong>and</strong>spontaneous bacterial peritonitis, <strong>and</strong> meningo-encephalitis. The septic work-up alsoincluded a peritoneal fluid tap but not a sample for CSF examination due to the bleedingrisk – see below. You also commence a vasopressor infusion. Lab haematology values are:87
INR 2.1 Platelets 50,000/mL Hb 10 g/dL WCC 24,000<strong>PACT</strong> module on Severe infectionQ. What are the considerations in relation to insertion of invasive catheters?A. There is an increased risk of bleeding complications during insertion of invasivecatheters. In some cases it may be appropriate to transfuse platelets <strong>and</strong> plasma prior toline insertion, but the severity of the situation may not permit a delay while bloodproducts are being prepared.In this case you elect to proceed, choosing the femoral route <strong>and</strong> using realtime ultrasoundto guide you.How do I set-up the chosen types of haemodynamic <strong>monitoring</strong>?Complications of haemodynamic <strong>monitoring</strong>The patient remains hypotensive despite 3L crystalloid fluid resuscitation <strong>and</strong>noradrenaline infusion at 0.2 mcg/kg/min.Q. CVP reads 10 mmHg. How do you interpret this result?A. A single CVP reading should not be interpreted in isolation.Q. As part of this assessment, you wish to ascertain whether tissue perfusion has improvedfollowing your resuscitative measures. What will you ask yourself <strong>and</strong> consider?A. Have capillary refill <strong>and</strong> skin perfusion improved? Is serum lactate reduced? Is urineoutput adequate? If not, further fluid resucuitation may be required.All static measures of preload must be interpreted within the clinical context.Q. If the response to your interventive <strong>management</strong> is inadequate at this stage, would youinitiate further haemodynamic <strong>monitoring</strong>?A. Yes.88
Q. Why?A. There is a risk of pulmonary oedema with excess volume loading. You want to ascertainif the patient remains fluid responsive <strong>and</strong> what is the cardiac output. Given the history ofcardiac disease you also want to determine the cardiac contractility.You perform bedside trans-thoracic echo. Windows are limited but you can clearly see ahyperdynamic heart with excellent contractility. You also note that the left ventricularwalls are ‘kissing’ at end-systole.Echocardiography excludes a ‘cardiogenic’ component of haemodynamic shock.An ‘empty’ LV suggests that further fluid administration may be warranted.You give a further challenge <strong>and</strong> also decide to use a PiCCO TM monitor to guide your further<strong>management</strong>. Arterial waveform analysis <strong>and</strong> thermodilution values obtained: PPV (pulse pressure variation): 18% GEDI (global end-diastolic volume index): 500 mL/ m 2 EVLWI (extravascular lung water index): 5 mL/kg PVPI (pulmonary vascular permeability index): 2Q. How do you interpret these values, particularly the PPV of 18%?A. In order to reliably interpret the PPV data you first confirm that the patient is notbreathing spontaneously, that the tidal volume is ≥8 mL/kg, <strong>and</strong> that sinus rhythm ispresent. A PPV value of 18% indicates that fluid challenging should improve cardiac ouput.The thermodilution data support this.Interpreting dynamic measures of preloadPPV of ≥13% in septic patients has been shown to be a specific <strong>and</strong> sensitive indicator ofpreload responsiveness.Prerequisites for the use of PPV include sinus rhythm, absence of spontaneousventilatory effort <strong>and</strong> tidal volume ≥8 mL/kg.Q. You obtain a portable chest X-ray, What further diagnostic tests would you consider atthis point? Would you consider an upper GI endoscopy?A. After discussion of the advisability of a CT scan of brain +/- abdomen, you agree on a CTbrain <strong>and</strong> abdominal ultrasound. You decide against upper GI endoscopy at present as Hbhas not dropped from previous levels, <strong>and</strong> there has been no clinical evidence of an upperGI bleed.89
CXR shows right lower lobe pneumonia. Ascitic fluid polymorphonuclear count (100/ mm 3 )is not indicative of spontaneous bacterial peritonitis (SBP) – see Learning Issue. CT brainreveals atrophic change but no evidence of raised ICP or intracerebral haemorrhage.Abdominal ultrasound scan shows a cirrhotic liver with associated ascites, but no evidenceof hepatic or portal vein thrombosis.Polymorphonuclear count of >250/mm 3 on ascitic fluid analysis is diagnostic of spontaneousbacterial peritonitis<strong>PACT</strong> module on Coma <strong>and</strong> altered consciousness<strong>PACT</strong> module on Clinical imaging<strong>PACT</strong> module on Abdomen in acute/critical care medicineTwo days later the patient’s noradrenaline requirement has reduced to 0.1 mcg/kg/min,the urine output is >0.5 mL/kg/hour, <strong>and</strong> peripheral perfusion has improved. Lactate,although reduced, remains elevated at 4 mmol/L.Q. What is your interpretation of the lactaemia – despite the resolution of the circulatoryshock?A. The clearance of lactate may be slow due to hepatic dysfunction.Always interpret values in clinical context. A patient who has warmperipheries with good urine output <strong>and</strong> minimal vasopressor requirement does nothave significant haemodynamic shock.Clinical assessmentCauses of hyperlactaemiaOn day three the patient’s oxygen requirement increases to FiO 2 0.8. CXR now showsdiffuse bilateral pulmonary infiltrates. PiCCO readings are: PPV 5% GEDI 870 mL/m 2 EVLWI 15 mL/kg PVPI 4Q. You suspect evolving ARDS <strong>and</strong> you note that the patient has positive fluid balance.What do you do now?A. Active diuresis is indicated.Q. How would you ventilate the patient?A. You utilise lung protective ventilation by maintaining the tidal volume at 6 mL/kg, <strong>and</strong>titrate up the PEEP.90
Recognising that the patient is now on the flat part of the Frank–Starling curve will changeyour haemodynamic <strong>management</strong>.Offloading fluid <strong>and</strong> aiming for a negative balance becomes a priority, especially if ARDShas developed.The patient spends a further 18 days in the ICU, with a course complicated by ventilatorassociatedpneumonia <strong>and</strong> delirium. Tracheostomy is performed as he is slow to wean frommechanical ventilation. He is decannulated on day 21 of hospital admission <strong>and</strong> dischargedhome a week later.On reflection, these cases demonstrate how a systematic approach to haemodynamic<strong>monitoring</strong>, together with the early utilisation of measured information, can be appliedwhatever the clinical scenario. The concept of maintaining adequate global <strong>and</strong> tissueperfusion is central to both <strong>monitoring</strong> <strong>and</strong> <strong>management</strong>. Frequent reassessment of theindices of organ <strong>and</strong> tissue perfusion <strong>and</strong> keeping an open mind are m<strong>and</strong>atory. Note theimportance of the diagnostic information concurrently obtained in shaping therapy.Ongoing critical appraisal of the information is m<strong>and</strong>atory for optimum <strong>management</strong> <strong>and</strong> tominimise errors.91