MLC Monitor Load Control User's Guide - Alber
MLC Monitor Load Control User's Guide - Alber
MLC Monitor Load Control User's Guide - Alber

You also want an ePaper? Increase the reach of your titles
YUMPU automatically turns print PDFs into web optimized ePapers that Google loves.
<strong>Monitor</strong> <strong>Load</strong> <strong>Control</strong> <strong>MLC</strong> SoftwareUser’s <strong>Guide</strong>3103 North Andrews Avenue ExtensionPompano Beach FL 33064Tel: (954) 623–6660 Fax: (954) 623–6671www.alber.com4200-020 R2.0
<strong>Monitor</strong> <strong>Load</strong> <strong>Control</strong> <strong>MLC</strong> SoftwareUser’s <strong>Guide</strong>3103 North Andrews Avenue ExtensionPompano Beach FL 33064Tel: (954) 623–6660 Fax: (954) 623–6671www.alber.com4200-020 R2.0
Information in this document is subject to change without notice.<strong>Monitor</strong> <strong>Load</strong> <strong>Control</strong> Software <strong>MLC</strong> User’s <strong>Guide</strong>, Book PN 4200-020 Revision 2.02001 Albércorp. 3103 North Andrews Avenue Extension Pompano Beach FL 33064Tel: (954) 623–6660 Fax: (954) 623–6671This manual may not be copied in whole or in part without express written permission fromAlbércorp.Microsoft, Microsoft Windows, and Microsoft Explorer are either trademarks or registeredtrademarks of Microsoft Corporation. Pentium is a trademark of Intel Corporation.
Table of ContentsTable of Contents1 GENERAL DESCRIPTION ....................................................................................... 12 SYSTEM REQUIREMENTS ...................................................................................... 13 SOFTWARE INSTALLATION................................................................................... 14 PASSWORD ............................................................................................................. 25 COMMUNICATION SETTINGS ................................................................................ 26 MAIN MENU ............................................................................................................. 46.1 Setup ............................................................................................................................ 46.2 Test ............................................................................................................................... 46.3 Reports ......................................................................................................................... 46.4 Diagnostics ................................................................................................................... 46.5 Communications ........................................................................................................... 46.6 Calibration ..................................................................................................................... 46.7 Help .............................................................................................................................. 57 RECOMMENDED TESTS ......................................................................................... 57.1 Micro-Ohmmeter ........................................................................................................... 57.2 Hydrometer ................................................................................................................... 57.3 Temperature (Electrolyte).............................................................................................. 57.4 Temperature (Ambient) ................................................................................................. 57.5 Equalize Charging ......................................................................................................... 67.6 Test History ................................................................................................................... 68 CONNECTING THE LOAD BANK TO THE <strong>MLC</strong> ..................................................... 68.1 Determine <strong>Load</strong> Type .................................................................................................... 68.1.1 Optional <strong>Load</strong> Banks (Battery Isolated) ................................................................... 68.1.2 Optional <strong>Load</strong> Banks (Supplemental <strong>Load</strong>) ............................................................. 68.1.3 System <strong>Load</strong> ........................................................................................................... 68.1.4 Connecting The <strong>Load</strong> Bank ..................................................................................... 79 SETTING UP THE <strong>MLC</strong> FOR LOAD TEST .............................................................. 79.1 Location ........................................................................................................................ 79.2 Battery Strings............................................................................................................... 89.3 Test Setup ..................................................................................................................... 89.4 Test Types .................................................................................................................... 99.4.1 Performance Test .................................................................................................... 99.4.2 Modified Performance Test ..................................................................................... 99.4.3 Service Test ...........................................................................................................109.4.4 Rundown Test ........................................................................................................109.4.5 Charger Test ..........................................................................................................119.4.6 Recharge Test ........................................................................................................119.5 Test Setup Parameters ................................................................................................129.5.1 Rated Time, Test Types: Performance, Modified Performance ..............................129.5.2 Power Type, Test Types: Performance, Modified Performance, Service, Charger .129.5.3 Temperature And Correction, Test Types: Performance, Modified Performance ....129.5.4 Alarm Levels, Test Types: Performance, Modified Performance, Service, Rundown,Recharge ...............................................................................................................134200-020R2.0 i 9/25/2009
Table of Contents9.5.5 Test Steps, Test Types: Performance, Modified Performance, Service, Rundown,Charger ..................................................................................................................139.5.6 Calculate Capacity At Target, Test Types: Performance, Modified Performance ....149.5.7 Ignore Zero Target Steps, Test Types: Modified Performance ...............................149.5.8 Charger High/Low Voltage Warning, Test Types: Charger .....................................149.5.9 Recharge Hours, Test Types: Recharge ................................................................149.6 <strong>Load</strong> Bank ....................................................................................................................1410 RUNNING THE TEST ............................................................................................. 1610.1 Start The Test ..............................................................................................................1710.2 <strong>Load</strong> Test <strong>Control</strong> .........................................................................................................1810.3 Manual <strong>Load</strong> Bank <strong>Control</strong> ...........................................................................................1810.4 View Alarms During Test ..............................................................................................1910.4.1 Cell Alarm ..............................................................................................................1910.4.2 Overall Voltage Alarm ............................................................................................2010.5 Test Window Toolbar ...................................................................................................2010.5.1 Cell Exclusion.........................................................................................................2110.5.2 Alarm Levels ..........................................................................................................2110.5.3 Test Steps ..............................................................................................................2210.5.4 <strong>Load</strong> Bank Adjust ...................................................................................................2310.5.5 Modify Graph..........................................................................................................2310.5.6 View Alarms ...........................................................................................................2410.6 Charger Test Window ...................................................................................................2510.7 Hardware Failure ..........................................................................................................2511 REPORT GENERATOR ......................................................................................... 2511.1 Starting the Report Generator ......................................................................................2611.2 Opening A Report ........................................................................................................2611.3 <strong>Load</strong>ing A File ..............................................................................................................2611.4 Summary Window ........................................................................................................2711.5 Criteria Window ............................................................................................................2811.6 Options Window ...........................................................................................................2911.7 Cell Detail Window .......................................................................................................3011.8 Graph Window .............................................................................................................3111.9 Filter Window ...............................................................................................................3211.10 Notes Window ..............................................................................................................3311.11 Report Properties Window ...........................................................................................3411.12 View Reports Form (Preview) Window .........................................................................3411.13 Saving A Report ...........................................................................................................3511.13.1 Binary (.BBR) Format .............................................................................................3511.13.2 Archive (.ZRF) Format ............................................................................................3511.14 Exporting in Database (.DB) Format .............................................................................3511.15 Exporting in Text (.TXT) Format ...................................................................................3511.16 Printing a Report ..........................................................................................................3511.17 Opening an Archive File ...............................................................................................3611.18 Drill Down Reports .......................................................................................................3611.19 Archive Reader Program ..............................................................................................3712 RUNNING DIAGNOSTICS ...................................................................................... 374200-020R2.0 ii 9/25/2009
Table of Figures12.1 A/D Diagnostic .............................................................................................................3712.2 <strong>Load</strong> Bank Diagnostic ..................................................................................................3813 SYSTEM CALIBRATION ........................................................................................ 4213.1 Shunt Rating ................................................................................................................4213.2 Connect the Calibration Source ....................................................................................4213.3 Calibration ....................................................................................................................4313.4 Print a Calibration Report .............................................................................................4313.5 Disconnect Equipment .................................................................................................4313.6 Calibration Backup .......................................................................................................4314 SYSTEM SPECIFICATIONS .................................................................................. 44Table of FiguresFigure 1. Password .................................................................................................................... 2Figure 2. Communication Settings ............................................................................................. 2Figure 3. Sample Of Device Manager COM Port Settings .......................................................... 3Figure 4. <strong>MLC</strong> Main Menu .......................................................................................................... 4Figure 5. Setup - Location .......................................................................................................... 7Figure 6. Setup - Battery String .................................................................................................. 8Figure 7. Setup - Test Setup: Performance ................................................................................ 9Figure 8. Setup - Test Setup: Modified Performance .................................................................10Figure 9. Setup - Test Setup: Service .......................................................................................10Figure 10. Setup - Test Setup: Rundown ..................................................................................11Figure 11. Setup - Test Setup: Charger ....................................................................................11Figure 12. Setup - Test Setup: Recharge ..................................................................................12Figure 13. Setup - <strong>Load</strong> Bank ...................................................................................................15Figure 14. <strong>Load</strong> Bank Advance Setup .......................................................................................16Figure 15. <strong>MLC</strong> Test .................................................................................................................17Figure 16. <strong>MLC</strong> Test in Manual Mode .......................................................................................18Figure 17. Manual Toolbar ........................................................................................................19Figure 18. Cell Warning Message .............................................................................................20Figure 19. Cell Exclusion Message ...........................................................................................20Figure 20. <strong>MLC</strong> Test Toolbar ....................................................................................................20Figure 21. Cell Exclusions .........................................................................................................21Figure 22. Alarm Levels ............................................................................................................22Figure 23. Test Steps - Constant Current ..................................................................................22Figure 24. Test Steps - Constant Power....................................................................................23Figure 25. Test Adjustments .....................................................................................................23Figure 26. Change Axis and Zoom Axis Results .......................................................................24Figure 27. View Alarms .............................................................................................................24Figure 28. Charger Test ............................................................................................................25Figure 29. Reports Main Window (Top) .....................................................................................26Figure 30. Open ........................................................................................................................26Figure 31. Summary..................................................................................................................27Figure 32. Summary for Charger Report ...................................................................................27Figure 33. Items on View Reports Form ....................................................................................28Figure 34. Criteria .....................................................................................................................28Figure 35. Options ....................................................................................................................294200-020R2.0 iii 9/25/2009
Table of FiguresFigure 36. Cell Detail.................................................................................................................31Figure 37. Graph .......................................................................................................................32Figure 38. Filter .........................................................................................................................33Figure 39. Notes .......................................................................................................................33Figure 40. Report Properties .....................................................................................................34Figure 41. View Reports Form ..................................................................................................34Figure 42. Typical Archive File ..................................................................................................36Figure 43. Results with Drill Down Report .................................................................................36Figure 44. A/D Diagnostics .......................................................................................................38Figure 45. <strong>Load</strong> Bank Diagnostics.............................................................................................39Figure 46. Steps Resistance .....................................................................................................40Figure 47. <strong>Load</strong> Bank Analysis ..................................................................................................41Figure 48. Calibration ................................................................................................................424200-020R2.0 iv 9/25/2009
General Description1 General DescriptionThe <strong>Monitor</strong> <strong>Load</strong> <strong>Control</strong> <strong>MLC</strong> battery capacity testing system helps ensure the reliability of theDC bus by determining weaknesses in the battery string and estimating when the battery shouldbe replaced. Capacity testing is the only proven way to determine where the battery is in its lifecurve. The <strong>MLC</strong> allows the user to determine the amount of energy remaining in the battery.The test system can also help detect faulty intercell connections and weak cells in the batterystring.During a battery discharge test, the <strong>MLC</strong> continuously records and displays individual cellvoltages, overall battery voltage, current, and alarm parameters. Test data can be printed usingthe report generator or exported to other programs.The <strong>MLC</strong> monitors and displays the voltage of up to 256 cells or modules, and up to eightstrings. It can be programmed to discharge a battery under constant current, constant power(KW), or variable current (user defined) profile conditions, and has programmable alarm warningand shut down levels. The <strong>MLC</strong> controls battery discharge tests at currents up to 4000 amps,and can print data reports upon completion of the discharge test.Data logging is accomplished with a memory-saving write-by-exception method, which internallyrecords monitored parameter changes that exceed 5 millivolts and stores all data on the harddrive.2 System RequirementsThe following are the minimum requirements for <strong>MLC</strong> and BCT―2000 system operation:¤ Microsoft Windows 2000 or XP,¤ Pentium4 1GHz or higher microprocessor,¤ 128M of memory for Windows 2000, 256M for Windows XP,¤ 150M of hard disk space for program installation. 1G of space for data storage,¤ CD/DVD drive, and a¤ USB port.NOTE:The <strong>MLC</strong> program must be installed on a computer that has the Albércorp Battery<strong>Monitor</strong> Data Manager (BMDM) program installed. The <strong>MLC</strong> uses the same databasethat the BMDM program uses.3 Software InstallationThe <strong>MLC</strong> software program controls all aspects of the <strong>MLC</strong> system.Setup information is saved to the database that was last opened under the BMDM program.This file contains calibration, setup, configuration, and password information. Calibrationinformation is stored in the hardware.The <strong>MLC</strong> program is packaged with the BMDM program. Both programs are installed from theBMDM CD.To start the <strong>MLC</strong> program, double-click the <strong>MLC</strong> icon on the desktop.On an 800 x 600 window, the Windows taskbar hides a portion of some <strong>MLC</strong> windows. Eitherdrag the taskbar to minimize it, or right click on the taskbar, then select Properties|Auto Hideto hide the taskbar.4200-020R2.0 1 9/25/2009
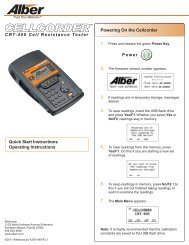
PasswordCAUTION:The computer power management feature, which automatically shuts down thecomputer, hard drive, and display after a specified time of inactivity, must either bedisabled or set to a time long enough to allow testing without going into the suspendmode. In addition, check the computer BIOS to determine if power managementfeatures have been set.For Windows 2000, under Start|Settings|<strong>Control</strong> Panel|System|Advanced|Performance Options|Application Performance, select Background Services.4 PasswordWhen the user selects certain functions, apassword dialog box appears. The defaultpassword from the factory is: alberType the password in the Enter Passwordbox and click OK. To change thepassword, click Change and follow windowinstructions. Some windows that require apassword may be viewed without apassword but not modified. To view awindow, click Cancel or press ESC.Figure 1. PasswordNOTE:If the password is changed without authorization or lost, contact Albércorp to obtain acode to unlock the system. Type this code in the Enter Factory Backup Code box andclick OK. This puts the password back to the default password alber. Change thepassword as previously described.5 Communication SettingsFigure 2. Communication SettingsThe <strong>MLC</strong> program communicates with the unit only when in the Test, Diagnostics, andCalibration windows.4200-020R2.0 2 9/25/2009
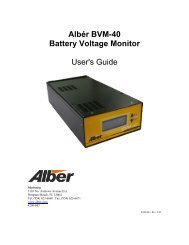
Table of FiguresIMPORTANT NOTE:The computer can communicate to the <strong>MLC</strong> card via USB only.The user must first determine which COM port the computer selects and uses for the USBdriver. Once determined, the user must then set the COM port in the <strong>MLC</strong> program.NOTE:Items in the user’s version of Microsoft Windows may have different names from thoseoutlined within the following paragraph.1. Connect the system to the USB port on the computer.2. Power up the computer.3. Power up the system.4. From the Windows desktop, click Start|Settings|<strong>Control</strong> Panel|System.5. Click the Hardware tab in the System dialog box.6. Click the Device Manager Button.7. Scroll down to Ports and expand the folder.8. The USB/Communications Port must be noted and saved.9. Close all windows.10. Open up the <strong>MLC</strong> Software.11. Navigate to the Communication Setup dialog box and enter the computer’s noted andsaved COM port here in the Direct Connection drop-down list.12. Select OK.NOTE:If the computer selects a COM port other than 1, 2, 3 or 4, then it will need to bemanually reassigned.Figure 3. Sample Of Device Manager COM Port Settings4200-020R2.0 3 9/25/2009
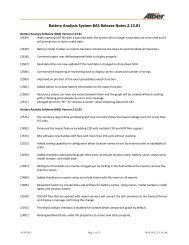
Main Menu6 Main MenuThe main menu is where all <strong>MLC</strong> operations begin.Figure 4. <strong>MLC</strong> Main MenuTo start the program and display the main menu, double-click the <strong>MLC</strong> icon on the Windowsdesktop. The Setup, Test, Reports, Diagnostics, Communications, Calibration, and Helpwindows are accessed from the main menu. Setup information, which includes batteryconfiguration, test steps, alarm levels, and load bank, must be correctly entered for the <strong>MLC</strong> torun properly.The following are brief descriptions of the main menu items. See full descriptions elsewhere inthis manual.6.1 SetupSetup accesses the Location, Battery Strings, Test Setup, and <strong>Load</strong> Bank dialog boxes. Setupdetermines system operation and control of tests. Open the Setup dialog boxes before runninga test or using the system for data logging. Selections allow the user to input test information forthe battery being tested, and parameters such as cell voltage alarms, overall voltage alarms,number of cells tested, and test program.6.2 TestThe Test window displays information for monitoring test progress in real time. The windowindicates battery OV (overall voltage), load in amps, power in watts / kilowatts, and capacity ifactivated. Individual cell or module activity is displayed as a bar graph.The window also displays step information, presently active step duration, value, step number,and total test times. The Status area indicates the currently selected cell voltage. The maximum,minimum, and average cell voltages appear below the Status area.6.3 ReportsThe Report Generator creates a report of a completed test. This is the only window thatprovides a final report or transfers test data to a file. The types of reports and options forcreating reports are described in the section Report Generator. Report options includeSummary, Criteria, Options, Cell Detail, Graph, Filter, and Notes. Report files reside in theReports\site name subdirectory, unless a different subdirectory was selected at time of test.6.4 DiagnosticsDiagnostics allows selection of the A/D and <strong>Load</strong> Bank dialog boxes, from which <strong>MLC</strong> and loadcontrol system diagnostics are performed. Use Diagnostics when a problem is encountered orwhen performing technical checks with the assistance of Albércorp.6.5 CommunicationsSelect Communications to select the USB COM port for the computer.6.6 CalibrationSelect Calibration when <strong>MLC</strong> system calibration is required.4200-020R2.0 4 9/25/2009
Table of Figures6.7 HelpSelect Help to access the index or help files or to determine the software version number.7 Recommended TestsPrior to performing any type of battery test, the user must review battery theory and the batterymanufacturer's maintenance and test procedures. Albércorp strongly recommends following theIEEE Std 450-1995 publication on battery maintenance and testing for flooded cells, and IEEEStd 1188-1996 for VRLA batteries. By using the battery manufacturer's suggested testingprocedures and those issued by IEEE, the user can help ensure a safe, effective load test.Before performing a load test, determine the type of test to perform, the length of the test, andwhere to locate the equipment during testing. If the test includes the use of Albércorp DC loadbanks, a well-ventilated area is required to disperse heat from the resistive load bank.WARNING:Do not place the load bank in a room that has an automatic fire system. The heatgenerated by the load bank could inadvertently trigger the fire system. Either locate theload banks in a safe area without such a system, or take other measures to prevent theinadvertent activation of the automatic system.Before connecting the <strong>MLC</strong> to the battery being tested, and prior to any load testing, Albércorprecommends performing the following tests on the battery.7.1 Micro-OhmmeterDuring the battery discharge test, the test system discharges the battery at a high current rate.Ohm’s Law shows that a high rate of current through a high resistive connection results in alarge amount of power being dissipated through the connection. This could cause excessiveheat build-up and result in premature termination of the test. Therefore, use a micro-ohmmeterto ensure there are no high resistive connections between individual cells, modules or intertierconnections. Refer to the battery manufacturer's maintenance instructions for a safe range ofreadings.7.2 HydrometerPrior to load testing, read the specific gravity of the sample electrolyte to confirm the battery isfully charged. Reading cannot be performed on sealed cells, but can easily be done on wet cellbatteries. Although this data is not entered into the <strong>MLC</strong> program, the user may want to record itseparately and attach it to the final test report. Specific gravity is a good indicator of the presentcharge of the battery. If all cell float voltage readings are within normal limits, the user may limitthe hydrometer readings to a 10% sample.7.3 Temperature (Electrolyte)While taking specific gravity readings, measure the electrolyte temperature of each cell. Recordthis data and then calculate the average temperature of the electrolyte in the cells being tested.The <strong>MLC</strong> requires that the temperature be entered for certain tests. Use this average value fortemperature correcting the load during test setup.7.4 Temperature (Ambient)Record the ambient temperature of the battery room prior to testing. This data is entered intothe <strong>MLC</strong> program, and the load can be temperature corrected to IEEE standards.4200-020R2.0 5 9/25/2009
7.5 Equalize ChargingConnecting the <strong>Load</strong> Bank to the <strong>MLC</strong>IEEE Std 450 for flooded cells and Std 1188 for VRLA cells, and most battery manufacturers,recommend that a battery be equalize charged at least seven days before performing adischarge test, and the battery be allowed 72 hours of float condition prior to testing. Thischarging action should provide optimum capacity results. Contact individual battery companiesfor their recommendations on this practice.In an effort to test the battery in an as-found state, occasionally load test the battery in itsnormal float state, without any prior charging or preparation. This as-found testing checks theeffectiveness of the battery maintenance program. (Done as a Service test on the <strong>MLC</strong>.)7.6 Test HistoryAnalyze test results from previous tests to determine faulty conditions that may becomeapparent during the load test. Doing this permits closer observation of cells or connections thatwere weak, the cause of problems, or possible failures. Correct any problems that stop testsprior to putting the battery back into service and before further testing.8 Connecting the <strong>Load</strong> Bank to the <strong>MLC</strong>After performing all preliminary tests, prepare and connect the <strong>MLC</strong> Series system.8.1 Determine <strong>Load</strong> TypeThe <strong>MLC</strong> System can operate in three different types of load configurations.8.1.1 Optional <strong>Load</strong> Banks (Battery Isolated)One recommended way to load test a battery is with the battery completely isolated from thesystem or its associated load, using optional Albércorp <strong>Load</strong> Banks. In this instance, the chargercarries the load until the test ends.WARNING:When using this method, if a loss of power occurs during the load test, there will be nobattery on line to support designed operation. Before switching the battery off line fromthe charger, ensure that design criteria allows the charger to carry full load. Someorganizations require placing a backup battery into service prior to load testing a criticalbattery.8.1.2 Optional <strong>Load</strong> Banks (Supplemental <strong>Load</strong>)A second recommended way to load test a battery is to supplement the service load on thebattery with Albércorp load banks. In this case, the battery is left on line and a capacity test isperformed using the load bank and system load as a combination total load on the battery. Thisis done by reading the present load on the battery charger, subtracting that from the dischargeload required, and programming the unit for the balance of the theoretical load.8.1.3 System <strong>Load</strong>Using the system load on the battery allows the system load to be placed directly on the battery,with the <strong>MLC</strong> used as a data-gathering device. The <strong>MLC</strong> system will not read current unless acurrent shunt is installed and optional current sense leads are connected to the shunt. (Done asa Rundown test on the <strong>MLC</strong>.)4200-020R2.0 6 9/25/2009
Table of Figures8.1.4 Connecting The <strong>Load</strong> BankIf using Albércorp load banks, do the following:1. Connect the 50’ load control cable (two Amphenol 37-pin connectors on one end and aDB-37 on the other end) from the BDS <strong>Control</strong>ler <strong>Load</strong> <strong>Control</strong> port to the <strong>Load</strong> <strong>Control</strong>Input on the side of the optional load bank. This connector is usually labeled J2;however, refer to the drawings that came with the load banks.2. Connect the heavy load cables from the load banks to the battery as shown in thedrawings that came with the load banks.3. The <strong>MLC</strong> is now mechanically ready to perform the desired load test.4. Power on all the equipment at this time except the Albércorp continuous load banks.5. After the <strong>MLC</strong> system has initialized and the main menu appears on the computer,power on the load banks.6. When disconnecting any equipment, power down the continuous load bank first, thenpower down the rest of the system.9 Setting Up The <strong>MLC</strong> For <strong>Load</strong> TestThe <strong>Monitor</strong> <strong>Load</strong> <strong>Control</strong> program allows the user to use the computer to set up all testparameters. Refer to the following Setup dialog box descriptions to program the testparameters. At this point, the <strong>MLC</strong> main menu must be displayed. On the main menu, clickSetup. A drop-down menu with Location, Battery Strings, Test Setup, and <strong>Load</strong> Bank appears.Complete each item as described.9.1 LocationOn the Setup menu, click Location. Site and battery information is saved with each test reportand permanently saved in the BMDM data file. Confirm all text boxes before performing anytest, or reports may have incorrect or missing data.Figure 5. Setup - Location4200-020R2.0 7 9/25/2009
Setting Up The <strong>MLC</strong> For <strong>Load</strong> TestCustomer Name - Select a customer name from the drop-down list. This name may be differentfrom the location name, which describes where the system is located.Location Name - Select the location name where the monitor is installed. Location name,battery name, and string name are used with each other to identify the strings and hardware towhich the monitor is connected.Battery Name and Dates - Select the battery name. The installation date and next test date inmm/dd/yyyy format appear in the boxes below the battery name.NOTE:The present date appended to the battery name is the default file name of the reportgenerated at the time of test.Print - To print site, battery, configuration, contact, and test information for the currentlyselected test, click Print.9.2 Battery StringsOn the Setup menu, click Battery Strings. The Battery Strings dialog box identifies how manystrings and cells per string in the <strong>MLC</strong> configuration. To select a string, put a check mark in thebox before the string name. The user may monitor up to eight strings, as long as the cell totaldoes not exceed 256 cells.9.3 Test SetupFigure 6. Setup - Battery StringOn the Setup menu, click Test Setup. The Test Setup dialog box allows selection of test type,discharge to perform, length of the discharge, and load to be applied. Single string applicationstest a single string; multiple string applications test up to eight strings at one time; chargertesting performs a test on the battery charger; and recharge mode monitors the battery duringrecharging.4200-020R2.0 8 9/25/2009
Table of Figures9.4 Test TypesThe user may configure six test types: Performance, Modified Performance, Service, Rundown,Charger, and Recharge. Each type saves specific parameters and test steps. Select a test fromthe Test Type drop-down list before running a test. Each test is briefly described below; refer toIEEE 450 for more information. Descriptions of items on the dialog boxes follow the six test typedescriptions. The areas enabled on the dialog boxes depend on the test type selected.9.4.1 Performance TestAlso known as a capacity test, the Performance test uses a programmed constant current orconstant power load to project reliability and remaining battery life before replacement isnecessary. A Performance test has only one step.9.4.2 Modified Performance TestFigure 7. Setup - Test Setup: PerformanceA Modified Performance test tests battery capacity (similar to a Performance test) and the abilityof the battery to provide a high-rate, short-duration load cycle. This test may be done in place ofa Service test. If the user types 0 (zero) for Rated Time, the test does not calculate batterycapacity.4200-020R2.0 9 9/25/2009
Setting Up The <strong>MLC</strong> For <strong>Load</strong> Test9.4.3 Service TestFigure 8. Setup - Test Setup: Modified PerformanceA Service test determines the battery “as found” ability to satisfy the battery duty cycle.9.4.4 Rundown TestFigure 9. Setup - Test Setup: ServiceA Rundown test is similar to a Service test, except the test uses the system load instead of acontrolled load. Rundown has only one step and no shutdown levels.4200-020R2.0 10 9/25/2009
Table of Figures9.4.5 Charger TestFigure 10. Setup - Test Setup: RundownWhen the Charger test is selected, the only parameters recorded to the report file are OverallVoltage and Current.9.4.6 Recharge TestFigure 11. Setup - Test Setup: ChargerThe Recharge test monitors the battery system while it is being recharged. For every two cellvolts, the cell warning level is set to 2.33V. The OV warning levels are a multiple of these levelstimes the number of cells per string. On this test, the levels are high level (maximum) values.4200-020R2.0 11 9/25/2009
Setting Up The <strong>MLC</strong> For <strong>Load</strong> Test9.5 Test Setup ParametersFigure 12. Setup - Test Setup: RechargeThe following items are available on the Test Setup dialog boxes depending on the test typeselected.9.5.1 Rated Time, Test Types: Performance, Modified PerformanceType the manufacturer’s specified rated time in the Rated Time box. This value is important forthe on-line capacity calculation performed during a single step capacity test. The format ishh:mm:ss. If doing a Modified Performance test, the user may leave Rated Time blank.The user may type 0 (zero) for Rated Time on a Modified Performance test. If this is done, thetest does not calculate battery capacity at test time. The user may enter a Rated Time at reportgeneration.9.5.2 Power Type, Test Types: Performance, Modified Performance, Service, ChargerConstant Power and Constant Current - To define power type, click Constant Power orConstant Current. Power type determines if the programmed load is rated in watts or amps. Thepower type selected applies to all steps; the user cannot switch between Constant Power andConstant Current between steps.9.5.3 Temperature And Correction, Test Types: Performance, Modified PerformanceTemperature, F and C - Click F or C (Fahrenheit or Celsius) then, in the Temperature box, typethe average electrolyte temperature of the sample number of cells. The program automaticallycalculates between C and F. For example, if the user selects C after typing a Fahrenheit value,the value converts to Celsius. To minimize rounding errors, type the value in the known format.For example, if the temperature is in degrees C, select C before typing the value.4200-020R2.0 12 9/25/2009
Table of FiguresCorrection, None and IEEE - If the user enters a temperature other than 77 F (25 C), the usermay select IEEE temperature correction of the load. To automatically correct to IEEE-450, clickIEEE in the Correction area. For no correction, click None. If the IEEE correction option isenabled and the temperature is later changed, all programmed steps are automaticallycorrected and all loads are compensated throughout the test program. For more information ontemperature compensation, refer to IEEE Std 450.9.5.4 Alarm Levels, Test Types: Performance, Modified Performance, Service,Rundown, RechargeIn the Alarm Levels area, type voltage levels that issue warnings or shutdown during testing.This area allows the user to set warning and shutdown levels for cells and OV. When an alarmcondition occurs, an alarm sounds, the failing cell is logged, and the graph or display areachanges color. A beeping alarm from the <strong>MLC</strong> indicates a warning, and a solid tone indicates ashutdown. Refer to View Alarms During Test.The user may change the warning and shutdown test levels for cells and OV when the test isrunning. Changes are recorded in the test activities portion of the report. Refer to Alarm Levels.NOTE:When cell warning or shutdown levels are changed, the OV warning or shutdown levelsare automatically adjusted by the number of cells in the string times the changed level.To disable any of the following warning or shutdown levels, type a 0 (zero) in the box.Warning Cells - Type the alarm voltage level of the individual cell or module to be alarmed. Forexample, if testing to an average end voltage of 1.75 volts per cell, type 1.75. When any cellfalls below 1.75V, an alarm condition occurs. If values are set to 0, the warning is not active.Shutdown Cells - Type the voltage of an individual cell to pause the test. For example, ifdischarging to 1.75 volts per cell average, the user may want to pause the test if any cell fallsbelow 1.65V. In this case, type 1.65 to pause the test when any cell falls below this voltage. Ifvalues are set to 0, the shutdown is not active.Warning OV - This box defines the overall battery voltage warning level. Type the overallvoltage warning level. For example, if testing 60 cells to an average of 1.75 volts per cell, theuser may want to be warned when battery voltage is approaching shutdown. If values are set to0, the warning is not active.Shutdown OV - In most cases, this value determines the end of the test. Type the overallbattery end voltage. For example, if testing a 60 cell battery to 1.65 volts per cell, type 99.0 inthe box (60 cells x 1.65 volts per cell = 99.0 volts). The system pauses the test when the overallvoltage falls below 99.0 volts. If values are set to 0, the shutdown is not active.9.5.5 Test Steps, Test Types: Performance, Modified Performance, Service, Rundown,ChargerStep - Each step is programmed individually, with a maximum of 99 steps allowed. If Step 1 (oranother desired step) is not displayed, scroll to the step, then click the step to highlight it. Exitinga field or pressing ENTER saves the data entered.Duration - Double click on the Duration field for the desired step, and type the time the step isto operate, in hh:mm:ss.4200-020R2.0 13 9/25/2009
Setting Up The <strong>MLC</strong> For <strong>Load</strong> TestNOTE:If running a capacity test where the battery must perform for a certain time at a singledischarge rate, select a time at least 50% longer than Rated Time. The time must belonger than the theoretical run time, so the test shuts down on voltage rather than time,for a more accurate capacity test. For example, if the test is one hour, enter a time of atleast 1 hour 30 minutes. This ensures testing to at least 100% of capacity.Amps or Watts - Use TAB or the mouse to move to the Amps or Watts field. (The columnheading depends on the test type.) Type the amps or watts required when using optional loadbanks. If using the <strong>MLC</strong> in Rundown mode without load banks, then this means that the systemload or other load control is being used, and the user must type 0 in this field.The values in this field have a decimal point and indicate values to tenths if the Micro<strong>Control</strong><strong>Load</strong> Bank option is enabled under Setup|<strong>Load</strong> Bank|Advance.Add, Delete and Insert - If this is a Performance or Rundown test, there is only one step. If thisis a Modified Performance, Charger or Service test, program the additional required steps. Toadd more steps, click Add. A new step appears in the list. To delete a step, highlight the step tobe deleted by clicking the step, then click Delete. To insert a step, highlight the step that willfollow the new step, then click Insert.9.5.6 Calculate Capacity At Target, Test Types: Performance, Modified PerformanceSelect this box to calculate the capacity when the target value is reached. The test timeadvances only when the target is reached. The test time, but not the test, stops if the load fallsbelow target and resumes when the target is reached.9.5.7 Ignore Zero Target Steps, Test Types: Modified PerformanceIgnore Zero Target Steps in Capacity Calculation - Select this box to ignore steps when theload is targeted to 0 (zero) in the capacity calculation. For any steps targeted to zero, the time ofthat step will not be used in the capacity calculation.9.5.8 Charger High/Low Voltage Warning, Test Types: ChargerCharger High Voltage Warning and Charger Low Voltage Warning - Type values in theseboxes to activate a warning when high or low voltage levels are exceeded. If values are set to 0,the warning is not active.9.5.9 Recharge Hours, Test Types: RechargeRecharge Hours - Type the number of hours that the recharge will be monitored.9.6 <strong>Load</strong> BankOn the Setup menu, click <strong>Load</strong> Bank. The <strong>Load</strong> Bank dialog box appears.4200-020R2.0 14 9/25/2009
Table of FiguresFigure 13. Setup - <strong>Load</strong> Bank<strong>Load</strong> Bank SN/ID, Add, and Delete - The <strong>MLC</strong> can configure multiple load bank setups. Toselect a setup, click a name in the <strong>Load</strong> Bank SN/ID drop-down list. To add a setup name, clickAdd. The name "<strong>Load</strong> Bank n" appears in the <strong>Load</strong> Bank SN/ID box and in the drop-down list.To change this name, overwrite the name in the box with a new name. The user can assignratings and step weights to each load bank setup name. To delete a name in the<strong>Load</strong> Bank SN/ID box, click Delete.Step n - For each load bank setup, type the step weight information.Momentary - If the load bank has momentary load steps on steps 9 through 16, select theappropriate Step n boxes in the Momentary area. Selecting Momentary protects the resistors inthe load bank by limiting the load test on the step to a maximum of 60 seconds.Shunt Rating Amps per mV - Assign the shunt rating in amps per millivolt. At the Shunt RatingAmps and per mV boxes, type the shunt value from the load banks. For example if the shunt isstamped 600/100 (600 amps at 100mV), type 600 in the Shunt Rating Amps box, then type 100in the per mV box.Auto Detect Step Resistance - If selected, the <strong>MLC</strong> calculates the average resistance of allsteps with weight information. The net effect of this occurs at the start of the test. The <strong>MLC</strong>assumes 0.5 amps per weight value. At 0.5 amps per weight value, the <strong>MLC</strong> turns on the stepsneeded to achieve the target load. Depending on the actual load banks, the first attempt may beoff target by as much as half the desired target load. After these steps are set, the <strong>MLC</strong> waits forthe next load and OV reading. Using the sum of the step weights first set, the <strong>MLC</strong> calculatesthe actual amps per weight value, then uses the OV to calculate each step resistance.NOTE:These resistances are calculated, not actual. If there is a problem controlling the load,the actual resistance of one or more steps may be incorrect. Refer to <strong>Load</strong> BankDiagnostic.4200-020R2.0 15 9/25/2009
Running the TestIf Auto Detect Step Resistance is selected, the <strong>MLC</strong> corrects the load steps at least one moretime at the start of the test. If the user does not want this to occur, do not select Auto DetectStep Resistance. In this case, select Diagnostics from the main menu, open the <strong>Load</strong> Bankdialog box, and measure or type the load bank resistance values into only the active Stepsboxes (Steps 1 to 16 as required).Advance - If the user wishes to adjust the control tolerance for the load bank or if the user isusing a Micro<strong>Control</strong> <strong>Load</strong> Bank, click the Advance button to display the <strong>Load</strong> Bank AdvanceSetup window.Figure 14. <strong>Load</strong> Bank Advance SetupWhen not using the Micro<strong>Control</strong> <strong>Load</strong> Bank, the default values are 1.50% and 2.50 amps. Donot decrease these values unless the user performs a load bank diagnostic to determine whatthe minimum tolerances are. The value that the user types in the Amps box on the <strong>Load</strong> BankAdvance Setup window is derived from the highest Vernier Gap value plus 1. The user may type0 in the % (per cent) box. If the user experiences a problem controlling the load bank, increasethe % (per cent) and amp values. Click Apply to save the changes.The Micro<strong>Control</strong> <strong>Load</strong> Bank allows precision control of the load in 0.1 amp increments. If theuser is using a Micro<strong>Control</strong> <strong>Load</strong> Bank, check the Micro<strong>Control</strong> <strong>Load</strong> Bank box. A warning boxappears to confirm that a Micro<strong>Control</strong> <strong>Load</strong> Bank is being used. If it is, click Yes to enable thisfeature. The default values change to 0% and 0.10 amps. If the user experiences a problemcontrolling the load bank, increase the amp value by a tenth or more.10 Running the TestAt this point, the main menu must be displayed. On the main menu, click Test. The <strong>MLC</strong> Testwindow displays all relevant information for monitoring test progress and parameters in a realtime mode.OV, Amps, KW, and Capacity - The top of the window indicates battery OV (overall voltage),load in amps, power in kilowatts, and the present capacity of the battery. (The capacity iscalculated only during a Performance or Modified Performance test.)4200-020R2.0 16 9/25/2009
Table of FiguresFigure 15. <strong>MLC</strong> TestNudge - Next to the Amps value are arrows that slightly increase or decrease (nudge) the loadwithin target when in the auto mode. When controlling the load, the <strong>MLC</strong> is considered on targetwhen the target current plus 1.5% of target current plus 1.5 amps is achieved. For example, ona load of 500 amps, the <strong>MLC</strong> could set the load at 500 amps plus 1.5% (7.5 amps) plus 1.5amps, or as high as 509 amps. The Nudge control allows the user to change the load to movethe current closer to 500 amps.Duration and Test Time - Individual cells or modules are displayed in a bar graph format.Presently active step duration and target value, in amps or watts, are in the lower left of thewindow. The Test Time area displays the present step total test times.Voltages - Click a bar on the graph to cause a cursor ball to appear above the bar. The cursordenotes the cell on which the Status area (to the right of Test Time) is reporting. The Statusarea indicates the cell voltages. The maximum, minimum, and average cell voltages aredisplayed below the Status area.Toolbar - Toolbar items at the top of the window are for excluding or including cells that wentinto shutdown, changing alarm levels, changing test step duration and load, adjusting the loadbank tolerance during a test, changing the number of graph bar lines, zooming in on a bar line,and viewing the alarms list.At the <strong>MLC</strong> Test window, all connected cells are displayed in a bar graph format. Verify thedisplayed readings of two or three cells and OV (overall volts) with a digital voltmeter. If thedisplay and the DVM do not agree, refer to System Calibration in this manual.10.1 Start The TestVerify equipment connections are secure and equipment is in operating mode. If usingAlbércorp load banks, ensure the step weights are configured properly. Refer to <strong>Load</strong> Bank.4200-020R2.0 17 9/25/2009
Running the TestF1 Start Test - If load banks are being used, set the load bank AC power switches to ON. If noproblems are apparent, to start the test, click F1 Start Test on the <strong>MLC</strong> Test window or pressthe F1 key.During the test, the cells degrade as the load is applied to the battery. Click a bar graph tocause a cursor to appear above the bar. The cursor denotes the cell on which the Status area(to the right of Test Time) is reporting. The Status area indicates the minimum and maximumcell voltages and average cell voltage. If the graph is in the active window, press the left or rightarrow keys to move the cursor to the previous or next cell bar.At the end of the test, a message indicates the load test is complete. When disconnecting anyequipment, power down the continuous load bank first, then power down the rest of the system.WARNING:When disconnecting equipment, power down the load bank first, then the rest of thesystem.10.2 <strong>Load</strong> Test <strong>Control</strong>While the test is running, several options are available: Stop Test, Pause, Resume, and Manual.F1 Stop Test - To stop the test, click F1 Stop Test or press F1. A message appears to confirmthe test should be stopped.F2 Pause and F2 Resume - To pause the test, click F2 Pause or press F2. Pause allows theuser to make changes. Do not pause the test for extended periods of time during load testing,because the cells will recover during the idle period. When the test is paused, F2 Pausechanges to F2 Resume.10.3 Manual <strong>Load</strong> Bank <strong>Control</strong>F3 Manual and F3 Auto - The system defaults to automatic control. For manual control, clickF3 Manual or press F3 after the test has started. To return to automatic mode, click F3 Auto.Figure 16. <strong>MLC</strong> Test in Manual Mode4200-020R2.0 18 9/25/2009
Table of FiguresTypically, select manual mode to control a Charger test or if there is a load bank problem.Manually selecting load step weights may help determine which step in the load bank is causingthe problem.NOTE:Do not confuse step weights in the load bank with test steps in the program.When F3 Manual is selected, a toolbar on the window allows control of the load bank.Figure 17. Manual ToolbarUser-Defined Weight Buttons - The larger arrows to the left of 20 on the toolbar are userdefinable.To increase or decrease their load weight per step, type a weight in the box or clickthe smaller arrows adjacent to the box. The maximum weight value is 200. To increase ordecrease the load applied, click the larger arrows. As the value is changed, the 16 square stepindicators change. The step enabled in the load bank is displayed as a binary count along thetoolbar; when a square is black, that step is on in the load bank.NOTE:The value in amps of the load change depends on the type of load bank used. Typically,this value is less than one amp per step. For a larger increment, change the userdefinedstep size on the toolbar. To determine the actual amp value for each weight,divide the load bank's total amp capacity by the total weight count. Refer to the <strong>Load</strong>Bank window to determine the total weight count.20, 10, 5, 1 and All Off - The user may also use the 20, 10, 5, and 1 buttons to change the totalweight applied to the load. To turn off all the steps, click All Off. When the test is running, theuser may click F2 Pause to pause the test and remove the load.NOTE:Instead of using the manual mode to change step weights, the user may use the TestSteps dialog box to change the actual load current or power. Refer to Test Steps.10.4 View Alarms During TestThe Test window indicates real-time alarm conditions for cells and OV. During testing, to viewthe alarm history, click the View Alarms button. Refer to View Alarms.10.4.1 Cell AlarmWhen a cell goes into alarm, the bar graph for the failing cell changes color, an alarm soundsfrom the PC, and the cell number and string designation are logged in the alarm history. A cellalarm occurs when the cell voltage drops below the programmed Cell Warning voltage level.The normal bar graph color is green; yellow indicates a warning condition, and red indicates ashutdown. If a cell goes into negative voltage levels, the bar graph for the cell changes to black.Cell Warning - When a cell falls below a warning level, the <strong>MLC</strong> beeps, but the test does notpause. To silence the alarm, click OK in the Warning message box.4200-020R2.0 19 9/25/2009
Running the TestIf the Cell Warning level is lowered, the cell comes out of warning and the bar graph returns togreen, but the event is retained in the alarm history. Use the Adjust Alarm Levels toolbar buttonto change the level. Refer to Alarm Levels.Figure 18. Cell Warning MessageCell Shutdown - When a cell falls below a shutdown level, the <strong>MLC</strong> sounds a continuous tone,the test pauses, and the Cell Exclusion message box appears.Figure 19. Cell Exclusion MessageTo silence the alarm and exclude the cell from the test, click Yes in the Cell Exclusion box. Thisalso causes the bar graph for the cell to no longer be displayed. To silence the alarm and keepthe cell in the test, click No. Resume the test if desired.The faulty cell can be jumpered out and the test resumed. This allows all alarm parameters todisregard the faulty cell if it is excluded.10.4.2 Overall Voltage AlarmWhen the overall voltage goes into alarm, the OV display changes color, the <strong>MLC</strong> alarmsounds, and the OV event is logged in the alarm history. An OV alarm occurs when the overallvoltage drops below the programmed Warning voltage level. The normal OV display color is thewindow background color; yellow indicates a warning condition, and red indicates a shutdown.The OV = V display is on the upper left of the Test window.A beeping alarm indicates a warning, and a solid tone indicates a shutdown. To silence thealarm, click Yes in the Warning or Shutdown message box.If the OV Warning level is lowered, the OV comes out of alarm and the OV display returns tobackground color, but the event is retained in the alarm history. Use the Adjust Alarm Levelstoolbar button to change the level. Refer to Alarm Levels.10.5 Test Window ToolbarThe Toolbar buttons that appear along the top of the <strong>MLC</strong> Test window are shown below.Figure 20. <strong>MLC</strong> Test Toolbar4200-020R2.0 20 9/25/2009
Table of FiguresUse the buttons to exclude or include cells that went into shutdown; change alarm levels;change test step duration and load; change the number of graph grid lines; zoom in on a baraxis; and view the alarms list. These buttons are described in the following sections.10.5.1 Cell ExclusionExclude CellsTo remove a cell from the test, click the Exclude Cells button. In the Cell Exclusions dialog box,click Add Cell, type the string and cell number, then click Exclude. The string and cell appear inthe list in the Cell Exclusions dialog box. A box with a check mark indicates the cell is excludedfrom the test. To include an excluded cell back into the test, clear the check box. The user canexclude cells before a test, and during a test without pausing the test. The user can includethem back during a test without pausing.Excluding and including a cell from the test automatically adjusts battery alarm levels bychanging the OV warning and shutdown values by one cell level. All items on the cell exclusionlist are cleared when the test is exited.10.5.2 Alarm LevelsFigure 21. Cell ExclusionsAdjust Alarm LevelsThe user may change the warning and shutdown levels for cells and OV while the test isrunning. Click the Adjust Alarm Levels toolbar button. After changing a level, use the TAB orENTER key or mouse to move to the next box. The new alarm level takes effect immediately.Changes are recorded in the test activities portion of the report.CAUTION:Changes made to the alarm levels and test steps using the Test Adjustments dialogboxes are valid only for the presently running test and do not permanently changethe test setup information.4200-020R2.0 21 9/25/2009
Table of FiguresFigure 24. Test Steps - Constant PowerIf Constant Power is selected, the Test Steps dialog box has buttons for 2000, 1000, 500 and100 watts, or the user may type a new value in the Watts column.10.5.4 <strong>Load</strong> Bank Adjust<strong>Load</strong> Bank AdjustClick the <strong>Load</strong> Bank Adjust button to adjust the load bank tolerance during a test. If the user isexperiencing load control problems during the test, increase the tolerance % (per cent) orcurrent (amps).10.5.5 Modify GraphFigure 25. Test AdjustmentsChange Cell Axis CountZoom on Cell AxisUse the Change Cell Axis Count or the Zoom on Cell Axis buttons to change the number ofX-axis lines (graphs) displayed or to zoom in on a graph. Click Change Cell Axis Count tospread the cells over more than one X-axis. This is useful when there are more than 60 cells ina test.4200-020R2.0 23 9/25/2009
Running the TestFigure 26. Change Axis and Zoom Axis ResultsWhen more than one X-axis is displayed, the user may click Zoom on Cell Axis to increase thesize of an axis display.10.5.6 View AlarmsView AlarmsClick the View Alarms button to open a box that lists all cell and OV alarms that are occurring orhave occurred during the test.Figure 27. View Alarms4200-020R2.0 24 9/25/2009
Table of Figures10.6 Charger Test WindowWhen the Charger test is running, the Charger window displays a Voltage/<strong>Load</strong> History graph.Data on this graph enters from the right and moves to the left. This history data is limited to tenminutes on the X-axis (time) display.Figure 28. Charger TestThe red curve displays the load in amps. The green curve displays charger voltage.10.7 Hardware FailureIf the computer senses a board failure or loses communication with the <strong>MLC</strong>, the test pausesand the window displays an error message. If load banks are being used, the system shutsthem down. Upon communication failure, all selected levels are voided.Before doing any diagnostics, verify the load banks are powered off and no load is being appliedto the battery. During the pause mode, check all cable connections and equipment. After theproblem is resolved, the testing may be resumed.11 Report GeneratorThe <strong>MLC</strong> Report Generator program reads the test data files generated by the <strong>MLC</strong> testsoftware and creates customized reports. After the <strong>MLC</strong> system performs a load test, the testdata is saved to a file, and it is this data, presented in report format that battery test personnelrely on to analyze battery system performance. Using the Report Generator, the user candisplay graphs, edit site information, add notes, and customize report pages.The Report Generator can save reports in several file formats. One format allows the user openthe report at a later date and modify site information or appearance. Alternatively, the user maysave the report in the archive format, which protects the document against changes to ensure4200-020R2.0 25 9/25/2009
Report Generatorthe integrity of the information. In Export mode, the Report Generator exports files in formatsthat can be used by commercial database programs or text editors.Sample Data - Use the file reportdemo.btr (Performance test) or mlcdemo.btr (ModifiedPerformance test) to try the features in the Report Generator.11.1 Starting the Report GeneratorAfter the system performs a <strong>Load</strong> Test, the user may generate a report for battery data analysis.To generate a report from a completed test, click Reports on the main menu, then open the file.The Reports main dialog box has five buttons and seven tabs.Figure 29. Reports Main Window (Top)Click a tab or button to open dialog boxes. The following sections describe the items in eachdialog box. To exit the Report Generator, click the · in the upper right corner of the Reportsmain dialog box.11.2 Opening A ReportWhen the Report Generator is started, the Open dialog box appears.Figure 30. OpenThe Files of Type drop-down list allows the user select <strong>MLC</strong> text (.BTR), binary (.BBR) orarchive (.ZRF) files. The <strong>MLC</strong> test software generates BTR format; the Report Generatorgenerates BBR and ZRF formats. The user must open a file before selecting other options.Select the subdirectory and the file name, then click Open.11.3 <strong>Load</strong>ing A File<strong>Load</strong> - When certain functions are selected and no file is open, a message indicates a file mustbe opened. To open a file after the Report Generator is started, click <strong>Load</strong> and select a file. Theuser do not need to close the old file, as only one text or binary file can be open at a time.However, the user may open an archive file while a text or binary file is open. (Refer to Openingan Archive File.)4200-020R2.0 26 9/25/2009
Table of Figures11.4 Summary WindowAfter a file is opened, the Reports dialog box appears. Click the Summary tab to display theSummary dialog box. Items in this box depend on the type of report selected.Figure 31. SummaryFigure 32. Summary for Charger ReportOn the Summary box, select the items to include in the report. If a Charger test report isselected, Battery Graph and Battery Text change to Charger Graph and Charger Text. To selectall the items in the Summary box, click All. To clear all the items, click None.4200-020R2.0 27 9/25/2009
Items in Summary BoxItems on View ReportsForm Non-Charger ReportTest Site Info Site SiteBattery Name Info Battery BatteryTest Setup Setup SetupTest Results Results -Test Activity Activity ActivityCell Summary. Cell Summary -Standard General Standard -Cell Detail Text Cell Detail -Tabular General Tabular -Cell Detail Graph Detail Graph -Battery Graph or Charger Graph Battery Graph Charger GraphBattery Text or Charger Text Battery Text Charger TextNotes Notes NotesFigure 33. Items on View Reports FormItems on View ReportsForm Charger ReportReport GeneratorEach item selected in the Summary box results in a tab appearing on the View Reports Formwindow, which opens when Preview is clicked. Refer to View Reports Form (Preview) Window.11.5 Criteria WindowClick the Criteria tab to display the Criteria dialog box.Figure 34. CriteriaTime Interval and OV Deviation - Click Time Interval or OV Deviation and type a value, or clickthe time or voltage buttons next to the boxes. The Report Interval determines the frequency ofreport sampling. Specify time in hours, minutes, and seconds (10 second minimum) or OVdeviation in volts (0.2 volt minimum).4200-020R2.0 28 9/25/2009
Table of FiguresLow Cell Threshold and Low OV Threshold - The Alarm Threshold Values area is enabled forall tests except Charger. The thresholds are the cell and OV shutdown levels entered in testsetup, or the last levels entered during the test. On the report, values that violate thesethresholds are printed in color and with brackets ( < > ) for black ink printers. These values maybe changed if desired.High Voltage Warning and Low Voltage Warning - For the Charger test, the Alarm ThresholdValues area changes to Charger Warning Levels. These are the warning levels entered in testsetup, or the last levels entered during the test. On the report, values that violate thesethresholds are printed in color and with brackets ( < > for low threshold violation and > < forhigh threshold violation) for black ink printers. These values may be changed if desired.Rated Time - Rated Time is used by Capacity test reports and may be modified at report time.Cell % Failure - The percentage of cell failure is used by Capacity test reports and may bemodified at report time. The value was previously fixed at 80% for reports, but may now bechanged.NOTE:Changing the threshold, rated time, and percentage failure values affects which cells areindicated on the report as failing.11.6 Options WindowClick the Options tab to display the Options dialog box.Figure 35. OptionsReport Title and Report Footer - Edit or add text in these boxes if required. The Report Titlealways prints (unless there is no title text), but the user must select the Footer Text Printedcheck box to print the footer. To print the page number and date, select the Footer PageNumber and Footer Date Printed check boxes.4200-020R2.0 29 9/25/2009
Report GeneratorExpand All Test Results Graphs - Select this box to display a Drill Down Report for each cellthat fails minimum voltage threshold level. This report (graph) appears on windows under theResults tab on the View Reports Form window. To have the Results tab appear, select TestResults on the Summary dialog box. (Refer to Drill Down Reports.)Include Power in Report - Select this box to list power in reports, in addition to voltage andcurrent. This box is available when the test data is not for constant power.Start Capacity Calculation at Target - Select this box to calculate the capacity when the targetvalue is found. All the test times in the report are adjusted by this time.NOTE:For example, if it takes four seconds to find the target, then all the times in the test reportwill be minus four seconds. If Calculate Capacity at Target was selected during testsetup, this option is not available.Ignore Zero Target Steps in Capacity Calculation - Select this box to ignore steps when theload is targeted to 0 (zero) in the capacity calculation. For any steps targeted to zero, the time ofthat step will not be used in the calculation.Include Steps Starting and Ending Values - For a multi-step test, select this box to see thestarting and ending values of the steps. The starting and ending times are included in the report.Clip Start and End of Test for Report - In the Start and End boxes, type the clip values for thestart and end of a report in hh:mm:ss format. This is used when the <strong>MLC</strong> does not control theload, or there is no load interval or low load at the start and end of the test.To determine the clip values, on the Criteria box, enable OV Deviation. On the Summary box,select only the battery text (.txt) report. To compile the report, click Preview. From the report,determine the time where the voltage drops or current is detected. This is the start clip time. Thetime where the voltage rises or current is no longer present is the end clip time. Set the end cliptime on the Options box to one second less than the actual value found. For example, if thevoltage rises at 13 minutes, 00 seconds, type 12 minutes, 59 seconds for the end clip time.Enable - Select this box to clip the start and end times for the report.11.7 Cell Detail WindowClick the Cell Detail tab to display the Cell Detail dialog box. This box allows the userautomatically or manually select the cells included in the cell detail report.4200-020R2.0 30 9/25/2009
Table of FiguresFigure 36. Cell DetailAuto Select - Click Auto Select to select cells that were at or below the low threshold level. Inauto select mode, the user may manually select additional cells for the report by selecting checkboxes in the list. To clear a selection, select the box again. If the user later change the low cellthreshold on the Criteria box, cells that meet the new criteria are automatically selected, andcells manually selected before the threshold change are not selected.Manual Select - Click the Manual Select button to select cells manually for the report. Add cellsto the report by selecting the check boxes. To clear a selection, select the box again. Changingthe low cell threshold does not change selected cells when in the manual mode.All On and All Off - Click All On to select all cells in the list. Click All Off to clear all cellselections. The user may use this feature in auto or manual mode.11.8 Graph WindowClick the Graph tab to display the Graph dialog box. The values displayed are 10% below theminimum and 10% above the maximum values found during the test.4200-020R2.0 31 9/25/2009
Report GeneratorFigure 37. GraphManual - To change the minimum and maximum values displayed on report graphs, clickManual and select values. The Cell Scaling and OV Scaling values are in volts. <strong>Load</strong> Scaling isin amps, and Power Scaling is in watts.Auto - If Auto is selected, the graphs are plotted to within 3% of the values.Low Cell Criteria Label and Low OV Criteria Label - The user may type new graph names inthese areas for report graphs.11.9 Filter WindowClick the Filter tab to display the Filter dialog box. The values displayed are the minimum andmaximum values found during the test. This dialog box allows the user eliminate bad values,such as those caused when a clip lead falls off.4200-020R2.0 32 9/25/2009
Table of FiguresFigure 38. FilterDisable is the default selection. To change values, click Enable, then type a value or select avalue. Cell Data Filter and OV Data Filter values are in volts. The <strong>Load</strong> Data Filter is in watts.11.10 Notes WindowFigure 39. NotesThe user may add notes to the report by typing them in this dialog box. Notes may includedetails about test results or equipment used, and appear on the last page of the report. To makethe notes permanent, save the file as a .BBR file. Click the Notes tab to display the Notes dialogbox.4200-020R2.0 33 9/25/2009
11.11 Report Properties WindowProperties - Click the Properties button to display the Report Properties dialog box.Report GeneratorFigure 40. Report PropertiesChange - Use the Properties dialog box to edit site information, then click Change to cause thechanges to take effect. Click the · in the upper right to close the window. To close withoutsaving the changes, do not click Change. To make the changes permanent, save the file as a.BBR file.11.12 View Reports Form (Preview) WindowPreview - After all report parameters are selected, to view the report on the window, clickPreview. Each section of the report is displayed one page at a time. To change the size of thepage display, click Page, Width or Full. To view different pages in one section, click the first,previous, next or last page buttons at the top of the window.Figure 41. View Reports Form4200-020R2.0 34 9/25/2009
Table of FiguresTo view different sections of the report, click the tabs along the top of the window. A tab appearsfor each item selected in the Summary box. (Refer to Summary Window.)11.13 Saving A ReportThe Report Generator can save a report as a binary file and an archive file. Either file type maybe opened later and viewed or printed. Reports are saved by default in the folder last opened,unless a different folder is selected.11.13.1 Binary (.BBR) FormatSave (in Reports) - The user may use the Report Generator to open a binary file and customizea report. Select options in the Reports dialog box to create different styles of reports for thesame data. To save a report in BBR format, click Save in the Reports box. In the Save As box,select the folder, type the file name, then click Save.11.13.2 Archive (.ZRF) FormatSave Archive (in View Reports Form) - The Report Generator and the Archive Reader canopen archive files. An archive file cannot be changed after it is saved. Archive format allows theuser distribute the report file while ensuring the integrity of the data. To save a report in ZRFformat, click Preview in the Reports box. When the View Reports Form box appears, click SaveArchive. In the Save Archive box, select the folder, type the file name, then click Save.11.14 Exporting in Database (.DB) FormatExport (in Reports) - The Report Generator can export a report as a comma-delimited text filefor use by commercial database programs. Files saved as comma-delimited text have theextension .DB. To save a report in database format, click Export in the Reports dialog box. Inthe Save In box, select the folder under which the file will be saved. Reports are exported bydefault to the folder last opened, unless the user select a different folder. In the File Name box,type the file name. In the Save As Type box, select DB Format. To save, click the Save button.In the DB format, data is in the following stream:¤ Line 1 (Header Information):¤ Test Location, Test Date, Test Start Time, Test End Time, Battery ID, Battery Type,Installation Date.¤ Line 2 (Test Information):¤ Time, Overall Voltage, Current, Cell 1, Cell 2, Cell 3 .................... Cell (x)11.15 Exporting in Text (.TXT) FormatExport (in Reports) - The Report Generator can export a report as an ASCII text file for use witha text editor. Files saved as ASCII text have the extension .TXT. To save a report in text format,click Export in the Reports dialog box. In the Save In box, select the folder under which the filewill be saved. In the File Name box, type the file name. In the Save As Type box, select TextFormat. To save, click the Save button.11.16 Printing a ReportPrint Current and Print All - To print only the pages under the currently-selected tab, click PrintCurrent on the View Reports Form window. To print all the pages under all the tabs on thewindow, click Print All. When Print All is clicked, a print dialog box appears, which allows theuser specify print all pages, the current page or specific pages, the number of copies, and theprinter setup.4200-020R2.0 35 9/25/2009
11.17 Opening an Archive FileReport Generator<strong>Load</strong> (in Reports) and Open Archive (in View Reports Form) - An <strong>MLC</strong> Archive (.ZRF) file isthe only file type that may be opened while a text or binary file is open. Archive files cannot bechanged. To open an archive file, click <strong>Load</strong> on the Reports dialog box. In the Open box, atFiles of Type, select <strong>MLC</strong> Archive from the drop-down list, select the file name, then click Open.Figure 42. Typical Archive FileThe archive file opens and is displayed. Use the buttons along the top of the window to changethe page size and view different pages. To print the report, click the Print button at the top left.To close the file, click the Close button.11.18 Drill Down ReportsA Drill Down Report (graph) displays the cell voltage versus test time. A report for each cell thatfails minimum voltage threshold level can be automatically or manually displayed on the TestResults pages.Figure 43. Results with Drill Down Report4200-020R2.0 36 9/25/2009
Table of FiguresTo automatically display the Drill Down Reports, select Expand All Test Results Graphs on theReports Options dialog box.To manually display a report, click Preview on the Reports dialog box, then click the Results tabto display the Test Results page. This page lists cells that fell below the minimum thresholdvoltage. Click on a cell description line to display a Drill Down Report for that cell. The reportappears under the description line of the selected cell. The user may display a report for eachfailing cell listed. To close a report, click on the same description line.11.19 Archive Reader ProgramThe Archive Reader program is a separately distributed program that is used to view and printarchive files when the Report Generator program is not available. The Archive Reader istypically distributed with archive files when these files are sent to locations that do not have theReport Generator program. The Archive Reader is packaged with the Report Generator andmay be freely copied and distributed with archive files.12 Running DiagnosticsThe A/D (Analog/Digital) and <strong>Load</strong> Bank diagnostic boxes reside under Diagnostics on the mainmenu. The dialog boxes perform diagnostics on the <strong>MLC</strong> system.WARNING:Diagnostics must be performed only by qualified personnel. Dangerous voltages mayexist inside the <strong>MLC</strong> system equipment. Use extreme caution when servicing equipment,connecting equipment or performing diagnostics.12.1 A/D DiagnosticThe A/D diagnostic test is used by the factory to troubleshoot current channel problems. If theuser experience problems with the current channels or A/D operation, contact the factory forinstructions on how to use this diagnostic.A/D Deviation Threshold (+/-) - At the A/D Deviation Threshold (+/-) box, type the number ofA/D counts that can vary before an error is declared. The default value is –10 counts.Current - This line indicates the count, voltage across the shunt, and the error count describedbelow.Test WDT - The watch dog timer (WDT) circuit monitors the <strong>MLC</strong> system to ensure it is runningnormally. If certain parameters do not respond within a predetermined time, this circuit resetsthe system to an initial power-on state. To test this circuit, click the WDT button to reset thehardware. The red LED on the <strong>MLC</strong> circuit board flashes once and the four green LEDs flashtwice.4200-020R2.0 37 9/25/2009
Running DiagnosticsFigure 44. A/D DiagnosticsCount, Voltage, Error Count, Start and Stop - To start the test, click Start. The Count andVoltage boxes display the A/D count and voltage. If the A/D count varies outside the rangedetermined by the A/D Threshold Deviation value, an error is recorded in the Error Count box.To stop the test, click Stop.12.2 <strong>Load</strong> Bank Diagnostic<strong>Load</strong> bank diagnostics may be used in two ways. Click a single step On to display the loadcurrent, battery voltage, and step resistance; or perform a cumulative resistance test, whichsaves the individual step resistance to the setup file.If the user do not enable Auto Detect Step Resistance (refer to <strong>Load</strong> Bank), the user must enterthe resistance for each step. There are two methods to obtain this information, and acombination of the two may be necessary. After resistance values are entered, the data issaved with the load bank setup information for the currently selected load bank.4200-020R2.0 38 9/25/2009
Table of FiguresFigure 45. <strong>Load</strong> Bank DiagnosticsThe first method to obtain the step resistance is to use an ohmmeter to measure the resistanceof the steps.WARNING:Be sure that power is removed from the load bank before measuring resistance valueswith an ohmmeter.The user may use an ohmmeter to measure the lower steps that have a higher resistance but,to get accurate readings, the user should use a micro-ohmmeter to measure the upper stepsthat have lower resistance values of 20 ohms or less.The user may also use the <strong>MLC</strong> program to obtain step resistance values. To set up the loadbank resistance, first select a Start Step in the Resistance Test group. Depending on shuntrating, selecting Start Step 3 or 4 is recommended, because lower steps produce very lowvoltages across the shunts, which may result in inaccurate readings.Select a Stop Step in the Resistance Test group. Ensure there is sufficient current to drive thestop step selected.Verify the Battery Voltage box displays battery or charger voltage. If the voltage is not displayed,fix the electrical connections before continuing with the test.To begin the load bank resistance test, click Start. The graph fills with resistance values.Observe the bottom axis of the graph. Plots on the graph alternately indicate the resistance ofan individual step and the cumulative (parallel) resistance of the steps up to that step. Doubleclickthe graph to maximize it.4200-020R2.0 39 9/25/2009
Running DiagnosticsNOTE:If the user did not enter the password, the test runs but values are not stored.When the test is complete, click Edit/Analyze to display the Steps Resistance box.Figure 46. Steps ResistanceAfter running the load bank resistance test, the Step n boxes display the resistance values thatwere read. To edit steps with no resistance values, read the resistance value on the panel of theload bank and type it into the box for each step.NOTE.Not all load banks will have this information.The user should run the load bank resistance test periodically, especially if there is a problemcontrolling the load. The test verifies that no step resistance is too high or low. Each step shouldbe approximately half the resistance of the previous step, unless its weight value is not doublethe weight value of the previous step. Refer to <strong>Load</strong> Bank.IMPORTANT NOTE: If the load bank is used in low and high voltage modes, thevalues displayed are for the currently selected mode of operation. (See the load bankspanel for different voltage settings.) If using both modes of the load bank, add anotherload bank to the setup (in Setup – <strong>Load</strong> Bank) and repeat the test. Name the load banksLow Voltage and High Voltage. Assign the load bank used for each test type.(Remember that values only need to be entered if Auto Detect Step Resistance is notenabled.)To analyze the load bank, click Analyze or, to close the Steps Resistance dialog box and returnto the Diagnostics <strong>Load</strong> Bank dialog box, click OK.If the user clicks Analyze, the <strong>Load</strong> Bank Analysis dialog box appears, with values at zero. Inthe Max OV box, type the maximum overall voltage and click Analyze. The load bank isanalyzed and values appear on the dialog box.4200-020R2.0 40 9/25/2009
Table of FiguresFigure 47. <strong>Load</strong> Bank AnalysisThe <strong>Load</strong> Bank Analysis dialog box has three columns of data for each load bank step: <strong>Load</strong>,Accumulative, and Vernier Gap. The <strong>Load</strong> column indicates how much current each step willdraw, based on the maximum OV value entered. The Accumulative column is the total currentdraw of the steps up to that point. The Vernier Gap is the difference between the step <strong>Load</strong>value and the Accumulative value of the previous steps. The highest Vernier Gap numberindicates the minimum tolerance (in amps) of the load bank. Type this value plus one on the<strong>Load</strong> Bank Advance Setup window under Setup|<strong>Load</strong> Bank|Advance.To close the <strong>Load</strong> Bank Analysis window, click X in the upper right corner. To close the StepsResistance box, click OK.Diagnostics <strong>Load</strong> Bank - On the Diagnostics <strong>Load</strong> Bank dialog box, click the appropriate Step1 to 16 to turn on the step corresponding to the step number. If power is supplied to the load,the step resistance is displayed. Toggle the button to turn the step on or off. With no power tothe load bank, the user may use an ohmmeter to read each step resistance.Results of the load bank diagnostics may be needed by Albércorp to assist in troubleshooting.4200-020R2.0 41 9/25/2009
13 System CalibrationSystem CalibrationThis section describes the calibration of the <strong>MLC</strong> system. First, check the system in the asfoundcondition. If all as-found parameters are within specification, calibration does not have tobe performed.Figure 48. CalibrationThe following is required for equipment calibration:¤ Albércorp CS-2000 calibration source (recommended) or equivalent¤ A 4½ digit calibrated digital multimeter (DMM)WARNING:High voltages exist inside the <strong>MLC</strong> system components and on the CS-2000 terminals.Calibration must be performed only by technically qualified persons. Observe electricalsafety precautions when removing and installing the cover and when connecting leadsand making adjustments.13.1 Shunt RatingUnder Setup, click the <strong>Load</strong> Bank menu item. Define Shunt Rating and Amps per Millivolt asdescribed in the <strong>Load</strong> Bank section. Failure to do this will not affect calibration, but the ampsvalue displayed under Present Reading on the Calibration dialog box may not be correct.13.2 Connect the Calibration SourceWhen calibrating the <strong>MLC</strong>, the use of the CS-2000 calibration source is recommended. If theCS-2000 is not available, use a millivolt source capable of delivering 100mV –1mV.Disconnect the wires connected to the shunt and connect them to the CS-2000 0-200mVterminal posts. Set the CS-2000 Polarity switch to Positive.4200-020R2.0 42 9/25/2009
Table of Figures13.3 Calibration1. Using a calibrated voltmeter, monitor the output at the 0-200mV terminal posts andadjust the CS-2000 to 100mV –1mV.2. From the main menu, click Calibration. Type the password to open the Calibration dialogbox.3. In the Voltage Measured box, type the actual voltage measured, in volts. For example, ifthe reading is 100 millivolts, type: .1004. Click the Send button.5. Confirm the value in the Present Readings Shunt mV box is what the user read using theexternal voltmeter.6. The value displayed in the Present Readings Amps box reflects what is set under theshunt settings described in the <strong>Load</strong> Bank section.7. Set the CS-2000 Polarity switch to negative and confirm the Shunt mV value does notindicate more than a 1mV error.13.4 Print a Calibration ReportAfter the user calibrates the unit, print a calibration report and keep it as proof of timelycalibration and as a reference, should any equipment need repair in the future. To print thecalibration report, open the Calibration dialog box and click Print.13.5 Disconnect EquipmentAfter calibration, power off the CS-2000 calibration source and disconnect it from the <strong>MLC</strong>wires. Reconnect the <strong>MLC</strong> wires back onto the shunt.13.6 Calibration BackupDuring the calibration process, calibration data is saved to the <strong>MLC</strong> hardware. If no calibrationexists, an error message appears when the Calibration window opens. If the calibration constant( K ) becomes corrupted, an error message is also displayed. If either error message appears,the user must calibrate the <strong>MLC</strong>. If the error message appears after calibration, the <strong>MLC</strong>requires service. Contact the factory for instructions.4200-020R2.0 43 9/25/2009
System Specifications14 System SpecificationsInputNumber ofChannelsReading RangeAccuracy*Current 1 0 to 3000A 0.1% of reading –3AAlarms Warning ShutdownCurrent N/A 20% of program current for 10secInput Data PointsCurrentStored At Reading Changes1A*Accuracy guaranteed from 40 F to 120 F to 95% relative humidity, non-condensing. Beyond the ratedtemperature range, accuracy may be degraded by 0.05% per F.4200-020R2.0 44 9/25/2009
IndexAA/D deviation threshold .................................... 37A/D diagnostics ................................................ 37add button .................................................. 14, 15add cell button .................................................. 21add step button ................................................ 22adjust active row duration ................................ 22adjust active row target .................................... 22adjust alarm levels button ................................ 21adjust test steps button .................................... 22advance button ................................................. 16alarmcell ................................................................ 19history ........................................................... 19OV ................................................................. 20values in reports ........................................... 28view during test ....................................... 19, 24alarm levels ...................................................... 13change during test ........................................ 21alarm levels window ......................................... 21alarm threshold values area ............................. 28all button ........................................................... 27all off button ................................................ 19, 31all on button ...................................................... 31ambient temperature test ................................... 5amps boxwith calibration .............................................. 43amps column .............................................. 14, 22amps per mv .................................................... 15with calibration .............................................. 42amps per weight value ..................................... 15amps= area ...................................................... 16analyze button .................................................. 40apply button ...................................................... 16archive file ........................................................ 35opening ......................................................... 36archive reader .................................................. 37ASCII format ..................................................... 35auto button ....................................................... 18auto button on graph window ........................... 32auto detect step resistance .............................. 15auto select button ............................................. 31Bbattery name ...................................................... 8Indexin reports ...................................................... 34battery strings window ....................................... 8battery voltage on diagnostics window ............ 39BBR file ...................................................... 26, 35binary file .......................................................... 35BTR file ............................................................ 26buttonchange password ........................................... 2button resume test ........................................... 184200-020R2.0 9/25/2009Ccalculate capacity at target check box ............. 14calibration ................................................... 42, 43backup .......................................................... 43CS-2000 source ........................................... 42reports .......................................................... 43calibration source ............................................. 42calibration window.............................................. 4capacity test ....................................................... 9capacity= area ................................................. 16CAUTION ..................................................... 1, 21cellexclusion ...................................................... 21shutdown ................................................ 13, 20warning ................................................... 13, 19cell % failure ..................................................... 29cell data filter .................................................... 33cell detail button ............................................... 30cell detail window ............................................. 30cell exclusion window ...................................... 20cell exclusions window ..................................... 21cell scaling area ............................................... 31change button .................................................. 34change cell axis count button .......................... 23change password button .................................... 2charger high/low voltage warning .................... 14charger test ...................................................... 25charger test window ......................................... 11charger warning levels ..................................... 29charger window ................................................ 25clip start and end of test check box ................. 30clip valuesdetermining ................................................... 30colors of graphs ................................... 19, 20, 25COM port ........................................................... 3communications window .................................... 4
Indexconstant current button .................................... 12constant power button ...................................... 12correction.......................................................... 12count box .......................................................... 38criteria button ................................................... 28criteria window ................................................. 28CS-2000 ........................................................... 42current line on A/D window .............................. 37cursor ball on graph ......................................... 18customer name .................................................. 8Ddatabase format ............................................... 35DB file ............................................................... 35delete button .............................................. 14, 15diagnostics ....................................................... 37A/D ................................................................ 37load bank ...................................................... 38diagnostics load bank window ......................... 41diagnostics window ............................................ 4disable (on filter window) .................................. 33drill down report ................................................ 36duration ............................................................ 17duration column ................................................ 13Eedit/analyze button ........................................... 40electrolyte temperature test................................ 5enable (on filter window) .................................. 33enable check box ............................................. 30equalize charging ............................................... 6error count box ................................................. 38exclude cells button .......................................... 21expand all test results graphs check box ... 29, 37export button .................................................... 35FF1 buttons on windows .... See the button namesfactory backup code ........................................... 2file typeBBR .............................................................. 26BTR............................................................... 26ZRF ............................................................... 26filter button........................................................ 32filter window ..................................................... 32footer date printed check box ........................... 29footer page number check box......................... 29footer text printed check box ............................ 29full button .......................................................... 34Ggeneral description ............................................. 1graph button ..................................................... 31graph window ................................................... 31graphs .............................................................. 16Hchanging during test ..................................... 23colors ................................................ 19, 20, 25in reports ...................................................... 36hardware failure ............................................... 25help window ....................................................... 5high voltage warning ........................................ 29history graph for charger .................................. 25history of tests .................................................... 6hydrometer test .................................................. 5IIEEE button ...................................................... 12IEEE standard ............................................ 5, 6, 9ignore zero target steps check box ............ 14, 30include power in report check box ................... 30include steps start and end values check box . 30insert button ..................................................... 14installation .......................................................... 1Kkw= area .......................................................... 16Lloadbattery isolated ............................................... 6load bank S/N ID .......................................... 15load bank window ......................................... 14load button .............................................. 26, 36load data filter ............................................... 33load scaling area .......................................... 31load step weights ......................................... 19load test control ............................................ 18load test setup ................................................ 7supplemental .................................................. 6system ............................................................ 6types ............................................................... 6load bank ........................................................... 5connecting .................................................. 6, 7diagnostics ................................................... 38high voltage mode ........................................ 40load bank manual control ............................. 18load bank window ......................................... 14low voltage mode ......................................... 40near fire system .............................................. 5load bank adjust button .................................... 23load bank advance setup window .................... 16load bank analysis window .............................. 40location name ..................................................... 8location window .................................................. 74200-020R2.0 9/25/2009
Indexlow cell criteria label ......................................... 32low cell threshold .............................................. 28low OV criteria label ......................................... 32low OV threshold .............................................. 28low voltage warning .......................................... 29Mmain menu.......................................................... 4calibration window .......................................... 4communications window................................. 4diagnostics window ......................................... 4help window .................................................... 5reports window ............................................... 4setup window .................................................. 4test window ..................................................... 4manual button .................................................. 18manual button on graph window ...................... 31manual control test window .............................. 18manual mode ................................................... 18manual select button ........................................ 31max OV ............................................................ 40microcontrol load bank ..................................... 16micro-ohmmeter test .......................................... 5modified performance test window .................... 9modify graphs ................................................... 23momentary ....................................................... 15Nnone button ................................................ 12, 27NOTE ........ 1, 2, 8, 13, 16, 19, 22, 29, 30, 39, 40notes button ..................................................... 33notes window ................................................... 33nudge button .................................................... 17Oopen archive button .......................................... 36options button ................................................... 29options window ................................................. 29OValarm ............................................................. 20shutdown ...................................................... 13warning ......................................................... 13OV data filter .................................................... 33OV deviation button .......................................... 28OV scaling area ................................................ 31OV= area .......................................................... 16Ppage button ...................................................... 34page size in reports .......................................... 34password ............................................................ 2pause button .................................................... 18performance test window ................................... 9power scaling area ........................................... 31power type ....................................................... 12present readings box ....................................... 43preview button .................................................. 34preview window ................................................ 34print all button .................................................. 35print current button ........................................... 35properties button .............................................. 34Rrated time ................................................... 12, 29recharge hours ................................................. 14recharge test window ....................................... 11report footer ..................................................... 29report generator ............................................... 25archive file .................................................... 35BBR file ........................................................ 35binary file ...................................................... 35DB file ........................................................... 35exporting ....................................................... 35loading a file ................................................. 26opening a report ........................................... 26sample file .................................................... 26saving a report.............................................. 35TXT file ......................................................... 35ZRF file ......................................................... 35report interval area ........................................... 28report properties window ................................. 34report title ......................................................... 29reports button ................................................... 26reports window ............................................. 4, 26resistance test area.......................................... 39resume button .................................................. 18rundown test window ....................................... 10Ssample data ..................................................... 26save archive button .......................................... 35save button (in reports) .................................... 35service test window .......................................... 10setup .................................................................. 7battery strings ................................................. 8load bank ...................................................... 14load test .......................................................... 7location ........................................................... 7test .................................................................. 8test types ........................................................ 9setup window ..................................................... 4shunt mV boxwith calibration.............................................. 43shunt rating4200-020R2.0 9/25/2009
Indexassigning ...................................................... 15with calibration .............................................. 42shunt rating amps per mV ................................ 15shutdown cells .................................................. 13shutdown level ................................................. 13shutdown OV .................................................... 13site namein reports ....................................................... 34specifications .................................................... 43start button ....................................................... 38start capacity calculation at target check box .. 30start step........................................................... 39start test button ................................................ 17step column ...................................................... 13step n buttonson diagnostics window............................ 38, 41on setup window ........................................... 15step resistance ................................................. 38step weight ................................................. 15, 19indicator ........................................................ 19steps resistance window .................................. 40stop button........................................................ 38stop step ........................................................... 39stop test button ................................................. 18summary button ............................................... 27summary window ............................................. 27systemTload ................................................................. 6taskbar ................................................................ 1temperatureambient ........................................................... 5correction ...................................................... 12setting ........................................................... 12test .................................................................. 5temperature buttons ......................................... 12testcontroll .......................................................... 18history ............................................................. 6starting .......................................................... 17test adjustments windows ................................ 21test leads .......................................................... 17test setup ............................................................ 8test steps .................................................... 13, 22change during test ........................................ 22test steps window............................................. 22test time ........................................................... 17test type ............................................................. 9charger ......................................................... 11modified performance .................................... 9performance ................................................... 9recharge ....................................................... 11rundown ........................................................ 10service .......................................................... 10test WDT button ............................................... 37test window .................................................. 4, 16test window toolbar .......................................... 20time interval button........................................... 28toolbar on test window ..................................... 17TXT file ............................................................. 35UUSBVCOM port ........................................................ 3version number .................................................. 5view alarms button ........................................... 24view reports form items .................................... 28view reports form window ................................ 34voltagein test window ............................................... 17voltage box ....................................................... 38WWARNING .............................. 5, 6, 18, 37, 39, 42warning cells .................................................... 13warning level .................................................... 13warning OV ...................................................... 13warning window ............................................... 19watch dog timer ................................................ 37watts column .............................................. 14, 23WDT ................................................................. 37weight buttons .................................................. 19width button ...................................................... 34Zzoom on cell axis button .................................. 23ZRF file ...................................................... 26, 354200-020R2.0 9/25/2009