MODELING OF LOW SALINITY EFFECTS IN SANDSTONE OIL ...
MODELING OF LOW SALINITY EFFECTS IN SANDSTONE OIL ...
MODELING OF LOW SALINITY EFFECTS IN SANDSTONE OIL ...

You also want an ePaper? Increase the reach of your titles
YUMPU automatically turns print PDFs into web optimized ePapers that Google loves.
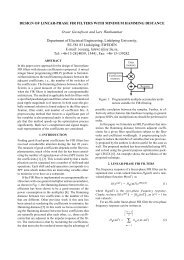
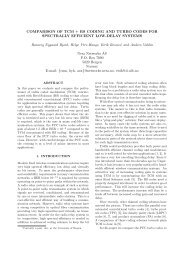
<strong>MODEL<strong>IN</strong>G</strong> <strong>OF</strong> <strong>LOW</strong> <strong>SAL<strong>IN</strong>ITY</strong> <strong>EFFECTS</strong> <strong>IN</strong> <strong>SANDSTONE</strong> <strong>OIL</strong> ROCKS 7Relative permeability0.90.80.70.60.50.40.30.2krw−HSkro−HSkrw−LSkro−LSfractional flow10.80.60.40.2HSLS0.100 0.1 0.2 0.3 0.4 0.5 0.6 0.7 0.8 0.9 1Water Saturation00 0.2 0.4 0.6 0.8 1Water SaturationFigure 2. Left: Example of relative permeability curves corresponding to highsalinity(HS) and low-salinity (LS) conditions. Right: Corresponding fractionalflow functions.3.1.1. High salinity conditions. This is assumed to be the initial state of the core. The valuesfor generating the functions are listed in Appendix B. Applying the values of the high salinitycondition in (14) the following two relative permeability curves are obtained(15) k HS (s; s HSwr , s HSor ),koHS (s; s HSwr , s HSor ),We refer to Fig. 2 for a plot of these curves (red line).for s HSwr≤ s ≤ 1 − s HSor .3.1.2. Low salinity conditions. This wetting condition is assumed to be attained only whenthere is complete desorption of Ca 2+ and Mg 2+ ions from the rock surface. The values for generatingthe functions are listed in Appendix B. Applying the values of the low salinity condition in(14) gives corresponding relative permeability curves(16) k LS (s; s LSwr , s LSor ),koLS (s; s LSwr , s LSor ),for s LSwr ≤ s ≤ 1 − s LSor .We refer to Fig. 2 for a plot of these curves (blue line). The motivation for the choice of the valueswas to match the form of the relative permeability measured for a variety of high salinity and lowsalinity brines in [43].3.2. Cation exchange as a mechanism for wettability alteration. We let β ca0 and β mg0be the amount of calcium and magnesium, respectively, initially bounded to the clay surface. Wethen define the quantity(17) m(β ca , β mg ) := max(β ca0 − β ca , 0) + max(β mg0 − β mg , 0),as a measure for the desorption of cations from the clay. Moreover, we define(18) H(β ca , β mg ) :=11 + rm(β ca , β mg ) ,where r > 0 is a specified constant. Note that the choice of r determines the extent in which thedivalent ion desorbed leads to a certain change of the wetting state.The function H(β ca , β mg ) is a weighting function, and works such that H = 1, when there is nodesorption of calcium and magnesium from the rock, whereas 0 < H < 1 in case of desorption ofat least one of these cations. How fast H(β ca , β mg ) is approaching 0 as m(β ca , β mg ) is increasing,depends on the choice of r. Now, the weighting function H(β ca , β mg ) can be used to represent thewetting state in the core plug; H(β ca , β mg ) = 1 corresponds to the initial oil-wet state, whereasH(β ca , β mg ) ≈ 0 represents the water-wet state. By defining relative permeability curves by meansof the weighting function H(β ca , β mg ) as described in the next subsection, the model can account