Environmental Impacts of Multi-Storey Buildings Using Different ...
Environmental Impacts of Multi-Storey Buildings Using Different ...
Environmental Impacts of Multi-Storey Buildings Using Different ...

Create successful ePaper yourself
Turn your PDF publications into a flip-book with our unique Google optimized e-Paper software.
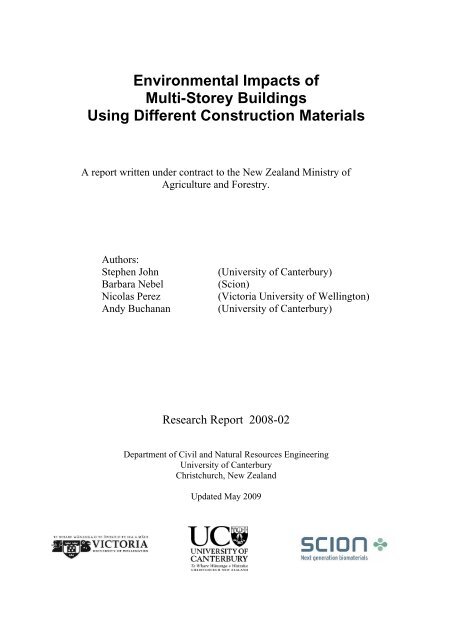
<strong>Environmental</strong> <strong>Impacts</strong> <strong>of</strong><strong>Multi</strong>-<strong>Storey</strong> <strong>Buildings</strong><strong>Using</strong> <strong>Different</strong> Construction MaterialsA report written under contract to the New Zealand Ministry <strong>of</strong>Agriculture and Forestry.Authors:Stephen JohnBarbara NebelNicolas PerezAndy Buchanan(University <strong>of</strong> Canterbury)(Scion)(Victoria University <strong>of</strong> Wellington)(University <strong>of</strong> Canterbury)Research Report 2008-02Department <strong>of</strong> Civil and Natural Resources EngineeringUniversity <strong>of</strong> CanterburyChristchurch, New ZealandUpdated May 2009
Acknowledgements.The authors wish to acknowledge the major contributions made by the following;John Eyre (Ministry <strong>of</strong> Agriculture and Forestry)Tobias Smith (University <strong>of</strong> Canterbury)Michael Newcombe (UC)David Drysdale (Scion)Simon Love (Scion)and the assistance given by the following;Richard Seville (Holmes Consulting Group)Iain Nicholls (Warren and Mahoney)Jan Geesink (Arrow International)Graeme Jones (Arrow International)George Baird (Victoria University <strong>of</strong> Wellington)Andrew Alcorn (VUW)David Yeoh (UC)Stefano Pampanin (UC)Bruce Deam (UC)Massimo Fragiacomo (UC)Morten Gjerde (VUW)Ross Davidson (Davis Langdon)eCubed Building Workshop Limited
ContentsGlossary...................................................................................................................................... 91 Introduction ...................................................................................................................... 102 Executive Summary ......................................................................................................... 123 Background ...................................................................................................................... 143.1 Research goals and objectives – MAF RFP POR/7811. .......................................... 143.2 Research Team ......................................................................................................... 163.3 Government Policies Supporting Research.............................................................. 163.4 <strong>Multi</strong>-<strong>Storey</strong> Timber <strong>Buildings</strong>................................................................................ 183.4.1 Introduction ...................................................................................................... 183.4.2 Forms <strong>of</strong> <strong>Multi</strong>-<strong>Storey</strong> Construction................................................................ 183.4.3 Typical Structure.............................................................................................. 183.4.4 Material selection for multi-storey timber buildings........................................ 183.4.4.1 Historical Timber <strong>Buildings</strong>......................................................................... 193.4.4.2 Traditional Heavy Timber Frames ............................................................... 193.4.4.3 Light Timber Frame ..................................................................................... 193.4.4.4 Cross Laminated Timber.............................................................................. 193.4.4.5 Post-tensioned Timber Frames and Walls.................................................... 203.4.5 Height Limits for <strong>Multi</strong>-<strong>Storey</strong> Construction................................................... 203.4.6 References ........................................................................................................ 213.5 Structural Timber Innovation Company .................................................................. 213.5.1 New Research Consortium............................................................................... 213.5.2 Vision ............................................................................................................... 223.5.3.................................................................................................................................. 223.5.4 STIC Objectives ............................................................................................... 223.5.5 Scope <strong>of</strong> Research and Development............................................................... 233.5.6 Market Drivers ................................................................................................. 243.5.7 Objectives......................................................................................................... 244 The <strong>Buildings</strong> ................................................................................................................... 254.1 Construction Materials for Commercial <strong>Buildings</strong> .................................................. 254.2 Building Design........................................................................................................ 254.3 General Design Concepts......................................................................................... 264.3.1 Four Alternative <strong>Buildings</strong> – Description ........................................................ 274.3.2 Common Design Principles.............................................................................. 294.3.3 Concrete Building ............................................................................................ 314.3.3.1 Structural System ......................................................................................... 314.3.3.2 Floors and Ro<strong>of</strong>............................................................................................ 314.3.3.3 Structural Walls............................................................................................ 324.3.3.4 Internal Partitions ......................................................................................... 324.3.4 Steel Building................................................................................................... 324.3.4.1 Structural System ......................................................................................... 324.3.4.2 Floor and Ro<strong>of</strong> ............................................................................................. 334.3.4.3 Structural Walls............................................................................................ 334.3.4.4 Internal Partitions ......................................................................................... 334.3.5 Timber and TimberPlus <strong>Buildings</strong> ................................................................... 344.3.5.1 Structural System ......................................................................................... 344.3.5.2 Floor and Ro<strong>of</strong> ............................................................................................. 354.3.5.3 Envelope Walls ............................................................................................ 354.3.5.4 Internal Partitions ......................................................................................... 35
4.3.5.5 Timber Building Finishes............................................................................. 354.3.5.6 TimberPlus Building Finishes...................................................................... 354.4 <strong>Multi</strong>-<strong>Storey</strong> Timber Building Research.................................................................. 374.4.1 New Forms <strong>of</strong> Timber Construction ................................................................ 374.4.2 Development <strong>of</strong> Post-Tensioned Timber Systems ........................................... 374.4.3 Experimental Investigation .............................................................................. 384.4.3.1 Design Flexibility......................................................................................... 394.4.3.2 Long-term Effects ........................................................................................ 405 Operational Energy .......................................................................................................... 415.1 General ..................................................................................................................... 415.2 Operational Energy Simulation................................................................................ 425.2.1 Simulation Method........................................................................................... 425.2.2 Floor Areas for Simulation............................................................................... 435.2.3 <strong>Buildings</strong>’ Thermal Envelope Descriptions ..................................................... 445.2.4 HVAC............................................................................................................... 455.2.5 Schedule ........................................................................................................... 465.2.6 Energy sources ................................................................................................. 465.3 Life-Cycle Operational Energy Use......................................................................... 465.3.1 Benchmarks for Operational Energy in New Zealand <strong>Buildings</strong>..................... 485.3.2 Summary <strong>of</strong> Energy Consumption Benchmarks.............................................. 495.4 Masters Thesis.......................................................................................................... 506 Life Cycle Assessment..................................................................................................... 516.1 Introduction .............................................................................................................. 516.2 Background .............................................................................................................. 516.2.1 LCA Overview ................................................................................................. 516.2.2 Definition <strong>of</strong> LCA ............................................................................................ 516.2.3 Elements <strong>of</strong> an LCA......................................................................................... 526.2.3.1 Goal and Scope Definition ........................................................................... 526.2.3.2 Inventory Analysis ....................................................................................... 526.2.3.3 Impact Assessment....................................................................................... 536.2.3.4 Interpretation ................................................................................................ 536.3 Life Cycle Assessment <strong>of</strong> the Four Building Designs ............................................. 546.3.1 Goal .................................................................................................................. 546.3.2 Scope ................................................................................................................ 546.3.2.1 Functional Unit............................................................................................. 546.3.2.2 System Boundaries....................................................................................... 556.3.2.3 Data Quality ................................................................................................. 556.3.2.4 Intended Audience and Application <strong>of</strong> the Results...................................... 566.3.2.5 Impact Assessment Methodologies.............................................................. 566.3.2.6 Primary Energy ............................................................................................ 566.3.2.7 Global Warming Potential (GWP) ............................................................... 586.3.3 Inventory Analysis ........................................................................................... 596.3.3.1 Material Quantities....................................................................................... 596.3.3.2 Maintenance ................................................................................................. 596.3.3.3 End-<strong>of</strong>-Life Inventory .................................................................................. 606.3.3.4 Transport ...................................................................................................... 636.3.3.5 Operational Energy ...................................................................................... 646.3.4 Impact Assessment........................................................................................... 656.3.4.1 Total Primary Energy Use and GWP ........................................................... 656.3.4.2 Contribution <strong>of</strong> building components .......................................................... 67
6.3.4.3 Maintenance related embodied energy......................................................... 696.3.5 Scenarios .......................................................................................................... 716.3.5.1 Landfill vs. Material Reutilisation ............................................................... 716.3.5.2 Transport Distances...................................................................................... 756.4 Green Star Assessment and Comparison ................................................................. 776.4.1 Approach .......................................................................................................... 776.4.2 Introduction to Green Star................................................................................ 776.4.3 Research Approach for Comparison ................................................................ 786.4.3.1 Green Star Base Scenario............................................................................. 796.4.3.2 Green Star Recycling Scenario .................................................................... 816.4.4 Results .............................................................................................................. 826.5 Discussion and Conclusions..................................................................................... 846.5.1 Life Cycle Assessment..................................................................................... 846.5.2 Primary Embodied Energy and GWP .............................................................. 846.5.3 Maintenance Related Energy ........................................................................... 856.5.4 Comparison Between Landfilling and Material Reutilisation.......................... 866.5.5 Transport Distances Sensitivity Test................................................................ 876.5.6 Green Star assessment...................................................................................... 877 Building Construction ...................................................................................................... 887.1 Construction Method <strong>of</strong> the Timber <strong>Buildings</strong> ........................................................ 887.1.1 Platform and Balloon Construction.................................................................. 897.1.2 Assembly <strong>of</strong> Key Components......................................................................... 897.2 Construction Method <strong>of</strong> Concrete Building............................................................. 907.3 Construction Time Analysis..................................................................................... 908 A Review <strong>of</strong> the Timber Used in the Timber <strong>Buildings</strong> .................................................. 948.1 General ..................................................................................................................... 948.2 Source and Availability <strong>of</strong> Timber........................................................................... 958.3 Certification <strong>of</strong> Timber............................................................................................. 968.4 Timber Treatment and Durability ............................................................................ 978.5 Additional Opportunities for the Use <strong>of</strong> Timber...................................................... 998.6 Current Situation in NZ for Recycling and Disposal <strong>of</strong> Treated Timber Products.. 998.6.1 Thermal Treatment........................................................................................... 998.6.2 Pre-Processing and Chemical Removal ......................................................... 1008.6.3 Recycling........................................................................................................ 1018.6.4 Extended Producer Responsibility (EPR) ...................................................... 1028.6.5 Sorting <strong>of</strong> Timber Waste................................................................................ 1038.6.6 The Way Forward for NZ............................................................................... 1038.6.7 Current Research Into Energy Recovery from Treated Timber in NZ .......... 1049 Discussion ...................................................................................................................... 1059.1 The <strong>Buildings</strong> ......................................................................................................... 1059.2 <strong>Multi</strong>-<strong>Storey</strong> Timber <strong>Buildings</strong>.............................................................................. 1069.3 Operational Energy ................................................................................................ 1069.4 The Data ................................................................................................................. 1079.4.1 Operational Energy ........................................................................................ 1079.4.2 Material Quantities......................................................................................... 1089.4.3 Data Sets......................................................................................................... 1099.4.3.1 General ....................................................................................................... 1099.4.3.2 The importance <strong>of</strong> a NZ-specific GWP coefficient for Laminated VeneerLumber 109
9.5 Permanent Carbon Storage in Wood Products; an Alternative End-<strong>of</strong>-Life Scenario.1109.5.1 Materials Only – With Data From GWP Coefficients used by Scion............ 1119.5.2 Materials only – using data from LCA assessment in Chapter 6.................. 1159.5.3 Materials Combined With all Other Emissions for Full Life Cycle .............. 1169.6 Green Star <strong>of</strong>fice building rating tool .................................................................... 1189.7 Timber used in the <strong>Buildings</strong>. ................................................................................ 1209.7.1 Laminated Veneer Lumber............................................................................. 1209.7.2 Other Timber Products................................................................................... 1219.8 The Big Picture....................................................................................................... 12110 Conclusions ................................................................................................................ 123References .............................................................................................................................. 132Appendix A Material Quantities <strong>of</strong> each Building TypeB Life Times <strong>of</strong> Building MaterialsC Carbon released and sequestration from wood in landfillD Transport ScenarioE Letter from Holmes Consulting LimitedF Warren and Mahoney ReportG Green Star Assessment <strong>of</strong> <strong>Different</strong> Building Options – Peer Review
- 9 -GlossaryCO 2 stored – refers to the CO 2 stored in non decomposed wood that has been disposed <strong>of</strong> inlandfill.Embodied energy – refers to the energy required to make a product, which includes: rawmaterial acquisition and processing, energy production, transport, and product manufacturing,i.e. “cradle to gate”.End <strong>of</strong> life energy – refers to the energy associated with the disposal <strong>of</strong> a material at the finalstages <strong>of</strong> the life cycle (e.g. landfilling or recycling) and includes the transport <strong>of</strong> materials tothe disposal/recycling facility. EOL may be positive or negative depending on the disposalmode. Examples <strong>of</strong> disposal modes include landfilling and combustion.Energy recovery – refers to obtaining useful energy from wood waste through combustion.Energy retained – refers to the total potential energy that could be produced fromcombustion <strong>of</strong> materials.GHG substitution – refers to the amount <strong>of</strong> fossil fuel GHG emissions unreleased, whenobtaining energy from wood instead <strong>of</strong> fossil fuel energy sources.Initial embodied energy – refers to the embodied energy <strong>of</strong> a building once it has beencompleted, before any maintenance has been undertaken.Maintenance (recurrent) related embodied energy – refers to the embodied energy <strong>of</strong>materials required to maintain the building.Material reutilisation – refers to reusing certain building materials for other beneficialpurposes, following deconstruction <strong>of</strong> the building. Examples include combustion <strong>of</strong> wood forenergy or recycling <strong>of</strong> materials.Operational energy – total primary energy consumed during the 60 year life <strong>of</strong> the building.Primary energy – Energy required to produce a unit <strong>of</strong> useful energy (MJ or kWh), whichincludes all upstream processes. Primary energy is energy contained in raw fuels and anyother forms <strong>of</strong> energy that has not been subjected to any conversion or transformationprocess. Primary energies are transformed in energy conversion processes to more convenientforms <strong>of</strong> energy, such as electrical energy and cleaner fuels.Total embodied energy – refers to the sum <strong>of</strong> initial embodied energy, maintenance relatedembodied energy, operational energy, end-<strong>of</strong>-life energy, and energy recovered throughmaterial reutilisation.Useful metered energy – Energy consumed at a point source, i.e. power socket.
- 10 -1 IntroductionThis report was produced for the Ministry <strong>of</strong> Agriculture and Forestry under the Request forProposal POR/7811.The 12-month collaborative research programme was directed by the Department <strong>of</strong> Civil andNatural Resources Engineering at the University <strong>of</strong> Canterbury, Christchurch.Scion (Wellington) was sub-contracted to undertake a substantial part <strong>of</strong> the research work,namely the Life Cycle Assessment and Green Star rating tool analysis.Acknowledgement <strong>of</strong> major contributions to the research programme is made to theUniversity <strong>of</strong> Canterbury, Scion and Victoria University <strong>of</strong> Wellington. Importantcontributions were made by many others including engineering and energy consultants,architects, quantity surveyors and construction project managers.All the Chapters in the report are written by the University <strong>of</strong> Canterbury, except Chapter 6,Life Cycle Assessment contributed by Scion.The report is structured as follows;Chapter 1Chapter 2Chapter 3Chapter 4Chapter 5Chapter 6Introduction.Executive Summary.A summary <strong>of</strong> the full programme <strong>of</strong> research, analyses, results, discussionsand conclusions.Background.Background information which positions the project and details goals andobjectives and the Research Team. This section also provides generalinformation about <strong>Multi</strong>-storey Timber <strong>Buildings</strong> and a significant combinedNZ Government and industry commitment to fund future relevant research.The <strong>Buildings</strong>.A key objective <strong>of</strong> the project was to design three buildings where the mainstructural components were either concrete, steel or timber. A fourth design,TimberPlus, maximising the use <strong>of</strong> timber throughout was also produced. Allbuildings have a projected 60 year lifetime.Operational Energy.A key objective <strong>of</strong> the project was to ensure that the four buildings were ‘lowenergy’ and designed to consume very similar operational energy over thelifetimes <strong>of</strong> the buildings.Life Cycle Assessment (LCA).Analysis and reporting by Scion. This chapter employs LCA to compare theenvironmental impacts <strong>of</strong> the four building designs, investigating the embodiedenergy <strong>of</strong> the various building materials and the building’s lifetime recurring(maintenance and refurbishment) embodied energy and associated operationalenergy. Two end-<strong>of</strong>-life scenarios are presented. The Global WarmingPotential (GWP) <strong>of</strong> each design is used to show differences between thebuildings due to the different materials used. A high level comparison ispresented between LCA and the NZ Green Building Council Green Star OfficeDesign rating tool.This chapter also includes the discussions and conclusions <strong>of</strong> Scion.
- 11 -Chapter 7Chapter 8Chapter 9Chapter 10Building Construction.Construction schedules for the different building designs.A Review <strong>of</strong> the Timber Used in the Timber <strong>Buildings</strong>.Investigation <strong>of</strong> the source, availability and certification <strong>of</strong> the timber assumedto be used in the buildings. Also, timber treatment, durability and the currentsituation in NZ for recycling and disposal <strong>of</strong> treated timber.Discussion.This chapter presents discussions <strong>of</strong> many <strong>of</strong> the results and findings <strong>of</strong> thisresearch. It includes an alternative end-<strong>of</strong>-life scenario to that proposed inChapter 6.Conclusions.Presented as a series <strong>of</strong> key questions and answers.References.The Appendices contain data and further information relevant to this report.
- 12 -2 Executive SummaryThe Research Goals and Objectives for this project were set out in the Ministry <strong>of</strong> Agricultureand Forestry (MAF) RFP POR/7811, April 2007. The University <strong>of</strong> Canterbury respondedwith a collaborative research programme ‘to fill the information gap about what is the greatestamount <strong>of</strong> wood that can be used in the construction and fit-out <strong>of</strong> commercial, large-scalebuildings in New Zealand (and) …… to provide Life Cycle Assessment (LCA) informationabout the benefits <strong>of</strong> maximising the use <strong>of</strong> wood in sustainable buildings’.This research project modelled the performance <strong>of</strong> four similar <strong>of</strong>fice building designs –Concrete, Steel, Timber and TimberPlus – all based on an actual six-storey 4,200m 2 building,to investigate the influence <strong>of</strong> construction materials on life cycle energy use and globalwarming potential (GWP).All four buildings were designed for a 60 year lifetime, with very similar low operationalenergy consumption. The Concrete and Steel buildings employed conventional structuraldesign and construction methods. The Timber buildings were designed with an innovativepost-tensioned timber structure using laminated veneer lumber (LVL). The TimberPlus designfurther increased the use <strong>of</strong> timber in architectural features such as exterior cladding, windowsand ceilings. All timber materials are renewable and durable, sourced from sustainablymanaged forests. Predicted construction times for all four buildings are similar.The LCA study by Scion considered the full life cycle <strong>of</strong> the buildings including initialembodied energy <strong>of</strong> the materials, and maintenance, transport, operational energy and two end<strong>of</strong>-lifescenarios, where deconstructed materials were either landfilled or reutilised.Increasing the amount <strong>of</strong> timber in the buildings decreased the initial embodied energy andGWP <strong>of</strong> materials and also decreased the total energy consumption and GWP over the 60 yearlifetime. The TimberPlus design clearly had the lowest environmental impacts, whilst the Steelbuilding had the highest impacts. A significant benefit could be obtained in the Steel, Concreteand Timber buildings by replacing high embodied energy components (especially aluminiumwindows and louvres) with timber.The final destination <strong>of</strong> deconstruction waste at the end <strong>of</strong> the 60 year life-cycle is extremelyimportant. Landfilling <strong>of</strong> timber waste, with the permanent storage <strong>of</strong> most <strong>of</strong> the carbon inthe timber, was slightly more beneficial than burning <strong>of</strong> wood waste for energy. The benefits <strong>of</strong>landfilling timber waste will increase as modern and future landfill construction andmanagement capture and utilise more <strong>of</strong> the methane generated by decomposition. Recycling<strong>of</strong> steel and concrete is more beneficial than landfilling.It is important to note that looking at a single environmental indicator, such as GWP, couldlead to unintended outcomes. For example, for the TimberPlus building the landfilling scenariowould be slightly better in terms <strong>of</strong> climate change. However, looking at the energy resultsalongside the GWP results, the reutilisation scenario shows both an energy reutilisation benefit,as well as still being beneficial to climate change. Therefore, the use <strong>of</strong> multiple indicatorsmay be necessary to inform the environmental decision-making processes.
- 13 -An alternative end-<strong>of</strong>-life scenario which assumed permanent storage <strong>of</strong> carbon in woodmaterials showed that net total GWP for the materials in the TimberPlus building is negative,because the long-term storage <strong>of</strong> over 630 tonnes <strong>of</strong> carbon dioxide removed from theatmosphere more than cancels out all the greenhouse gases emitted in the manufacture <strong>of</strong> allthe other building materials. In this scenario, the TimberPlus building could be considered tobe ‘carbon-neutral’ for at least the first 12 years <strong>of</strong> its operation.With NZ-specific energy and GWP coefficients now available, a simple model can bedeveloped for assessing the energy and GWP impacts <strong>of</strong> individual buildings. This studyshows that the Green Star Office rating tool does not capture all the benefits <strong>of</strong> using morewood in buildings which are identified by the simple model or a full LCA study.Support <strong>of</strong> on-going research is essential to further develop the potential for Timber buildingsto be more widely used in NZ, with subsequent reductions in greenhouse gas emissions.
- 14 -3 Background3.1 Research goals and objectives – MAF RFP POR/7811.The broad Research Goals and Objectives for this project were set out in the Ministry <strong>of</strong>Agriculture and Forestry (MAF) Request for Proposal POR/7811 issued in April 2007. TheUniversity <strong>of</strong> Canterbury responded with a proposal (Operational Research Proposal Form –Part Two) which formulated a collaborative research programme bringing together a number<strong>of</strong> specialist and academic resources together with building industry consultants.The Research Project proposed to design three comparable commercial buildings in Timber,Concrete and Steel and to conduct a full Life Cycle Assessment to determine environmentalimpacts associated with the buildings throughout their lifetime.The research needed to achieve the following objectives (as identified by MAF);• Fill the information gap about what is the greatest amount <strong>of</strong> wood that can be used inthe construction and fit-out <strong>of</strong> commercial and large-scale residential buildings in NewZealand.• Provide Life Cycle Assessment (LCA) information about the benefits <strong>of</strong> maximising theuse <strong>of</strong> wood in sustainable buildings.The research was supported by the rationale that;• The Government has stated its wish to pursue policies that will move NZ towards beingtruly sustainable.• Modern engineered wood products, recent advances in structural timber engineering andinnovative designs now position timber as an alternative material (to concrete and steel)for multi-storey buildings.• Wood is a renewable, low energy resource; there is a plentiful, sustainably-grown supplyin NZ. Modern timber construction produces little waste and the manufacture <strong>of</strong> buildingmaterials from wood is generally non-polluting at all stages.• Increased use <strong>of</strong> wood would provide national benefits over the long term (reduced fossilfuel energy consumption and CO 2 emissions; an increase in the pool <strong>of</strong> carbon in woodand wood products; and the potential for displacement <strong>of</strong> fossil fuel by burning <strong>of</strong> woodwaste materials).• To understand long-term sustainability, full LCA <strong>of</strong> building materials must beconsidered.Over the past few decades there has been very little commercial and large-scale residentialbuilding utilising predominately wood and wood products. Whilst there is no technical orfinancial reason for this, a major barrier could be the conservatism <strong>of</strong> building owners and
- 15 -designers and a shortage <strong>of</strong> building design practitioners who are trained and experienced inthe use <strong>of</strong> wood as a construction material for large buildings.The information gap noted above is there because few have seen the need for this informationuntil now, there are few examples and very few advocates.Further impetus for this research was provided by the introduction <strong>of</strong> the New Zealand GreenBuilding Council (NZGBC) Green Star Office rating tool (v1.0) which does not consider thefull LCA <strong>of</strong> building materials; it does not consider embodied energy, nor give fairconsideration to the displacement <strong>of</strong> more energy intensive building materials by wood, norprovide recognition <strong>of</strong> the ability to use wood waste to generate energy. Current research wasneeded to demonstrate the perceived shortcomings <strong>of</strong> the NZGBC rating tool and <strong>of</strong>feralternatives.The initial research contract had three programme objectives:Objective 1 To design three comparable buildings with the following structuralmaterials; conventional reinforced concrete, conventional steel andinnovative pre-stressed timber. MAF RFP POR/7811 providedmethodology and design guides for the building.Objective 2 To investigate both the embodied energy in the structural and nonstructuralmaterials and the whole-<strong>of</strong>-life operational energy <strong>of</strong> eachbuilding design, together with lifetime GWP emissions.Objective 3 To demonstrate and highlight any differences between the total whole-<strong>of</strong>lifeenergy <strong>of</strong> each building, together with lifetime GWP emissions.The research was extended in December 2007 to;• Design a fourth structure, the TimberPlus building. This design was to go well beyondsubstituting the mainly structural components <strong>of</strong> the building to redesign the wholearchitecture, both internal and external. (For instance, the TimberPlus buildingmaximises the use <strong>of</strong> wood through timber external cladding and internal partitions, andincorporates timber framed windows, doors and stairs). The TimberPlus option needed tomaximise the use <strong>of</strong> wood but not beyond what would be a reasonable expectation botharchitecturally and aesthetically, whilst still <strong>of</strong>fering a realistic maintenance schedule andwithin a similar budget to the Concrete and Steel options.• Undertake additional work on the Steel building to allow the Steel building to be broughtup to a more comparable level <strong>of</strong> design and research, similar to that for the Concrete andTimber options, and thus allow a more rigorous comparison <strong>of</strong> the four alternativedesigns.• Extend the work on the schedule <strong>of</strong> materials for each building undertaken by theQuantity Surveyor to include the following categories; glass, aluminium, paint andfinishes, particleboard/fibreboard and insulation.• Undertake additional investigation by the Quantity Surveyor to provide a betterunderstanding <strong>of</strong> where environmental impacts are greatest.• Include the effects <strong>of</strong> building maintenance and refurbishment in the life cycleassessment.• Expand the LCA work to include a sensitivity analysis on the environmental impacts <strong>of</strong>the transport distances <strong>of</strong> wood and other materials used in the buildings• Expand the end-<strong>of</strong>-life aspect <strong>of</strong> the original LCA modelling work to investigate andreport on the effects <strong>of</strong> landfilling <strong>of</strong> demolition waste and the possibilities for both the
- 16 -recycling and use <strong>of</strong> demolition waste for the further displacement <strong>of</strong> fossil fuels – in thecase <strong>of</strong> wood, by burning waste materials.• Compare the New Zealand Green Star Office rating tool with LCA results to check forconsistency, and make recommendations as to possible improvements to the Office ratingtool.• Engage an accredited Green Star consultant to provide a review <strong>of</strong> the comparisonbetween LCA and Green Star.• Determine and report on the type <strong>of</strong> timber used in construction and maintenance <strong>of</strong> thefour building designs and the source <strong>of</strong> this timber, together with any applicablesustainable source certification.• Broadly determine the amount and level <strong>of</strong> treatment <strong>of</strong> timber used in the constructionand maintenance <strong>of</strong> the four building designs, with emphasis on the use <strong>of</strong> CCAtreatments.• Report on the current status for burning treated wood.3.2 Research TeamThe University <strong>of</strong> Canterbury (UC) was in a unique position to lead this research.• UC is at the forefront <strong>of</strong> research into innovative design <strong>of</strong> large-scale, multi-storeycommercial timber buildings.• Existing research (from March 2007) at UC mirrored the proposed MAF-fundedresearch.The University <strong>of</strong> Canterbury provided overall project management and engaged a number <strong>of</strong>other research establishments and specialist consultants to provide expert information andadvice.In order to fulfil the Research Objectives, the research was organised in a number <strong>of</strong> distinctsub-programmes (with main contributors shown);• Structural design <strong>of</strong> Timber, TimberPlus, Concrete and Steel buildings; UC andothers.• Architectural design <strong>of</strong> building; Victoria University <strong>of</strong> Wellington.• Assessment <strong>of</strong> quantities <strong>of</strong> materials in each building by Quantity Surveyor, DavisLangdon Shipston Davies <strong>of</strong> Christchurch.• Operational energy modelling and analysis <strong>of</strong> all four buildings; N. Perez, VUW.• Life cycle assessment (LCA) <strong>of</strong> alternative building designs; Scion.• Assessment and review <strong>of</strong> timber use in Timber buildings; Warren and Mahoney,Christchurch.3.3 Government Policies Supporting ResearchListed below is a summary <strong>of</strong> the government directives around sustainable buildingpractices. These directives have supported the growing interest (“push”) for moreinformation, consideration and action on construction <strong>of</strong> commercial and large-scale timberbuildings in New Zealand.
- 17 -• Ministry for the Environment (MfE) lead.In May 2007, the NZ Government Cabinet directed public service departmentsto adopt a minimum five star Green Star New Zealand rating for the construction<strong>of</strong> all new and refurbished A Grade commercial <strong>of</strong>fice buildings and a minimumfour star Green Star rating for B Grade commercial <strong>of</strong>fice buildings, as from1 July 2007 [CAB Min (07) 18/7 refers].In May 2007, NZ Cabinet directed public service departments to adopt theMinistry for the Environment Commissioning Guidelines for all newgovernment owned or leased buildings over 2000m 2 from 1 July 2007. Ministryfor the Environment website: http://www.mfe.govt.nz/publications/susdev/sustainable-government-buildings-jun07/.In September 2007 the NZ Government set a target that all new governmentbuildings meet a minimum five star Green Star New Zealand rating from 2012[CBC Min (07) 21/16 refers]. New Zealand Energy Efficiency and ConservationStrategy 2007, page 76. http://www.eeca.govt.nz/eeca-library/eecareports/neecs/report/nzeecs-07.pdf• Ministry <strong>of</strong> Economic Development lead.Public Service departments are required to ensure that the final disposal <strong>of</strong>construction and demolition timber is in line with the waste minimisationprinciples set out in the Resource and Efficiency in Building and RelatedIndustries (REBRI) guidelines. When entering into building or constructioncontracts that include the use <strong>of</strong> timber and wood products, ensure primecontractors and sub-contractors apply the REBRI guidelines to the buildingproject (eg, develop a site waste management plan and separate materials forrecycling).http://www.med.govt.nz/upload/51276/category-reviews.pdfPublic Service departments are required to ensure that wood products purchasedare made from timber that is legally sourced and take all reasonable steps toensure that this timber originates from sustainably-managed sources, inaccordance with the New Zealand Timber, Wood Products and PaperProcurement Policy.http://www.med.govt.nz/upload/51276/category-reviews.pdf• Ministry <strong>of</strong> Agriculture and Forestry lead.Until recently, there was also a requirement to have a build in wood designoption for government commercial buildings up to, and including, four floors.More information is available on the Ministry <strong>of</strong> Agriculture and Forestrywebsite: www.maf.govt.nz
- 18 -3.4 <strong>Multi</strong>-<strong>Storey</strong> Timber <strong>Buildings</strong>3.4.1 IntroductionTimber construction is ideally suited to multi-storey buildings because <strong>of</strong> its high strength-toweightratio. For areas where seismic design will govern or where foundation issues exist, thelight weight nature <strong>of</strong> a predominantly timber building means much lower earthquake loadsand lower foundation loads than for a reinforced concrete building, which can lead to a veryeconomical design.3.4.2 Forms <strong>of</strong> <strong>Multi</strong>-<strong>Storey</strong> ConstructionThe main categories <strong>of</strong> use are residential and commercial.<strong>Multi</strong>-storey residential buildings are characterised by a large number <strong>of</strong> separate rooms oneach floor, a large number <strong>of</strong> permanent walls, and relatively short-span floors supported onwalls. These buildings are usually light timber framing, although cross-laminated-timber isstarting to become popular in Europe. The large number <strong>of</strong> walls is useful for lateral loadresistance. Some <strong>of</strong> these are likely to be inter-tenancy walls with special requirements foracoustic properties and fire resistance. Most <strong>of</strong> the timber structure will be hidden from view,protected by gypsum plasterboard.<strong>Multi</strong>-storey commercial buildings are characterised by a large open spaces, with very fewwalls, and relatively long-span floors supported on beams and columns. The only permanentwalls may be those at the perimeter and around the lift shaft and stairwells. Timber beams andcolumns may be visible timber elements in the finished building.3.4.3 Typical StructureTypical structural form for multi-storey residential buildings consists <strong>of</strong> the followingelements:• The ro<strong>of</strong> is supported on timber purlins, timber rafters and timber ro<strong>of</strong> trusses.• The floor is wood-based panel on timber joists, either solid joists or proprietaryengineered joists. Alternatively, the floor may be a manufactured system utilisingjoists and plywood in stressed-skin panels, or timber-concrete composite floors.• The floors are supported on light timber frame walls, or timber beams.• The beams are supported on timber columns or walls.• Walls usually consist <strong>of</strong> light timber framing clad with plywood sheathing or gypsumplasterboard lining.• Other wall options are solid LVL walls or other timber products, such as Triboard orcross-laminated-timber.3.4.4 Material selection for multi-storey timber buildingsThe Journal Structural Engineering International (2008) provided the following introductionto an edition dedicated to Tall Timber <strong>Buildings</strong>;Timber has been a preferred construction material since the dawn <strong>of</strong> civilisation due toits natural abundance, high ratios <strong>of</strong> stiffness and strength to weight, and the ease with
- 19 -which it can be fashioned to shape. Over about the last decade, governmentallyimposed prescriptive regulations that define how buildings have to be designed andconstructed have begun to be replaced by performance based codes. New andevolving regulations directly address performance attributes <strong>of</strong> alternative combinations<strong>of</strong> materials, construction methods and building geometry. This proves especiallyliberating for designs employing timber because engineers are given the freedom toapply and derive benefits from advanced design technologies and to use modern timberconstruction products. In Britain, Italy and Switzerland, for example, six storey or tallertimber buildings are now accepted. In North America, four storeys is usual withoccasionally five or six storeys allowed by authorities with local jurisdiction. With thecorrect choice <strong>of</strong> building methods, 20 storey or taller timber buildings are technicallypossible. Ten storey timber buildings becoming quite common is a practical near termgoal. Researchers at various institutions in Europe, North America and Asia areperforming large scale tests and developing design concepts and methods necessaryfor that to become a reality.There is a wide range <strong>of</strong> structural systems available for multi-storey timber buildings. Most<strong>of</strong> these are in one <strong>of</strong> the following categories:• Historical timber buildings• Traditional heavy timber frame construction• Light timber frame construction• Cross laminated timber (CLT)• Post-tensioned timber frames and walls3.4.4.1 Historical Timber <strong>Buildings</strong>Timber has been used for many centuries for construction <strong>of</strong> traditional historical timberbuildings including multi-storey pagodas in Asia, stave churches in Scandinavia, andcombined timber and masonry building in many European cities.3.4.4.2 Traditional Heavy Timber Frames“Traditional heavy timber frame construction” describes buildings <strong>of</strong> large dimension beamsand columns connected together by timber or steel dowels, or steel or plywood gusset platesfor moment resistance. Such forms <strong>of</strong> construction are common in both historical and moderntimber buildings, especially in North America. The timber beams and columns may beGlulam, sawn timber, or rough members hewn from logs.3.4.4.3 Light Timber Frame“Light timber frame construction” is the most common form <strong>of</strong> multi-storey timber buildings,using small section sawn timber as wall studs and floor joists. Stud and joist sizes aretypically from 90x40mm up to 250x50mm or more. This construction is very popular inNorth America where it is <strong>of</strong>ten called “wood frame construction” or “two-by-fourconstruction”. Flooring and structural walls are usually clad with plywood or particle board.Internal walls are lined with gypsum plasterboard. Wall and floor cavities are <strong>of</strong>ten filled withlight weight insulating materials for thermal and acoustic performance.3.4.4.4 Cross Laminated TimberCross laminated timber (CLT) panels are rapidly becoming popular in Europe forprefabricated multi-storey timber buildings. CLT panels are large timber panels <strong>of</strong> solidwood, manufactured from layers <strong>of</strong> sawn timber boards in alternating directions (similar tothick plywood). The boards are glued or nailed or dowelled together to construct the panels.
- 20 -The boards are usually about 90x20mm size, in panels which may be from five layers thick upto ten layers thick (100-200mm panel thickness). The panels can be used for all the walls andfloors <strong>of</strong> large buildings. Room sizes are small because all the walls are structural walls andfloor spans are limited.3.4.4.5 Post-tensioned Timber Frames and WallsA new form <strong>of</strong> multi-storey timber construction being developed in New Zealand, based onrecent developments in reinforced concrete construction for seismic areas, uses post-tensionedtimber frames and walls. For further information see Section 4.4, <strong>Multi</strong>-storey TimberBuilding Research.3.4.5 Height Limits for <strong>Multi</strong>-<strong>Storey</strong> ConstructionHeight limits considering the gravity load resisting structure are as follows (see the TimberDesign Guide, Buchanan, A., 2008):• The upper limit for light timber framing for gravity structures is in the order <strong>of</strong> 5 to 8storeys, depending on the configuration <strong>of</strong> the building.• The upper limit for LVL post and beam gravity systems could be in the order <strong>of</strong> 15 to25 storeys, depending on the configuration <strong>of</strong> the building.• The economically competitive span limit <strong>of</strong> timber floor construction utilisingengineered wood products is likely to be around 8 or 9 metres. Typically, spans <strong>of</strong>around 6 metres are generally the maximum used in practice with engineered woodproducts and other systems available at present.Height limits considering the lateral load resisting structure are as follows:• The upper limit for plywood shear walls is in the order <strong>of</strong> 5 to 8 storeys, depending onthe configuration <strong>of</strong> the building.• The upper limit for solid LVL shear walls is untested and is the subject <strong>of</strong> research atpresent, however they would be expected to exceed the capacity <strong>of</strong> plywood shearwalls by a considerable margin.• The upper limit for timber moment resisting frames is likely to be in the order <strong>of</strong> 5 to10 storeys, depending on the configuration <strong>of</strong> the building.• The upper limit for plywood floor diaphragms will be driven by the capacity <strong>of</strong> nailedconnections from the plywood to the framing. The loads imposed by seismic flooraccelerations are likely to exceed nail capacities at about 15 to 25 storeys, dependingon building configuration. Site glued connections would allow the possibility <strong>of</strong> higherbuildings however the issue <strong>of</strong> glue durability and the suitability for site applicationmay render a structural site glued option impractical.• The upper limit for using gypsum plasterboard bracing systems is likely to be around 4storeys, depending on the configuration <strong>of</strong> the building.Hybrid structures are possible with a combination <strong>of</strong> timber gravity load resisting structureand steel and/or concrete lateral load resisting structure. With this combination <strong>of</strong> materials,a predominantly timber building could be designed and constructed which would be limited inheight only by the capacity <strong>of</strong> the timber gravity load resisting system and the floordiaphragm system, i.e. 15 to 25 storeys.
- 21 -For fire safety, the New Zealand Building Code does not limit the height <strong>of</strong> timber buildings.With proper attention to design and detailing, timber buildings can be as safe as buildings <strong>of</strong>other materials, so fire safety will not limit the possible height.3.4.6 ReferencesFor further information, refer to the following publications:<strong>Multi</strong>-<strong>Storey</strong> Timber <strong>Buildings</strong> Manual, by Graeme Beattie, BRANZ. Published by CHH,FCF, JHBP, & WWB. 2001.<strong>Multi</strong>-<strong>Storey</strong> Timber Frame <strong>Buildings</strong>; a Design Guide, by R. Grantham and V. Enjily.BRE/TRADA, UK.Feasibility <strong>of</strong> Low-Rise Timber Commercial <strong>Buildings</strong>. Research Report 91-3, Department <strong>of</strong>Civil Engineering, University <strong>of</strong> Canterbury. 1991.The Seismic Design and Behaviour <strong>of</strong> <strong>Multi</strong>-storey Plywood Sheathed Timber FramedShearwalls. Ph.D. Thesis, University <strong>of</strong> Canterbury. 1996.The Timber Design Guide. Third Edition 2008. Edited by Pr<strong>of</strong>essor A. Buchanan, University<strong>of</strong> Canterbury. New Zealand Timber Industry Federation Inc.3.5 Structural Timber Innovation Company3.5.1 New Research ConsortiumThis research document is based on the design <strong>of</strong> innovative, multi-storey Timber buildingsThe development <strong>of</strong> these buildings from the under-pinning engineering, through to design,enhanced timber technology, fabrication and construction is already being researched.However, with the recent approval for the funding <strong>of</strong> a multi-million-dollar ResearchConsortium - being co-funded by the NZ Government and industry for an initial period <strong>of</strong> fiveyears - a new level <strong>of</strong> research and market-driven commercialisation commenced in August2008 with the formation <strong>of</strong> the Structural Timber Innovation Company Ltd. (STIC).The largest investor in STIC is the NZ Government, through the Foundation for ResearchScience and Technology (FRST), providing 1:1 matching funding with industry. Thefounding shareholders are Carter Holt Harvey, Nelson Pine Industries, Wesbeam (Australia),NZ Pine Manufacturer’s Association, Building Research <strong>of</strong> NZ, University <strong>of</strong> Auckland andthe University <strong>of</strong> Canterbury. In addition, Forest and Wood Products (Australia) is a majorcontributor under a Service Agreement.The company is overseen by a Board <strong>of</strong> Directors, and managed by a CEO. The research isdirected by Pr<strong>of</strong>essor Andy Buchanan from the University <strong>of</strong> Canterbury. ACommercialisation Committee <strong>of</strong> shareholder representatives drives market acceptance andcommercialisation <strong>of</strong> the research findings.The company has major research contracts with the University <strong>of</strong> Auckland, the University <strong>of</strong>Canterbury, University <strong>of</strong> Technology, Sydney and BRANZ Ltd. It also collaborates with the
- 22 -University <strong>of</strong> Sassari and the Technical University <strong>of</strong> Milan, in Italy, and other overseasuniversities and research establishments as appropriate.3.5.2 VisionThe central focussing question which has driven the formation <strong>of</strong> STIC is;How can New Zealand create new markets both nationally and internationally forinnovative timber building systems, which will allow cost-effective construction <strong>of</strong>attractive, flexible and durable buildings, with reduced construction time and much lowerenvironmental impacts than traditional construction ?STIC is driving the development <strong>of</strong> innovative large-span timber buildings for a wide range <strong>of</strong>uses in New Zealand, Australia and other export markets. Primary applications includecommercial, educational, industrial, recreational and residential buildings.These buildings will have their main structural members manufactured from high qualityengineered timber components including Glulam and LVL (laminated veneer lumber). Thebuildings will be from single storey to six storeys or more.Compared with buildings from traditional materials, these new buildings will be:• More attractive and more desirable places to live and work.• Lower in weight, with easier transportation <strong>of</strong> components and less expensivefoundations.• Less expensive to construct through good design and extensive prefabrication.• Easier to heat and cool with better acoustic performance.• More resistant to major earthquakes and extreme weather events.• Safer in fire and other emergencies.• Less energy-intensive in the manufacture <strong>of</strong> materials and life-time use, resulting in lowerCO 2 emissions, helping to meet government’s objectives <strong>of</strong> carbon neutrality.• Less wasteful <strong>of</strong> materials, with lower environmental emissions during construction andre-use.3.5.33.5.4 STIC ObjectivesThe Structural Timber Innovation Company (STIC) has created a step change in NewZealand’s wood manufacturing and construction industries. It is enhancing the internationalcompetitiveness <strong>of</strong> the wood manufacturing sector and developing innovative solutions forconstruction <strong>of</strong> timber buildings world-wide.STIC targets sustainable construction, developing new building solutions which greatlyreduce environmental impacts. It is developing a wide range <strong>of</strong> new, high-value structuralproducts, and is adding value to lower grade wood products that are part <strong>of</strong> the totalconstruction package.STIC is developing, commercialising and facilitating new structural timber solutions for NewZealand and Australia followed by the United States and other export markets. Developmenthas started with large-span, single-storey buildings, moving on to two to six storey open plan
- 23 -buildings for low seismic areas, then similar or taller buildings for high seismic or high windareas.STIC is producing comprehensive design guides for designers, regulators, manufacturers andbuilders. Delivery <strong>of</strong> the new building systems is supported by strong relationships withfabricators and construction companies in local and international markets. <strong>Buildings</strong> areconstructed from prefabricated components, including beams, columns, frames, floors, walls,partitions and cladding panels, manufactured from sawn timber, glue laminated timber(Glulam), laminated veneer lumber (LVL), and wood-based panel products.3.5.5 Scope <strong>of</strong> Research and DevelopmentThe scope <strong>of</strong> the STIC project is very large. Some <strong>of</strong> the major points are:• The new form <strong>of</strong> building construction uses large prefabricated timber building elements inarrangements only previously built with concrete or steel.• This is leading to an innovative change in the New Zealand construction industry, which istraditionally a cautious and conservative industry.• Large scale prefabricated and post-tensioned timber construction mirror recentdevelopments in reinforced concrete construction.• The new construction is possible because Glulam (glued laminated timber) and LVL(laminated veneer lumber) have changed radiata pine from a commodity to an engineeringmaterial.• Design guides, s<strong>of</strong>tware and other support tools are an essential part <strong>of</strong> the programme.• A provisional patent has been sought for several aspects <strong>of</strong> this new construction system.• Overseas help will be needed to develop export markets.• This new form <strong>of</strong> construction provides a sustainable building option which will make amajor contribution to meeting the New Zealand government’s objective <strong>of</strong> carbonneutrality.• A wide range <strong>of</strong> topics is being addressed, including structural engineering, architecture,sustainability, construction and cost, fire safety, acoustic performance, and durability.• The modular system concept for large prefabricated timber buildings will result in a newtimber fabrication industry, manufacturing new building products for domestic and exportmarkets.Medium term goal - multi-storey commercial and residential buildings
- 24 -3.5.6 Market DriversThe market drivers pushing development <strong>of</strong> the new buildings include:1. Strong international demand for low to medium-rise residential and commercialbuildings as a result <strong>of</strong> demographic changes.2. Demand for sustainable buildings, renewable materials and reduced CO 2 emissions.3. Stated government objectives for carbon neutrality in the building industry and widereconomy.4. Industry demand for prefabrication and integrated construction <strong>of</strong> long-span buildings.5. Increasing importance <strong>of</strong> rapid reparability and re-use after extreme seismic andweather events.3.5.7 ObjectivesThe following is a summary <strong>of</strong> the research objectives to be carried out by STIC;Objective 1 - Single storey timber ro<strong>of</strong>s and portal frames – 30-40m span.• New long span ro<strong>of</strong> and portal frame systems.• Design <strong>of</strong> fasteners for large static and dynamic loads.• Connections – develop new portal frame knee joints.Objective 2 – Timber floors for multi-storey timber buildings.• Floor systems and construction.• Structural performance <strong>of</strong> floors.• Fire resistance.• Acoustic and vibration performance.• Long term performance.Objective 3 - <strong>Multi</strong>-storey pre-stressed timber walls and frames.• Structural form and construction.• Structural frames to resist gravity loads.• Fire resistance.• Long term performance.• Structural frames and walls for seismic loads and extreme wind loads.• Energy use and sustainability.
- 25 -4 The <strong>Buildings</strong>4.1 Construction Materials for Commercial <strong>Buildings</strong>Most commercial buildings tend to make extensive use <strong>of</strong> steel, glass, and concrete materialsin construction, all <strong>of</strong> which can be energy-intensive to produce, via processes that have thepotential to cause adverse environmental impacts and utilising resources that are in shorteningsupply.However, recent developments in wood technology and engineered timber products, seismicand acoustic design, fabrication and construction techniques have enabled timber to beutilised much more extensively for the basic structure <strong>of</strong> medium-rise, multi-storey buildings,such as a typical ‘down-town’ <strong>of</strong>fice block.While there is a tendency for commercial buildings to be labelled according to the mainmaterial used for their sub-structure and super-structure, the vast majority <strong>of</strong> buildings use alarge number <strong>of</strong> different materials, from a variety <strong>of</strong> sources, both national and international.From a materials perspective, a building becomes a very complex system and it is <strong>of</strong>ten notimmediately clear which materials or combinations <strong>of</strong> materials provide the bestenvironmental performance (in terms <strong>of</strong> life–cycle energy use and GWP, for example). Whileconscious <strong>of</strong> these limitations, this report will retain this labelling system as it is currentpractice.Studies have indicated that typically structural components account for between 16 and 65per cent <strong>of</strong> initial embodied energy (Aye, Bamford, Charters, & Robinson, 1999; Cole &Kernan, 1996; Oppenheim & Treloar, 1995; Treloar, Fay, Ilozor, & Love, 2001). Hence,when considering the environmental impacts <strong>of</strong> building materials, the structural componentsused in a building are <strong>of</strong> significant importance.This report emphasises alternative structural design options where the predominant structuralmaterial is either concrete, steel or timber.4.2 Building DesignThere are two main aspects in the design <strong>of</strong> a multi-storey building. The structural designconsiders all the main structural components - the skeleton - including the foundation, thebeams, columns, external walls, as well as the internal flooring system and ro<strong>of</strong> structure.The architectural design provides the external cladding including windows and louvres,internal walls, insulation, etc.. In some areas, the distinction between structural andarchitectural design is not clear cut and there can be considerable overlap; changes to thestructure <strong>of</strong>ten enforce changes to the architecture and visa versa meaning any final design istherefore the result <strong>of</strong> an iterative, developmental design process.The design <strong>of</strong> the four case study buildings covered by this report was the combined output <strong>of</strong>structural engineers and architects, working together.The case study buildings analysed in this research are based on an actual building, a new sixstorey,4,247 m 2 (gross floor area) (3,536 m 2 net usable area), science laboratory for the
- 26 -School <strong>of</strong> Biological Sciences at the University <strong>of</strong> Canterbury in Christchurch. It wasdesigned by local Christchurch architects (Courtney Architects) and structural engineers(Cusiel Lovell-Smith) with conventional pre-cast reinforced concrete as the main material forthe structure, envelope walls, floors and ro<strong>of</strong> slabs. This building - currently underconstruction – will be linked by an atrium to the present Zoology building at the University.Figure 4.1: Perspective view <strong>of</strong> the new Biological Sciences laboratory at the School <strong>of</strong> Biological Sciences,University <strong>of</strong> Canterbury.4.3 General Design ConceptsThe above building design was modified to provide a simplified template for the development<strong>of</strong> the four alternative case study buildings covered by this report.Each case study was designed as a stand-alone building, keeping the same original orientationbut removed from the adjoining Zoology building and redesigned internally as a commercial<strong>of</strong>fice building. All new case studies are based on the same simplified template as that <strong>of</strong> theoriginal laboratory building, as shown in Figure 4.2, where the stand-alone laboratorybuilding in plan view (left hand) is compared with the concrete case study building (righthand) used in this research. The part <strong>of</strong> the atrium which contains the stairs, lift, bathroomsand corridors remains attached to the simplified template building. The six storey building isapproximately 36 metres by 20 metres in plan with one stair and one elevatorAll four buildings are designed as the same simple commercial (<strong>of</strong>fice type) building withopen plan floor spaces rather than the complex laboratory layout <strong>of</strong> the actual building butretain the ‘plant / riser ducts’ (two enclosed void areas closed to the south façade). Each ductis approximately eight meters by four meters and the length <strong>of</strong> these is placed transversally to
- 27 -the building. The basement level <strong>of</strong> the structure present in the original laboratory design wasremoved for the new design and therefore the foundation level was altered to accommodatethis changeThe building structure has been designed for the Christchurch region, in what can beconsidered to be a moderate seismic zone. The foundations are in reasonably goodconditions, considered to be a shallow soil. For all structural design, the current New Zealanddesign codes have been used. Where these have not been adequate, particularly in the case <strong>of</strong>the timber buildings, other relevant international codes have been utilised.The structure has two distinct seismic systems in order to resist loading in the north-south andeast-west directions. In the long (E-W) direction, a moment resisting frame is used; in theshort (N-S) direction, walls are used.4.3.1 Four Alternative <strong>Buildings</strong> – DescriptionThe template building was used to produce architectural and structural drawings for fouralternative case studies in which the structures and finishes are predominantly either concreteor steel or timber.The four case study buildings were designated:Concrete building – pre-cast reinforced concrete exposed in structural frames and shear walls,with the same external fibre-cement cladding as the actual Biological Sciencesbuilding in the light weight walls in South façade..Steel building – all the main structural components are steel, with the use <strong>of</strong> EccentricallyBraced Frames (EBF) resisting lateral loading in both (short and long) directions.Framing and cladding are steel.Timber building – the main structural components are prefabricated laminated veneer lumber(LVL 1 ) columns and beams, the east and west walls are prefabricated solid LVL1 Structural Laminated Veneer Lumber (LVL) manufactured to AS/NZS 4357.0 Structural Laminated VeneerLumber is an assembly <strong>of</strong> veneers laminated with a Type A phenolic resin. The grain direction <strong>of</strong> the outerveneers and <strong>of</strong> most or all <strong>of</strong> the inner veneers is in the longitudinal direction. LVL is suitable for use in allpermanent structural applications and it has a wide variety <strong>of</strong> uses including beams and columns, truss chords, I-beam flanges, scaffold planks, concrete formwork supports and supports for structural decking.Although the Type A bond is durable and permanent under conditions <strong>of</strong> full weather exposure, long termstress, and combinations <strong>of</strong> exposure and stress, the timber species may not be durable when used in weatherexposed situations. In exposed applications, structural LVL must be preservative treated to ensure it lasts its fullservice life and surface finished to minimise surface checking.The design properties <strong>of</strong> structural LVL as well as product dimensions are published by the individualmanufacturers. LVL dimensions vary between manufacturers, however manufactured billets are nominally 1200mm wide and in standard thicknesses <strong>of</strong> 35 or 36, 39, 45, and 63 mm. Other thicknesses are available from somemanufacturers. The 1200 mm wide billet is ripped into standard beam depths and includes beam depths <strong>of</strong> 1200mm deep.The veneer grades for LVL are controlled by the manufacturing specification <strong>of</strong> each individualLVL manufacturer.LVL is manufactured under a rigorous product quality control and product certification scheme. This ensures anengineered product <strong>of</strong> known and consistent physical and mechanical properties.
- 28 -members, floors are timber / concrete composite and the external cladding is fibrecement.TimberPlus building – as for the Timber building above but with greatly increased use <strong>of</strong>timber throughout including timber external cladding and cedar windows andlouvres, solid timber internal walls, timber ceilings and other features whichmaximise the use <strong>of</strong> timber throughout the building.• The Concrete building design is very similar to that provided by Courtney Architects.• The preliminary Steel building design was provided by Steel Construction NewZealand Limited and modified by structural engineers from Holmes Construction andthe University <strong>of</strong> Canterbury, with architectural design by Victoria University <strong>of</strong>Wellington (VUW).• The Timber and TimberPlus designs were produced by engineers at the University <strong>of</strong>Canterbury, with architectural design by Victoria University <strong>of</strong> Wellington (VUW).In each design, the objective was to use as much <strong>of</strong> the target material as reasonably possible,both in structures and finishes. However, to standardise - and adhere to “good NZ designpractice”- for the Concrete, Steel and Timber designs, many interior and exterior finishes areas commonly found in typical NZ multi-storey buildings and similar in each design. Forexample, windows, curtain walls in the north and south façade, sun louvres in the northfaçade, ro<strong>of</strong> cladding and internal finishes such as most <strong>of</strong> the linings and ceilings are thesame.The TimberPlus building was designed so that all possible ‘common finishes’ <strong>of</strong> the Timberbuilding were replaced by timber components.Figure 4.2: Plan <strong>of</strong> the simplified layout used in the concrete, steel, timber and TimberPlus buildings.
- 29 -4.3.2 Common Design PrinciplesMany design features are common to the Concrete, Steel and Timber buildings and these aredescribed below. Indeed, many design features are also common to the TimberPlus building;however, there are also important differences to note, particularly in the architecture. Wherethe TimberPlus building has notable differences, these will be described.In all four case studies the building's envelope walls are the same at the east and west endsand different on the north and south faces. For the Concrete, Steel and Timber buildings, thenorth facade construction is the same with a curtain wall made <strong>of</strong> double glass windowsframed in aluminium mullions and transoms. The aluminium louvres outside the curtain wallcover all the façade from the first floor up to the ro<strong>of</strong> ‘s<strong>of</strong>fit’. (The ground floor has glazedwalls and doors as a commercial building, see figure 4.4).For all case studies, the east and west façades are solid walls (but different materials) withonly two narrow windows, one vertical (south corner) and one horizontal window centred inthe façade. The south side <strong>of</strong> the building has an external corridor that connects the <strong>of</strong>ficeswith the stairs, lift and toilets service area (see figures 4.2 and 4.5). Corridors are enclosedbetween a light wall (south façade <strong>of</strong> internal <strong>of</strong>fices) and a single glass aluminium framedcurtain wall (south facade <strong>of</strong> building) (the TimberPlus building has cedar window frames).The south façade curtain wall is the same for the Concrete, Steel and Timber buildings.The foundation level <strong>of</strong> the original building was altered from the original design <strong>of</strong> theconcrete structure, removing the basement, meaning that a re-design <strong>of</strong> the originalfoundation level was required.It was assumed for design purposes that the building is situated on a moderately strong soil.For the Timber building, beam foundations are placed under both the seismic frame and walls,with pad foundations under the four central gravity columns (Figure 4.3). This layout was alsoused for the Concrete building; however a slight increase in the capacity <strong>of</strong> the foundationswas necessary. For costing analysis, the foundations for the Steel building were considered tobe the similar to that <strong>of</strong> the Timber building due to the similar masses <strong>of</strong> the structures.However, after consultation with Holmes Consulting Ltd a 15% increase was added due to theconsiderable uplift forces applied by the eccentrically braced frames.Pad foundationsBeam foundationsFigure 4.3: Foundation layout for timber building
- 30 -Calculations <strong>of</strong> the foundation size for the Timber and Concrete building showed that the size<strong>of</strong> the foundations required is comparable. This is unexpected due to the lightness <strong>of</strong> theTimber building intuitively leading to a reduction in foundation size. However, the foundationsize was principally governed by the overturning moment applied by vertical members duringa seismic event, and not gravity loading. It can be expected that a significant reduction infoundations between the Timber and Concrete structures will occur if a building is gravitydominated or is situated in s<strong>of</strong>t soil.Figure 4.4: North-east façades perspective view <strong>of</strong> the simplified Concrete building, north façade.The north-east perspective view <strong>of</strong> the Concrete building in Figure 4.4, is also representative<strong>of</strong> the Steel, Timber and TimberPlus buildings. The overall architectural design is the same inall four buildings but built in different materials and using different building techniques.In Figure 4.4, it is possible to identify the layout <strong>of</strong> the north face curtain wall behind theparallel louvres. The seven structural columns from floor to ro<strong>of</strong> slab are visible. The eastface wall is the same as the west face wall and it is possible to see the stair well coming out <strong>of</strong>the service area in the south end <strong>of</strong> the east face wall.The stepped shape <strong>of</strong> the ro<strong>of</strong> is due to the plant room which increases the ro<strong>of</strong> height on thesouth side <strong>of</strong> the ro<strong>of</strong>. Inside the plant room, chimneys exhaust the air from the <strong>of</strong>fices whenthese are being naturally ventilated. The ro<strong>of</strong>-top plant room in the Concrete, Steel andTimber case studies is designed to have a combination <strong>of</strong> pr<strong>of</strong>iled metal cladding andaluminium opening louvres to the walls. Offices have opening vents which will allow heat tobe purged into the chimneys when not required and from these to the plant room whereopening louvres will exhaust the air to the exterior <strong>of</strong> the building. The TimberPlus buildingreplaces the metal cladding and aluminium louvres with cedar timber components.
- 31 -Figure 4.5: South-west façades perspective view <strong>of</strong> the simplified Concrete building.Figure 4.5, the south-west perspective <strong>of</strong> the Concrete building, shows the corridors throughthe south face single glass curtain wall. These connect the service areas in the east end witheach <strong>of</strong> the three internal <strong>of</strong>fices areas. The service area envelope wall is reinforced concretewith steel sheets pr<strong>of</strong>iles as ro<strong>of</strong> cladding. The west face envelope wall returns into the southface and runs inside the corridors enclosing the <strong>of</strong>fice areas.The following descriptions are an overview <strong>of</strong> each alternative building design. Note that theoverall structure has been maintained in all four case studies but some changes werenecessary as noted.4.3.3 Concrete Building4.3.3.1 Structural SystemThe Concrete building is a conventional pre-cast reinforced concrete column, beam and wallstructure. The building is raised floor-by-floor with concrete shear walls at each end <strong>of</strong> thebuilding. Rectangular columns and beams form a frame on the north and south faces. Internalbeams are supported on one internal row <strong>of</strong> columns spanning approximately 12 metres to thenorth edge and 6 metres to the south edge. These support the long span pre-cast floor units.4.3.3.2 Floors and Ro<strong>of</strong>The floors are pre-cast ‘hollowcore’ floor slabs supported by the frame beams. The thickness<strong>of</strong> the hollowcore slabs ranges from 200-30 mm with a 75 mm reinforced concrete topping.Two openings for the vertical chimneys are left in all floors. The ro<strong>of</strong> is formed using thesame pre-cast units as the upper floors complete with topping system. Over this structure, a
- 32 -lightweight timber and steel framed ro<strong>of</strong> is built with metal ro<strong>of</strong>ing. The plant room ro<strong>of</strong> isconstructed in timber and steel frame and is clad in the same material as the main ro<strong>of</strong>.4.3.3.3 Structural WallsThe east wall, west wall and part <strong>of</strong> the south façade are a 310 mm thick “Thermomass” wall;a composite wall with 60 mm concrete on the exterior, 50 mm <strong>of</strong> extruded polyurethaneinsulation in the core, and 200 mm <strong>of</strong> exposed reinforced concrete to the interior <strong>of</strong> thebuilding. The service area walls are 200 mm reinforced concrete walls.4.3.3.4 Internal PartitionsThe light weight walls on the south face <strong>of</strong> the <strong>of</strong>fices and the walls to the ventilationchimneys are timber framed containing 90 mm thick fibreglass insulation and a 25 mm aircavity for the exterior walls. Internally, the timber framed walls are lined with gypsumplasterboard. Acoustic insulation is required between partitions <strong>of</strong> the main body <strong>of</strong> <strong>of</strong>fices.Generally, a plaster acoustic tiled ceiling is used in all <strong>of</strong>fice areas. The solid concreteexposed walls have a clear sealer applied; plasterboard walls have paint finish and all pre-castconcrete walls have an external finish.4.3.4 Steel BuildingFigure 4.6 shows the north-east and south-west perspective views <strong>of</strong> the Steel building.The structure <strong>of</strong> the Steel building consists <strong>of</strong> a concrete foundation supporting steel beamsand columns. Both internal and external walls are non-structural elements, being light weightsteel stud walls supported between floors. This is the only design in which the east and westend envelope walls are not part <strong>of</strong> the structural system.Figure 4.6: Steel building, north-east and south-west perspective views.Both curtain walls in the north and south façade are the same as in the Concrete and Timberbuildings.4.3.4.1 Structural SystemThe Steel building is a column and beam steel structure braced by eccentrically braced frames(EBF). Figure 4.7 (one <strong>of</strong> the drawings provided by Steel Construction New Zealand (Xiao &Fussell, pers. comm.)) sketches the proposed layout <strong>of</strong> the recommended steel structure forthe simplified Steel building. There are three frames <strong>of</strong> columns and beams running along thebuilding, one at each long edge and one internal frame. Transverse secondary beams connect
- 33 -the three longitudinal frames. The floors are braced by Eccentrically Braced Frames (EBF).There are two frames in the longitudinal direction located at the perimeter <strong>of</strong> the building.There are four frames in the transverse direction inside the building, located beside thechimney voids.Figure 4.7: Sketches <strong>of</strong> the layout <strong>of</strong> Steel building structure (right) compared with the layout <strong>of</strong> the actuallaboratory concrete structure (left).4.3.4.2 Floor and Ro<strong>of</strong>The floors and ro<strong>of</strong> slab use the Comfloor system, where a 0.9 mm corrugated galvanizedsteel sheet supported by the structural beams, is topped by 150 mm <strong>of</strong> reinforced concretewith a total floor depth (floor plus beam) <strong>of</strong> typically 610 mm. The ro<strong>of</strong> slab is formed usingthe same Comflor system complete with concrete topping and a 75 mm thick fibreglassinsulation layer below the steel deck. Over this structure a steel framed ro<strong>of</strong> is built withmetal ro<strong>of</strong>ing. The ro<strong>of</strong> plant room is constructed in steel frame and is clad in the samematerial as the ro<strong>of</strong> (Xiao & Fussell, pers. comm.)4.3.4.3 Structural WallsThe envelope walls at each end <strong>of</strong> the building and around the service shaft have beenassumed to be non-structural elements. Walls on the east and south faces are supportedbetween floors slabs, so that the heavy steel structure is exposed inside the building, andhence not able to act as a thermal bridge. The envelope walls in the east, west and southfacades (enclosing the main body <strong>of</strong> <strong>of</strong>fices) are framed in lightweight cold rolled galvanizedsteel studs and contain 90 mm fibreglass insulation. These have a 30 mm air cavity forventilation and the cladding is painted steel sheet pr<strong>of</strong>ile.4.3.4.4 Internal PartitionsInternal partitions are framed in lightweight galvanized steel studs with gypsum board liningmaterials, and they contain 90 mm fibreglass insulation. Acoustic insulation is requiredbetween partitions <strong>of</strong> the main body <strong>of</strong> <strong>of</strong>fices. Generally, a plaster acoustic tiled ceiling isused in all <strong>of</strong>fice areas and all plasterboard is painted.
- 34 -The integrity <strong>of</strong> the steel building design has been carefully checked and scrutinized bypr<strong>of</strong>essional engineers at Holmes Consulting Group in Christchurch. A letter, included inAppendix F, summarises the design and recommends that the foundation structures beincreased in mass by 15% but otherwise confirms that the design is structurally sound andacceptable within normal NZ design standards for steel multi-storey buildings.4.3.5 Timber and TimberPlus <strong>Buildings</strong>4.3.5.1 Structural SystemThe Timber and TimberPlus buildings are constructed from a new post tensioned structuraltimber system being developed at the University <strong>of</strong> Canterbury (Buchanan, Deam,Fragiacomo, Pampanin, & Palermo, 2008; Paleremo, Pampanin, Fragiacomo, Buchanan, &Deam, 2006; Smith, Pampanin, Fragiacomo, & Buchanan, 2008).The structural timber columns, beams and shear walls are prefabricated from laminatedveneer lumber (LVL) and assembled on site with post-tensioned connections. The beams,columns and walls are fabricated from multiple layers <strong>of</strong> 63 mm LVL glued together intolarge prefabricated components. Most beams and columns are approximately 400 X 600 mmin cross section.Earthquake and wind resistance are provided by moment-resisting frames in the longitudinaldirection and cantilever shear walls in the transverse direction. The moment-resisting frameshave post-tensioned beams supported between continuous solid timber columns which are notpost-tensioned. The cantilever shear walls have vertical post-tensioning tendons and someyielding steel bars as energy dissipaters at the base.Figure 4.8 shows a structural slice through one floor <strong>of</strong> the Timber and TimberPlus building(both being the same). The columns in the north and south frames and in the centre row canbe clearly seen. The centre columns sit on the long edges <strong>of</strong> the voids. Structural shear wallsare visible in the east and west faces and also the module <strong>of</strong> the prefabricated floor system.Light-weight timber framed walls are placed between the structural shear walls. All thecolumns are located in the same position and have similar sizes to the columns in theConcrete building.Figure 4.8: Structural slice through one floor <strong>of</strong> the timber and TimberPlus building.
- 35 -4.3.5.2 Floor and Ro<strong>of</strong>The structural system which supports the flooring has been altered slightly from that <strong>of</strong> theConcrete building, in order to reduce the maximum span from 12 metres to 9 metres, asshown in Figure 4.8. The upper floors and the ro<strong>of</strong> slabs are timber-concrete composite slabsbuilt using prefabricated structural LVL and plywood decking supported on four internalstructural timber (LVL) gravity beams and the end walls. The plywood decking supports a 60mm thick reinforced concrete composite topping, fixed to the LVL joists by notches andembedded coach screws. The ro<strong>of</strong> slab contains a 75 mm thick fibreglass layer.4.3.5.3 Envelope WallsThe solid, structural LVL envelope walls are designed as coupled rocking walls. They arelocated within the east and west envelope walls, so must be considered as potential thermalbridges. The envelope walls (structural walls or light weight walls) have a 25 mm air cavityfor ventilation under the exterior cladding sheet.4.3.5.4 Internal PartitionsThe light weight envelope walls and the internal partitions are framed in timber studs with 90mm fibreglass insulation and gypsum board internal linings.4.3.5.5 Timber Building FinishesFigure 4.9 shows the north-east and south-west façade perspective view <strong>of</strong> the Timberbuilding. The north and south curtain walls, external louvres in north façade, ro<strong>of</strong> and plantroom claddings and windows in the east and west façade are the same as in the Concrete andSteel buildings.Figure 4.9: Timber building, North-east and South-west perspective views.The light weight envelope walls in the east, west and south façades (including service areaenvelope walls) are framed in timber studs with 90 mm fibreglass insulation. These wallshave a 25 mm air cavity for ventilation built with 25 mm timber battens under fibre cementsheets used as external cladding. Internal finishes are timber framed walls lined with gypsumboard plasterboard. Acoustic insulation is required between partitions <strong>of</strong> the main body <strong>of</strong><strong>of</strong>fices. Generally, a plaster acoustic tiled ceiling is used in all <strong>of</strong>fice areas.4.3.5.6 TimberPlus Building FinishesIn the TimberPlus building, all possible ‘common finishes’ <strong>of</strong> the Timber building werereplaced by timber components in order to maximise the use <strong>of</strong> wood. Figure 4.10 shows thenorth-east and south-west perspective views <strong>of</strong> the TimberPlus building.
- 36 -In the TimberPlus building all aluminium windows frames were replaced by timber (CanadianWestern Red Cedar) frames and composite aluminium-cedar frames in the case <strong>of</strong> the openingwindows. Timber louvres in the north facade are another important replacement with theoriginal aluminium louvres replaced by cedar louvres supported in a cedar structure with steelconnections (cedar was used also for mullions and transoms and in all parallel louvres outsidethe curtain wall). Louvres outside the north façade cover the same area as in the Concrete,Steel and Timber buildings and are supported in a cedar timber structure.The light weight envelope walls in the east, west and south façade (including service areaenvelope walls) are framed in timber studs with 90 mm fibreglass insulation. These wallshave a 25 mm air cavity for ventilation built with 25 mm timber battens under Pinus radiatapine weatherboards (www.timber.net.au/flatline). Internal linings are medium densityfibreboard (MDF), painted for service and corridor areas and solid finger jointed timberboards inside the <strong>of</strong>fices. The partitions between the main <strong>of</strong>fices are solid timber walls made<strong>of</strong> five solid timber layers <strong>of</strong> Pinus radiata with a final thickness <strong>of</strong> 105 mm. MDF panelswith a decorative hardwood veneer are used for ceilings in all <strong>of</strong>fice areas.Figure 4.10: TimberPlus building, North-east and South-west perspective views.Figure 4.11 shows an interior view <strong>of</strong> the two different types <strong>of</strong> finish materials used in the<strong>of</strong>fice buildings. The top image represents the very common type <strong>of</strong> <strong>of</strong>fice interior finishesused in the Concrete, Steel and Timber buildings. The bottom image shows the internal view<strong>of</strong> an <strong>of</strong>fice in the TimberPlus building. Carpet was applied to both types <strong>of</strong> finishes but canbe potentially replaced by timber flooring (Parquet) in the TimberPlus building. Theseimages graphically demonstrate ‘common practice’ finishes and the variation <strong>of</strong> this usingtimber in the case <strong>of</strong> the TimberPlus lower image.Figure 4.11: ‘Common finishes’ <strong>of</strong> the concrete, steel and timber buildings, compared with the internalfinishes <strong>of</strong> the TimberPlus building.
- 37 -4.4 <strong>Multi</strong>-<strong>Storey</strong> Timber Building ResearchThis section gives a summary <strong>of</strong> recent research and development <strong>of</strong> a new system forconstruction <strong>of</strong> multi-storey pre-stressed timber buildings in New Zealand. The systempresents opportunities for much greater use <strong>of</strong> timber and engineered wood products in largebuildings, using innovative technologies for creating high quality buildings with large openspaces, excellent living and working environments, and resistance to hazards such asearthquakes, fires and extreme weather eventsWhilst none <strong>of</strong> these timber multi-storey buildings have yet been constructed, the researchprogramme is proceeding rapidly, in close collaboration with industry and governmentfunding agencies.4.4.1 New Forms <strong>of</strong> Timber ConstructionNew forms <strong>of</strong> pre-stressed timber construction being developed at the University <strong>of</strong>Canterbury, New Zealand, have the potential to revolutionise large-scale timber buildings.The Timber and TimberPlus buildings described in this report are good examples <strong>of</strong> this newconstruction technology.The new technology can be used for multi-storey timber buildings up to 10 storeys or more.These buildings will have:• Heavy timber beams, columns, or walls• Large structural members prefabricated <strong>of</strong>f site• Main timber structure <strong>of</strong> LVL members• Post-tensioned connections for easy construction and high seismic resistance• Removable partitions and cladding• Composite T-beam floors with concrete topping on timber joistsThe performance requirements for these buildings will be:• Wide open spaces, with maximum flexibility <strong>of</strong> use.• Residential, educational or commercial uses, which can be changed over time.• Safety in fire, earthquakes, or extreme weather events.• Excellent acoustic performance.• Excellent thermal behaviour.• Durability for hundreds <strong>of</strong> years.• Low levels <strong>of</strong> life-cycle energy use, hence low CO 2 emissions during construction,long-term use, and demolition.4.4.2 Development <strong>of</strong> Post-Tensioned Timber SystemsRecent research work at the University <strong>of</strong> Canterbury has extended the concept <strong>of</strong> hybridmulti-storey building systems from pre-cast concrete to timber frame and wall systems.During the 1990s, investigations in pre-cast concrete moment-resisting frames orinterconnected shear walls under the U.S. PRESSS (Pre-cast Seismic Structural System)programme resulted in the revolutionary development <strong>of</strong> high-performance, cost-effective,seismic resisting systems. These solutions can undergo inelastic displacements while limitingstructural damage and assuring full re-centreing capability after a seismic event (no
- 38 -residual/permanent deformations). These innovative solutions, typically referred to as jointedductile connections or PRESSS-technology, differ from monolithic solutions (i.e. cast-inplacereinforced or pre-cast concrete; welded or bolted connections in steel) in that:a) Prefabricated structural elements are connected using unbonded post-tensioning;b) The inelastic seismic demand is accommodated within the connection through theopening and closing <strong>of</strong> an existing gapc) The structural elements are kept in the elastic range with a very limited level <strong>of</strong> damage.A particularly efficient solution is provided by the hybrid system where an adequatecombination <strong>of</strong> self-centreing capacity (unbonded tendons plus axial load) and energydissipation (mild steel or other dissipation devices) leads to a controlled rocking motion underseismic action.This pre-cast concrete technology has been successfully adapted for timber frame and wallsystems. Due to its high homogeneity and good mechanical properties, laminated veneerlumber (LVL) has been selected as the preferred engineered wood material.Figure 4.12Figure 4.12Figure 4.12 shows the conceptual solution for a hybrid beam-columntimber connection, based on the combination <strong>of</strong> post-tensioning and internal dissipaters (e.g.epoxied mild steel bars).Internal or externaldissipation devicesRocking motionSelf-centering Energy dissipationMMHybrid systemMθθθUnbonded posttensionedtendonθ impUnbonded posttensionedMild steel ordissipative devicesFigure 4.12. Basic concept <strong>of</strong> hybrid jointed ductile connections for LVL timber frame systems and flagshapehysteresis behaviour [3].4.4.3 Experimental InvestigationThe University <strong>of</strong> Canterbury has carried out extensive experimental tests on timber exteriorbeam-column subassemblies, cantilever columns, single walls and coupled walls. Typicaltest-setups are shown in Figure 4.13.Figure 4.13. Test set-up <strong>of</strong> exterior beam-column joint, (single) cantilever wall, cantilever columnspecimens.
- 39 -Several different solutions have been developed for energy dissipation devices. Because thedissipaters are the only damageable part <strong>of</strong> the connection system, improved post-earthquakereparability leads to significant reductions in repair costs and business downtime compared totraditional solutions in timber construction (e.g. nailed, bolted, or steel dowel connections).In general terms, the experimental results on different frame or wall systems and subassembliesconfirmed the high seismic performance <strong>of</strong> these innovative jointed ductile timberconnections based on post-tensioning techniques. In all cases, considering differentsimulations <strong>of</strong> seismic loading, the tested systems demonstrated large inelastic displacements(high ductility demand) with no significant damage <strong>of</strong> the structural elements and negligibleresidual deformations.4.4.3.1 Design FlexibilityThe hybrid systems described above allow for great flexibility in the seismic design <strong>of</strong> multistoreytimber buildings, as confirmed by the different arrangements investigated, withdifferent types <strong>of</strong> dissipaters combined with different initial post-tensioning <strong>of</strong> the tendons.Research to evaluate the losses <strong>of</strong> pre-stressing force in the tendons over time due to creep <strong>of</strong>the timber is ongoing.The floor system is a key component <strong>of</strong> the multi-storey timber building. There are a number<strong>of</strong> performance requirements that must be satisfied:• resistance to gravity load (strength limit state for out-<strong>of</strong>-plane loading)• control <strong>of</strong> vibration and deflection due to gravity load (serviceability limit state)• resistance to lateral load (strength limit state for in-plane loading)• control <strong>of</strong> deflection due to lateral load on the diaphragm (strength and serviceabilitylimit state)• fire resistance• acoustic separation• thermal insulationThe Timber and TimberPlus buildings both use a concrete-timber composite flooring system.Whilst traditional joist floors are extensively used for single- or two-storey houses, they meetfew <strong>of</strong> the above performance requirements. Stressed skin panels flooring systems exhibitimproved structural performance, however they still suffer from the problem <strong>of</strong> vibrations forlong-span floors and cannot provide adequate acoustic separation.Concrete-timber composite systems were initially proposed in Europe for strength andstiffness upgrading <strong>of</strong> existing timber floors. Now, due to several advantages, such as lowerweight than traditional reinforced concrete floors, and better acoustic performance thantimber-only floors, the composite systems are being used for new construction. The largerstiffness <strong>of</strong> the concrete topping markedly increases the flexural stiffness <strong>of</strong> the compositesystem which reduces the deflection and the sensitivity to vibrations. It is possible toconstruct medium to long-span (6 to 10 m) floors significantly lighter than pre-cast concretecounterparts with similar performance. Particularly important is the increase in acousticseparation over traditional timber-only floor, which is a crucial requirement for inter-tenancyfloors.
- 40 -A design feature <strong>of</strong> the Timber and TimberPlus buildings is prefabrication. The floors couldbe constructed from composite panels entirely prefabricated <strong>of</strong>f-site or by connecting concreteslabs prefabricated <strong>of</strong>f-site onto the timber joists and the adjacent slabs.An extensive experimental programme is currently ongoing at the University <strong>of</strong> Canterbury,New Zealand and the University <strong>of</strong> Technology, Sydney including tests to failure and longtermtests <strong>of</strong> full scale concrete-LVL composite beams and different connection details,dynamic vibration tests <strong>of</strong> composite beams, and tests under repeated loads <strong>of</strong> compositebeams and different connection details.The possibility <strong>of</strong> using pre-stressed LVL beams with composite connections to the concretetopping will also be investigated after good results <strong>of</strong> a preliminary study.4.4.3.2 Long-term EffectsDurabilityDurability has been a problem in multi-storey light-timber-frame buildings in New Zealand,with inadequate weather-pro<strong>of</strong>ing details leading to rapid decay <strong>of</strong> untreated timber studs inconcealed wall cavities. This problem is being solved with stringent new design andinspection procedures. There are also new requirements for using chemical treated timber instructural elements that may become wet due to weather exposure. Durability is not expectedto be a problem in the new commercial buildings using large scale beams, columns and walls,provided that attention is paid to weather-pro<strong>of</strong> cladding materials and the main structuralelements are visible for inspection.Creep testsAn extensive experimental programme aimed to investigate the long-term behaviour <strong>of</strong> prestressedLVL beams is currently in progress. The programme includes creep tests <strong>of</strong> smallLVL blocks, loaded in compression parallel and perpendicular to grain, creep tests <strong>of</strong> portions<strong>of</strong> two-bay LVL frames, where the beams are pre-stressed with unbonded tendons, and creeptests <strong>of</strong> LVL beams, with and without pre-stressing, subjected to gravity load. Preliminaryresults have shown a moderate (about 10%) reduction <strong>of</strong> pre-stressing force due to timedependentphenomena over one year. These results will be reported soon.Fire safetyThe fire safety aspects <strong>of</strong> multi-storey timber buildings is being assessed in accordance withNew Zealand and international codes, considering both internal and external growth andspread <strong>of</strong> fire, also structural fire resistance <strong>of</strong> the floors and main structural members. Since1992 the New Zealand Building Code has allowed timber buildings <strong>of</strong> unlimited heightprovided that performance requirements are met, whereas earlier codes limited height to onlythree storeys.
- 41 -5 Operational Energy5.1 GeneralThis section presents the data setup used in the operational energy simulation process,describes the thermal envelope configuration <strong>of</strong> the four alternative building designs, providesa description <strong>of</strong> the heating, ventilation and air conditioning (HVAC) systems used, thelighting systems and the schedule for simulations.Figure 5.1 shows the floor plan used for the Concrete, Steel, Timber and TimberPlusbuildings. It also shows a transverse cross-section through the ventilation chimneys. Thefloor is subdivided into four zones; three <strong>of</strong>fices and one corridor and services area on thesouth side.Figure 5.1: Plan used for energy calculations, and cross-section through the ventilation chimneys.For operational energy modelling, only the <strong>of</strong>fice zones have HVAC control. The corridorsand service areas only have manually opening windows, set for natural ventilation. Two largeventilation chimneys were placed in the actual Concrete design for the Biological Scienceslaboratory building, and these are retained in the four case study designs considered in thisreport. The ventilation chimneys are continuous through all floors, from ground level up tothe plant room on the ro<strong>of</strong> slab. They are used for natural ventilation with automaticallycontrolled louvres set to be opened between 22°C and 26°C. When the louvres are closed, theair conditioning keeps the temperature at 26°C until 6pm.Of central importance to the design <strong>of</strong> the research covered by this report was the requirementto have all four alternative designs displaying very similar operational energy consumptionover the lifetime <strong>of</strong> the buildings. Several previous researchers have found that even whenthe energy efficiency <strong>of</strong> buildings being compared is code-compliant, the effects <strong>of</strong> theembodied energy <strong>of</strong> construction materials are difficult to discern and negligible in
- 42 -comparison to the much larger variations in operational energy between the differentbuildings (Cole and Kernan (1996); Page (2006); Sartori and Hestnes (2007); Suzuki and Oka(1998)).Similar operational energy consumption <strong>of</strong> the four buildings being compared in this reportmeans that the differences in the environmental impacts are determined by the differences inthe embodied and recurrent (maintenance and refurbishment) energy and GWP emissions inthe different materials used in each building.To achieve very similar operational energy pr<strong>of</strong>iles required different design for envelopewalls construction, thermal mass, and heating and cooling equipment in each <strong>of</strong> the fourbuildings.An energy performance simulation was undertaken to assess the operational energy use <strong>of</strong> allfour building. The energy simulation was initially undertaken for the Concrete building usingDesign Builder s<strong>of</strong>tware (2008). Design parameters were varied, trialling differentequipment, materials and data sets until a satisfactory operational energy pr<strong>of</strong>ile wasachieved; a pr<strong>of</strong>ile typical <strong>of</strong> a multi-storey <strong>of</strong>fice building in Christchurch.This energy consumption pr<strong>of</strong>ile was then used as a benchmark energy target for thealternative Steel, Timber and TimberPlus buildings. Iterative energy simulations followingchanges in design features (for example, selection <strong>of</strong> improvement in envelope wallsconstruction and some changes in finishes) were undertaken with each <strong>of</strong> the alternativebuildings, aiming to reach the benchmark set by the Concrete building. Once the ‘Concrete’benchmark was reached, final simulations were carried out to assess the small differencesbetween the energy performances <strong>of</strong> each <strong>of</strong> the four buildings.5.2 Operational Energy Simulation5.2.1 Simulation MethodThe Concrete building was designed initially to have low energy consumption, and to performbetter than the minimum requirements <strong>of</strong> New Zealand Standard NZS 4243 Energy Efficiency– Large <strong>Buildings</strong> (NZS). Subsequently, all four buildings in this research had similarperformance pr<strong>of</strong>iles (close to 86 kWh/m 2 /year). This is particularly important because one<strong>of</strong> the aims <strong>of</strong> this research was to look at the influence <strong>of</strong> materials on the life cycle energyuse and GWP emissions <strong>of</strong> the buildings.For the simulations carried out in this study, many <strong>of</strong> the inputs (Table 5.1) are default databased on NZS 4243 but some data from the Design Builder s<strong>of</strong>tware library database was alsoused as input (NZS (1996)). A Wellington based engineering company eCubed BuildingWorkshop Ltd 2 was involved to supervise the simulation process.2 2 e-Cubed Building Workshop Ltd. synthesises traditional mechanical and electrical services engineeringdesign with new trends in sustainable design. Service is based upon an extensive local and international trackrecord in applying sustainable principles to engineering services design. The e-Cubed sustainable design serviceworks alongside the architect and the traditional engineering consultants to develop a sustainable designframework and concepts which are refined and tested by the use <strong>of</strong> advanced modeling tools with the aim <strong>of</strong>reducing energy and water use by 40-50% when compared to a conventional solution.
- 43 -Table 5.1: Simulation inputs valuesData Value Unit SourceMetabolic Rate 0.9 Met Ashrae comfort toolOccupancy 0.1 People/m 2 NZS:4243Plug Load (Office Equipment) 8 W/m 2 NZS:4243Heating set point 22 Celsius E CubeNatural ventilation 24 Celsius E CubeCooling set point 26 Celsius E CubeMin. fresh air 8 l/s - person NZS:1330Lifts 4 kWh/m 2 NZGBCInfiltration 0.25 ACH* NZGBCDHW 4 kWh/m 2 NZGBCLighting 400 Lux AS/NZS 1680.1:2006Lighting power density 13.6 W/m 2 DesignBuilderDuring the design process, changes to improve performance were mostly related to variation<strong>of</strong> thermal mass and the improvement <strong>of</strong> the thermal envelope and for example by addinginsulation to the ro<strong>of</strong> slab.5.2.2 Floor Areas for SimulationThe analysis <strong>of</strong> the results <strong>of</strong> this research used the net usable area. The ventilation systemoccupies a large area <strong>of</strong> space within the building; the large vertical void areas used aschimneys connected to a plant room on the ro<strong>of</strong> were taken out <strong>of</strong> the gross floor area for thecalculation <strong>of</strong> the net usable area.Table 5.2 shows the initial gross floor area (calculated inside the envelope walls), thensegregated in floor area allocated to the ventilation chimneys and plant room, <strong>of</strong>fices andcorridors floor area. Finally, Table 5.2 shows the net usable area which was calculated addingthe <strong>of</strong>fice floor area plus corridors floor area.Table 5.2: Calculation <strong>of</strong> the Net Usable Area for the analysis <strong>of</strong> resultsGross floor area 4,247 m 2Chimneys and plant room 711 m 2Offices 2,745 m 2Corridors 792 m 2Net usable area (Offices + Corridors): 3,536 m 2Initially, the net usable area was used for the calculation <strong>of</strong> the operating energy consumptionintensity per square metre. Subsequently, in order to have a single result for life-cycle energyconsumption per square metre, the initial and recurrent embodied energy were subdividedalso for net usable area. All results with reference to the intensity <strong>of</strong> energy per square meterare presented in net usable area.
- 44 -5.2.3 <strong>Buildings</strong>’ Thermal Envelope DescriptionsTable 5.3 shows the different construction <strong>of</strong> the <strong>of</strong>fice area envelope walls, including wallthickness, R/values (heat loss) and the percentage <strong>of</strong> the section <strong>of</strong> each wall configurationtype within the total wall for each <strong>of</strong> the walls involved in the envelope <strong>of</strong> the main body <strong>of</strong><strong>of</strong>fices, for each <strong>of</strong> the Concrete, Steel, Timber and TimberPlus buildings. This informationis <strong>of</strong> importance because only the <strong>of</strong>fice areas use HVAC (mixed with natural ventilation), sothere is significant energy consumption required to keep a comfortable range <strong>of</strong> temperatureinside those areas, with heat losses through walls having a particularly large impact.As seen in Table 5.3, a significant difference between the Concrete building (with highthermal mass) and the three other buildings (with lower thermal mass) - Steel, Timber andTimberPlus - is that the Concrete building has a much thicker wall in the east and westfacades (Thermomass) than the east or west facades <strong>of</strong> the Steel, Timber or TimberPlusbuildings. Despite this much greater thickness, the R/Values are lower for the Concretebuilding than for the Steel, Timber and TimberPlus buildings. The wall description in all fourbuildings is segregated into cavity walls and structural walls.All light weight envelope walls in the Steel, Timber and TimberPlus buildings, including thesouth façade internal wall <strong>of</strong> the Concrete building, have 90 mm thick fibre-glass insulation.There was no variation in the thickness <strong>of</strong> insulation between any buildings, so the finalR/value differences between light weight walls is due to the influence <strong>of</strong> different linings,claddings and air cavity thicknesses. The TimberPlus building normally has higher R/valuesthan the Timber building, due to timber external claddings and interior linings.Table 5.3 is a summary <strong>of</strong> detailed wall specifications. Total R/Values were calculated by theDesignBuilder s<strong>of</strong>tware used for simulations.When looking at light weight walls in any <strong>of</strong> the four buildings, the cavity is the section <strong>of</strong> thewall that contains insulation between the internal linings and the external air cavity under thecladding, and the structure is the section <strong>of</strong> the wall that contains the studs and nogs(blocking) all added together, acting as a thermal bridge. In the case <strong>of</strong> the Steel building, thepart <strong>of</strong> the wall structure acting as a thermal bridge is only the web <strong>of</strong> the cold-rolled steelchannel used as studs. On the other hand, in a timber frame wall, the area acting as a thermalbridge is the complete timber stud width. Nevertheless, thermal conductivity is much higherin steel (45.3 W/mK) than in timber (0.11 W/mK) so the incidence <strong>of</strong> the small portion <strong>of</strong>steel in a steel framed wall is as significant as a much larger portion <strong>of</strong> wood in a timberframed wall (ASHRAE American Society <strong>of</strong> Heating, 2005).Because <strong>of</strong> the high thermal conductivity <strong>of</strong> steel, the main structural system <strong>of</strong> the steelbuilding was left inside the <strong>of</strong>fices and not within envelope walls so it doesn’t drasticallyincrease the heat losses. On the other hand, in the Concrete, Timber and TimberPlusbuildings, the structural systems are rather similar and the shear walls are part <strong>of</strong> the structuralsystem. This means that in the east and west facades, the structural walls are part <strong>of</strong> theenvelope walls, somewhat decreasing the total R/Value. In the Concrete building, there is alayer <strong>of</strong> extruded polystyrene in the core <strong>of</strong> the structural walls but in the Timber andTimberPlus buildings no extra insulation has been added to the shear walls. The influence <strong>of</strong>structural components on the thermal envelope is the main reason why all four buildingscannot have exactly the same R/Value, even when the same insulation is used.
- 45 -Table 5.3: Areas <strong>of</strong> <strong>of</strong>fice envelope walls including thickness and R/values for the Concrete, Steel, Timberand TimberPlus buildings.Wall construction Thicknees R/Value % in wall1 Concrete buildingEast and West facades: Concrete / Thermomass 310 mm 2.02 100 %South facades: Concrete / Thermomass 310 mm 2.02 22 %Light weight envelope wall / cavity 137 mm 2.68 73 %Light weight envelope wall / structure 137 mm 1.50 6%North Façade: Glassing Courtain wall 50 mm 0.56 100 %Ro<strong>of</strong>: Concrete / ro<strong>of</strong> Floor (ceiling incl) 814.5 mm 2.59 100 %Internal floor: Concrete / Internal Floor (ceiling incl) 814.5 mm 0.79 100 %Ground floor: Concrete / Ground Floor 1327 mm 2.80 100 %2 Steel BuildingEast and West facades: Light weight envelope wall / cavity 138.5 mm 2.65 97 %Light weight envelope wall / structure 138.5 mm 0.23 3%South facades: Light weight, south wall / cavity 147 mm 2.68 97 %Light weight, south wall / structure 147 mm 0.25 3%North Façade: Glassing Courtain wall 25 mm 0.56 100 %Ro<strong>of</strong>: Steel / Ro<strong>of</strong> slab (ceiling incl) 814.5 mm 2.47 100 %Internal floor: Steel / Internal floor (ceiling incl) 814.5 mm 0.67 100 %Ground floor: Concrete / Ground Floor 1327 mm 2.80 100 %3 Timber BuildingEast / West / south facades: LVL Shear Wall 286 mm 2.06 72 %Light weight envelope wall / cavity 137 mm 2.68 27 %Light weight envelope wall / structure 135 mm 1.50 1%South facades: Light weight envelope wall / cavity 137 mm 2.68 90 %Light weight envelope wall / structure 135 mm 1.50 10 %North Façade: Glassing Courtain wall 25 mm 0.56 100 %Ro<strong>of</strong>: Timber / Ro<strong>of</strong> slab (ceiling incl) 864.5 mm 2.58 100 %Internal floor: Timber / Internal Floor (ceiling incl) 814.5 mm 0.78 100 %Ground floor: Concrete / Ground Floor 1327 mm 2.80 100 %4 Timber Plus BuildingEast and West facades: LVL Shear Wall 331 mm 2.42 72 %Light weight envelope wall / cavity 144 mm 2.81 27 %Light weight envelope wall / structure 144 mm 1.23 1%South facades: Chimney, south wall / cavity 149 mm 2.84 90 %Chimney, south wall / structure 149 mm 1.23 10 %North Façade: Light weight envelope wall 144 mm 2.84 30 %Glassing Courtain wall 25 mm 0.56 70 %Ro<strong>of</strong>: Timber / Ro<strong>of</strong> slab 864 mm 2.58 100 %Internal floor: Timber / Internal Floor 814.5 mm 0.78 100 %Ground floor: Concrete / Ground Floor 1327 mm 2.80 100 %5.2.4 HVACFor all four buildings, the HVAC system operates when the inside temperature is below 22 °Cand above 26°C. Between 22 °C and 26°C the buildings all work under a natural ventilationmode with no heating or cooling. The building designs include two internal ventilationchimneys that under natural ventilation mode and are set in simulation to exhaust the aircoming into the buildings through opening windows in the curtain wall <strong>of</strong> the north façade.
- 46 -The HVAC system used in the simulations (chosen from many default possibilities inDesignBuilder) was hot water radiators for perimeter heating and mixed-mode betweennatural ventilation and mechanical HVAC. Above 26°C, air conditioning keeps thetemperature constant and below 22°C, heating warms the building.5.2.5 ScheduleAll four buildings were simulated as typical <strong>of</strong>fice buildings, using schedules for simulationbased on NZS 4243. Three schedules were developed to determine the percentage <strong>of</strong> loadsfor items such as occupancy, plugs, lighting and equipment and HVAC operation.Table 5.4 summarises the simulation load level.Table 5.4: Schedule for HVAC simulations (figures represent percentage <strong>of</strong> assigned load).12-8am 8-11am 11-6pm 6-10pm 10-12am1 OccupancyWeek 0 95 95 5 0Saturday 0 10 5 0 0Sunday 0 5 5 0 02 Plug and LightingWeek 5 90 90 30 5Saturday 5 30 15 5 5Sunday 5 5 5 5 53 Operation HVAC Typical NZ <strong>of</strong>ficeWeek 0 100 100 0 0Sunday 0 0 0 0 05.2.6 Energy sourcesNatural gas is used as fuel for the heating system and domestic hot water. Electricity is usedfor cooling, lighting and <strong>of</strong>fice equipment energy. The outcome <strong>of</strong> the operational energysimulations produced results which showed the annual fuel consumption segregated intonatural gas and electricity.This energy mix is important when considering GWP since two buildings having the sametotal energy might use different proportions <strong>of</strong> gas and electricity. Thus buildings with thesame total operational energy use may not result in the same GWP emissions, as LPG has amuch higher CO 2 coefficient than electricity.5.3 Life-Cycle Operational Energy UseAn energy performance simulation was undertaken to assess the operational energyconsumption <strong>of</strong> each <strong>of</strong> the four alternative building designs which were designed to havevery similar operational energy consumption.The underlying difference between operational energy consumption between the buildings ismostly due to the amount <strong>of</strong> concrete (acting as thermal mass) involved in each building.
- 47 -Modifying the design to achieve similar operational energy consumption is then achievedthrough changes to the insulating materials, thermal mass and heating and cooling equipmentin each <strong>of</strong> the four buildingsThe difference in energy consumption between the Timber and TimberPlus buildings is due tothe influence <strong>of</strong> solid wood in the partitions, external walls and ceiling acting as thermalmass, storing and exchanging heat (Bellamy and Mackenzie, 2007) and also because theTimberPlus building normally has higher R/values than the Timber building, due to timberexternal claddings and interior linings.With similar operational energy consumption, the final life-cycle energy consumed and GWPemissions would be determined by the differences in the embodied and recurrent energy andGWP emissions in the materials used in each building.Even when buildings aimed for similar operating energy consumption, small differences stillexisted. The following provides summary results <strong>of</strong> the energy consumption simulations.Table 5.5 shows the total annual operational energy consumption <strong>of</strong> the Concrete, Steel,Timber and TimberPlus buildings. Operational energy is derived from either electricity or gas,and the total final consumption is divided by the net useable floor area (measured insideexternal walls).Table 5.5: Operational energy annual resultsDifference againstTotal annual energy use in operationlowest consumptionkWh GJ % GJ1 Concrete buildingTotal electricity 241,171 kWh 868 GJTotal Gas 55,764 kWh 201 GJTotal energy use: 296,935 kWh 1,069 GJ 0% 0GJTotal energy use/m 2 : 84 kWh/m 2 0.30 GJ/m 22 Steel buildingTotal electricity 245,999 kWh 886 GJTotal Gas 56,365 kWh 203 GJTotal energy use: 302,363 kWh 1,089 GJ 2% 20GJTotal energy use/m 2 : 86 kWh/m 2 0.31 GJ/m 23 Timber buildingTotal electricity 257,433 kWh 927 GJTotal Gas 53,934 kWh 194 GJTotal energy use: 311,367 kWh 1,121 GJ 5% 52GJTotal energy use/m 2 : 88 kWh/m 2 0.32 GJ/m 24 Timber-Plus buildingTotal electricity 247,271 kWh 890 GJTotal Gas 57,470 kWh 207 GJTotal energy use: 304,740 kWh 1,097 GJ 3% 28GJTotal energy use/m 2 : 86 kWh/m 2 0.31 GJ/m 2Net usable area 3,536 m 2
- 48 -The total annual operational energy consumed in the four buildings is fairly similar. Thehighest difference (5%) is between the Concrete and the Timber buildingWhen energy consumed is divided by the building’s gross floor area, the Concrete buildinguses 84 kWh/m 2 /yr, followed by the Steel and the TimberPlus buildings, both using 86 kWh/m 2 /yr, and the Timber building, using 88 kWh m 2 /yr. The difference between the Concretebuilding (lowest operating energy consumption) and the Timber building (largest operatingenergy consumption) is about 4 kWh/ m 2 /yr.Electricity accounts for roughly 85% <strong>of</strong> the total energy consumed, with gas accounting forthe remaining 15%. This is because gas is used only for heating and domestic hot water whileelectricity is used for cooling, lighting, room electricity and miscellaneous systems (mainlylift).Table 5.6 shows the life-cycle operational energy use for the Concrete, Steel, Timber andTimberPlus buildings (the annual operational energy multiplied by a 60 year life-cycle). Thelife-cycle energy consumption is presented in GJ and the total is then divided by the buildingsnet useable floor area (measured inside external walls).Table 5.6: Energy consumed in operations, annual and 60 year life cycle consumption in GJAnnual energy consumed in operation60 years life-cyclekWh GJ GJ1 Concrete buildingTotal energy use: 296,935 kWh/yr 1,069 GJ/yr 64,138 GJ/yrTotal energy use/m 2 : 84 kWh/m 2 .yr 0.30 GJ/m 2 .yr 18.1 GJ/m 2 .yr2 Steel buildingTotal energy use: 302,363 kWh/yr 1,089 GJ/yr 65,310 GJ/yrTotal energy use/m 2 : 86 kWh/m 2 .yr 0.31 GJ/m 2 .yr 18.5 GJ/m 2 .yr3 Timber buildingTotal energy use: 311,367 kWh/yr 1,121 GJ/yr 67,255 GJ/yrTotal energy use/m 2 : 88 kWh/m 2 .yr 0.32 GJ/m 2 .yr 19.0 GJ/m 2 .yr4 Timber-Plus buildingTotal energy use: 304,740 kWh/yr 1,097 GJ/yr 65,824 GJ/yrTotal energy use/m 2 : 86 kWh/m 2 .yr 0.31 GJ/m 2 .yr 18.6 GJ/m 2 .yr5.3.1 Benchmarks for Operational Energy in New Zealand<strong>Buildings</strong>Several researchers have studied the energy consumption <strong>of</strong> commercial buildings in NewZealand – hence, there are a number <strong>of</strong> benchmarks for operational energy in <strong>of</strong>fice buildingsin New Zealand.The benchmark studies below provide comparison <strong>of</strong> the results with those produced from theoperational energy simulations undertaken for each <strong>of</strong> the four buildings in this report. Thisconfirms that all four buildings are low energy consumption buildings.
- 49 -• Standards New Zealand (NZS) 4220.“Code <strong>of</strong> practice for energy conservation in non-residential buildings” (1982).This standard sets energy consumption targets for New Zealand’s existing and newbuildings. The target for <strong>of</strong>fice buildings is: existing buildings 200 kWh/m 2 /yr andnew buildings 100 kWh m2/yr.• Property Council <strong>of</strong> New Zealand.The table below summarises the findings <strong>of</strong> report published by The PropertyCouncil <strong>of</strong> New Zealand in 2000: Energy consumption benchmarks: An analysis <strong>of</strong>the energy expenses incurred by New Zealand CBD <strong>of</strong>fice buildings.This study was undertaken to asses the cost and level <strong>of</strong> energy consumption incommercial CBD <strong>of</strong>fice buildings throughout New Zealand. The survey wasundertaken over the 1998 and 1999 calendar years. The survey obtained the annualenergy consumption statistics <strong>of</strong> 35 CBD <strong>of</strong>fice buildings encompassing approx410,000 m 2 <strong>of</strong> net lettable area (the gross area less common areas and ancillaryspaces).The study produced an energy performance indicator, the Energy Use Index (EUI)which provides a reference for a building’s energy consumption (in kWh/m 2 /yr <strong>of</strong>NLA) <strong>of</strong> several buildings occupancy types. Table 5.7 shows the EUI values for<strong>of</strong>fice buildings with different indoor climate control systems.Table 5.7: Property Council <strong>of</strong> New Zealand, 2000 Energy Use Index.Office building Low Typical highWith HVAC 200 kWh/m 2 /yr 280 kWh/m 2 /yr 400 kWh/m 2 /yrNatural ventilated 100 kWh/m 2 /yr 210 kWh/m 2 /yr 300 kWh/m 2 /yrTenant electricity only 60 kWh/m 2 /yr 150 kWh/m 2 /yr 200 kWh/m 2 /yr• NZ Green Building Council.The NZGBC <strong>of</strong>fers the newest energy use target with the New Zealand Green StarOffice Rating Tool. Green Star was launched in 2007 and rates the “sustainability”<strong>of</strong> new and refurbished <strong>of</strong>fice buildings in New Zealand. It is a ConditionalRequirement for obtaining a NZ Green Star rating that the base building designachieves an energy use figure <strong>of</strong> 120 kWh/ m 2 /yr or less, using the modellingmethod in NZS 4243/4218 (NZ Green Building Council, 2008).5.3.2 Summary <strong>of</strong> Energy Consumption BenchmarksThe predicted average energy consumption <strong>of</strong> the Concrete, Steel, Timber and TimberPlusbuildings analysed in this report is 86 kWh/m 2 /yr. There is a tendency in simulations that theoutcomes produced are lower than the audited energy consumption during occupancy. It isnot the aim <strong>of</strong> this report to identify the reasons for the gap between the predicted and auditedoutcomes. However, a figure <strong>of</strong> 84-86 kWh/m 2 /yr is well below all the above benchmarks.
- 50 -5.4 Masters ThesisThe Master in Building Science thesis “The influence <strong>of</strong> construction materials on the lifecycle energy use and carbon dioxide emissions <strong>of</strong> medium sized commercial buildings” byNicolas Perez (2008) provides much greater detail about the operating energy <strong>of</strong> the fourbuildings covered by this report, including detailed information on;• Operating energy segregated into end-uses (cooling, heating, DHW, systemmiscellaneous (lift), lighting and room electricity).• Annual energy consumption – heating versus cooling.• Comparison between the Concrete and Timber buildings as examples <strong>of</strong> high and lowthermal mass buildings respectively.
- 51 -6 Life Cycle Assessment6.1 IntroductionThis section <strong>of</strong> the report investigates some <strong>of</strong> the environmental impacts <strong>of</strong> the fouralternative building designs through the use <strong>of</strong> Life Cycle Assessment (LCA).This work was carried out by Scion, a New Zealand Government Crown Research Institute(CRI).6.2 BackgroundLife Cycle Assessment (LCA) is the central theme <strong>of</strong> this research project. However, the LCAstudy is dependent on research and results obtained from other parts <strong>of</strong> the overall project,undertaken prior to the LCA. The necessary steps before being able to undertake the LCAstudy are summarised below;1. The design <strong>of</strong> four buildings – Concrete, Steel, Timber and TimberPlus.2. The quantification <strong>of</strong> the construction materials used in each building.3. Operational energy modelling and results for each design.Building on the above research, the LCA study compares the lifetime primary energyconsumption and the global warming potential (GWP) <strong>of</strong> the four buildings and investigatesthe environmental hotspots <strong>of</strong> each building.6.2.1 LCA OverviewLife Cycle Assessment is based on the concept <strong>of</strong> Life Cycle Thinking which integratesconsumption and production strategies over a whole life cycle, so preventing a piece-mealapproach to systems analysis. Life cycle approaches avoid problem-shifting from one lifecycle stage to another, from one geographic area to another, and from one environmentalmedium to another.Life Cycle Assessment is an analytical tool for the systematic evaluation <strong>of</strong> the environmentalimpacts <strong>of</strong> a product or service system through all stages <strong>of</strong> its life. It extends from extractionand processing <strong>of</strong> raw materials through to manufacture, delivery, use, and finally on to wastemanagement. This is <strong>of</strong>ten referred to as “cradle to grave”. A number <strong>of</strong> other environmentalassessment tools are restricted to the production process, which is sometimes called “gate togate”, or in the case <strong>of</strong> embodied energy covers the life cycle from “cradle to gate” withouttaking the end-<strong>of</strong>-life into account.6.2.2 Definition <strong>of</strong> LCAISO 14040 defines LCA as:“… a technique for assessing the environmental aspects and potential impacts associatedwith a product, by• compiling an inventory <strong>of</strong> relevant inputs and outputs <strong>of</strong> a product system;
- 52 -• evaluating the potential environmental impacts associated with those inputs andoutputs;• interpreting the results <strong>of</strong> the inventory analysis and impact assessment phases inrelation to the objectives <strong>of</strong> the study.LCA studies the environmental aspects and potential impacts throughout a product’s life (i.e.cradle-to-grave) from raw material acquisition through production, use and disposal. Thegeneral categories <strong>of</strong> environmental impacts needing consideration include resource use,human health, and ecological consequences.”6.2.3 Elements <strong>of</strong> an LCAAn internationally accepted framework for LCA methodology is defined in AS/NZS ISO14040 and 14044. These standards define the generic steps which have to be taken whenconducting an LCA. The following section will explain these steps and give examples on howthey can be applied to the building industry.Four different phases <strong>of</strong> LCA can be distinguished:6.2.3.1 Goal and Scope DefinitionThe goal and scope <strong>of</strong> the LCA study are clearly defined in relation to the intendedapplication. This includes a detailed description <strong>of</strong> the reasons for undertaking the study, aswell as the intended audience and the intended application <strong>of</strong> the results.Having defined the goal <strong>of</strong> the study, scoping involves defining the functional unit, systemboundaries and other requirements for the study, such as data quality, and choice <strong>of</strong>environmental impacts to be analysed in the “impact assessment”.6.2.3.2 Inventory AnalysisThe inventory analysis involves the actual collection <strong>of</strong> data and the calculation procedures.The relevant inputs and outputs <strong>of</strong> the analysed product system are quantified and produced asa table. These are the material and energy inputs, and product and emission outputs to air,water and land.In an LCA, the material and energy flows should be “drawn from the environment ... ordiscarded into the environment without ... human transformation” [ISO 14040]. Thus theoverall product system should extend upstream to primary resources, and downstream to thepoint where material is emitted into the environment in an uncontrolled way.The initial phase is to develop an “input-output” table <strong>of</strong> the product systems. This would, forexample, be a kg <strong>of</strong> concrete, kWh <strong>of</strong> electricity used and km <strong>of</strong> transport, including the litres<strong>of</strong> diesel consumed. A detailed inventory is then compiled; for concrete this includes theamount <strong>of</strong> gravel, sand, crude oil and all related emissions, e.g. kg <strong>of</strong> CO 2 emissions.At the end <strong>of</strong> the life cycle, treatment <strong>of</strong> solid waste should be considered as part <strong>of</strong> theproduct system. This means that ‘waste’ does not leave the product system analysis but isdealt with within the system boundaries.
- 53 -6.2.3.3 Impact AssessmentThe impact assessment translates the results <strong>of</strong> the inventory analysis into environmentalimpacts (e.g. climate change, ozone depletion). The aim <strong>of</strong> this phase is to evaluate thesignificance <strong>of</strong> potential environmental impacts.The contribution to climate change is, for example, expressed as the Global WarmingPotential (GWP). GWP is defined over a certain time period to reflect the relative lifespans <strong>of</strong>each greenhouse gas in the atmosphere - in this project the time period used is 100 years. Thisis a standard time period defined by the IPCC. In order to calculate the GWP, all emissionscontributing to climate change that are listed in the inventory table, e.g. carbon dioxide andmethane, are converted into kg CO 2 equivalents. The following methodology is applied: CO 2has a weighting <strong>of</strong> 1 kg CO 2 equivalent whereas the more potent greenhouse gas methane hasa value <strong>of</strong> 25 kg CO 2 equivalents (IPCC, 2007), in other words 1 kg <strong>of</strong> methane contributes25 times as much to global warming as 1 kg CO 2 . In this way it is possible to add up theresults <strong>of</strong> all emissions which contribute to the same environmental impact category.6.2.3.4 InterpretationIn this phase conclusions and recommendations for decision-makers are drawn from theinventory analysis and the impact assessment.These can be represented as shown in Figure 6.1. In practice, LCA involves a series <strong>of</strong>iterations as its scope is redefined on the basis <strong>of</strong> insights gained throughout the study.Life cycle assessment frameworkGoal andscopedefinitionInventoryanalysisInterpretationDirect applications:• Product developmentand improvement• Strategic planning• Public policy making• Marketing• OtherImpactassessmentFigure 6.1 LCA framework (ISO 14040)
- 54 -6.3 Life Cycle Assessment <strong>of</strong> the Four Building Designs6.3.1 GoalThe goal <strong>of</strong> this study is to calculate the environmental impacts (energy consumption andGlobal Warming Potential) <strong>of</strong> four alternative designs <strong>of</strong> a theoretical <strong>of</strong>fice building locatedon the University <strong>of</strong> Canterbury campus.The four designs are composed <strong>of</strong> three different structural materials; Concrete, Steel andTimber. In addition a variant called TimberPlus has been examined, in which the use <strong>of</strong> woodhas been maximised to the highest practical level.The study includes the initial production <strong>of</strong> the required materials to construct the building, amaintenance schedule where some building materials are replaced over the lifetime <strong>of</strong> thebuilding, impacts related to the operational energy, and the end-<strong>of</strong>-life <strong>of</strong> the four buildings.In addition to the overall goal, scenario analysis and sensitivity tests were carried out. Thescenario analysis examined different end-<strong>of</strong>-life scenarios, as well as the impact <strong>of</strong> differentlocations <strong>of</strong> the buildings with regard to changes in transport distances.The end-<strong>of</strong>-life scenarios include a base scenario where all waste is landfilled compared witha scenario in which the building materials are reused. This includes combustion <strong>of</strong> all woodmaterials and recycling <strong>of</strong> structural concrete and steel. Scenarios for transport distances lookat the location <strong>of</strong> the building in Christchurch (base scenario), Wellington, and Auckland.The end-<strong>of</strong>-life and transport scenarios are described in more detail in sections 6.3.3.3 and6.3.3.4.Finally, the results <strong>of</strong> the study are analysed and compared with an assessment <strong>of</strong> thebuildings using the current Green Star NZ assessment tool introduced by the New ZealandGreen Building Council (NZGBC). Green Star NZ is an environmental rating system forbuildings. Green Star for <strong>of</strong>fice buildings was released in April 2007 and evaluates buildingprojects against eight environmental impact categories, plus innovation. The goal <strong>of</strong> thisanalysis is to show how the same commercial building would rate using Green Star comparedto a life cycle based approach, as it is applied in Life Cycle Assessment.6.3.2 ScopeThe scope <strong>of</strong> the study includes a clear description <strong>of</strong> the system under analysis, thefunctional unit, system boundaries and data quality as well as the intended audience andapplication <strong>of</strong> the results.6.3.2.1 Functional UnitThe results <strong>of</strong> the study are related to an <strong>of</strong>fice building with gross area 4,247 m 2 on sixfloors, located in Christchurch and used over a period <strong>of</strong> 60 years. Four designs <strong>of</strong> thebuilding have been considered.
- 55 -6.3.2.2 System BoundariesThe system boundaries applied in this study were “cradle to grave”, which means that allimpacts <strong>of</strong> manufacturing the building products, their transport, the use phase <strong>of</strong> the building,and the disposal <strong>of</strong> the product after its useful life were considered. Upstream processes suchas the production <strong>of</strong> diesel used in transport as well as the emissions <strong>of</strong> the truck have beentaken into account, including all related environmental impacts. This also applies to theprovision <strong>of</strong> natural gas for heating and electricity.The actual construction and demolition <strong>of</strong> the building are not taken into account because theyare considered to be negligible (Kellenberger and Althaus, 2008).The results <strong>of</strong> the study are shown for the following stages <strong>of</strong> the life cycle:• production <strong>of</strong> building materials• transport to building siteo base scenario: building located in Christchurcho alternative scenarios: Wellington and Auckland• use <strong>of</strong> building over 60 yearso maintenanceo electricity for lighting, heating, appliances and coolingo natural gas for heating and hot water• transport <strong>of</strong> demolition materials to landfill or recycling• end-<strong>of</strong>-lifeo base scenario: landfill• including operation <strong>of</strong> landfill, e.g. bulldozers to shift material onlandfill.• carbon storage (sequestration) <strong>of</strong> timber, taking into account somedecay and release <strong>of</strong> carbon in form <strong>of</strong> carbon dioxide or methane.o reutilisation scenario – combustion <strong>of</strong> all timber in cogeneration to produceheat and electricity which displace electricity from the NZ grid and heat fromnatural gas as well as recycling <strong>of</strong> all structural concrete and steel.All stages <strong>of</strong> the life cycle as well as the scenarios are described in detail in the inventoryanalysis.6.3.2.3 Data QualityTwo aspects with regard to data quality need to be considered:• input – output data, i.e. quantities <strong>of</strong> materials used and transport distances• life cycle inventory data, i.e. emissions and energy required for the production <strong>of</strong> thematerials or generation <strong>of</strong> electricityThe data quality for both aspects <strong>of</strong> this research report can be described as high quality data.The input-output data is based on calculations - because the study has been undertaken forfour theoretical buildings, the material consumption could not be measured on site.
- 56 -The life cycle inventory data used in this study is from two key sources:The data for most building materials is based on a new dataset that has been developed as part<strong>of</strong> the project “Life Cycle Assessment: Adopting and adapting overseas LCA data andmethodologies for building materials in New Zealand” by Nebel et al. (2009). In this projectEuropean-based industry data was combined with New Zealand specific data, compiled andcalculated by Alcorn (1995, 1998, 2003) at the Centre for Building Performance Research atVictoria University.Data for materials that are not included in this dataset are based on data that is part <strong>of</strong> a LCAs<strong>of</strong>tware package (GaBi 4.3) and is based on European industry data. The data has beenamended and checked for consistency with literature data (GaBi 2006) and is compliant withthe ISO Standards 14040 and 14044. The documentation <strong>of</strong> the data describes the productionprocess, applied boundary conditions, allocation rules etc. for each product. The data coversresource extraction, transport, and processing, i.e., “cradle to gate”. Included are materialinputs, energy inputs, transport, outputs and as well as the emissions related to energy use andproduction. Capital equipment is excluded 3 .A New Zealand specific dataset for the provision <strong>of</strong> electricity is provided in the GaBidatabase, based on the average GridMix <strong>of</strong> 2004.6.3.2.4 Intended Audience and Application <strong>of</strong> the ResultsThe study was undertaken for the Ministry for Agriculture and Forestry. It is anticipated thatthe results will be used to inform policy making. The results can also be used to demonstratethe benefits <strong>of</strong> a life cycle approach when comparing different building designs.6.3.2.5 Impact Assessment MethodologiesPrimary energy, as an indicator for resource consumption, and Greenhouse gas emissions(global warming potential), as one <strong>of</strong> the most important environmental impacts, have beenconsidered.6.3.2.6 Primary EnergyPrimary energy is energy contained in raw fuels and any other forms <strong>of</strong> energy that has notbeen subjected to any conversion or transformation process. Primary energies are transformedin energy conversion processes to more convenient forms <strong>of</strong> energy, such as electrical energyand cleaner fuels. The transformation includes losses that occur in the generation,transmission, and distribution <strong>of</strong> energy. For example, the provision <strong>of</strong> 1 MJ <strong>of</strong> electricityfrom natural gas requires 2.6 MJ <strong>of</strong> primary energy (GaBi 4.3). Primary energy consumptionfor “cradle to gate” or “cradle to site” is <strong>of</strong>ten referred to as “embodied energy”.Embodied energy is the energy consumed by all processes from extraction <strong>of</strong> raw materialsthrough to the production <strong>of</strong> a product. The definition <strong>of</strong> the system boundaries vary fordifferent assessments and sometimes include the delivery to the building site, energyrequirements for installation, and transport <strong>of</strong> workers to the site (“cradle to site”). However,data for these processes is <strong>of</strong>ten hard to quantify. Published figures for embodied energy aretherefore <strong>of</strong>ten based on a “cradle to gate” concept.3 Capital equipment does not need to be included in LCA studies <strong>of</strong> construction materials (Frischknecht et al.2007).
- 57 -For more information see:http://www.greenhouse.gov.au/yourhome/technical/fs52.htmEmbodied energy usually includes energy from fossil fuels as well as energy from renewablefuels, based on the assumption that there is a limit on how much renewable energy can beharnessed. The supply <strong>of</strong> electricity from hydro or wind is for example restricted and shouldtherefore also be used efficiently in order to replace as much fossil fuels as possible. In orderto address this issue only harnessed renewable energy should be considered, e.g. electricitygenerated from hydro energy, or thermal energy from combustion <strong>of</strong> biomass. In this case, forexample, the calorific value <strong>of</strong> biomass is included. Harnessed renewable energy is differentfrom energy that is captured within a product, but not used for energy production, for examplethe solar energy required for the photosynthesis to grow timber.In currently available commercial databases, including the widely used Ecoinvent database aswell as the GaBi database non-harnessed solar energy for photosynthesis is also included.This is done to keep the energy balance intact because a calorific value is assigned to alltimber products. This means there is an output <strong>of</strong> energy (calorific value <strong>of</strong> timber) andtherefore an equivalent input <strong>of</strong> energy, i.e. solar, is required. However, this can be seen asdistorting the overall use <strong>of</strong> renewable energy, because the solar energy for timber productioncan not be utilised in any other way. In the LCA data for building materials in New Zealand(Nebel et al. 2009) non-harnessed energy has therefore been excluded. However, as the NZdata does not cover all materials, it needs also to be consistent with available databases inorder to be able to mix NZ with data from those to provide a full range <strong>of</strong> materials and thisoption has therefore been provided too. Not all materials used in the four buildings analysedin this report are available in the new New Zealand dataset, e.g. NZ specific LVL andWestern Red Cedar data are not available and the data had therefore to be sourced from theGaBi database.For the purpose <strong>of</strong> this project a sensitivity analysis has been done that compares the analysis<strong>of</strong> renewable plus non-renewable as well as only non-renewable embodied energy. For thetimber products used from the GaBi database the solar contribution has been subtractedmanually for the key timber products for this comparison, using the calorific value <strong>of</strong> theproducts. The results are indicative – because wood fibres are for example used in fibrecement and it was not possible to determine the accurate amount <strong>of</strong> all timber used in allprocesses. The results are shown in Figure 6.2 and indicate that the conclusions drawn fromjust the non-renewable proportion <strong>of</strong> the embodied energy are valid for the total embodiedenergy use (the results for the non-renewable energy follow an almost identical trend to thenon-renewable & renewable energy combined). Therefore, the primary energy figures in thisreport will refer to the non-renewable proportion <strong>of</strong> primary energy only.
- 58 -250002000015000Energy (GJ)1000050000Concrete Steel Timber TimberPlusNon-RenewableNon-renewable + renewableFigure 6.2: Comparison <strong>of</strong> embodied energy including renewable and non-renewable energy with onlynon-renewable energy for all materials6.3.2.7 Global Warming Potential (GWP)Increasing amounts <strong>of</strong> greenhouse gases (such as carbon dioxide and methane) enhance thenatural greenhouse effect and are possibly leading to an increase in global temperature.During the 20th century, the average global temperature increased by about 0.6°C. Climatechange is therefore <strong>of</strong>ten referred to as 'global warming'. Since the effects may also includestorms or regional cooling, the term 'climate change' is more suitable. The natural greenhouseeffect is an important factor in heating the atmosphere: short wavelength solar radiationentering the Earth's atmosphere is re-radiated from the Earth's surface in longer infraredwavelengths and then reabsorbed by components <strong>of</strong> the atmosphere. Without the naturalgreenhouse effect the average global temperature would be about -18°C. Due to thegreenhouse effect the average global temperature is 15°C.The general recommendation is to use the most recent figures for CO 2 equivalents forgreenhouse gas emissions published by the Intergovernmental Panel for Climate Change(IPCC). In 2007, the IPCC updated its estimates <strong>of</strong> Global Warming Potentials (GWP) for keygreenhouse gases from 1996.The global warming potential is an expression <strong>of</strong> the contribution <strong>of</strong> a product or service toclimate change. An internationally agreed characterisation model exists for the calculation <strong>of</strong>the Global Warming Potential. This has been published by the IPCC.CO 2 has a weighting <strong>of</strong> 1 whereas the more potent greenhouse gas methane has a value <strong>of</strong> 25kg CO 2 equivalents: in other words 1 kg <strong>of</strong> methane contributes 25 times as much to globalwarming as 1 kg CO 2 (over 100 years). This way it is possible to add up the results <strong>of</strong> allemissions which contribute to climate change.
- 59 -6.3.3 Inventory Analysis6.3.3.1 Material QuantitiesThe material quantities for each building type and building component are presented in tonnesin Appendix A. The material quantities, for each building type, were estimated by a quantitysurveyor, Davis Langdon Shipston Davies in Christchurch. The total quantities, in tonnes, <strong>of</strong>the main building materials are summarised and presented in Table 6.1Table 6.1Table 6.1.Table 6.1: Total building material quantities for each building design.Building typeMaterial (tonnes) Concrete Steel Timber TimberPlusConcrete – 17.5 MPA 165 62 53 53Concrete – 40.0 MPA 679 2,170 1,316 1,316Concrete – Pre-cast 4,595 101 N/A N/ASteel (NZ) 5.85 77.40 4.04 4.04Steel (Aus) 17.66 265.64 5.55 5.55Steel sheet 16.66 15.66 N/A N/AReinforcing steel wire 114.41 24.03 19.48 19.48Glass 47.03 47.03 47.03 31.94Timber 11.57 10.94 61.28 130.82Western Red Cedar N/A N/A 0.00 22.80LVL N/A N/A 343.94 343.94Plywood 4.09 4.09 54.45 64.79MDF 2.00 2.00 2.00 70.62Aluminium 6.63 6.63 6.63 1.06Aluminium sheet mix 27.26 27.26 27.26 N/APlasterboard (Gypsum) 38.83 56.10 43.24 N/APaint 0.69 0.77 1.03 1.11Fibreglass Insulation 3.30 8.34 7.93 8.42Polystyrene Insulation 2.31 N/A N/A N/AFibre Cement 36.39 44.89 73.82 N/A6.3.3.2 MaintenanceA maintenance schedule for each building design was developed based on a literature review<strong>of</strong> material lifetimes. Additional information, in particular with regard to the estimatedlifetime <strong>of</strong> the timber products and components <strong>of</strong> the buildings, was provided in the report byIain Nicholls, an Architectural Technologist at Warren and Mahoney in Christchurch(commissioned by the University <strong>of</strong> Canterbury as part <strong>of</strong> this overall research project). Thisreport, A Review <strong>of</strong> the timber used in four alternative designs <strong>of</strong> multi-storey buildings isincluded in its entirety in Appendix F.The replacement or refurbishment lifetimes <strong>of</strong> specific building materials are presented inAppendix B along with the references on which the figures are based.Where the exact material is not given, the closest approximation is used. In some cases, morethan one value is given for a single material, in which case the exemplar house figure (Szalay,2006) is used, as this was calculated from many studies. For this study, it was assumed thatthe plywood panelling and MDF would have the same lifetime until replacement orrefurbishment.
- 60 -It was assumed that structural components and insulation would last the entire lifespan <strong>of</strong> thebuilding <strong>of</strong> 60 years. It was also assumed that any replacements required, would be with anidentical material to the original.The replacement or refurbishment lifetime for acoustic ceiling tiles was estimated at 40 yearsand building components produced from Western Red Cedar were estimated to last 60+ years,except for windows which were assumed to last 40 years, provided there is strict adherence toa regular maintenance, such as staining (Nicholls, 2008).6.3.3.3 End-<strong>of</strong>-Life InventoryBase ScenarioThe base scenario assumes that all building materials, including wood-based materialsinstalled in each building, such as timber, LVL, plywood, and MDF, would be sent to landfillfollowing deconstruction at the end <strong>of</strong> each building’s life. For the landfill scenarios thetransport to the landfill as well as all emissions to the operating the landfill (e.g. use <strong>of</strong> bulldozers) are included (GaBi, 2006).The total mass <strong>of</strong> all the structural timber, architectural finishes and each wooden componentfor each building is presented in (Table 6.2). The carbon content <strong>of</strong> all wooden materials wasassumed to be 50% (Wegener and Fengel, 1982; IPCC, 2006). The total carbon within thewooden materials sent to landfill was calculated for each building (i) based on this proportion(Table 6.2). Evidence has shown that 18% <strong>of</strong> carbon in wooden materials decomposes within19-46 years following initial disposal but after this period no further significant amount <strong>of</strong>carbon is released (shown as Total carbon stored in landfill after 46 years (ii))(Ximenes, et al.,2008). In lines iii) and iv) respectively those figures have been converted into CO 2 equivalentstorage.From the proportion <strong>of</strong> carbon released, 50% <strong>of</strong> that will form into carbon dioxide (CO 2 ) and50% into methane (CH 4 ) (IPCC, 2006). A 42 % capture <strong>of</strong> methane has been taken intoaccount (MfE, 2009). It is anticipated that the amount <strong>of</strong> landfill gas captured from NewZealand landfills will increase in the future; however to avoid additional uncertainties, thelatest figure based on physical data has been used. It was assumed that the captured methanewas flared and thus converted to CO 2 for the calculations 4 . Another assumption was that 10%<strong>of</strong> the non-captured methane underwent microbial oxidation to CO 2 in the landfill (IPCC,2006, Einola et al., 2009). Based on this information the total release <strong>of</strong> Greenhouse Gas(GHG) from decomposition was calculated. The total release <strong>of</strong> GHG from decompositionwas then converted into respective GWP by multiplying each GHG by its GWP coefficient,CO 2 being 1 and CH 4 , 25 (IPCC, 2007). The resultant GWP CO 2 –equivalent (v) was thensubtracted from the total CO 2 sequestered in the building (iii). This provided the net amount<strong>of</strong> CO 2 –equivalent sequestered in landfill once decomposition has ceased (vi).Due to its high GWP methane contributes around 76% to the total GWP <strong>of</strong> emissions fromlandfill.4 Data on the amount <strong>of</strong> energy produced from landfill gas in New Zealand is available, however theuncertainties associated with attributing this to specific materials make this calculation very difficult. Although itcan not be quantified at this stage, an additional benefit should be attributed to timber stored in landfills due theuse <strong>of</strong> landfill gas for energy generation.
- 61 -Table 6.2: Net tonnes CO 2 equivalent stored in landfill including total GHG emissions released fromdecompositionBuilding typeConcrete Steel Timber Timber+Timber tonnes 11.57 10.94 61.28 164.96LVL tonnes 0.00 0.00 343.94 343.94Plywood/MDF tonnes 6.09 6.09 56.45 125.07i) Total Carbon content <strong>of</strong>buildingtonnes8.83 8.52 230.84 316.99ii) Total Carbon stored inlandfill after 46 yearstonnes7.24 6.98 189.28 259.93iii) Total CO 2 sequestered inbuildingtonnes32.38 31.22 846.40 1,162.28iv) Total CO 2 sequestered inlandfill after 46 yearstonnes26.55 25.60 694.04 953.07v) Total CO 2 equivalent.released from decomposition(GWP)tonnes18.13 17.49 474.08 651.00vi) Net CO 2 e sequestered inlandfilltonnes14.24 13.73 372.32 511.27Figure 6.3 presents the results displayed in Table 6.2 graphically.800.0600.0400.0200.0GWP (t CO2 equiv.)0.0-200.0-400.0-600.0Concrete Steel Timber Timber+NetDecompositionPlywood/MDFLVLTimber-800.0-1000.0-1200.0-1400.0Building typeFigure 6.3: Tonnes CO 2 stored from timber components in landfill including total GHG emissionsreleased from decompositionMaterial Reutilisation ScenarioIn the material reutilisation scenario, instead <strong>of</strong> sending waste materials to landfill, all woodenmaterials from all four building designs were used as a boiler fuel to provide energy and allstructural steel and concrete was recycled.
- 62 -In the steel recycling scenario, all recoverable structural steel (estimated to be 250 tonnes)was recycled. The amount <strong>of</strong> recycled steel was then assumed to replace virgin steel andcredited to the building. For the Concrete building, the recoverable structural concrete(estimated at 2,180 tonnes) was assumed to be recycled to produce gravel. The production <strong>of</strong>the same amount <strong>of</strong> virgin gravel was then credited to the building.The total mass <strong>of</strong> wooden materials was the same as in the landfilling scenario which includestimber, LVL, plywood, and MDF (see Table 6.3). It was assumed that all these materialswould be burnt in a cogeneration plant with an efficiency <strong>of</strong> 60% (Connell Wagner, 2007; seealso the Bioenergy Knowledge Centre calculator, www.bkc.co.nz/tools). This means that 60%<strong>of</strong> the calorific value <strong>of</strong> the wood (i) is recovered as useful energy (ii) through combustionwith a ratio <strong>of</strong> electricity to heat <strong>of</strong> 1:3 (Connell Wagner, 2007). Thus 60% <strong>of</strong> the totalcalorific value <strong>of</strong> the timber was converted into electricity (iii) and heat (iv). It was assumedthat this amount <strong>of</strong> electricity and heat replaces electricity from the national grid and heatfrom burning natural gas and therefore displaces fossil fuels (0.067 kg CO 2 e per MJ heat fromnatural gas [a universal coefficient] and 0.078 kg CO 2 e per MJ electricity (GaBi 4.3, adjustedfor electricity generation in the NZ grid) and primary energy (1.42 MJ per MJ heat fromnatural gas and 2.25 MJ per MJ electricity (GaBi 4.3)).Table 6.3: Energy recovered from wood combustion and CO 2 displaced from avoiding the use <strong>of</strong>traditional energy sources (natural gas and electricity)Building type Concrete Steel Timber Timber+Material (t)Timber 11.57 10.94 61.28 164.96LVL 343.94 343.94Plywood/MDF 6.09 6.09 56.45 125.07Total wood waste 17.66 17.03 461.67 633.97Retained energy (GJ)(i) Calorific Value 276.91 267.03 7,238.99 9,940.65(ii) at 60% efficiency 166.15 160.22 4,343.39 5,964.39(iii) Metered Electricity 41.54 40.05 1085.85 1491.10(iv) Metered Heat 124.61 120.16 3,257.54 4,473.29CO 2 e displacement (t)Electricity 3.23 3.12 84.45 115.97Natural gas 8.31 8.01 217.17 298.22Total 11.54 11.13 301.62 414.19Primary energy displacement(GJ)Electricity 93.46 90.12 2,443.16 3,354.97Natural gas 176.53 170.23 4,614.85 6,337.16Total 269.99 260.35 7,058.01 9,692.13This displacement can be explained more clearly by tracking the path <strong>of</strong> the carbon, withinthe wooden products, from cradle to grave.
- 63 -Growing timber takes up CO 2 from the atmosphere and stores it as carbon. When the wood isharvested from the forest the carbon continues to be stored within the wood. The wood isthen used in various forms in construction <strong>of</strong> buildings, exists over the full lifetime <strong>of</strong> thebuildings and carbon continues to be stored up to the point <strong>of</strong> deconstruction.When the deconstructed timber is combusted, CO 2 is released back into the atmosphere,which brings the balance back to zero. However, because beneficial energy is recovered at thesame time, the need to use fossil fuels such as natural gas and electricity generated in coal,gas and oil fired power stations has been avoided. Therefore, the CO 2 that was not released,by avoiding the use <strong>of</strong> natural gas and electricity, can be subtracted from the GWP <strong>of</strong> the end<strong>of</strong>-lifephase in which the wood is being combusted.The emission <strong>of</strong> CO 2 equivalents and the use <strong>of</strong> primary energy were then subtracted from thetotal life cycle results <strong>of</strong> each building respectively (Table 6.3), based on the aboveexplanation. The use <strong>of</strong> natural gas for heat and the emissions related to producing electricityby burning <strong>of</strong> fossil fuel have been avoided.6.3.3.4 TransportIt was assumed for all building materials that they would be sourced locally or from theclosest possible supplier. All timber was assumed to be sourced locally (this is a fairassumption for most timber, excepting cedar, used in the TimberPlus building). For somematerials that are available from multiple locations, such as concrete, aluminium, and paint, aNew Zealand average distance was calculated.It was assumed that structural steel would be imported from Australia. However, it would alsobe possible that steel would be imported from Asia.The locations reflect a short distance (Auckland), a medium distance (Wellington) and a longdistance scenario (Christchurch). The long distance scenario was chosen as the base scenario(as Christchurch is the actual location <strong>of</strong> the new Biological Sciences building used as atemplate in this study). Transport distances for the three scenarios are presented in Table 6.4.Table 6.4 Distances travelled, via truck and ship, to deliver materials to building locations inChristchurch, Wellington and AucklandChristchurch (km) Wellington (km) Auckland (km)Material Truck Ship Truck Ship Truck ShipConcrete 124 124 124Steel (NZ) 1,000 92 600 30Steel (Aus) 50 2,500 50 2,500 50 2,500Glass 1,000 92 600 30Timber 427 400 200LVL 427 100 500Plywood/MDF 676 62 400 200Aluminium 400 400 400Plasterboard 20 600 30Paint 400 400 400Glass Insulation 1,000 92 600 30Poly Insulation 1,000 92 600 30Fibre Cement 1,000 92 600 30
- 64 -6.3.3.5 Operational EnergyTotal Megawatt hours (MWh) consumed (electricity and natural gas) during the 60 yearoperation period for each building type was supplied by Nicolas Perez (Perez, 2008) (Table6.5) as metered consumption. To demonstrate the total energy consumption this has beenconverted to primary energy and the respective GWP has also been calculated.A life cycle inventory dataset for New Zealand has been used to calculate the primary energycontent and the GWP for electricity. The dataset takes the New Zealand electricity mix aswell as New Zealand specific emissions into account (MED, 2005). The dataset wasdeveloped in collaboration <strong>of</strong> Scion and PE-Europe and is based on generic datasets for theprovision <strong>of</strong> electricity in GaBi S<strong>of</strong>tware 4.3 (GaBi, 2006).The following results have been calculated:Electricity:Global Warming potential: 0.28 kg CO 2 equiv. / kWhPrimary energy: 8.1 MJ/kWhThe factors for heat from natural gas are based on datasets available in the GaBi 4.2 database.Global Warming potential: 0.24 kg CO 2 equiv. / kWhPrimary energy: 5.1 MJ/kWhThe above results reflect the high proportion <strong>of</strong> renewable energy in the New Zealandelectricity mix (66.6% in 2007 according to the Ministry for Economic Development)The results for metered energy consumption, as well as primary energy and GWP are shownin Table 6.5. The figures for metered energy consumption have then been multiplied with therespective numbers for CO 2 equiv./kWh and MJ primary energy/kWh for heat from naturalgas and electricity.Table 6.5: Operational energy consumption (electricity and natural gas) over 60 years including meteredMWh and Primary energy (GJ) consumption with associated GWP (t CO 2 eq.)BuildingtypeMetered;Electricity(MWh)(Perez,2008)Primaryenergyx 8.1CO 2x 0.28Metered;natural gas(MWh)(Perez,2008)Primaryenergyx 5.1CO 2x 0.24Primaryenergy(GJ)GWP(t. CO 2eq.)Concrete 14,470 117,207 4,052 3,346 17,065 803 135,863 4,910Steel 14,760 119,556 4,133 3,382 17,248 812 138,428 5,000Timber 15,446 125,113 4,325 3,236 16,504 777 143,315 5,161Timber+ 14,836 120,172 4,154 3,448 17,585 828 139,388 5,038The primary energy consumption associated with the operation stage was determined andused instead <strong>of</strong> using the consumed MWh in the building because the system boundariesinclude all energy use associated with each stage <strong>of</strong> the life cycle. Therefore it was imperativeto include all energy consumed in the process <strong>of</strong> delivering the useable energy to thebuildings.
- 65 -6.3.4 Impact AssessmentTotal primary energy and GWP were the two impact categories calculated for each buildingtype. The results for each building are presented for the following life cycle stages: initialmaterial production and use, maintenance, transport, operation over the 60 year lifetime <strong>of</strong> thebuilding/s and end-<strong>of</strong>-life.The results are based on the Base scenario, as described in sections 6.3.4.1 to 6.3.4.3. Theresults for the reutilisation scenario and transport scenarios are presented in section 6.3.5.6.3.4.1 Total Primary Energy Use and GWPThe total primary energy and GWP contributions from each building can be seen in Figure 6.4and Figure 6.5 below. The Timber buildings have lower contributions to global warming thanthe Steel and Concrete buildings; the results for the Steel building are 30% higher than for theTimberPlus building. The TimberPlus building has the lowest primary energy use over its lifecycle, followed by Concrete, Timber and Steel respectively. The total primary energy use forthe Steel building is 7 % higher than the TimberPlus building.The main contribution to each impact category is during the building’s operational phase, inall buildings contributing over 85% <strong>of</strong> the primary energy use and over 70% <strong>of</strong> the GWPimpacts. The difference between each building’s transport, maintenance, and end-<strong>of</strong>-life makerelatively little difference but the differences in initial embodied energy are significant. InTable 6.6 and Table 6.7, the total figures for each stage <strong>of</strong> the life cycle are presented.When breaking down the total impact <strong>of</strong> the buildings into life cycle stages, it can be seen thatthe operational energy is the largest figure. It makes up 87% (Steel) to 94% (TimberPlus) <strong>of</strong>the total energy use <strong>of</strong> the buildings, and 72% (Concrete) to 78% (TimberPlus) <strong>of</strong> the totalemissions that contribute to GWP. Embodied energy makes up 5% (TimberPlus) to 11%(Steel) <strong>of</strong> the total primary energy use and embodied GWP makes up 9% (TimberPlus) to23% (Steel) <strong>of</strong> the impact from greenhouse gas emissions. Maintenance is the only othersignificant contributor in each category. End-<strong>of</strong>-life (transport <strong>of</strong> materials to landfill and thelandfilling process as well as storage <strong>of</strong> carbon and potential release <strong>of</strong> methane) is around0.5% for primary energy use and ranges from 2% (Concrete) to -9% (TimberPlus) for theGWP. Transport <strong>of</strong> materials to site makes up around 0.3% <strong>of</strong> primary energy use and 0.5%<strong>of</strong> GWP.The differences in the buildings’ embodied energies and embodied global warming potentialscan be seen below (in Table 6.6 and Table 6.7). The Steel building has the highest values forboth categories, followed by Concrete, Timber and TimberPlus. However, taking into accountthe full life cycle (including operation energy) the order for the energy use is different. Due toincreased operational energy, the total primary energy use for the Timber building becomesgreater than for the Concrete building. The order <strong>of</strong> the total GWP values remains the same.This point has been expanded in the inventory section (6.3.3.3).
- 66 -180000160000140000120000Energy (GJ)100000800006000040000200000Concrete Steel Timber Timber+Building typeEmbodied Energy Maintenance Energy Transport Energy Operational Energy End <strong>of</strong> Life EnergyFigure 6.4: Primary energy consumption for each stage <strong>of</strong> the life cycle for all four buildingsTable 6.6: Total amount <strong>of</strong> energy consumed (GJ) in each stage <strong>of</strong> the life cycle for all building typesInitialembodiedenergy(GJ)Transportenergy(GJ)End-<strong>of</strong>lifeenergy(GJ) 5TOTALENERGY(GJ)BuildingtypeMaintenanceenergy (GJ)Operationalenergy (GJ)Concrete 13,772 1,722 589 135,863 1,342 153,288Steel 17,970 2,201 532 138,428 691 159,822Timber 11,597 1,887 408 143,315 490 157,696TimberPlus 7,191 1,518 419 139,388 492 149,008Table 6.7: Total GWP for each stage <strong>of</strong> the life cycle <strong>of</strong> all building typesInitialembodiedMaintenanceTransportOperationEnd<strong>of</strong>-lifeCO2storageTOTALBuilding [t CO2 [t CO2 [t CO2 [t CO2 [t CO2 [t CO2 [t CO2typeequiv.] equiv.] equiv.] equiv.] equiv.] 6 equiv.] 7 equiv.]Concrete 1,576 131 42 4,910 168 -32 6,794Steel 1,615 166 39 5,000 95 -31 6,883Timber 971 139 29 5,161 529 -846 5,982Timber+ 566 99 30 5,038 706 -1,162 5,2765 End-<strong>of</strong>-life refers to the energy associated with the disposal <strong>of</strong> a material, which may be positive or negativedepending on the disposal method.6 In this landfill scenario, end-<strong>of</strong>-life includes transport <strong>of</strong> materials to the landfill and subsequent emissionsfrom the landfill.7 The calculation <strong>of</strong> initial embodied GWP does not include carbon sequestered in the building materials. Thepotential carbon stored in the materials is detailed in Table 6.2.
- 67 -8000700060005000GWP (t CO2 equiv.)40003000200010000-1000-2000ConcreteSteelBuilding typeTimberTimber+Initial Embodied Maintenance Transport Operational End <strong>of</strong> Life CO2 storageFigure 6.5: GWP (tonnes CO 2 equivalent) for each stage <strong>of</strong> the life cycle <strong>of</strong> all the building types6.3.4.2 Contribution <strong>of</strong> building componentsIn this section, embodied energy (as distinct from total primary energy) and embodied GHGemissions are analysed (cradle to gate only). However, it should be noted that the calorificvalue, as well as, the stored carbon (that is potential sequestration in the timber) are not takeninto account. These factors are dependent on the end-<strong>of</strong>-life scenario <strong>of</strong> the building and aretaken into account in the full life cycle assessments. Especially, the carbon storage shouldonly be considered if the whole life cycle is taken into account because the effect <strong>of</strong> differentend-<strong>of</strong>-life scenarios can influence this result significantly, as shown later in section 6.3.5.However, Figure 6.3 has shown that the carbon storage in landfill that can be attributed tospecific materials can be significant, if a landfill scenario is assumed. Refer to section 6.3.3.3on the details how this was calculated.The highest individual energy user is the structure <strong>of</strong> the Steel building (Figure 6.6Figure6.6Figure 6.6). Aluminium louvres are the largest energy input for the Concrete and Timberbuildings, and the second largest <strong>of</strong> the Steel building. The TimberPlus building uses woodenlouvres, which are almost 20 times lower in energy than the aluminium louvres used in theother buildings. Window type also makes a significant contribution to embodied energy andagain, the reason the TimberPlus building has a lower figure than the others is because it useswooden frames instead <strong>of</strong> aluminium. Suspended floors are the next significant embodiedenergy contributor, and this is primarily from Concrete and Steel. The values are much higherthan for the foundations figures, because much more concrete and steel is used in fivesuspended floors.The higher value for the ceiling <strong>of</strong> the TimberPlus building can be attributed to the largequantities <strong>of</strong> MDF used in the ceilings.
- 68 -700060005000Energy (GJ)40003000200010000CeilingDoorsExterior WallsFoundationsGround Floor SlabsInterior WallsLouvresRo<strong>of</strong>StairsStructureSuspended FloorsWindowsBuidling typeConcrete Steel Timber Timber+Figure 6.6: Total embodied energy (GJ) for each building component, compared between building typesThe global warming potential <strong>of</strong> the building components is shown in Figure 6.7Figure6.7Figure 6.7, and it can be seen that the values in general follow the same trends as theembodied energy graph (Figure 6.6Figure 6.6Figure 6.6). Again the three largest contributorsare the suspended floors and structure <strong>of</strong> the Concrete and Steel buildings, and the aluminiumlouvres on all buildings except the TimberPlus building.600500400GWP (t CO2 equiv.)300200ConcreteSteelTimberTimber+1000CeilingDoorsExterior WallsFoundationsGround Floor SlabsInterior WallsLouvresRo<strong>of</strong>StairsStructureSuspended FloorsWindowsBuilding componentFigure 6.7: GWP (tonnes CO 2 equivalent) estimated for each building component, compared betweenbuilding typesFigure 6.6Figure 6.6Figure 6.6 and Figure 6.7Figure 6.7Figure 6.7 show clearly that theprimary energy consumption and the global warming potential <strong>of</strong> the structure <strong>of</strong> the Steeland Concrete buildings are higher than for the structures <strong>of</strong> the Timber buildings.
- 69 -As explained above, carbon storage is not shown in Figure 6.7Figure 6.7Figure 6.7 due to theuncertainties existing around different end-<strong>of</strong>-life scenarios. However, as shown in Figure6.3, the carbon storage can be significant even if a proportion <strong>of</strong> methane emissions areassumed in a landfill scenario.6.3.4.3 Maintenance related embodied energyWhen looking at impacts <strong>of</strong> building maintenance, the categories that stand out are where theimpact is zero (Figure 6.8Figure 6.8Figure 6.8 and Figure 6.9Figure 6.9Figure 6.9). Norepairs or replacements are required in the foundations, ground floor slabs, structure(including insulation) and suspended floors. The highest impact in both embodied energy andGWP is from replacement <strong>of</strong> windows, with the exception <strong>of</strong> the TimberPlus building. Thebulk <strong>of</strong> energy used in window production can be attributed to aluminium frames. TheTimberPlus building again has the lowest impact here, due to use <strong>of</strong> wooden frames asopposed to aluminium.The interior walls and ceilings <strong>of</strong> the TimberPlus building have a relatively high impactcompared to the other buildings. This is because <strong>of</strong> the higher embodied energy in the MDFpanels compared to the building materials used for the other building designs. Assuming thesame ceiling as in the Concrete, Steel and Timber building for the TimberPlus building, thetotal GWP for this building could be reduced by about 50 tonnes <strong>of</strong> CO 2 equivalents.Interestingly, the Concrete building has the lowest exterior maintenance, as the concretestructure only has to be painted (wooden tiles and steel tiles must be replaced to some extenton the other building designs). TimberPlus is the only building with maintenance relatedenergy for louvres; the louvres are wooden (cedar) and are expected to last the full 60 yearlifespan <strong>of</strong> the building but durability is dependent on routine and regular maintenancethrough the application <strong>of</strong> stain.12001000800Energy (GJ)6004002000CeilingDoorsExterior WallsFoundationsGround Floor SlabsInterior WallsLouvresRo<strong>of</strong>StairsStructureSuspended FloorsWindowsBuidling typeConcrete Steel Timber Timber+Figure 6.8: Total embodied energy (GJ) for each maintained building component, compared betweenbuilding types
- 70 -100908070GWP (t CO2 equiv.)6050403020100CeilingDoorsExterior WallsFoundationsGround Floor SlabsInterior WallsLouvresRo<strong>of</strong>StairsStructureSuspended FloorsWindowsBuidling typeConcrete Steel Timber Timber+Figure 6.9: GWP (tonnes CO 2 equivalent) estimated for each maintained building component, comparedbetween building typesThe TimberPlus building has the greatest impacts (embodied energy and GWP) formaintenance for three <strong>of</strong> the building components (interior walls, ceilings, and louvres).Despite this it still has the lowest total impact (Figure 6.10Figure 6.10Figure 6.10 and Figure6.11Figure 6.11Figure 6.11). This is partly due to the lower embodied energy <strong>of</strong> the woodenwindow frames, compared with the aluminium window frames used in the other buildings. Itis worth noting that the impacts from the Steel and Timber buildings from maintenance arevery similar because both buildings have the same materials for interior walls, ceiling, andwindow frames. If the same ceiling is assumed for all four buildings, the maintenance relatedGWP for the TimberPlus building would reduced by approximately 25 tonnes <strong>of</strong> CO 2equivalents.2,5002,000Energy (GJ)1,5001,0005000Concrete Steel Timber Timber+Buidling type
- 71 -Figure 6.10: Total embodied energy (GJ) <strong>of</strong> all the materials required for maintenance andrefurbishment, compared between building types180160140GWP (t CO2 equiv.)120100806040200Concrete Steel Timber Timber+Buidling typeFigure 6.11: Total GWP (tonnes CO 2 equivalent) for all the materials required for maintenance,compared between building types6.3.5 Scenarios6.3.5.1 Landfill vs. Material ReutilisationTwo end-<strong>of</strong>-life scenarios were proposed for construction and demolition waste. The Basescenario assumes that all waste materials are landfilled. As described in the inventory analysis(section 6.3.3.3) a percentage <strong>of</strong> the timber in landfill is assumed to decompose and the restwill store carbon for some time, effectively forming a carbon reservoir. The second“reutilisation scenario” involves using the wood waste for energy, which releases the storedCO 2 , but at the same time displaces energy and the related emissions from other sources. Seesection 6.3.3.3 for a description <strong>of</strong> the processes. All structural concrete and steel wasrecycled in the reutilisation scenario.The difference in the total primary life cycle energy consumption and GWP <strong>of</strong> both scenariosis presented in Table 6.8 and Table 6.9, as well as Figure 6.12 and Figure 6.13.
- 72 -180,000160,000140,000120,000Energy (GJ)100,00080,00060,00040,00020,0000Concrete Steel Timber Timber+Building TypeLandfillReutilisationFigure 6.12: Comparison between total primary energy use <strong>of</strong> landfilling and reutilisation scenariosTable 6.8: Total primary energy consumption <strong>of</strong> each building’s life cycle for landfilling and reutilisationscenariosBuilding type Landfilling [GJ] Reutilisation [GJ]Concrete 153,288 152,464Steel 159,822 155,306Timber 157,696 153,022Timber + 149,008 142,7138,0007,0006,000GWP (t CO2 eq.)5,0004,0003,0002,0001,0000Concrete Steel Timber Timber+Building TypeLandfillReutilisationFigure 6.13: Comparison between total GWP (tonnes CO 2 equivalent) <strong>of</strong> landfilling and reutilisationscenarios
- 73 -Table 6.9: Total GWP <strong>of</strong> each building’s life cycle for landfilling and reutilisation scenariosBuilding type Landfilling [t CO 2 eq.] Reutilisation [t CO 2 eq.]Concrete 6,794 6,782Steel 6,883 6,567Timber 5,982 6,010Timber + 5,276 5,330The total primary energy use <strong>of</strong> all four buildings was lower in the reutilisation scenarios, assome energy was generated from wooden materials. It should again be noted that the landfillresults could change in the future if landfill gas capture rates increase, and if energy fromlandfill gas is able to be calculated. The GWP results are more varied than the energy useresults. As with energy, the GWP impacts <strong>of</strong> the Steel and Concrete buildings are reducedwhen material reutilisation is chosen as an end <strong>of</strong> life option. However, for the Timber andTimberPlus buildings the results indicate that the benefit as a result <strong>of</strong> carbon storage inlandfills (landfill scenario) is very slightly greater than the benefit from <strong>of</strong>fsetting emissionsfrom other energy sources (reutilisation scenario).The small difference in both primary energy use and GWP for the Concrete building isbecause concrete is recycled into aggregate which is a very low embodied energy product.The reason that the Steel building fares much better in the reutilisation scenario can beattributed largely to the recycling <strong>of</strong> steel (avoiding some primary steel, which has a very highembodied energy).The Concrete building has the lowest difference in energy and GWP between the twoscenarios, with the reutilisation scenario showing a 0.5% and 0.2% saving respectively. TheTimberPlus building has the greatest energy saving in the reutilisation scenario, with a 4.2%reduction, because it has a large quantity <strong>of</strong> wood waste for combustion. The Steel buildinghas the greatest reduction in GWP, with a 4.6% reduction; again this is due to the highembodied energy <strong>of</strong> steel, which is recycled into other steel products, thus avoidingproduction <strong>of</strong> a large quantity <strong>of</strong> virgin steel. The reutilisation scenario for all buildings showsa reduction in total energy, as the energy recovery from combusting the wood has beensubtracted from the total energy use <strong>of</strong> the buildings.
- 74 -180,000160,000140,000120,000Energy (GJ)100,00080,00060,00040,00020,0000Concrete Steel Timber Timber+-20,000Initial Embodied Energy Maintenance Transport Operation End-<strong>of</strong>-Life Energy RetainedFigure 6.14: Percentage <strong>of</strong> energy consumed in each stage <strong>of</strong> the life cycle, compared between buildingtypes in the reutilisation scenarioTable 6.10: Total primary energy consumption <strong>of</strong> each stage <strong>of</strong> the life cycle including the total energyrecovered through combustion and avoided energy due to recyclingInitialEnd-<strong>of</strong>lifeEnergy TotalBuildingtypeembodied[GJ]Maintenance[GJ]Transport[GJ]Operation[GJ] [GJ] 89retained[GJ] 10 [GJ]Concrete 13,772 1,722 589 135,863 684 -166 152,464Steel 17,970 2,201 532 138,428 -3,665 -160 155,306Timber 11,597 1,887 408 143,315 159 -4,343 153,022Timber + 7,191 1,518 419 139,388 161 -5,964 142,7138 End-<strong>of</strong>-life in this recycling scenario includes the recycling <strong>of</strong> recoverable concrete to make into moreaggregate (but still utilising significant amounts <strong>of</strong> primary energy) and recoverable steel (a negative valuebecause the energy difference between making recycled steel and virgin steel is enormous and in this case therecycled steel replaces some the production <strong>of</strong> some virgin steel).9 Note that only large amounts <strong>of</strong> recyclable material are accounted for; so, for instance, there is no accounttaken <strong>of</strong> recycling <strong>of</strong> foundation concrete in the Timber building.10 Energy retained refers to the total potential energy that could be produced from combustion <strong>of</strong> materials.
- 75 -8,0007,0006,0005,000GWP (t CO2 eq.)4,0003,0002,0001,0000-1,000Concrete Steel Timber Timber+Initial Embodied Maintenance Transport Operation End-<strong>of</strong>-Life CO2 RetainedFigure 6.15: Percentage <strong>of</strong> GWP <strong>of</strong> each unit process, compared between building types in thereutilisation scenario.Table 6.11: Total GWP (tonnes CO 2 equivalent) <strong>of</strong> each stage <strong>of</strong> the life cycle including the CO 2 retainedthrough displacing the use <strong>of</strong> traditional energy sourcesInitialembodied[t CO 2 eq.]CO 2 eqretained[t CO 2 eq .]BuildingtypeMaintenance[t CO 2 eq.]Transport[t CO 2 eq.]Operation[t CO 2 eq.]End-<strong>of</strong>-life[t CO 2 eq.][t CO 2 eq.]Concrete 1,576 131 42 4,910 135 -12 6,782Steel 1,615 166 39 5,000 -241 -11 6,567Timber 971 139 29 5,161 11 -302 6,010Timber + 566 99 30 5,038 12 -414 5,330The total primary energy consumed and GWP <strong>of</strong> each stage <strong>of</strong> the life cycle for thereutilisation scenario are presented in Table 6.10 and Table 6.11 respectively (presentedgraphically in Figure 6.14Figure 6.14Figure 6.14 and Figure 6.15). The negative figure in theEnd-<strong>of</strong>-life column for Steel includes a credit for the displacement <strong>of</strong> virgin steel. Thesetables also present the quantity <strong>of</strong> energy recovered from combusting the wood componentsand the CO 2 retained through displacing the use <strong>of</strong> traditional energy sources with theirassociated CO 2 emissions. These figures can be seen in the ‘Energy retained’ (Table 6.10) and‘CO 2 eq.retained’ (Table 6.11) columns, and the larger figures represent the larger quantities<strong>of</strong> wood available for energy recovery in the Timber and TimberPlus buildings.Total6.3.5.2 Transport DistancesIt is important to note that the transport contribution to total impact is minimal at around 0.3%and 0.5% for primary energy use and GWP respectively. However, for the purpose <strong>of</strong> thestudy it was interesting to test the relevance <strong>of</strong> the assumptions made. A sensitivity test wastherefore carried out to test the difference in environmental impact when the location <strong>of</strong> eachtype <strong>of</strong> building was changed (Base scenario assumed Christchurch). The change in location
- 76 -means that transport distances for materials would be different depending on the location <strong>of</strong>the building. In the transport scenarios, the buildings were located in Christchurch,Wellington, and Auckland. Table 6.4 presents the material transport distances to supplymaterials to these locations. It was assumed that materials would be sourced from the closestpossible supplier.Changing the location <strong>of</strong> the building made significant difference to the primary energy useand GWP for the life cycle stage “transport” for each building type. A significant reduction inboth impact categories was seen when the building was relocated to Auckland. This isbecause many building materials are produced in Auckland therefore requiring less transport.Christchurch had the highest impact for all the building types because it was assumed that themajority <strong>of</strong> building materials were transported from Auckland. This might not reflect thereality – but for the purpose <strong>of</strong> the modelling a “short distance, medium distance and longdistance” scenario was required - Christchurch was therefore chosen to reflect the “longdistance” scenario. This meant that the “worst case” would be used in the base scenario – yettransport still only contributed around 0.5 %.There was an overall reduction in transport related energy consumption <strong>of</strong> 30% for theConcrete building between Christchurch and Auckland.Taking into account that transport contributed only around 0.5 % to the overall life cycleimpacts for the base scenario (the “long distance scenario”), the variation between locationscan be seen as insignificant even though it appears that there are significant impactdifferences between building locations. These changes can be seen graphically on the nextpage in Figure 6.16 and Figure 6.17Figure 6.17Figure 6.17.700000600000500000Energy (MJ)4000003000002000001000000ChristchurchWellingtonAucklandChristchurchWellingtonAucklandChristchurchWellingtonAucklandChristchurchWellingtonAucklandConcrete Steel Timber Timber+Location and building typeFigure 6.16: Comparison <strong>of</strong> total energy (GJ) consumed from transporting materials to sites inChristchurch, Wellington and Auckland, for all building types
- 77 -45000400003500030000GWP (kg CO2eq.)2500020000150001000050000ChristchurchWellingtonAucklandChristchurchWellingtonAucklandChristchurchWellingtonAucklandChristchurchWellingtonAucklandConcrete Steel Timber Timber+Location and building typeFigure 6.17: Comparison <strong>of</strong> total GWP (tonnes CO 2 equivalent) from transporting materials to sites inChristchurch, Wellington and Auckland, for all building types6.4 Green Star Assessment and Comparison6.4.1 ApproachThe Green Star environmental rating system was introduced in New Zealand in 2007.Although there are some conceptual difference between LCA methodology and Green Star,both tools aim to identify life cycle impacts and have the potential to minimise theenvironmental impacts <strong>of</strong> buildings. Both tools have in common that they take energy use andmaterials in to account. However, the approach <strong>of</strong> both tools is conceptually different.Whereas the LCA is based on quantified data <strong>of</strong> all materials and energy used over the lifetime <strong>of</strong> a building, Green Star is based on credits for a number <strong>of</strong> criteria.The aim <strong>of</strong> this section is to compare the results <strong>of</strong> both tools, based on the same assumptions.A brief introduction to the Green Star tool is provided as background information.The assumptions for the LCA study described in this report are the basis for the comparison.6.4.2 Introduction to Green StarThe Green Star environmental rating system was developed by the New Zealand GreenBuilding Council (NZGBC) with the aim to:• define green building by establishing a common language and standard <strong>of</strong>measurement;• promote integrated, whole-building design;• identify building life-cycle impacts;• raise awareness <strong>of</strong> green building benefits;• recognise and reward environmental leadership; and• transform the built environment to reduce the environmental impact <strong>of</strong>development.
- 78 -The Green Star NZ <strong>of</strong>fice design v 1.2 tool was developed for the design stage <strong>of</strong> <strong>of</strong>ficebuildings to evaluate the environmental initiatives and/or potential environmental impacts <strong>of</strong>commercial <strong>of</strong>fice base building designs.In Green Star, credits are awarded for certain activities. For example 1 point is awarded whereit can be demonstrated that the percentage <strong>of</strong> all steel in the design has a post-consumerrecycled content great than 60 % by mass, and 2 points for 90 % by mass. If the material cost<strong>of</strong> steel represents less than 1 % <strong>of</strong> the project’s total contract value then this credit would be“not applicable”. Similarly 2 points are awarded where it is demonstrated that all timber andcomposite timber products are either post-consumer re-used timber or FSC certified timber ora combination there<strong>of</strong>. In other categories points are awarded for land use, IEQ, transport etc(Figure 6.18).Figure 6.18: Green Star methodology (NZGBC 2008)All points are then weighted and summarised into a single score, where materials have acontribution <strong>of</strong> 10 % to the total score whereas energy has a contribution <strong>of</strong> 25 %. For allweightings see Table 6.12.Table 6.12: Weightings in Green Star toolManagement 10 %Indoor <strong>Environmental</strong> Quality 20 %Energy 25 %Transport 10 %Water 10 %Materials 10 %Land Use and Ecology 10 %Emissions 5 %100 %6.4.3 Research Approach for ComparisonDue to the differences in the scope <strong>of</strong> both tools, the comparison was restricted to thoseaspects which are taken into account in both tools, i.e. material use and energy use. Allfeatures <strong>of</strong> the buildings that are not strictly material or energy use related were therefore
- 79 -assumed to be identical for the four different building designs - Concrete, Steel, Timber andTimberPlus.Two scenarios were assessed in Green Star. A base scenario which took into account thedominant ‘core’ materials only, i.e. timber, steel and concrete only and a recycling scenariowhich is similar to the reutilisation scenario in the LCA study. Both Green Star scenarios areshown in Table 6.13. The justification for the credits is explained in section 6.4.3.1 for theGreen Star base scenario and in section 6.4.3.2 for the Green Star recycling scenario.6.4.3.1 Green Star Base ScenarioThe Green Star Base scenario took only the core materials <strong>of</strong> each building type into account,i.e. no points for concrete or steel were awarded in the Timber building. Otherwise the Timberbuilding would score credits for either steel or concrete whereas the intention was to analysethe credits awarded for the core materials <strong>of</strong> each building option only.Timber building• Not applicable (N/A) was ticked for recycled steel content and concrete contentrespectively although, according to the Green Star methodology N/A can only beticked if the material cost for steel or concrete respectively is less than 1 % <strong>of</strong> theproject’s total contract value.• Sustainable timber (FSC certified) was chosen for the timber option <strong>of</strong> the building.• Operational energy figure specific to the Timber building were included (73kWh/m 2 /yr metered electricity and 15 kWh/m 2 /yr metered natural gas).• All other assumptions were identical to the Timber, Steel and Concrete building.TimberPlus building• The amount <strong>of</strong> timber used cannot be accounted for in Green Star. The results for theTimberPlus building were therefore identical with the Timber building.• Operational energy figures specific to the TimberPlus building were included(70 kWh/m 2 /yr metered electricity and 16 kWh/m 2 /yr metered natural gas).• All other assumptions were identical to the TimberPlus, Steel and Concrete building.Concrete building• Recycled concrete was assumed for the Concrete building. The N/A option was tickedfor Steel and Timber respectively.• Operational energy figure specific to the Concrete building were included(68 kWh/m 2 /yr metered electricity and 16 kWh/m 2 /yr metered natural gas).• All other assumptions were the same as for Steel and Timber.Steel building• Recycled steel was assumed for the Steel building. The N/A option was ticked forConcrete and Timber respectively.• Operational energy figure specific to the Steel building were included (70 kWh/m 2 /yrmetered electricity and 16 kWh/m 2 /yr metered natural gas).• All other assumptions were the same as for Concrete and Timber.
- 80 -Table 6.13: Overview <strong>of</strong> Green Star input.BuildingTimberBuildingTimberPlusBuildingConcretebuildingSteelbuildingGreen StarcategoryConcreteSteelGreen Star BaseNot applicableNot applicableGreen Star RecyclingConcrete recycling (masscontribution > 1%)Not applicable (masscontribution < 1 %)Timber Sustainable timber Sustainable timberOperationalenergyOther materialcategoriesConcreteSteel73 kWh/m 2 /yr meteredelectricity and15 kWh/m 2 /yr metered nat. gasIdentical assumptions for all fourbuildingsNot applicableNot applicable73 kWh/m 2 /yr meteredelectricity and15 kWh/m 2 /yr metered nat. gasIdentical assumptions for allfour buildingsConcrete recycling (masscontribution > 1%)Not applicable (masscontribution < 1 %)Timber Sustainable timber Sustainable timberOperationalenergyOther materialcategories70 kWh/m 2 /yr meteredelectricity and16 kWh/m 2 /yr metered nat. gasIdentical assumptions for all fourbuildings70 kWh/m 2 /yr meteredelectricity and16 kWh/m 2 /yr metered nat. gasIdentical assumptions for allfour buildingsConcrete Recycled concrete Recycled concreteSteel Not applicable Not ApplicableTimber Not applicable Sustainable timberOperationalenergyOther materialcategories68 kWh/m2/yr meteredelectricity16 kWh/m2/yr metered nat. gasIdentical assumptions for all fourbuildings68 kWh/m2/yr meteredelectricity16 kWh/m2/yr metered nat. gasIdentical assumptions for allfour buildingsConcrete Not applicable Recycled concreteSteel Recycled steel Recycled steelTimber Not applicable Sustainable timberOperationalenergyOther materialcategories70 kWh/m2/yr meteredelectricity16 kWh/m2/yr metered nat. gasIdentical assumptions for all fourbuildings70 kWh/m2/yr meteredelectricity16 kWh/m2/yr metered nat. gasIdentical assumptions for allfour buildings
- 81 -6.4.3.2 Green Star Recycling ScenarioThe Green Star Recycling Scenario takes recycling in all buildings into account. In order toprovide a fair comparison, the maximum points for each material were applied. This meansfor example that concrete in the Timber building has been recycled, but on the other hand thatthe timber in the Concrete building was FSC certified. However, if less than 1 % <strong>of</strong> the totalproject value is due to the cost <strong>of</strong> steel or concrete materials respectively, the option ‘notapplicable’ is available. The cut <strong>of</strong>f rule for timber is 0.1 %.In details the following assumptions and choices in Green Star were made:Timber building• Concrete recycling was taken into account. The N/A option can only be ticked if thecontribution <strong>of</strong> concrete is less than 1 % <strong>of</strong> the project’s total contract value. For theTimber building, concrete is required in the foundations. Although detailed data on thecost contribution <strong>of</strong> specific materials was not available, the contribution in terms <strong>of</strong>mass was > 1%. The recycling option was therefore assumed.• The N/A option for steel can only be ticked if it is less than 1% <strong>of</strong> the project’s totalcontract value. Because the cost contribution was not available, the decision was basedon the material contribution which was less than 1 % and N/A was ticked.• Operational energy figures specific to the Timber building were included(73 kWh/m 2 /yr metered electricity and 15 kWh/m 2 /yr metered natural gas).s• All other assumptions were identical with the TimberPlus, Steel and Concretebuilding.TimberPlus• The same assumptions as for the Timber building were applied. The additional amount<strong>of</strong> timber in the TimberPlus building cannot be accounted for in the Green Star tool.• Operational energy figures specific to the TimberPlus building were included(70 kWh/m 2 /yr metered electricity and 16 kWh/m 2 /yr metered natural gas).• All other assumptions were identical with the Timber, Steel and Concrete building.Concrete building• The steel contribution was less than 0.5 % and consequently the N/A option waschosen.• The cut <strong>of</strong>f criteria for timber is 0.1 % and more than this value <strong>of</strong> timber was used.FSC certified was therefore taken into account for the Steel building.• Operational energy figure specific to the Steel building were included (68 kWh/m 2 /yrmetered electricity and 16 kWh/m 2 /yr metered natural gas).• All other assumptions were identical with the Timber, TimberPlus and Steel building.Steel building• The cut <strong>of</strong>f criteria for FSC certified timber is 0.1 % and more than this value <strong>of</strong>timber was used. FSC certified was therefore taken into account for the Steel building.• The concrete contribution was > 1 % and recycled concrete was chosen for thisscenario.• Operational energy figure specific to the Steel building were included (70 kWh/m 2 /yrmetered electricity and 16 kWh/m 2 /yr metered natural gas).• All other assumptions were identical with the Timber, TimberPlus and Concretebuilding.
- 82 -6.4.4 ResultsThe number <strong>of</strong> points awarded (only for the two categories materials and energy), as well asthe weighted total score (based on those two categories) for the Steel, Concrete, Timber andTimberPlus building are shown in Table 6.14.The weighted score is calculated in the Green Star tool based on the weightings shown inTable 6.12. Categories for which “not applicable” was chosen are excluded from theweighting, i.e. it leads to a different result if N/A is ticked or if 0 credits are awarded.Table 6.14: Green Star results – base scenario.Timber TimberPlus Steel ConcreteRecyclables Storage 0 0 0 0Re-use <strong>of</strong> Façade N/A N/A N/A N/ARe-use <strong>of</strong> Structure N/A N/A N/A N/AShell and Core or Intergrated Fit out 0 0 0 0Recycled Content <strong>of</strong> Concrete N/A N/A N/A 3Recycled Content <strong>of</strong> Steel N/A N/A 2 N/APVC Minimisation 0 0 0 0Sustainable Timber 2 2 N/A N/ACarpet N/A N/A N/A N/APaints 0 0 0 0Thermal insulation 0 0 0 0Non-carpet floor coverings N/A N/A N/A N/ACredits for material 2 2 2 3Credits for energy 3 3 3 3Total credits 5 5 5 6Weighted score 5 5 5 6The environmental ranking <strong>of</strong> the buildings based on the Green Star results would be- Concrete- Steel/Timber/TimberPlus (all joint equal)In comparison the LCA results for primary energy use as well as GWP in the base scenarioare shown in Table 6.15Table 6.15Table 6.15.Table 6.15: LCA results – base scenarioRanking Primary energy GWP1 TimberPlus TimberPlus2 Concrete Timber3 Timber Concrete4 Steel Steel
- 83 -Table 6.16: Green Star results – recycling scenario.Timber TimberPlus Steel ConcreteRecyclables Storage 0 0 0 0Re-use <strong>of</strong> Façade N/A N/A N/A N/ARe-use <strong>of</strong> Structure N/A N/A N/A N/AShell and Core or Integrated Fit out 0 0 0 0Recycled Content <strong>of</strong> Concrete 3 3 3 3Recycled Content <strong>of</strong> Steel N/A N/A 2 N/APVC Minimisation 0 0 0 0Sustainable Timber 2 2 2 2Carpet N/A N/A N/A N/APaints 0 0 0 0Thermal insulation 0 0 0 0Non-carpet floor coverings N/A N/A N/A N/ACredits for material 5 5 7 5Credits for energy 3 3 3 3Total credits 8 8 10 8Weighted score 7 7 8 7For the reutilisation scenario, the environmental ranking <strong>of</strong> the buildings based on the results<strong>of</strong> the Green Star rating would be:• Steel• Concrete/Timber/TimberPlus (all joint equal)For comparison, Table 6.17 shows the LCA results for primary energy use as well as GWP inthe reutilisation scenario.RankingTable 6.17: LCA results – reutilisation scenario.LCA reutilisationscenario -Primary energyLCA reutilisationscenario -GWP1 TimberPlus TimberPlus2 Concrete Timber3 Timber Steel4 Steel Concrete
- 84 -6.5 Discussion and ConclusionsThe following Discussion and Conclusions is presented by Scion and specifically addressesonly the LCA investigation undertaken by Scion and detailed in this Chapter 6.6.5.1 Life Cycle AssessmentThis study reinforces the growing recognition both in New Zealand and worldwide for a fulllife cycle approach to analysing and understanding the different environmental impacts <strong>of</strong>different building designs. A rigorously applied Life Cycle Assessment approach is able toidentify differences in the environmental impacts <strong>of</strong> different building materials. However, ithas also shown that the differences between the construction materials in the buildings do notdominate the overall results. Each building’s operational phase, especially the operationalenergy, is the most significant contributor.The consideration and results from investigating carbon storage in timber placed in landfillhave shown that the potential release <strong>of</strong> methane has a significant influence on the overallmaterial related results. The net storage <strong>of</strong> carbon in landfilled timber, which is one <strong>of</strong> thescenarios that is relevant in a full life cycle approach, does not influence the overall resultssignificantly because the results are dominated by the operational phase.6.5.2 Primary Embodied Energy and GWPThe designing <strong>of</strong> four multi-storey buildings, each utilising different construction materialsbut ensuring that operational energy consumption over the lifetime <strong>of</strong> the buildings was verysimilar, enabled meaningful analysis <strong>of</strong> the importance <strong>of</strong> embodied energy and GWP to takeplace.The results show that the TimberPlus building has by far the lowest initial embodied energyand GWP contributions, followed by the Timber building. This is because the TimberPlusbuilding contains less aluminium and steel compared to the other building types, insteadsubstituting timber-based products, such as Western Red Cedar louvres and pine cladding.The Steel building had the greatest embodied energy and GWP contribution (followed closelyby the Concrete building for GWP), mainly caused by the large quantity <strong>of</strong> structural steel inthe Steel building and pre-cast concrete in the Concrete building, where both materials havehigh embodied energy and GWP. However, taking the full life cycle including operationalenergy into account, the difference between the four buildings was relatively small.The main impact contributors for all building in terms <strong>of</strong> building components were louvres,windows, and structural elements, all <strong>of</strong> which contained relatively large quantities <strong>of</strong>aluminium (louvres and windows) and steel (structure).When comparing each stage in the life cycle over the full life cycle, operation <strong>of</strong> the buildingcontributed the highest percentage to energy consumption at around 90% and GWP at around80%. This is largely due to the reasonably long 60 year lifetime considered, as well as therelatively large building size with high energy requirements. These percentages would reducein the future if the building is modified to become more energy efficient.
- 85 -The contribution <strong>of</strong> initial embodied energy and GWP to the overall life cycle results ishighest for the Steel building at 11% and 23% respectively. The end-<strong>of</strong>-life phase wasdominated by the energy used to operate a landfill and the potential methane emissions fromthe partial decomposition <strong>of</strong> timber. The carbon stored in the wood that was sent to landfill,was subtracted from the end-<strong>of</strong>-life GWP. The TimberPlus building, being composed largely<strong>of</strong> wood, had the greatest net CO 2 eq sequestration (511 tonnes CO 2 eq), and the Steel building,containing the least wood, had the least at 14 tonnes CO 2 eq. These reductions, in terms <strong>of</strong> theoverall impact on the building’s life cycle; account for reductions <strong>of</strong> up to 9% (TimberPlus)<strong>of</strong> the total GWP. The GWP benefit from carbon stored in landfills increases as more methaneis able to be captured and converted to CO 2 (which has a much lower GWP value thanmethane). If the captured methane is used for energy (for example, as is presently happeningat Burwood landfill in Christchurch, where the methane is collected and used for energy forheating the QEII swimming pool complex) there will also be a benefit for the net primaryenergy balance over the life cycle <strong>of</strong> the buildings.6.5.3 Maintenance Related EnergyMaintenance <strong>of</strong> the buildings over the 60 year lifetime contributed relatively minorenvironmental impacts compared to the initial embodied energy and GWP. However, therewere noticeable differences, in maintenance impacts, between building types and buildingcomponents.The Steel building had the greatest maintenance related impacts, whereas TimberPlus had thesmallest. Fewer materials were required to maintain the TimberPlus building. Western RedCedar, which lasts 60+ years, was used for louvres, balustrades, and reveals. Therefore, thesestructures do not require replacement, resulting in a greatly reduced overall impact for theTimberPlus building.However, the TimberPlus building did have the greatest maintenance related impact forinterior walls and ceilings components. This is due to the replacement <strong>of</strong> MDF panels whichhave a lifetime <strong>of</strong> 40 years. Even though the TimberPlus building had a higher maintenancerelated impact from replacing MDF interior linings and ceilings, the energy recovered fromcombusting these timber components, in the reutilisation scenario, reduced the overallembodied energy. Additionally, the carbon storage in the landfill scenario and the <strong>of</strong>fset <strong>of</strong>emissions from fossil fuels in the reutilisation scenario result in GWP reductions for thesetimber components. This cannot be done for the other building types as they use materials(e.g. gypsum board) that are not combustible and, therefore, are sent to landfill.The building components that required the most maintenance, with the largest contribution tototal maintenance related impact, were the windows. This is indicative <strong>of</strong> the large quantity <strong>of</strong>aluminium required in the maintenance <strong>of</strong> the frames. The exception is TimberPlus which hadthe lowest impact as much <strong>of</strong> the aluminium componentry <strong>of</strong> the windows is replaced withWestern Red Cedar. For the TimberPlus building, the reduced impact <strong>of</strong> the windowscategory outweighs the higher impacts in interior wall and ceiling categoriesSome studies have shown that building maintenance can be greater than the initial embodiedimpacts. Therefore, the building designs in this study are very good in comparison, asassociated building maintenance only contributes around 1% to the total impact and between11% (Steel building) and 17 % (TimberPlus) <strong>of</strong> initial embodied energy.
- 86 -This shows that if a building is well designed and constructed, even if embodied energy isrelatively high, maintenance impacts will be much lower over time which decreases theoverall life cycle impact.6.5.4 Comparison Between Landfilling and MaterialReutilisationThe results show a variation in end-<strong>of</strong>-life impact between landfilling (creating carbonstorage) and material reutilisation (combusting wood for energy recovery, and recyclingstructural concrete and steel). These results showed that the reutilisation scenario resulted in areduction in total energy consumption in all buildings <strong>of</strong> 0.5% (Concrete) to 4% (TimberPlus)when compared with the landfill scenario. The reutilisation scenario also showed similarbenefits for GWP for the concrete and steel buildings, with 0.2% (Concrete) and 5% (Steel)reductions respectively. Conversely, in this scenario, the Timber and TimberPlus buildingsshowed an increase in total GWP <strong>of</strong> 0.5 and 1% respectively, when compared with the landfillscenario.The GWP <strong>of</strong> the Steel and Concrete buildings decreased in the reutilisation scenario due toavoidance <strong>of</strong> production <strong>of</strong> primary materials (aggregate and primary steel). In the Timberand TimberPlus buildings, landfilling showed a carbon storage benefit, while combusting thewood for energy displaced the use <strong>of</strong> fossil fuels. Overall the GWP results for Timber andTimberPlus buildings in the two scenarios showed a slight favour to landfilling, though theresults are so similar that no real conclusion can be made other than that both options result ina negative end <strong>of</strong> life GWP figure, which reduces the total life cycle GWP.Material reutilisation enabled a recovery <strong>of</strong> energy for all building types. Reutilisationrecovered a proportion <strong>of</strong> the embodied energy <strong>of</strong> the wood that would otherwise be wasted ifthe wood was landfilled. Therefore the buildings with the largest energy recoveries were theTimberPlus and Timber buildings, as these buildings were composed largely from renewablewooden materials that could be combusted for energy recovery. The Steel building also had areduction in energy use when the structural steel was recycled, as production <strong>of</strong> primary steelis avoided.Recycling the steel and concrete in the reutilisation scenario would be more beneficial thansimply landfilling these materials because this displaces the need to use new primarymaterials – in the case <strong>of</strong> steel these materials have a high initial embodied energy and GWP.For the Concrete building the differences are not as pronounced, however there are still slightGWP and energy reductions as a result <strong>of</strong> material reutilisation.In summary, reutilisation shows clear benefits for the Steel building. The Concrete buildinghas energy and GWP benefits from reutilisation, though they are small enough to be affectedby changes in transport distances. Both scenarios result in end <strong>of</strong> life GWP reductions for theTimber and TimberPlus buildings. However, the reutilisation scenario shows the additionalbenefit <strong>of</strong> energy recovery and displacement <strong>of</strong> fossil fuels.The comparison between the two end-<strong>of</strong>-life scenarios shows that conclusions based on asingle indicator could lead to unintended outcomes. <strong>Using</strong> the TimberPlus building as anexample, the results <strong>of</strong> the landfilling scenario would be slightly better in terms <strong>of</strong> climatechange. However, looking at the energy results alongside the global warming potential
- 87 -results, the reutilisation scenario shows an energy reutilisation benefit, as well as still beingbeneficial to climate change. Therefore, the use <strong>of</strong> multiple indicators is necessary to informenvironmental decision-making processes.6.5.5 Transport Distances Sensitivity TestThe analysis <strong>of</strong> different transport distances has shown that the contribution <strong>of</strong> transport to thetotal life cycle is not significant. Differences between the short and long distance scenarioswere minimal.6.5.6 Green Star assessmentThere are clear differences in the results based on the Green Star assessment and the LCA.The results <strong>of</strong> both tools were not consistent and it became obvious that the recycling content<strong>of</strong> steel and concrete drive the material related results. The reutilisation scenario in the LCAstudy has shown that there are environmental benefits related to the energy use <strong>of</strong> postconsumertimber. These environmental benefits can not be recognised in the Green Starassessment tool. The LCA reutilisation scenario has also shown that the recycling benefits forsteel are more significant than the benefits for recycling concrete, whereas Green Star <strong>of</strong>fers amaximum <strong>of</strong> 3 points for recycled concrete and only 2 points for recycled steel and the use <strong>of</strong>sustainable timber respectively.The different cut <strong>of</strong>f rules for steel and concrete (i.e. 1 %) and timber (0.1 %) also distort theresults. The amount <strong>of</strong> steel for example is less than 1 % in the Concrete, Timber andTimberPlus buildings. The questions relating to steel are therefore not applicable in thosebuilding types.However, concrete and timber have to be accounted for in every building type respectively.The credits for recycled concrete and FSC certified timber lead then to the result that the Steelbuilding comes out best in the recycling scenario, which awards points for recycled concreteand sustainable timber in addition to the points for recycled steel.On the other hand, the proportion <strong>of</strong> steel is less than 1 % in the Concrete and Timberbuildings, and consequently no credits are awarded for steel because the “Not applicable”option applies. Therefore, those buildings gain less points in total.It was also not possible to take the total amount <strong>of</strong> timber into account. Whereas the LCA hasshown clear differences between the Timber and the TimberPlus building, both have the sameresults in the Green Star assessment.The higher weighting <strong>of</strong> energy (25 %) than materials (10 %) for the single score <strong>of</strong> the GreenStar rating can be described as being consistent with the LCA study which has shown that theoperational energy consumption (as compared to the embodied energy <strong>of</strong> materials)dominates the results over the whole life cycle.
- 88 -7 Building ConstructionThis chapter is based on the work undertaken by Smith (2008) on his Master <strong>of</strong> Engineeringthesis, ‘Hybrid Laminated Veneer Lumbar <strong>Buildings</strong>; Detailing, Feasibility andConstructibility’.‘Constructability’ – the ease and speed <strong>of</strong> construction - <strong>of</strong> any new system is crucial to thefeasibility <strong>of</strong> that construction method. Speed <strong>of</strong> construction will quite obviously affect theoverall cost <strong>of</strong> any building (for instance, the length <strong>of</strong> time that an expensive crane has to beon-site). However, it is also important to realise that quicker construction could <strong>of</strong>fer anopportunity cost saving – a shorter period <strong>of</strong> construction can allow an owner / tenant tooccupy a building sooner.In order to analyse and compare the constructability <strong>of</strong> different buildings, encompassing bothmaterials and labour, it is necessary to understand the proposed construction method andensure that it is both feasible and optimised.The beginning <strong>of</strong> this chapter briefly outlines the construction method <strong>of</strong> the proposed posttensionedTimber buildings and the pre-cast Concrete building. A comparison is presentedbetween the construction times <strong>of</strong> the two buildings.7.1 Construction Method <strong>of</strong> the Timber <strong>Buildings</strong>Well-planned construction methodology can dramatically reduce the amount <strong>of</strong> time taken inthe assembly <strong>of</strong> a structure. It is crucial that the construction method utilises the <strong>of</strong>f-siteprefabrication <strong>of</strong> the timber members as one <strong>of</strong> the key advantages <strong>of</strong> the post-tensionedtimber system. In order to assist the rapidity <strong>of</strong> construction the building was separated intothree sections (Figure 7.1Figure 7.1Figure 7.1) enabling workers to perform tasks on separatesections without conflict. The proposed construction procedure is briefly detailed.NFigure 7.1: Building construction sections
- 89 -7.1.1 Platform and Balloon ConstructionTwo main types <strong>of</strong> construction method exist for the erection <strong>of</strong> light timber buildings. Thesemethods can also be used for the erection <strong>of</strong> a post and beam structure (Buchanan, 2007) suchas the post tensioned LVL system. The first <strong>of</strong> these methods is platform construction, shownin Figure 7.2a in which the building is constructed on a floor by floor bases. This mean thecolumn and wall segments will by one single storey high. This method has the advantage <strong>of</strong>providing a consistent working platform from the floor below. In the construction <strong>of</strong> lighttimber frame buildings, this method is not recommended for buildings above four storeys ascrushing due to perpendicular-to-grain loading will become a problem. The second method isthat <strong>of</strong> balloon construction, as shown in Figure 7.2b, where the columns and walls arecontinuous over several storeys and beams and flooring are then attached up the height, withthe erection <strong>of</strong> three floors occurring without the additional placing <strong>of</strong> vertical members. Thismethod can save construction time due to less members being assembled on site. Theprefabrication <strong>of</strong> members, added to the lightness <strong>of</strong> timber, means that the balloonconstruction method is preferred for post- tensioned timber construction.a)b)Figure 7.2: a) Platform construction method b) Balloon construction method7.1.2 Assembly <strong>of</strong> Key ComponentsThere are a number <strong>of</strong> key components/technologies identified with the construction <strong>of</strong> theTimber buildings which contribute to the ‘constructability’ <strong>of</strong> the designs. Current research atthe Department <strong>of</strong> Civil and Natural Resource Engineering at the University <strong>of</strong> Canterburyincludes;
- 90 -• Wall and column to foundation attachment.• Beam attachment.• Timber / concrete composite flooring systems and floor attachment.• Splicing <strong>of</strong> wall and column members.• Post tensioning.Further details are provided in the referenced Masters thesis.7.2 Construction Method <strong>of</strong> Concrete BuildingThe construction <strong>of</strong> the alternative Concrete building would proceed in a similar manner tothat <strong>of</strong> the Timber building, as both consist largely <strong>of</strong> prefabricated members. The same‘section’ construction technique will be adopted. The major variation between the twobuildings is that the wall and columns <strong>of</strong> the Concrete structure are only <strong>of</strong> a single storey inheight, meaning that platform construction rather than balloon construction will take place.Figure 7.3 shows the assembly <strong>of</strong> this structure.Figure 7.3: Construction <strong>of</strong> pre-cast concrete case study building7.3 Construction Time AnalysisThe time taken on a construction project can have a considerable effect on the feasibility <strong>of</strong> agiven project. Therefore, one <strong>of</strong> the key performance indicators <strong>of</strong> any construction system isthe overall construction time. With this in mind, the time taken to assemble the case study
- 91 -buildings has been analysed and compared. Arrow International Ltd., Project ManagementConsultants, was consulted to ensure the construction scheduling for both case studies areestimated with reasonable accuracy.Some assumptions had to be made in order to predict the necessary time needed. Theseassumptions are listed below:• Column and wall members will take one hour to erect after arrival onsite.• Beam members will take half an hour to place after arrival onsite.• Flooring units will take twenty minutes to place after arrival onsite.• The floor topping will be undertaken in two pours, each taking one day.• Architectural fit-out will not be considered for either building.• Available personal onsite will not limit construction time.The buildings are divided into sections in order to increase rapidity <strong>of</strong> construction. <strong>Using</strong> thisinformation Gantt charts <strong>of</strong> the proposed construction sequence were developed for both theConcrete (Figure 7.4Figure 7.4Figure 7.4) and Timber buildings (Figure 7.5).From Figure 7.4Figure 7.4Figure 7.4 and Figure 7.5 above it can be seen that the overallconstruction time for the Concrete building is 67 days and 69 days for the Timber building.The first floor <strong>of</strong> each structure take the longest time as the foundations must cure adequately.It can be seen that the sub-structure work takes almost one third <strong>of</strong> the time <strong>of</strong> construction ineach building. On completion <strong>of</strong> the first level, the rapidity <strong>of</strong> pre-fabricated construction isevident. Each level <strong>of</strong> both structures takes approximately 15 days to complete.The major point <strong>of</strong> difference between the two buildings is the method <strong>of</strong> construction used.The use <strong>of</strong> the balloon construction method means that the Timber structure only placesvertical members in two lifts during construction, compared to the Concrete structure whichmust place wall and column members at each floor. The Concrete assembly negates this issueby using pre-fabricated members containing both column and beam elements, and as lessmembers are required on each floor, a similar time can be achieved.A direct comparison between the two construction times shows little difference in timemeaning that comparable construction times can be achieved with the proposed posttensionedtimber construction.
- 92 -Figure 7.4: Construction schedule summary for pre-cast Concrete building
- 93 -Figure 7.5: Construction schedule summary for Timber building
- 94 -8 A Review <strong>of</strong> the Timber Used in the Timber<strong>Buildings</strong>8.1 GeneralWarren and Mahoney architects in Christchurch were engaged to report on the supply,sustainable forestry certification and treatment <strong>of</strong> the timber materials and components <strong>of</strong> thebuildings covered by this report.A summary <strong>of</strong> the Warren and Mahoney report, included in its entirety in Appendix F, ispresented below.Whilst all four building designs use some timber materials, it is the Timber and TimberPlusdesigns which make extensive use <strong>of</strong> timber. Both utilise timber for the main structuralcomponents <strong>of</strong> the multi-storey buildings. However, it is the TimberPlus design whichmaximises the use <strong>of</strong> timber throughout both structurally and architecturally, both internallyand externally (see Chapter 4, The <strong>Buildings</strong>).The Timber and TimberPlus buildings have been rigorously designed. This research goesbeyond a purely theoretical study <strong>of</strong> a ‘timber building’ to <strong>of</strong>fer designs which incorporateproven engineering and are capable <strong>of</strong> being constructed today.In order to support the proposal that the Timber and TimberPlus buildings are ‘real’, it isnecessary to investigate and validate the supply <strong>of</strong> the timber materials in the quantities inwhich they would be required and where such materials would be commercially sourced,locally or imported. All timber needs to be ‘suitable’ for the location and purpose proposed.Building rating systems, such as NZ Green Star Office design (and a raft <strong>of</strong> similar toolswhich are due to be ‘rolled out’ in NZ in the next 24 months) place emphasis on any timbermaterials and components being sourced from a sustainable supply. The present NZ GreenStar Office design tool recognises only Forest Stewardship Council (FSC) certification.Warren and Mahoney sourced timber materials from supply chains which could demonstratesustainable forestry certification wherever possible.The treatment <strong>of</strong> timber, and the chemicals associated with treated timber, are issues <strong>of</strong> greatimportance from a ‘healthy living perspective’, from the impact on the environment duringthe production process and during lifetime usage and, <strong>of</strong> increasing importance, from theperspective <strong>of</strong> disposal <strong>of</strong> deconstructed building materials and components at the end-<strong>of</strong>-life.Section 8.6 gives a brief update on the current situation in NZ for recycling and disposal <strong>of</strong>treated timber waste.The Warren and Mahoney report, also <strong>of</strong>fers advice on additional opportunities to maximisetimber in the buildings.
- 95 -8.2 Source and Availability <strong>of</strong> TimberNew Zealand has a substantial forestry industry which ranges from the efficient growing <strong>of</strong>specialist plantation species through to modern harvesting techniques, to milling andtreatment, the provision <strong>of</strong> engineered timber products such as laminated veneer lumbar(LVL) and Glulam and the manufacture <strong>of</strong> timber components.Increasingly, a large range <strong>of</strong> timber products are available to <strong>of</strong>fer alternative options todesigners and builders for both main structural building components and architecturalfinishes.NZ forestry – and hence the product supply chain – is dominated by Pinus radiata. Thisversatile timber <strong>of</strong>fers a product range which, with little processing, can be used for thesupply <strong>of</strong> standard framing material through to lower end value-added products such asplywood and medium density fibreboard (MDF) and increasingly through more technicalmanufacturing processes to engineered components, such as LVL.P. radiata is not a naturally durable timber, <strong>of</strong>ten requiring treatment to extend its lifetimeand useful range <strong>of</strong> applications. An alternative to treatment is to source more naturallydurable species, such as Western Red Cedar. Also, for both technical and aesthetic reasons,other timber species may be more appropriate than P. radiata in some applications.The Warren and Mahoney report covers each timber component <strong>of</strong> the buildings and details acommercial source which could meet the demand for the quantities specified in the buildingdesigns. Where possible, timber has been sourced from a local supply.NZ supplied P. radiata was suitable for much <strong>of</strong> the structural timber, finishing and joineryincluding the following;• Columns, beams, joists, shear walls and portals.• Interior and exterior wall framing.• Internal solid walls.• Ro<strong>of</strong> and parapet framing.• Ceiling tiles.• Floor.• Internal stairs.• Exterior wall cladding.The TimberPlus building proposes a P. radiata timber exterior wall cladding, ‘Shadowclad’,an engineered product supplied by Carter Holt Harvey.An interesting alternative for exterior cladding is the Flatline Board System currently underdevelopment by Australia’s Timber Development Agency (TDA)(www.timber.net.au/flatline) – this is an “open-source” system which can be utilised by anycladding manufacturer. Theoretically, therefore, it could be manufactured in NZ utilisinglocally sourced timber.The quantities <strong>of</strong> LVL required for the Timber and TimberPlus buildings are certainlyavailable for supply in NZ. Plywood, MDF and framing materials are readily available “<strong>of</strong>fthe shelf”.
- 96 -NZ has a limited supply <strong>of</strong> alternative timber species, such as cedar, and, for the commercialquantities required, this has been sourced from overseas. Cedar has been proposed for all thewindow reveals and for the louvres.8.3 Certification <strong>of</strong> TimberThis topic is briefly documented by the Warren and Mahoney report noting FSC and othermajor sustainable timber sourcing schemes. Each timber and component are coveredseparately and have been sourced from a ‘certified’ supply wherever possible.Much <strong>of</strong> NZ’s commercial P. radiata forestry is now covered by some form <strong>of</strong> recognisedcertification system, guaranteeing a level <strong>of</strong> sustainable supply (largely FSC). However,certification does not always apply to the complete supply chain and this is an area whichneeds further development in NZ (and internationally).The Warren and Mahoney report notes that LVL supplied by Nelson Pine Forests forcolumns, beams, joists, shear walls and portals (the nearest LVL supplier for the Christchurchlocated buildings) is not currently certified. However, it also notes that Carter Holt HarveyLtd. can supply FSC certified timber and LVL 11 .11 TimberNews (http://www.mycustompublishing.com.au/e-news/issue35.html) reported the following in the 30 thJune 2008 edition (the text has been edited and abbreviated to include only relevant information);Carter Holt Harvey has engaged Ensis in Australia, the local agent for Scientific Certification Schemes (SCS), toprovide certification <strong>of</strong> its mills. SCS is recognised by the Forest Stewardship Council (FSC) standard.In NZ, SCS has so far audited ply mills at Tokoroa and Mt Maunganui and the Marsden Point LVL mill (andother CHH sawmills at Yarram, Morwell and Myrtleford and the ply mill at Myrtleford in Australia).Carter Holt Harvey uses chain <strong>of</strong> custody (CoC) certification to ensure that all wood in its products is legallysourced from sustainably managed forests. Chain <strong>of</strong> custody certification creates the essential link betweencertified forests and timber processors, providing accreditation for responsible timber production acrossmanufacture, wholesale and retail.Forest Certification Scheme (FCS) provides chain <strong>of</strong> custody certification to timber producers andmanufacturers. The scheme incorporates quality systems; material sourcing; production controls; transactiondocumentation, and labelling. In the case where Carter Holt Harvey (Australia) purchases products from NewZealand mills, CoC certification <strong>of</strong> key warehouses will also be required. FSC chain <strong>of</strong> custody certification lastsfor five years.Meanwhile, Carter Holt Harvey has outlined its environmental program, titled Wood Naturally, with a new videoand brochure explaining the assessment program and actions the company is taking to achieve national targetsfor a sustainable built environment.<strong>Environmental</strong> assessment tools are being used by CHH to ensure its practices and products are sourced andproduced responsibly. The company aims to have wood products recognised for their contribution towardssustainable construction. The company has been working across a number <strong>of</strong> fronts to achieve this goal:• Working with the CSIRO to contribute baseline data on the manufacture and processing <strong>of</strong> timber productssuch as plywood, particle board and MDF, which will then be used to compare the qualities <strong>of</strong> wood productswith other building materials.• Sourcing Chain <strong>of</strong> Custody (CoC) certification <strong>of</strong> all its mills in Australia and New Zealand to independentlydemonstrate that wood being used is sourced from sustainably managed forests.• Communicating its environmental credentials and goals through online updates on procurement policy, millcertification and benefits <strong>of</strong> wood as a building product.
- 97 -It would be incorrect, however, to assume that because something is made from P. radiata itcan be sourced with FSC certification – each product needs to be investigated individually.Carter Holt Harvey have committed to a process <strong>of</strong> “FSCing” their entire product range - asshown below - so very soon, certified versions <strong>of</strong> most P. radiata products, when purchaseddirectly from CHH, will be available. (CHH are leading the way in this but othermanufacturers will be forced to follow suit or lose market share).a. LVL available now FSC certified.b. Laserframe and rough sawn timber / decking available now FSC certified.c. Ply available now FSC, CoC certified (including Shadowclad).d. MDF and Timber pr<strong>of</strong>iles (weatherboard etc.) FSC certification expectedJuly/August ’08.e. Hi-Joist FSC certification expected Oct / Nov ’08.The Flatline Board System is still only a theoretical system, so theoretically P. radiata withan FSC rating could be used to produce this product.Warren and Mahoney advise (Pers. comm., Iain Nicholls) that FSC certified medium densityfibreboard (MDF) will soon be available from Carter Holt Harvey Woodproducts with an E1VOC rating. (Note that in this report, MDF ceiling tiles were sourced from Nelson Pine whomanufacture MDF under the brand name “Goldenedge”. Whilst Nelson Pine is not currentlyFSC certified for this product, it is expected that a similar product with FSC certificationcould be sourced).FSC certified cedar is available in NZ from a Canadian source.Whilst care may need to be taken to ensure sourcing <strong>of</strong> sustainably certified timber, thesupply in NZ and worldwide is increasing as certification becomes almost mandatory ininternational markets.8.4 Timber Treatment and DurabilityAppropriate timber treatment extends the useful range and durability <strong>of</strong> many timberproducts. Treatment is generally taken to mean the addition <strong>of</strong> preservatives which infuse thetimber <strong>of</strong>ten at the time <strong>of</strong> processing <strong>of</strong> the timber (such as boron salts, light organic solventpreservatives (LOSP), etc.). However, durability is also greatly influenced by surfacecoatings such as paints and stains and must also be considered when investigating theenvironmental impacts. The Warren and Mahoney report documents timber durabilityclasses, places all the proposed timber products within the appropriate durability class andproposes treatment methods and schedules for each timber product. The report also listssuitable timber finishes and maintenance schedules to extend durability and appearance.Timber preservatives are listed in order <strong>of</strong> preference following the requirements <strong>of</strong> the NZBuilding Code and NZS3602. Strictly adhering to these treatment methods and schedules isextremely important, applying both to timber exposed to severely harsh weathering on theoutside <strong>of</strong> a building and also to more protected internal finishes.
- 98 -Note that whilst the utilisation <strong>of</strong> timber waste after deconstruction (<strong>of</strong> buildings) by burningfor energy production is not widely available in NZ at present (see section 8.6), it is importantto consider a future scenario where timber waste could be better utilised. The type and level<strong>of</strong> treatment <strong>of</strong> timber both during its initial processing (and manufacturing if applicable) andduring its lifetime could have a great effect on the suitability and, therefore, possibility <strong>of</strong>utilising deconstruction waste at the end-<strong>of</strong>-life <strong>of</strong> a building. It is certainly thought prudentto avoid CCA (copper-chrome-arsenic) treatments wherever possible.Appropriate design <strong>of</strong> the buildings, the suitability <strong>of</strong> proposed products and awareness <strong>of</strong>durability are all extremely important to ensure the longevity <strong>of</strong> the timber-based buildings.Building design considerations ensure that structural LVL components are not exposed todamaging deterioration during the proposed lifetime <strong>of</strong> the buildings.In keeping with current best practice, Warren and Mahoney advise that the use <strong>of</strong> CCA(copper chrome arsenic treatments) are to be avoided and, as such, wherever possible, thearchitects have avoided specifying CCA for any <strong>of</strong> the TimberPlus buildings components.Instead, products have been specified which have less potent ACQ treatments (or Borontreatments for lesser exposure areas, as defined by the NZBC, and Shadowclad is pre-treatedwith H3.1 LOSP azole). ACQ is a waterborne, Alkaline Copper Quaternary preservativesystem developed to provide long-term protection to wood exposed in exterior applications.ACQ is based on copper combined with a quaternary ammonium compound and is applied towood by pressure treatment. Copper and quaternary ammonium compounds are effectivefungicides and termiticides. Together they provide protection against a broad spectrum <strong>of</strong>decay fungi, borer and termites. ACQ can be used in all locations that CCA would previouslyhave been specified except H6. Wherever treatments are not required by code they haveavoided them.Cedar – used externally for both window framing and louvres – requires adherence to a strictmaintenance schedule. The Warren and Mahoney report notes that “with correctmaintenance <strong>of</strong> surface finishes, cedar is expected to last well in excess <strong>of</strong> the 60 yearbuilding lifespan”.The TDA Flatline Board System, proposed as the external cladding for the TimberPlusbuilding, is a theoretical system which has been designed for P. radiata. There are manyexamples <strong>of</strong> well designed NZ buildings constructed from P. radiata weatherboards whichhave lasted well in excess <strong>of</strong> 60 years – the key is the maintenance <strong>of</strong> the coatings and thebuilding’s design avoiding the creation <strong>of</strong> enduring damp conditions. As advised by Warrenand Mahoney Architects (Iain Nicholls, pers. comm.), it is expected that the TDA systemwould be no different.Similarly, Shadowclad plywood pre-treated to H3.1 with LOSP azole, also proposed forexternal use in the TimberPlus building, is designated to last 50 years when properlymaintained (Pers. comm. between Carter Holt Harvey and Iain Nicholls) and it was furtherconfirmed that that there would be no reason to expect any failure during the life <strong>of</strong> a 60 yearbuilding if properly maintained.
- 99 -8.5 Additional Opportunities for the Use <strong>of</strong> TimberThe Timber and TimberPlus buildings both use an increased amount <strong>of</strong> timber in theirconstruction (over and above a comparable concrete or steel building). However, the researchuncovered additional opportunities for the use <strong>of</strong> timber which were not included in thebuilding designs analysed for environmental impacts (designs had to be finalised at a fairlyearly stage <strong>of</strong> the research in order for energy modelling and LCA work to proceed).The Warren and Mahoney report identifies and provides details <strong>of</strong> some <strong>of</strong> these additionalopportunities including the greater use <strong>of</strong> timber products in the ceilings and interior walls, asinsulation and for floors, as well as externally.8.6 Current Situation in NZ for Recycling and Disposal <strong>of</strong>Treated Timber ProductsThe conference paper “Extended Producer Responsibility <strong>of</strong> Treated Timber Waste”presented by Simon Love at the SB07 Sustainable Building conference in New Zealand in2007 (Love, 2007) provides a good overview <strong>of</strong> the current options for the recycling anddisposal <strong>of</strong> treated timber waste. A summary <strong>of</strong> the paper is included below.Treated timber is a waste stream <strong>of</strong> significant volume in NZ. Whilst exact figures for theamount <strong>of</strong> treated timber waste are not available, an estimated production volume <strong>of</strong> 830,250m 3 <strong>of</strong> treated timber in NZ in 2006 indicates that there is potential for a large supply <strong>of</strong> treatedtimber waste products in future years.Untreated timber, with no chemical preservatives, has many recycling options such as reuse,mulch, fibreboard, chipboard, animal bedding, compost and energy/heat recovery. Indeed,the utilising wood waste for the production <strong>of</strong> energy by thermal treatment (burning) is widelyused in some sectors <strong>of</strong> NZ industry (for instance, in sawmills and timber processing plants).Recycling <strong>of</strong> untreated wood waste appears to be market-driven, with the recyclers receivingwood waste for a fee, and selling mulched wood products to customers. These products areusually chipped wood for boiler fuel or shredded wood for use as garden mulch.However, utilising treated wood waste with infused chemical preservatives and/or superficialpaints and stains presents a much more problematic situation due to the presence <strong>of</strong> toxicproducts, such as arsenic and the possible release <strong>of</strong> harmful chemicals in to the atmosphere.Extended producer responsibility (EPR) is seen as an essential step towards being able toutilise timber waste.8.6.1 Thermal TreatmentThermal treatment encompasses incineration, gasification and pyrolysis. Incineration involvesburning the timber waste in air. This can result in the volatilisation <strong>of</strong> the chemicals in thewood, particularly arsenic when CCA-treated timber is burned. For an incineration process tobe considered as an environmentally responsible end-<strong>of</strong>-life solution, the emissions from theincineration process must be within acceptable limits. This could be achieved with a filtrationsystem. Incineration plants are currently being used to dispose <strong>of</strong> only untreated waste woodin Europe.
- 100 -Gasification <strong>of</strong> waste wood involves the extraction <strong>of</strong> gaseous fuel from wood by heating inan oxygen-free environment. The gas from the wood (which can include hydrogen andmethane) is then mixed with oxygen and used for energy production, for example in gasturbines. This method can be an effective way <strong>of</strong> recovering energy from waste wood. Theproblem with using gasification for waste treated timber is the same as with incineration.Gasification usually occurs at above 800 °C, and at this temperature volatilisation <strong>of</strong> arsenicwill occur. Again the waste gas stream would have to be cleaned before it could be released tothe atmosphere. Currently there are no commercial projects that use gasification to processtreated waste wood.Pyrolysis is a similar process to gasification, except the decomposition <strong>of</strong> the wood happensat much lower temperatures (
- 101 -example, removal <strong>of</strong> CCA treatment from treated wood has been demonstrated using oxalicacid and copper-tolerant bacteria. (Clausen, 2004) This process reported removal rates as highas 83 % for Cu, 86 % for Cr, and 95 % for As. The downside to this technology is the timeand expense needed to complete this extraction. The method involves an 18-hour extractionusing oxalic acid to remove the chromium and arsenic, followed by a 7 to 9 day bioleachingprocess to remove the copper. Some brown-rot fungi have displayed copper tolerance, andhave been successfully used for the purpose <strong>of</strong> treatment extraction. (Taylor, 2005).Electro-dialytic remediation is a method developed and patented at the Technical University<strong>of</strong> Denmark (DTU). It uses an electric current to mobilise the metal ions in solution, and anion exchange membrane to then separate the electrolytes out. Prior to electro-dialytictreatment, wood is soaked in solutions <strong>of</strong> oxalic acid or a combination <strong>of</strong> phosphoric acid andoxalic acid. In experiments, this type <strong>of</strong> electro-dialytic treatment removed up to 87% <strong>of</strong> theCu, 81% <strong>of</strong> the Cr and >95% <strong>of</strong> the As in wood. (Christensen, 2004).All <strong>of</strong> the remediation techniques mentioned above have a major drawback; that is, the woodmust be chipped or ground into small particles to achieve a high extraction rate. This is anenergy-intensive process. Also, high volumes <strong>of</strong> wood would be difficult to process due to thelengthy time these processes take. A 10-day treatment time, plus drying time and thepossibility <strong>of</strong> altered wood properties (important if the wood is to be recycled intoparticleboard etc.) renders these processes impractical at this current time. One very importantpoint is that the literature articles describe how the processes result in virtually non-toxicwood, yet most <strong>of</strong> these articles neglect to mention what happens to the extraction liquid,which will have become saturated with heavy metals. The disposal or processing <strong>of</strong> this liquidcould be <strong>of</strong> serious environmental concern.An ideal solution for end-<strong>of</strong>-life treated timber would be a recycling or disposal process thatcan deal with treated and untreated wood, without the need for additional processing (see alsosection 8.6.5).8.6.3 RecyclingA few different options for creating recycled products have been tested with treated timber.Many <strong>of</strong> these are mentioned in the 2005 UK-based report on treated wood waste (WRAP,2005). Products such as particleboard, chipboard and oriented strand board (OSB) cantheoretically be made with treated timber; however there are drawbacks to this.Firstly, in Europe and the UK, contamination standards are set for the production <strong>of</strong>particleboard (and similar products). These standards would mean that the percentage <strong>of</strong>CCA-treated timber that could be used in particleboard production would be less than 1 %.Also, CCA-treated timber that had been subjected to oxalic acid chemical extraction andbacterial remediation displayed a reduction in integrity and strength (but an increase inelasticity) once processed into particleboard.Standard CCA-treated wood waste used in particleboard resulted in similar physicalproperties, yet leaching <strong>of</strong> arsenic was relatively high. (Clausen, 2000 and 2001). Wetprocessedfibreboard using CCA-treated timber can be made with very similar properties asnormal untreated fibreboard, however the product is processed in water, and the cleanup <strong>of</strong>this water could pose problems due to the leaching <strong>of</strong> arsenic. In New Zealand, the Auckland
- 102 -Regional Council has put in place regulations preventing the use <strong>of</strong> treated timber inparticleboard production.Wood-plastic and wood-cement composites are another potential application <strong>of</strong> recycledtreated timber. Wood-cement composites can include cement-bonded particleboard, woodfibre cement boards, concrete construction blocks, acoustic barriers and ro<strong>of</strong> tiles. In general,these products perform well, in some cases better than alternatives using untreated wood.Properties such as susceptibility to leaching, bending strength and stiffness can be improved.Wood-plastic composites are at a very early stage and therefore little is known about theirpotential properties. Ultimately however, wood-cement and wood-plastic composites aremerely shifting the problem <strong>of</strong> difficult waste further along the life cycle. Waste disposal <strong>of</strong>these composites could pose further problems at the end <strong>of</strong> these products’ lives.Mulch and compost are other potential uses for treated timber waste. However, with thesurface area vastly increased, and a high exposure to water, the risk <strong>of</strong> leaching <strong>of</strong> chemicalsfrom CCA-treated timber is likely to be multiplied many times.8.6.4 Extended Producer Responsibility (EPR)Extended producer responsibility (EPR) is a concept which places the responsibility for theend-<strong>of</strong>-life environmental impacts <strong>of</strong> a product on the producer. This involves facilitatingreturn <strong>of</strong> the product to the producer, followed by processing to recycle what is possible andminimise waste. In New Zealand EPR schemes exist for cellphones, unused paint andwhiteware. Internationally, schemes exist for end-<strong>of</strong>-life vehicles, electronic equipment,packaging, batteries and others. Treated wood would be an excellent target for an EPRscheme as it is a waste that is potentially hazardous, takes up unnecessary space in landfills,and has the potential for energy recovery. Also with the Waste Minimisation (Solids) Billappearing before parliament, producers are becoming aware <strong>of</strong> the need to be responsible withtheir waste.New Zealand currently has no timber EPR schemes in place for either untreated or treatedtimber.However, the upcoming Waste Minimisation Bill specifies that the Waste MinimisationAuthority will be set up, which will collect a Waste Disposal Levy. This levy will be chargedat the time <strong>of</strong> disposal <strong>of</strong> waste, and will fund the authority, as well as funding projects toassist with waste minimisation.The Waste Minimisation Bill contains a section on EPR (though it uses the terms EPR andproduct stewardship interchangeably). This Bill does not propose legislation for compulsoryproduct stewardship/EPR schemes; it focuses on the compulsory participation <strong>of</strong> a produceronly if a product stewardship/EPR scheme already exists. This participation would includeprovision <strong>of</strong> collection facilities, and a minimum recycling, reuse or material recovery rate <strong>of</strong>75% <strong>of</strong> end-<strong>of</strong>-life products received at these recycling facilities. The bill also states thatsufficient notice will have to be given if there is an intention to consider the need for aproduct stewardship programme for a product.
- 103 -The Waste Minimisation Bill stemmed from the Ministry for the Environment WasteStrategy. The most relevant part <strong>of</strong> this strategy to treated timber is the statement: “ByDecember 2008, there will have been a reduction <strong>of</strong> construction and demolition waste tolandfills <strong>of</strong> 50 percent <strong>of</strong> December 2005 levels measured by weight.” This will significantlyaffect wood waste, as inert wastes such as concrete are already sent to clean-fills.8.6.5 Sorting <strong>of</strong> Timber WasteIdeally, in time, a recycling/disposal technology that can process both treated and untreatedtimber will eventuate. However, if this is not feasible, any recycling <strong>of</strong> treated timber wastewould have to involve a sorting process to separate treated timber from untreated wood. Anumber <strong>of</strong> options could <strong>of</strong>fer sorting solutions ranging from visual sorting and PAN stain (astain formulation that can detect copper-containing preservatives), to X-ray fluorescence (anon-destructive characterisation technique that can detect different elements in solid or liquidsamples) and laser-induced breakdown spectroscopy (LIBS; use <strong>of</strong> a laser to ablate and ionisewood into a plasma).8.6.6 The Way Forward for NZThe Scion conference paper “Extended Producer Responsibility <strong>of</strong> Treated Timber Waste”(Love, 2007) <strong>of</strong>fers recommendations for the future utilisation <strong>of</strong> treated timber.New Zealand’s treated timber producers should strive to establish a voluntary EPR schemebefore any legislation is put in place. This would require establishing who the responsibleproducers <strong>of</strong> treated timber are (wood producers, treatment chemical producers, forestrycompanies) and what processes should be implemented to deal with treated timber waste.There are many different sorting & treatment options available, in varying stages <strong>of</strong> maturity,and the option that should be chosen depends on whether carbon sequestration, energyproduction or life-cycle thinking are the key priorities and also on ongoing research, such asthat into leaching and decomposition rates for treated wood in landfills.Research would give a clearer idea <strong>of</strong> whether landfilling is actually an environmentallyacceptable practice for treated timber. At present, nowhere else in the world has landfillingbeen considered an acceptable solution for treated timber waste in the future, due to theunknowns about the behaviour <strong>of</strong> treated timber in landfills over much longer time periodsEnergy recovery from treated (and untreated) timber waste provides a way to significantlyreduce the volume <strong>of</strong> wood waste which would normally end up in landfills. The downside tothis is that the sequestration <strong>of</strong> CO 2 in the timber is no longer a benefit, as CO 2 will bereleased upon incineration, gasification or pyrolysis <strong>of</strong> the timber. This is still considered a‘carbon neutral’ process as the CO 2 that is released is essentially carbon that the plantabsorbed during its life time. The debate here is between ‘carbon neutral’ processes that couldprovide energy, and carbon-reducing processes that take up space in landfills and couldpotentially leak arsenic into the earth.
- 104 -Landfilling would <strong>of</strong>fer carbon sequestration at the expense <strong>of</strong> leaching risks & landfillstorage space, incineration would <strong>of</strong>fer energy production at the expense <strong>of</strong> carbon storage,and other thermal treatments <strong>of</strong>fer a clean life-cycle approach, though still at the expense <strong>of</strong>carbon storage. Without clear priorities it is difficult to recommend a ‘best’ option at thisstage. Ultimately, the best option for New Zealand depends on the priorities <strong>of</strong> governmentand industry.8.6.7 Current Research Into Energy Recovery from TreatedTimber in NZThe authors have been unable to establish that any research is currently underway in NZ onthe utilisation <strong>of</strong> treated timber by burning. From personal communications, the authorsunderstand that the following parties would be interested in pursuing such research.Chemical and Processing Engineering, University <strong>of</strong> CanterburyThe authors have had personal contact with Shusheng Pang, Associate Pr<strong>of</strong>essor in theChemical and Process Engineering department and Director <strong>of</strong> the Wood TechnologyResearch Centre at the University <strong>of</strong> Canterbury.Associate Pr<strong>of</strong>essor Pang has developed strong interests in renewable biomass energy. He isthe leader <strong>of</strong> a research programme that has been awarded over $1.9 million over four years todevelop a system for using wood industry wastes to produce electricity and thermal energy.As a collaborative programme, research at the University <strong>of</strong> Canterbury is being done by theUniversity's Wood Technology Research Centre under programme leader Associate Pr<strong>of</strong>essorShusheng Pang and colleagues including and Associate Pr<strong>of</strong>essor Bruce Manly <strong>of</strong> theForestry School. The research collaborators and industry partners are the University <strong>of</strong> Otago,Page Macrae Engineering Ltd., Meridial Solutions, the Selwyn Plantation Board Ltd., andDelta S. Technologies. The research group has established links to Thermal GasificationTask <strong>of</strong> International Energy Agency (IAE) which enables exchange <strong>of</strong> research with otherworld leading research organisations.However, the above programme is not currently investigating the utilisation <strong>of</strong> treated timberwaste.Future Forests ResearchFuture Forests Research is a new venture by the New Zealand forestry sector to enhance thevalue <strong>of</strong> forests and forestry for New Zealand through strategic management andimplementation <strong>of</strong> research.FFR is a partnership between the leading NZ forestry companies, NZ Forest OwnersAssociation, the Farm Forestry Association and Scion. Membership includes Regional andDistrict Councils and research and educational organisations.Future Forests Limited recently applied for research funding through the Sustainable FarmingFund carbon portfolio to investigate the utilisation through thermal treatment by pyrolosis <strong>of</strong>treated timber products but was unsuccessful (Pers. Comm., Keith Richards, Theme Managerfor <strong>Environmental</strong> and Social portfolio).
- 105 -9 Discussion9.1 The <strong>Buildings</strong>Much <strong>of</strong> the research covered by this report is built solidly upon the very successful earlystages <strong>of</strong> the project which produced structural and architectural designs for four buildingsconstructed out <strong>of</strong> different materials. These designs were all based on the exacting designspecifications and drawings for the Biological Sciences building produced by CourtneyArchitects and presently under construction at the University <strong>of</strong> Canterbury.In other words, the designs are based on a ‘real’ building, which became a template for thealternative Concrete, Steel, Timber and TimberPlus designs. In the case <strong>of</strong> the Steel andTimber buildings, major changes were made to the structural engineering and materials,accompanied by appropriate alterations to architectural design and materials to suit a typicalNew Zealand location. The TimberPlus building was similar to the Timber design withadditional modifications to the architecture to increase the use <strong>of</strong> timber and timbercomponents.All the designs are considered at least reasonably comprehensive for a preliminary designstage and address the main structural elements. All have been carefully checked andreviewed. The Steel building, initially proposed by Steel Construction NZ Ltd., was modifiedat the University <strong>of</strong> Canterbury in consultation with Holmes Consulting Group engineers inChristchurch (see the letter in Appendix E).The Timber and TimberPlus buildings are based on innovative timber engineering researchwhich builds on proven post-tensioning technology employed in pre-cast concreteconstruction. The timber engineering is presently undergoing rigorous collaborativeexperimentation and testing at the University <strong>of</strong> Canterbury, Auckland University andUniversity <strong>of</strong> Technology, Sydney.Most importantly, the building designs go beyond providing comparable constructions<strong>of</strong>fering the same net lettable area, facilities, operations and lifetime. Each building, whilsteasily meeting the standards for being a low energy building (average 86 kWh/m2/yr),achieves an operational energy consumption within 3% <strong>of</strong> each other.The Timber and TimberPlus designs and associated research have clearly helped to “fill theinformation gap” identified by MAF in the Request for Proposal (POR/7811) as to thegreatest amount <strong>of</strong> wood that can be used in the construction and fit-out <strong>of</strong> commercial andlarge-scale residential buildings in NZ.The production <strong>of</strong> the four alternative building designs fully meets Objective 1 set out in theUniversity <strong>of</strong> Canterbury response to RFP POR/7811.
- 106 -9.2 <strong>Multi</strong>-<strong>Storey</strong> Timber <strong>Buildings</strong>It is acknowledged that, at present, no multi-storey timber buildings with the design andstructural engineering proposed for the Timber and TimberPlus buildings have been builtanywhere around the world. However, all the research results to date go well beyond initialexpectations and support the proposition that traditional concrete or steel multi-storeybuilding designs could instead be constructed with timber structural elements andarchitecture, utilising considerably more timber materials and components.This considerable body <strong>of</strong> research is now moving beyond the laboratory and into thecommercial building industry. The Foundation for Science, Research and Technology(FRST) – a NZ Government funded research body – has approved the establishment <strong>of</strong> a newresearch consortium which has formed a company, the Structural Timber InnovationCompany (STIC) to continue and expand research and commercialise the research output.The consortium is joined by many <strong>of</strong> the major timber producing and manufacturingcompanies in NZ and Australia who are providing joint funding over an initial five yearperiod. This collaborative Consortium can itself be viewed as a major achievement inbringing together national and international companies and industry bodies (more normallyused to competing with each other), producer associations and research establishments, many<strong>of</strong> which have traditionally not worked closely together, to work towards a common goal.The success <strong>of</strong> securing substantial research funding both from the NZ Government andindustry, ultimately with the aim <strong>of</strong> constructing timber buildings similar to the timberdesigns considered by this research, is extremely encouraging. The ideas <strong>of</strong> the researchscientists are about to be put to the test in the real world <strong>of</strong> the hugely competitive,commercial building industry.9.3 Operational EnergyA vital phase <strong>of</strong> the energy analysis and modelling objective (Objective 2), and integral to theoverall research design, was the provision <strong>of</strong> alternative building designs which would allhave very similar operational energy consumption.The research demonstrates that each building easily meets the standards for being a lowenergy building, as well as achieving operational energy consumption for each buildingwithin 3% <strong>of</strong> each other.The very fact that this research demanded that the buildings needed to be designed withsimilar operational energy usage, provided constraints on the designs. In a ‘real’ building,design would be a trade-<strong>of</strong>f between many factors and engineering design, the building’sthermal envelope, the building’s services (heating, cooling and ventilation) and other internalenergy demands (such as lighting) would be heavily influenced by the building’s location(geography), usage and, very importantly, by cost. This study was constrained by the designsbeing suited to a Christchurch location; however, the cost incurred in modifying designs(materials, etc.) to provide similar operational energy usage was not a determining factor.In the thesis, The influence <strong>of</strong> construction materials on life-cycle energy use and carbondioxide emissions <strong>of</strong> medium size commercial buildings, Perez (2008) notes that;
- 107 -• The buildings tend to be ‘internal load-dominated’ and their operational energy is lessdependent on the thermal characteristic <strong>of</strong> the building.• Even lower operational energy consumption could be achieved depending on theamount <strong>of</strong> insulation and thermal mass in each building.• Thermal mass in the Timber buildings (and indeed, in the Steel building) could beprovided through using more wood (as thermal mass) and also presents the future –and interesting - possibility <strong>of</strong> using Phase Change Materials.• For any two buildings with the same total operational energy consumption, the relativeamount <strong>of</strong> heating and cooling energy consumption may be very different dependingon the thermal envelope and the amount <strong>of</strong> thermal mass in each building.• For the low energy consumption buildings in this study, only 25% <strong>of</strong> the energyconsumption is in heating and cooling; 75% is for lighting, room electricity,miscellaneous systems and domestic hot water.Previous attempts to compare lifetime energy consumption and GWP <strong>of</strong> buildings have beenhampered by building design – not only has the operational energy <strong>of</strong> the building been verysignificant but it has also differed between buildings being studied. Hence, the significance <strong>of</strong>embodied energy and other stages in the life cycle have been harder to determine and anydifferences in embodied energy have been over-ridden by differences in operational energy.This research has largely eliminated the operational energy variable and has allowed theimportance <strong>of</strong> other energy phases during the lifetime <strong>of</strong> the buildings – initial embodiedenergy, maintenance energy, transport and end-<strong>of</strong>-life –to be identified.It should be noted that providing buildings, as above, with similar operational energy was atime consuming task, requiring numerous ‘iterative’ designs where materials were changed,the design ‘tweaked’ and then the energy modelling was re-run. This would normally be avery expensive procedure.The operational energy design and analysis part <strong>of</strong> this research report was entirelysatisfactory and met Objective 2.9.4 The DataLife cycle assessment is entirely dependent on the data used at various stages in the analysis.The LCA process builds on data provided at a number <strong>of</strong> points during the analysis. Thequality <strong>of</strong> the data will largely determine the quality <strong>of</strong> any LCA study. The data - andassociated calculations – should be clearly presented, consistent and verifiable and anycalculations should be able to be reproduced.9.4.1 Operational EnergyPerez (2008) details all the data - and assumptions - on which the energy modelling for thefour alternative buildings is based. The Wellington based company e-Cubed Building
- 108 -Workshop Limited provided expert energy modelling consultancy advice to this part <strong>of</strong> theproject.The simulation schedules for the buildings (occupancy, plug and lighting, and HVAC) areconsidered realistic and typical for a Christchurch <strong>of</strong>fice building.As described in Chapter 6, a life cycle inventory dataset for New Zealand was used tocalculate the primary energy content and the GWP for electricity. This dataset takes the NewZealand electricity mix as well as New Zealand specific emissions into account. Importantly,there is a high proportion <strong>of</strong> renewable energy in the electricity mix to clearly reflect theunique NZ situation (where up to 70% <strong>of</strong> electricity is generated by renewables, largelyhydro-power).As noted in the thesis, there is a tendency in simulations that the outcomes produced are lowerthan the audited energy consumption during occupancy. However, the average energyconsumption <strong>of</strong> 86 kWh/m 2 /yr for the buildings is well below benchmarks (for low energybuildings) and, thus, is considered appropriate as input data for the LCA.9.4.2 Material QuantitiesBoth the initial and maintenance embodied energy and GWP components <strong>of</strong> the LCA <strong>of</strong> thebuildings utilises the quantities <strong>of</strong> materials used in the initial construction and the ensuingmaintenance <strong>of</strong> the buildings over the 60-year life cycle.This research employed Davis Langdon Shipston Davies (Christchurch), a well-establishedand experienced, local quantity surveying company, to calculate and provide the quantities <strong>of</strong>construction materials for each building design.The Quantity Surveyor produced material listings, from the structural and architecturaldrawings, as shown for all buildings in Appendix A. Any building <strong>of</strong> this magnitude isconstructed <strong>of</strong> many components and a very diverse range <strong>of</strong> materials. At the start <strong>of</strong> thisphase <strong>of</strong> the research, a decision was taken to itemise only those materials shown – whilst thismay be deemed an arbitrary listing, this was very much a considered decision taken inconsultation with all parties including the quantity surveyor. What was most critical was to‘capture’ and record all those quantities <strong>of</strong> materials which could have a significantcontribution to either the energy or GWP impacts. Thus, a material was considered forinclusion if it was either present in large quantities or it was a material or building componentwhich was very energy intensive (or emitted large quantities <strong>of</strong> GWP gases) in its production.The material listing could be further refined and many more categories included. However,the additional effort would involve a much greater level <strong>of</strong> detail than was available from thestructural and architectural drawings – and at much greater cost.The material quantities are also used to determine the environmental impacts <strong>of</strong> transport andend-<strong>of</strong>-life scenarios.The detail and accuracy <strong>of</strong> the material listings used in this research are considered to beaccurate, presented at an appropriate level <strong>of</strong> detail and exceed the original projectspecifications.
- 109 -9.4.3 Data Sets9.4.3.1 GeneralThe embodied energy and GWP <strong>of</strong> the various building materials is calculated by multiplyingthe quantities <strong>of</strong> materials in each building by an appropriate embodied energy or GWPcoefficient. Thus, the coefficient data set used in these calculations quite obviously makes asignificant difference to the results.LCA is a fairly recent research technique and much <strong>of</strong> its ‘evolution’ has been based inEurope, where a number <strong>of</strong> important data sets have been developed. Due to the lack <strong>of</strong>locally produced and specific data for building materials, a number <strong>of</strong> studies in New Zealandhave been based on European industry and energy data sets. Until recently, the best ‘local’data set was produced by Alcorn (see Alcorn, A. (1995), (1998) and (2003)) but this workacknowledges that the data set is now out-<strong>of</strong>-date and has some significant deficiencies.A recent study undertaken by Scion in collaboration with Alcorn for the NZ Ministry <strong>of</strong>Agriculture and Forestry (Nebel et al., 2009) presents a dataset for key NZ building materials;the dataset was developed using LCA studies <strong>of</strong> timber and other building materials bycombining, updating and extending overseas data and NZ information. This project identifieda problem in the significant variation between NZ and European manufacturing and theresulting data differences. Whilst this latest dataset is recommended for use with NZbuildings, greater accuracy will only be achieved by the rigorous collection and analysis <strong>of</strong>NZ specific data and the development <strong>of</strong> a comprehensive NZ Life Cycle Inventory database(which would include data from other sectors such as transport and energy).9.4.3.2 The importance <strong>of</strong> a NZ-specific GWP coefficient for LaminatedVeneer LumberThe recent study “Life Cycle Assessment: Adopting and adapting overseas LCA data andmethodologies for building materials in New Zealand” (Nebel et al., 2009) has addressedsome <strong>of</strong> the issues and produced a limited data set for the major building materials in NZ (seealso Section 6.3.2.3.) However, a notable omission from this new data set is a globalwarming potential (GWP) coefficient for laminated veneer lumber (LVL). This product isproposed to be used extensively in new pre-fabricated, multi-storey timber building, such asthe Timber and TimberPlus buildings in this report.For the LCA presented in Chapter 6, Scion have used a GWP coefficient <strong>of</strong> 0.377 (Kg CO 2equivalent per Kg <strong>of</strong> material) for LVL based on Glulam (a somewhat similar laminatedtimber product) derived from European industry, with some significant adaptions made torecognise;(i) that NZ LVL is produced using a significant component <strong>of</strong> renewable energy and(ii) that the bioenergy (solar energy) captured by timber products during the growing <strong>of</strong>the wood should not be included in the coefficient (Scion have made similarallowances for all other timber products in the new data set, as well, which is asignificant departure from some <strong>of</strong> the European data sets which incorporate thisbioenergy to complete an energy balance).
- 110 -This figure (0.377 Kg CO 2 eq./Kg) is significantly different to the figure which would havebeen used in earlier studies.However, as noted above, this new LVL coefficient is still a ‘best-estimate’ and has not beendeveloped by a thorough investigation, analysis and understanding <strong>of</strong> LVL production in NewZealand.There are a limited number <strong>of</strong> LVL producers in NZ, at least two <strong>of</strong> which have undertakenrecent work to determine a NZ-specific coefficient for LVL. Nelson Pine Industries Limitedhas undertaken a detailed assessment through analysis <strong>of</strong> the production and extraction <strong>of</strong> themain raw material in the production process (logs) from Nelson Forests’ domestic log supplychain and considering major inputs in processing operations within their own factoryincluding assessment <strong>of</strong> the electrical energy, boiler fuel, mobile plant fuel and PF resin (notethat for the wood residues used for heat generation the assessment has included the fuel andother CO 2 emissions associated with collection, processing and transport).Nelson Pine uses a significant amount <strong>of</strong> biomass energy. When this biomass is recognised asa renewable energy source (excluded), the emissions pr<strong>of</strong>ile <strong>of</strong> Nelson Pine LVL is 118 kgCO 2 eq./m 3 . This is finished LVL product out-the-gate. (Note that stored carbon is notincluded in the assessment).The density <strong>of</strong> Nelson Pine LVL at 12% moisture content is 574 kg/m3 and this gives acoefficient for Nelson Pine LVL <strong>of</strong> 0.206 kg CO 2 eq./kg.Nelson Pine believe that planned improvements in the production process could drop thisfigure to under 100 kg CO 2 eq./m 3 . <strong>Using</strong> the same density conversion after plannedimprovements could reduce the coefficient to 0.174 Kg CO 2 eq./kg.If a coefficient <strong>of</strong> 0.206 kg CO 2 eq./kg or less was used for LVL in the LCA study inChapter 6, there would be a reduction in embodied GWP emissions associated with theTimber and TimberPlus building, both <strong>of</strong> which use a significant amount <strong>of</strong> LVL in theirstructure.The work undertaken by Nelson Pine has not been independently reviewed at this stage andcompatibility with other datasets used in this study, with regard to system boundaries andother methodological issues, could not be established. Therefore, the dataset was not appliedin this study9.5 Permanent Carbon Storage in Wood Products; anAlternative End-<strong>of</strong>-Life Scenario.The LCA conducted by Scion and detailed in Chapter 6 covers the full life cycle <strong>of</strong> thebuildings – <strong>of</strong>ten referred to as a ‘cradle to grave’ assessment. All life cycle assessmentsrequire assumptions about the end-<strong>of</strong>-life <strong>of</strong> the building. Chapter 6 has used two end-<strong>of</strong>-lifescenarios, one being landfilling with emissions <strong>of</strong> some <strong>of</strong> the decomposition gases and thesecond being “reutilisation” with the wood products being burned for energy recovery. Thesescenarios are difficult to predict because many things may be different in 60 years time (orlonger) when the buildings reach the end <strong>of</strong> their useful lives.
- 111 -The following assessment will present the full lifetime GWP for the four buildings using analternative end-<strong>of</strong>-life scenario where the there is no net increase in greenhouse gas emissionsafter the building is demolished. Assumptions and reasons are given below to show why thisis a valid alternative way to present the results <strong>of</strong> this study.The permanent storage scenario is consistent with the carbon sequestered in the woodproducts being retained permanently, that is, in perpetuity, in one <strong>of</strong> the following ways:• Landfill <strong>of</strong> all wood products with no subsequent release <strong>of</strong> greenhouse gas emissions.• Landfill, with any decomposition to methane being collected for energy production.• Re-use <strong>of</strong> all wood products in other new buildings.• Replacement <strong>of</strong> all buildings with new buildings containing at least the same amount<strong>of</strong> wood.An excellent example <strong>of</strong> this ‘permanent storage scenario’ is occurring right now inChristchurch. The old Burwood Landfill is generating methane gas which is being efficientlycollected and used to displace the use <strong>of</strong> other carbon-based fossil fuels in the heating <strong>of</strong> theQEII pool complex. By 2010, the Christchurch City Council will extend the usage <strong>of</strong>methane from Burwood by building additional piping to take the gas to the new City Officesin Central Christchurch.The underlying consideration is that as long as the timber products ‘exist’, they are storingcarbon (or displace other fossil fuel usage, as long as any ‘bad’ products <strong>of</strong> decomposition(eg. methane) are used and not released back to the atmosphere). This approach does notassume any particular end-<strong>of</strong>-life scenario; it doesn’t have to because it simply says thattimber products, that are real and being utilised, store carbon, and there are mechanisms forretaining this ‘beneficial’ storage over the very long term.The Kyoto Protocol does not recognise this approach. It considers all the carbon in wood is100% volatilised at the time <strong>of</strong> harvesting – which it clearly is not – and has led to muchdebate about how to account for carbon storage in timber products.This assessment only uses data already given in Chapter 6 <strong>of</strong> this report, presented in aslightly different way. The discussion will be in three parts; firstly, considering the materialsonly using those GWP coefficients adopted by Scion in the LCA in Chapter 6, thenconsidering the materials only but calculated using figures directly from the LCA inChapter 6, and, lastly, materials combined with all other emissions for the full life cycle over60 years.9.5.1 Materials Only – With Data From GWP Coefficients usedby Scion.The following data is for materials only, not including emissions from operating ormaintaining the building over its life. A simplified assessment, which only considersemissions from the building materials, is essentially the same as a partial life cycle assessmentwhich considers the building until the end <strong>of</strong> the construction phase (sometime referred to as‘cradle-to-gate’). This scenario more clearly shows the potential benefits <strong>of</strong> retaining thecarbon sequestered in the wood products.
- 112 -Table 9.1 (middle column) shows GWP coefficients (Kg CO 2 equivalent per Kg material) forall the materials in the different buildings used by Scion to input to the LCA modellingprocess. The right-hand column <strong>of</strong> this table shows the GWP for materials where carbonstorage in the timber is taken into account (see explanation below), which has a marked effecton the coefficients used for all timber products. The timber datasets are based on NewZealand log production.The report “Life Cycle Assessment: Adopting and adapting overseas LCA data andmethodologies for building materials in New Zealand” (Nebel, 2009) notes the following:All timber datasets are based on log production specific for New Zealand. The dataset forsawn timber is fully based on data that has been collected in a number <strong>of</strong> projects at Scion.Existing models from the GaBi database have been modified for particle board and plywoodas follows. The electricity mix has been replaced with the NZ grid mix and thermal energyfrom natural gas has been replaced with the respective Australian dataset. It should be notedthat most <strong>of</strong> the thermal energy in all datasets is generated from residual wood which isreflected in the renewable energy consumption.Primary energy and carbon stored in the timber have not been included in the datasetspresented, but need to taken into account when using the data, depending on the end <strong>of</strong> lifescenario. The carbon stored in the timber will be partially released in the case <strong>of</strong> landfillingand would be fully released in the case <strong>of</strong> thermal utilisation. In an LCA study the end <strong>of</strong> lifescenario needs to be defined and emissions <strong>of</strong> CO2 and/or CH4 as well as the potential longterm storage need to be taken into account. The stored carbon in wood products can becalculated as follows:Assumed 50% <strong>of</strong> wood mass is carbon.=> 1kg wood = 0.5 kg CarbonMolar mass carbon = 12 g/mol.Molar mass oxygen = 16 g/mol=> Molar Mass CO2 = 44 g/mol0.5 kg / 12 g/mol = 41.67 moles <strong>of</strong> carbon in 1 kg wood.41.67 moles x 44 g/mol = 1833.34 grams.=> 1 kg wood --> 1.83 kg <strong>of</strong> CO21.83 kg CO2 equivalents are sequestered per 1 kg <strong>of</strong> timber.Table 9.2Table 9.2Table 9.2 shows the GWP (in units <strong>of</strong> CO 2 equivalent) for the materialsused in the four buildings, obtained by multiplying the mass <strong>of</strong> different materials in Table6.1 by the coefficients for each material given in Table 9.1 (right hand column). Table9.3Table 9.3Table 9.3 shows the same data in the major groups <strong>of</strong> materials.Figure 9.1Figure 9.1Figure 9.1 shows the aggregated data from Table 9.3Table 9.3Table 9.3.It can be clearly seen that emissions from concrete production dominate the emissions fromthe Concrete building, emissions from steel production dominate the emissions from the Steelbuilding and emissions from aluminium play a significant part in the overall emissions <strong>of</strong> theConcrete, Steel and Timber buildings,. Whilst emissions from concrete are greatest for theConcrete building, they are notable in the other three buildings too.The carbon sink from wood and wood products is clearly apparent in the Timber andTimberPlus buildings (but is almost insignificant for the Concrete and Steel buildings whichhave few wood products). There are no net emissions from the timber materials in any <strong>of</strong> thebuildings. In the Timber and TimberPlus buildings, the carbon stored in the timber materialsgreatly exceeds the emissions associated with the production and manufacture <strong>of</strong> these timber
- 113 -Table 9.1. GWP coefficients (Kg CO 2 equiv. per Kg material) for all materials in the four buildings.GWPGWPMaterial (kg)(Global WarmingPotential)(Including carbonstorage in material)[kg CO 2 [kg CO 2Equiv.]Equiv.]Concrete, 17.5 MPa 0.102 0.102Concrete, 40 MPa 0.158 0.158Pre-Cast Concrete 0.17 0.17Concrete tiles 0.263 0.263Reinforcing steel 0.449 0.449Structural Steel 1.802 1.802Steel Sheet 2.284 2.284Paint, water based 2.077 2.077Fired clay brick 0.246 0.246Glass fibre insulation 1.66 1.66PE membrane (building wrap) 2.368 2.368Fibre Cement Sheet 0.697 0.697Aluminium, extruded. 11.312 11.312Glass 1.36 1.36GIB ® plasterboard 0.34 0.34Sawn timber, kiln dried (10%) 0.154 -1.68Particle Board 0.279 -1.55Western Red Cedar (imported) 0.83 12 -1.00Laminated Veneer Lumber 0.377 -1.45Plywood 0.21 -1.62Table 9.2. GWP (tonnes CO 2 equiv.) for all materials in each <strong>of</strong> the four buildings.Concrete Steel Timber TimberPlusConcrete 17.5 MPA 6.2 6.3 5.4 5.4Concrete 40.0 MPA 107.3 342.9 207.9 207.9Concrete pre-cast 781.2 17.2 0.0 0.0Steel (NZ) 10.5 139.5 7.3 7.3Steel (Au) 31.8 478.7 10.0 10.0Steel sheet 38.1 35.8 0.0 0.0Stainless steel 0.0 0.0 0.0 0.0Reinforcing steel 51.4 10.8 8.7 8.7Glass 65.8 65.8 65.8 44.7Timber -18.5 -17.5 -98.0 -209.3Western Red Cedar 0.0 0.0 0.0 -22.8LVL 0.0 0.0 -498.7 -498.7Plywood -6.6 -6.6 -88.2 -105.0MDF -3.1 -3.1 -3.1 -109.5Aluminium 75.0 75.0 75.0 12.0Aluminium sheet mix 308.4 308.4 308.4 0.0Plasterboard 13.2 19.1 14.7 0.0Paint 1.4 1.6 2.1 2.3Fibreglass insulation 5.6 14.1 13.4 14.2Polystyrene insulation 6.0 0.0 0.0 0.0Fibre cement 25.4 31.3 51.5 0.0Net total 1,499 1,519 82 -63312 An updated coefficient for Western Red Cedar in NZ is 0.434 Kg CO 2 equiv. which would reduce emissionsdue to this material by around 10 tonnes CO 2 equiv.
- 114 -products. For example, in the TimberPlus building, there is storage <strong>of</strong> 1,162 tonnes <strong>of</strong> CO 2(Table 6.2), whilst the total production <strong>of</strong> all <strong>of</strong> the timber in the building gives rise toemissions <strong>of</strong> only 202 tonnes <strong>of</strong> CO 2 (material in tonnes, Table 6.1 x GWP coefficient incolumn 2, Table 9.2).Table 9.3 Aggregated GWP (tonnes CO 2 equiv.) for groups <strong>of</strong> materials in the four buildingsConcrete Steel Timber TimberPlusConcrete 895 366 213 213Steel 132 665 26 26Aluminium 383 383 383 12Other 117 132 148 61Wood -28 -27 -688 -945Net total 1,499 1,519 82 -63318001600tonnes CO1400120010008006004002000-200-400-600-800-1000ConcreteSteelTimberTimberPlusWoodOtherAluminiumSteelConcreteFigure 9.1: GWP emissions for the materials in the four buildings, assuming permanent storage <strong>of</strong> carbonin wood products. Data from GWP coefficients used in Table 9.3 .tonnes CO2180016001400120010008006004002000-200-400-600-800ConcreteSteelTimberTimberPlusFigure 9.2. Net GWP emissions for the materials in the four buildings, assuming permanent storage <strong>of</strong>carbon in wood products. Data from GWP coefficients in Table 9.3 .
- 115 -Figure 9.2 shows that the net GWP emissions from the materials in the Timber building arejust 5% <strong>of</strong> those from the Concrete and Steel buildings. This is because the carbon stored inthe wood-based building materials balances out nearly all <strong>of</strong> the greenhouse gases emitted inthe manufacturing <strong>of</strong> all the other materials in the building.For the TimberPlus building, the net total CO 2 emissions for the materials in the TimberPlusbuilding are negative because the carbon stored in the wood-based building materials morethan cancels out all the greenhouse gases emitted in the manufacture <strong>of</strong> all the other materialsin the building. The net negative figure - or long-term carbon storage - is over 630 tonnes <strong>of</strong>CO 2 equivalent.9.5.2 Materials only – using data from LCA assessment inChapter 6Another method <strong>of</strong> analysing the data in Chapter 6 is to take the results <strong>of</strong> the LCAassessment presented in Chapter 6. The top line in Table 9.4 is the initial embodied GWP(tonnes CO 2 equiv.) for all materials in each <strong>of</strong> the four buildings from Table 6.7. The secondline in Table 9.4 is the equivalent CO 2 sequestered in the wood materials, derived from thewood quantities in Table 6.2. The quantity <strong>of</strong> carbon in that table has been converted to CO 2equivalent by multiplying by 3.67 (the conversion factor for changing tonnes <strong>of</strong> carbon totonnes <strong>of</strong> CO 2 equivalent).Table 9.4: GWP (tonnes CO 2 equiv.) for all materials in each <strong>of</strong> the four buildingsConcrete Steel Timber TimberPlusEmbodied (CO 2 eq.) 1,576 1,615 971 566Sequestered (CO 2 eq.) -32 -31 -846 -1,162Total 1,544 1,584 125 -596The figures in Table 9.4 are plotted in Figure 9.3 (as separate figures) and Figure 9.4 (netfigures). These graphs show similar trends to Figure 9.1Figure 9.1Figure 9.1 and Figure 9.2.The actual numbers are a little different from the coefficients method - the reason for this isnot known precisely. The difference may be due to the unknown assumptions used to obtainthe coefficients presented in Table 9.1.However, the over-riding conclusion from using both methods, is that the carbon stored in thewood-based building materials <strong>of</strong> the TimberPlus building more than cancels out all <strong>of</strong> thegreenhouse gases emitted in the manufacture <strong>of</strong> all the other materials in the building.
- 116 -tonnes CO21,8001,6001,4001,2001,0008006004002000-200-400-600-800-1,000-1,200-1,400Sequestered carbonCO2 emissionsConcrete Steel Timber TimberPlusFigure 9.3. GWP emissions for the materials in the four buildings, assuming permanent storage <strong>of</strong> carbonin wood products. Data from LCA analysis in Chapter 6.tonnes CO2180016001400120010008006004002000-200-400-600-800Concrete Steel Timber TimberPlusFigure 9.4. Net GWP emissions for the materials in the four buildings, assuming permanent storage <strong>of</strong>carbon in wood products. Data from LCA analysis in Chapter 6.9.5.3 Materials Combined With all Other Emissions for Full LifeCycleThe materials data shown above can be combined with all other emissions to give a morecomplete lifecycle assessment. Table 9.5 shows the same data as Table 9.4, with the addition<strong>of</strong> emissions from maintenance, transport, and lifetime operational energy use over 60 years.Note that there is no GWP at all shown for end-<strong>of</strong>-life (assuming 100% storage <strong>of</strong> carbon).Whilst there should be an allowance for the ‘GWP cost’ directly associated with transporting,
- 117 -placing and retaining materials in a landfill scenario, this is not known but is consideredrelatively small. All data is from Table 6.7 in Chapter 6.Table 9.5: GWP (tonnes CO 2 equiv.) for full life cycle <strong>of</strong> the four buildings.Concrete Steel Timber TimberPlusEmbodied 1,576 1,615 971 566Maintenance 131 166 139 99Transport 42 39 29 30Operational 4,910 5,000 5,161 5,038Sequestered -32 -31 -846 -1,162Total 6,627 6,789 5,454 4,571The numbers in Table 9.5 are plotted in Figure 9.5. Whilst it can be seen that operationalenergy use is still by far the largest source <strong>of</strong> GWP gases, it is important to note that theembodied emissions will become an even larger percentage <strong>of</strong> the total life-cycle emissions if,as following recent developments and trends, the building is re-designed in the future forlower operational energy use.Figure 9.6 shows the net figures for each building, as given in the bottom line <strong>of</strong> Table 9.5.Whilst the differences are less pronounced than in Figure 9.4, the Timber building producesaround only 80% <strong>of</strong> the total lifetime emissions <strong>of</strong> the Steel building and the TimberPlusbuilding emits over its lifetime only around 65% <strong>of</strong> the Steel building – this is considered asignificant reduction in CO 2 emissions.8,0007,0006,000tonnes CO25,0004,0003,0002,0001,0000SequesteredOperationalTransportMaintenanceEmbodied-1,000-2,000Concrete Steel Timber TimberPlusFigure 9.5. Total lifecycle GWP emissions for the four buildings, assuming permanent storage <strong>of</strong> carbon inwood products. Data from LCA in Chapter 6.Whilst the TimberPlus building does become a net emitter <strong>of</strong> CO 2 over time, the buildingwould be able to operate fully as a ‘carbon neutral’ building for around the first 12 years <strong>of</strong> itslife.
- 118 -800070006000tonnes CO2500040003000200010000Concrete Steel Timber TimberPlusFigure 9.6. Net lifecycle GWP emissions for the four buildings, assuming permanent storage <strong>of</strong> carbon inwood products.All <strong>of</strong> the above scenarios do not consider the carbon storage potential <strong>of</strong> products used forbuilding maintenance and refurbishment. This could be added and would further reduce theimpacts <strong>of</strong> the Timber and TimberPlus buildings. However, it would make only relativelysmall differences as the quantities <strong>of</strong> materials are small.9.6 Green Star <strong>of</strong>fice building rating toolThe Green Star rating tool Office Design v1.0 was used to assess the four building designs, acomparison was made with LCA and a discussion <strong>of</strong> the rating tools was carried out by Scion– this is all detailed in Section 6.4The NZ Green Building Council recently requested submissions to be made on the proposedrevision <strong>of</strong> Green Star Office Design version 1.0. The timing <strong>of</strong> possible changes to version1.0 <strong>of</strong> the rating tool is extremely topical and very relevant to this report, particularly in thearea <strong>of</strong> the importance <strong>of</strong> the building materials used in everyday construction in NZ, theirenvironmental impacts and how materials are ‘treated’ by the Green Star rating tool. TheDepartment <strong>of</strong> Civil and Natural Resources Engineering at the University <strong>of</strong> Canterbury putforward a submission (30 th April 2008) which is summarised below.________________________________________________________________Supporting information for Submission to Green Star NZ, 30 th April 2008 from Department <strong>of</strong> Civil andNatural Resource Engineering, University <strong>of</strong> Canterbury.The information below is provided to support the following two submissions;1. We propose that Green Star New Zealand - Office Design Version 2.0 should include a CO 2calculator and award points for overall low or negative CO 2 emissions <strong>of</strong> all the building materialsused in construction (embodied CO 2 ; "cradle-to-gate").2. We propose that Green Star New Zealand - Office Design Version 2.0 should include a CO 2calculator and award points for overall low or negative CO2 emissions <strong>of</strong> the building materials usedin (the predicted) maintenance and refurbishment <strong>of</strong> the building (recurrent embodied CO 2 ).
- 119 -Net CO 2 emissions – that is emissions (positive) or sequestration (negative) – are the primary focus <strong>of</strong> bothnational and international initiatives to address climate change.This submission is supported by the recently produced document “Building for the 21 st Century – Review <strong>of</strong>the Building Code” (July 2007; published by Dept. <strong>of</strong> Building and Housing). This document states ‘We areconsidering the possibility <strong>of</strong> assessing the resources used by buildings through the carbon dioxide (CO 2 )emissions associated with their construction, operation, maintenance and demolition’.This document further states “We are considering CO 2 emissions …….because CO 2 is the most significantgreenhouse gas associated with buildings. There are also established criteria for assessing the CO 2associated with various forms <strong>of</strong> energy used in buildings”.This proposal is based around adopting some <strong>of</strong> the practices <strong>of</strong> proven Life Cycle Assessment (LCA)methodologies and international standards. It provides a quantitative measure (for instance, tonnes <strong>of</strong> CO 2per square metre <strong>of</strong> NLA) <strong>of</strong> the carbon dioxide emissions associated with the production andmaintenance/refurbishment <strong>of</strong> all the materials in a building.CO 2 emissions are derived from calculations <strong>of</strong> the embodied energy <strong>of</strong> all the building materials (bothinitial construction materials and those used for maintenance and refurbishment), cross-referenced withappropriate Life Cycle Inventory (LCI) data sets. Ideally these data sets would be NZ-specific (or at least‘tailored’ to NZ conditions) and would need to be available and standardised across all sectors <strong>of</strong> themanufacturing and building industry. (Whilst this is not currently the case, a good start can be made usingLCI data for most commonly used building materials within NZ, such as is available from Victoria University<strong>of</strong> Wellington (VUW)).This approach recognises both the potential and the robustness <strong>of</strong> LCA implemented over the lifetime <strong>of</strong> abuilding but balances this against practicality and cost (LCA is a costly and complex task and there arecurrently few practitioners in New Zealand) to <strong>of</strong>fer a solution that could be implemented and incorporatedin Office Design, Version 2.For a building, the simplified approach which we propose would measure and calculate the following:- Initial embodied energy <strong>of</strong> significant building materials.- Recurrent embodied energy <strong>of</strong> significant materials used in maintenance and refurbishment <strong>of</strong>the building over its proposed lifetime.- The net embodied CO 2 <strong>of</strong> building materials over the initial life cycle <strong>of</strong> those materials from‘cradle to gate’ – that is, considering and accounting for all the CO 2 emissions associated withthe production <strong>of</strong> the building material up to the point <strong>of</strong> the material being available at the ‘gate’<strong>of</strong> the production facility.- The recurrent embodied CO 2 <strong>of</strong> those building materials used for maintenance andrefurbishment beyond initial construction – that is, considering and accounting for the CO 2emissions associated with the production <strong>of</strong> materials used in maintenance and refurbishment<strong>of</strong> the building.Net embodied CO 2 includes carbon sequestered in building materials. This requires an assumption that atthe end <strong>of</strong> the building’s life, materials, such as wood, will either be re-used, be buried in a landfill or beburned for energy recovery in lieu <strong>of</strong> fossil fuel.This is a simple model. It does not include;1. CO 2 emissions from transport to the building site.2. CO 2 emissions in construction or demolition.3. Possible reduction in CO 2 emissions by using wood waste as an energy source.4. Operational energy over the life-time <strong>of</strong> the building which is included elsewhere in Green StarOffice Design.Further information supporting the above methodology can be found in “Embodied Energy and CO 2Coefficients for NZ Building Materials” (A. Alcorn, March 2003 – Published by Centre for BuildingPerformance Research).
- 120 -Embodied energy.Embodied energy would be calculated from a building-specific listing <strong>of</strong> the major building materials,converted into gross quantities (for instance, as documented in a Quantity Surveyor’s report) and crossreferenced with an appropriate, simplified LCI with data applicable to NZ.Note that only the major building materials would be considered – this could be defined as those materialswhich contribute to more than a specified percentage <strong>of</strong> the building by mass or volume. It would mostlikely, in most instances, consider at least concrete, steel, timber, glass, aluminium, paint,particleboard/fibreboard, gypsum board, masonry and insulation.This recognises the environmental impact <strong>of</strong> producing / manufacturing building materials. Results wouldhighlight materials which have a significant embodied energy “cost”.Initial embodied CO 2 would be calculated by cross-referencing appropriate LCI data for the significantmaterials listed above (for instance, VUW data sets).Recurrent embodied energy.This recognises the environmental impact <strong>of</strong> maintenance, refurbishment and replacement <strong>of</strong> buildingmaterials. Results would highlight materials which have a significant embodied energy “cost” over the lifetime<strong>of</strong> a building beyond the initial construction, due to the need for frequent maintenance or replacement(but possibly demonstrating less initial environmental impact).Recurrent embodied CO 2 would be calculated by cross-referencing data on maintenance and replacementcycles for the most commonly used materials.Net embodied CO 2 .Overall net embodied CO 2 would be calculated from initial embodied CO 2 , plus any chemical release <strong>of</strong>CO 2 during the manufacturing process, less CO 2 sequestered and then combined with recurrent embodiedCO 2 . Initial and recurrent embodied CO 2 could be detailed separately.Net CO 2 – that is an emission to the atmosphere or a sequestration with removal <strong>of</strong> CO 2 from theatmosphere – is the primary focus <strong>of</strong> both national and international initiatives to address climate change.Measurement <strong>of</strong> net embodied CO 2 recognises those materials and processes that remove CO 2 from theatmosphere on a permanent (sustainable) basis.Utilising Victoria University LCI data for building materials <strong>of</strong>fers a “CO 2 footprint” for most common NZbuilding materials and captures the effect <strong>of</strong> CO 2 emissions during the manufacturing process (for instancein cement production), as well as sequestration (for instance in timber products).________________________________________________________________________9.7 Timber used in the <strong>Buildings</strong>.Structural LVL dominates the quantity <strong>of</strong> timber used in the buildings. Other timber andtimber components are used throughout all the buildings but much more so in the Timber andTimberPlus designs.9.7.1 Laminated Veneer LumberThe Engineered Wood Products Association <strong>of</strong> Australasia provides excellent information onmany <strong>of</strong> the engineered wood products currently available commercially in New Zealand (andAustralia) (http://www.paa.asn.au).LVL is a hugely versatile timber product <strong>of</strong> known and consistent physical and mechanicalproperties, able to be manufactured to chosen specifications, including large dimensions.
- 121 -The LVL specified for the structural components <strong>of</strong> the Timber and TimberPlus buildings isavailable as a product, in appropriate dimensions and quantities, from a number <strong>of</strong> companiesin NZ. There is, undoubtedly, a large resource <strong>of</strong> plantation grown P. radiata in NZ toprovide the raw product for the manufacture <strong>of</strong> LVL.However, it is acknowledged that the fabrication facilities, machinery and techniques forproducing key structural components – in large quantities and in large piece sizes - is not yetcommercially available in NZ. These structural components must be cut and glued to precisetolerances from LVL plants, with connection devices accurately positioned.9.7.2 Other Timber ProductsThe Warren and Mahoney report included in Appendix G is a very useful starting point forexploring the suitability <strong>of</strong> the specified timber used in the buildings, particularly the Timberand TimberPlus buildings. Suitability is the key word - this report acted as an importantreality check on the building designs to ensure that the timber specified in the proposeddesigns was appropriate architectural usage (including usage in any external situation andappropriate NZ architecture), could be sourced, in sufficient quantities and from where, andfrom a sustainable market. The report also <strong>of</strong>fers appropriate schedules and products for ongoingmaintenance over the life-time <strong>of</strong> the building.The report confirms that the various proposed uses <strong>of</strong> timber in the buildings are appropriate,the different timber species are available and can be sourced both locally and internationallyas necessary, and largely from a sustainable, certified forestry markets. Furthermore, thetimber products are durable, with lifetimes extending to cover the full 60-year life cycle <strong>of</strong> thebuildings.The increasing recognition <strong>of</strong> various certification systems for sustainable forestry andproducts means that an increasing amount <strong>of</strong> suitably certified timber is becoming availableboth in NZ and internationally. Indeed, it is likely that consumer demand will ensure that alltimber products will be sourced from sustainable forest markets in the not-too-distant future.9.8 The Big PictureThe popular media, scientific journals, government initiatives, and international forums, toname a few, are awash with information and debate about climate change and globalwarming. Hand-in-hand with this, has been an explosion <strong>of</strong> interest, worldwide, in all-thingssustainable.‘Sustainability’ is the ‘buzz word’ <strong>of</strong> the times.New Zealand has signed a binding international treaty, the Kyoto Protocol, which commitsthe country to reducing its emissions <strong>of</strong> those gases perceived to be responsible for globalwarming. Irrespective <strong>of</strong> the all the debate about whether climate change is anthropogenic,just a natural, cyclical climatic variation and the time frame, it can be argued, that NZ as acountry now recognises that the present way-<strong>of</strong>-doing-things is unsustainable.A major focus for change rests on the need to reduce the wasteful use <strong>of</strong> energy, especiallyfossil fuels, and the (predominantly) CO 2 emissions associated with energy usage. <strong>Buildings</strong>contribute significantly to energy usage both in NZ and worldwide and the materials that areused to construct and maintain those buildings are themselves a significant proportion <strong>of</strong> thatenergy usage. Determining exactly how important building materials are in terms <strong>of</strong>
- 122 -environmental impacts and identifying ‘hot spots’ associated with those materials will aidunderstanding, focus resources and contribute to decision and policy making. Reducing theamount <strong>of</strong> energy used by buildings – both in their materials and operations – provides anopportunity to reduce GWP and contribute to NZ’s Kyoto commitments.However, the authors firmly believe that the focus should not just be on Kyoto and carbonneutrality. NZ has a large plantation forest resource – which can provide a raw material forconstruction <strong>of</strong> buildings from single-storey houses through to multi-storey commercialbuildings. Conversely and significantly, NZ does not have the raw materials to produce steelor aluminium. The NZ forest estate is a sustainable resource – largely certified as such byrecognised international bodies. The timber produced from these forests is an entirelyrenewable material – when a tree is cut-down, a new seedling can be planted and more timbercan be grown on the same piece <strong>of</strong> ground, continually ‘harvesting’ the solar energy <strong>of</strong> thesun. This process does not deplete any <strong>of</strong> the world’s resources which are becoming limitedin supply. The forest and timber industry in NZ provides products which have a lowembodied energy and low GWP.Controversy surrounds the concept <strong>of</strong> carbon sequestration in both forests and timberproducts. Timber - and forests - clearly store carbon. Thus, the growing <strong>of</strong> timber removescarbon from the atmosphere. How long timber stores carbon and what happens at the end-<strong>of</strong>lifeare the key questions as to whether forestry and timber products can be considered toprovide a net removal <strong>of</strong> carbon from the atmosphere in the long term.<strong>Using</strong> more timber to build in NZ and exporting more high-value engineered timber productscould lead to an increase in NZ’s plantation forestry resource, processing and manufacturingcapabilities and infrastructure, all <strong>of</strong> which could lead to reduced environmental impacts fromthe NZ built environment and financial and societal rewards.
- 123 -10 ConclusionsThe following conclusions are drawn from the whole report including those made by Scion inChapter 6.The research modelled the performance <strong>of</strong> four similar multi-storey <strong>of</strong>fice buildings toinvestigate the influence <strong>of</strong> construction materials on life cycle energy use and globalwarming potential.The model was based on an actual six-storey 4250 m 2 floor area building, with a mixed–modeventilation system, currently under construction at University <strong>of</strong> Canterbury in Christchurch.While the actual building is being constructed in concrete, two alternative versions weredesigned in which the structures and finishes are predominantly steel and wood. These threedesigns are referred to as the Concrete, Steel and Timber buildings. A fourth building design,TimberPlus has a timber structure and uses timber wherever possible in linings, windowframes, louvres and cladding.• What is the influence <strong>of</strong> construction materials on operational energyconsumption and GWP?To determine the influence <strong>of</strong> construction materials on life cycle energy use and GWP, it isnecessary to design comparable buildings with similar operational energy consumption inorder to allow meaningful analysis <strong>of</strong> the importance <strong>of</strong> embodied energy and GWP.The operational energy analysis showed that Concrete, Steel, Timber and TimberPlusbuildings can all be designed to have low operational energy consumption ( average 85kWh/m 2 /yr), and all within 3% <strong>of</strong> each other.Table 10.1 shows the percentage <strong>of</strong> operational energy, initial embodied energy andmaintenance related embodied energy to the total primary energy usage over the full lifetime<strong>of</strong> the buildings (all calculations from data from Table 6.6). Table 10.2 shows the percentageimpact on GWP emissions (all calculations from data from Table 6.7). (Note that neither tableshows transport and end-<strong>of</strong>-life).Operation <strong>of</strong> the buildings contributed the highest percentage to total lifetime energyconsumption, around 94% for the TimberPlus building but only 87% for the Steel building.This result is greatly influenced by the long 60 year lifetime <strong>of</strong> the buildings, as well as therelatively large building size with high energy requirements.Even lower operational energy consumption could be achieved by using greater amounts <strong>of</strong>insulation and thermal mass in each <strong>of</strong> the buildings. Concrete is the traditional material usedfor thermal mass, but thermal mass can also be provided in the Timber buildings or in theSteel building by using exposed wood surfaces as thermal mass or by using Phase ChangeMaterials in the wall and ceiling linings.
- 124 -Table 10.1: Percentage <strong>of</strong> operational, initial embodied and maintenance related embodied energy to totalenergy over the full lifetime <strong>of</strong> the buildings 13 .Concrete Steel Timber TimberPlusOperational energy to total lifetime 89 87 91 94energy (%)Initial embodied energy to total 9 11 7 5lifetime energy (%)Maintenance related embodied 1 1 1 1energy to total lifetime energy (%)Table 10.2: Percentage <strong>of</strong> operational GWP, initial embodied GWP and maintenance related embodiedGWP to total GWP emissions over the full lifetime <strong>of</strong> the buildings 14 .Concrete Steel Timber TimberPlusOperational GWP to total lifetime 72 73 86 95GWP (%)Initial embodied GWP to total 23 23 16 11lifetime GWP (%)Maintenance related embodied 2 2 2 2GWP to total lifetime GWP (%)Even though the total operational energy consumption is similar in all buildings, the relativeamounts <strong>of</strong> energy used for heating and cooling can be different, depending on the differentthermal envelopes and the relative amount <strong>of</strong> thermal mass in each building.The trends for energy consumption also apply to GWP arising from the operation <strong>of</strong> thebuildings. Small variations are seen due to the primary energy mix and the manufacturing <strong>of</strong>some materials, such as concrete, which result in the chemical emission <strong>of</strong> CO 2 .• What is the influence <strong>of</strong> construction materials on the initial embodied energyand GWP <strong>of</strong> buildings?The importance <strong>of</strong> the assumptions made in an LCA study as to what happens to buildingmaterials on deconstruction <strong>of</strong> the buildings after 60 years has a significant impact on theGWP, as timber and timber products have the ability to sequester carbon for long periods.Assuming all deconstruction materials are landfilled, Tables 10.1 and 10.2 show that the Steelbuilding has the greatest embodied energy (11%) and GWP contributions (23%), mainlycaused by the large quantity <strong>of</strong> structural steel, which has a high embodied energy and GWP.The TimberPlus building has the relatively lowest overall embodied energy (5%) and GWP(11%) contributions because it contains less aluminium and steel compared to the other13 This table does not show percentages for transport or end-<strong>of</strong>-life energy – hence, figures do not necessarilytotal to 100%.14 Note that this table does not show percentage contributions from GWP due to transport, end-<strong>of</strong>-life or carbonstorage. The apparent anomaly <strong>of</strong> the emissions from operational, initial embodied and maintenance adding upto more than 100% is <strong>of</strong>fset by carbon storage in the timber materials in the landfill.
- 125 -building types, instead substituting timber-based products, such as Western Red Cedarlouvres and pine cladding.The main impact contributors for all building in terms <strong>of</strong> building components were thosewhich contained relatively large quantities <strong>of</strong> aluminium (louvres and windows) and steel(structure).However, the above analysis refers to a scenario where all the demolition materials are placedin landfill at the end <strong>of</strong> the 60 year lifetime <strong>of</strong> the building (and some <strong>of</strong> the materials areconsidered to decompose to methane which is released back to the atmosphere).A very different result is seen where materials are either recycled or emissions <strong>of</strong> gases backto the atmosphere at the end-<strong>of</strong>-life are prevented or those gases are used to displace the use<strong>of</strong> other fossil fuels.• What is the influence <strong>of</strong> construction materials on the maintenance relatedembodied energy and GWP <strong>of</strong> buildings?Maintenance related embodied energy and GWP <strong>of</strong> the buildings over the 60 year lifetimecontributed relatively minor environmental impacts compared to the initial embodied energyand GWP (building maintenance contributes only around 1 – 2 % to the total impacts (Tables10.1 and 10.2) and between 12 % (Steel building) and 21 % (TimberPlus) <strong>of</strong> initial embodiedenergy). However, there were noticeable differences, in maintenance impacts, betweenbuilding types and building components.The Steel building had the greatest maintenance related impacts, whereas TimberPlus had thesmallest. Fewer materials were required to maintain the TimberPlus building. Western redcedar, which lasts 60+ years, was used for louvres, balustrades, and reveals. These structuresdo not require replacement, resulting in a reduced overall impact for the TimberPlus building.The building components that required the most maintenance, with the largest contribution tototal maintenance related impact, were the windows. This is indicative <strong>of</strong> the large quantity <strong>of</strong>aluminium required in the maintenance <strong>of</strong> the frames. The exception is TimberPlus which hadthe lowest impact because the aluminium components <strong>of</strong> the windows were replaced withWestern Red Cedar.A well designed and constructed building, with low maintenance related embodied energywill decreases the overall life cycle impacts.
- 126 -• How does the choice <strong>of</strong> finishing materials affect the life-cycle energy use andGHG emissions?Comparing the Timber with the TimberPlus building shows that a significant reduction inembodied energy and embodied GHG emissions can be achieved by increasing the amount <strong>of</strong>wood and wood products in the building envelope. The largest benefit comes from replacingaluminium with wood in the window frames and the sun louvres.A similar benefit would accrue if a large amount <strong>of</strong> timber finishing materials were used inthe Concrete and Steel buildings.Further increasing the use <strong>of</strong> timber throughout any <strong>of</strong> the buildings, for example in ceilingsand interior walls, as insulation and floors, would reduce embodied energy and GHGemissions even more.• What impact does the end-<strong>of</strong>-life disposal <strong>of</strong> materials have on energyconsumption and GWP?The end-<strong>of</strong>-life disposal <strong>of</strong> materials (with a number <strong>of</strong> feasible scenarios) has a significantimpact on full life cycle energy consumption and GWP.Scion proposed two end-<strong>of</strong>-life scenarios; landfilling (creating carbon storage) and materialreutilisation, the latter combusting wood for energy recovery, and recycling concrete andsteel. The Discussion in Section 9.5 proposes a different end-<strong>of</strong>-life scenario, where theassumption is that all carbon sequestered in wood products is retained in perpetuity.The Scion results show a variation in end-<strong>of</strong>-life impact between landfilling and materialreutilisation. Reutilisation resulted in a reduction in total energy consumption in all buildingswhen compared to the landfill scenario. The reutilisation scenario showed similar benefits forGWP for the Concrete and Steel buildings; however, the Timber and TimberPlus buildingsshowed a slight increase in total GWP (results for the two scenarios were very close, so thatno firm conclusion can be made, other than that both scenarios result in a negative end-<strong>of</strong>-lifeGWP figure, which reduces the total life cycle GWP).Material reutilisation enabled a significant recovery <strong>of</strong> energy and reduction in GWP for allbuilding types. Material reutilisation recovered a proportion <strong>of</strong> the embodied energy <strong>of</strong> thewood that would otherwise be wasted if the wood was landfilled.The building with the largest energy recovery and GWP reduction was the TimberPlusbuilding, as this building is composed largely from wooden materials that can be combustedfor energy recovery. The Steel building also had a significant reduction when the structuralsteel was recycled, as production <strong>of</strong> primary steel is avoided; however, the reduction is stillless than recovering energy from combusting wood in the TimberPlus building.Recycling the steel and concrete in the reutilisation scenario would be more beneficial thansimply landfilling these materials because this displaces the need to use new primarymaterials with high initial embodied energy and GWP.
- 127 -In summary, reutilisation shows clear benefits for the Steel building. The Concrete buildinghas energy and GWP benefits from reutilisation, though they are small enough to be affectedby changes in transport distances. Both scenarios result in end <strong>of</strong> life GWP reductions for theTimber and TimberPlus buildings, however the reutilisation scenario shows the additionalbenefit <strong>of</strong> energy recovery and displacement <strong>of</strong> fossil fuels.The landfilling scenario presented above is greatly influenced by the assumption that 18% <strong>of</strong>timber materials decompose within 46 years <strong>of</strong> burial, methane is released and only 42% <strong>of</strong>the methane is captured (after this time there is no further significant amount <strong>of</strong> carbonreleased). Landfilling will become an even more beneficial option from a GHG emissionsviewpoint as modern and future landfills are better constructed and managed to capture andutilise any methane generated by decomposition. (However, see the next question with regardto multiple environmental impacts).A third end-<strong>of</strong>-life scenario (see Section 9.5) shows that if the assumption is made that 100%<strong>of</strong> the carbon in timber and timber products is permanently stored – equivalent to carbonbeing permanently removed from the atmosphere - then there is a significantly largerreduction in GWP for the Timber and TimberPlus buildings.Under this scenario, considering only the impact <strong>of</strong> the materials over the life cycle <strong>of</strong> thebuildings, net GWP emissions for the Timber building are around only 10% <strong>of</strong> those for theConcrete and the Steel building. This is because the carbon stored in the wood-based buildingmaterials balances out much <strong>of</strong> the GWP <strong>of</strong> the materials emitted in the manufacture <strong>of</strong> all theother materials in the building.tonnes CO2180016001400120010008006004002000-200-400-600-800ConcreteSteelTimberTimberPlusFigure 10.1. (Figure 9.2 reproduced) Net GWP emissions for the materials in the four buildings, assumingpermanent storage <strong>of</strong> carbon in wood products. Data from GWP coefficients in Table 9.3 .
- 128 -For the TimberPlus building, there is an even more noticeable impact - net storage <strong>of</strong> carbon,over 630 tonnes <strong>of</strong> CO 2 equivalent. The storage <strong>of</strong> carbon more than cancels out all thegreenhouse gases emitted in the manufacturing process <strong>of</strong> all the other building materials.As shown in Figure 10.2, under this permanent carbon storage scenario, the Timber andTimberPlus buildings have significantly lower net emissions over the full 60 year life-cycle <strong>of</strong>the buildings (data from Table 6.9 and Table 9.3) compared to either conventional, presentdaylandfilling or material reutilisation and recycling.This storage <strong>of</strong> carbon would allow the TimberPlus building to operate for the first 12 yearsas a ‘carbon neutral’ building with no net emission <strong>of</strong> CO 2 .Net storage <strong>of</strong> carbon in wood products is consistent with the idea <strong>of</strong> ‘regenerative building’where the built environment positively repairs the damage <strong>of</strong> previous generations.GWP (t CO2 eq.)8,0007,0006,0005,0004,0003,0002,0001,0000Concrete Steel Timber TimberPlusLandfill scenario w ith decomposition <strong>of</strong> 14% <strong>of</strong> timber after 46 yearsReutilisation / recycling scenarioLandfill w ith 100% permanent carbon storage in timber productsFigure 10.2. Net lifecycle GWP emissions for the four buildings showing comparison <strong>of</strong> different end-<strong>of</strong>lifescenarios.• How important is the choice <strong>of</strong> indicators for an assessment?The comparison between the two end-<strong>of</strong>-life scenarios in Chapter 6 shows that conclusionsbased on a single indicator could lead to unintended outcomes. <strong>Using</strong> the TimberPlus buildingas an example, the results <strong>of</strong> the landfilling scenario would be slightly better in terms <strong>of</strong>climate change. However, looking at the energy results alongside the global warmingpotential results, the reutilisation scenario shows an energy reutilisation benefit, as well asstill being beneficial to climate change. Therefore, the use <strong>of</strong> multiple indicators is necessaryto inform the environmental decision-making processes.
- 129 -• What is the ranking <strong>of</strong> the buildings in terms <strong>of</strong> environmental impacts?____________________________________________________________________Initial embodied energy Best (least embodied energy) TimberPlus<strong>of</strong> materialsTimber(From Table 6.6)ConcreteWorst (most embodied energy) Steel___________________________________________________________________________Initial embodied CO 2 -eq. Best (lowest GWP emissions) TimberPlus<strong>of</strong> materialsTimber(From Table 6.7)ConcreteWorst (highest GWP emissions) Steel_____________________________________________________________________Total primary energy use Best (least total energy used) TimberPlus<strong>of</strong> building over full lifecycleConcrete- landfill scenario Timber(From Table 6.6) Worst (most total energy used) Steel___________________________________________________________________________Total GWP emissions Best (least total GWP emissions) TimberPlus<strong>of</strong> building over full lifecycleTimber- landfill scenario Concrete(From Table 6.7) Worst (most total GWP emissions) Steel_____________________________________________________________________Total GWP emissions Best (least total GWP emissions) TimberPlus<strong>of</strong> building over full lifecycleTimber- reutilisation scenario Steel(From Table 6.11) Worst (most total GWP emissions) Concrete_____________________________________________________________________• How important is the choice <strong>of</strong> energy and GWP data-set coefficients on LCAresults?The importance <strong>of</strong> the choice <strong>of</strong> energy and GWP data-set coefficients is significant.This is because the embodied energy and GWP <strong>of</strong> the various building materials – two <strong>of</strong> themost important environmental impacts assessed by LCA - are calculated by multiplying thequantities <strong>of</strong> materials in each building by an appropriate embodied energy or GWPcoefficient.As noted earlier (Section 9.4.3), due to the lack <strong>of</strong> locally produced and specific data forbuilding materials, a number <strong>of</strong> previous studies in New Zealand have been based onEuropean industry and energy data sets. However, processes, manufacturing and energysources in NZ - with a significant proportion <strong>of</strong> renewable energy generation being fed intothe NZ energy mix and wood processors, in particular, utilising locally produced biomassenergy – are <strong>of</strong>ten very different to those found in Europe and, thus, coefficients can be verydifferent.The recent study “Life Cycle Assessment: Adopting and adapting overseas LCA data andmethodologies for building materials in New Zealand” (Nebel et al., 2009) has addressedsome <strong>of</strong> the issues and produced a limited data set for the major building materials in NZ (see
- 130 -also Section 6.3.2.3.) This new NZ-specific data set shows that in comparison with one <strong>of</strong> themost widely used data sets in Europe (Gabi 4.3), there are major differences in coefficients foraluminium, steel and engineered wood products, such as LVL and plywood.The new data set now derives a GWP coefficient for LVL produced in NZ <strong>of</strong> 0.377 kg CO 2eq., which is significantly less than in previous studies. However, this figure is still based onGlulam (a similar laminated timber product) derived from European industry data, with somesignificant adaptions made to recognise NZ conditions.Nelson Pine Industries Limited, a NZ-based producer <strong>of</strong> LVL, has undertaken extensive workto calculate a GWP coefficient for its LVL. Nelson Pine use a significant amount <strong>of</strong> biomassenergy. When this biomass is recognised as a renewable energy source, they have calculateda GWP coefficient for LVL <strong>of</strong> 0.206 kg CO 2 eq. This is finished LVL product out-the-gate.Furthermore, Nelson Pine believe that planned improvements in the production process coulddrop this figure to under 0.174 kg CO 2 eq.• Does the NZ Green Building Council Green Star Office rating tool capture thefull environmental impacts <strong>of</strong> energy consumption and GWP and does the ratingtool recognise the benefits <strong>of</strong> reutilising all materials?There are clear differences in the results <strong>of</strong> environmental impacts for both energy usage andGWP between assessments based on the Green Star rating tool and the LCA methodology.The results <strong>of</strong> both tools were not consistent and it is obvious that the recycling content <strong>of</strong>steel and concrete drive the material related results in Green Star. The reutilisation scenarioin the LCA study showed that there are environmental benefits related to the energy use <strong>of</strong>post-consumer timber, especially through thermal treatment (burning to recover energy anddisplace other carbon based fossil fuels). This can not be accommodated for in the Green Starassessment tool.The Green Star Office rating tool does not take the amount <strong>of</strong> timber used in a building intoaccount. The LCA process showed a clear difference between the Timber and the TimberPlusbuilding; however, both have the same results in the Green Star assessment.The higher weighting <strong>of</strong> energy (25 %) than materials (10 %) for the single score <strong>of</strong> the GreenStar rating is consistent with the LCA study which showed that operational energy usedominates the results over the whole life cycle.• Is it possible to construct a multi-storey building in Timber?A considerable and growing volume <strong>of</strong> research and expertise in the design <strong>of</strong> timberstructures and buildings, aided by advances in engineered timber products and associatedindustry developments, supports the proposal that the Timber building designs in this reportcould be built right now.The performance-based NZ Building codes should not provide any ‘roadblocks’. Designfeatures <strong>of</strong> the Timber buildings can address and allay all concerns over seismic, fire andnoise constraints and research is on-going.
- 131 -• What is the comparison in construction time between construction <strong>of</strong> a timbermulti-storey building and equivalent conventional concrete or steel designs?A direct comparison between construction times shows that with a large amount <strong>of</strong> <strong>of</strong>f-siteprefabrication, all four buildings can be erected in less than 70 days.• Is it feasible and practical to increase the use (amount) <strong>of</strong> timber in multi-storeybuildings?Today’s design, engineering and construction methods show that it is entirely feasible to usetimber as the main structural material for multi-storey buildings. Current research stronglyindicates that an innovative post-tensioning alternative timber design to conventional concreteand steel designs is a viable and realistic proposition.It is clearly feasible to increase the amount <strong>of</strong> timber used in the architecture <strong>of</strong> multi-storeybuildings, both externally and internally. The replacement <strong>of</strong> conventional aluminiumwindows and louvres with equivalent timber components significantly reduces the totallifetime energy use and GWP <strong>of</strong> a building.No building will be built exclusively <strong>of</strong> only one material - concrete, steel or timber.<strong>Buildings</strong> which combine the benefits <strong>of</strong> mixed materials – hybrid designs – such as concretefor thermal mass and timber for structural members and architectural features <strong>of</strong>fer theprospect <strong>of</strong> buildings with the lowest overall environmental impacts.This report shows that it is possible to source all timber from certified sustainable forests andprocessing systems and that the availability <strong>of</strong> certified timber is increasing rapidlyworldwide. Furthermore, there are many timber treatments available on the market todaywhich do not use CCA treatments and provide timber products with durability to outlast the60 year lifetime <strong>of</strong> a typical multi-storey building.• Is there a problem with either reutilising or disposing <strong>of</strong> treated timber at theend-<strong>of</strong>-life <strong>of</strong> a timber building?Modern timber preservation techniques do not need to employ CCA treatments. Futuretimber buildings will not need to use CCA treated timber.At present, at the end-<strong>of</strong>-life, most treated timber is landfilled. Modern landfills are designedto eliminate the release <strong>of</strong> harmful products <strong>of</strong> gradual decomposition or leaching. Also,research is developing methods for the removal <strong>of</strong> treatments from timber products, thusrendering it safe for recycling, landfill disposal or incineration without the use <strong>of</strong> complexfiltration systems.Treated timber products can be recycled into particleboard, chipboard and orientated strandboard or incorporated into wood-plastic and wood-cement composites.There are no facilities currently available in NZ for burning treated timber for energyproduction. Research and advances in gasification and pyrolysis may provide thermaltreatment options in the future.
- 132 -ReferencesASHRAE American Society <strong>of</strong> Heating, Refrigerating and Air-Conditioning Engineers. 2005Ashrae Handbook : Fundamentals. Atlanta, GA.: ASHRAE, 2005.Alcorn, A. 1995. Embodied energy coefficients <strong>of</strong> building materials. Centre for BuildingPerformance Research. Victoria University <strong>of</strong> Wellington.Alcorn, A. 1998. Embodied energy coefficients <strong>of</strong> building materials. Centre for BuildingPerformance Research. Victoria University <strong>of</strong> Wellington.Alcorn, A. (2003). Embodied Energy and CO2 coefficients for NZ Building Materials.Centre for Building Performance Research, Victoria University <strong>of</strong> Wellington, March2003.Aye, L., Bamford, N., Charters, B., & Robinson, J. (1999). Optimising embodied energy incommercial <strong>of</strong>fice development. RICS Foundation, 217-223.Bellamy, L., and D. Mackenzie. "Simulation Analysis <strong>of</strong> the Energy Performance andHumidity <strong>of</strong> Solid Wood and Light Timber Frame Houses." Pine ManufacturersAssociation Solid Wood Building Initiative (2007).Buchanan, A. H., Deam, B. L., Fragiacomo, M., Pampanin, S., & Palermo, A. (2008). <strong>Multi</strong>-<strong>Storey</strong> Prestressed Timber <strong>Buildings</strong> in New Zealand. Structural EngineeringInternational, Journal <strong>of</strong> the International Association for Bridge and StructuralEngineering (IABSE). Vol. 18, No. 2, pp 166 - 173.Bioenergy Knowledge Centre (2008). Biomass calorific value calculator.http://bkc.co.nz/Portals/0/docs/tools/calorific_value_calculator.htmlChristensen, I., Pederson, A. et al. (2004). Electro-dialytic remediation <strong>of</strong> CCA-treated Woodin Larger Scale. Proceedings <strong>of</strong> <strong>Environmental</strong> <strong>Impacts</strong> <strong>of</strong> Preservative-treated woodConference, Orlando, Florida, 8-11 February, 2004.Clausen, C. A., Kartal, S. N. and Muehl, J. (2000) Properties <strong>of</strong> particleboard made fromrecycled CCA-treated wood. The International Research Group on WoodPreservation, 31st Annual Meeting, Kona, Hawaii 14th – 19thClausen, C. A., Kartal, S. N. and Muehl, J. (2001) Particleboard made from remediated CCAtreatedwood: evaluation <strong>of</strong> panel properties. Forest Products Journal Vol. 51 (7/8),pp.61 – 64Clausen,C.A., Kenealy, W.R. (2004) Scaled-up remediation <strong>of</strong> CCA treated wood.Proceedings <strong>of</strong> <strong>Environmental</strong> <strong>Impacts</strong> <strong>of</strong> Preservative-treated wood Conference,Orlando, Florida, 8-11 February, 2004.Cole, R. J., & Kernan, P. C. (1996). Life-cycle energy use in <strong>of</strong>fice buildings. Building andEnvironment, 31(4), 307-317(311).
- 133 -Connell Wagner (2007): Combustion <strong>of</strong> Biomass. CRL Energy. Report No. 29919-001/R1.Cooper, P.A. and Kazi, F.K.M. (2006). Method to recover and reuse chromated copperarsenate wood preservative from spent treated wood. Waste Management 26, 182-188.DesignBuilder S<strong>of</strong>tware. "Designbuilder User Interface for Energyplus,". 2008.http://www.designbuilder.co.uk/. Ed. http://www.designbuilder.co.uk/.Einola, J.; Sormunen, K.; Lensu, A.; Leiskallio, A.; Ettala, M.; Rintala, J.; (2009) Methaneoxidation at a surface-sealed Boreal landfill. Waste Management 29, 2105–2120Frischknecht, R.; Althaus, H.J.; Bauer, C.; Doka, G.; Heck, T.; Jungbluth, N.; Kellenberger,D.; Nemecek, 2007. The <strong>Environmental</strong> Relevance <strong>of</strong> Capital Goods in Life CycleAssessments <strong>of</strong> Products and Services. International Journal for LCA (Online First):11.GaBi 2006: LBP, PE: GaBi 4.2. S<strong>of</strong>tware-System and Databases for Life Cycle Engineering.Copyright, TM. Stuttgart, EchterdingenHelson, L., Van den Bulck, E. (2005). Review <strong>of</strong> disposal technologies for chromated copperarsenate (CCA) treated wood waste, with detailed analyses <strong>of</strong> thermochemicalconversion processes. <strong>Environmental</strong> Pollution 134, 301-314.IPCC (2006). NGGIP Publication '2006 IPCC Guidelines for National Greenhouse GasInventories'IPCC (2007): Climate Change: The physical science basis. Chapter 2: Changes inatmospheric constituents and in radiative forcing. Intergovernmental Panel on ClimateChange.Kellenberger, D.; Althaus, H.J. (2008): Relevance <strong>of</strong> simplifications in LCA <strong>of</strong> buildingcomponents. Accepted for publication in “Building and Environment”.Kirk, SJ; Dell'Isola, A. (1995): Life Cycle Costing for Design Pr<strong>of</strong>essionals. 2 nd edition.McGraw-Hill, New York.Love, S. (2007). Extended Producer Responsibility <strong>of</strong> Treated Timber Waste. Scion. SB07Sustainable Building Conference, New Zealand (Building Research).MED (2005). New Zealand Energy Data File, June 2005. Ministry for EconomicDevelopment. New Zealand.MfE (2007): The 2006/07 National Landfill Census. October 2007, Ref. ME842. Ministry forthe Environment. New Zealand.MfE (2009): New Zealand's Greenhouse Gas Inventory 1990-2007. Ref ME928. Ministry forthe Environment, New Zealand.
- 134 -Nebel, B., Alcorn, A. and Wittstock, B. (2009). Life Cycle Assessment: Adopting andadapting overseas LCA data and methodologies for building materials in NewZealand. ScionResearch.NZ Green Building Council. "Green Star NZ - Office Design V1". 2008.http://www.nzgbc.org.nz/index.php?option=com_content&task=blogcategory&id=80&Itemid=75.NZS. NZS 4243: 1996 Energy Efficiency - Large <strong>Buildings</strong>: Standards New Zealand, 1996.Oppenheim, D., & Treloar, G. (1995). Embodied energy and <strong>of</strong>fice buildings - A case study.Proceedings <strong>of</strong> the 33rd Australian and New Zealand Solar Energy SocietyConference 1, 349 - 354.Page, Ian. E408 Timber in Government <strong>Buildings</strong> - Cost and Evironmental Impact Analysis.Porirua: BRANZ Limited, 2006.Palermo, A., Pampanin, S., Fragiacomo, M., Buchanan, A. H., & Deam, B. L. (2006).Innovative Seismic Solution for <strong>Multi</strong>-<strong>Storey</strong> LVL Timber <strong>Buildings</strong>. Proceedings,World Conference on Timber Engineering, Portland, USA, August 2006.Perez, N. (2008): The influence <strong>of</strong> construction materials on the life cycle energy use andcarbon dioxide emissions <strong>of</strong> medium sized commercial buildings. M.B.Sc thesis forMaster in Building Science. Victoria University <strong>of</strong> Wellington.Princeton (2008): Princeton University Design Standards: 1.1 University FacilitiesOrganization.http://www.princeton.edu/facilities/design_construction/princeton_university_desi/Property Council <strong>of</strong> New Zealand, 2000. Energy consumption benchmarks: An analysis <strong>of</strong> theenergy expenses incurred by New Zealand CBD <strong>of</strong>fice buildings.Sartori, I., and A. G. Hestnes. "Energy Use in the Life Cycle <strong>of</strong> Conventional and Low-Energy <strong>Buildings</strong>: A Review Article " Energy and buildings 39 (2007): 249-57.Skog, K.; Nicholson, G. (1998): Carbon cycling through wood products: The role <strong>of</strong> woodand paper products in carbon sequestration. Forest Products Journal, Vol. 48, No 7/8.Smith, T. (2008). Masters thesis; ‘Hybrid Laminated Veneer Lumbar <strong>Buildings</strong>; Detailing,Feasibility and Constructibility’. Department <strong>of</strong> Civil and Natural ResourcesEngineering, Canterbury University.Smith, T., Pampanin, S., Fragiacomo, M., & Buchanan, A. H. (2008). Design andConstruction <strong>of</strong> Prestressed Timber <strong>Buildings</strong> for Seismic Areas. Proceedings, WorldConference on Timber Engineering, Miyazaki, Japan, June 2008.Standards New Zealand (NZS) 4220, 1982. “Code <strong>of</strong> practice for energy conservation in nonresidentialbuildings”.Structural Engineering International (2008). Volume 18, No. 12.
- 135 -Suzuki, Michiya, and Tatsuo Oka. "Estimation <strong>of</strong> Life Cycle Energy Consumption and Co2Emission <strong>of</strong> Office <strong>Buildings</strong> in Japan." Energy and <strong>Buildings</strong> 28.1 (1998): 33-41.Szalay, Z. (2006): The Exemplar House. Scion internal report.Taylor, J., Mann, R., Reilly, M., Warnken, M., Pincic, D., Death, D. (2005). Recycling andEnd-<strong>of</strong>-life Disposal <strong>of</strong> Timber Products. Prepared for the Australian GovernmentForest and Wood Products Research and Development Corporation. Final Report,2005.Treloar, G. J., Fay, R., Ilozor, B., & Love, P. E. D. (2001). An analysis <strong>of</strong> the embodiedenergy <strong>of</strong> <strong>of</strong>fice buildings by height. Facilities, 19(5-6), 204-214(211).Wegener, G.; Fengel, D. (1982): Wood. Chemistry, Ultrastructure, Reactions. Verlag Kessel.Germany.WRAP, (2005). Options and Risk Assessment for Treated Wood Waste. Written by TradaTechnology and Enviros Consulting Ltd for the Waste and Resources ActionProgramme (UK).Ximenes, F.; Gardner, W.D.; Cowie, A.L. (2008): The decomposition <strong>of</strong> wood products inlandfills in Sydney, Australia. Waste Management, In Press, CorrectedPro<strong>of</strong>, Available online 4 January 2008
- 136 -Appendix A: Material quantities <strong>of</strong> each building typeLegend:CR/SS/SSS/GGTLVLCMDFAlGibPFCConcrete in;Reinforcing Steel in;Structural Steel in;Other Steel in;Galvanized SteelGlass in;Timber in;LVLCedarMDFAluminium in;Plasterboard to;Paint to;Particleboard/fibreboard to;In Insulation to;
- 137 -C O N C R E T E B U I L D I N Gm m2 workings m3 density tonnesFoundationsC Beam Foundations 69 1.2 x 0.6 49.6837 1.5 x 1.4 77.70 127.38 2.31 294.25R/S Beam Foundations 6937 106 0.046 4.88C Raft Foundations 71 0.3 21.3017 0.3 5.10 26.40 2.31 60.98R/S Raft Foundations 7117 88 0.04 3.52Ground Floor SlabsC Ground Floor Slabs 72 0.3 21.60725 0.2 145.00 166.60 2.31 384.85R/S Ground Floor Slabs 72725 797 0.002273 1.81Suspended floorsC Suspended Floor Slabs 2574 0.09 231.661046 0.09 94.14645 0.065 41.9341 0.14 5.74 373.47 2.31 862.70R/S Suspended Floor Slabs 2574104664541 4306 0.002273 9.79Structure:SS Portals 16.66C Columns 72 0.4 x 0.8 23.04269 0.4 x 0.5 53.80 76.84 2.31 177.50R/S Columns 72269 341 0.03 10.23C Beams 248 0.4 x 0.8 79.36790 0.4 x 0.6 189.60209 0.3 x 0.51 31.9860 0.3 x 0.51 9.18 310.12 2.31 716.37R/S Beams 24879020960 1307 0.015 19.61C Walls 349 0.3 104.701540 0.26 400.4095 0.2 19.00164 0.2 32.80 556.90 2.31 1,286.44R/S Walls 349 0.03 10.471540 0.03 46.2095 0.015 1.43164 0.015 2.46 60.56StairsC Stairs 27 1.62 43.74 2.31 101.04R/S Stairs 27 0.15 4.03G Balustrading 27 45.9 0.0375 1.72Ro<strong>of</strong>S Pant_Room_Wall Cladding 241 0.00751 1.81S Ro<strong>of</strong> Cladding 445 0.00751 3.34S Spouting 36 0.25 x 0.3 0.0280 0.15 x 0.175 0.03 0.05 7.85 0.39S Downpipes 158 150 dia 0.04 7.85 0.31Exterior wallsS Exterior Wall Framing 3.5 518241 2656.5 92 x 1.15 0.001523 4.05S Exterior cavity battens 1.8 518 932.4 0.000601 0.56P Exterior Walls 518 0.06FC Exotec fibrecement walls 518 Under windows on south east and north west643 Along corridor 1161.00 0.0135 15.67In Walls - R2.6 518 Under windows on south east and north westGib Walls - 13 Standard643 Along corridor 1161.00 1.93518 Envelope 0.0087 4.51
- 138 -T S<strong>of</strong>fit Framing 3.8 87 330.6 75 x 50 1.24 0.506 0.63FC Vitra fibrecement s<strong>of</strong>fits 87 0.0135 1.17P Exterior S<strong>of</strong>fits 87 0.01In Polystyrene Thermom 1540 2.31WindowsG Windows 138172 1453.00 0.03095 44.97T Window reveals 496 400 x 25 4.96 0.506 2.51Al Windows 2418 0.5 1209.00 0.005366 6.49DoorsG Doors 6 11 0.03095 0.34T Doors 69 0.029 2.00P Doors 69 216 0.02Al Doors 51 0.5 25.50 0.005366 0.14Interior wallS Interior Wall Framing 3.5 1466643 7381.5 92 x 1.15 0.001523 11.24Gib Walls - 13 Standard 643 Interior 0.0087 5.59Gib Walls - 13 Fyreline 2932 Interior 0.0098 28.73P Interior Walls 51829321286840 5576.00 0.60In Walls - acoustic 1466 2.05CeilingIn Ceilings 445Exposed to the outside 40960 914.00 1.37Fb/C Mineral fibre ceiling tiles 3660685 4345.00 0.0045 19.55LouversAl Louvres 2903 0.7 2032.10 0.013415 27.26C O N C R E T E B U I L D I N G M A I N T E N A N C EStairs Lifetime # <strong>of</strong> replacements Mass <strong>of</strong> replacements (tonnes) ReferenceC Stairs 50 0.2 20.21 Kirk et al. 1995R/S Stairs 50 0.2 0.81 Kirk et al. 1995G Balustrading 40 0.5 0.86 Kirk et al. 1995Ro<strong>of</strong>S Pant_Room_Wall Cladding 40 0.5 0.90 Szalay 2006S Ro<strong>of</strong> Cladding 40 0.5 1.67 Szalay 2006S Spouting 40 0.5 0.20 Kirk et al. 1995S Downpipes 40 0.5 0.16 Kirk et al. 1995Exterior wallsS Exterior cavity battens 40 0.5 0.28 Szalay 2006P Exterior Walls 8 6.5 0.36 Szalay 2006FC Exotec fibrecement walls 50 0.2 3.13 Szalay 2006Gib Walls - 13 Standard 40 0.5 2.25 Szalay 2006FC Vitra fibrecement s<strong>of</strong>fits 40 0.5 0.59 Szalay 2006P Exterior S<strong>of</strong>fits 8 6.5 0.06 Szalay 2006WindowsG Windows 40 0.5 22.49 Szalay 2006T Window reveals 40 0.5 1.25 Szalay 2006Al Windows 40 0.5 3.24 Szalay 2006DoorsG Doors 40 0.5 0.17 Szalay 2006T Doors 40 0.5 1.00 Szalay 2006P Doors 8 6.5 0.15 Szalay 2006Al Doors 40 0.5 0.07 Szalay 2006Interior wallGib Walls - 13 Standard 40 0.5 2.80 Szalay 2006Gib Walls - 13 Fyreline 40 0.5 14.37 Szalay 2006P Interior Walls 8 6.5 3.93 Szalay 2006CeilingFb/C Mineral fibre ceiling tiles 40 0.5 9.78 Assumption
- 139 -S T E E L B U I L D I N Gm m2 workings m3 density tonnesFoundationsC Beam Foundations 69 1.2 x 0.6 49.6837 1.5 x 1.4 77.70 127.38 2.31 294.25R/S Beam Foundations 6937 106.00 0.046 4.88C Raft Foundations 71 0.3 21.3017 0.3 5.10 26.40 2.31 60.98R/S Raft Foundations 7117 88.00 0.04 3.52C Pad Foundations 6 0.4 x 0.2 0.19 0.19 2.31 0.44R/S Pad Foundations 6 0.4 x 0.2 0.19 0.05 0.01Ground Floor SlabsC Ground Floor Slabs 72 0.3 21.60725 0.2 145.00 166.60 2.31 384.85R/S Ground Floor Slabs 72725 797.00 0.002273 1.81Suspended floorsC Suspended Floor Slabs 4304 0.15 645.60 645.60 2.31 1,491.34R/S Suspended Floor Slabs 4304 0.002273 9.78S/G Comflor 4304 0.0115 49.50StairsC Stairs 27 1.62 43.74 2.31 101.04R/S Stairs 27 0.15 4.03G Balustrading 27 45.9 0.0375 1.72Structure:S/S Portals Plantroom 15.66S/S Columns 69.66S/S Beams 138.20S/S Braces 22.82S/S Plates and Cleats 20.00Exterior wallsS Wall Cladding 1808 Cladding 0.00751 13.58S/G Exterior Wall Framing 3.5 180824130 7276.5 92 x 1.15 0.001523 11.08S/G Exterior Cavity Battens 1.8 18086530 3425.4 0.000601 2.06P Exterior Walls 30 0.003FC Exotec fibrecement walls 30 SW_Facade 0.0135 0.41In Walls - R2.6 1808164843852 3667.00 6.11Gib Walls - 13 Standard 1808 Exterior walls 0.0087 15.73S Parapet Framing 3.5 65 227.5 92 x 1.15 0.001523 0.35FC Exotec fibrecement parapet 65 0.0135 0.88P Exterior Parapets 65 0.01S S<strong>of</strong>fit Framing 3.8 87 330.6 0.000601 0.20FC Vitra fibrecement s<strong>of</strong>fits 87 0.0135 1.17P Exterior S<strong>of</strong>fits 87 0.01Ro<strong>of</strong>S Wall Cladding Plant room 241 2049.00 0.00751 1.81S Ro<strong>of</strong> Cladding 445 0.00751 3.34S Spouting 36 0.25 x 0.3 0.0280 0.15 x 0.175 0.03 0.05 7.85 0.39S Downpipes 158 150 dia 0.04 7.85 0.31T Ro<strong>of</strong> Framing 2.6 445409 2220.4 150 x 50 16.65 0.506 8.43T Plywood Ro<strong>of</strong>s 409 0.01 4.09Interior wallFC Exotec fibrecement walls 843 Chimneys852 Chimneys 1695.00 0.0135 22.88
- 140 -S/G Internal Wall Framing 3.5 615852 5134.5 92 x 0.75 0.00104164 574 150 x 0.75 0.001547843 2950.5 92 x 1.15 0.001523 10.72Gib Walls - 13 Standard 328 Interior843 Interior852 Interior 2023.00 0.0087 17.60Gib Walls - 13 Fyreline 1230 Interior 0.0098 12.05P Interior Walls 1808123032816861704 6756.00 0.73In Walls - acoustic 615 0.86WindowsG Windows 138172 1453.00 0.03095 44.97T Window reveals 496 400 x 25 4.96 0.506 2.51Al Windows 2418 0.5 1209.00 0.005366 6.49DoorsG Doors 6 11 0.03095 0.34T Doors 69 0.029 2.00P Doors 69 216 0.02Al Doors 51 0.5 25.50 0.005366 0.14Ceiling <strong>of</strong>ficesFb/C Mineral fibre ceiling tiles 3660685 4345.00 0.0045 19.55In Ceilings 445 exposed to outside - L6 and L7 plantroom40960 914.00 1.37LouversAl Louvres 2903 0.7 2032.10 0.013415 27.26S T E E L B U I L D I N G M A I N T E N A N C EStairs Lifetime # <strong>of</strong> replacements Mass <strong>of</strong> replacements (tonnes)C Stairs 50 0.2 20.21 Kirk et al. 1995R/S Stairs 50 0.2 0.81 Kirk et al. 1995G Balustrading 40 0.5 0.86 Kirk et al. 1995Exterior wallsS Wall Cladding 30 1 13.58 Kirk et al. 1995S/G Exterior Cavity Battens 40 0.5 1.03 Szalay 2006P Exterior Walls 8 6.5 0.02 Szalay 2006FC Exotec fibrecement walls 50 0.2 0.08 Szalay 2006Gib Walls - 13 Standard 40 0.5 7.86 Szalay 2006S Parapet Framing 50 0.2 0.07 Szalay 2006FC Exotec fibrecement parapet 50 0.2 0.18 Szalay 2006P Exterior Parapets 8 6.5 0.05 Szalay 2006FC Vitra fibrecement s<strong>of</strong>fits 50 0.2 0.23 Szalay 2006P Exterior S<strong>of</strong>fits 8 6.5 0.06 Szalay 2006Ro<strong>of</strong>S Wall Cladding 40 0.5 0.90 Szalay 2006S Ro<strong>of</strong> Cladding 40 0.5 1.67 Szalay 2006S Spouting 40 0.5 0.20 Kirk et al. 1995S Downpipes 40 0.5 0.16 Kirk et al. 1995Interior wallFC Exotec fibrecement walls 50 0.2 4.58 Szalay 2006Gib Walls - 13 Standard 40 0.5 8.80 Szalay 2006Gib Walls - 13 Fyreline 40 0.5 6.03 Szalay 2006P Interior Walls 8 6.5 4.76 Szalay 2006WindowsG Windows 40 0.5 22.49 Szalay 2006T Window reveals 40 0.5 1.25 Szalay 2006Al Windows 40 0.5 3.24 Szalay 2006DoorsG Doors 40 0.5 0.17 Szalay 2006T Doors 40 0.5 1.00 Szalay 2006P Doors 8 6.5 0.15 Szalay 2006Al Doors 40 0.5 0.07 Szalay 2006Ceiling <strong>of</strong>ficesFb/C Mineral fibre ceiling tiles 40 0.5 9.78 Assumption
- 141 -T I M B E R B U I L D I N Gm m2 workings m3 density tonnesFoundationsC Beam Foundations 69 1.2 x 0.6 49.6837 1.5 x 1.4 77.70 127.38 2.31 294.25R/S Beam Foundations 6937 106 0.046 4.88C Raft Foundations 58 0.3 17.4017 0.3 5.10 22.50 2.31 51.98R/S Raft Foundations 5817 75 0.04 3.00C Foundation Pads 6 0.3 x 0.2 0.11 2.31 0.25R/S Foundation Pads 6 0.3 x 0.2 0.11 0.05 0.01Ground Floor SlabsC Ground Floor Slabs 72 0.25 18.00725 0.2 145.00 163.00 2.31 376.53R/S Ground Floor Slabs 72725 797 0.002273 1.81Suspended floorsC Suspended Floor Slabs 4304 0.065 279.76 2.31 646.25R/S Suspended Floor Slabs 4304 0.002273 9.78T Plywood Floors 4304 0.0117 50.36StairsG Balustrading 27 45.9 0.0375 1.72T Stairs 27 0.40 10.92 0.506 5.53Structure:S/S Posts 2.18S/S Joist hangers 900 0.00034272 0.31S/S Beam tendons 30 0.11S/S Column base shoe 18 0.0101388 0.18S/S Column base dissipater 144 0.00073631 0.11S/S Wall base dissipater 72 0.00301593 0.22S/S Wall base MacAlloy 12 0.05222898 0.63LVL Columns 430 600 x 378 97.5298 500 x 378 18.52 116.05 0.506 58.72LVL Posts 140 200 x 189 5.2998 160 x 126 1.98123 200 x 189 4.65 11.92 0.506 6.03LVL Beams 425 600 x 378 72.29442 550 x 378 91.8957 450 x 252 6.4680 240 x 126 2.4289 200 x 126 2.2452 220 x 189 2.16 177.47 0.506 89.80LVL Portals 161 360 x 189 10.95 0.506 5.54LVL Joists 1 4304 400 x 126 216.92 0.506 109.76LVL Shear Walls 581 252 146.41 0.506 74.08Exterior wallsT Exterior Wall Framing 3.5 157230241 6450.5 100 x 50 32.25 0.506 16.32T Exterior Cavity Battens 1.8 58115726530 4046.4 50 x 25 5.06 0.506 2.56FC Exotec fibrecement walls 581157230 2183.00 0.0135 29.47P Exterior Walls 58115726530 2248.00 0.24In Walls - R2.6 15721641685 3421.00 5.70Gib Walls - 13 Standard 1572 Extertior walls 0.0087 13.68T Parapet Framing 3.5 65 227.5 100 x 50 1.14 0.506 0.58FC Exotec fibrecement parapet 65 0.0135 0.88P Exterior Parapets 65 0.01T S<strong>of</strong>fit Framing 3.8 87 330.6 75 x 50 1.24 0.506 0.63FC Vitra fibrecement s<strong>of</strong>fits 87 0.0135 1.17P Exterior S<strong>of</strong>fits 87 0.01
- 142 -Ro<strong>of</strong>S Wall Cladding Plantroom 241 0.00751 1.81S Ro<strong>of</strong> Cladding 445 0.00751 3.34S/G Spouting 36 0.25 x 0.3 0.0280 0.15 x 0.175 0.03 0.05 7.85 0.39S/G Downpipes 158 150 dia 0.04 7.85 0.31T Ro<strong>of</strong> Framing 2.6 445409 2220.4 150 x 50 16.65 0.506 8.43T Plywood Ro<strong>of</strong>s 409 0.01 4.09WindowsG Windows 138172 1453.00 0.03095 44.97T Window reveals 496 400 x 25 4.96 0.506 2.51Al Windows 2418 0.5 1209.00 0.005366 6.49DoorsG Doors 6 11 0.03095 0.34T Doors 69 0.029 2.00P Doors 69 216 0.02Al Doors 51 0.5 25.50 0.005366 0.14Interior wallFC Exotec fibrecement walls 1685 Chimneys 0.0135 22.75T Interior Wall Framing 3.5 6151685 100 x 50 40.25164 300 x 50 8.61 48.86 0.506 24.72Gib Walls - 13 Standard 328 Interior1685 2013.00 0.0087 17.51Gib Walls - 13 Fyreline 1230 Interior 0.0098 12.05P Interior Walls 157212303283370548 7048.00 0.76In Walls - acoustic 615 0.86Ceiling <strong>of</strong>ficesFb/C Mineral fibre ceiling tiles 3660685 4345.00 0.0045 19.55In Ceilings 445 Exposed to outside - L6 and L7 plantroom40960 914.00 1.37LouversAl Louvres 2903 0.7 2032.10 0.013415 27.26
- 143 -T I M B E R B U I L D I N G M A I N T E N A N C EStairs Lifetime # <strong>of</strong> replacements Mass <strong>of</strong> replacements (tonnes)G Balustrading 40 0.5 0.86 Kirk et al. 1995T Stairs 15 3 16.58 Princeton, 2008Exterior wallsT Exterior Cavity Battens 50 0.2 0.51 Szalay 2006FC Exotec fibrecement walls 50 0.2 5.89 Szalay 2006P Exterior Walls 8 6.5 1.58 Szalay 2006Gib Walls - 13 Standard 40 0.5 6.84 Szalay 2006T Parapet Framing 50 0.2 0.12 Szalay 2006FC Exotec fibrecement parapet 50 0.2 0.18 Szalay 2006P Exterior Parapets 8 6.5 0.05 Szalay 2006FC Vitra fibrecement s<strong>of</strong>fits 50 0.2 0.23 Szalay 2006P Exterior S<strong>of</strong>fits 8 6.5 0.06 Szalay 2006Ro<strong>of</strong>S Wall Cladding 40 0.5 0.90 Szalay 2006S Ro<strong>of</strong> Cladding 40 0.5 1.67 Szalay 2006S/G Spouting 40 0.5 0.20 Kirk et al. 1995S/G Downpipes 40 0.5 0.16 Kirk et al. 1995WindowsG Windows 40 0.5 22.49 Szalay 2006T Window reveals 40 0.5 1.25 Szalay 2006Al Windows 40 0.5 3.24 Szalay 2006DoorsG Doors 40 0.5 0.17 Szalay 2006T Doors 40 0.5 1.00 Szalay 2006P Doors 8 6.5 0.15 Szalay 2006Al Doors 40 0.5 0.07 Szalay 2006Interior wallFC Exotec fibrecement walls 50 0.2 4.55 Szalay 2006Gib Walls - 13 Standard 40 0.5 8.76 Szalay 2006Gib Walls - 13 Fyreline 40 0.5 6.03 Szalay 2006P Interior Walls 8 6.5 4.96 Szalay 2006Ceiling <strong>of</strong>ficesFb/C Mineral fibre ceiling tiles 40 0.5 9.78 Assumption
- 144 -T I M B E R P L U S B U I L D I N Gm m2 workings m3 density tonnesFoundationsC Beam Foundations 69 1.2 x 0.6 49.6837 1.5 x 1.4 77.70 127.38 2.31 294.25R/S Beam Foundations 6937 106 0.046 4.88C Raft Foundations 58 0.3 17.4017 0.3 5.10 22.50 2.31 51.98R/S Raft Foundations 5817 75 0.04 3.00C Foundation Pads 6 0.3 x 0.2 0.11 2.31 0.25R/S Foundation Pads 6 0.3 x 0.2 0.11 0.05 0.01Ground Floor SlabsC Ground Floor Slabs 72 0.25 18.00725 0.2 145.00 163.00 2.31 376.53R/S Ground Floor Slabs 72725 797 0.00227 1.81Suspended floorsC Suspended Floor Slabs 4304 0.065 279.76 2.31 646.25R/S Suspended Floor Slabs 4304 0.00227 9.78T Plywood Floors 4304 0.0117 50.36StairsT Stairs 27 0.40 10.92 0.506 5.53T Balustrading 27 21 50 x 25 0.71 0.506 0.36Structure:S/S Posts Lift shaft 2.18S/S Joist hangers 900 0.00034 0.31S/S Beam tendons 30 0.11S/S Column base shoe 18 0.01014 0.18S/S Column base dissipater 144 0.00074 0.11S/S Wall base dissipater 72 0.00302 0.22S/S Wall base MacAlloy 12 0.05223 0.63LVL Columns 430 600 x 378 97.5298 500 x 378 18.52 116.05 0.506 58.72LVL Posts 140 200 x 189 5.2998 160 x 126 1.98123 200 x 189 4.65 11.92 0.506 6.03LVL Beams 425 600 x 378 72.29442 550 x 378 91.8957 450 x 252 6.4680 240 x 126 2.4289 200 x 126 2.2452 220 x 189 2.16 177.47 0.506 89.80LVL Portals 161 360 x 189 10.95 0.506 5.54LVL Joists 1 4304 400 x 126 216.92 0.506 109.76LVL Shear Walls 581 252 146.41 0.506 74.08Ro<strong>of</strong>S Ro<strong>of</strong> Cladding 445 0.00751 3.34S/G Spouting 36 0.25 x 0.3 0.0280 0.15 x 0.175 0.03 0.05 7.85 0.39S/G Downpipes 158 150 dia 0.04 7.85 0.31T Ro<strong>of</strong> Framing 2.6 445409 2220.4 150 x 50 16.65 0.506 8.43T Plywood Ro<strong>of</strong>s 409 0.01 4.09S Wall Cladding Plant Room 241 0.00751 1.81Exterior walls (Envelope)T Exterior Wall Framing 3.5 124632730241 100 x 50 32.27276 300 x 50 14.49182 150 x 50 4.78 51.54 0.506 26.08T Exterior Cavity Battens 1.8 58112463276518230 4375.8 50 x 25 5.47 0.506 2.77T Interior Wall lining 581 10 5.8112461685 12 35.17 40.98 0.506 20.74
- 145 -T Exterior Wall Cladding 5811246327276 19 46.17 0.506 23.36T Exterior Wall Cladding 182 12 2.18 0.506 1.11T Exterior Wall Cladding 30 10 0.30 0.506 0.15P Exterior Walls 58112463276527618230 2707.00 0.29In Walls - R2.6 12463272761821685 3716.00 6.19T S<strong>of</strong>fit Framing 3.8 87 330.6 75 x 50 1.24 0.506 0.63T S<strong>of</strong>fit Lining 87 10 0.87 0.506 0.44P Exterior S<strong>of</strong>fits 87 0.01T Parapet Framing 3.5 65 227.5 100 x 50 1.14 0.506 0.58T Parapet Cladding 65 19 1.24 0.506 0.62Interior wallT Interior Wall Framing 3.5 2381685 100 x 50 33.65300 x 50 0.00 33.65 0.506 17.03T Interior Wall Cladding 1685 20.22 0.506 10.23T Walls 377 0.056 21.11P Interior Walls 12463272761827544763370548 7179.00 0.78MDF 15 MDF 32727618247682 1343.00 0.0111 14.91In Walls - acoustic 615 0.86WindowsG Windows 94972 1021.00 0.03095 31.60T Window reveals 496 400 x 25 4.96 0.506 2.51Al Windows 2418 0.08 193.44 0.00537 1.04T Window frames 2418 40 x 25 0.506 1.22DoorsG Doors 6 11 0.03095 0.34T Doors 69 0.029 2.00P Doors 69 216 0.02T Door frames 51 40 x 25 0.506 0.03Ceiling <strong>of</strong>ficesP Ceilings 82 0.01MDF 17 MDF ceiling tiles 4263 0.0126 53.71In Ceilings Exposed to outside - 445L6 and L7 plantroom 40960 914.00 1.37LouversT Louvres 2903 300 x 50 43.55 0.506 22.03P Louvres 2903 0.7 2032.10 0.22
- 146 -T I M B E R P L U S B U I L D I N G M A I N T E N A N C EStairs Lifetime # <strong>of</strong> replacements Mass <strong>of</strong> replacements (tonnes)T Stairs 15 3 16.58 Princeton, 2008Ro<strong>of</strong>S Ro<strong>of</strong> Cladding 40 0.5 1.67 Szalay 2006S/G Spouting 40 0.5 0.20 Kirk et al. 1995S/G Downpipes 40 0.5 0.16 Kirk et al. 1995S Wall Cladding 40 0.5 0.90 Szalay 2006Exterior walls (Envelope)T Exterior Cavity Battens 50 0.2 0.55 Szalay 2006T Exterior Wall Cladding 40 0.5 11.68 Kirk et al. 1995T Exterior Wall Cladding 30 1 1.11 Kirk et al. 1995P Exterior Walls 8 6.5 1.91 Szalay 2006T S<strong>of</strong>fit Framing 40 0.5 0.31 Kirk et al. 1995T S<strong>of</strong>fit Lining 40 0.5 0.22 Kirk et al. 1995P Exterior S<strong>of</strong>fits 8 6.5 0.06 Szalay 2006T Parapet Framing 40 0.5 0.29 Kirk et al. 1995Interior wallT Interior Wall Cladding 30 1 10.23 Kirk et al. 1995P Interior Walls 8 6.5 5.06 Szalay 2006MDF 15 MDF 40 0.5 7.45 Princeton, 2008WindowsG Windows 40 0.5 15.80 Szalay 2006Al Windows 40 0.5 0.52 Szalay 2006T Window frames 40 0.5 0.61 Szalay 2006DoorsG Doors 40 0.5 0.17 Szalay 2006T Doors 40 0.5 1.00 Szalay 2006P Doors 8 6.5 0.15 Szalay 2006T Door frames 40 0.5 0.01 Szalay 2006Ceiling <strong>of</strong>ficesP Ceilings 8 6.5 0.06 Szalay 2006MDF 17 MDF ceiling tiles 40 0.5 26.86 Princeton, 2008LouversP Louvres 8 6.5 1.43 Szalay 2006
- 147 -Appendix B. Life times <strong>of</strong> building materialsFrom "Life Cycle Costing for Design Pr<strong>of</strong>essionals", 2.ndEd. Kirk et al. 1995MaterialUseful LifeBalustrading (glass) ("Balcony Walls and Handrails - Glass Panels") 40Pre-cast Concrete Stairs 50Steel stairs 40Cedar/Redwood siding (cladding) 40Plywood Siding 30Corrugated Metal Deck (comflor) 30Metal s<strong>of</strong>fits 40Cast iron ro<strong>of</strong> drains 40Exterior metal panels 30+From Princeton University Design Standards Manual(Princeton 2008)MaterialUseful lifeAluminium Louvres 60Plywood Panelling (plywood ro<strong>of</strong>s/floors) 40Plywood siding (ext walls) 30Stairs - pressure treated lumber 15Wood finish carpentry/millwork (interior wood cladding) 60-80From Exemplar House Study (Szalay 2006)All foundations/floor framing/wall framing/pilesBuilding LifeFibre Cement Walls 50Weatherboard/wooden panelling 40Plasterboard lining 40Plasterboard ceiling lining and battens 40Steel ro<strong>of</strong>ing, battens, insulation 40Interior paint 8Exterior paint 8Window frames and glazing 40External doors, frames 40Internal doors 40Assumptions for this studyAcoustic Ceiling Tile, Fibre Cement 40
- 148 -Appendix C: Carbon release and sequestration from wood in landfillCalculations to determine the carbon dioxide and methane release from landfill as wood decomposesAssumed 50% <strong>of</strong> wood mass is carbon.Molar mass carbon = 12So 1kg wood = 0.5 kg Carbon.g/mol.Molar Mass CO 2 = 44 g/mol0.5 kg = 41.67 moles <strong>of</strong> carbon. Molar Mass CH 4 = 16 g/mol41.67 moles <strong>of</strong> CO 2 41.6666 moles <strong>of</strong> CH 441.6666 x 16 = 666.6741.67 x 44 grams = 1833.34 grams.gramsSo 1 kg wood --> 1.83 kg <strong>of</strong> CO 2Or 1 kg carbon --> 3.67 kg CO 2So 1 kg wood --> 0.67 kg <strong>of</strong>CH 4Or 1 kg carbon --> 1.34kgCH 4
- 149 -Appendix D: Transport scenarioEmbodied energy and GWP values for transporting materials to each building location foreach building type.Building type Building location Energy (MJ) GWP (kg CO 2 eq)Concrete Christchurch 502,770 37,305Wellington 450,210 33,405Auckland 342,150 25,393Steel Christchurch 461,150 34,609Wellington 421,841 31,690Auckland 316,470 23,880Timber Christchurch 366,700 27,196Wellington 255,090 18,918Auckland 256,110 18,994Timber+ Christchurch 368,680 27,342Wellington 245,760 18,226Auckland 267,920 19,869
- 150 -Appendix E: Letter from Holmes Consulting Limited.
- 151 -Appendix F: Warren and Mahoney report.
Timber PlusA review <strong>of</strong> the timber used in four alternativedesigns <strong>of</strong> multi-storey buildings.A report for the University <strong>of</strong> CanterburyPrepared by :Iain NichollsArchitectural Technologist
Timber Plus ProjectSummary <strong>of</strong> the Timber Plus Project.The University <strong>of</strong> Canterbury has been engaged by the Ministry <strong>of</strong> Agriculture and Forestry to investigate theenvironmental impacts <strong>of</strong> multi-storey buildings using different construction materials.The University have chosen to create a virtual model <strong>of</strong> a concrete framed building currently underconstruction. <strong>Using</strong> this model as a baseline, two further models have been developed. The first <strong>of</strong> theseuses timber in ways which are traditional and accepted within the New Zealand construction industry, thesecond seeks to explore new methods and areas in which timber can be utilised. This second alternativemodel has been titled “The Timber Plus Building”.The lifetime energy use together with the embodied energy <strong>of</strong> each building has been calculated for each <strong>of</strong>the three models and potential environmental impacts assessed wherever possible.The Brief.Warren and Mahoney have been asked to provide advice specifically regarding the timbers used within theTimber Plus building. This advice is to ensure that:-• The embodied energy <strong>of</strong> the building is minimised.• The maximum green-star rating for the building is achieved.• The timber specified can be obtained from sustainable sources.• The timber specified is suitable for the location and purpose.• Timber treatments used, if any, are kept to a minimum and are environmentally preferable.• Additional opportunities to maximise timber are identified.• End <strong>of</strong> life disposal / re-use is achieved with minimum environmental impact.It is acknowledged that this is a theoretical study and will only be presented as such.Embodied Energy.The embodied energy <strong>of</strong> an element is defined as the total amount <strong>of</strong> energy that is required to extract,transport, manufacture and construct that element. It covers the period “from cradle to gate” without takinginto account end <strong>of</strong> life disposal.For a brick this would include the energy required to extract the clay, to transport it to the brick-works, to pumpthe water, to mould it into shape, to fire it, to deliver it to site and to put it into place. In such an example theenergy to fire the brick would stand out as a major energy input.For a material such as timber, the embodied energy would include the energy required to harvest, to re-plant,to transport it to the saw mill, to process it and deliver the finished product to site and finally to install it. Astimber requires relatively little energy to plant or to grow, transportation and milling become the key areas toexamine. The timber used within a building should first and foremost be suitable for the application it isintended for and its harvesting should be carried out in a sustainable manner. Once these criteria are metproducts that require the least energy to deliver to site should be preferred.Page 2 <strong>of</strong> 21 May 2008
Timber Plus ProjectTimber TreatmentThe following methods <strong>of</strong> timber preservative are listed in order <strong>of</strong> preference. These preferences should befollowed according to the level <strong>of</strong> protection required by the New Zealand Building Code and NZS3602.1. Use <strong>of</strong> plantation timber which does not require treatment. The most reliable way to avoid decay isto use good quality well seasoned timbers in locations which are well protected from the elements,have good ventilation and can be readily inspected. Rot producing fungi are able to form when nontreatedtimber is subject to moist conditions for a prolonged period <strong>of</strong> time. (Including duringconstruction). Selection <strong>of</strong> timber species with high natural durability increases timber life. (Refer tothe following section for further information on natural durability ratings).2. Boron Salts for H1 hazard ratings in all locations which are protected from the weather. Borontreated timber is not deemed hazardous.3. CAF - Copper-based, chrome and arsenic-free treatments (such as Alkaline Copper Quaternary -ACQ) where the Building Code requires H3.2 and H5 hazard ratings. Note that certain metalproducts (including fasteners, hardware and flashing) may corrode when in direct contact with woodtreated with copper-based preservatives. To prevent premature corrosion and failure it is important t<strong>of</strong>ollow the recommendations <strong>of</strong> the manufacturers for all metal products. CAF treated wood should beregarded as toxic waste when disposed <strong>of</strong> and should not be burnt or mulched.4. LOSP - Light organic solvent preservatives where the Building Code requires H3.1 treatment. Notethat there is an increase in VOC emissions when LOSPs are applied.5. The use <strong>of</strong> CCA - (copper chrome arsenic treatments) is to be avoided. Arsenic is a knownCarcinogen and, when absorbed into the human body significantly increases the incidence <strong>of</strong> somecancers. Arsenic can be absorbed through the skin, ingested or inhaled. In the case <strong>of</strong> CCA timbertreatments people are most at risk where there is repeated hand contact combined with hand tomouth contact. For this reason CCA treated timber is not recommended for applications such aschildren’s play equipment, work surfaces etc. In the United States and in several European countriesthere are restrictions / bans in place for CCA treated projects. Although the risk is widely regarded asminimal alternatives which are Arsenic free are preferred. CCA treated wood is regarded as toxicwaste when disposed <strong>of</strong> and should not be mulched or burned.Timber Durability ClassesWithin New Zealand there are four durability classes. These are based on field tests <strong>of</strong> identically sizedheartwood stakes with ratings as follows:-Natural DurabilityHeartwood Service Life (Years)Class Fully Protected Above Ground (Exposed) In GroundD1 50+ 50+ 25+D2 50+ 30 15 – 25D3 50+ 15 8 – 15D4 50+ 8 < 5Timbers incorporated into the design <strong>of</strong> the Timber Plus building have the following natural durability ratings:-Pinus Radiata - Non-Durable D4Thuja Plicata - Durable D2Picea Abies - Non-Durable D4Page 3 <strong>of</strong> 21 May 2008
Timber Plus ProjectGreen Star Rating Scheme.The New Zealand Green Building Council (NZGBC) have recently implemented a rating scheme for <strong>of</strong>ficebuildings based largely on an existing Green Star rating scheme already successful in Australia. This schemeassesses new <strong>of</strong>fice buildings on areas which impact the natural environment and awards stars for areas <strong>of</strong>achievement.The areas assessed by the NZGBC Greenstar Office Rating scheme are many and diverse, from the location<strong>of</strong> the building in relation to public transport facilities to the energy use <strong>of</strong> the building. The areas that relate totimber use within the building are more limited however and are as follows¹:-Ref. Title Aim <strong>of</strong> Credit Credit Criteria Summary PointsAvailableIEQ-13 VolatileOrganicCompoundsIEQ-14MAT-8FormaldehydeMinimisationSustainableTimberTo encourage andrecognise projectsthat reduce thedetrimentalimpact onoccupant healthfrom finishesemitting internalair pollutantsTo encourage andrecognise projectsthat reduce theuse <strong>of</strong>formaldehydecomposite woodproducts in orderto promote ahealthy indoorenvironment.To encourage andrecognise thespecification <strong>of</strong> reusedtimberproducts or timberthat has beensourced fromcertifiedenvironmentallyresponsible forestmanagementschemes.Up to three points are awarded where it isdemonstrated that various finishes meet thebenchmarks for low Volatile Organic Compound(VOC) content. One point is achieved for eachcriterion below that is achieved:95% <strong>of</strong> all painted surfaces are low-VOC paintsOR no paint is used;All carpets are low-VOC OR no carpet is installed;and/orAll adhesives and sealants are low VOC OR noadhesives/sealants are used.One point is awarded where it is demonstratedthat:All composite wood product is low emissionformaldehyde; ORNo composite wood product used.Two points are awarded where it is demonstratedthat all timber and composite timber productsused in the building and construction works arerequired to be sourced from either a combination<strong>of</strong> the following:Post-consumer recycled timber; orForest Stewardship Council (FSC) certified timber.Locally sourced timber should be used unlessthere are demonstrable benefits from importing. Ifthe material cost <strong>of</strong> timber represents less than0.1% <strong>of</strong> the project’s total contract value then thiscredit is “Not Applicable”.312Page 4 <strong>of</strong> 21 May 2008
Timber Plus ProjectRef. Title Aim <strong>of</strong> Credit Credit Criteria Summary PointsAvailableMat-12 Non-carpetfloorcoveringsTo encourage andrecognise theselection <strong>of</strong> floorcoverings that areindependentlyverified to beenvironmentallypreferable.One point is awarded where it can bedemonstrated that 90% or more <strong>of</strong> the non-carpetfloor coverings (i.e. parquet, wooden planks,laminate and linoleum) used are independentlycertified as having lower environmental impactthan non-carpet floor coverings, as verifiedthrough a materials certification body recognisedby the NZGBC (e.g. NZ <strong>Environmental</strong> Choice).1Inn-1InnovativeStrategiesandTechnologiesTo recognise thespread <strong>of</strong>innovativeinitiatives forcommercialbuildingapplications thatimprove adevelopment’senvironmentalimpact.If carpets are not part <strong>of</strong> the project’scontract/lease then this credit is “Not Applicable”.Up to 5 innovation points are awarded at thediscretion <strong>of</strong> the NZGBC Technical Review Group,where it is demonstrated that an innovativestrategy or technology has a significantenvironmental benefit. The application will beassessed by the NZGBC against the followingcriteria:Does the application have systematic,investigative and experimental activities as part <strong>of</strong>the innovation? ORHigh levels <strong>of</strong> technical risk associated with it, forthe purposes <strong>of</strong> acquiring new knowledge(whether or not for a specific technical purpose) orcreating a new or improved material, products,devices, processes or services? ANDWhat is the environmental benefit <strong>of</strong> theinnovation?More than one innovation can be submitted,however the maximum points available for anyone building assessment under the Innovationcategory is five in total.5Total points achievable through wise use <strong>of</strong> timber 12It can be seen from the above table that the Timber Plus building has the opportunity to earn 7 points as adirect result <strong>of</strong> the correct use <strong>of</strong> timber. A further award <strong>of</strong> a maximum <strong>of</strong> 5 points is potentially available dueto the innovative and experimental nature <strong>of</strong> the timber structure. A 5 star NZ excellence rating requires aminimum <strong>of</strong> 60 points and a 6 star world excellence rating 75 points.It is possible to gain one additional point through the sensitive selection <strong>of</strong> the surface finishing treatments(paints or stains). Mat-10 requires a minimum <strong>of</strong> 95% <strong>of</strong> these coatings to be low VOC ratings throughout thewhole project – not just timber finishes. It is important that this potential is not compromised by therecommendations <strong>of</strong> this report, therefore we have recommended low VOC coatings wherever it is practicable,not only in the interior.Note 1:Note 2:Intumescent coatings may be required as instructed by a Fire Engineer. These coatings arenot yet available in low VOC formulae and this may render the achievement <strong>of</strong> the MAT-10credit impossible.There is currently no allowance made in the Greenstar rating scheme for stains or clearfinishes. It is our understanding that the imminent update to the rating tool will approvestains and clear finishes that meet the requirements <strong>of</strong> the Enironmental Choice labellingscheme. Wherever we have specified clear finishes and stains these have met theserequirements as far as possible.Page 5 <strong>of</strong> 21 May 2008
Timber Plus ProjectVolatile Organic Compounds (VOCs)<strong>Multi</strong>-layered, engineered timber products are formed using thin sheets <strong>of</strong> timber laminate bonded togetherwith resin to form stronger sheets. In plywood each sheet is laid with the grain perpendicular to the previoussheet, whereas laminated veneer lumber (LVL) is formed from sheets laid with each grain parallel.Medium density fibreboard (MDF) and particleboard each consist <strong>of</strong> small timber fibres bonded into sheetsagain using resin.Two forms <strong>of</strong> resin are used. The most common is phenol formaldehyde. The alternative, for particularlydifficult to glue species or where the more unsightly black phenolic adhesive would be disfiguring, is aminoplastic. Emissions from phenol formaldehyde are significantly less than the amino plastic binders.In concentrated amounts VOCs have been found to cause itchy eyes and breathing irritation. They are knowncarcinogens and it is desirable to minimise their presence within enclosed spaces. The reduction <strong>of</strong> VOCemitting substances has the additional benefit <strong>of</strong> reducing the need for costly and energy intensive ventilationsystems.There are two standards that NZ producers <strong>of</strong> ply, LVL, MDF and Particleboard are accustomed to measuringtheir products against:-AS/NZS 4357.0:2005, which sets out Formaldehyde Emission classes in section 2.7.2 Table 1. (AS/NZS 2269for plywood). The classes are as follows:-E0 - defined as a mean emission <strong>of</strong> 0.5 mg/L.Super E0 - defined as a mean emission <strong>of</strong> 0.3 mg/LAlthough not yet defined our expectation is that the top two grades – E0 and Super E0 - should be deemed tomeet the Greenstar NZ low VOC emission standard set out in IAQ-14. E1 grade would be deemed noncompliant.The Japanese Industrial Standard JIS A5905 2003 rates the product as F followed by a certain number <strong>of</strong>stars. The more stars the lower the emissions. Again, our expectation is that the top two grades - F*** andF**** - should be deemed to meet the Greenstar NZ low VOC emission standard. The mean formaldehydeemission level <strong>of</strong> F**** is 0.3mg/l or less which is similar to formaldehyde levels found in natural woodproducts. F** grade would be deemed non-compliant.A summary <strong>of</strong> formaldehyde emission standards is as follows:Grade Also known as Mean MaximumF**** Super E0 0.3 mg/L or less 0.4 mg/L or lessF*** E0 0.5 mg/L or less 0.7 mg/L or lessF** E1 1.5 mg/L or lessPage 6 <strong>of</strong> 21 May 2008
Timber Plus ProjectSustainable Timber SourcesThere is a temptation for many manufacturers and suppliers to ride the green wave and to make potentiallyunfounded claims <strong>of</strong> their product’s environmentally preferable characteristics. This means that the buildingpr<strong>of</strong>essional and the general public need to have a means <strong>of</strong> benchmarking these products against others thatmake similar claims. Which one is genuine? Which unfounded?Third party certification has emerged as the most trustworthy method <strong>of</strong> assessing sustainable products. Inthis case a supplier / forester or manufacturer would engage a third party, who stands to gain or lose nothingthrough a product’s success or failure, to certify the product against common criteria.There are a variety <strong>of</strong> forest management certification schemes in operation throughout the world, and somecountries have multiple schemes. Each scheme constitutes a different certification ‘brand name'.Forest management certification brands are sponsored by a number <strong>of</strong> national and international organisationsand producers may choose to seek multiple certifications.The major schemes are set out below.International Standards Organization (ISO)The ISO 14001 standard is a generic environmental management system standard that can apply to anyindustry. Three commitments must be made in the framework <strong>of</strong> ISO 14001: complying with laws andregulations, continuous improvement, and prevention <strong>of</strong> pollution. Under ISO 14001, the forest manager setsthe specific indicators and criteria for sustainable forest management (SFM). After that, a management systemis set up in order to help move toward those goals and to monitor improvements. However, in implementingISO 14001, there are no specific performance requirements, no assessment <strong>of</strong> chain <strong>of</strong> custody and thereforeno label. A significant number <strong>of</strong> major corporations in countries such as Sweden, Finland, Canada and the UShave adopted ISO 14001, sometimes in conjunction with other systems. A number <strong>of</strong> Australian forestrycompanies and State forest agencies have achieved ISO 14001 certification. Evidence <strong>of</strong> compliance with ISO14000 standard - Environment management Systems is not generally regarded as sufficient pro<strong>of</strong> <strong>of</strong> aproduct’s sustainability.Programme for Endorsement <strong>of</strong> Forest Certification (PEFC) - IncludingEurope, Australia, Brazil, Canada and U.S.A.The PEFC - was created as an umbrella organisation for nationally-based certification schemes within Europe.The Scandinavian nations were early users <strong>of</strong> certification and are currently among the largest providers <strong>of</strong>wood from certified forests. Each national certification scheme within the PEFC group maintains its ownstandards, although they are based on a European regional initiative (called the ‘Helsinki Process') whicharose from the 1992 Rio Earth Summit. PEFC confers one common label on all its recognised standards.PEFC has in its membership 32 independent national forest certification systems <strong>of</strong> which 22 to date havebeen through a rigorous assessment process involving public consultation and the use <strong>of</strong> independentconsultants to provide the assessments on which mutual recognition decisions are taken by the membership.These 22 schemes account for over 193 million hectares <strong>of</strong> certified forests producing millions <strong>of</strong> tonnes <strong>of</strong>certified timber to the market place making PEFC the world's largest certification scheme. The other nationalmember’s schemes are at various stages <strong>of</strong> development and are working towards mutual recognition underthe PEFC processes.In 2004 the Australian Forest Standard was endorsed under the PEFC scheme.Page 7 <strong>of</strong> 21 May 2008
Timber Plus ProjectThe Forest Stewardship Council (FSC) systemThe Forest Stewardship Council began as an initiative <strong>of</strong> the conservation organisation World Wide Fund forNature. It became a corporation in October 1995 and is based in Mexico. The FSC is a framework, not a singlestandard. All national FSC initiatives are based on a common set <strong>of</strong> principles and criteria. The FSCCorporation assesses and approves different national standards. All FSC standards use a common label.FSC-accredited certifiers work on the basis <strong>of</strong> 10 general FSC principles and 56 criteria, as well as national orregional standards where they have been developed.Many nations have established FSC 'National Initiatives' and in Canada and the US there are several subregionseach with an FSC standard under development. The FSC currently covers about 84 million hectares <strong>of</strong>forest worldwide So far the FSC is concentrated in a few nations, with 36% <strong>of</strong> all FSC-certified forests inSweden, 15% in Poland, 11% in the USA and 4% in Brazil. The remaining 34% is located in smaller quantitiesacross 50 other nations. Only 3-4% <strong>of</strong> FSC certifications are in the Asia-Pacific region. No FSC standard hasyet been developed for application in Australia.FSC have a chain <strong>of</strong> custody (CoC) certification which certifies all parties involved in handling the product.As noted above, the FSC certification scheme is the only scheme recognised by the NZGBC for the purpose <strong>of</strong>achieving Green Star rating scheme points.Canadian Standards Association (CSA)The first national certification scheme in Canada was approved in 1996 under the auspices <strong>of</strong> the CanadianStandards Association (CSA). While the development <strong>of</strong> the CSA certification standard was sponsored byindustrial organizations, a wide range <strong>of</strong> stakeholders were involved in the process. The Canadian Standard isbased on the management principles <strong>of</strong> the ISO 14001 but goes beyond them to include specific performancegoals. Third party auditing is required for certification. CSA provides for ‘chain <strong>of</strong> custody' certification for forestproducts originating from a certified forest, and provides for labelling. In 2006 the Canadian nationalsustainable forest management standard CAN/CSA Z809:2002 was endorsed by PEFC – it covers in excess<strong>of</strong> 15 million hectares.Sustainable Forestry Initiative (SFI)SFI, like the international non-pr<strong>of</strong>it Forest Stewardship Council (FSC), sets standards for sustainablyharvested timber, but SFI grew out <strong>of</strong> the trade group American Forest and Paper Association (AF&PA), andits certification process has long been seen by environmental groups as less robust than FSC’s. SFI gained anew measure <strong>of</strong> independence on January 1, 2007. Responsibility for the program was previously splitbetween the non-pr<strong>of</strong>it Sustainable Forestry Board and AF&PA; the multi-stakeholder Board <strong>of</strong> Directors <strong>of</strong> theSustainable Forestry Initiative, Inc. is now the sole governing body over the SFI Standard and all aspects <strong>of</strong>the program. Of the 15 board members, five are the CEOs <strong>of</strong> non-pr<strong>of</strong>it environmental groups; five boardmembers are the CEOs <strong>of</strong> forest products companies; and the remaining board members representstakeholders from the broader forest community. SFI is based on a set <strong>of</strong> principles, objectives andperformance measures. Under SFI, companies must demonstrate continuous improvement in meeting SFI'sforest management objectives. The area covered by the SFI in January 2007 was over 126 million hectares.Page 8 <strong>of</strong> 21 May 2008
Timber Plus ProjectTimber Utilised in Timber Plus Building.INTERNAL STAIRSMaterial 1:Species:VOC Emissions:Transport:Certification:Available:Processing Energy:Treatment required:Plywood.Pinus Radiata (plantation grown).Produced to E0 standard.Grown / produced in New Zealand (Tokoroa and Mt Maunganui). Trucked tomerchants throughout the North and South Islands.FSC CoC certifiedCarter Holt Harvey Ltd. www.chh.comAll veneer drying is from gas and all steam for log conditioning is supplied Hog Fuel(Wood Waste) and burning <strong>of</strong> the black liquor from the pulping process.Untreated.Material 2:Species:VOC Emissions:Transport:Certification:Available:Processing Energy:Treatment required:Notes:Laserframe MSG8.Pinus Radiata (plantation grown).Untreated wood has extremely low natural VOC emissions.Grown / produced in New Zealand. S. Island supplies from Nelson. N. Islandsupplied from Kawerau. Trucked to merchants throughout the North and SouthIslands.FSC CoC certifiedCarter Holt Harvey Ltd. www.chh.com100% <strong>of</strong> the heat used in drying timber at the Nelson plant is derived from woodwaste. The heat used for drying at the Kawerau plant comes from the Hog Fuel(Wood Waste) and from burning the Black Liquor produced from dissolving thewood fibre in NAOH.Untreated.Note that there is not always sufficient supply <strong>of</strong> the widely used sizes <strong>of</strong> MSG-8and MSG-10 timber. For a sizable project sufficient stocks should be secured earlyin the construction planning process.Material 3:Species:VOC Emissions:Transport:Certification:Available:Processing Energy:Treatment required:Finish / Maintenance:Laminated Veneer Lumber (LVL).Pinus Radiata (plantation grown).Nelson Pine LVL is manufactured using phenol formaldehyde. It complies withAS/NZS 4357.0:2005 - E0 emission standard.Grown / processed in New Zealand. Trucked to merchants throughout the Northand South islands.Not certified. (FSC certified LVL available from CHH Ltd.)Nelson Pine Ltd. www.nelsonpine.co.nzProcessing plant powered with waste wood fuel.Untreated.Assuming not for stair treads as stair treads need to meet certain slip resistanceratings – rather for the handrails, balustrades and other areas <strong>of</strong> high wear.Life Expectancy as per Resene “Expected Life System Chart”- SC1 New and SC2 Repaint cosmetic only – 10yrs,- SC3 – repaint with wear and tear – 5 yrsPaint finishDescription:Interior timber joinery, waterborne gloss1 coat:NRS: Resene Quick Dry , waterborne primer / u/coat2 coat:Resene Enamacryl waterborne gloss enamel3 coat:Resene Enamacryl waterborne gloss enamelSystem meets Green Star IEQ 13 requirements as at 15/05/08Page 9 <strong>of</strong> 21 May 2008
Timber Plus ProjectStain and Clear FinishDescription:Interior timber joinery, waterborne, stained finish1 coat:Resene Colorwood, waterborne wood stain2 coat:Resene Aquaclear, waterborne urethane3 coat:Resene Aquaclear, waterborne urethane4 coat:Resene Aquaclear, waterborne urethaneResene Aquaclear available in Gloss, Semi Gloss and Satin finishesSystem meets <strong>Environmental</strong> Choice but not Green Star IEQ 13 requirements as at 15/05/08 –as there are no allowances for stains or clear finishes currently.Clear Finish onlyDescription:Interior timber joinery, waterborne, stained finish1 coat:Resene Aquaclear, waterborne urethane2 coat:Resene Aquaclear, waterborne urethane3 coat:Resene Aquaclear, waterborne urethane4 coat:Resene Aquaclear, waterborne urethaneResene Aquaclear available in Gloss, Semi Gloss and Satin finishesSystem meets <strong>Environmental</strong> Choice but not Green Star IEQ 13 requirements as at 15/05/08 – as thereare no allowances for stains or clear finishes currently.PLYWOOD FLOORSMaterial:Species:VOC Emissions:Transport:Certification:Available:Processing Energy:Treatment required:Finish / Maintenance:21mm thick structural plywood.Pinus Radiata (plantation grown).Produced to E0 standard.Grown / produced in New Zealand (Tokoroa and Mt Maunganui). Trucked tomerchants throughout the North and South Islands.FSC CoC certifiedCarter Holt Harvey Ltd. www.chh.comAll veneer drying is from gas and all steam for log conditioning is supplied Hog Fuel(Wood Waste) and burning <strong>of</strong> the black liquor from the pulping process.Untreated.Assuming not for stair treads as stair treads need to meet certain slip resistanceratings – rather for the handrails and other areas <strong>of</strong> high wear.: Recommendation is for a “sealer coat” only: If substrate will be exposed to direct foot traffic another 3 coats <strong>of</strong> Aquaclear willbe needed and life expectancy would reduce accordingly. Expect to recoat withanother 1-2 coats every 2-3 years minimum.Clear finish sealer coat onlyLife Expectancy as per Resene “Expected Life System Chart” - for sealer coat only- SC1 New and SC2 Repaint cosmetic only – 10yrs- SC3 – repaint with wear and tear – 5 yrsDescription:Interior timber, stains and clear finishes, waterborne clear1 coat:Resene Aquaclear, waterborne clear2 coat:Resene Aquaclear, waterborne clearResene Aquaclear available in Gloss, Semi Gloss and Satin finishes –System meets <strong>Environmental</strong> Choice but not Green Star IEQ 13 requirements as at 15/05/08 – asthere are no allowances for stains or clear finishes currently.Page 10 <strong>of</strong> 21 May 2008
Timber Plus ProjectCOLUMNS, BEAMS, JOISTS, SHEAR WALLS AND PORTALSMaterial:Species:VOC Emissions:Transport:Certification:Available:Processing Energy:Treatment required:Finish / Maintenance:Laminated Veneer Lumber (LVL).Pinus Radiata (plantation grown).Nelson Pine LVL is manufactured using phenol formaldehyde. It complies withAS/NZS 4357.0:2005 - E0 emission standard.Grown / processed in New Zealand. Trucked to merchants throughout the Northand South islands.Not certified. (FSC certified LVL available from CHH Ltd.)Nelson Pine Ltd. www.nelsonpine.co.nzProcessing plant powered with waste wood fuel.Untreated.Should not be used externally or in areas which are frequently damp.Life Expectancy as per Resene “Expected Life System Chart” - for sealer coat only- SC1 New and SC2 Repaint cosmetic only – 10yrs- SC3 – repaint with wear and tear – 5 yrsStain and clear finishClear finish onlyDescription:Interior timber, stains and clear finishes, waterborne stain1 coat:Resene Colorwood, waterborne wood stain2 coat:Resene Aquaclear, waterborne urethane3 coat:Resene Aquaclear, waterborne urethane4 coat:Resene Aquaclear, waterborne urethaneResene Aquaclear available in Gloss, Semi Gloss and Satin finishes –System meets <strong>Environmental</strong> Choice but not Green Star IEQ 13 requirements as at 15/05/08 –as there are no allowances for stains or clear finishes currently.Description:1 st coat:2 nd coat:3 rd coat:Interior timber, stains and clear finishes, waterborne clearResene Aquaclear, waterborne urethaneResene Aquaclear, waterborne urethaneResene Aquaclear, waterborne urethaneResene Aquaclear available in Gloss, Semi Gloss and Satin finishes.System meets <strong>Environmental</strong> Choice but not Green Star IEQ 13 requirements as at 15/05/08 –as there are no allowances for stains or clear finishes currently.INTERIOR WALL FRAMINGMaterial:Species:VOC Emissions:Transport:Certification:Available:Processing Energy:Treatment required:Laserframe MSG8.Pinus Radiata (plantation grown).Untreated wood has extremely low natural VOC emissions. If a LOSP basedpreservative treatment is used there is some VOC emission soon after treatment.Grown / produced in New Zealand. S. Island supplies from Nelson. N. Islandsupplied from Kawerau. Trucked to merchants throughout the N. and S. Islands.FSC CoC certifiedCarter Holt Harvey Ltd. www.chh.com100% <strong>of</strong> the heat used in drying timber at the Nelson plant is derived from woodwaste. The heat used for drying at the Kawerau plant comes from the Hog Fuel(Wood Waste) and from burning the Black Liquor produced from dissolving thewood fibre in NAOH.High risk areas – I.e. bathrooms, entrance vestibule etc. – H3.1 ACQ.Low risk areas – Untreated.Bottom Plate where located above concrete screed – H1.2 Boron.Page 11 <strong>of</strong> 21 May 2008
Timber Plus ProjectINTERIOR WALL CLADDING, BATHROOMSWe note that “15mm regular MDF board” has been specified in bathroom areas. This is not at allrecommended due to the low moisture resistance <strong>of</strong> MDF. Treated ply or paint finished, finger jointed timberboards would be an acceptable alternative in this location used in conjunction with an efficient ventilationsystem. In wet areas (showers / splashbacks etc.) ceramic tiles on a fibre cement board substrate would berecommended.Material:Species:VOC Emissions:Transport:Certification:Available:Treatment required:Finish / Maintenance:10mm thick finger jointed solid timber boards or Ply.Pinus Radiata (plantation grown.Untreated wood has extremely low natural VOC emissions.Ply to be E0 standard.Grown / produced in New ZealandFSC CoC certifiedCarter Holt Harvey Ltd. www.chh.comNone.Ensure timber is not in direct contact with waterLife Expectancy as per Resene “Expected Life System Chart”- SC1 New and SC2 Repaint cosmetic only – 10yrs- SC3 – repaint with wear and tear – 5 yrsPaint finishDescription:Interior timber joinery - bathrooms, waterborne gloss1 coat:NRS: Resene Quick Dry, waterborne primer / u/coat2 coat:Resene Enamacryl, waterborne gloss enamel3 coat:Resene Enamacryl, waterborne gloss enamelSystem meets Green Star IEQ 13 requirements as at 15/05/08INTERNAL SOLID WALLSMaterial:105mm thick Leno Tec solid timber panels (Spruce).Species:Picea Abies.VOC Emissions: Emission class E1 using melamine resin. – Would not meet expected minimumrequirement <strong>of</strong> Green Star Office rating tool.Transport:Pre-fabricated in Europe and then shipped 20,000Kms to NZ. Not practical due tolarge panel sizes inconsistent with containerised transport.Certification:FSC certified timber unavailable in NZ. PEFC certified system acceptable as pro<strong>of</strong><strong>of</strong> sustainability but inadmissible for Green Star Office credits.Available:Scandinavian system sourced in Finland. Would require joint venture set-up withNZ company utilising local plantation timbers due to large panel sizes and hightransport costs. (N.B. without the use <strong>of</strong> large panel sizes the benefits <strong>of</strong> thesystem (quick and easy erection) are dramatically reduced).Processing Energy: Unknown.Treatment required: None.Surface Finishing: Low VOC Paint finish applied prior to delivery.Finish / Maintenance: Expected to exceed 60 year building life when used in a dry, ventilated indoorlocation. Life expectancy <strong>of</strong> coatings as per Resene “Expected Life System Chart”- SC1 New and SC2 Repaint cosmetic only – 10yrs- SC3 – repaint with wear and tear – 5 yrsPaint finishDescription:Interior timber surface, waterborne low sheen1 coat:Resene Quick Dry, waterborne primer /undercoat2 coat:Resene Zylone Sheen VOC FREE, waterborne low sheen3 coat:Resene Zylone Sheen VOC FREE, waterborne low sheenSystem meets Green Star IEQ 13 requirements as at 15/05/08Page 12 <strong>of</strong> 21 May 2008
Timber Plus Project15 MDFMaterial:Species:VOC Emissions:Transport:Available:Processing Energy:Treatment required:Surface Finishing:Finish / Maintenance:Medium density fibreboard (MDF).Pinus Radiata (plantation grown).GoldenEdge MDF is manufactured using phenol formaldehyde. It is certified ascomplying with the Japanese Industrial Standard JIS A5905 2003 for an F****grade MDF (also known as Super EO).Grown / processed in New Zealand.Nelson Pine Ltd. www.nelsonpine.co.nzProcessing plant powered with waste wood fuel.None.Low VOC Paint.Should not be used externally or in areas which are frequently damp. Lifeexpectancy <strong>of</strong> coatings as per Resene “Expected Life System Chart”- SC1 New and SC2 Repaint cosmetic only – 10yrs- SC3 – repaint with wear and tear – 5 yrsPaint finishDescription:Interior timber surface, waterborne low sheen1 coat:Resene Quick Dry, waterborne primer /undercoat2 coat:Resene Zylone Sheen VOC FREE, waterborne low sheen3 coat:Resene Zylone Sheen VOC FREE, waterborne low sheenSystem meets Green Star IEQ 13 requirements as at 15/05/0817 MDF CEILING TILESMaterial:Medium density fibreboard (MDF).Species:Pinus Radiata (plantation grown).VOC Emissions: GoldenEdge MDF is manufactured using phenol formaldehyde. It is certified ascomplying with the Japanese Industrial Standard JIS A5905 2003 for an F****grade MDF (also known as Super EO).Transport:Grown / processed in New Zealand.Available:Nelson Pine Ltd. www.nelsonpine.co.nzProcessing Energy: Processing plant powered with waste wood fuel.Treatment required: None.Surface Finishing: Low VOC Paint.Finish / Maintenance: Should not be used externally or in areas which are frequently damp. LifeExpectancy as per Resene “Expected Life System Chart”- SC1 New and SC2 Repaint cosmetic only – 10yrs- SC3 – repaint with wear and tear – 5 yrsPaint finishDescription:Interior timber surface, waterborne flat1 coat:Resene Quick Dry, waterborne primer /undercoat2 coat:Resene Ceiling Paint, waterborne flat3 coat:Resene Ceiling Paint, waterborne flatSystem meets Green Star IEQ 13 requirements as at 15/05/08Page 13 <strong>of</strong> 21 May 2008
Timber Plus ProjectWINDOW REVEALSMaterial:Species:VOC Emissions:Transport:Certification:Available:Processing Energy:Treatment required:Surface Finishing:Finish / Maintenance:Paint finishWestern Red Cedar.Thuja PlicataN/A External Use Only.Grown / processed in W.Canada. As no chemical treatment is required for thistimber species it is claimed that there is a significant reduction in embodied energywhich <strong>of</strong>fsets the additional transport energy required to cross the Pacific.FSC certified timber available in NZ.Herman Pacific Ltd. www.hermpac.co.nzUnknown.None.Migrating oil stain (penetrating stain).With correct maintenance <strong>of</strong> surface finishes cedar is expected to last well inexcess <strong>of</strong> the 60 year building lifespan. Note: Paint finish is preferred for timberjoinery or at least a stain under the clear finish. Clear finishes alone will still allowdegradation <strong>of</strong> the timber under the clear film as UV light will still penetrate theclear. Pigments in stain and paint help prevent penetration <strong>of</strong> the UV light whichbreaks down the timber fibres.Life expectancy as per Resene “Expected Life System Chart” - paint system only- SC1 New and SC2 Repaint cosmetic only – 10yrs- SC3 – repaint with wear and tear – 5 yrsDescription:Interior timber joinery, waterborne gloss1 coat:NRS: Resene Quick Dry, waterborne primer / undercoat2 coat:Resene Enamacryl waterborne gloss enamel3 coat:Resene Enamacryl waterborne gloss enamelSystem meets Green Star IEQ13 requirements as at 15/05/08Stain and Clear FinishLife expectancy stain and clear – reapplication <strong>of</strong> clear finish to the sill areas <strong>of</strong>windows will need to be approximately every 3-4 years. Other areas, approximately6-8 years depending on sun exposure.Description:Interior timber joinery, waterborne, stained finish1 coat:Resene Colorwood D50a, waterborne wood stain2 coat:Resene Aquaclear D59, waterborne urethane3 coat:Resene Aquaclear D59, waterborne urethane4 coat:Resene Aquaclear D59, waterborne urethaneResene Aquaclear available in Gloss, Semi Gloss and Satin finishes –System meets <strong>Environmental</strong> Choice but not Green Star IEQ 13 requirements as at 15/05/08 –as there are no allowances for stains or clear finishes currently.Page 14 <strong>of</strong> 21 May 2008
Timber Plus ProjectROOF FRAMINGMaterial:Species:VOC Emissions:Transport:Certification:Available:Processing Energy:Treatment required:Finish / Maintenance:Laserframe.Pinus Radiata (plantation grown).No solvents involved in preservative treatment.Grown / produced in New Zealand. S. Island supplies from Nelson. N. Islandsupplied from Kawerau. Trucked to merchants throughout the North and SouthIslands.FSC CoC certifiedCarter Holt Harvey Ltd. www.chh.com100% <strong>of</strong> the heat used in drying timber at the Nelson plant is derived from woodwaste. The heat used for drying at the Kawerau plant comes from the Hog Fuel(Wood Waste) and from burning the Black Liquor produced from dissolving thewood fibre in NAOH.H3.1 ACQ.Periodic inspections to ensure integrity <strong>of</strong> ro<strong>of</strong> coverings.PLYWOOD ROOFSMaterial:Species:VOC Emissions:Transport:Certification:Available:Processing Energy:Treatment required:Finish / Maintenance:Construction Plywood.Pinus Radiata (plantation grown).Produced to E0 standard.Grown / produced in New Zealand (Tokoroa and Mt Maunganui). Trucked tomerchants throughout the North and South Islands.FSC CoC certifiedCarter Holt Harvey Ltd. www.chh.comAll veneer drying is from gas and all steam for log conditioning is supplied Hog Fuel(Wood Waste) and burning <strong>of</strong> the black liquor from the pulping process.H3.1 rated ACQ.Periodic inspections to ensure integrity <strong>of</strong> ro<strong>of</strong> coverings.Note that all membrane ro<strong>of</strong>s must be ventilated. There is currently no NZstandard for this but a code <strong>of</strong> practice is currently being developed. When this isavailable it should be adhered to for the timber plus building.PARAPET FRAMINGMaterial:Species:VOC Emissions:Transport:Certification:Available:Processing Energy:Treatment required:Laserframe.Pinus Radiata (plantation grown).No solvents involved in preservative treatment.Grown / produced in New Zealand. S. Island supplies from Nelson. N. Islandsupplied from Kawerau. Trucked to merchants throughout the North and SouthIslands.FSC CoC certifiedCarter Holt Harvey Ltd. www.chh.com100% <strong>of</strong> the heat used in drying timber at the Nelson plant is derived from woodwaste. The heat used for drying at the Kawerau plant comes from the Hog Fuel(Wood Waste) and from burning the Black Liquor produced from dissolving thewood fibre in NAOH.H1.2 Boron.Page 15 <strong>of</strong> 21 May 2008
Timber Plus ProjectSOFFIT FRAMINGMaterial:Species:VOC Emissions:Transport:Certification:Available:Processing Energy:Treatment required:Laserframe.Pinus Radiata (plantation grown).No solvents involved in preservative treatment.Grown / produced in New Zealand. S. Island supplies from Nelson. N. Islandsupplied from Kawerau. Trucked to merchants throughout the North and SouthIslands.FSC CoC certifiedCarter Holt Harvey Ltd. www.chh.com100% <strong>of</strong> the heat used in drying timber at the Nelson plant is derived from woodwaste. The heat used for drying at the Kawerau plant comes from the Hog Fuel(Wood Waste) and from burning the Black Liquor produced from dissolving thewood fibre in NAOH.H1.2 Boron.EXTERIOR WALL FRAMINGMaterial:Species:VOC Emissions:Transport:Certification:Available:Processing Energy:Treatment required:Notes:Laserframe MSG8.Pinus Radiata (plantation grown).No solvents involved in preservative treatment.Grown / produced in New Zealand. S. Island supplies from Nelson. N. Islandsupplied from Kawerau. Trucked to merchants throughout the North and SouthIslands.FSC CoC certifiedCarter Holt Harvey Ltd. www.chh.com100% <strong>of</strong> the heat used in drying timber at the Nelson plant is derived from woodwaste. The heat used for drying at the Kawerau plant comes from the Hog Fuel(Wood Waste) and from burning the Black Liquor produced from dissolving thewood fibre in NAOH.H1.2 Boron.Note that there is not always sufficient supply <strong>of</strong> the widely used sizes <strong>of</strong> MSG-8and MSG-10 timber. For a sizable project sufficient stocks should be secured earlyin the construction planning process.EXTERIOR CAVITY BATTENSMaterial:Species:VOC Emissions:Transport:Certification:Available:Processing Energy:Treatment required:45 x 25mm Timber Battens.Pinus Radiata (plantation grown).No solvents involved in preservative treatment.Grown / produced in New Zealand. S. Island supplies from Nelson. N. Islandsupplied from Kawerau. Trucked to merchants throughout the North and SouthIslands.FSC certifiedCarter Holt Harvey Ltd. www.chh.com100% <strong>of</strong> the heat used in drying timber at the Nelson plant is derived from woodwaste. The heat used for drying at the Kawerau plant comes from the Hog Fuel(Wood Waste) and from burning the Black Liquor produced from dissolving thewood fibre in NAOH.H3.1 ACQ.Page 16 <strong>of</strong> 21 May 2008
Timber Plus ProjectEXTERIOR WALL CLADDINGMaterial:Species:Available:Processing Energy:Treatment required:Surface Finishing:Note:TDA’s Flatline Board Sytem.Pinus RadiataCurrently this is a conceptual timber cladding system developed by Australia’sTimber Development Agency. It is not yet in production but is an “open-source”system which can be utilised by any cladding manufacturer. Theoretically thereforeit could be manufactured in New Zealand utilising locally sourced, FSC certifiedtimber.N/A.H3.1 ACQ.Factory applied stain primer. Top coat on-site with either natural or tinted stain ORopaque paint finish.Metal cavity batten system and metal vertical board jointers recommended by TDAresearch body. This system is untested in multi-storey applications and wouldneed to be subjected to rigorous checks before it could achieve building codeapproval.Finish / Maintenance Note 1: this system would have to be assessed along with its special sealer coat –as system is new to Resene. Recommendation is written as for standard stain finishonly NOT including any proprietary finish.Note 2: Stain should be applied to ALL faces <strong>of</strong> the timber prior to installation – thisincludes the back face.Note 3: Check manufacturer’s instructions for colour restrictions on substrates. Darkcolours, in both paint and stain finishes, used externally may void warranties.Note 4: Resene “Cool Colours” technology is recommended where dark coloursare specified externally.Stain FinishLife Expectancy as per Resene “Expected Life System Chart” does not includeexterior stains- Stains need reapplication every 3-5 years to maintain their propertiesincluding, colour durablity, water-repellency and mould inhibition.- Note there will be areas to any stained building where stain fades fasterthan others.Description:1 st coat:2 nd coat:3 rd coat:Exterior timbers, stains and clear finishes, waterborne stainResene Waterborne Woodsman, waterborne stainResene Waterborne Woodsman, waterborne stainApply third coat if possible after 1 st summerSystem meets <strong>Environmental</strong> Choice but not Green Star MAT 10 requirements as at 15/05/08 –as there are no allowances for stains or clear finishes currently.Paint finishLife Expectancy as per Resene “Expected Life System Chart”- SC1 New and SC2 Repaint cosmetic only – 10yrs- SC3 – repaint with wear and tear – 6 yrsDescription:Exterior timbers, waterborne satinSurface Prep:If needed Resene Timberlock, solvent-bornepreserver/conditioner1 coat:Resene Quick Dry, waterborne primer / undercoat2 coat:Resene Lumbersider, waterborne satin3 coat:Resene Lumbersider, waterborne satin*Alternatively for Semi Gloss finish use Sonyx 101, D30 or gloss finish use Hi Glo, D31System meets <strong>Environmental</strong> Choice & Green Star MAT 10 paints requirements as at 15/05/08.Page 17 <strong>of</strong> 21 May 2008
Timber Plus ProjectEXTERIOR WALL CLADDING (CONTINUED).Material:Species:VOC Emissions:Transport:Certification:Available:Processing Energy:Treatment required:Surface Finishing:Finish / Maintenance:Shadowclad.Pinus RadiataN/A. Exterior cladding application.Grown / produced in New Zealand (Tokoroa and Mt Maunganui). Trucked tomerchants throughout the North and South Islands.FSC CoC certifiedCarter Holt Harvey Ltd. www.chh.comAll veneer drying is from gas and all steam for log conditioning is supplied Hog Fuel(Wood Waste) and burning <strong>of</strong> the black liquor from the pulping process.Pre-treated with H3.1 LOSP Azole.Painting with light colours will reduce the incidence <strong>of</strong> face “checking” (Facechecking is caused by the normal swelling and shrinkage <strong>of</strong> wood, particularly onNorthern facing elevations).Note1 : Shadowclad ply has a minimum LRV or Light Reflectance Value <strong>of</strong> 40% asset by the manufacturer. This restricts the use <strong>of</strong> dark colours or warranty will bevoid.Note 2: Stain should be applied to ALL faces <strong>of</strong> the timber prior to installation – thisincludes the back face.Note 3: Resene “Cool Colours” technology is recommended where dark coloursare specified externally.Stain FinishLife Expectancy as per Resene “Expected Life System Chart”- Stains need reapplication every 3-5 years to maintain their propertiesincluding, colour durablity, water-repellency and mould inhibition.- Note there will be areas to any stained building where stain fades fasterthan others.Description:1 st coat:2 nd coat:3 rd coat:Exterior timbers, stains and clear finishes, waterborne stainResene Waterborne Woodsman, waterborne stainResene Waterborne Woodsman, waterborne stainApply third coat if possible after 1 st summerSystem meets <strong>Environmental</strong> Choice but not Green Star MAT 10 requirements as at 15/05/08 –as there are no allowances for stains or clear finishes currently.Paint finishLife Expectancy as per Resene “Expected Life System Chart”- SC1 New and SC2 Repaint cosmetic only – 10yrs- SC3 – repaint with wear and tear – 6 yrsDescription:Exterior timbers, waterborne satinSurface Prep:If needed Resene Timberlock, solvent-bornepreserver/conditioner1 coat:NW: Resene Quick Dry, waterborne primer / undercoat2 coat:Resene Lumbersider, waterborne satin3 coat:Resene Lumbersider, waterborne satin*Alternatively for Semi Gloss finish use Sonyx 101, D30 or gloss finish use Hi Glo, D31System meets <strong>Environmental</strong> Choice and Green Star MAT 10 Paints requirements as at15/05/08.Page 18 <strong>of</strong> 21 May 2008
Timber Plus ProjectLOUVRESMaterial:Species:VOC Emissions:Transport:Certification:Available:Processing Energy:Treatment required:Surface Finishing:Finish / Maintenance:Western Red Cedar.Thuja PlicataN/A External Use Only.Grown / processed in W.Canada.FSC certified timber available in NZ.Herman Pacific Ltd. www.hermpac.co.nzUnknown.None.Migrating oil stain (penetrating stain).With correct maintenance <strong>of</strong> surface finishes cedar is expected to last well inexcess <strong>of</strong> the 60 year building lifespan. Check manufacturer’s instructions for colourrestrictions on substrates. Dark colours, in both paint and stain finishes, usedexternally may void warranties.Note 2: Stain should be applied to ALL faces <strong>of</strong> the timber prior to installation – thisincludes the back face.Note 3: Resene “Cool Colours” technology is recommended where dark coloursare specified externally.Stain FinishLife Expectancy as per Resene “Expected Life System Chart” does not includeexterior stains- Stains need reapplication every 3-5 years to maintain their properties including,colour durablity, water-repellency and mould inhibition.- Note there will be areas to any stained building where stain fades faster thanothers.Description:1 st coat:2 nd coat:3 rd coat:Exterior timbers, stains and clear finishes, waterborne stainResene Waterborne Woodsman, waterborne stainResene Waterborne Woodsman, waterborne stainApply third coat if possible after 1 st summerSystem meets <strong>Environmental</strong> Choice but not Green Star MAT 10 requirements as at 15/05/08 –as there are no allowances for stains or clear finishes currently.Page 19 <strong>of</strong> 21 May 2008
Timber Plus ProjectAdditional Opportunities.There are a number <strong>of</strong> additional opportunities to maximise the use <strong>of</strong> timber and timber derived productswithin the timber plus building. We have identified the following as <strong>of</strong>fering potential:-CEILINGS:Atkar Au.diPanel round hole perforated MDF or ply ceiling panels available from Asona Ltd. with prefinishedtimber grain and decorative surfaces, IAB acoustic tissue backer and edge pr<strong>of</strong>iled. Manufactured inAustralia.INTERIOR WALLS:Woodwool acoustic insulation products to reduce reverberation times within room.INSULATION:Insulation created from cellulose fibres could be used to insulate ceiling and external wall cavities with integralfire retardants as necessary.FLOORS:Linoleum sheet flooring could be used to bathroom and kitchenette areas. Linoleum is manufactured fromrenewable resources including wood flour, cork flour, jute, linseed oil and natural resin. The expected life spanis 30 years. Available from Tarkett flooring Ltd. Manufactured in Italy.Timber overlay flooring could be used throughout <strong>of</strong>fice and reception areas. FSC certified parquet flooring isavailable from Ekowood Ltd. The expected lifespan is 60years+ when well maintained (it can be re-sandedand re-finished up to three times) and it is warranted for 25 years. Manufactured in Malaysia from NewZealand Pinus Radiata with a sustainably sourced tropical timber wearing layer.Wood fibre acoustic Insulation panels could be used beneath the overlay flooring to reduce inter-floor soundtransmission and reduce reverberation within <strong>of</strong>fice areas. Sonopan insulation panels are available fromLouisville Speciality Products Ltd. Manufactured in Canada.EXTERNAL:There is an opportunity to construct a timber deck on bearers leading up to the main entrance in place <strong>of</strong> thesolid timber on slab that is currently shown. This may not increase the timber component but would reduce theconcrete used in the building. Options would be:-• Pinus Radiata decking treated to H3.2 with a copper-based chrome and arsenic-free (CAF) treatmentsuch as ACQ (Alkaline Copper Quaternary). OR:• NZ red beech (Noth<strong>of</strong>agus Fusca) which does not need additional chemical treatment in deckingsituations. H3.2 ACQ treatment to posts in contact / below ground. Red Beech could also be usedas the flooring to the entrance foyer to provide a seamless entrance showcasing one <strong>of</strong> NewZealand’s most beautiful timber species.Page 20 <strong>of</strong> 21 May 2008
Timber Plus ProjectReferences.1. NZGBC Green Star NZ – Office Design V1 rating tool.2. BRANZ Bulletin 445 Feb 2004 Timber Treatment3. New Zealand Building Code part B (Durability) and E2 (External Moisture).Page 21 <strong>of</strong> 21 May 2008
Appendix AResene Expected Paint Systems Life Chart
Resene expected paint system lifeThe expected paint system life chart below indicates the expected life <strong>of</strong> a well maintained pigmentedwaterborne paint system applied to a properly prepared surface to the specifications <strong>of</strong> Resene beforerecoating is required. Well maintained means regular washing <strong>of</strong> exterior surfaces and repairing anyobvious damage. See the Resene Caring for your paint finish brochure for recommended cleaninginstructions.For example:Painting an EXTERIOR building. The concrete WALLS are to be painted and the surface condition isdescribed as ‘IDEAL’ (SC1), giving the indication that 12 years could be expected provided regularwashing and repairs are carried out during this time. After this the surface will require painting. Thebox at the bottom <strong>of</strong> this page gauges the expected surface condition at the end <strong>of</strong> the stated lifetime.The system for example should have received very little change (0) in surface cracking but it wouldbe expected to have suffered colour change (3).Expected paint system lifeExteriorInteriorCementitiousMetalCorrosion less than2% <strong>of</strong> surfaceTimberPaperfaced andcloth plasterSolidplasterTimberSC1 12 10 10 SC1 10 10 10SC2 12 10 10 SC2 10 10 10SC3 10 7 6 SC3 6 6 5SC4 8 5 3SC4 - - -Exterior expected life figures are for vertical exposure. Surfaces less than 60˚ to the horizontal will have a 50% reduced life expectancycompared to the stated life expectancies above. Interior expected life figures refer only to durability characteristics <strong>of</strong> chipping, cracking,flaking, peeling and general film integrity. Colourfastness is excluded. Due to the vast range <strong>of</strong> staining and the varying effects <strong>of</strong> this onthe substrate and finish it is not possible to include these factors in a general guideline.Extreme marine environments, adhesion failure <strong>of</strong> previous coatings, substrate damage or use <strong>of</strong> solventborne products will result inreduced life expectancies. Refer Resene for assistance.Surface conditions are defined as follows:1. IDEAL New surface in excellent condition. No defects. Surface has not been exposed to weather.2. GOOD Coated surfaces requiring repaint for cosmetic reasons only. Apparently sound coating protecting substrate, no paintbreakdown.3. FAIR Some substrate exposed for undetermined time due to incidence <strong>of</strong> paint breakdown - requires preparatory work andspot priming.4. POOR Substantial areas exposed to weathering for substantial time or never painted.Test methodDescriptionExteriorInteriorAS1580 481.1.11AS1580 481.1.12AS1580 481.1.5AS1580 481.1.8AS1580 481.1.10AS1580 481.1.2ChalkingColour c hangeGloss c hangeCrackingFlakingDiscoloration233.5004010001Key: 0 = No change,5 = Severe changeIf in doubt about any aspect <strong>of</strong> your specification or project please contact Resene.
- 152 -Appendix G: Green Star Assessment <strong>of</strong> <strong>Different</strong> Building Options – Peer Review
New Zealand Forest ResearchInstitute Limited trading asScionGreenStar Assessment <strong>of</strong> <strong>Different</strong>Building Options - Peer reviewJuly 2008
New Zealand Forest Research Institute Limited trading as ScionGreenStar Assessment - Peer reviewThis document has been prepared for the benefit <strong>of</strong> New Zealand Forest Research Institute Limited trading asScion . No liability is accepted by this company or any employee or sub-consultant <strong>of</strong> this company with respectto its use by any other person.This disclaimer shall apply notwithstanding that the report may be made available to other persons for anapplication for permission or approval to fulfil a legal requirement.MWH New Zealand LimitedTower 2, Deans Park7 Deans AvenueAddingtonP O Box 13-249Christchurch 8141New ZealandPhone : 64-3-366 7449Fax : 64-3-366 7780Quality Assurance StatementProject Manager:Gabrielle TorkingtonPrepared by:Gabrielle TorkingtonReviewed by:Jonathan FosterApproved for issue by:Tom Burkitt……………………………………………………Revision ScheduleRev No Date Description Prepared By Reviewed By Approved ByStatus Draft 16.07.2008Project NumberOur Ref − MWH Scion GreenStar Assessment PeerReviewFINAL.doc
New Zealand Forest Research Institute Limited trading as ScionGreenStar Assessment <strong>of</strong> <strong>Different</strong> Building Options - Peer reviewContentsExecutive Summary .............................................................................................................................................. 41 Introduction ................................................................................................................................................. 61.1 Background to the Project ........................................................................................................... 61.1.1 Introduction to the GreenStar NZ Building Performance Rating Framework................ 91.1.2 Principles <strong>of</strong> Life Cycle Assessment1.1.3 MWH Commission1.2 Peer Review <strong>of</strong> LCA and GreenStar NZ Office Design V1 Comparison .................................... 131.3 Discussion and Conclusions ..................................................................................................... 141.4 Further Work.............................................................................................................................. 181.5 References ................................................................................................................................ 19List <strong>of</strong> TablesTable 1-1-1 Weightings in GreenStar New Zealand Rating Tool........................................................................10Table 1-2-1 Results <strong>of</strong> LCA Vs GreenStar NZ from base scenario comparison.................................................13Table 1-2-2 Results <strong>of</strong> LCA Vs GreenStar NZ from re-utilisation scenario comparison .....................................14List <strong>of</strong> FiguresFigure 1-1-1 GreenStar Building Rating Tool Generic Framework:.....................................................................10Figure 1-1-2 Life Cycle Assessment Framework:................................................................................................11Status Draft 16.07.2008Project NumberOur Ref − MWH Scion GreenStar Assessment PeerReviewFINAL.doc
Executive SummaryA common building design has been used as a basis for comparison between four types <strong>of</strong> building constructionmaterials. The four different types <strong>of</strong> materials under comparison included; concrete, steel, timber and timberplus (where the use <strong>of</strong> timber had been maximised). The building was based upon an existing building that hadrecently been constructed from concrete.A LCA (Life Cycle Assessment) assessment has been undertaken <strong>of</strong> the different construction materials, underthe single design regime using operational energy calculations and material lists developed by a quantitysurveyor. The operational energy and materials aspects <strong>of</strong> the LCA assessment have also been applied to thebuilding under the GreenStar Office Design V1 building performance rating tool. The approach <strong>of</strong> both tools isdifferent. Whereas the LCA is based on quantified data <strong>of</strong> all materials and energy used over the life time <strong>of</strong> abuilding, Green Star is based on credits awarded for a number <strong>of</strong> specified criteria.Due to the differences in the scope <strong>of</strong> both tools, the comparison was restricted to those aspects which aretaken into account in both tools, i.e. material use and energy use. Two scenarios were assessed using theGreen Star NZ Office Design V1 rating tool. A base scenario which took into account the dominant materials,i.e. timber, steel and concrete only and a recycling scenario which is similar to the reutilisation scenario in theLCA study.Under the base scenario the results for the GreenStar NZ assessments rated the use <strong>of</strong> concrete mostfavourably in construction but did not separate steel, timber and timber+. Whereas LCA demonstrated cleardifferences in the desirability <strong>of</strong> the different materials from an energy use and global warming potentialperspective with timber+ having the least sensitive environmental pr<strong>of</strong>ile.Under the re-utilisation scenario GreenStar NZ was unable to differentiate between concrete, timber andtimber+ and rated steel as the optimal building material. <strong>Using</strong> energy use and global warming potential dataLCA assessment <strong>of</strong> the same information showed timber+ as the least environmentally degrading.To achieve very similar operational energy pr<strong>of</strong>iles required different design for envelope walls construction,thermal mass, and heating and cooling equipment in each <strong>of</strong> the four buildings. This fundamental variation wasnot able to be reflected in the GreenStar NZ self-assessments due to the limited credits assessed and resultedin skewed reporting <strong>of</strong> the ratings achieved.The energy mix was important when considering GWP since two buildings having the same total energy mightuse different proportions <strong>of</strong> gas and electricity. Not all energy is equal; combustion emissions differ by energyform and the upstream, pre-combustion implications <strong>of</strong> producing and moving different energy forms can beeven more significant. The energy mix is <strong>of</strong> vital importance for the GreenStar NZ rating system and significantlydifferent mixes would have been awarded different credits under the criteria <strong>of</strong> the energy calculator. Theinformation provided for natural gas and electricity was slightly different for the four buildings but the tool wasnot able to discern the mire subtle differences under the limited credits assessed.The base building was not an <strong>of</strong>fice building, it was based upon the laboratory buildings for the BiologicalScience facilities at Canterbury University, therefore the use <strong>of</strong> the Office Design tool was <strong>of</strong> questionable value.However, in the absence <strong>of</strong> any other more appropriate tools (i.e. the GreenStar NZ Education tool currentlyunder development) the study carried out has highlighted some important principles for further investigation.Status Draft 16.07.2008Project NumberOur Ref − MWH Scion GreenStar Assessment PeerReviewFINAL.doc
There were relatively small differences between the results from base and re-utilisation scenarios. This was inpart due to the limited number <strong>of</strong> credits chosen for comparison. The assumptions <strong>of</strong> no differences in inherentbuilding characteristics for those credits not under scrutiny for each material assessed did not align with thebasic premise <strong>of</strong> the GreenStar NZ rating tool which caters for fundamental differences in buildings using<strong>of</strong>fsetting <strong>of</strong> credits in other categories to drive positive changes in behaviour.There are substantial rewards under the material category <strong>of</strong> the GreenStar NZ for recycled content <strong>of</strong> steel andconcrete and integrated fit out. These drivers do not account for the environmental benefits demonstrated byLCA that are not recycling driven. The presumption <strong>of</strong> GreenStar NZ and most green building rating systems isthat recycled materials will automatically result in reduced environmental burdens. This is not always the caseand a review <strong>of</strong> these aspects using LCA would be prudent where data and benchmarks are available.In the long run the integration <strong>of</strong> LCA tools into whole building assessment systems will yield significantbenefits, not only will it improve understanding and appropriate rewards for environmental performance, butonce established future LCA will be less complex and expensive. A paradigm shift is required away fromconventional wisdom and related procurement decisions toward minimisation <strong>of</strong> life cycle flows to and fromnature.Status Draft 16.07.2008Project NumberOur Ref − MWH Scion GreenStar Assessment PeerReviewFINAL.doc
1 IntroductionA common building design has been used as a basis for comparison between four types <strong>of</strong> buildingconstruction materials. The four different types <strong>of</strong> materials under comparison included; concrete,steel, timber and timber plus (where the use <strong>of</strong> timber had been maximised). The building wasbased upon an existing building that had recently been constructed from concrete.1.1 Background to the ProjectA LCA (Life Cycle Assessment) assessment was been undertaken <strong>of</strong> the different constructionmaterials, under a single design regime using operational energy calculations and material listsdeveloped by a quantity surveyor. The operational energy and materials aspects <strong>of</strong> the LCAassessment have also been applied to the GreenStar NZ Office Design V1 building rating tool.The scope <strong>of</strong> both tools was different, hence the comparison was restricted to those aspects whichwere taken into account in both tools, i.e. material use and energy use. All features <strong>of</strong> the buildingsthat were not strictly material or energy use related were assumed to be identical for the differentbuilding designs.Two scenarios were assessed using the Green Star NZ Office Design V1 rating tool. A basescenario accounted for the dominant materials, i.e. timber, steel and concrete only and a recyclingscenario which is similar to the reutilisation scenario in the LCA study as follows;Green Star Base scenarioThe Green Star Base scenario took only the core materials <strong>of</strong> each building type into account asdescribed below;Timber buildingo N/A was ticked for recycled steel and concrete content respectively although,according to the Green Star methodology, N/A can only be ticked if the materialcost for steel or concrete respectively is less then 1 % <strong>of</strong> the project’s total contractvalue. Since the Green Star Assessment was undertaken in order to assess thedifferences between the building materials concrete recycling was assumed for theconcrete building, steel recycling for the steel building and for the timber buildingonly the thermal utilisation <strong>of</strong> timber. This approach was taken to demonstrate thespecifics <strong>of</strong> each material.o Sustainable timber (FSC certified) was chosen for the timber option <strong>of</strong> the building.o Operational energy figure specific to the timber building were included (73kWh/m2/yr metered electricity and 15 kWh/m2/yr metered natural gas).o All other assumptions were identical to the timber plus, steel and concretebuildings.Status Draft 16.07.2008Project NumberOur Ref − MWH Scion GreenStar Assessment PeerReviewFINAL.doc
Timber plus buildingo The amount <strong>of</strong> timber used cannot be accounted for in Green Star. The results forthe timber plus building were therefore identical with the timber building.o Operational energy figure specific to the timber plus building were included (70kWh/m2/yr metered electricity and 16 kWh/m2/yr metered natural gas).o All other assumptions were identical to the timber, steel and concrete buildings.Concrete buildingo Recycled concrete was assumed for the concrete building. The N/A option wasticked for steel and timber respectively.o Operational energy figure specific to the concrete building were included (68kWh/m2/yr metered electricity and 16 kWh/m2/yr metered natural gas).o All other assumptions were the same as for steel and timber.Steel buildingo Recycled steel was assumed for the steel building. The N/A option was ticked forconcrete and timber respectively.o Operational energy figure specific to the steel building were included (70kWh/m2/yr metered electricity and 16 kWh/m2/yr metered natural gas).o All other assumptions were the same as for concrete and timber buildings.Green Star Recycling ScenarioThe Green Star Recycling Scenario takes recycling in all buildings into account. In order to providea fair assessment the maximum points for each material were applied where the material had to betaken into account. This means for example that concrete in the timber building has been recycled,but on the other hand that the timber in the concrete building was FSC certified. However, if lessthen 1 % <strong>of</strong> the total project value is due to materials costs <strong>of</strong> steel or concrete respectively theoption ‘not applicable’ is available.The assumptions were as follows;Timber buildingo Concrete recycling was taken into account. The N/A option can only be ticked ifthe contribution <strong>of</strong> concrete is less then 1 % <strong>of</strong> the project value. For the timberbuilding, concrete is required in the foundations. Although detailed data on thecost contribution <strong>of</strong> specific materials was not available, the contribution in terms<strong>of</strong> mass was > 1%. The recycling option was therefore assumed.o The N/A option for steel can also be only ticked is less than 1% <strong>of</strong> the costcontribution. Because the cost contribution was not available, the decision wasbased on the material contribution which less then 1 % and N/A was ticked.o Operational energy figure specific to the timber building were included (73kWh/m2/yr metered electricity and 15 kWh/m2/yr metered natural gas).o All other assumptions were identical with the timber plus, steel and concretebuildings.Status Draft 16.07.2008Project NumberOur Ref − MWH Scion GreenStar Assessment PeerReviewFINAL.doc
Timber pluso The same assumptions as for the timber building were applied.o Operational energy figure specific to the timber plus building were included (70kWh/m2/yr metered electricity and 16 kWh/m2/yr metered natural gas).o All other assumptions were identical with the timber, steel and concrete buildings.Concrete buildingo The steel contribution was less then 0.5 % and consequently the N/A option waschosen.o The cut <strong>of</strong>f criteria for timber is 0.1 %. FSC certified was therefore taken intoaccount for the steel building.o Operational energy figure specific to the steel building were included (68kWh/m2/yr metered electricity and 16 kWh/m2/yr metered natural gas).o All other assumptions were identical with the timber, timber plus and steelbuildings.Steel buildingo The cut <strong>of</strong>f criteria for FSC certified timber is 0.1 %. FSC certified was thereforetaken into account for the steel building.o The concrete contribution was > 1 % and recycled concrete was chosen for thisscenario.o Operational energy figure specific to the steel building were included (70kWh/m2/yr metered electricity and 16 kWh/m2/yr metered natural gas).o All other assumptions were identical with the timber, timber plus and concretebuildings.<strong>Using</strong> the above assumptions the project objective was to determine whether the building material(whole category) and energy (limited credits only) related credits <strong>of</strong> the GreenStar Office Design V1building rating tool are comparable with the results <strong>of</strong> a LCA-based assessment. What follows is asynopsis <strong>of</strong> the two tools to assist with the interpretation <strong>of</strong> the results. The basis <strong>of</strong> the GreenStarNZ building performance rating tool is described initially, followed by a simple description <strong>of</strong> LCA.1.1.1 Introduction to the GreenStar NZ Building Performance Rating Tool FrameworkThe inaugural GreenStar NZ building performance rating tool (Office Design V1) was introduced inNew Zealand in 2007. Although there are some conceptual differences between LCA and GreenStar, both tools aim to identify life cycle impacts and have the potential to minimise theenvironmental impacts <strong>of</strong> buildings. Both tools have in common that they take energy use andmaterials in to account. However, the approach <strong>of</strong> both tools is different. Whereas the LCA isbased on quantified data <strong>of</strong> all materials and energy used over the life time <strong>of</strong> a building, GreenStar is based on credits for a number <strong>of</strong> criteria.A brief introduction to the Green Star NZ Office Design V1 tool is provided as backgroundinformation for the gap analysis that follows.Status Draft 16.07.2008Project NumberOur Ref − MWH Scion GreenStar Assessment PeerReviewFINAL.doc
The Green Star NZ building performance rating framework was developed by the New ZealandGreen Building Council (NZGBC) and it aims to:- Define green building by establishing a common language and standard <strong>of</strong> measurement;- Promote integrated, whole-building design;- Identify building life-cycle impacts;- Raise awareness <strong>of</strong> green building benefits;- Recognise and reward environmental leadership; and- Transform the built environment to reduce the environmental impact <strong>of</strong> development.(Green Star NZ Office Design V1, 2008)The GreenStar NZ Office Design V1 tool was developed for the design stage <strong>of</strong> <strong>of</strong>fice buildings toevaluate the environmental initiatives and/or potential environmental impacts <strong>of</strong> commercial <strong>of</strong>ficebase building designs (Green Star NZ Office Design V1). It has been shown that the design stage<strong>of</strong> <strong>of</strong>fice buildings is when the most influence can be made upon total life cycle costs.In the Green Star NZ building performance rating tool credits are awarded for certain activities andwhere possible industry benchmarks are used. For example 1 point is awarded where it can bedemonstrated that the percentage <strong>of</strong> all steel in the design has a post-consumer recycled contentgreat than 60 % by mass, and 2 points for 90 % by mass. If the material cost <strong>of</strong> steel representsless than 1 % <strong>of</strong> the project’s total contract value then this credit would be “not applicable”.Similarly 2 points are awarded where it is demonstrated that all timber and composite timberproducts are either post-consumer re-used timber or FSC (Forest Stewardship Certified) timber ora combination <strong>of</strong> both. In other categories points are awarded for other categories (Figure 1-1-1).Figure 1-1-1: Generic Green Star NZ Framework (NZGBC 2008)All points are then weighted and summarised into a single score, where materials have acontribution <strong>of</strong> 10 % to the total score whereas energy has a contribution <strong>of</strong> 25 %. For allweightings see Table 1-1.Status Draft 16.07.2008Project NumberOur Ref − MWH Scion GreenStar Assessment PeerReviewFINAL.doc
Table 1-1-1: Weightings in Green Star toolManagement 10 %Indoor <strong>Environmental</strong> Quality 20 %Energy 25 %Transport 10 %Water 10 %Materials 10 %Land Use and Ecology 10 %Emissions 5 %Total (+ innovation) 100 %1.1.2 Principles <strong>of</strong> Life Cycle AssessmentMaterials stewardship is fundamental to sustainable development, and should provide a unifyingapproach to the development and implementation <strong>of</strong> policies directed at sustainable use <strong>of</strong>materials.Life cycle assessment (LCA) is an analytical methodology that is used to quantify theenvironmental impacts <strong>of</strong> products, processes or services (see Figure 1-1-2 for a ‘life cycle’). Theconstruction industry can apply this methodology to deliver sustainable development throughenhanced materials stewardship.Figure 1-1-2 : Example <strong>of</strong> a Life Cycle for a Product or Commodity used by Industry(Norgate et al. 2007)Status Draft 16.07.2008Project NumberOur Ref − MWH Scion GreenStar Assessment PeerReviewFINAL.doc
Introduction to Life Cycle AssessmentLCA is a methodology for assessing the environmental performance <strong>of</strong> a service, process, orproduct, including a building, over its entire life cycle. It is not possible to go into the details <strong>of</strong> LCAhere, but the basic methodology for the various steps is useful to present. Life cycle assessmenttypically comprises four stages; (1) the goal definition and scoping stage; (2) the life cycle inventorystage, (3) the life cycle impact assessment stage, and (4) the interpretation or improvement stage(ISO 14040 2006). Life cycle impact assessment can also be re-framed as life cycle ‘costing’, usinga variety <strong>of</strong> techniques to place a monetary value on the socio-economic and environmentalimpacts <strong>of</strong> alternative decisions (Krozer 2008).Life cycle assessment tools assess impacts on a variety <strong>of</strong> environmental values, including air andwater quality, greenhouse emissions and land use for a suite <strong>of</strong> activities undertaken duringconstruction. ‘Cradle-to-gate’ LCA assesses alternative construction activities from design to builtand in use forms, whilst ‘cradle-to-grave’ LCA assesses the commodity throughout its life-cycle,both during and after direct responsibility <strong>of</strong> the producer.The goal and scope stage outlines the context <strong>of</strong> the LCA, whether it will be construction-only,cradle-to-gate, cradle-to-grave or cradle-to-cradle. The inventory also determines what data isavailable, and which operations and environmental parameters will be included. A risk-basedassessment should be used to determine which operations in the construction process should beassessed, and which environmental parameters / impacts within each operation should bequantified.The inventory analysis provides detailed material and energy balances over the system asidentified in the goal and scope definition. All quantities <strong>of</strong> material and energy inputs, and productand emission outputs to air, water, and land are compiled into one inventory.Following the inventory, the life cycle impact assessment phase typically has three components(ISO14040 2006): Classification: where the results <strong>of</strong> the inventory are categorised into impactcategories; Characterisation: where the contribution <strong>of</strong> inventory data to each impact category isdetermined; and Valuation: whereby the different impacts are normalised and weighted againsteach other (Mangena and Brent 2006). The valuation step is optional in an LCA. If this step isundertaken the previous results need to shown in order to provide the necessary transparency.<strong>Environmental</strong> impacts to be quantified are selected and defined in the goal and scope definition.The choice <strong>of</strong> <strong>Environmental</strong> impacts may differ for different LCA studies. Within one LCA studythe same environmental impacts need to be considered in each stage <strong>of</strong> constructionA major concern with LCA, like any impact assessment process (including GreenStar NZ), is theway that values are attributed for different types <strong>of</strong> impacts. The valuation step is optional –characterised results need to be shown as well. This means that the user <strong>of</strong> the results can decidewhether one considers climate change more important or ozone depletion. Regardless, oncevalues are quantified, LCA can be a useful decision support tool for comparing project or processoptions within an agreed values framework.Status Draft 16.07.2008Project NumberOur Ref − MWH Scion GreenStar Assessment PeerReviewFINAL.doc
The science behind LCA is still developing. Since life cycle costs cannot be unambiguouslyattributed, especially in multi-product process chains (Johns et al. 2008), LCA should only be usedas a decision support framework, rather than a complete decision making tool.1.1.3 MWH CommissionMWH NZ were engaged to prepare a peer review <strong>of</strong> Greenstar self-assessment <strong>of</strong> a buildingdesign constructed from four different materials; concrete, steel, timber and timber plus. Thepreliminary work involved comparing the self-assessments (concrete, steel, timber) provided byScion under the base scenario with the GreenStar Office Design V1 building rating tool. Scion alsoprovided two context documents detailing the research approach and the operational energydetails <strong>of</strong> the base building. The brief was to provide Scion with a peer review as to whether theassumptions they had made and comparisons drawn between GreenStar Office Design V1 andLCA were appropriate for the limited credits selected for the purposes <strong>of</strong> this study. The creditsselected by Scion for the purposes <strong>of</strong> this study included; ENE1, ENE2 and MAT 1-12.Results <strong>of</strong> the peer review were supplied to Scion by MWH to enable their final reporting. The peerreview <strong>of</strong> the results summarised below details results <strong>of</strong> the initial GreenStar Office Design V1self-assessments submitted to MWH from Scion under the base scenario and LCA results alsosubmitted by Scion. MWH have reviewed the documentation in conjunction with current industrypractice and their knowledge <strong>of</strong> the GreenStar system gained whilst helping the New ZealandGreen Building Council to develop the first GreenStar buildings rating tool for New Zealand. MWHalso keep current with GreenStar NZ technical updates by delivering pr<strong>of</strong>essional developmenttraining for GreenStar pr<strong>of</strong>essionals on behalf <strong>of</strong> the New Zealand Green Building Council andwhilst acting as technical advisors to the New Zealand Green Building Council technical advisoryworking group. This peer review has been undertaken using MWH current knowledge in theconstantly evolving field <strong>of</strong> environmentally sustainable design and our own industry experience indesigning green buildings.1.2 Peer Review <strong>of</strong> LCA and GreenStar NZ Office V1 ResultsThe aim <strong>of</strong> this section is to compare the results <strong>of</strong> the Scion life cycle assessment and theGreenStar NZ Office Design V1 tool self-assessments carried out by Scion, based on the sameassumptions. The relevance <strong>of</strong> the research approach (basic assumptions) and interpretation <strong>of</strong>results will be discussed in the conclusions.The number <strong>of</strong> points awarded (for two categories materials (whole category) and energy (ENE1and ENE2)) as well as the weighted total score (based on these categories) for the steel, concrete,timber and timber plus building are shown in Table 1-2-1.Status Draft 16.07.2008Project NumberOur Ref − MWH Scion GreenStar Assessment PeerReviewFINAL.doc
Table 1-2-1: Green Star NZ Office Design V1 results – Base scenarioCreditsWeighted scoreTimber building 5 5Timber plus building 5 5Steel building 5 5Concrete building 6 6The GreenStar NZ Office Design V1 ranking <strong>of</strong> the buildings based on self-assessments;1. Concrete2. Steel/Timber/Timber plusIn comparison the LCA results have shown the following ranking for primary energy use as well asGWP in the base scenario:1. Timber plus2. Concrete3. Timber4. SteelUnder the base scenario the GreenStar NZ assessments rated the use <strong>of</strong> concrete most favourablyin construction but did not separate steel, timber and timber plus. Whereas LCA demonstratedclear differences in the desirability <strong>of</strong> the different materials from an energy use and globalwarming potential perspective, with timber plus having the least sensitive environmental pr<strong>of</strong>ile.Table 1-2-2: Green Star NZ Offie Design V1 results – Recycling scenarioCreditsWeighted scoreTimber building 8 7Timber plus building 8 7Steel building 10 8Concrete building 8 7The GreenStar NZ Office Design V1 ranking <strong>of</strong> the buildings based on the results would be;1. Steel2. Concrete/Timber/Timber plusStatus Draft 16.07.2008Project NumberOur Ref − MWH Scion GreenStar Assessment PeerReviewFINAL.doc
In comparison the LCA results have shown the following ranking for primary energy use as well asGWP in the reutilisation scenario:1. Timber plus2. Concrete3. Timber4. SteelUnder the re-utilisation scenario GreenStar NZ was unable to differentiate between concrete,timber and timber+ and rated steel as the optimal building material. <strong>Using</strong> energy use and globalwarming potential data LCA assessment <strong>of</strong> the same information showed timber+ as the leastenvironmentally degrading.1.3 Discussion and ConclusionsWhen examining the credits awarded in the self assessments carried out by Scion as describedabove for the different building materials it became evident that individual credits in this particularcase are largely irrelevant. It is more appropriate to measure the percentage contribution <strong>of</strong> thecredits to the final score, taking into account not applicable credits and category weightings. Forexample: 6 credits <strong>of</strong> a possible 24 credits multiplied by the category weighting gives a 2.5%contribution to the final score, but 6 credits <strong>of</strong> a possible 21 credits multiplied by the sameweighting gives a 2.86% contribution to the final score. The percentage contribution to the overallcategory score <strong>of</strong> specific credits allows a more accurate assessment <strong>of</strong> the relative importanceassigned to the selected credits under the GreenStar NZ system and a more meaningfulcomparison with LCA.The GreenStar NZ Office Design V1 tool proved to be <strong>of</strong> limited consistency with respect tocomparisons with life cycle assessment as the basic assumptions <strong>of</strong> the study did not align withthose <strong>of</strong> GreenStar NZ. Under the GreenStar NZ Rating systerm a building will inherently performwell in certain areas and not in others, but good design practice will be rewarded by a balancedscorecard approach for the overall building rating. The assumption in this study <strong>of</strong> consistentperformance <strong>of</strong> the base building in those credits not under comparison does not align with thepremise <strong>of</strong> GreenStar NZ. It is highly unlikely that any base building made from such diversematerials as have been compared in this study would not demonstrate differences in other creditsbeyond materials and energy. This is an academic exercise however and has been reviewed assuch.The study revealed that the level <strong>of</strong> refinement <strong>of</strong> the GreenStar NZ tool was not able to determinea difference between the timber and the timber plus building, both share the same results in theGreen Star NZ assessment. This result could be attributed to a lack <strong>of</strong> volumetric accounting <strong>of</strong>material proposed for construction; the GreenStar NZ-based rating tool used material costs as apercentage <strong>of</strong> the total contract costs. However. in pragmatic terms this was not a significant issuefor this study because the building design assumptions proved to be unrealistic, wherebyconstructing a building <strong>of</strong> the design proposed, in wood alone (timber or timber plus) would not becompliant with building code. The GreenStar NZ tool lacked sufficient refinement to discern theStatus Draft 16.07.2008Project NumberOur Ref − MWH Scion GreenStar Assessment PeerReviewFINAL.doc
order <strong>of</strong> desirability <strong>of</strong> the less preferable construction materials and function as a design rating toolthat could also support sound decision making at the planning stage.The approach adopted for this research study was consistent and allowed comparison to be drawnbetween the tools, however the lack <strong>of</strong> availability <strong>of</strong> detailed data on the cost contribution <strong>of</strong>specific materials was limiting as some <strong>of</strong> the GreenStar NZ materials credits depend upon thisinformation in order to award points. The material contract cost attributes required under GreenStarNZ and the material cost cut <strong>of</strong>f rules for steel and concrete (1 % <strong>of</strong> project contract value) andtimber (0.1 % <strong>of</strong> project contract value) were incepted to reflect the “average” building and basedupon estimations from certified quantity surveyors. The cut <strong>of</strong>f points were designed to allowpoints to be awarded only where a measurable proportion <strong>of</strong> the total contract cost was accountedfor in material that had been recycled. GreenStar NZ aims to drive good practice and take abalanced scorecard approach in buildings where recycled materials cannot be fully utilised. Thecredits for recycled concrete, steel and FSC certified timber are awarded for buildings unless theyfail to meet the cut <strong>of</strong>f criteria and then the “Not Applicable” option applies. When credits are notapplicable under one credit criteria, the other points in that category become more valuable as theunclaimed credits are spread evenly across the other applicable credits.<strong>Using</strong> the base and recycling scenarios highlighted the changes possible in building rating bysimply selecting different core materials versus the impact <strong>of</strong> full recycling on the overall GreenStarNZ building rating. There were changes in the most preferred material type but a lack <strong>of</strong>differentiation in the other possible materials for both scenarios. In order for the scenarios todifferentiate more clearly under GreenStar NZ it would be essential to have more quantifiable dataaround re-use as a percentage <strong>of</strong> total contract value and some detail on the fit-out. The reviewersare aware that fit-out was beyond the scope <strong>of</strong> the study, however it is a strong component <strong>of</strong>GreenStar NZ and some assumptions could have been made based on the current building.Of central importance to the design <strong>of</strong> the study covered by this report was the requirement to haveall four alternative designs displaying very similar operational energy consumption over the lifetime<strong>of</strong> the buildings. Previous research has shown that even when the energy efficiency <strong>of</strong> buildingsbeing compared is code-compliant, the effects <strong>of</strong> the embodied energy <strong>of</strong> construction materialsare difficult to differentiate in comparison to the much larger variations in operational energybetween the different buildings (Wayne and Trusty, 2007). Choosing similar operational energyconsumption <strong>of</strong> the four buildings being compared in this report means that the differences in theenvironmental impacts are determined by the differences in the embodied and recurrent(maintenance and refurbishment) energy and GWP emissions in the different materials used ineach building. To achieve very similar operational energy pr<strong>of</strong>iles required different design forenvelope walls construction, thermal mass, and heating and cooling equipment in each <strong>of</strong> the fourbuildings. This fundamental variation was not able to be reflected in the GreenStar NZ selfassessmentsunder the limited credits chosen and resulted in skewed reporting <strong>of</strong> the ratingsachieved.The energy category (25%) is given a higher weighting than the materials category (10%) forinfluencing the overall score <strong>of</strong> the Green Star rating and this was consistent with the LCAassessment which showed that the operational energy use dominates the results over the wholelife cycle.Status Draft 16.07.2008Project NumberOur Ref − MWH Scion GreenStar Assessment PeerReviewFINAL.doc
All four buildings in this research had similar performance pr<strong>of</strong>iles (close to 85 kWh/m 2 /year). Thiswas important because the aim <strong>of</strong> this study was to look at the influence <strong>of</strong> materials on the lifecycle energy use and GWP emissions <strong>of</strong> the buildings. Natural gas was used as fuel for theheating system and domestic hot water. Electricity is used for cooling, lighting and <strong>of</strong>ficeequipment energy. The energy mix was important when considering GWP since two buildingshaving the same total energy might use different proportions <strong>of</strong> gas and electricity. Not all energyis equal; combustion emissions differ by energy form and the upstream, pre-combustionimplications <strong>of</strong> producing and moving different energy forms can be even more significant. Thusbuildings with the same total operational energy use may not result in the same GWP emissions,for example, LPG has a much higher carbon dioxide coefficient than electricity. Indeed the carbondioxide rating <strong>of</strong> electricity varies significantly depending on how the electricity is generated andwhere (which country) it is produced. A rating system promoting minimal energy use without regardfor the form may be misleading, especially if it results in the use <strong>of</strong> materials or constructiontechniques that have significant resource use or emission implications in their own right. Theenergy mix is <strong>of</strong> vital importance for the GreenStar NZ rating system and different mixes wouldhave been awarded different credits under the criteria <strong>of</strong> the energy calculator, hence theconsistent approach used in this study was appropriate for the desired outcomes.The base building was not an <strong>of</strong>fice building, it was based upon the laboratory buildings for theBiological Science facilities at Canterbury University, therefore the use <strong>of</strong> the Office Design toolwas <strong>of</strong> questionable value. However, in the absence <strong>of</strong> any other more appropriate tools (i.e. theGreenStar NZ Education tool currently under development) the study carried out has highlightedsome areas in need <strong>of</strong> further work, these areas are covered in the following section <strong>of</strong> the report.Arguably using the Office Design V1 tool would have skewed the rating results as the weightingshave been derived to reward best practice in designing <strong>of</strong>fice buildings rather than educationestablishments. The principles <strong>of</strong> GreenStar NZ remain the same across tools, but how they areapplied varies according to specific applications, this study provides a positive starting point fordiscussion.There were relatively small differences between the results from base and re-utilisation scenarios.This was in part due to the limited number <strong>of</strong> credits chosen for comparison. The assumptions <strong>of</strong>no differences in inherent building characteristics for those credits not under scrutiny for eachmaterial assessed did not align with the basic premise <strong>of</strong> the GreenStar NZ rating tool which catersfor fundamental differences in buildings using <strong>of</strong>fsetting <strong>of</strong> credits in other categories to drivepositive changes in behaviour.The wide use <strong>of</strong> not applicable for the self-assessments where circumstances are considered thesame for all four buildings or where data does not exist may have biased the results fromGreenStar NZ as credits that are deemed not applicable in one credit are equally spread acrossthe remaining credits in the category. This re-distribution <strong>of</strong> points results in a change in the overallimportance <strong>of</strong> the remaining credits in the catgeory.There are substantial rewards under the material category <strong>of</strong> the GreenStar NZ for recycledcontent <strong>of</strong> steel and concrete and integrated fit out. These drivers do not account for theenvironmental benefits demonstrated by LCA from the use <strong>of</strong> post-consumer timber, resulting inStatus Draft 16.07.2008Project NumberOur Ref − MWH Scion GreenStar Assessment PeerReviewFINAL.doc
the GreenStar assessment considering the concrete building option to be optimal. The presumption<strong>of</strong> GreenStar NZ and most green building rating systems is that recycled materials willautomatically result in reduced environmental burdens. However, this may not always be the caseand recycling in any given situation may be a positive or negative attribute. For example recyclingcan save landfill space, but the process <strong>of</strong> recycling <strong>of</strong> any given product may take more energyand adversely affect air quality more than production from raw materials. The focus on recyclingcan ignore the possibility and give more weight to solid waste and resource depletion issues thanglobal warming or other measures. One issue or indicator does not take precedence over theother, but commonly held assumptions can drive the shape <strong>of</strong> rating tools over data and facts whendecisions are made during tool planning. It may be prudent to re-visit the objective <strong>of</strong> recyclingduring the review phase <strong>of</strong> the GreenStar NZ tool to align the ratings to the initial aim to reduce theflows from and to nature.There were found to be aspects <strong>of</strong> the GreenStar NZ tool that were constrained when trying to fullyintegrate LCA-based tools into this building rating system. Two, in particular deserve emphasis; theproblem <strong>of</strong> data availability, and the absence <strong>of</strong> appropriate references or benchmarks againstwhich to judge LCA results for a particular building.GreenStar NZ is clear in its aims and in some cases is driving better practice; The energy creditsaim to reduce greenhouse emissions from operation <strong>of</strong> the building (carbon dioxide emissions), touse energy more efficiently and reduce peak loads. The reality is that energy rating is heavilydependent upon building fabric, building services systems and expected electrical and mechanicalloadings. In the majority <strong>of</strong> modern buildings there is a fine balance between natural light andthermal gain. The Façade is also an important factor in determining the final energy rating. Thissupports the notion that a more holistic measure is required to capture all these linked aspects <strong>of</strong>the energy equation. The material credits aim to minimise resource consumption through materialselection, use and re-use initiatives, support third party life cycle assessment programs andefficient management practices. There are gaps in the data currently available to populate thirdparty verification schemes such as <strong>Environmental</strong> Choice due to the lack <strong>of</strong> independently verifiedspecifications available through accredited suppliers. This is an active area <strong>of</strong> research and as databecomes available it will inform the GreenStar tools. Recycled steel and concrete at this stage arenot practical due to a lack <strong>of</strong> information available from suppliers and indeed a lack <strong>of</strong> choice <strong>of</strong>products. In addition, as previously discussed, recycling may not always prove to be the bestenvironmental choice.The integrated interior fit-out strategy is important and does drive efficiency in management. Amajor limitation in the material category is the lack <strong>of</strong> environmental choice products for developersto choose from and be confident that they are making a sound decision.In order to encourage the uptake <strong>of</strong> LCA and incorporate all estimated effects and not proxymeasures it will be necessary to educate the public as to why informed environmental choice isimportant. It will be important to emphasise the need for assessing whole buildings and theinherent relationships in a building system where the choice <strong>of</strong> one material for an application maydictate the use <strong>of</strong> other materials for thermal or other reasons.Status Draft 16.07.2008Project NumberOur Ref − MWH Scion GreenStar Assessment PeerReviewFINAL.doc
1.4 Further WorkThe difficulty in maintaining complete objectivity in building assessment systems is most noteablein the material selection criteria and to a lesser extent in the energy use criteria. Definingsustainable materials presents a confounding challenge for Scientists. Ultimately a betterintegration <strong>of</strong> LCA techniques and LCA-based decision support tools in whole building rating andcertification systems is preferable.Based on this study there are several options for further work that would add to the growing body<strong>of</strong> knowledge in this vital research area, some <strong>of</strong> these are detailed below. During the review phase<strong>of</strong> the GreenStar NZ tools provide feedback to the New Zealand Green Building Council aroundalignment <strong>of</strong> the ratings to the initial objective to reduce the flows from and to nature. Data tosupport this important feedback would be essential to ensure changes could be incorporated int<strong>of</strong>uture tools.Once the GreenStar NZ Education tool has been released it may be prudent to re-run the selfassessmentsand compare LCA with the appropriate application-specific green building rating tool.A further study comparing results obtained for similar self-assessments with BREEAM and LEEDas alternate green building rating tools that have had the opportunity to mature in the market.Further work around true life cycle costs for beneficial re-use options for recycled materials andinvestigating barriers to LCA data availability for New Zealand is suggested.Provision <strong>of</strong> research data to companies trying to become <strong>Environmental</strong> Choice certified wouldenable the market to have better data across a wider range <strong>of</strong> products and this would encouragetheir wider use.A more comprehensive treatment <strong>of</strong> other credits where LCA would be invaluable isrecommended, examples include; MAN-7 (quantifying the impact <strong>of</strong> waste diverted from landfill) orEMI-5 (assessing the life cycle costs <strong>of</strong> reducing flows to municipal sewage systems).The issue <strong>of</strong> data availability across borders to ensure comparability and the obvious commercialsensitivity <strong>of</strong> the data is an outstanding issue requiring resolution at a high level. Raising the pr<strong>of</strong>ile<strong>of</strong> LCA as a decision support tool at government level would be fundamental to winning furtherfunding to develop New Zealand-based data. When judging the significance <strong>of</strong> data with respect toreferences or benchmarks the ultimate answer lies in developing case studies <strong>of</strong> different types <strong>of</strong>conventional buildings in different regions that can serve as benchmarks. There are compellingreasons to have this data in terms <strong>of</strong> future pro<strong>of</strong>ing key decisions around climate change andadaptation.In the long run the integration <strong>of</strong> LCA tools into whole building assessment systems will yieldsignificant benefits, not only will it improve understanding and reward for environmentalperformance, but once established future LCA will be less complex and expensive. A paradigmshift is required away from conventional wisdom and related procurement decisions towardminimisation <strong>of</strong> life cycle flows to and from nature.Status Draft 16.07.2008Project NumberOur Ref − MWH Scion GreenStar Assessment PeerReviewFINAL.doc
1.5 ReferencesInternational standardisation organisation 2006. <strong>Environmental</strong> Management – Life cycleassessment – Principles and framework. ISO14040.Johns, W.R., Kokossis, A., and Thompson, F. (2008) A flowsheeting approach to integrated lifecycle analysis. Chemical Engineering and Processing 47: 557–564.Krozer, Y. (2008) Life cycle costings for innovations in product chains. Journal <strong>of</strong> CleanerProduction 16: 310-321.Mangena, S.J., and Brent, A.C. (2006) Application <strong>of</strong> a Life Cycle Impact Assessment framework toevaluate and compare environmental performances with economic values <strong>of</strong> supplied coalproducts. Journal <strong>of</strong> Cleaner Production 14: 1071-1084.Norgate, T.E., Jahanshahi, S, and Rankin, W.J (2007) Assessing the environmental impact <strong>of</strong>metal production processes. Journal <strong>of</strong> Cleaner Production 15: 838-848.New Zealand Green Building Council (NZGBC) 2008. Technical Manual Office Design ToolVersion 1. pp vi.Wayne, B., and Trusty M.A. 2007. Integrating LCA Tools in Green Building Rating Systems.Sustainable Materials Conference, Vancouver, 2007. Sustainable Materials Institute, Ontario.Pp112-113.Status Draft 16.07.2008Project NumberOur Ref − MWH Scion GreenStar Assessment PeerReviewFINAL.doc