Experiment GB-6: Conductivity of Solutions - iWorx
Experiment GB-6: Conductivity of Solutions - iWorx
Experiment GB-6: Conductivity of Solutions - iWorx

Create successful ePaper yourself
Turn your PDF publications into a flip-book with our unique Google optimized e-Paper software.
<strong>Experiment</strong> <strong>GB</strong>-6: <strong>Conductivity</strong> <strong>of</strong> <strong>Solutions</strong>Exercise 1: The <strong>Conductivity</strong> <strong>of</strong> Various Electrolytes.Aim: To determine the conductivity <strong>of</strong> different electrolyte solutions.Procedure:Note:Always begin testing samples with the conductivity selector switch in the 0-200 uS range. Whilerecording the conductivity <strong>of</strong> each test sample, toggle the switch to the 0-20,000 uS position. This isespecially important for measuring solutions with higher conductivities.1. Fill a 100 ml beaker with approximately 50 ml <strong>of</strong> 0.05M NaCl. Fill a 250 ml beaker with 100mldeionized water.2. Make sure the conductivity selector switch is in the 0-200 uS position.3. With the CM-100 conductivity meter in the beaker <strong>of</strong> deionized water, click Record on theLabScribe Main window to begin recording.4. When the recording on the <strong>Conductivity</strong> channel reaches a stable baseline, type DI Water in theMark box to the right <strong>of</strong> the Mark button. Press the Enter key on the keyboard to mark therecording.5. Type 0.05M NaCl in the Mark box to the right <strong>of</strong> the Mark button.6. Remove the meter from the deionized water and carefully blot the tip.7. Place the CM-100 in the beaker <strong>of</strong> 0.05 M NaCl.8. When the recording on the <strong>Conductivity</strong> channel reaches a stable baseline, type 0.05 NaCl inthe Mark box to the right <strong>of</strong> the Mark button. Press the Enter key on the keyboard to mark therecording. The recording should look like Figure <strong>GB</strong>-6-L1.Note: You may need to toggle the conductivity selector switch to the 0-20,000 uS range to get anaccurate reading <strong>of</strong> conductivity.9. Click Stop to halt the recording.10. Select Save in the File menu.11. Remove the conductivity meter from the beaker. Hold the meter over the 500 ml beaker usedfor collecting waste deionized water, and rinse it with a wash bottle. Blot any drops <strong>of</strong> DI waterfrom the meter and place the meter in a beaker containing fresh DI water. The meter will beused in the next section <strong>of</strong> the exercise.<strong>iWorx</strong> Sample LabGeneral Biology-Ecology – <strong>Conductivity</strong> <strong>of</strong> <strong>Solutions</strong> – Labs<strong>GB</strong>-6-1Copyright <strong>iWorx</strong> Systems Inc.Note: Only for evaluation by prospective customers.
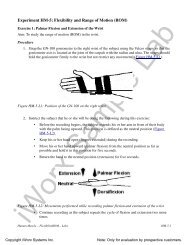
Figure <strong>GB</strong>-6-L1: Recording showing the conductivity <strong>of</strong> a solution in the Main window.12. Repeat steps 1 through 11 using the following solutions.• 0.05 M CaCl 2• 0.05 M AlCl 3• 0.05 M HC 2H 3O 2• 0.05 M H 3PO 4• 0.05 M H 3BO 3• 0.05 M HCl• 5% C 2H 4O 2• 5% C 3H 7OHNote: Be sure to mark the recording appropriately for each <strong>of</strong> these solutions for ease <strong>of</strong> data analysis.13. Place the CM-100 conductivity probe in a beaker <strong>of</strong> fresh deionized water during data analysis.<strong>iWorx</strong> Sample LabGeneral Biology-Ecology – <strong>Conductivity</strong> <strong>of</strong> <strong>Solutions</strong> – Labs<strong>GB</strong>-6-2Copyright <strong>iWorx</strong> Systems Inc.Note: Only for evaluation by prospective customers.
12. Repeat steps 1 through 11 for both 1.0 M CaCl 2and 1.0 M AlCl 3.13. Discard the contents <strong>of</strong> each beaker as directed by your instructor.Note: Remove the conductivity meter from the beaker. Hold the meter over the beaker used forcollecting waste deionized water, and rinse it with a wash bottle. Blot any drops <strong>of</strong> DI water from themeter and place the meter in the beaker containing fresh DI water. Make sure the CM-100 is clean anddry prior to storage.Data Analysis1. Scroll to the section <strong>of</strong> data for deionized water and 1 drop <strong>of</strong> 1.0 M NaCl recorded duringExercise 2.2. Use the Display Time icons on the LabScribe toolbar to position this section <strong>of</strong> recording onthe Main window. The required data can also be selected by:• Placing the cursors on either side <strong>of</strong> the section <strong>of</strong> data needed. Place one cursor on thestable conductivity value recorded from pure deionized water. Place the second cursoron the stable conductivity value recorded after adding 1 drop <strong>of</strong> 1.0 M NaCl.• Clicking the Zoom between Cursors button on the LabScribe toolbar to expand thesegment <strong>of</strong> data to the width <strong>of</strong> the Main window.3. Look at the Function Table that is above the uppermost channel displayed in the Analysiswindow. The mathematical functions that are listed should include Title, Value1, and Value2.The values for these parameters from each channel are seen in the table across the top margin <strong>of</strong>each channel.4. Once the cursors are placed in the correct positions for determining the conductivity, the valuescan be recorded in the on-line notebook <strong>of</strong> LabScribe by typing the names and values directlyinto the Journal.5. The functions in the channel pull-down menus <strong>of</strong> the Analysis window can also be used to enterthe names and values <strong>of</strong> the parameters from the recording to the Journal. To use thesefunctions:• Place the cursors at the locations used to measure the conductivity from the <strong>Conductivity</strong>channel.• Transfer the name <strong>of</strong> the mathematical function used to determine the conductivity to theJournal using the Add Title to Journal function in the <strong>Conductivity</strong> channel pull-downmenu.• Transfer the value for the conductivity to the Journal using the Add Ch. Data to Journalfunction in the <strong>Conductivity</strong> channel pull-down menu.6. Place one cursor on the stable conductivity value <strong>of</strong> the pure deionized water. Place the secondcursor on a data point in the recording <strong>of</strong> the 1 drop <strong>of</strong> 1.0 M NaCl solution.<strong>iWorx</strong> Sample LabGeneral Biology-Ecology – <strong>Conductivity</strong> <strong>of</strong> <strong>Solutions</strong> – Labs<strong>GB</strong>-6-5Copyright <strong>iWorx</strong> Systems Inc.Note: Only for evaluation by prospective customers.
7. Measure the values for the following parameters from the <strong>Conductivity</strong> channel for the region<strong>of</strong> data selected:• <strong>Conductivity</strong>-DI Water, which is Value1 on the <strong>Conductivity</strong> channel.• <strong>Conductivity</strong>-1, which is Value2 on the <strong>Conductivity</strong> channel.8. Record the values for these parameters in the Journal using one <strong>of</strong> the procedures described inStep 5, and on Table <strong>GB</strong>-6-L2.9. Click the down arrow next to the Mark box to choose the next section <strong>of</strong> data.• Highlight and click on the next Mark on the list - CaCl 2.• This will automatically move the recording to the section <strong>of</strong> data with that Mark.10. Repeat steps 1 through 9 for CaCl 2.11. Repeat steps 1 through 9 for AlCl 3.Data TablesTable <strong>GB</strong>-6-L1: Data Table for Exercise 1 - <strong>Conductivity</strong> <strong>of</strong> Different <strong>Solutions</strong><strong>Conductivity</strong> Values for Various <strong>Solutions</strong>Solution Deionized water prior to test (uS) <strong>Conductivity</strong> <strong>of</strong> Solution (uS)0.05 M NaCl0.05 M CaCl 20.05 M AlCl 30.05 M HC 2H 3O 20.05 M H 3PO 40.05 M H 3BO 30.05 M HCl5% C 2H 4O 2(acetic acid)5% C 3H 7OH(isopropyl alcohol)<strong>iWorx</strong> Sample LabGeneral Biology-Ecology – <strong>Conductivity</strong> <strong>of</strong> <strong>Solutions</strong> – Labs<strong>GB</strong>-6-6Copyright <strong>iWorx</strong> Systems Inc.Note: Only for evaluation by prospective customers.
Table <strong>GB</strong>-6-L2: Data Table for Exercise 2 - ConcentrationEffect <strong>of</strong> Concentration on <strong>Conductivity</strong>1.0 M NaCl 1.0 M CaCl 21.0 M AlCl 3# <strong>of</strong> drops <strong>Conductivity</strong> (uS) # <strong>of</strong> drops <strong>Conductivity</strong> (uS) # <strong>of</strong> drops <strong>Conductivity</strong> (uS)QuestionsExercise 11 1 12 2 23 3 34 4 45 5 56 6 67 7 78 8 89 9 910 10 101. Which solution had the highest conductivity? The lowest?2. What is the main contributor to the difference in conductivity values between the solutionstested?3. What is the reason that acetic acid and isopropyl alcohol showed little, if any, conductivity?4. How do strong and weak electrolytes compare in their conductivity values?Exercise 21. What was the effect <strong>of</strong> adding drops <strong>of</strong> 1.0 M NaCl to deionized water?2. What was the effect <strong>of</strong> adding drops <strong>of</strong> 1.0 M CaCl 2to deionized water?3. What was the effect <strong>of</strong> adding drops <strong>of</strong> 1.0 M AlCl 3to deionized water?<strong>iWorx</strong> Sample Lab4. Graph Concentration vs. <strong>Conductivity</strong> for each <strong>of</strong> the 3 solutions.General Biology-Ecology – <strong>Conductivity</strong> <strong>of</strong> <strong>Solutions</strong> – Labs<strong>GB</strong>-6-7Copyright <strong>iWorx</strong> Systems Inc.Note: Only for evaluation by prospective customers.