

Unbundled Mortgage Market - International Union for Housing Finance
Unbundled Mortgage Market - International Union for Housing Finance
Unbundled Mortgage Market - International Union for Housing Finance

You also want an ePaper? Increase the reach of your titles
YUMPU automatically turns print PDFs into web optimized ePapers that Google loves.
Acknowledgments<br />
This book represents the <strong>International</strong> <strong>Union</strong> <strong>for</strong> <strong>Housing</strong> <strong>Finance</strong>’s most in-depth Sourcebook to<br />
date. Produced by Countrywide <strong>International</strong> Consulting Services, LLC, this volume provides<br />
country specific chapters with in<strong>for</strong>mation on national economies, housing markets, mortgage<br />
markets, policy developments, and an expanded list of contacts. This version completely revises<br />
and updates the 1995 edition, prepared by Cardiff Consulting Services and edited by Michael<br />
Lea, and the original version, <strong>International</strong> <strong>Housing</strong> <strong>Finance</strong> Factbook written by Mark Boleat<br />
in 1987. That version was a revision of Mark’s seminal contribution to the field of international<br />
housing finance, National <strong>Housing</strong> <strong>Finance</strong> Systems, published in 1985 by Croon Helm, Ltd. in<br />
association with the <strong>International</strong> <strong>Union</strong> of Building Societies and Savings Associations.<br />
The editor, Michael Lea, president of Countrywide <strong>International</strong> Consulting Services, LLC.,<br />
would like to express appreciation <strong>for</strong> the many people who made this edition of the Sourcebook<br />
possible.<br />
Don Holton, Secretary General and Michelle Jacksier, Administrator of the <strong>International</strong><br />
<strong>Union</strong> <strong>for</strong> <strong>Housing</strong> <strong>Finance</strong> <strong>for</strong> their support and assistance throughout the project;<br />
The Countrywide team: Jackie Blankenship, Paul Clendening, Joe Draus, Melissa<br />
Frierson, Monique Gaw, Edward Kralian, David Sakayeda, Kirsten Trosper, and Mark<br />
Watson who searched <strong>for</strong> hard-to-find data and country in<strong>for</strong>mation and wrote a number<br />
of the chapters, and Tom Boone who provided encouragement and support to finish the<br />
volume;<br />
Judith Hardt, Secretary General of the European <strong>Mortgage</strong> Federation, <strong>for</strong> permission to<br />
use the data and descriptions of European housing and mortgage markets that <strong>for</strong>m the<br />
basis <strong>for</strong> the European <strong>Union</strong> and Norway country summaries;<br />
Douglas Diamond, independent consultant and the world’s leading expert on the housing<br />
and mortgage markets of Central and Eastern Europe who contributed the country writeups<br />
<strong>for</strong> Estonia, Hungary, Slovakia, Czech Republic and who work <strong>for</strong>med the<br />
substantial basis of the country reports <strong>for</strong> Barbados, Egypt, Poland and Russia;<br />
Steven Bernstein, <strong>for</strong>merly with Cardiff Consulting Services, who contributed<br />
substantially to the Argentina, Australia and Brazil country summaries;<br />
Todd Palmer of Freddie Mac, who contributed the country summaries <strong>for</strong> Ecuador and<br />
Paraguay.<br />
Finally, I would like to thank my wife Teresa who put up with the long hours of Internet<br />
searches, writing and editing during the last year and remained optimistic and supportive<br />
throughout.<br />
Countrywide <strong>International</strong> Consulting Services<br />
1
Descriptions<br />
Overview of <strong>Housing</strong> <strong>Finance</strong> Systems 1<br />
A characteristic feature of a housing investment is its relative size and long investment<br />
horizon, requiring large amounts of long-term finance. The aim of a housing finance<br />
system is to provide these funds to the producers and purchasers of housing, both rental<br />
and owner-occupied. This simple description has spawned a broad array of institutional<br />
arrangements, ranging from contractual savings schemes, to depository institutions<br />
specializing in mortgage finance, to the issuance, sale and trading of mortgage securities.<br />
All of these arrangements have been created with the same purpose in mind, to channel<br />
funds from savers to borrowers.<br />
In an economy without a well developed <strong>for</strong>mal financial system, housing is either selffinanced<br />
(i.e., out of savings) or directly financed between individuals (such<br />
arrangements are often referred to as in<strong>for</strong>mal finance). Direct finance can be provided<br />
by friends, relatives, small savings clubs or landlords (e.g., the chonsei system in Korea).<br />
Although often the only alternative <strong>for</strong> households seeking to better their housing<br />
circumstances, in<strong>for</strong>mal arrangements are typically inefficient and costly in part because<br />
the requirements of savers and borrowers are different.<br />
A sign of financial sector development is the funding of housing by <strong>for</strong>mal financial<br />
institutions. These institutions can be private sector entities, which can be shareholder<br />
owned or mutual organizations or special circuits (i.e., government-backed institutions<br />
operating apart from the broader financial markets). As economies develop, provision of<br />
housing finance often moves away from extensive reliance on special circuits towards<br />
integration of housing finance into the broader financial markets [Diamond and Lea,<br />
1992b].<br />
In many countries, the traditional and still predominant model of <strong>for</strong>mal financial sector<br />
finance of housing is the deposit taking system. In this model, an institution gathers<br />
savings from households and enterprises and makes loans to homebuyers (Figure 1). By<br />
taking in savings from non-homebuyers, depository institutions can access a much larger<br />
pool of funds than through dedicated savings. There are several types of deposit taking<br />
institutions, including commercial banks which offer a complete range of banking<br />
services, savings banks which deal largely with the household sector, and specialist<br />
housing finance institutions (building societies or savings and loan associations) which<br />
focus their lending primarily on housing. A key feature of a depository system is that the<br />
institution originates, services and funds the loan. Funding is primarily through retail<br />
deposits but these institutions may also issue bonds and mortgage securities. Another key<br />
feature is the short-term, variable rate nature of the funding.<br />
1 This section is an updated version of the Overview from the 1995 edition of the Sourcebook.<br />
Helpful comments were provided by Achim Dübel.<br />
Countrywide <strong>International</strong> Consulting Services<br />
2
Homebuyers<br />
Figure 1<br />
Depository and Direct Lending<br />
Loans<br />
Banks and<br />
Savings<br />
Institutions<br />
Direct Lending<br />
Countrywide <strong>International</strong> Consulting Services<br />
Saving<br />
s<br />
Savers<br />
Specialist deposit funded institutions have traditionally dominated the provision of<br />
housing finance in English speaking countries (e.g., Australia, Canada, South Africa, the<br />
United States). The model <strong>for</strong> housing finance in these countries originated with the<br />
terminating building societies founded in England in 1775. The early building societies<br />
were <strong>for</strong>med to mobilize savings of lower and middle income households <strong>for</strong> the sole<br />
purpose of home construction. These institutions gradually evolved into specialized<br />
depository institutions with broader asset and liability powers but retained their focus on<br />
housing finance. In recent years, there has been a decline in the influence of specialized<br />
depositories which have been losing market share (or converting) to commercial banks<br />
and other <strong>for</strong>ms of intermediation.<br />
Contract savings systems can be viewed as specialized depository institution circuits. In<br />
many respects they are similar to the terminating building society in that they are often<br />
closed (meaning that the vast majority of funds <strong>for</strong> home purchase are derived from the<br />
savings attracted from potential homebuyers). Contract savings are major components of<br />
the housing finance systems of Austria, France and Germany and have been utilized in<br />
French-speaking Africa and Latin America. 2 They generate funds through contract<br />
savings, generally at a below market fixed rate of interest. Fulfillment of the contract<br />
entitles the savers to a below market fixed interest rate loan. In France and Germany the<br />
contract savings system provides supplementary credit (i.e., second mortgages) while in<br />
Austria it provides primary mortgages. Contract savings are generally supported by<br />
government through savings bonuses and favorable tax treatment. A specialized <strong>for</strong>m of<br />
contract savings exists in Singapore through the activities of the Central Provident Fund<br />
that serves general retirement purposes. Savers can use their mandatory savings <strong>for</strong><br />
downpayments and mortgage payments (but not rent payments - thus accounting <strong>for</strong> the<br />
extremely high rate of homeownership). The Fund assumes the position of the first lien<br />
holder and households frequently obtain supplementary funds from banks.<br />
An alternative to the depository institution model is the mortgage bank system (Exhibit<br />
2). In such systems, specialized institutions (mortgage banks) originate and service<br />
2 For more detail on the French and German systems see Diamond and Lea [1992a].<br />
3
portfolios of mortgage loans which are funded by securities they issue. The securities are<br />
general obligations of the mortgage bank and are typically purchased by institutions with<br />
long term sources of funds (e.g., pension funds and insurance companies). The mortgage<br />
bank model has been around since the mid-1800s and is extensively used in continental<br />
Europe (particularly in Germany and Scandinanvia). A major feature of mortgage banking<br />
systems is the predominance of of long-term, fixed-rate mortgages. 3<br />
Homebuyers<br />
Loans<br />
Figure 2<br />
<strong>Mortgage</strong> Bank System<br />
<strong>Mortgage</strong> Banks Institutional<br />
Securities Investors<br />
Countrywide <strong>International</strong> Consulting Services<br />
Saving<br />
s<br />
A depository system is frequently referred to as a retail approach as institutions deal<br />
directly with the public in lending and borrowing funds. The mortgage bank system is a<br />
combination of a retail and a wholesale approach. Its wholesale character comes from the<br />
funds raising side wherein funds are obtained primarily from institutional sources through<br />
the broader capital market rather than directly from the public.<br />
A fourth approach which has gained popularity in recent years is a secondary mortgage<br />
market (Exhibit 3). A secondary market ("SMM") involves the sale of mortgage loans<br />
(or loan portfolios) or MBS backed by specific pools of mortgages. 4 As such, it involves<br />
the transfer of the risks and ownership of mortgage loans to a third party. The loans may<br />
be sold to specialized institutions called conduits or through special purpose, separately<br />
capitalized vehicles. These entities raise funds through issuance of securities backed (or<br />
collateralized) by the loans. The majority of residential mortgage loans in the U.S. are<br />
funded through the SMM. MBS have been issued in Australia, Canada, South Africa, a<br />
number of Asian and Latin American countries and most European countries.<br />
3 For more detail on European mortgage banking systems see Hardt [2000]. The loans may be<br />
fixed to maturity (e.g., Denmark <strong>for</strong> 20 or 30 years) or <strong>for</strong> shorter periods of time (e.g., in<br />
Germany <strong>for</strong> a maximum of 10 years on a 30 year loan).<br />
4 An MBS is a pass-through security in which borrowers' monthly principal and interest payments<br />
and loan payoffs are passed directly to the investor net of servicing and guarantee fees. MBS can<br />
be used as funding instruments without creating a market (e.g., private placements of securities<br />
or sales of whole loans). For a more detailed discussion of mortgage bond and secondary market<br />
systems see Lea [1999].<br />
4
Banks and<br />
Savings<br />
Institutions<br />
Loans<br />
Loan Sales<br />
Securities<br />
Figure 3<br />
<strong>Housing</strong> <strong>Finance</strong> With a Secondary<br />
<strong>Mortgage</strong> <strong>Market</strong><br />
Saving<br />
s<br />
Households<br />
Loans<br />
Countrywide <strong>International</strong> Consulting Services<br />
Saving<br />
s<br />
<strong>Mortgage</strong> Banks Institutional<br />
Securities Investors<br />
Secondary<br />
<strong>Mortgage</strong><br />
<strong>Market</strong><br />
Loan Sales<br />
Securities<br />
The SMM model was originally developed in the U.S. in the 1970s as a method to sell<br />
mortgage loans (i.e., achieve off-balance sheet financing) in order to reduce the risk (both<br />
interest rate and liquidity) associated with fixed rate mortgage lending. The provision of<br />
payment guarantees with the securities issued by government sponsored enterprises<br />
(“GSEs”) such as Fannie Mae and Freddie Mac facilitates investor acceptance. The<br />
investor in a guaranteed security cares mainly about the default risk of the guarantor and<br />
not that on the individual loans that comprise the collateral. The investor is exposed to<br />
the cash-flow risk of the security which ultimately led to the creation of the collateralized<br />
mortgage obligation as a means to attract institutional investors. 5 In recent years,<br />
securitization has developed in other countries and the U.S. without the aid of<br />
government and has played an important role in improving market liquidity and bank risk<br />
and capital management. These transactions become feasible when wholesale sources of<br />
funds are cheaper than retail and/or lenders are capital constrained.<br />
The portfolio acquisition activities of the GSEs expanded in the 1990s. Both Fannie Mae<br />
and Freddie Mac increasingly hold mortgage assets on their balance sheet and fund<br />
themselves with the issuance of straight and callable debt. This approach to housing<br />
finance is similar to that of the European mortgage banks.<br />
In many countries, government supported or controlled institutions have a prominent role<br />
in the provision of housing finance. The largest housing finance institution in the world,<br />
the Government <strong>Housing</strong> Loan Corporation of Japan, is a government entity. The largest<br />
housing finance institution in the U.S., Fannie Mae, is a government-sponsored enterprise<br />
5 The CMO allocates cash flows received from a pool of mortgages sequentially among a group<br />
of securities.<br />
5
with private shareholders but a limited government charter and both funding raising and<br />
tax advantages. There is an emerging privatization trend with <strong>for</strong>mer government<br />
supported institutions in Argentina, Australia, France, Korea and Spain being partially or<br />
totally sold to the private sector. <strong>Housing</strong> finance retains a preferential place in most<br />
national financial systems (e.g., through tax deductibility of mortgage interest, favorable<br />
treatment of mortgage loans <strong>for</strong> capital adequacy and investment regulation).<br />
Government institutions can be either retail or wholesale in their activities. Retail<br />
institutions (housing banks) are typically depositories mandated to lend most of their<br />
funds to housing. As mortgage markets develop, however, a common problem with these<br />
institutions has been their crowding out of private market participants (particularly if their<br />
lending and fund raising is not well targeted).<br />
An alternative to the retail housing bank is the second-tier, or wholesale, institution<br />
(Exhibit 4). These institutions, referred to as liquidity, rediscounting or secondary<br />
mortgage facilities ("SMF"), are typically government owned or supported. They issue<br />
general obligation bonds in the capital markets and use the proceeds to refinance the<br />
portfolios of primary market lenders. 6 In the U.S., the Federal Home Loan Banks have<br />
been making collateralized loans to mortgage lenders since the 1930s. Similar institutions<br />
exist in France, India, Jordan, Malaysia and Switzerland. The securities issued by these<br />
institutions are general company obligations and usually not collateralized by the loans.<br />
Loans<br />
Figure 4<br />
Secondary <strong>Mortgage</strong> Facility<br />
<strong>Housing</strong> <strong>Finance</strong> with a Secondary<br />
<strong>Mortgage</strong> Facility<br />
Households<br />
Saving<br />
s<br />
Institutional<br />
Investors<br />
Banks and<br />
Savings<br />
Institutions<br />
Saving<br />
s<br />
Loans<br />
Countrywide <strong>International</strong> Consulting Services<br />
Secondary<br />
<strong>Mortgage</strong><br />
Facility<br />
Securities<br />
The use of one or more of these systems depends on the stage of development of a<br />
country's financial markets as well as government policies. <strong>Housing</strong> finance usually<br />
emerges as a retail activity. Wholesale funds mobilization develops if the banking system<br />
6 Refinance can be through over-collateralized loans or recourse purchase. In either case, the<br />
facility bears minimial credit risk from default on the underlying collateral. See Pollock, A.<br />
[1994].<br />
6
is constrained from supplying sufficient mortgage credit to meet demand or if capital<br />
market sources of funding are more cost effective. The issuance of securities is, however,<br />
premised on the existence of well developed capital markets. The creation of secondary<br />
market institutions has been motivated by the desire to expand the capital market finance<br />
of housing.<br />
Obstacles to the Development of <strong>Housing</strong> <strong>Finance</strong><br />
In many countries, the provision of housing finance is viewed as insufficient to meet the<br />
demands of households. Generally this means that mortgages are not attractive<br />
investments. The risks of providing long-term credit are a major reason why housing<br />
loans may not be attractive investment These risks include credit risk, funding risk,<br />
agency risk and political risk [Diamond and Lea, 1995].<br />
First, because mortgages are obligations of individuals, secured by property in a particular<br />
location, assessment of credit risk can be costly and time consuming. The ability of the<br />
lender to <strong>for</strong>eclose on loans in default in a reasonable time period with reasonable costs is<br />
a major determinant of credit risk.<br />
Second, even if credit risk is manageable, retail lenders may perceive significant funding<br />
risk in mortgage investment. To be af<strong>for</strong>dable, mortgages must be long term (typically 15<br />
or more years in maturity although with amortization and early repayment their duration<br />
is 5 to 7 years). Lenders with primarily short term liabilities are subject to significant<br />
liquidity risk if they allocate a substantial portion of their assets to mortgages. Also,<br />
mortgage borrowers may demand fixed rate loans. Lenders with primarily short term<br />
liabilities are subject to considerable interest rate risk if they invest in such loans (e.g.,<br />
U.S. savings and loans in the 1970s). Lenders with primarily long term liabilities, in turn,<br />
are subject to warehousing risk when assembling the pools. Long-term lenders are also<br />
more susceptible to inflation risk.<br />
Agency risk arises when a divergence of incentives between agents occurs. In mortgage<br />
lending, if the originator is different than the ultimate funder a divergence of incentives<br />
occurs between the lender (who is motivated to produce loans) and the risk bearer (who<br />
must bear the consequences of poorly underwritten loans). Agency risk also arises with<br />
the use of guarantees where the activities of the insured directly affect the exposure of the<br />
insurer. In the U.S., the high risk lending by some bankrupt savings and loans<br />
demonstrated the mortal hazard aspect of government deposit insurance.<br />
Political risk arises when the legal and political framework within which lending takes<br />
place changes. A change in the en<strong>for</strong>ceability of mortgage contracts (loan <strong>for</strong>giveness by<br />
the government) can discourage lenders. The presence of a state subsidized competitor(s).<br />
with preferential access to low cost (government subsidized) sources of funds can crowd<br />
out private lenders from the market by offering lower rates and/or better terms.<br />
Borrowers will often queue to receive below market rate loans, depriving private lenders<br />
offering market rate products a profitable customer base.<br />
Countrywide <strong>International</strong> Consulting Services<br />
7
Solutions to the Lack of <strong>Housing</strong> <strong>Finance</strong><br />
The proper solution to the perceived lack of mortgage lending depends on the primary<br />
cause of the market breakdown. In many countries, the lack of access to collateral by<br />
borrowers and lenders is the major barrier to expansion of housing finance. Without<br />
collateral, lenders are more reluctant to lend, housing loans are more expensive and<br />
borrowers do not benefit from the fixed asset they own. This can happen if clear title<br />
cannot be established or if the legal system does not allow <strong>for</strong>eclosure. Expansion of the<br />
housing finance system to lower and moderate income households is unlikely without a<br />
firm legal basis <strong>for</strong> collateralized lending.<br />
If lenders are reluctant to extend credit because of the costs of underwriting loans or the<br />
inability to achieve geographical diversification, a mortgage insurance system may<br />
stimulate more lending. Insurance can be provided by the government (the Federal<br />
<strong>Housing</strong> Administration or FHA in the U.S.) or the private sector. Insurance or security<br />
guarantees remove concern over the lack of standardization in or in<strong>for</strong>mation about<br />
mortgages <strong>for</strong> institutional investors and thus stimulate a SMM. However, in most cases<br />
mortgage insurance cannot offset the lack of collateral or inability to pay by many<br />
borrowers. Public insurance programs may result in a shifting of risk from the private to<br />
public sector and create disincentives <strong>for</strong> proper credit risk management.<br />
A SMF is appropriate if primary market lenders have poor access to the broader capital<br />
markets or concerns exist about their ability to manage interest rate or liquidity risk.<br />
Security issuance is a more efficient way of raising funds than individual loan sales. A<br />
SMF may be able to issue longer maturity bonds than individual institutions. If the<br />
institution is well capitalized (or supported by the government) it can achieve a higher<br />
credit rating on and lower cost funding <strong>for</strong> its activities than private issuers. A centralized<br />
institution may be able to issue securities with lower transactions costs. Issuance of a<br />
large volume of standardized securities can result in greater liquidity than issues of<br />
individual institutions.<br />
SMMs develop when true off-balance sheet financing is desired. Transfer of ownership<br />
enables lenders with relatively little capital to compete in the mortgage market. Although<br />
MBS can be issued by private sector concerns, they are complex, unique and costly to<br />
issue. In addition, the issuing entity still must confront the problems associated with<br />
introducing a new security and assuring investors of its liquidity and credit worthiness.<br />
The activities of governments (e.g., through state housing banks) are often justified as a<br />
way to lower the cost of credit to home builders and buyers. Subsidizing interest rates is<br />
costly and can crowd private lenders out of the market. More importantly, interest rate<br />
subsidies often miss the point as to why loan rates are high in the first place and – in the<br />
case of long-term loans – provide subsidies far beyond the initial period of af<strong>for</strong>dability<br />
constraints. Subsidized rates will not solve the credit risk problems faced by lenders in<br />
systems with inadequate legal protections. Also, they cannot overcome the problems<br />
Countrywide <strong>International</strong> Consulting Services<br />
8
associated with using the wrong kind of mortgage instruments (e.g., a long-term fixed<br />
rate mortgage in an inflationary environment). Fundamental advances in recent years in<br />
developing countries have been made through the use of alternative mortgage instruments<br />
(e.g., indexed mortgages) which balance the af<strong>for</strong>dability of mortgage credit with its<br />
profitability to the lender.<br />
Global Trends<br />
In the 6 years since the publication of the last edition of the <strong>Housing</strong> <strong>Finance</strong><br />
Sourcebook, there have been significant changes in the provision of housing finance<br />
around the world. There has been a major change in the macroeconomic environment in<br />
which housing finance institutions operate. Increased integration of the global economy<br />
now allows funds to flow more readily across national boundaries. A big step in this<br />
direction was taken by most of the countries in the European <strong>Union</strong> which adopted the<br />
common currency at the beginning of 1999. The issuance of mortgage-backed securities<br />
and mortgage bonds has expanded, facilitating greater access to funds <strong>for</strong> housing and<br />
providing a mechanism <strong>for</strong> cross-border investment in housing.<br />
Increased integration has resulted in greater volatility in local economies and housing<br />
finance systems as crises such as those that started in Thailand and Russia spread across<br />
the world. These pertubations have had significant effects on housing finance lenders,<br />
either through weakening of their balance sheets (often <strong>for</strong> reasons apart from the quality<br />
of their housing loan portfolios) and/or a drying up of funds, particularly long term funds<br />
suitable <strong>for</strong> mortgage lending.<br />
Despite the greater volatility, there are signs that housing finance is advancing on a global<br />
basis. <strong>Mortgage</strong> debt-to-GDP ratios have been rising, particularly in emerging markets.<br />
As shown in Figure 5, mortgage debt has been expanding relative to the size of the<br />
economy in many countries in Asia and Latin America, despite the volatility both regions<br />
experienced during the second half of the decade. The increases in Latin America are<br />
smaller with Argentina and Chile registering small increases but Brazil which was<br />
particularly affected by the crisis having a significant reduction in the ratio. Outside of<br />
South Africa, however, housing finance remains rather underdeveloped throughout<br />
Africa.<br />
The recent experience in developed countries is more mixed. The mortgage markets of<br />
the pheriphal countries of Europe (e.g., have grown rapidly reflecting the combined<br />
effects of liberalization and falling interest rates. The German mortgage market has also<br />
grown significantly relative to the growth of the economy, in part due to on-going<br />
reconstruction ef<strong>for</strong>ts in the <strong>for</strong>mer East Germany. The French market fell in relative size,<br />
in part due to a shift away from use of the mortgage as a legal instrument. The mature US<br />
mortgage market shrank slightly relative to the size of the economy. Despite its<br />
economic and financial sector problems, the Japanese market has grown relative to the<br />
economy during this period.<br />
Countrywide <strong>International</strong> Consulting Services<br />
9
15.00%<br />
10.00%<br />
5.00%<br />
0.00%<br />
-5.00%<br />
-10.00%<br />
-15.00%<br />
South Africa 93-99<br />
Australia 94-99<br />
Japan 93-98<br />
Korea 94-98<br />
Figure 5<br />
% Growth in <strong>Mortgage</strong> Debt/GDP in Selected Countries<br />
Malaysia 93-98<br />
Thailand 94-98<br />
Canada 94-99<br />
Mexico 93-97<br />
U.S. 94-99<br />
Jamaica 93-98<br />
Countrywide <strong>International</strong> Consulting Services<br />
Argentina 96-98<br />
Brazil 94-98<br />
Chile 94-98<br />
France 93-99<br />
Germany 94-99<br />
Italy 93-98<br />
Spain 93-99<br />
Sweden 93-99<br />
Global mortgage markets remain quite varied. Commercial and savings banks are the<br />
dominant lenders in most countries. The role played by specialized depository<br />
institutions has continued to decline, particularly in the UK and its <strong>for</strong>mer colonies as<br />
many building societies have converted to and/or been absorbed by commercial banks.<br />
Although securitization has become more important in recent years, as evidenced by the<br />
number of countries (at least 24 countries in 6 continents) that transactions have taken<br />
place over the past 6 years, in all countries outside of the US it remains an ancillary <strong>for</strong>m<br />
of finance. <strong>Mortgage</strong> banks remain important lenders in Europe and the US, but<br />
increasingly they are subsidiaries of larger financial groups headed by commercial<br />
(universal) banks. The new Basel capital accords may change the relative importance of<br />
mortgage bonds and mortgage-backed securities.<br />
A major emerging characteristic of mortgage markets is functional separation (or<br />
unbundling) in which specialists per<strong>for</strong>m the various functions underlying a mortgage<br />
loan.<br />
As shown in Figure 6, in the bundled model of mortgage lending a financial institution<br />
per<strong>for</strong>ms the major functions of origination, servicing, funding and portfolio risk<br />
management. These intermediaries may utilize the services of third-party vendors, such as<br />
mortgage insurers, appraisers and credit agencies. However, a single firm accomplishes<br />
the primary functions. The portfolio lender originates a mortgage to a homebuyer,<br />
services it and per<strong>for</strong>ms the pipeline risk management and portfolio management<br />
functions, including funding. Portfolio lenders may be specialized institutions such as<br />
savings and loans, building societies or European-style mortgage banks, or generalpurpose<br />
depository institutions (commercial banks, savings banks).<br />
Figure 6: The Bundled Home <strong>Mortgage</strong> Delivery System<br />
U.K. 94-99<br />
1 0
Borrowers<br />
Bundled <strong>Mortgage</strong> <strong>Finance</strong><br />
Model<br />
Portfolio<br />
Lender<br />
Originate<br />
Service<br />
Manage<br />
Risk<br />
Fund<br />
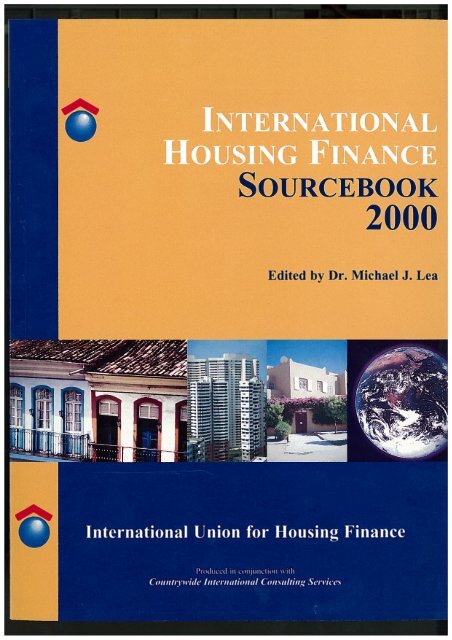
Figure 7 shows the unbundled mortgage delivery system characteristic of a secondary<br />
mortgage market. In this model the functions of origination, servicing, risk management<br />
and funding are unbundled and provided by different specialized entities.<br />
Countrywide <strong>International</strong> Consulting Services<br />
Deposits<br />
Figure 7: <strong>Unbundled</strong> <strong>Mortgage</strong> Delivery System<br />
<strong>Unbundled</strong> <strong>Mortgage</strong> <strong>Market</strong><br />
Borrower Retail Channel<br />
Inte<br />
rnet<br />
<strong>Mortgage</strong><br />
Intermediary<br />
Corres - Corres<br />
pondent<br />
-<br />
pondent<br />
Functions<br />
Wholesale<br />
<strong>Mortgage</strong><br />
Banker<br />
Closing<br />
Pooling<br />
Shipping<br />
Delivery<br />
<strong>Market</strong>ing Processing Underwriting Closing<br />
Warehousing<br />
Credit<br />
Enhance-<br />
ment<br />
Bonds<br />
Investor<br />
(Conduit<br />
or<br />
Final) Servicing<br />
Risks Pipeline Risk & Credit Risk Credit Risk Portfolio<br />
Mgt . Mgt . Risk Mgt .<br />
For example, mortgage origination is no longer confined to retail branches of financial<br />
institutions, although they remain important distribution channels. <strong>Mortgage</strong><br />
intermediaries (introducers, brokers) are increasingly important in many markets. These<br />
entities may be specialists in mortgage origination or originate mortgages in conjunction<br />
with other activities such as real estate brokerage, providing financial advisory services or<br />
building homes. The functions they per<strong>for</strong>m may also vary. Most intermediaries in the<br />
UK <strong>for</strong> example, are mainly marketing agents, providing referrals and loan applications<br />
whereas in the US many mortgage brokers process applications and package loan files.<br />
Correspondent lenders close loans in their own name (but underwritten to the<br />
specifications of the ultimate investor) and immediately sell them to larger, wholesale<br />
lenders that can get better execution upon sale in the secondary market. The Internet is<br />
rising in importance in mortgage lending but primarily as an adjunct to existing<br />
1 1
distribution channels. “Pure” Internet origination has not yet proven itself as a standalone<br />
channel as it depends on other channels <strong>for</strong> fulfillment.<br />
The institution that originates the loan may or may not be the one that services it. In<br />
recent years, mortgage servicing has become much more consolidated in the US, with the<br />
top 10 servicers administering over 40% of the market. Various aspects of servicing,<br />
such as arrears management have become even more specialized, as the importance of<br />
this function has risen with the advent of the sub-prime mortgage market in developed<br />
markets such as Australia, UK and US. Outsourcing of administrative functions, whether<br />
by commercial banks or specialist lenders is also becoming more commonplace.<br />
In the unbundled model there are a wide variety of investors in housing loans, ranging<br />
from depositories (investing in loans originated and serviced by others) to mutual funds.<br />
In the global market they may be either domestic or <strong>for</strong>eign. Credit risk management is<br />
often specialized as well, provided by third parties such as mortgage insurance or bond<br />
insurance companies (public or private) <strong>for</strong> the benefit of investors.<br />
What are the main drivers of unbundling? Two major factors are competition and<br />
technology. <strong>Housing</strong> finance is becoming a more competitive business on a daily basis,<br />
creating spread compression and incentives to cut cost. Administrative activities like<br />
servicing lend themselves to automation and scale economies that can be achieved<br />
through consolidation and outsourcing. Improved and more timely access to in<strong>for</strong>mation<br />
facilitates monitoring of agent behavior, reducing both cost and risk associated with<br />
unbundling.<br />
What does the future hold <strong>for</strong> housing finance? In countries in which the legal and<br />
institutional framework has been established, housing finance will grow and become<br />
more competitive. Mainstream lenders like commercial banks will increasingly look to<br />
housing finance as an important service to provide their customers. Securitization will<br />
become more widespread as lenders look to diversify funding sources, in<strong>for</strong>mation on<br />
mortgage per<strong>for</strong>mance improves and investors become more knowledgeable.<br />
Consolidation of back office functions will increase in developed markets as will the use<br />
of multiple channels of distribution.<br />
In countries with undeveloped housing finance systems, emphasis must be placed on<br />
creating the proper infrastructure <strong>for</strong> a sustainable system. The two most important<br />
ingredients are a sound legal infrastructure and stable economy. If these are in place, a<br />
primary mortgage market can grow and prosper bringing the promise of homeownership<br />
closer <strong>for</strong> all.<br />
References<br />
1. Boleat, M., National <strong>Housing</strong> <strong>Finance</strong> Systems: A Comparative Study, London, Croon-Helm<br />
Ltd, 1985.<br />
Countrywide <strong>International</strong> Consulting Services<br />
1 2
2. Diamond, D.B. and M.J. Lea, "<strong>Housing</strong> <strong>Finance</strong> in Developed Countries: An <strong>International</strong><br />
Comparison of Efficiency" Journal of <strong>Housing</strong> Research, 3,1, 1992a.<br />
3. Diamond, D.B. and M. J. Lea, "The Decline of Special Circuits in Developed Country<br />
<strong>Housing</strong> <strong>Finance</strong>", <strong>Housing</strong> Policy Debate, 3,3, 1992b.<br />
4. Diamond, D.B. and M.J. Lea, "Sustainable Financing <strong>for</strong> <strong>Housing</strong>", Fannie Mae Office of<br />
<strong>Housing</strong> Research Working Paper, 1995.<br />
5. DÜBEL, A., “Separating Homeownership Subsidies from <strong>Finance</strong>: Traditional<br />
<strong>Mortgage</strong> <strong>Market</strong> Policies, Recent Re<strong>for</strong>m Experiences and Lessons <strong>for</strong> Subsidy<br />
Re<strong>for</strong>m”, Land and Real Estate Initiative Research Papers, Background Series # 14,<br />
The World Bank, Washington, D.C., 2000.<br />
6. Hardt, J. and D. Manning, “European <strong>Mortgage</strong> <strong>Market</strong>s: Structure, Funding and Future<br />
Development”, European <strong>Mortgage</strong> Federation, June 2000<br />
7. Lea, M.J., "The Applicability of Secondary <strong>Mortgage</strong> <strong>Market</strong>s to Developing Countries",<br />
<strong>Housing</strong> <strong>Finance</strong> <strong>International</strong>, 8, 3, March 1994.<br />
8. Lea, M.J., “Models of Secondary <strong>Mortgage</strong> <strong>Market</strong> Development”, in M. Watanabe, ed.,<br />
New Directions in Asian <strong>Housing</strong> <strong>Finance</strong>, <strong>International</strong> <strong>Finance</strong> Corporation, 1998<br />
9. Lea, M.J., “Prerequisites <strong>for</strong> a Successful Secondary <strong>Mortgage</strong> <strong>Market</strong>: The Role of the<br />
Primary <strong>Mortgage</strong> <strong>Market</strong>”, <strong>Housing</strong> <strong>Finance</strong> <strong>International</strong>, 15, 2 December 2000.<br />
10. Lea, M.J. and S. Bernstein, ed., <strong>Housing</strong> <strong>Finance</strong> Sourcebook: 1995, <strong>International</strong> <strong>Union</strong> <strong>for</strong><br />
<strong>Housing</strong> <strong>Finance</strong>, 1995<br />
11. Pollock, A., “Simplicity Versus Complexity in the Evolution of <strong>Housing</strong> <strong>Finance</strong> Systems”,<br />
<strong>Housing</strong> <strong>Finance</strong> <strong>International</strong>, 8, 3, March 1994.<br />
Countrywide <strong>International</strong> Consulting Services<br />
1 3
AFRICA AND MIDDLE EAST<br />
Countrywide <strong>International</strong> Consulting Services<br />
1 4
Regional Summary<br />
Sub-Saharan Africa<br />
Sub-Saharan Africa as a whole is an impoverished region where there is very little <strong>for</strong>mal<br />
housing finance. The region is experiencing economic difficulties, including volatile and<br />
predominantly rising inflation rates over the last decade, as well as high rates of<br />
unemployment. Political instability and centrally controlled industry contribute to these<br />
problems. Standards of living are low and actually declining in some countries.<br />
Homeownership rates are high, reflecting a relatively low rate of urbanization and high<br />
level of in<strong>for</strong>mal housing in most countries. The lack of <strong>for</strong>mal title registration and<br />
communal property ownership traditions in many countries inhibit the use of property as<br />
collateral <strong>for</strong> lending. <strong>Housing</strong> stock shortages are also prevalent throughout the region<br />
with far fewer new homes constructed each year than are needed.<br />
In<strong>for</strong>mal finance of housing is common in Africa whether it is through relatives lending<br />
money or unorganized and unregulated small-scale financing. Although the region has<br />
institutions with the potential to provide funding <strong>for</strong> housing, the low-income levels and<br />
the risk associated with such lending are major inhibitors to the development of mortgage<br />
markets. As a result, mortgage debt-to-GDP ratios outside of South Africa are extremely<br />
low. South Africa with a mortgage debt-to-GDP ratio of 26% and US$ 32,736 in<br />
mortgages outstanding is the lone exception.<br />
Ef<strong>for</strong>ts are underway to help develop the mortgage markets in Africa. In South Africa,<br />
companies such as Gateway and the Home Loan Guarantee Corporation, focus on<br />
relieving financial institutions from some of the risk associated with default and long<br />
term finance in an ef<strong>for</strong>t to promote home financing <strong>for</strong> the lower economic strata.<br />
Ef<strong>for</strong>ts are also underway to nurture secondary mortgage markets and securitization.<br />
Middle East and North Africa<br />
The economies of the Middle East and North Africa have been improving in recent years<br />
as evidenced by declining inflation rates and increasing rates of GDP growth.<br />
Throughout the region there has been a move towards freer markets and less state<br />
intervention in the economy. Unemployment rates remain high however and have been<br />
increasing in Israel and Jordan. All countries in the region have high rates of<br />
homeownership.<br />
<strong>Housing</strong> finance is relatively undeveloped in the Middle East and North Africa, reflecting<br />
highly conservative attitudes towards debt finance on the part of borrowers and lenders<br />
alike. A lack of long term finance and extreme concern about liquidity risk are major<br />
inhibitors to growth of the sector. Israel has the largest mortgage market in this region,<br />
due primarily to a high level of government involvement. In other countries, housing<br />
finance is just beginning to develop.<br />
In Turkey <strong>for</strong> example, private housing finance only emerged in 1999 as inflation rates<br />
declined. Outstanding mortgages are approximately $US 821 million, less than 1% of<br />
Countrywide <strong>International</strong> Consulting Services<br />
1 5
Gross Domestic Product. <strong>Housing</strong> finance has also begun to develop in Jordan, spurred<br />
by deregulation and creation of a liquidity facility to provide long term funds. Jordan’s<br />
outstanding mortgage debt is US$ 426 million, and it is 11% of GDP.<br />
Countrywide <strong>International</strong> Consulting Services<br />
1 6
ALGERIA<br />
Economic Background<br />
Year Exchange Rate<br />
Dinar/US$<br />
Consumer Price<br />
Index<br />
Countrywide <strong>International</strong> Consulting Services<br />
Change In<br />
Consumer Prices<br />
Dinar US$<br />
Nominal GDP<br />
(Millions)<br />
Nominal GDP<br />
(Millions)<br />
1990 12.19 29.34 16.62% 555,700 45,587<br />
1991 21.39 36.94 25.89% 843,700 39,444<br />
1992 22.78 48.63 31.67% 1,045,100 45,878<br />
1993 24.12 58.62 20.54% 1,162,100 48,180<br />
1994 42.89 75.65 29.05% 1,471,400 34,306<br />
1995 52.18 100.00 32.18% 1,961,700 37,595<br />
1996 56.19 121.65 21.65% 2,501,000 44,510<br />
1997 58.41 126.32 3.84% 2,613,550 44,745<br />
1998 60.35 132.64 5.00% 2,552,805 42,300<br />
1999* 69.31 136.08 2.60% 3,299,156 47,600<br />
The economy in Algeria is largely tied to the oil and gas sectors; however, recent<br />
economic expansion is attributed to recent investment in an expanding hydrocarbon<br />
sector. Approximately one fourth of the country’s GDP comes from the hydrocarbon<br />
sector. This industry accounts <strong>for</strong> more than half of Algeria’s budget revenues and over<br />
95% of export earnings. Total GDP was estimated at US$ 45.5 billion in 1990 but<br />
decreased to US$ 37.5 billion by 1995. The 1999 estimate of GDP was approximately<br />
US$ 47.6 billion.<br />
Inflation has tended to be extremely high in Algeria. IMF statistics indicate that while<br />
inflation in 1997 was at 3.8%, the country began the decade with 16.6% in 1990, peaked<br />
at 32.2% in 1995, and remained over 20% in every other year throughout the 1990s.<br />
Estimates indicate that the unemployment rate was at 30% in 1998. Of an approximate<br />
labor <strong>for</strong>ce of 7.8 million, 29.5% work <strong>for</strong> the government, compared to 16.2% working<br />
in construction and public works. There is little in<strong>for</strong>mation regarding interest rates in<br />
Algeria. In 1997, the Treasury bill rate was 18% the money market rate was 11.8% , and<br />
the fixed lending rate approximately 12%.<br />
<strong>Housing</strong> <strong>Market</strong><br />
Algerians have experienced a deteriorating quality of living standards. A poverty<br />
assessment by the Government of Algeria between 1988-95 indicates that poverty<br />
increased from 8% to 14% during the period. Although poverty is mainly centralized in<br />
urban regions, it has become a national concern. More than half of the households in<br />
Algeria were classified as low-income by 1996.<br />
1 7
Year Population (Millions) Owner Occupancy Total Dwelling Stock<br />
(Millions)<br />
Countrywide <strong>International</strong> Consulting Services<br />
<strong>Housing</strong> Starts*<br />
1990 25.02 19,740 3.00 88,100<br />
1991 25.64 10,920 3.08 65,300<br />
1992 26.27 13,700 3.15 88,000<br />
1993 26.89 8,500 3.24 80,100<br />
1994 27.50 44,000 3.32 118,700<br />
1995 28.06 57,100 3.44 161,000<br />
1996 28.57 56,700 3.60 132,200<br />
1997 29.05 51,100 3.80 161,700<br />
1998 29.80 52,388 3.90 164,660<br />
1999 31.10 55,038 4.10 171,867<br />
Source: Ministry of Construction<br />
<strong>Housing</strong> stock grew from approximately 3 million in 1990, to over 4 million by 1999<br />
(approximately 1.34% of which was owner occupied). In 1993, there were 15,700<br />
households being rented, compared to 66,670 in 1999. <strong>Housing</strong> completions have<br />
increased substantially since 1990, from an estimated 65,000 completions in 1991 to over<br />
171,000 by 1999. This increasing demand in the housing sector is greatly due to many<br />
low-income social housing programs initiated by the Government of Algeria. In fact, the<br />
government seeks to provide expansion of the housing market in the four major cities of<br />
Algiers, Oran, Constantine, and Annaba. Shortages in housing units available became a<br />
major concern in 1993, due to a shortage of construction materials such as cement.<br />
<strong>Mortgage</strong> <strong>Market</strong><br />
The mortgage instrument used is a standard 20-year, amortizing fixed rate instrument. In<br />
addition, it assumes a 25% payment-to-income ratio. The mid-range incomes are from<br />
20% to 70% deciles (approximately 10,483 Dinar to 14,153 Dinar per month).<br />
Assuming a payment-to-income ratio of 25% the maximum monthly loan payment would<br />
be 2,621 Dinar to 3,538 Dinar. At a fixed 13% amortizing loan rate, the typical loan range<br />
would be approximately 224,000 Dinar –to302,000 Dinar.<br />
Policy Developments<br />
� In 1992, a new Minister of <strong>Housing</strong> was appointed and charged with the responsibility<br />
of urban development, in addition to the typical oversight of construction.<br />
� In June of 1998, the World Bank approved a US$ 150 million loan to the Government<br />
of Algeria <strong>for</strong> low-income housing. This program will seek to improve the lives and<br />
living standards of more than 300,000 people over a ten-year period.<br />
� The Government of Algeria has created a proposal that seeks to help create jobs and<br />
increase the income <strong>for</strong> unemployed individuals via short-term employment<br />
opportunities. This project, if approved, will be implemented between FY01-04.<br />
Sources and References<br />
1. World Bank, http://www.worldbank.org/<br />
2. CIA World Fact Book 1999 - Algeria<br />
1 8
3. Bernstein, Steven. “The Algerian <strong>Housing</strong> <strong>Market</strong> and the Algerian <strong>Mortgage</strong><br />
Refinance Corporation: A Brief Overview of the Statistics.” August 3, 1998<br />
Countrywide <strong>International</strong> Consulting Services<br />
1 9
BOTSWANA<br />
Economic Background<br />
Year Exchange<br />
Rate<br />
Pular/ US$<br />
Consumer<br />
Price<br />
Index<br />
Countrywide <strong>International</strong> Consulting Services<br />
Change In<br />
Consumer<br />
Prices<br />
Pular US$<br />
Nominal GDP<br />
(Millions)<br />
Nominal GDP<br />
(Millions)<br />
1990 1.87 55.14 11.40% 6,490.70 3,470.96<br />
1991 2.07 61.63 11.77% 7,496.50 3,621.50<br />
1992 2.26 71.60 16.17% 8,298.60 3,671.95<br />
1993 2.56 81.86 14.33% 9,045.40 3,533.36<br />
1994 2.72 90.49 10.54% 10,972.50 4,034.01<br />
1995 2.82 100.00 10.51% 12,252.00 4,344.68<br />
1996 3.64 110.08 10.08% 14,201.80 3,901.59<br />
1997 3.81 119.59 8.64% 17,485.70 4,589.42<br />
1998 4.46 127.56 6.66% 20,363.10 4,565.72<br />
1999 4.63 136.65 7.13% 23,258.90 5,023.52<br />
Source: IMF<br />
Previously a British Protectorate, Botswana became a Democratic Republic in 1966. The<br />
country is faced with poverty and unemployment, and it is working towards improving<br />
the quality of life <strong>for</strong> its people. According to the World Bank, Botswana is one of very<br />
few African States classified as a lower, middle-income country.<br />
As of 1997, approximately 80% of the people in Botswana made their livelihood from the<br />
agricultural sector. However, diamond mining and tourism are growing contributors to<br />
the economy. In fact, mining currently contributes 33% of the Botswana GDP, compared<br />
to 1% at the time of the country’s independence from Britain.<br />
GDP has generally experienced an increasing trend during the 1990s. In 1990, GDP was<br />
valued at approximately US$ 3.47 billion, as compared to US$ 4.34 billion in 1995. It<br />
finished out the decade with just over US$ 5 billion <strong>for</strong> 1999. Botswana had one of the<br />
stronger sub-Saharan economies the second half of the decade.<br />
Inflation has displayed a decreasing trend, more noticeably between 1997-99. Inflation<br />
peaked at 16.17% in 1992, and it remained in double-digits through 1996. Inflation<br />
registered at slightly more than 7% <strong>for</strong> 1999. Unemployment is very high in Botswana.<br />
Estimates report that with an approximate population of 1.57 million people, 21% of the<br />
total labor <strong>for</strong>ce is unemployed. In 1995 it was estimated that 100,000 people worked in<br />
the public sector, and 135,000 in the private sector. Approximately 15% of the labor<br />
<strong>for</strong>ce were employed in construction in 1997.<br />
<strong>Housing</strong> <strong>Market</strong><br />
As of mid 1999, the median age in Botswana was registered at 18.2 years and an average<br />
household size of 3.56 (which translates to a demand of 11,979 new units per year).<br />
These two statistics indicate a possible explosion in housing demand.<br />
2 0
The housing sector can be divided into two sectors; urban centers and rural areas,<br />
including major villages. Rural housing is mainly owner-occupied, while urban regions<br />
are limited to investment. Hundreds of plots are left untouched and open to individual<br />
buyers. However, several urban development projects are in-process or under<br />
consideration.<br />
The government generated nearly all of construction in Botswana. By 1995, the total<br />
stock estimate was 904,525 units.<br />
<strong>Mortgage</strong> <strong>Market</strong><br />
Private funding is the most important source of financing <strong>for</strong> residential housing in<br />
Botswana, while, the government is the main source of finance <strong>for</strong> urban housing. The<br />
Government of Botswana provides building material loans to the Self Help <strong>Housing</strong><br />
Association (SHHA), and mortgage loan guarantee schemes through the Botswana<br />
Building Society. The SHHA has been plagued with high building material loan defaults<br />
and a lack of administrative organization. There are other institutions in the housing<br />
finance sector including:<br />
� Botswana Savings Bank – These banks are operated through the Post Offices<br />
throughout the country. The target market is civil workers.<br />
� Botswana <strong>Housing</strong> Corporation – Sells houses to individuals under the Tenant<br />
Purchase Scheme, in which the tenant is allowed to use his monthly rent towards the<br />
buying of the property.<br />
� Commercial Banks – There are five commercial banks in the country, all of which<br />
are major contenders in the home financing sector.<br />
� Employer Organizations – Some employers opt to offer loans exclusively to their<br />
employees, <strong>for</strong>ming a substantial portion of the market.<br />
Interest rates tend to be slightly above the prime lending rate, which is determined by the<br />
Central Bank. Private lending institutions, however, can set their own rates. These<br />
originators typically generate interest rates ranging from 0.5% to 1.5% above the prime<br />
lending rate. <strong>Mortgage</strong> lenders in Botswana provide loans <strong>for</strong> purchasing homes,<br />
refinancing, improving homes, and <strong>for</strong> developing commercial and industrial properties.<br />
Additionally, the mortgage market is composed of housing schemes, which are programs<br />
Income<br />
Category<br />
Poor/<br />
Unemployed<br />
Low Income<br />
Urban<br />
Middle<br />
Income Lower<br />
Middle<br />
Income Upper<br />
& High<br />
Income<br />
Income<br />
Range<br />
(Pula/year)<br />
below P$<br />
1,800<br />
P$1800-<br />
10,000<br />
P$10,001-<br />
16,000<br />
P$16,001 &<br />
above<br />
<strong>Housing</strong><br />
Scheme<br />
Integr. Poverty<br />
Alleviation<br />
SHHA<br />
<strong>Housing</strong><br />
Associations<br />
BHC<br />
designed <strong>for</strong> the financing of various income levels.<br />
Countrywide <strong>International</strong> Consulting Services<br />
2 1
Policy Developments<br />
The government’s long-term policy is to ensure safe and sanitary housing <strong>for</strong> all. It plans<br />
to build new urban houses in a short time so that no individual is <strong>for</strong>ced to live in an<br />
illegal settlement. Additionally, the government plans to improve the quality of housing<br />
in rural areas by implementing a modified version of the Self-Help scheme.<br />
Sources and References<br />
1. World Bank, www.worldbank.org<br />
2. CIA World Fact Book 1999 - Botswana<br />
3. Botswana Building Society<br />
Countrywide <strong>International</strong> Consulting Services<br />
2 2
EGYPT<br />
Economic Background<br />
Year Exchange<br />
Rate<br />
E£ / US$<br />
Consumer<br />
Price<br />
Index<br />
Countrywide <strong>International</strong> Consulting Services<br />
Change In<br />
Consumer<br />
Prices<br />
Egyptian £ US$<br />
Nominal GDP<br />
(Millions)<br />
Nominal GDP<br />
(Millions)<br />
1990 2.00 52.37 16.76% 96,100 48,050<br />
1991 3.33 62.72 19.75% 111,200 33,393<br />
1992 3.34 71.27 13.64% 139,100 41,647<br />
1993 3.37 79.88 12.09% 157,300 46,677<br />
1994 3.39 86.40 8.15% 175,000 51,622<br />
1995 3.39 100.00 15.74% 205,000 60,472<br />
1996 3.39 107.19 7.19% 228,300 67,345<br />
1997 3.39 112.15 4.63% 256,250 75,590<br />
1998 3.39 116.83 4.18% 280,220 82,661<br />
1999 3.41 120.43 3.08% 302,300 88,651<br />
Source: IMF<br />
At the beginning of the 1990s, Egypt was plagued by low productivity, high population<br />
growth, high inflation, and poor economic management. In 1991, the Government of<br />
Egypt set out to trans<strong>for</strong>m the economy from a state-owned system to a market oriented<br />
environment. The goals were to shift investments from the public to private, and increase<br />
<strong>for</strong>eign investment.<br />
Gross Domestic Product has grown steadily since 1999, and it is mainly generated<br />
through the agricultural sector. GDP registered at approximately US$ 33.4 billion in<br />
1991, US$ 60.4 billion by 1995, and finished out the decade with approximately US$<br />
88.6 billion in 1999.<br />
Inflation has increased since the economic re<strong>for</strong>ms initiated in 1991. In 1991, <strong>for</strong><br />
example, prices were well over 19% higher than the previous year. This trend decreased<br />
steadily <strong>for</strong> most of the decade, with the exception to 1995, when inflation rose slightly to<br />
15.74%. Inflation reached a low of 3.08% in 1999.<br />
Based on limited available data, interest rates have been declining. Ranging from three<br />
months to one year, the T-bill yields declined from approximately 18% at the beginning<br />
of the decade to 8.80% by 1997. Additionally, the deposit rate was at 12% from 1990-<br />
1993, and has settled below 10% since 1997.<br />
<strong>Housing</strong> <strong>Market</strong><br />
At the beginning of 1990, housing remained inadequate, dwellings were overcrowded,<br />
and many Egyptians lived in makeshift accommodations. Throughout the second half of<br />
the decade, however, Egypt experienced a construction boom resulting from the extreme<br />
demand <strong>for</strong> housing and the liberalization of <strong>for</strong>eign investment. Growth in the sector<br />
has and will continue to be spurred by a government plan to invest up to E£ 16 billion on<br />
new housing and E£ 13 billion on land reclamation between 1997-2003.<br />
2 3
With an annual rate of population growth of about 2.3%, it is estimated that Egypt adds<br />
about 1.4 million new citizens each year. To maintain the current average size household<br />
of 4.8, additional 300,000 housing units are being created on net, roughly each year. In<br />
1998, the Ministry of <strong>Housing</strong>, Utilities and New Communities estimated that about<br />
180,000 new units were built and <strong>for</strong>mally licensed. The remainder, about 120,000 units,<br />
was probably added in<strong>for</strong>mally, either through urban squatter construction, encroachment<br />
on agricultural land in rural areas, or by adding units on top of existing structures.<br />
Of the 180,000 <strong>for</strong>mal sector units, 122,000 or about 68% were classified as “low cost or<br />
economic” indicating that they were smaller than 60 square meters and usually occupied<br />
by households in the two lowest income ranges, with incomes under about E£ 9,000 and<br />
E£ 18,000 respectively. Based on available data, about half of these low cost units were<br />
build under the auspices of on-going subsidized housing program of the government.<br />
Approximately 33,000 units were in the middle income range, about 100 square meters in<br />
size costing about E£ 100,000 and appealing to households making about E£ 2,000 per<br />
month. Another 14,000 were in the upper-middle income range and cost about E£<br />
150,000-200,000.<br />
The secondary market in existing housing units is very fragmented and in<strong>for</strong>mal, but is<br />
probably significant in aggregate size. It has taken on much greater significance since<br />
1995 in response to (1) the decline in inflation and rise in real interest rates and (2) the<br />
end of rent controls on new rental contracts. These shifts have encouraged investors<br />
holding empty flats to rent them out or to sell them. Demand has been boosted by rising<br />
real incomes, particular among the urban middle class. These increases have been aided<br />
by the continuing privatization of the economy encouraging creation of more efficient<br />
enterprises and productive jobs and the ending of rent control.<br />
<strong>Mortgage</strong> <strong>Market</strong><br />
The most common <strong>for</strong>m of finance <strong>for</strong> non-subsidized units is all cash. Often, a deposit<br />
of 50% is complemented by installment payments scheduled over 3-5 years. Many<br />
commercial banks, and the government-owned <strong>Housing</strong> Development Bank and Egypt<br />
Arab Land Bank make some loans to individuals on commercial terms. Banks finance<br />
loans to developers that are paid off by installment of final buyers. There is no data on<br />
either of these activities, but it is considered to be less than E£ 1-2 billion per year, out of<br />
a total bank loan portfolio of LE 220 billion that is growing by E£ 40 billion a year.<br />
The banking system in Egypt consists of more than 80 banks, which fall under control of<br />
the Central Bank and include 28 commercial and 32 investment institutions. There are<br />
three banks that specialize in housing finance: Credit Foncier Egyptien (CFE), Real<br />
Estate Arab Bank, and the <strong>Housing</strong> Development Bank (HDB). The <strong>Housing</strong> and<br />
Development Bank is state-owned, Joint stock company. It grants loans mainly to<br />
companies, housing societies, and individuals that are seeking to build apartment<br />
complexes.<br />
Individual loans are available <strong>for</strong> as long as 7 years, at rates in the range of 14-15%. The<br />
minimum required downpayment is usually 40-50%, and the average LTV is about 20-<br />
Countrywide <strong>International</strong> Consulting Services<br />
2 4
30%. The current rates imply a gross margin of only 3 percent over the cost of funds,<br />
which is relatively low <strong>for</strong> a developing country.<br />
The main limitation on the housing finance market is the absence of a proper mortgage<br />
law. It is considered highly unlikely under current law that a lender can ever gain vacant<br />
possession of an owner-occupied property in the case of default. That is why most<br />
lending is in the <strong>for</strong>m of financing installment payments over 3-5 years, with the builder<br />
retaining title until all payments are made.<br />
Until recently, lenders managed to moderate their credit risk by requiring that post-dated<br />
checks be provided. Failure of a check to be covered was a criminal offense and<br />
relatively easy to prosecute. However, the law was changed in 1999 to end this practice<br />
in late 2000, and this has heightened the interest in passing a comprehensive mortgage<br />
law as soon as possible. The possibility of such as law has also been strengthened by the<br />
recent increase in interest of commercial banks, particularly the private banks in retail<br />
lending in general.<br />
Sources and References<br />
1. Diamond, D., Country Summary May 15, 2000<br />
2. World Bank, www.worldbank.org<br />
3. CIA World Fact Book 1999 - Egypt<br />
4. <strong>International</strong> <strong>Finance</strong> Corporation<br />
5. <strong>Housing</strong> and Development Bank – Egypt<br />
6. Arab World Online www.awo.net<br />
7. National Bank of Egypt<br />
8. National U.S. – Arab Chamber of Commerce<br />
9. USAID<br />
Contacts<br />
1. Duff and Phelps FINBI<br />
Dr. Amr Hassanein<br />
8 el Sad Aali St.<br />
Dokki, Giza Egypt<br />
Tel: 20-2-349-5616<br />
Fax: 20-2-349-6184<br />
2. Citibank Consumer Bank<br />
C.P. Janardhan<br />
2 Abdul Kader Hamza St. 14th Fl,<br />
Garden City, Cairo Egypt,<br />
Tel: 20-2-594-2786<br />
Fax: 20-2-594-3061<br />
Countrywide <strong>International</strong> Consulting Services<br />
2 5
GHANA<br />
Economic Background<br />
Year Exchange<br />
Rate<br />
Cedis/ US$<br />
Consumer Price<br />
Index<br />
Countrywide <strong>International</strong> Consulting Services<br />
Change In<br />
Consumer<br />
Prices<br />
Cedis US$<br />
Nominal GDP<br />
(Millions)<br />
Nominal GDP<br />
(Millions)<br />
1990 344.83 30.94 37.26% 2,031,690 5,891.86<br />
1991 390.63 36.52 18.03% 2,427,530 6,214.40<br />
1992 520.83 40.19 10.06% 2,802,870 5,381.54<br />
1993 819.67 50.22 24.96% 3,674,850 4,483.33<br />
1994 1,052.63 62.71 24.87% 4,950,380 4,702.87<br />
1995 1,449.28 100.00 59.46% 7,417,990 5,118.40<br />
1996 1,754.39 146.56 46.56% 10,384,500 5,919.15<br />
1997 2,272.73 187.43 27.89% 14,133,400 6,218.69<br />
1998 2,325.58 214.84 14.62% N/A N/A<br />
1999 34,448 N/A N/A N/A N/A<br />
Source: IMF<br />
In 1957, Ghana became the first country in sub-Saharan Africa to become liberated from<br />
colonialism. In the late 1970s, Ghana endured military takeovers that were indicative of<br />
what was to follow in the rest of the region. Recent decades, however, have consisted of<br />
great development and economic re<strong>for</strong>m, including the introduction of a new Constitution<br />
in 1992.<br />
Ghana’s economy is based mainly on agriculture, which contributes more than 40% to<br />
GDP. Cocoa, timber and pineapples are the main crops. However, mining has become a<br />
rapidly growing sector as a source <strong>for</strong> <strong>for</strong>eign exchange. Additionally, the construction<br />
sector maintained a market share of GDP between 10%-20% between 1992-98.<br />
GDP experienced an overall-increasing trend throughout the 1990s, with the exception of<br />
1992-94. In 1991, Ghana registered an approximate GDP of US$ 6.2 billion, but by<br />
1993, GDP had decreased to approximately US$ 4.4 billion. GDP has increased since<br />
then, and by 1997, Ghana achieved a GDP of approximately US$ 6.2 billion.<br />
Inflation has been extremely high within the country. Based on 1995 prices, inflation<br />
registered at 37.3% in 1990, 59.5% in 1995, and in 1998 was still well over 14%. The<br />
government of Ghana offers T-bills, which have varied in rates throughout the 1990s. Tbills<br />
earned close to 30% in 1990, over 41% in 1995, and 26.4% by 1997. The labor<br />
<strong>for</strong>ce (by occupation) is 61% agriculture and fishing, 10% industry, and 29% services. A<br />
1997 estimate indicates that the unemployment is very high, registering at approximately<br />
20%.<br />
<strong>Housing</strong> <strong>Market</strong><br />
<strong>Housing</strong> in Ghana is concentrated in urban settings. Approximately 50% of urban<br />
households are rented, 10% to 25% are owner-occupied, and less than 10% live in<br />
employer owned-housing. Additionally, the rent to income ratio is between 30%-40%.<br />
Currently, 25,000 units are being produced annually.<br />
2 6
The bulk of the demand <strong>for</strong> houses is in the US$ 10,00 – US$ 12,500 ranges.<br />
Additionally, the costs of houses typically include the costs of developing the necessary<br />
infrastructure (paved roads, drains, electricity and water supply).<br />
Expansion in the housing market is largely due to the introduction of housing finance in<br />
1992. Private investment remains the key source of construction projects in the country.<br />
Prior to housing finance, the housing market was restricted by the following: lack of longterm<br />
finance, difficulty of establishing clear title to land, lacking infrastructure, lack of<br />
construction finance, presence of rent control, and government ownership of a large<br />
portion of the <strong>for</strong>mal housing stock.<br />
<strong>Mortgage</strong> <strong>Market</strong><br />
Created in the early 1990s, the <strong>Housing</strong> <strong>Finance</strong> Company (HFC) was established by the<br />
Government of Ghana, with the assistance of the World Bank. Comprised of a<br />
partnership between the Merchant Bank of Ghana, the Social Security and National<br />
Insurance Trust, and the Government of Ghana, the company was designed with the<br />
purpose of improving the quality of life <strong>for</strong> its inhabitants via af<strong>for</strong>dable housing.<br />
Since 1991, the HFC has developed a loan portfolio of 2100 cumulative originations,<br />
equaling an outstanding mortgage debt of approximately US$ 20 million. Four general<br />
housing schemes have been developed by the HFC:<br />
� The Pilot Scheme – This is the most common scheme, with an interest rate of 3.5%<br />
on an indexed basis, and homes must be newly constructed. These loans have a term<br />
of up to 20 years or the number of years to retirement at age 60.<br />
� Employer Assisted Scheme (EAS) – Under this scheme, employers arrange <strong>for</strong><br />
housing <strong>for</strong> their employees. This scheme is divided into loans financed through<br />
employer subsidies, unsubsidized loans but employer organized, and employer-owned<br />
units with the option to buy.<br />
� Uncompleted <strong>Housing</strong> Scheme (UHS) – This scheme entails the borrower paying<br />
off the loan without the benefit of living in the house at the same time. Repayments<br />
are fixed at 25% of the borrower’s income over 20 years.<br />
� Non-resident Ghanaian Scheme (NGRS) – This scheme helps to finance a portion<br />
of the construction costs <strong>for</strong> non-resident Ghanaians. These loans are being approved<br />
in U.S. Dollars or British pounds, with 10-year terms at rates of 12.5% or 13%,<br />
respectively.<br />
HFC Loans Outstanding, February 1998<br />
Scheme Number<br />
Balance (bil.<br />
G$)<br />
Rate HFC Margin<br />
Pilot 1544 23.8 3.5% indexed 1.0%<br />
EAS 123 2.3 2.5-2.8% indexed 1.5-1.8%<br />
UHS 188 4.7 4.5% indexed 2.0%<br />
NRG 186 9.6<br />
12.5% (US)-<br />
13.0% (GRP)<br />
4.5-5.0%<br />
Other 48 1.5 Misc. Misc.<br />
Total: 2089 41.9<br />
Countrywide <strong>International</strong> Consulting Services<br />
2 7
Source: Cardiff Consulting Services, Inc.<br />
Sources and References<br />
1. World Bank, www.worldbank.org<br />
2. CIA World Fact Book 1999 - Ghana<br />
3. <strong>International</strong> <strong>Finance</strong> Corporation<br />
4. Stephanie Bäeta Ansah, “Developing <strong>Housing</strong> <strong>Finance</strong> in Traditional Economies:<br />
Selected African Countries Outside of South Africa” – <strong>Housing</strong> <strong>Finance</strong> <strong>International</strong>,<br />
December 1999<br />
Contact<br />
1. Home <strong>Finance</strong> Company Limited<br />
# 35, 6th Avenue<br />
North Ridge, Accra<br />
P.O. Box CT 4603<br />
Cantonments, Accra, GHANA<br />
Tel: 242090-4, Fax: 242095<br />
Email: hfcomp@ncs.com.gh<br />
http:\\www.ghana.com.gh/hfc<br />
Countrywide <strong>International</strong> Consulting Services<br />
2 8
KENYA<br />
Economic Background<br />
Year Exchange<br />
Rate<br />
Shillings/US$<br />
Consumer<br />
Price<br />
Index<br />
Countrywide <strong>International</strong> Consulting Services<br />
Change In<br />
Consumer<br />
Prices<br />
Shillings US$<br />
Nominal GDP<br />
(Millions)<br />
Nominal GDP<br />
(Millions)<br />
1990 22.91 33.98 15.59% 195,536 8,534.96<br />
1991 27.51 40.72 19.82% 221,250 8,042.53<br />
1992 32.22 52.75 29.55% 264,967 8,223.68<br />
1993 58.00 76.90 45.80% 333,613 5,751.95<br />
1994 56.05 99.21 29.01% 400,722 7,149.37<br />
1995 51.43 100.00 0.79% 465,653 9,054.11<br />
1996 57.11 108.82 8.82% 527,967 9,244.74<br />
1997 58.73 121.89 12.02% 627,436 10,683.40<br />
1998 60.37 128.97 5.81% 698,958 11,577.90<br />
1999* 70.33 N/A N/A 756,273 10,753.20<br />
Source: IMF; *Central Bank of Kenya<br />
Since the early half of the 1990s, Kenya has made attempts to re<strong>for</strong>m economic<br />
conditions. The nation has not experienced major ethnic and civil conflicts as most of the<br />
countries in the region; however, Kenya is plagued with problems in its infrastructure.<br />
Long-term barriers to development, <strong>for</strong> example, include high population growth, utility<br />
shortages, and recovery of agriculture lost in the 1997-98 El Nino conditions. The<br />
government of Kenya is currently attempting an aggressive shift towards privatization.<br />
Real Gross Domestic Product was decreasing at the beginning of the decade, due to<br />
increasing inflation. Since 1993, however, GDP has experienced an increasing trend, but<br />
at a slower rate. Agriculture is the main source of GDP in Kenya, totaling an<br />
approximate 30% share. In 1990, GDP in Kenya totaled approximately US$ 8.1 billion,<br />
decreased to US$ 4.8 billion in 1993, and then increased to a decade high of US$ 11.2<br />
billion by 1998.<br />
Inflation was high and variable throughout the decade. In 1990, inflation was<br />
approximately 15.6%. It rose to 45.8% in 1993, then fell to0.8% in 1995. By the end of<br />
the decade, inflation in Kenya had been curtailed to single digits.<br />
Unemployment is an extremely serious issue in Kenya, caused in part by rapid population<br />
growth. Estimates <strong>for</strong> 1998 indicate that of the 9.2 million-person work<strong>for</strong>ce, 50% are<br />
unemployed. For those employed, 75%-80% work in agricultural jobs.<br />
Interest rates vary greatly in Kenya, all of which peaked during 1993. This can be<br />
attributed to the inflation of that year. Treasury bills were as high as 49.8% in 1993 and<br />
at 22.8% in 1998. Lending rates ranged from 29%-31% between 1993-1997. Deposit<br />
rates were as high as 22.5% in 1993, as low as 9.5% in 1995, and registered at 10.8% in<br />
1997.<br />
2 9
<strong>Housing</strong> <strong>Market</strong><br />
Approximately 75% of Kenyans live in rural areas. There is a great division between the<br />
public and private housing sectors in Kenya. While the number of public residential<br />
buildings completed decreased from 167 units in 1994 to 99 units in 1996, private<br />
residential completions over the same period increased from 1,062 to 1,434 units.<br />
Although private development contributes much of the construction, high construction<br />
costs, high interest rates, and lack of serviced lands have greatly hindered additional<br />
expansion <strong>for</strong> the sector.<br />
Both categories of completions considered, the housing stock demand of 10,000 units per<br />
year is not being met. In<strong>for</strong>mal housing accounts <strong>for</strong> a substantial portion of the housing<br />
deficit, with more than 40% of Kenyans living below the poverty line. Even in low cost<br />
housing, housing costs are more than ten times the average income.<br />
<strong>Mortgage</strong> <strong>Market</strong><br />
The <strong>for</strong>mal lending sector in Kenya is a mere 10% of the lending activities existing within<br />
the country. The banking system consists of 53 commercial banks, 35 <strong>for</strong>eign exchange<br />
bureaus, 17 non-bank financial institutions, four building societies, and three mortgage<br />
finance companies. Commercial banks originate loans mainly <strong>for</strong> their staff members.<br />
These loans have terms that are directly related to the number of years that the employee<br />
has worked <strong>for</strong> the bank and salary level, with interest rates as high as 15%. Commercial<br />
banks also make mortgage loans to their prime customers, and commercial loans <strong>for</strong> the<br />
development of estates to be rented and sold. These two types of loans have 3 to 5-year<br />
terms, and usually yield market rates.<br />
The three dominant institutions are the <strong>Housing</strong> <strong>Finance</strong> Company of Kenya Ltd.<br />
(HFCK), Savings and Loan Kenya Ltd. (S and L), and East African Building Society<br />
(EABS). The HFCK controls approximately 70% of the <strong>for</strong>mal market share, and<br />
together, the three institutions possess a combined share of 90% of the <strong>for</strong>mal mortgage<br />
market. In 1994 these three institutions had approximately Kshs 6.4 billion in mortgage<br />
assets, Kshs 8.5 billion in 1996, and Kshs 10.7 billion in 1997. Below is an example of a<br />
typical mortgage contract in the <strong>for</strong>mal mortgage finance sector:<br />
Feature Description<br />
<strong>Mortgage</strong> Rate Variable rate adjusted at lender discretion. (Typically between 26%-28%).<br />
Repayment Amortizing, monthly repayment of principal and interest<br />
Term 10-15 years. Average maturity is 8-10 years.<br />
Loan to Value<br />
Payment to Income<br />
Prepayment Allowed with penalty.<br />
Default<br />
Fees<br />
70%-80%. <strong>Mortgage</strong> protection via life/fire insurance, with monthly premium<br />
throughout term.<br />
Maximum 40% of verifiable household income (can include adult children living<br />
in the house).<br />
Not serious, exception that monthly repayments are delayed. Foreclosure<br />
processes are straight<strong>for</strong>ward through the courts and advertised auction sale.<br />
Appraisal fees, application fee, legal fees, stamp duty, insurance (up to 12% of<br />
house price).<br />
Countrywide <strong>International</strong> Consulting Services<br />
3 0
Other Requirements Minimum account balance equivalent to two months’ payments.<br />
The in<strong>for</strong>mal portion of lending comprises 90% of housing finance in Kenya. It generally<br />
covers small-scale financing that is unorganized and unregulated. Sources include<br />
relatives, friends, savings associations, and employers (especially <strong>for</strong> domestic servants).<br />
Loans originated by the in<strong>for</strong>mal sector are typically very small, with terms varying from<br />
one month to three years, and rely on peer and group pressure to guarantee repayment.<br />
They do not require security and/or collateral, and they are generally used <strong>for</strong> land<br />
purchase, building materials, incremental construction, and home improvement.<br />
Additionally, Kenyans may opt to borrow money through the in<strong>for</strong>mal sector to pay rent<br />
while unemployed.<br />
Sources and References<br />
1. World Bank. “Country: Kenya.” Available: http://www.worldbank.org/afr/ke2.htm<br />
2. CIA World Fact Book 1999 - Kenya<br />
3. <strong>International</strong> <strong>Finance</strong> Corporation<br />
4. <strong>Housing</strong> <strong>Finance</strong> Company of Kenya Ltd. Annual Report 1998<br />
5. Central Bank of Kenya. http://www.home.centralbank.go.ke<br />
6. Okonkwo, Ositadinma. “<strong>Housing</strong> <strong>Finance</strong> and <strong>Housing</strong> Delivery Systems in Kenya:<br />
Bottlenecks, Recent Developments and the Way Forward.” Shelter Afrique, 1998.<br />
7. Charitoneko, Stephanie; Fruman, Cecile; Pederson, Glen. “Case Studies in<br />
Microfinance: Kenya Rural Enterprise Program.” August 1998.<br />
8. Savings and Loan Kenya Ltd. – Director’s Report and Accounts. December 1998.<br />
www.kenyaweb.com<br />
Countrywide <strong>International</strong> Consulting Services<br />
3 1
M AL AW I<br />
Economic Background<br />
Year Exchange<br />
Rate<br />
Kwacha/US$<br />
Consumer<br />
Price<br />
Index<br />
Countrywide <strong>International</strong> Consulting Services<br />
Change In<br />
Consumer<br />
Prices<br />
Kwacha US$<br />
Nominal GDP<br />
(Millions)<br />
Nominal GDP<br />
(Millions)<br />
1990 2.65 23.68 11.81% 5,069.90 1,913.17<br />
1991 2.66 26.66 12.62% 6,105.50 2,295.30<br />
1992 4.40 33.00 23.75% 6,693.80 1,521.32<br />
1993 4.49 40.51 22.77% 8,868.90 1,975.26<br />
1994 15.30 54.55 34.65% 10,324.70 674.82<br />
1995 15.30 100.00 83.33% 22,821.90 1,491.63<br />
1996 15.32 137.60 37.60% 35,535.60 2,319.56<br />
1997 21.23 150.18 9.14% 41,558.80 1,957.55<br />
1998 43.88 194.85 29.75% 52,404.90 1,194.28<br />
1999* 46.44 N/A N/A 77,947.00 1,678.45<br />
Source: IMF; *Reserve Bank of Malawi<br />
Malawi is one of the world’s least developed countries. Economic growth is extremely<br />
slow, and the country remains highly dependent on <strong>for</strong>eign investment and assistance<br />
from the World Bank and the IMF. Until 1994, Malawi remained under authoritarian<br />
rule, leaving the new democratic government with problems such as a growing population<br />
and poverty, inequality, and poor management of resources. The government seeks to<br />
privatize many public institutions so that it may focus funds on social sector programs.<br />
The main source of GDP in Malawi is agriculture. Approximately 45% of GDP<br />
originates from this sector, and it contributes 90% of export revenues. GDP in Malawi<br />
has declined <strong>for</strong> the majority of the 1990s. The value of GDP increased sharply between<br />
1994 and 1995. In 1990, GDP was at approximately US$ 1.9 billion. By 1995, GDP had<br />
reached a low of US$ 674 million, soared to over US$ 2.3 billion in 1996, and finished<br />
out 1999 at approximately US$ 1.7 billion.<br />
Malawi has experienced uncontrollable inflation rates <strong>for</strong> most of the decade, attributed<br />
to the excessive growth in the money supply, increases in utility tariffs, and heavy<br />
government borrowing. Inflation increased from 11.8% in 1990 to more than 83% by<br />
1995. Inflation dropped more than 46% by the following year and even further through<br />
1997, where inflation hit a decade low of 9.1%. However, by 1999 inflation had again<br />
increased to more than 52%.<br />
Interest rates in Malawi have generally increased throughout the past ten years. The<br />
Treasury bill rate increased from 11.5% in 1991, to over 46% in 1995. The T-bill was at<br />
32.98% by the end of 1998. The deposit rate increased as well, from 1990 to 1995. Since<br />
then, the deposit rate experienced a small dip, and registered at 19.1 % by the end of<br />
1998. Finally, the prime lending rate has typically remained at approximately 26%;<br />
however, it was also affected by the inflation spike in 1995.<br />
3 2
Unemployment is a large contributor to the slow economic expansion in Malawi. 1997<br />
estimates report that the population in Malawi had reached approximately 10.44 million.<br />
The labor <strong>for</strong>ce consists of approximately 3.5 million of these individuals. The<br />
government estimates that less than 25% of this number is employed. Unskilled labor is<br />
abundant, while skilled labor is scarce. High unemployment has created extreme poverty<br />
within the country.<br />
<strong>Housing</strong> <strong>Market</strong><br />
<strong>Housing</strong> in Malawi is centralized in rural regions. Estimates indicate that approximately<br />
85% of the population live in rural dwellings, consisting of either a small hut, or a mud<br />
and brick house.<br />
<strong>Mortgage</strong> <strong>Market</strong><br />
Two major banks dominate the banking system in Malawi: National Bank of Malawi and<br />
Commercial Bank of Malawi. There are approximately 8 non-bank financial institutions,<br />
some of which are: the Investment Development Bank of Malawi, Malawi Rural <strong>Finance</strong><br />
Company, Malawi Development Corporation, and the New Building Society.<br />
The New Building Society is the oldest mortgage financing institution in Malawi. It<br />
possesses a majority of the mortgage financing market. In addition to mortgage loans, the<br />
institution offers working capital loans, takes deposits, and provides properties <strong>for</strong> lease.<br />
Its primary goal is to contribute to the generation of residential and commercial properties<br />
in Malawi. Below is a chart of the New Building Society’s originations over the past 5<br />
years.<br />
New Building Society<br />
Loan Originations and Value<br />
1994/95 – 1998/99<br />
Number Value K$<br />
(Millions)<br />
1994/95 2518 27.9<br />
1995/96 2379 21.6<br />
1996/97 2117 38.6<br />
1997/98 2246 156.4<br />
1998/99 4148 103.6<br />
Source: The New Building Society<br />
New Building Society<br />
Loan Size and Distribution<br />
FY 1998/99<br />
Loan Size Number of<br />
<strong>Mortgage</strong>s<br />
K0 – K300,000 3674<br />
K300,001 – K500,000 235<br />
K500,001 – K1,000,000 184<br />
K1,000,001 –<br />
K2,000,000<br />
39<br />
K2,000,001 –<br />
6<br />
K3,000,000<br />
Over K3,000,000 10<br />
Source: The New Building Society<br />
Countrywide <strong>International</strong> Consulting Services<br />
3 3
During fiscal year 1998/99, the New Building Society originated 4,148 mortgage loans<br />
<strong>for</strong> a value of K$ 103.6 million. Of these loans, more than 88% were less than or equal to<br />
K$ 300,000 (equivalent to approximately US$ 6,460). The loan size distribution is<br />
illustrated in the chart above. Since 1993, these small loans have grown in number due to<br />
the fact that the Society provides financing to more lower- income groups than its<br />
previous lending.<br />
Sources and References<br />
1. World Bank. “Countries: Malawi.” Available: www.worldbank.org<br />
2. CIA World Fact Book 1999 - Malawi<br />
3. Chalira, Z.R. Dr. “The New Building Society: Past Per<strong>for</strong>mance and Prospects <strong>for</strong> the<br />
Future – Malawai” November 1998.<br />
4. “Malawibiz.com, Your Gateway to Malawi, Country Report.” Available:<br />
http://www.malawibiz.com/infocountrep.html<br />
5. Reserve Bank of Malawi. Available: http://www.rbm.malawi.net/<br />
6. EAGER Regional Workshop on the Implementation of Financial Programming. June<br />
10-11, 1999. Lilongwe, Malawi. Available:<br />
http://www.eagerproject.com/malawiconf.html<br />
Countrywide <strong>International</strong> Consulting Services<br />
3 4
MAURITIUS<br />
Economic Background<br />
Year Exchange<br />
Rate<br />
Rupees/US$<br />
Consumer<br />
Price<br />
Index<br />
Countrywide <strong>International</strong> Consulting Services<br />
Change In<br />
Consumer<br />
Prices<br />
Rupees US$<br />
Nominal GDP<br />
(Millions)<br />
Nominal GDP<br />
(Millions)<br />
1990 14.32 71.01 13.49% 39,275 2,743<br />
1991 14.79 75.99 7.00% 44,316 2,996<br />
1992 17.00 79.51 4.64% 49,633 2,920<br />
1993 18.66 87.88 10.52% 56,570 3,032<br />
1994 17.86 94.31 7.32% 63,043 3,530<br />
1995 17.66 100.00 6.03% 69,082 3,912<br />
1996 17.97 106.55 6.55% 77,310 4,302<br />
1997 22.27 113.83 6.83% 86,428 3,881<br />
1998 24.78 121.59 6.81% 96,985 3,914<br />
1999 25.47 129.99 6.91% 105,575 4,145<br />
Source: IMF<br />
Mauritius has experienced growth levels that have lifted it to one of the world’s middleincome<br />
countries. Its strengths have been a stable democracy, a stable economy, and a<br />
great deal of social progress. Although economic per<strong>for</strong>mance remains good by<br />
international standards, growth has slowed.<br />
Exports, tourism, and the financial and business sectors have driven economic expansion.<br />
GDP was approximately US$ 2.7 billion at the start of the decade, and increased steadily<br />
through 1996, when GDP reached US$ 4.3 billion. Between 1997 – 1998, GDP<br />
experienced a slight decline, but again increased to over US$ 4 billion by the end of 1999.<br />
The construction sector generated 6% of GDP in 1998.<br />
Inflation was volatile throughout the first half of the 1990s; however, it has remained<br />
fairly stable since 1995. Peaking at 13.5% in 1990, inflation remained between 6 % to<br />
7% <strong>for</strong> the second half of the decade. Interest rates varied throughout the 1990s. Money<br />
market rates registered just over 10% in 1999. By 1999, the deposit rate was at<br />
approximately 10.9%. The average lending rate in 1997 was 13.9%, and increased to<br />
14.4% by 1999.<br />
Unemployment among the 514,000-person work<strong>for</strong>ce in Mauritius is growing. Estimates<br />
<strong>for</strong> 1998 indicated the unemployment rate was 6%, up from 2% in 1996. The labor <strong>for</strong>ce<br />
is concentrated in construction and industry (36%), services (24%), and agriculture<br />
(14%).<br />
<strong>Housing</strong> <strong>Market</strong><br />
The last housing census in Mauritius was conducted in 1990, and it revealed many<br />
changes to the housing market since the previous census of 1983. For example, the<br />
number of households increased from 206,400 in 1983 to 236,100 in 1990. Additionally,<br />
the average number of rooms per household increased from 3.5 to 3.9 during the same<br />
3 5
period. In 1990, approximately 75% of the housing stock were owned, as compared to<br />
66.9% in 1983, which was directly related to the decrease in rentals. The percentage of<br />
rented housing stock decreased from 17.8% in 1983 to 14.8% in 1990.<br />
Mauritius is mainly a rural country, with less than 14% of the total land characterized as<br />
urban. The population density in 1998 was measured at 572 people per square Km.<br />
Construction is a thriving sector. In 1998, approximately 8,302 new building permits<br />
were issued in Mauritius, compared with 7,097 in 1997 and 6,108 in 1990. Additionally,<br />
more than R5 million was invested in the construction of residential buildings during<br />
1998, <strong>for</strong> 5.2% of GDP. The construction price index was at 113.4 by 1998, up from<br />
109.5 in the previous year.<br />
<strong>Mortgage</strong> <strong>Market</strong><br />
Although most financing in Mauritius originates from personal savings, the country does<br />
have institutional sources. As of 1999, in addition to the Bank of Mauritius (which serves<br />
as the nation’s Central Bank), there were 10 commercial banks, 10 offshore banks, and at<br />
least 7 non-bank financial institutions (NBFIs).<br />
These non-bank institutions possess the majority of the mortgage lending market. In fact,<br />
the Mauritius <strong>Housing</strong> Company Ltd. (MHC), the single largest mortgage lender in the<br />
country, is a NBFI. Over two-thirds of the company’s portfolio consists of lower income<br />
loans.<br />
National statistics indicate that mortgages are offered at fixed rates, with varying terms.<br />
Average bank lending rates were at 13.9% in December of 1997, 14.0% in the same<br />
period 1998, and 14.4% in 1999. MFC’s rates were much lower, ranging from 10 – 12%,<br />
reflecting government subsidies <strong>for</strong> housing.<br />
Mauritius has a small secondary market. The Bank of Mauritius had 839 transactions<br />
involving the sale of loans through April of 1999. This number jumped to over 1200 by<br />
the same period in 2000. The average yield on bills sold in the secondary market was at<br />
11.6% by the end of April 2000, down from 12.7% at the end of April 1999.<br />
Sources and References<br />
1. World Bank, www.worldbank.org<br />
2. CIA World Fact Book 1999 - Mauritius<br />
3. Ministry of Economic Development and Regional Co-Operation, Central Statistics Office.<br />
Available: http://ncb.intnet.mu/cso.htm<br />
4. Ministry of Economic Development and Productivity and Regional Development,<br />
“Construction Price Index.” Available: http://ncb.intnet.mu/medrc/cpi/<br />
5. Development Bank of Mauritius, Ltd. Available:<br />
6. http://www.web-ltd.com/dbm/dtml/accueil.htm<br />
7. Bank of Mauritius. Annual Report and Audited Accounts 1998-99. Available:<br />
http://bom.intnet.mu/Anrep99/AR991p1.htm<br />
8. Mauritius Chamber of Commerce and Industry. Investment and Business in Mauritius: A<br />
Presentation. Available: http://www.mcci.org/invest/services/banks.htm<br />
Countrywide <strong>International</strong> Consulting Services<br />
3 6
MOROCCO<br />
Economic Background<br />
Year Exchange<br />
Rate<br />
Dirhams/US$<br />
Consumer<br />
Price<br />
Index<br />
Countrywide <strong>International</strong> Consulting Services<br />
Change In<br />
Consumer<br />
Prices<br />
Dirhams US$<br />
Nominal GDP<br />
(Billions)<br />
Nominal GDP<br />
(Billions)<br />
1990 8.04 103.69 6.91% 213.99 26.62<br />
1991 8.15 98.28 7.99% 242.36 29.74<br />
1992 9.05 100.11 5.74% 242.91 26.84<br />
1993 9.65 91.84 5.18% 249.22 25.83<br />
1994 8.96 92.87 5.14% 279.32 31.17<br />
1995 8.47 100.00 6.12% 281.70 33.26<br />
1996 8.80 97.95 2.99% 319.34 36.29<br />
1997 9.71 89.66 0.89% 318.35 32.79<br />
1998 9.26 88.94 2.91% 341.38 36.87<br />
1999 10.09 87.11 N/A N/A N/A<br />
Source: IMF<br />
GDP in Morocco experienced a fairly steady trend throughout the 1990s. Manufacturing<br />
is the country’s largest contributing sector to GDP (33%), with agriculture as the second<br />
largest (14%). GDP was at US$ 26.6 billion at the beginning of the decade, increasing to<br />
US$ 36.2 billion in 1996. Due to a drought in 1997, GDP contracted, and then resumed<br />
growth in 1998, when it registered at US$ 36.8 billion.<br />
Inflation in Morocco remained comparatively lower than in other developing countries.<br />
The highest level of inflation was at 7.99% during 1991, decreasing to 5.14% three years<br />
later. By the end of the decade, inflation was just below 3%.<br />
Unemployment is an important concern in Morocco. With a labor <strong>for</strong>ce of over 11<br />
million in 1997, approximately 19% were unemployed. By occupation, the labor <strong>for</strong>ce is<br />
50% agricultural, 26% services, 15% industry, and 9% other.<br />
Morocco has problems similar to other developing countries, with government spending,<br />
constraints on private sectors, and inflation at the top of the list. Recent economic<br />
policies have focused on tight economic and fiscal management, re<strong>for</strong>mation of public<br />
sector and private sector expansion and development of human and social programs. As<br />
a result, tariffs have been lowered, the banking system has been re<strong>for</strong>med, there are new<br />
investment guidelines, the tax system has been revised, import restrictions have been<br />
eased, and government spending has declined.<br />
<strong>Housing</strong> <strong>Market</strong><br />
As of 1994 there were 4.11 million dwelling units, of which 2.28 million were in urban<br />
areas. The population of the country was 27 million. Population density is quite high in<br />
urban areas with a mean of 6.9 inhabitants per dwelling unit. The Ministry of Habitat<br />
estimated new demand <strong>for</strong> housing at 184,000 units per year while only 60 to 80,000 are<br />
3 7
eing produced. For example in 1997 there were 82,681 units constructed and 76,900<br />
units finished.<br />
With a population density of approximately 61 people per square kilometer, over 50% of<br />
the population live in urban areas.<br />
<strong>Mortgage</strong> <strong>Market</strong><br />
Banking activities have been liberalized in Morocco. Major re<strong>for</strong>mations include the<br />
abolition of direct credit control, liberalization of lending rates, elimination of all<br />
mandatory bank credit allocation, and revised banking law applicable to all bank and nonbank<br />
credit institutions. As of May 1998, all banks and societies of credit were allowed to<br />
make housing loans.<br />
The primary financing institution is Credit Immobilier et Hotelier (CIH). CIH was the<br />
exclusive financier of the housing sector until 1993 and accounts <strong>for</strong> 57% of the market<br />
as of 1997. The other major housing lender is the popular Central Bank, which holds<br />
18% of the market. The free sector has an approximate 16% market share with 9% <strong>for</strong><br />
two societies of real estate credit.<br />
The mortgage sector in Morocco is quite small, estimated to be 4% of GDP with 0.6% of<br />
GDP in annual new production. The private, in<strong>for</strong>mal sector remains the predominant<br />
source of funding. CIH loan terms range up to 15 years with rates in 1998 of<br />
approximately 11% or 2.25% over treasury bills. Bank loans have shorter terms and<br />
higher margins. Loans are funded with short-term deposits.<br />
The government has prepared a securitization law and supports the development of longer<br />
term financing sources <strong>for</strong> housing.<br />
Sources and References<br />
1. World Bank, www.worldbank.org<br />
2. CIA World Fact Book 1999 - Morocco<br />
3. Credit Immobilier et Hotelier. Available:<br />
http://www.m2mgroup.com/m2mgroup.com/ref<br />
4. Sladden, Frederik. US-Arab Tradeline. Arab World Online. “Foreign Investors Flock<br />
to Moroccan Sell Offs.” January 21, 2000. Available:<br />
http://www.awo.net/newspub/pubs/tradelin/000121a.asp<br />
5. “Morocco’s Voyage From Feudal to Modern.” Economist. Available:<br />
http://www.economist.com/editorial/free<strong>for</strong>all/current/ir9104.html<br />
Countrywide <strong>International</strong> Consulting Services<br />
3 8
SOUTH AFRICA<br />
Economic Background<br />
Year Exchange<br />
Rate<br />
Rand/US$<br />
Consumer<br />
Price<br />
Index<br />
Countrywide <strong>International</strong> Consulting Services<br />
Change In<br />
Consumer<br />
Prices<br />
Rand US$<br />
Nominal GDP<br />
(Millions)<br />
Nominal GDP<br />
(Millions)<br />
1990 2.56 140.22 14.40% 289,816 113,209<br />
1991 2.74 131.57 15.28% 331,980 121,161<br />
1992 3.05 127.26 13.92% 372,227 122,042<br />
1993 3.40 111.12 9.56% 426,133 125,333<br />
1994 3.54 102.19 9.01% 482,120 136,192<br />
1995 3.65 100.00 8.59% 548,100 150,164<br />
1996 4.68 84.92 7.36% 614,942 131,398<br />
1997 4.87 78.78 8.55% 680,212 139,674<br />
1998 5.86 66.17 6.89% 737,813 125,907<br />
1999* 6.15 69.61 5.20% 747,405 121,529<br />
Source: IMF; * Reserve Bank of South Africa<br />
South Africa is a middle-income, developing country with available resources, modern<br />
infrastructure, and well-developed service sectors. However, unemployment, extreme<br />
poverty, crime and corruption are current problems left behind from years of apartheid.<br />
The government is committed to implementation of programs that will create open<br />
markets, privatization, and a favorable investment climate.<br />
GDP growth levels have fluctuated throughout the past ten years. Minerals (mainly gold<br />
and diamonds) and energy resources have remained the key contributors to GDP. In<br />
1990, GDP registered at approximately US$ 113 billion, and increased steadily through<br />
1995, when it peaked at approximately US$ 150 billion. By 1998, a decreasing growth<br />
rate left GDP at US$ 126 billion. Growth in 1999 was somewhat greater than expected at<br />
1.3%.<br />
South Africa has experienced a decreasing trend in terms of inflation, due in part, to the<br />
tight policies of the Central Bank. In 1990, prices were approximately 14.4% higher than<br />
the previous year, and by 1995, inflation had dwindled to 8.6%. According to IMF<br />
statistics, inflation levels <strong>for</strong> 1999 registered at a low of 5.20% higher than the prices of<br />
the previous year.<br />
Unemployment is a major contributor to the slow economic growth in South Africa.<br />
Estimates indicate that approximately 30% of the 15 million people in the work <strong>for</strong>ce are<br />
unemployed. High unemployment is a contributing factor to the extreme poverty in the<br />
country, and important to mention. Although the country is considered middle-income,<br />
approximately 13% of the population lives in what are considered “first-world”<br />
conditions, while 53% of the population lives in “third-world” conditions (and only 25%<br />
of these individuals have access to electricity and/or running water).<br />
3 9
Interest rates fluctuated greatly in the 1990s. The money market rate has seen interest rate<br />
as high as 19.5% in 1990 and as low as 10.2% in 1994, finishing with 17.1% in 1998.<br />
Treasury bills were at 17.8% in 1990, decreased to 10.9% in 1994, and then rose to 16.5%<br />
by 1998. Additionally, rates <strong>for</strong> government bonds have ranged from 14% to 16.3%<br />
during the 1990s.<br />
<strong>Housing</strong> <strong>Market</strong><br />
In 1995, the population in South Africa was well over 41 million, and has continued to<br />
grow at a rate of approximately one million people per year. This growth rate greatly<br />
exceeds the growth rate of available housing in the country. In 1995, it was estimated<br />
that more than 8 million households, with an average household size of 4.97 people,<br />
existed in South Africa. The table below illustrates monthly income distribution figures<br />
<strong>for</strong> the households in South Africa.<br />
Income Category Percentage # of Households<br />
(R $)<br />
(Millions)<br />
0 – 800 39.7% 3.30<br />
800 – 1,500 29.8% 2.41<br />
1,500 – 2,500 11.8% 0.98<br />
2,500 – 3,500 5.6% 0.46<br />
3,501 and higher 13.9% 1.15<br />
Total: 100% 8.3<br />
Source: South African Department of <strong>Housing</strong><br />
These figures indicate that approximately 68.8% (or 5.71 million) of the households in<br />
South Africa have an income of less that R$ 1,500 per month (approximately US$ 410<br />
per month). Moreover, the population is mainly concentrated in urban areas (66%),<br />
leaving 34% of the people in rural regions.<br />
Types of <strong>Housing</strong>. There are various types of housing within South Africa. Urban<br />
housing consists of houses, flats, townhouses, and retirement homes. Hostels are another<br />
type of housing found within the country, which are low-cost, community-based housing<br />
settlements. Next, there are squatter houses, which are located on the periphery of towns<br />
and cities, and in the backyards of <strong>for</strong>mal housing. Rural housing consists of a<br />
combination of <strong>for</strong>mal and in<strong>for</strong>mal housing, both of which have inadequate resources<br />
and/or infrastructure. Finally, farm worker housing are hostel-type structures. They are<br />
among the worst in terms of living conditions, and they are typically seasonal.<br />
<strong>Housing</strong> Stock Deficit. Three major factors are contributing to the housing stock deficit:<br />
(1) high rates of population growth, (2) lack of construction finance, and (3) the fact that<br />
the construction sector and building material supply industry are emerging from and<br />
economic recession and production slump. Building costs in 1999 were estimated to be<br />
7.5% higher than 1998. Additional causes <strong>for</strong> the housing deficit are the lack of land<br />
policy, difficulty in land identification, difficulty in land assembly, land invasions, and<br />
complications with land titles and planning.<br />
Countrywide <strong>International</strong> Consulting Services<br />
4 0
It is estimated that the shortage of housing in South Africa is increasing at a rate of<br />
178,000 units per year. The consequences are overcrowding and increased squatter<br />
settlements.<br />
<strong>Housing</strong> Prices. By the end of the first quarter of 1999, housing prices were<br />
approximately 2.3% higher than the same period of the previous year, leaving the average<br />
price of a house (80-350sq. m) at R 203,800 (US$ 33,800). Calculated on a quarterly<br />
basis, however, prices were generally 0.7% lower than the fourth quarter of 1998. This<br />
was the first quarterly decline in housing prices since 1992, reflecting relatively high<br />
interest rates.<br />
<strong>Mortgage</strong> <strong>Market</strong><br />
Prior to the 1980s, private ownership of housing was politically restricted to the European<br />
population. Hence, mortgage banking is not new to South Africa; however, new<br />
developments in the mortgage finance sector have made <strong>for</strong>mal credit available to lowerincome<br />
households, something that financing institutions have traditionally avoided.<br />
<strong>Mortgage</strong> Products. The following are several mortgage products that can be found in<br />
the South African mortgage market, each with varying rates and terms:<br />
1. <strong>Mortgage</strong> Loan – Referred to as a <strong>Mortgage</strong> Bond, made by commercial banks to the<br />
conventional moderate to high income market, these loans are secured by a lien on the<br />
house, have variable interest rates, 20 to 30-year terms, no/low prepayment penalties,<br />
and require a 20% or less down-payment.<br />
2. Access Bond – A variant of the mortgage loan, this product is designed to renew<br />
borrowing up to the maximum amount of initial principal.<br />
3. Af<strong>for</strong>dable <strong>Housing</strong> Loan – These loans are written up to the full cost of the house<br />
plus transaction costs. However, this loan must also have coverage of 20% of the<br />
total loan amount with one (or combination) of the following: (1) pledge of pension<br />
fund, (2) employer guarantee, or (3) purchase of guarantee <strong>for</strong> up to half the loan<br />
amount from the Home Loan Guarantee Company. With terms of up to 20 years, they<br />
have flexible interest rates and payment-to-income ratios that do not exceed 35% of<br />
the total household income.<br />
4. Micro Loan – These loans are very small in size (R 9,000 <strong>for</strong> example), may carry a<br />
fixed interest rate, and are secured by the borrower’s pension fund. They are<br />
generally used <strong>for</strong> home improvements, but can also be combined with government<br />
subsidies to increase the standard of housing they can achieve.<br />
Banking System. In terms of mortgage loans, the South African banking system is<br />
centered on four major banking institutions, which together, comprise approximately 85%<br />
of the total mortgage market. Below is a table that illustrates the market shares of each of<br />
the major financial institutions. As of December 1998, the banking system had a total of<br />
R 189.4 billion in housing loans outstanding representing 38% of bank assets and<br />
approximately 26% of GDP.<br />
Institution Servicing Portfolio Conventional Mkt. Low-income Mkt.<br />
Countrywide <strong>International</strong> Consulting Services<br />
4 1
Share Share<br />
ABSA Group R64 billion 34% 25%<br />
Standard Bank R32 billion 22% 6%<br />
First National Bank N/A 6% 5%<br />
NEDCOR R32 billion 43% 18%<br />
Source: IUHF<br />
In addition to the banks, South Africa enjoys a second-tier banking system, which is<br />
comprised of Home <strong>Finance</strong> Institutions (HFIs) such as <strong>Mortgage</strong> Indemnity Fund,<br />
SERVCON, National Home <strong>Finance</strong> Corporation (NHFC), NURCHA, and Gateway<br />
Home Loans. Most of these institutions were developed after the 1994 signing of the<br />
Record of Understanding, which was designed to bring credit to the lower-income<br />
housing market.<br />
1. <strong>Mortgage</strong> Indemnity Fund (MIF)– This HFI was created to eliminate the banks’<br />
risk of being unable to repossess properties due to breakdown of law and order.<br />
Through MIF’s existence, 15 financial institutions have been accredited, and 140,000<br />
mortgage bonds have been granted, valued at over R10 billion (R4.1 billion of which<br />
has gone to the lower-income market.)<br />
2. SERVCON <strong>Housing</strong> Solutions – This HFI was also designed to deal with<br />
repossessions, and currently manages over 33,000 non-per<strong>for</strong>ming loans, valued at<br />
over R1.3 billion. The company offers various options to the defaulting borrower,<br />
and the government guarantees 50% of the cost of the portfolio.<br />
3. The National <strong>Housing</strong> <strong>Finance</strong> Corporation (NHFC) – NHFC was designed to<br />
explore ways to create housing opportunities <strong>for</strong> low and moderate-income<br />
households, and is essentially a wholesale financier.<br />
4. National Urban Reconstruction and <strong>Housing</strong> Agency (NURCHA) – NURCHA<br />
was designed to facilitate access to credit <strong>for</strong> subsidy-linked housing projects, sharing<br />
the risk with financial institutions and developers. The goal is to encourage housing<br />
development.<br />
5. Gateway Home Loans (Ltd.) – Gateway is a subsidiary of NHFC, designed to help<br />
individuals obtain a larger micro loan to purchase a house, instead of the sole use of<br />
home improvements. Retirement funds secure half of the loan, and default insurance<br />
secures the other 50%. The key point to mention is that lenders will not have to carry<br />
these high-risk, micro loans on their balance sheets. Instead Gateway will pool the<br />
loans into a portfolio that it secures. The result is a secondary market in which these<br />
loans will be sold to a third party.<br />
Although personal/family savings remains a substantial source of home funding in South<br />
Africa, the mortgage financing sector is experiencing expansion as it continues to take<br />
action in extending credit to the lower-income market.<br />
Policy developments are aimed in several directions. The main goals are to regulate the<br />
market, which would eliminate fraud, lowering the barriers of entry to the financing<br />
market, and to eliminate some of the risk of non-per<strong>for</strong>ming loans. On the social side,<br />
government seeks to educate the public and making credit more accessible.<br />
Countrywide <strong>International</strong> Consulting Services<br />
4 2
S.A. Home Loans announced in 1999 that it was introducing a home-loan securitization<br />
operation. It has been aggressively originating mortgage loans but as of early 2000 had<br />
not issued an MBS. In 1988, the <strong>for</strong>mer United Building Society securitized R 250<br />
million of mortgage loans, so this type of business operation is not new to South Africa.<br />
Contributed by Mary R. Tomlinson<br />
The Banking Council, South Africa<br />
Sources and References<br />
1. World Bank, www.worldbank.org<br />
2. CIA World Fact Book 1999 – South Africa<br />
3. <strong>International</strong> <strong>Finance</strong> Corporation<br />
4. Banking Council of South Africa, South African Banking Review, 1997, 1998<br />
5. Tucker, Robert, “The Retail Dimension: Rethinking the Provision of Retail Banking<br />
Services to Low Income Communities, <strong>Housing</strong> <strong>Finance</strong> <strong>International</strong>, December<br />
1999<br />
6. Tomlinson, M., Ensuring <strong>Mortgage</strong> Repayment in South Africa, <strong>Housing</strong> <strong>Finance</strong><br />
<strong>International</strong>, June 1999<br />
7. Tomlinson, M., <strong>Mortgage</strong> Bondage? South Africa’s Financial Institutions and Low-<br />
Cost <strong>Housing</strong> Delivery”, <strong>Housing</strong> <strong>Finance</strong> <strong>International</strong>, June 1998<br />
Contacts<br />
1. Banking Council of South Africa<br />
17 Harrison Street<br />
10th floor<br />
PO Box 616174<br />
Marshalltown 2107<br />
South Africa<br />
Tel: 27.11.838.4978<br />
Fax: 27.11.836.5509<br />
http://www.banking.org.za.<br />
2. Gateway Homeloans Ltd.<br />
Gateway Home Loans Isle of Houghton<br />
II Boundary Road Old Traf<strong>for</strong>d 3<br />
3rd floor<br />
Houghton<br />
South Africa<br />
http://www.gatewayhomeloans.co.za<br />
Countrywide <strong>International</strong> Consulting Services<br />
4 3
Israel<br />
Economic Background<br />
Year Exchange Rate<br />
currency/US$<br />
Consumer Price<br />
Index<br />
Countrywide <strong>International</strong> Consulting Services<br />
Change In<br />
Consumer Prices<br />
New Sheqalim US$<br />
Nominal GDP<br />
(Millions)<br />
Nominal GDP<br />
(Millions)<br />
1990 2.02 54.73 17.17% 105,831 52,392<br />
1991 2.28 65.14 19.01% 134,855 59,147<br />
1992 2.46 72.92 11.95% 161,738 65,747<br />
1993 2.83 80.90 10.94% 186,576 65,928<br />
1994 3.01 90.87 12.33% 224,838 74,697<br />
1995 3.01 100.00 10.04% 261,586 86,906<br />
1996 3.19 111.28 11.28% 304,682 95,512<br />
1997 3.45 121.29 9.00% 339,992 98,548<br />
1998 3.80 127.89 5.43% 370,424 97,480<br />
1999* 4.14 134.54 5.20% 409,200 98,800<br />
Source: IMF; *Bank of Israel<br />
Israel has a technologically advanced market economy with substantial government<br />
participation. The influx of Jewish immigrants from the <strong>for</strong>mer USSR topped 750,000<br />
during the period 1989-99, bringing the population of Israel from the <strong>for</strong>mer Soviet<br />
<strong>Union</strong> to 1 million. This is one-sixth of the total population, adding scientific and<br />
professional expertise of substantial value <strong>for</strong> the economy's future. The influx, coupled<br />
with the opening of new markets at the end of the Cold War, energized Israel's economy,<br />
which grew rapidly in the early 1990s. But growth began slowing in 1996 when the<br />
government imposed tighter fiscal and monetary policies, and the immigration bonus<br />
petered out. Those policies brought inflation down to record low levels in 1999.<br />
In the second half of 1999, activity accelerated in most industries, and an economic<br />
recovery began. Much of the acceleration was led by exports, while the response of GDP<br />
to the expansion of demand lagged behind that of imports of goods and services. The rate<br />
of price increases was below the 1999 inflation target, and inflation expectations<br />
declined. The <strong>for</strong>eign-currency market remained relatively calm, the exchange rate vis-avis<br />
the currency basket was administered within the band, and there was slight nominal<br />
shekel depreciation. At the beginning and end of the period reviewed, the nominal interest<br />
rate was reduced by a cumulative 0.8 percentage point, but the real interest rate remained<br />
relatively high. The labor market remained slack, as it has been <strong>for</strong> a long time. In<br />
November 1999, the unemployment rate rose to an annual peak of 9.2%. Nevertheless,<br />
various indicators suggest that economic recovery will work to reduce this rate.<br />
<strong>Housing</strong> <strong>Market</strong><br />
The population of Israel (1996) was 5.76 million of which 90.9% was urban. Population<br />
growth (average, 1948 – 1996) was 4.1% of which 1.9% was due to net migration. There<br />
are 1.59 million households (1996). <strong>Housing</strong> starts in 1998 were 42,900, down somewhat<br />
from earlier years of the decade. Israel has a high homeownership rate.<br />
4 4
<strong>Housing</strong> and construction have been major factors in the economic development of Israel.<br />
Throughout its history, Israel has absorbed large number of immigrants. Immigration<br />
preceded the establishment of the State of Israel – waves of Jewish refugees flooded the<br />
country during and after World War II, but the proportions grew afterwards. Since its<br />
birth in 1948 and until the end of 1998, some 2.7 million people immigrated to Israel.<br />
<strong>Mortgage</strong> <strong>Market</strong><br />
<strong>Housing</strong> loan origination and servicing are handled in Israel almost exclusively by<br />
specialized mortgage banks. Most of them are wholly or partially owned by Israel’s large,<br />
general-purpose banks. Nine such mortgage banks operate today. Only two of which are<br />
unaffiliated with a general-purpose bank. Beside the mortgage banks, two generalpurpose<br />
banks and several insurance companies are active in housing lending, but their<br />
market share does not exceed 2-3%. The home financing market is highly concentrated.<br />
The three leading mortgage banks share 75% of the home market in terms of outstanding<br />
debt. The largest mortgage banks are as follows:<br />
– Bank Tfachot<br />
– Bank Mishkan<br />
– Bank Leumi LeMashkantaot<br />
– Bank Discount Mashkantaot<br />
– Bank Yerushalaim<br />
– Bank Ben Leumi Mashkantaot<br />
In 2000, Bank Mishkan acquired Bank Tefahot.<br />
<strong>Market</strong> In<strong>for</strong>mation<br />
Year <strong>Housing</strong> Starts Population <strong>Mortgage</strong><br />
Originations*<br />
1990 42.4 4,660,000 8839<br />
1991 83.5 4,950,000 11,138<br />
1992 46.0 5,120,000 11,012<br />
1993 35.8 5,260,000 13,326<br />
1994 43.6 5,400,000 18,152<br />
1995 70.0 5,540,000 22,256<br />
1996 55.9 5,700,000 27,143<br />
1997 50.9 5,830,000 29,840<br />
1998 42.9 5,970,000<br />
* <strong>Mortgage</strong> Banks; Source: Nachmany<br />
A unique feature of the Israeli mortgage market is the linkage of the typical housing loan<br />
to the Consumer Price Index (CPI). In order to overcome the af<strong>for</strong>dability and volatility<br />
problems of traditional loans in an unstable monetary environment, the CPI-indexed loan<br />
specifies a real rather than nominal rate and indexes the balance <strong>for</strong> inflation. The<br />
differences between indexed and non-indexed loans emerge with changes in CPI: whereas<br />
in the case of a regular loan, the original amortization schedule will stay unchanged. In<br />
Countrywide <strong>International</strong> Consulting Services<br />
4 5
the case of a linked loan the current payment amount and balance due will change every<br />
month, even after accounting <strong>for</strong> the monthly principal payment.<br />
The most common housing loan is a 20-year, level-payment, fixed rate loan. Longer<br />
terms are usually available but with an adjustable rate mechanism, which allows <strong>for</strong><br />
interest rate resets at intervals of one, two-and-a-half or five years. Adjustable rate loans<br />
are comparatively young. They were first introduced in 1989, and until mid-1996, they<br />
have comprised only about 10% of the market volume. A sharp increase of interest rates<br />
in 1996 and expectations that the high rates were temporary caused a surge in the demand<br />
<strong>for</strong> adjustable rate loans. Their share of total origination increased to about 50%. Most<br />
housing loans in Israel carry a prepayment penalty. According to the new regulation, in<br />
case of a prepayment the borrower will pay the lender bank a penalty that will<br />
compensate the bank <strong>for</strong> most of the decline of future interest income due to a decrease of<br />
interest rate. The average loan size is rather small in Israel. With no tax benefits attached,<br />
people have no tax incentive to borrow.<br />
Interest Rates<br />
Year Treasury Bill<br />
Rate<br />
Deposit Rate Lending Rate<br />
1990 15.08% 14.40% 26.45%<br />
1991 14.50% 13.89% 26.43%<br />
1992 11.79% 11.29% 19.94%<br />
1993 10.54% 10.44% 16.44%<br />
1994 11.77% 12.19% 17.45%<br />
1995 14.37% 14.08% 20.22%<br />
1996 15.54% 14.48% 20.68%<br />
1997 13.88% 13.07% 18.71%<br />
1998 12.17% 11.00% 16.18%<br />
1999 12.60% 16.50%<br />
Source: IMF<br />
To finance their lending, the mortgage banks need long-term funding. The main sources<br />
of such funds in Israel have been institutional investors, especially provident funds and<br />
insurance companies. Provident funds are long-term investment funds, operated mainly<br />
by general-purpose banks, through which households can enjoy certain tax benefits on<br />
their savings. These tax benefits are conditional on a 15-year minimum duration of the<br />
account. Because of the unique, long-term preferences of their depositors, the funds<br />
became a natural investor in mortgage banks. The vast scale and continued growth of<br />
these funds have enabled them to provide most of the cash needed by the mortgage banks<br />
during the last decade. The mortgage banks are approaching the point where their funding<br />
resources will be exhausted. The rapid growth of outstanding debt has not been matched<br />
by a concomitant growth of provident funds’ assets, and the banks are there<strong>for</strong>e likely to<br />
find themselves reliant on increasingly limited resources. Without additional re<strong>for</strong>ms that<br />
unbind new investors, particularly pension funds and insurance companies, the banks are<br />
expected to face a shortage of funds.<br />
Countrywide <strong>International</strong> Consulting Services<br />
4 6
A major obstacle to the development of mortgage lending in Israel has always been the<br />
inadequacy of property registration. Even today, a considerable portion of the housing<br />
stock is not <strong>for</strong>mally registered, and changes of ownership are documented on various<br />
legal documents that are not registered in a central roll. Another difficulty arises from the<br />
government’s promotion <strong>for</strong> nearly universal home ownership, which necessarily includes<br />
prospective borrowers who are low income, immigrants with no credit record or young<br />
families without employment history. This leads to a relatively low credit profile of the<br />
average borrower in Israel as compared to its counterpart in other developed countries.<br />
A common goal of the government’s various housing programs since 1971 has been to<br />
enable potential homebuyers to purchase units. Instead of taking responsibility <strong>for</strong> the<br />
construction and the provision of homes, the government moved to supporting the<br />
demand <strong>for</strong> housing by providing the financing at preferential terms. Using alternating<br />
sets of criteria to define eligibility <strong>for</strong> the programs (‘Eligible Borrowers’) and the terms<br />
of the aid, the Ministry of Construction and <strong>Housing</strong> concentrated on providing<br />
subsidized credit to selected population groups. These were mainly immigrants, “young<br />
couples”, people living in overcrowded conditions and families acquiring homes in<br />
development regions.<br />
Sources and References<br />
1. IMF: <strong>International</strong> Monetary Fund, Statistics 2000<br />
2. Bank of Israel: Recent Economic Developments<br />
3. Nachmany, Doron, “<strong>Housing</strong> <strong>Finance</strong> in Israel”, <strong>Housing</strong> <strong>Finance</strong> <strong>International</strong>, June<br />
1999<br />
Countrywide <strong>International</strong> Consulting Services<br />
4 7
Jordan<br />
Economic Background<br />
Year Exchange Rate<br />
Dinar / US$<br />
Consumer Price<br />
Index<br />
Countrywide <strong>International</strong> Consulting Services<br />
Change In<br />
Consumer Prices<br />
Dinar US$<br />
Nominal GDP<br />
(Millions)<br />
Nominal GDP<br />
(Millions)<br />
1990 1.51 81.22 16.19% 2,668.30 1,767.09<br />
1991 1.47 87.84 8.16% 2,868.30 1,951.22<br />
1992 1.47 91.35 4.00% 3,537.10 2,406.19<br />
1993 1.44 94.38 3.32% 3,858.70 2,679.65<br />
1994 1.43 97.70 3.52% 4,246.90 2,969.86<br />
1995 1.43 100.00 2.37% 4,560.80 3,189.37<br />
1996 1.41 106.50 6.50% 4,711.00 3,341.13<br />
1997 1.41 109.74 3.04% 4,945.80 3,507.66<br />
1998 1.41 114.60 4.43% 5,236.60 3,713.90<br />
1999 1.41 N/A N/A 5,723.50 4,059.22<br />
Source: IMF; *Central Bank of Jordan<br />
Jordan is a small, Arab country with limited supplies of water and other natural resources<br />
such as oil. After averaging 9% in 1992-95, GDP growth averaged only 2% during 1996-<br />
99. In an attempt to spur growth, King Abdallah has undertaken limited economic re<strong>for</strong>m,<br />
including partial privatization of some state owned enterprises and Jordan's entry in<br />
January 2000 into the World Trade Organization (WTO). Debt, poverty, and<br />
unemployment are fundamental, ongoing economic problems. Inflation has declined<br />
significantly, and it was estimated to be less than 3% by the end of the year. The official<br />
unemployment rate is 15%, but the actual rate is estimated to be as high as 25%-30%.<br />
Year<br />
Loans and<br />
Advances<br />
Time<br />
Deposits<br />
Discount Rate<br />
1995 10.65% 7.68% 8.5%<br />
1996 11.25% 8.5% 8.5%<br />
1997 12.25% 9.18% 7.75%<br />
1998 12.89% 8.33% 8.00%<br />
1999 12.67% 7.89% 9.0%<br />
Source: Central Bank of Jordan<br />
<strong>Housing</strong> <strong>Market</strong>s<br />
The population of Jordan was estimated at 4.9 million inhabitants in 1999. The number of<br />
permits issued from 1999-1995 were as follows:<br />
Year New <strong>Housing</strong> Permits House Cost Index<br />
(1997=100)<br />
1995 18,558 94.3<br />
1996 16,803 99.2<br />
1997 14,838 100.0<br />
1998 15,971 101.8<br />
1999 15,371 102.6<br />
Source: Central Bank of Jordan<br />
4 8
<strong>Mortgage</strong> <strong>Market</strong><br />
The residential mortgage market in the Hashemite Kingdom of Jordan has expanded<br />
considerably since 1997, when the Government removed the privileges of the <strong>Housing</strong><br />
Bank in mortgage lending and enabled the entry of other banks. Nine commercial banks<br />
now offer mortgage loans. Although the <strong>Housing</strong> Bank continues to dominate the market,<br />
several other banks have well-established portfolios, while others plan to expand their<br />
mortgage lending beyond their own employees in the next year. Nine commercial banks<br />
active in mortgage lending report planned mortgage loans <strong>for</strong> 1999 of over 70 million<br />
Jordanian Dinars (JD), equivalent to nearly US$ 100 million.<br />
The planned production of residential mortgage loans by banks in 2000 represented 0.8%<br />
of planned GDP, whereas their overall stock represented 4.8 % of GDP by the end of<br />
1999. This level of new production exceeds past levels of the <strong>Housing</strong> Bank as a sole<br />
lender, be<strong>for</strong>e re<strong>for</strong>ms were completed. If adding loans of Military Funds, Teacher Funds<br />
and <strong>Housing</strong> and Urban Development Corp., the overall stock of mortgage loans is<br />
estimated at JD 600 million, or 11% of GDP. Whereas the planned production of<br />
mortgage loans in 2000 may reach JD 76 million, or 1.3% of GDP.<br />
The Jordan <strong>Mortgage</strong> Refinance Company (JMRC) was created in 1997 to provide<br />
liquidity facilities to commercial banks engaged in residential mortgage lending through<br />
refinancing loans over-collateralized by sound, residential mortgages. Since its<br />
establishment JMRC has completed 13 refinancing operations, totaling nearly JD 22<br />
million (US$ 31 million) with six commercial banks. Although initially funding these<br />
refinance loans through a loan from the World Bank, JMRC is now attracting its own<br />
funding through the issuance of bonds in the Jordanian market. Through 1999JMRC had<br />
issued two 3-year bullet bonds <strong>for</strong> JD14.8 million (US$ 21 million).<br />
The rules inherent in the Ottoman Law limiting long-term debt still present a major<br />
constraint <strong>for</strong> most banks. The rule is that the total interest paid over the term of the loan<br />
cannot exceed the principal. Even with loan terms of 10-years, banks could exceed the<br />
Ottoman Law rules on accrued interest, under a scenario where variable credit rates rise<br />
along with the cost of funds.<br />
One of the lenders’ concerns is the potential difficulty associated with mortgage<br />
<strong>for</strong>eclosure processes. Be<strong>for</strong>e mortgage lenders can actually <strong>for</strong>eclose on a property, they<br />
are required to obtain the authorization of the CBJ and the Office of the Prime Minister.<br />
Such authorizations are not automatic and are frequently subjected to lengthy delays.<br />
Since 1995, the Jordan Loan Guarantee Corporation (JLGC) has been offering to insure<br />
75 percent of the outstanding balances of approved mortgage loans, <strong>for</strong> an annual fee of<br />
75 basis points applied to a ceiling agreed between a participating financial institution<br />
and JLGC. By the end of 1997, this program had received relatively little interest, as only<br />
JD 0.6 million in mortgage loans had been guaranteed. By November 19, 1998, however,<br />
the ceilings had reached JD 12 million as more banks entered into partnerships with<br />
JLGC now offering a mortgage insurance product.<br />
Countrywide <strong>International</strong> Consulting Services<br />
4 9
As of mid-1999, mortgage interest rates, also taking into account the separate 1%<br />
servicing fee, ranged between 14% and 15%. The Arab Land Bank and the Jordan Gulf<br />
Bank have proposed lower mortgage rates, 13% and even 12% p.a. in some cases, <strong>for</strong><br />
long-term mortgage housing loans, thus reflecting the impact of wider competition on<br />
reducing margins. Modest declines of mortgage rates may be expected across most other<br />
banks, both resulting from lower deposit rates and greater competition <strong>for</strong> mortgage<br />
lending.<br />
Most banks have conservatively begun mortgage lending by targeting low-risk production<br />
and offering limited terms. Most offer loan terms between 5 and 10 years, but the Arab<br />
Land Bank and Jordan National Bank will offer terms as long as 15 years in some cases.<br />
Minimum down-payment ratios are between 20% and 30%, but in practice they are<br />
usually higher. Other restrictions include a maximum loan amount of JD 50,000,<br />
automatic payroll deductions, and/or several external guarantors.<br />
Sources and References<br />
1. World Bank. Available: www.worldbank.org<br />
2. Central Bank of Jordan. Available: http://www.cbj.gov.jo/<br />
3. Jordan <strong>Mortgage</strong> Refinance Corporation<br />
Countrywide <strong>International</strong> Consulting Services<br />
5 0
Turkey<br />
Economic Background<br />
Year Exchange Rate<br />
Lira/US$<br />
Consumer Price<br />
Index<br />
Countrywide <strong>International</strong> Consulting Services<br />
Change In<br />
Consumer Prices<br />
Turkish Lira US$<br />
Nominal GDP<br />
(Millions)<br />
Nominal GDP<br />
(Millions)<br />
1990 2,930.07 5.50 60.31% 392,580,000 133,983.15<br />
1991 5,079.92 9.12 65.97% 638,130,000 125,618.12<br />
1992 8,564.43 15.52 70.07% 1,129,410,000 131,872.17<br />
1993 14,472.50 25.77 66.10% 2,062,190,000 142,490.24<br />
1994 38,726.00 53.16 106.26% 3,868,430,000 99,892.32<br />
1995 59,650.00 100.00 88.11% 7,762,460,000 130,133.45<br />
1996 107,775.00 180.35 80.35% 14,772,100,000 137,064.25<br />
1997 205,605.00 334.96 85.73% 28,835,900,000 140,249.02<br />
1998 314,464.00 618.48 84.64% 51,625,100,000 164,168.55<br />
1999 541,400.00 1019.68 64.87% 77,374,805,000 142,916.15<br />
Source: IMF; *Central Bank of Turkey<br />
Turkey experienced strong, economic growth over the last five years. Real GDP averaged<br />
6.5% annual growth from 1995 to 1998. However, adversely affected by Russia’s<br />
economic crisis and a devastating earthquake in 1999, GDP fell about 5%. The economic<br />
loss of the 1999 earthquake, which hit northwestern Turkey, is estimated to have reached<br />
between $ 7.5 to $ 12.2 billion, with industrial production falling to 30% of capacity. The<br />
economy has since rebounded and GDP growth <strong>for</strong> 2000 is estimated at 5.5%.<br />
Turkey’s largest economic sector is agriculture, making up 18% of GDP; however, the<br />
textiles and clothing industry are the largest exporting groups, together representing 40%<br />
of exports. The unemployment rate <strong>for</strong> 1999 was estimated at 7.3% of the labor <strong>for</strong>ce.<br />
Inflation is a big concern in Turkey, as inflation over the last decade has averaged 73.7%.<br />
The Turkish government has introduced structural re<strong>for</strong>ms to reduce budget deficits in<br />
order to reduce inflation. For 1999, inflation was estimated at 65%. The government’s<br />
inflation target <strong>for</strong> 2000 is 35% and in the single digits <strong>for</strong> 2002.<br />
<strong>Housing</strong> <strong>Market</strong><br />
The rapid urbanization of the population over the last twenty years has created housing<br />
shortages. In 1998, the total housing shortage was approximately 500,000 units. The<br />
earthquake in 1999 amplified the need <strong>for</strong> new housing. The total number of destroyed<br />
homes reached over 100,000. It is estimated that the amount needed <strong>for</strong> the overall<br />
reconstruction and restoration of homes and buildings is between $3 – $6 billion. The<br />
government has tried to alleviate the shortage of housing by building new prefabricated<br />
housing units in the earthquake region, offering subsidies to encourage house<br />
construction in this region, and offering low interest loans to real estate developers.<br />
The total number of existing houses and dwellings stood at 14,500,000 in 1998. The<br />
average housing unit was 130.7 square meters.<br />
5 1
Year <strong>Housing</strong> Starts<br />
1992 472,777<br />
1993 548,120<br />
1994 523,791<br />
1995 507,623<br />
1996 454,295<br />
1997 464,117<br />
1998 414,573<br />
Source: State Institute of Statistics<br />
<strong>Mortgage</strong> <strong>Market</strong><br />
Home ownership is widespread in Turkey with over 70% of the population owning their<br />
own homes. However, almost all of these homes were self-financed. Thus, outstanding<br />
mortgages represented less than 1% of GDP. Historically, there have been large barriers<br />
<strong>for</strong> individuals seeking to obtain mortgage loans, such as large down payments, high<br />
interest rates and banks’ unwillingness to offer mortgage products.<br />
<strong>Mortgage</strong> lending has only recently become an area of focus <strong>for</strong> Turkish banks. For<br />
1999, total originations were estimated at $ 500 million. Turkish banks offer both fixed<br />
and variable rate products. Loan maturity extends from 5 to 20 years and interest rates<br />
range from 2.5% to 3.5% per month <strong>for</strong> Turkish Lira denominated loans. Maximum<br />
LTVs reach 75%. There is no secondary mortgage market in Turkey.<br />
Sources and References<br />
1. World Bank, www.worldbank.org<br />
2. CIA, World Factbook<br />
3. Turkish State Institute of Statistics<br />
Countrywide <strong>International</strong> Consulting Services<br />
5 2
ASIA AND AUSTRALIA<br />
Countrywide <strong>International</strong> Consulting Services<br />
5 3
REGIONAL SUMMARY<br />
Australia<br />
Australia has experienced strong economic growth over the last decade. There was<br />
growth in employment and consumer spending levels as well as increased household<br />
wealth. The owner-occupancy rate is high, at more than 70%, with only 40% of<br />
households carrying mortgages. New home construction was also high, making up 25%<br />
of the home purchases in recent years.<br />
Total mortgage debt outstanding increased 126% to almost US$127 billion in the last<br />
decade. Many different mortgage products are offered in Australia, including variable<br />
and fixed rate and flexible mortgage products. <strong>Mortgage</strong> Insurance is prevalent, thus<br />
reducing lenders’ risk of loss. Securitization of mortgage loans expanded significantly in<br />
the last decade. This was initially led by non-depository mortgage banking institutions<br />
with more recent participation by large depositories.<br />
New Zealand<br />
New Zealand found recent economic success through the development of a free market<br />
economy and trade. However, the New Zealand Dollar experienced recent depreciation,<br />
declining some 44% in four years against the US Dollar. Inflation has been declining<br />
over the last decade, ending at a negative .12% at the end of 1999.<br />
New Zealand has a high rate of home ownership, at 71% of the total population in 1996.<br />
Single, detached housing dominates the region. However, price increases and new zoning<br />
laws have resulted in the increase of rental property construction in recent years. ABN<br />
AMRO is a leading mortgage lender, as are several large Australian banks.<br />
As i a<br />
The Asian financial crisis of 1997 had an adverse impact on the economy of the region,<br />
and it subsequently <strong>for</strong>ced the redirection of many fiscal policies <strong>for</strong> the countries there.<br />
Currency devaluations led to economic downturns and financial sector difficulties from<br />
which the regional economies are only beginning to emerge. Control over interest rates<br />
and lending guidelines have been loosened somewhat since the crisis in an ef<strong>for</strong>t to spur<br />
economic growth.<br />
Countrywide <strong>International</strong> Consulting Services<br />
54
Percent Change from Prior Year<br />
% Change from prior year<br />
120.00%<br />
100.00%<br />
80.00%<br />
60.00%<br />
40.00%<br />
20.00%<br />
0.00%<br />
-20.00%<br />
-40.00%<br />
80.00%<br />
60.00%<br />
40.00%<br />
20.00%<br />
0.00%<br />
-20.00%<br />
-40.00%<br />
Percent Change in Exchange Rates<br />
(Currency per US$)<br />
Countrywide <strong>International</strong> Consulting Services<br />
Australia<br />
Bangladesh<br />
China<br />
Hong Kong<br />
India<br />
Japan<br />
Korea<br />
Malaysia<br />
New Zealand<br />
Philippines<br />
Singapore<br />
Taiwan<br />
Thailand<br />
Percent Change in Lending Rates<br />
Australia<br />
China<br />
Hong Kong<br />
India<br />
Japan<br />
Korea<br />
Malaysia<br />
New Zealand<br />
Philippines<br />
Singapore<br />
Taiwan<br />
Thailand<br />
1996-1997<br />
1997-1998<br />
1998-1999<br />
1995-1996<br />
1996-1997<br />
1997-1998<br />
5 5
Despite its economic difficulties in the 1990s, Japan remains the largest mortgage market<br />
in the region in terms of outstanding mortgage debt while New Zealand has the highest<br />
ratio of mortgage debt outstanding to GDP.<br />
$2,000,000<br />
$1,500,000<br />
$1,000,000<br />
$500,000<br />
$-<br />
Australia - 1999<br />
0%<br />
Australia - 1999<br />
Outstanding <strong>Mortgage</strong> Debt (Millions $US)<br />
$159,029<br />
Hong Kong - 1999<br />
41% 39%<br />
Hong Kong - 1999<br />
$61,629 $379<br />
India - 1999<br />
Japan - 1999<br />
$1,800,000<br />
Korea - 1999<br />
Governments in the region generally promote housing and housing finance, whether it is<br />
through state-owned financial institutions, subsidies or the use of provident funds (<strong>for</strong>ced<br />
savings). The housing stock itself is predominantly of a condominium style, or high-rise<br />
flats. This is due to the small areas of land in many of the Asian countries. The rate of<br />
home ownership is high, with Singapore leading the way at 87%, followed by Taiwan at<br />
84%. Investor speculation and the subsequent economic crisis have resulted in<br />
overbuilding and thus oversupply of stock in some countries.<br />
Countrywide <strong>International</strong> Consulting Services<br />
$51,174 32,090 $78,047<br />
$17,978 $7,337 $20,354<br />
Malaysia - 1997<br />
Philippines - 1997<br />
New Zealand - 1999<br />
Oustanding <strong>Mortgage</strong> Debt / GDP<br />
India - 1999<br />
1%<br />
Japan - 1999<br />
37%<br />
Korea - 1999<br />
13%<br />
Malaysia - 1997<br />
25%<br />
59%<br />
Philippines - 1997<br />
New Zealand - 1999<br />
Taiwan - 1999<br />
12%<br />
Taiwan - 1999<br />
Thailand - 1998<br />
26%<br />
Thailand - 1998<br />
17%<br />
5 6
100%<br />
90%<br />
80%<br />
70%<br />
60%<br />
50%<br />
40%<br />
30%<br />
20%<br />
10%<br />
0%<br />
70%<br />
AUSTRALIA, NEW ZEALAND & ASIA<br />
Rate of Homeownership<br />
Ef<strong>for</strong>ts to make mortgage lending more prevalent and af<strong>for</strong>dable are underway throughout<br />
most of the region, with plans <strong>for</strong> secondary markets & securitization in place as well.<br />
Hong Kong, Japan and Malaysia have begun securitizing mortgages, while China, India,<br />
Korea and Thailand have plans to develop secondary markets in the near future.<br />
<strong>Mortgage</strong> Insurance is also a topic <strong>for</strong> policy development in some countries as a means<br />
of reducing credit risk <strong>for</strong> lending institutions, thereby increasing the availability of<br />
mortgage funds.<br />
Countrywide <strong>International</strong> Consulting Services<br />
54%<br />
60%<br />
60%<br />
71%<br />
Australia Hong Kong Japan Korea New<br />
Zealand<br />
87%<br />
84%<br />
Singapore Taiwan<br />
5 7
Australia<br />
Economic Background<br />
Year Exchange Rate<br />
Australian $ /US$<br />
Consumer Price<br />
Index<br />
Countrywide <strong>International</strong> Consulting Services<br />
Change In<br />
Consumer Prices<br />
Australian $ US$<br />
Nominal GDP<br />
(Billions)<br />
Nominal GDP<br />
(Billions)<br />
1990 1.28 88.37 7.27% 393.66 307.55<br />
1991 1.28 91.22 3.22% 399.89 312.41<br />
1992 1.36 92.12 0.99% 416.11 305.96<br />
1993 1.47 93.79 1.81% 438.11 298.03<br />
1994 1.37 95.57 1.89% 464.14 338.79<br />
1995 1.35 100.00 4.64% 491.59 364.14<br />
1996 1.28 102.61 2.61% 521.70 407.58<br />
1997 1.34 102.87 0.25% 549.29 409.92<br />
1998 1.59 103.75 0.85% 579.14 364.24<br />
1999* 1.55 105.27 1.47% 607.79 392.12<br />
Source: IMF; *1999 GDP Reserve Bank of Australia<br />
As of June 1999, Australia had recorded strong economic growth of 4.1% in real GDP <strong>for</strong><br />
the year. Growth in each of the eleven quarters prior to March 1999 was strong and<br />
relatively stable, falling between 0.5% and 1.5%. However, in the quarter ending June<br />
1999, growth had slowed to 0.2%.<br />
Increasing domestic demand resulting from rising levels of consumer spending was the<br />
main driving <strong>for</strong>ce behind the growth in GDP. Increased household wealth and consumer<br />
confidence, together with strong growth in personal credit, were major influences leading<br />
to the high levels of consumer spending.<br />
During 1998-99, the annual inflation rate, as measured by the increase in the Australian<br />
Consumer Price Index, was as low as 1.47%. The Treasury rate underlying the CPI that<br />
excludes items subject to volatile price fluctuations was 1.7%. The CPI has remained<br />
below 2% <strong>for</strong> the last two and a half years. While inflation edged up during the past year,<br />
it remained below the Reserve Bank’s target range of between 2-3%.<br />
Employment grew 2.2% during 1998-99, up from 1.4% the previous year. The<br />
unemployment rate declined to an average of 7.6% over the year, the lowest level since<br />
1989-90. The unemployment rate reached 7.2% in June 1999, a full percentage point<br />
lower that the rate in 1998.<br />
The Reserve Bank’s target <strong>for</strong> monetary policy is the cash interest rate. The cash rate of<br />
4.75% was unchanged during the period December 1998 to June 1999.<br />
<strong>Housing</strong> <strong>Market</strong><br />
Most homes in Australia are privately owned with an owner-occupancy rate of more than<br />
70% (Australian Bureau of Statistics 1999). Of the owner-occupied homes, only 40%<br />
carried a mortgage.<br />
5 8
Australian <strong>Housing</strong> Stocks<br />
Dwelling Type 1991 Census 1996 Census<br />
Single Family Homes 4,476,238 5,366,478<br />
Semi-detached, Terrace and<br />
442,732 574,063<br />
Townhouses<br />
Flats/Units/Apartments 653,956 930,856<br />
Caravans/Cabins/Houseboats 138,273 147,834<br />
Other Dwellings 38,881 156,006<br />
TOTAL DWELLINGS 5,750,237 7,175,237<br />
Source: Australian Bureau of Statistics<br />
Approximately 80% of the housing stock consisted of detached single family houses. The<br />
remaining 20% are made up of semi-detached houses, row or terrace houses, townhouses,<br />
flats, units and apartments.<br />
Almost 75% of homebuyers purchased an existing/used home. The price of established<br />
houses in Australia, as measured by the Australian Bureau of Statistics (ABS) Established<br />
House Price Index, rose by almost 85% between June 1986 and June 1996. The consumer<br />
price inflation (CPI) index rose by 58% over the same period. A large proportion of the<br />
remaining 25% of purchases consist of low income homes.<br />
The ABS estimates the number and value of housing. In 1998-99 all groups of mortgage<br />
lenders made a total of 396,702 housing loan commitments <strong>for</strong> a total value of $51.74<br />
billion. The number of commitments made (excluding re-financing) was up 2.5%, and<br />
the value was up 14.6% compared with 1997-98.<br />
New home construction and the purchase of new homes was 93,603 units in 1998-99, a<br />
decrease of 3.9% from the previous year. The value of these loans was $12.15 billion, an<br />
increase of 7.7% from the previous year. This sector comprised 23.6% of the total<br />
housing market.<br />
The purchase of established dwellings was 303,099 loans, up 4.7% compared with 1997-<br />
98, and comprised 76.4% of the housing market. The loan value was $39.59 billion, an<br />
increase of 16.9% from the previous year. This segment accounted <strong>for</strong> 76.5% of the total<br />
housing market.<br />
<strong>Mortgage</strong> <strong>Market</strong><br />
The Australian housing finance sector experienced rapid growth throughout the 1990s.<br />
From 1992 through the end of 1998, total mortgage debt outstanding had increased 126%,<br />
to almost US$127 billion. The trend continued as the balance grew to just over $160<br />
billion by the end of 1999. Australia finances on the order of 400,000 to 500,000<br />
mortgages per year (both new mortgages and re-finances).<br />
Residential <strong>Mortgage</strong> <strong>Market</strong> (million A$)<br />
Year <strong>Mortgage</strong> Debt Outstanding <strong>Mortgage</strong> Debt-to-GDP<br />
1992 100,738 24.2%<br />
1993 121,228 27.7%<br />
1994 148,216 31.9%<br />
Countrywide <strong>International</strong> Consulting Services<br />
5 9
1995 165,848 33.7%<br />
1996 181,351 34.8%<br />
1997 198,093 36.1%<br />
1998 217,885 37.6%<br />
1999 246,495 40.7%<br />
2000 286,326<br />
Source: Reserve Bank of Australia<br />
In 1998-99, all lenders in Australia financed a total of 487,977 units (A$61.5 billion).<br />
The average loan rose 12.5% to $130,425. In 1998-99 80.2% of loans were used to<br />
purchase or refinance established homes, 15.2% in construction loans and the remaining<br />
4.6% to purchase new homes. Construction lending fell by 1% in 1998-99 to 73,445,<br />
while the purchase of new homes fell by 13% to 20,153. However, financing of<br />
established homes (including refinancing) increased 2.5% to 394,379.<br />
Historically, commercial banks have provided the bulk of the housing finance. In 1994<br />
88% of all mortgage debt outstanding was originated by commercial banks. The rest of<br />
the mortgage credit was provided by building societies (5.8%), credit unions (3.0%), life<br />
insurance companies, and finance companies (3.1%). The commercial bank market share<br />
fell to 72.1% in 1998. This was a result of aggressive competition from mortgage<br />
managers (specialized, mortgage originators funded through securitization). The<br />
specialized mortgage lenders are competitive on price, mortgage product, efficiency in<br />
origination, funding and servicing of loans. This competition has <strong>for</strong>ced the commercial<br />
banks and building societies to be more competitive as well as innovative in packaging<br />
and cross-selling of other financing products and services with mortgage loans.<br />
Residential <strong>Mortgage</strong> <strong>Market</strong> Share<br />
(% of Outstanding)<br />
Type of Institution 1994 1998<br />
Banks 88.10% 72.16%<br />
Building Societies 5.80% 3.85%<br />
Credit <strong>Union</strong>s 3.00% 3.87%<br />
Specialized Lenders 3.10% 20.11%<br />
Total 100.00% 100.00%<br />
Source: Reserve Bank of Australia<br />
The commercial banks’ market share rose to 83.5% of total (number) loans in 1999. This<br />
was up from 81.2% in the previous year. The number of loans made by banks <strong>for</strong><br />
housing totaled 404,159 in 1999, a 3.3% increase from the previous year. This increase<br />
contrasted with an 8.7% decrease in the number of loans of other lenders to 65,024. The<br />
number of loans made to individuals by permanent building societies decreased 4.7% to<br />
18,794.<br />
The main commercial bank, mortgage lenders are Commonwealth Bank, National<br />
Australia Bank, Westpac Bank and ANZ Bank.<br />
Commercial Banks-<strong>Mortgage</strong> Debt Outstanding (Feb 1999)<br />
Bank Balance A$ Millions US$ Millions % of Total<br />
Countrywide <strong>International</strong> Consulting Services<br />
6 0
Commonwealth Bank 32,947 20,986 22.09%<br />
National Australia Bank 26,748 17,037 17.93%<br />
Westpac Banking Corporation 26,091 16,618 17.49%<br />
ANZ Banking Group 19,222 12,244 12.89%<br />
St. George Bank 17,101 10,892 11.46%<br />
26 Additional Banks Holding <strong>Mortgage</strong>s 27,052 17,231 18.14%<br />
Source: Australian Prudential Regulation Authority<br />
Countrywide <strong>International</strong> Consulting Services<br />
Total 149,162 95,007 100.00%<br />
In 1998-99, the average loan from a bank was $127,400 (12.5% increase from the<br />
previous year), permanent building societies, $117,800 (up 8.9%), and $119,400 from<br />
other lenders (an increase of 3.7%).<br />
As of June 1999, the average, variable interest rate on a home mortgage was 6.34%, while<br />
the average 3 year fixed rate was 6.94%. <strong>Mortgage</strong> rates have been on a downward trend<br />
since the late 1980s. This was mainly due to the downward trend in the inflation rate.<br />
More recently, increased competition in the market has been responsible <strong>for</strong> a contraction<br />
in lending margins over the real interest rate from over 4% to between on average 1.2%-<br />
1.6%..<br />
A large variety of mortgage products are offered in Australia. These include variations of<br />
fixed and variable rate instruments. The most common instrument offered is, however, a<br />
standard 25-year amortizing, reviewable rate mortgage. The rate on this instrument is<br />
varied at the discretion of the lender. This instrument accounts <strong>for</strong> approximately 80% of<br />
the total market (Standard and Poors 1998).<br />
For all mortgage types, typical loan-to-value ratios average 80%. However, depending on<br />
the mortgage program they can go as high as 90%. The typical range of payment-toincome<br />
ratios is 25%-35%. Almost all mortgages originated in Australia are A quality; a<br />
fact that is reflected in the low, overall default rate in Australian mortgage portfolios.<br />
Lender loss in Australia is minimized by the use of mortgage insurance. Most mortgages<br />
in Australia carry a mortgage insurance policy. The policy insures 100% against loss,<br />
against the loan balance plus costs (Fitch 1997). Insurers are required to pay claims<br />
within 14 days of receipt of a claim.<br />
The mortgage insurance industry is dominated by four companies: Commercial <strong>Union</strong><br />
Lender <strong>Mortgage</strong> Insurance Co. Ltd. (LMI), GE <strong>Mortgage</strong> Insurance PMI <strong>Mortgage</strong><br />
Insurance Ltd.and Sun Alliance and Royal <strong>Mortgage</strong> Insurance Ltd. (Sun Alliance).<br />
The securitization of mortgage loans in Australia developed substantially in the 1990’s.<br />
Around US$40 billion in mortgage debt has been securitized. This represents<br />
approximately 19% of the outstanding mortgage balance in the system. Until 1997, the<br />
main securitizers were the non-depository, mortgage banking institutions. The three<br />
largest, PUMA, Aussie Home Loans and RAMS <strong>Mortgage</strong> Corp, finance their operations<br />
mainly by issuing mortgage-backed securities. Commercial banks have recently<br />
6 1
accelerated the securitization of their mortgage portfolios. This trend was rein<strong>for</strong>ced by<br />
the June 1998 Westpac securitization of US$1.4 billion in the first global and biggest debt<br />
issue by an Australian financial institution. The security was denominated in Australian<br />
Dollars and marketed in the United States.<br />
Sources and References<br />
1. IMF Statistics, 2000<br />
2. Australian Bureau of Statistics, various reports.<br />
3. Australian Financial Institutions Commission, various statistical tables 1998.<br />
4. Bernstein, S., The Australian <strong>Mortgage</strong> <strong>Market</strong>, report prepared <strong>for</strong> the <strong>Mortgage</strong><br />
Bankers Association of America, April 1999<br />
5. Lea, M.J. And S.A. Bernstein, <strong>International</strong> <strong>Housing</strong> <strong>Finance</strong> Sourcebook 1995.<br />
<strong>International</strong> <strong>Union</strong> <strong>for</strong> <strong>Housing</strong> <strong>Finance</strong> Institutions, 1995.<br />
6. Michaux, Fabienne, “Standard & Poor’s Australian Residential MBS Criteria”, 1998.<br />
7. Reserve Bank of Australia, Monthly Bulletin, various issues 1998-1999.<br />
8. Zelter, Jill M. and Kevin Stehpeson, “Australian <strong>Mortgage</strong> Default Model.” Fitch.<br />
1998.<br />
Contacts<br />
1. Australian Association of Permanent Building Societies<br />
PO Box 9021<br />
16 Thesiger Court Deakin ACT 2600<br />
Tel: (02) 6281 1588<br />
Fax: (02) 6285 1674<br />
http://www.aapbs.com.au/<br />
2. Westpac Banking Corp.<br />
Level 25, 60 Martin Place,<br />
Sydney NSW 2000, Australia Contact (Australia) : Ph: (02) 9226 3143,<br />
Fax: (02) 9226 1539 Contact (Overseas): Ph: 61 2 9226 3143,<br />
Fax: 61 2 9226 1539<br />
Email: westpac@westpac.com.au<br />
http://www.westpac.com.au<br />
Countrywide <strong>International</strong> Consulting Services<br />
6 2
BANGLADESH<br />
Economic Background<br />
Year Exchange Rate<br />
Taka/ US$<br />
Consumer Price<br />
Index<br />
Countrywide <strong>International</strong> Consulting Services<br />
Change in<br />
Consumer Prices<br />
Taka US$<br />
Nominal GDP<br />
(Billions)<br />
Nominal GDP<br />
(Billions)<br />
1990 34.75 77.07 6.13% 737.57 21.23<br />
1991 36.60 81.97 6.36% 834.39 22.80<br />
1992 38.95 84.95 3.63% 906.50 23.27<br />
1993 39.57 87.50 3.01% 948.06 23.96<br />
1994 40.21 92.15 5.31% 1030.36 25.62<br />
1995 40.28 100.00 8.52% 1170.26 29.05<br />
1996 41.79 104.06 4.06% 1301.60 31.15<br />
1997 43.89 109.48 5.21% 1403.05 31.97<br />
1998 46.91 118.56 8.29% 1548.33 33.01<br />
1999 49.09 N/A. N/A. 1749.26 35.63<br />
Source: IMF<br />
The Bangladesh economy is dominated by the agricultural sector, which contributes to<br />
32% of the GDP. Most of the capital flows to the Bangladesh are accounted <strong>for</strong> by a<br />
combination of <strong>for</strong>eign grants and subsidized loans. As of 1996, the <strong>Housing</strong> Sector<br />
made up 7.4% of GDP.<br />
Sector – 1995 – 1996 % of GDP<br />
Agriculture 31.9%<br />
Infrastructure 14.1%<br />
Industry 11.5%<br />
Professional Services 11.8%<br />
Trade 10.0%<br />
<strong>Housing</strong> 7.4%<br />
Construction 6.3%<br />
Public Administration 5.2%<br />
Banking & Insurance 1.8%<br />
Total<br />
100%<br />
Source: IFC Appraisal Report <strong>for</strong> Delta BRAC <strong>Housing</strong> <strong>Finance</strong> Corp.<br />
Bangladesh’s financial sector is relatively small and underdeveloped. The financial<br />
system is dominated by the nationalized commercial banks (NCB) which account <strong>for</strong> over<br />
70% of total financial industry assets. The financial system includes four, state-owned,<br />
commercial banks; seven, private-sector banks; four Development <strong>Finance</strong> Institutions;<br />
many, non-banking, financial institutions; the Stock Exchange and insurance companies.<br />
Commercial banks limit their lending to projects with “prime” sponsors, and the capital<br />
markets are also small with capitalization of the Dhaka and Chittagong Exchanges. The<br />
fact that State Owned Enterprises can get cheap funding easily has led to interest rate<br />
6 3
distortions, which in turn have impacted the financial market developments. Government<br />
savings plans have kept private investment out by putting them at a competitive<br />
disadvantage.<br />
<strong>Housing</strong> <strong>Market</strong><br />
Bangladesh has been facing a rapid, urbanization trend in recent decades. As a result,<br />
previously small, urban centers such as Dhaka, Chittagong, Khulna, and Rajshashi have<br />
become the home of over 40 million, or 30% of the total population. As a result, the<br />
Consumer Price Index in <strong>Housing</strong> has increased tremendously in the last 20 years. Total<br />
investment in housing has been constant in the last decade, at 9% of the GDP.<br />
The lack of private financing cited above results in a relatively low share of housing as a<br />
percent of GDP and also results in a lack of strong, financial institutions <strong>for</strong> housing,<br />
relative to the other sectors. Current estimates are that there is a high tenant population of<br />
65% of the households in Dhaka. This suggests a restricted access to owning a home due<br />
to difficult avenues <strong>for</strong> obtaining home financing.<br />
<strong>Mortgage</strong> <strong>Market</strong><br />
The <strong>International</strong> <strong>Finance</strong> Corporation (IFC) holds 15% of the shares in the Delta Brach<br />
<strong>Housing</strong> <strong>Finance</strong> Company (DBH), which was created in 1998 to provide private sector<br />
housing finance in Bangladesh. The company provides long-term home mortgage loans,<br />
increases the overall housing stock and stimulates home ownership.<br />
Sources and References<br />
9. IMF Statistics, 2000<br />
10. <strong>International</strong> <strong>Finance</strong> Corporation Bulletin http://www.ifc.org<br />
11. <strong>International</strong> Monetary Fund www.imf.org<br />
12. World Bank, www.worldbank.org<br />
Countrywide <strong>International</strong> Consulting Services<br />
6 4
China<br />
Economic Background<br />
Year Exchange Rate<br />
Yuan/US$<br />
Consumer Price<br />
Index<br />
Countrywide <strong>International</strong> Consulting Services<br />
Change In<br />
Consumer Prices<br />
Yuan US$<br />
Nominal GDP<br />
(Billions)<br />
Nominal GDP<br />
(Millions)<br />
1990 4.78 N/A 3.06% 1,831.95 383.25<br />
1991 5.32 N/A 3.54% 2,128.04 400.01<br />
1992 5.51 N/A 6.34% 2,586.36 469.39<br />
1993 5.76 N/A 14.58% 3,450.06 598.97<br />
1994 8.62 N/A 24.24% 4,669.07 541.66<br />
1995 8.35 N/A 16.90% 5,851.05 700.72<br />
1996 8.31 N/A 8.32% 6,833.04 822.27<br />
1997 8.29 N/A 2.81% 7,489.46 903.43<br />
1998 8.28 N/A 0.84% 7,985.33 964.41<br />
1999 8.28 n/a n/a 8,268.01 998.55<br />
Source: IMF; *Central Bank of China (Estimate)<br />
Beginning in late 1978, the Chinese leadership moved the economy from a sluggish<br />
Soviet-style, centrally planned economy to a more market-oriented economy. The result<br />
has had a quadrupling effect on GDP since 1978. In 1999, with its 1.25 billion people and<br />
a GDP of just $3,800 per capita, China became the second largest economy in the world<br />
after the US. Agricultural output doubled in the 1980s. Industry also posted major gains,<br />
especially in coastal areas near Hong Kong and opposite Taiwan, where <strong>for</strong>eign<br />
investment helped spur output of both domestic and export goods.<br />
In late 1993, China's leadership approved additional, long-term re<strong>for</strong>ms aimed at giving<br />
still more play to market-oriented institutions. Their leadership also approved measures to<br />
strengthen the center's control over the financial system. State enterprises would continue<br />
to dominate many key industries in what was termed "a socialist, market economy". From<br />
1995-99, inflation dropped sharply, reflecting tighter monetary policies and stronger<br />
measures to control food prices. At the same time, the government struggled to (a) collect<br />
revenues due from provinces, businesses, and individuals; (b) reduce corruption and other<br />
economic crimes; and (c) keep afloat the large, state-owned enterprises, most of which<br />
had not participated in the vigorous expansion of the economy and many of which had<br />
been losing the ability to pay full wages and pensions.<br />
Interest Rates<br />
Year Deposit Rate Lending Rate<br />
1990 8.64% 9.36%<br />
1991 7.56% 8.64%<br />
1992 7.56% 8.64%<br />
1993 10.98% 10.98%<br />
1994 10.98% 10.98%<br />
1995 10.98% 12.06%<br />
1996 7.47% 10.08%<br />
1997 5.67% 8.64%<br />
6 5
1998 3.78% 6.39%<br />
1999 2.25% 5.85%<br />
Source: IMF<br />
<strong>Housing</strong> <strong>Market</strong><br />
Until 1990, the Chinese government had total control over the housing market, including<br />
investment, construction, distribution as well as management and repairs. These houses<br />
were distributed to the citizens through the administrative function of the government<br />
without any payment or through state-owned enterprises (SOEs) as part of the<br />
comprehensive wage-benefit package offered to employees. The investment made by the<br />
government to provide such housing had no return and as such, this system lacked any<br />
incentives <strong>for</strong> development of a modern, housing industry. Also, the provision and<br />
upkeep of houses <strong>for</strong> employees has become a major burden <strong>for</strong> bankrupt or cashstrapped<br />
SOEs.<br />
Starting in 1991, the housing system re<strong>for</strong>m was put in place throughout the country,<br />
including the establishment of the housing provident fund to provide additional funds <strong>for</strong><br />
construction. This regulation required employers, both public and private, as well as the<br />
employees, to contribute a certain portion of the employee’s wages to the reserve. The<br />
funds gathered were mostly used <strong>for</strong> social housing development and mortgage loans. In<br />
addition, SOE owned housing is being sold to employees at substantial discounts (or in<br />
some instances given away) in order to reduce or eliminate the SOE obligation.<br />
Since 1998, the Chinese government has made several market-driven re<strong>for</strong>ms to further<br />
develop the housing and real estate industry, such as enlarging the LTV ratio to 80% and<br />
extending the loan term to 30 years. There are also tax breaks on capital gains from sales<br />
of homes and other real estate transactions. The investment in urban housing<br />
construction has amounted to approximately RMB 500 billion yuan, accounting <strong>for</strong> over<br />
16% of the total fixed asset investment. Urban housing volume is at 500 million square<br />
meters. The average, per-capita living space of urban citizens was 9.8 meters, compared<br />
to 3.6 in 1979.<br />
All of these changes are making the real estate market more vibrant. In 1999, 19,771<br />
houses were put on the market <strong>for</strong> resale.<br />
<strong>Mortgage</strong> <strong>Market</strong><br />
There are two sectors of housing finance, the provident fund mortgage and the<br />
commercial mortgage in China. The provident mortgage is designed to assist citizens in a<br />
concentrated area by offering a set interest rate, usually about 2 percentage points above<br />
the depository, interest rates. Only those who contribute to the fund are eligible <strong>for</strong> loans.<br />
By the end of 1999, the total sum of the provident fund reached RMB 140.9 billion yuan.<br />
There are four, state-owned, commercial banks in China who fund mortgage and other<br />
real estate loans. By the end of 1999, total, real estate loans amounted to RMB 355.6<br />
billion yuan. Over 61% of the total loans were real estate development loans, leaving<br />
about 39% <strong>for</strong> individual mortgages and other loans. Individual, mortgage loans<br />
increased over 145% from the previous year. By March 2000, real estate loans provided<br />
Countrywide <strong>International</strong> Consulting Services<br />
6 6
y commercial banks reached RMB 450 billion yuan, with 136.3 billion making up<br />
individual housing loans. Under the direction of the Bank of China, these state-owned<br />
commercial banks issued housing mortgage bonds against the individual mortgages.<br />
Up to this point, construction development had been regionally based and concentrated in<br />
certain urban areas, thus causing the mortgage market to develop faster in those areas.<br />
Southeastern, coastal areas are developing much faster than the rest of the country in<br />
terms of housing finance.<br />
Competition between commercial banks has dramatically increased within the past few<br />
years, as the changes in the housing market are evident. This will lead to increased<br />
lending, better quality of service and more diligent, lending practices to minimize risks.<br />
Policy Developments<br />
Policy development plays a major role in the development of housing and mortgage<br />
markets in China. In addition to the changes under way, the government is looking to<br />
find ways to focus on improving the quality of housing, enhancing af<strong>for</strong>dability, as well<br />
as decreasing credit risk.<br />
The following issues are on the agenda <strong>for</strong> the government of China to further develop<br />
the housing and mortgage market:<br />
� Enhance af<strong>for</strong>dability and loan-repaying capabilities of individuals<br />
� Standardize the real estate transaction process and implement proper measures to<br />
increase the number of real estate transactions<br />
� Further increase housing supply and quality of housing<br />
� Improve efficiency of the provident fund<br />
� Work with commercial banks to lower credit risk, potentially looking into mortgage<br />
insurance<br />
� <strong>Mortgage</strong>-backed securities (MBS) are currently being discussed <strong>for</strong> certain cities<br />
Sources and References<br />
1. IMF Statistics, 2000<br />
2. CIA, The World Factbook, 2000<br />
3. Jonson Cheng Cong, “A Booming <strong>Housing</strong> <strong>Mortgage</strong> <strong>Market</strong> in Shanghai”, <strong>Housing</strong><br />
<strong>Finance</strong> <strong>International</strong>, March 1998<br />
4. Chinese <strong>Housing</strong> <strong>Finance</strong> Delegation Report provided to participants at the US<br />
Department of <strong>Housing</strong> and Urban Development seminar on housing finance,<br />
Washington DC, June 2000.<br />
Countrywide <strong>International</strong> Consulting Services<br />
6 7
HONG KONG<br />
Economic Background<br />
Year Exchange Rate<br />
HK$/ US$<br />
Consumer Price<br />
Index<br />
Countrywide <strong>International</strong> Consulting Services<br />
Change In<br />
Consumer Prices<br />
Hong Kong $ US$<br />
Nominal GDP<br />
(Billions)<br />
Nominal GDP<br />
(Billions)<br />
1990 7.79 64.31 582.55 74.78<br />
1991 7.77 71.76 11.58% 668.51 86.04<br />
1992 7.74 78.46 9.34% 779.34 100.69<br />
1993 7.74 84.31 7.46% 897.46 115.95<br />
1994 7.73 91.67 8.73% 1,010.88 130.77<br />
1995 7.74 100.00 9.09% 1,077.14 139.17<br />
1996 7.73 106.32 6.32% 1,191.89 154.19<br />
1997 7.74 112.53 5.84% 1,324.70 171.15<br />
1998 7.75 115.72 2.83% 1,267.44 163.54<br />
1999* 7.76 111.13 -3.97% 1,233.14 158.91<br />
Source: IMF; * Census & Statistics Dept of Hong Kong<br />
On July 1, 1997, Hong Kong reverted back to the People's Republic of China (PRC) after<br />
more than 150 years as a colony of the British Crown. Under the terms of the Sino-<br />
British Joint Declaration, Hong Kong became a Special Administrative Region (SAR) of<br />
the PRC. A Basic Law was established under which the current legal and economic<br />
system will remain in place until 2047 (DMG 3).<br />
Following the smooth administrative transition, the new SAR faced its first economic<br />
challenge in the Asian crisis of 1997-98. Prior to the crisis, fast growth, low<br />
unemployment, persistent moderate inflation and negative real interest rates characterized<br />
Hong Kong’s economy. Real GDP growth averaged 5% per year from 1992 to 1997.<br />
The unemployment rate averaged 2.4% over the same period. Inflation averaged 8.7%<br />
per year from 1990 to 1997. In this environment, asset prices escalated rapidly. Real<br />
estate speculation drove up property values by 40% or more in some years.<br />
With the onset of the Asian financial crisis, external demand dropped sharply. The<br />
depreciation of the Yen and other Asian currencies caused a relative appreciation of the<br />
Hong Kong Dollar, which has remained closely linked to the U.S. $ since 1983 (IMF 1,<br />
DMG 3). Real GDP fell 5% in 1998. Inflation dropped to 2.8% <strong>for</strong> 1998. Interest rates<br />
rose, and in 1998 the Best Lending Rate averaged 9.94%. Asset prices dropped steeply.<br />
From July 97 to August 98, the Hang Seng stock index fell 55%. From Q4/97 to Q4/98,<br />
home prices dropped by 40%. The unemployment rate rose to 4.7% <strong>for</strong> 1998.<br />
Beginning in Q2/99, Hong Kong began to emerge from its recession. By July the Best<br />
Lending Rate had dropped back to 8.25%. Preliminary estimates showed real GDP<br />
finishing the year up 2.9%. This can be attributed to reviving external and internal<br />
demand. Prices fell the entire year with the CPI dropping 4.0%. The unemployment rate<br />
<strong>for</strong> 1999 averaged 6.2%.<br />
6 8
Interest Rates<br />
Year Money <strong>Market</strong> Deposit Rate Treasury Bill<br />
Rate<br />
Countrywide <strong>International</strong> Consulting Services<br />
Lending Rates<br />
1990 11.50 6.67 10.00<br />
1991 4.63 5.46 8.50<br />
1992 3.81 3.07 3.83 6.50<br />
1993 4.00 2.25 3.17 6.50<br />
1994 5.44 3.54 5.66 8.50<br />
1995 6.00 5.63 5.55 8.75<br />
1996 5.13 4.64 4.45 8.50<br />
1997 4.50 5.98 7.50 9.50<br />
1998 5.50 6.62 5.04 9.00<br />
1999 5.75 4.50 4.94 8.50<br />
Source: IMF<br />
<strong>Housing</strong> <strong>Market</strong><br />
In 1999, there were 2.1 million housing units in Hong Kong. Because of the population<br />
density and scarcity of land, nearly all Hong Kong residential property is condominium<br />
style. There is almost no single-family, detached housing.<br />
About 54% of Hong Kong's housing units are privately owned. Thirty-two percent (32%)<br />
of housing is publicly supplied rental housing. The remaining 14% of the stock are<br />
government-subsidized sale flats. The stock distribution as of September 1999 was as<br />
follows:<br />
Stock of Personal Residence Flats September 1999<br />
(000)<br />
Public Rental 682<br />
Subsidized Sale 304<br />
Privately Owned 1,140<br />
Other 114<br />
Total 2,130<br />
Source: Hong Kong <strong>Housing</strong> Authority<br />
The Hong Kong <strong>Housing</strong> Authority (HKHA) is the government institution responsible <strong>for</strong><br />
administering Hong Kong's public rental program and subsidized financing programs <strong>for</strong><br />
low and middle-income purchasers. Public, rental units are in very high demand due to<br />
their low cost and high quality. However, the waiting list <strong>for</strong> these units is long. In<br />
September 1999, the average wait was six years. The Hong Kong <strong>Housing</strong> Society<br />
(HKHS) is a non-profit organization whose programs are aimed primarily at assisting<br />
middle income families in their home purchases.<br />
Homeownership rates have risen, as the people of Hong Kong have become more<br />
affluent. From 18% in 1971, the homeownership rate rose to 33% by 1985 and 52% by<br />
1999.<br />
6 9
In an ef<strong>for</strong>t to meet housing demand and help reduce disruptive real estate speculation,<br />
the government is encouraging increased home construction in Hong Kong. According to<br />
a White Paper on Long-term <strong>Housing</strong> Strategy (LTHS) issued in 1998, the government<br />
seeks to provide 85,000 flats/year to the Hong Kong market. Its goal is to build 50,000<br />
flats/year through the public sector and to facilitate the building of 35,000 flats/year<br />
through the private sector. Moreover, it aims to reduce the average waiting time <strong>for</strong><br />
public rental housing to 3 years by 2005 and to achieve a home ownership rate of 70% by<br />
2007. In 1999, the production goals of the LTHS were met.<br />
New Production (thousands)<br />
1994 1995 1996 1997 1998 1999<br />
Public Rental 17.1 17.3 18.4 16.0 14.1 29.4<br />
Subsidized Sale 4.4 16.2 10.7 21.5 21.1 22.5<br />
Private 34.5 21.2 17.2 15.9 19.5 33.2<br />
Total 56.0 54.8 46.3 53.5 54.7 85.1<br />
Source: HK Central Statistics<br />
Although Hong Kong property values fell significantly in their recent recession, they<br />
remain high relative to other housing markets. The Ratings and Valuation Department<br />
estimated that property prices fell by 5-6% in 1999. As Hong Kong has emerged from its<br />
recession, property values are increasing despite falling prices in the rest of the economy.<br />
Since the bottom of the market in Q3/98, home prices have begun to rise again,<br />
particularly <strong>for</strong> larger units.<br />
Square Feet<br />
14000<br />
12000<br />
10000<br />
8000<br />
6000<br />
4000<br />
2000<br />
0<br />
Source: Vigers Hong LTD (Bloomberg)<br />
Hong Kong Residential Property Values<br />
Purchase Price in HK$ / sq ft<br />
Q1/97 Q2/97 Q3/97 Q4/97 Q1/98 Q2/98 Q3/98 Q4/98 Q1/99 Q2/99 Q3/99 Q4/99<br />
Quarter<br />
Countrywide <strong>International</strong> Consulting Services<br />
Small(1500 sq ft)<br />
7 0
)<br />
<strong>Mortgage</strong> <strong>Market</strong><br />
The economic downturn has led to a dwindling demand <strong>for</strong> loans from the commercial<br />
sectors. Consequently, the total loan portfolio of all authorized institutions (authorized by<br />
the Hong Kong Monetary Authority, HKMA) shrank by approximately 10% from the<br />
peak of HK$ 2.04 billion in September 1997 to HK$ 1.82 billion in December 1999. In<br />
addition to the shrinking demand, loan quality has also been affected as evident in a rising<br />
non-per<strong>for</strong>ming loan ratio. To cope with the negative impact of the difficult, operating<br />
environment on profitability, banks have decided to channel more resources to the<br />
residential, loan market. This strategy has contributed to some growth in residential<br />
mortgage lending despite the contraction of the overall loan market.<br />
The total amount of residential loans outstanding increased from HK$ 473 billion in<br />
September 1997 to HK$ 532 billion at the end of 1999. Approximately 90% of mortgage<br />
lending is provided by 33 Authorized Institutions. The mortgage debt to GDP ratio is<br />
approximately 41%.<br />
Although the residential mortgage loan market achieved positive growth, the pace was<br />
strikingly slower than previous years. During the boom time in 1997 the monthly growth<br />
rate usually exceeded 2%. However in the subsequent two years, the rate slowed down to<br />
between 0.5% and 1.0%. The pace further slumped to a zero growth rate in the fourth<br />
quarter of 1999. In 1999, gross, new lending by authorized institutions was HK$ 119<br />
billion, which was 6.1% higher than 1998.<br />
Residential <strong>Mortgage</strong> <strong>Market</strong>* (HK$ million)<br />
Year <strong>Mortgage</strong> Debt<br />
Outstanding<br />
New Originations<br />
Gross<br />
1994 244,126 85,391<br />
1995 269,589 92,110<br />
1996 319,902 162,957<br />
1997 425,784 256,299<br />
1998 455,863 112,414<br />
1999 478,244 119,225<br />
Lending by authorized institutions; Source: HKMC<br />
<strong>Mortgage</strong> rates declined by approximately 50 basis points in 1999 to 8.5% by December.<br />
Given the sluggish market environment, banks have become more aggressive in attracting<br />
new mortgage business. In 1999, they used the following two tactics to attract borrowers:<br />
• Sub-prime, mortgage rates <strong>for</strong> a certain period of time (3-5 years)<br />
• Cash rebate on a percentage of the loan amount<br />
HKMC has estimated the financial effect of these options at approximately 50 basis<br />
points in yield.<br />
Countrywide <strong>International</strong> Consulting Services<br />
7 1
While fixed rate loans are offered, the typical Hong Kong, residential loan is a fully<br />
amortizing, floating rate loan, indexed to the Best Lending Rate (BLR), Hong Kong's<br />
prime rate. <strong>Mortgage</strong> rates have ranged from 1.75% over the BLR in 1994, to .25% in<br />
1998 and through BLR in 1999. The typical term ranges from 15 to 30 years but is<br />
usually 25 years. Since February 1994, the Hong Kong Monetary Authority (HKMA) has<br />
set the maximum, permissible LTV to 70%. For mortgages originated in 1999, the<br />
average LTV was 57.6%. The maximum debt-to-income ratio is 50%. Prepayments are<br />
allowed, but a penalty is assessed if a prepayment is made in the first year. Prepayment<br />
speeds during stable interest rate environments are 25-30% CPR, with the largest portion<br />
coming from turnover as buyers trade up to larger, better quality housing (DMG 18).<br />
Delinquency rates were relatively low. In 1999 HKMA reported a delinquency rate (more<br />
than 3 months) of 1.13%, up substantially from 1998.<br />
The market <strong>for</strong> mortgage securitization began to develop in the mid-1990s. In 1994 the<br />
HKMA issued guidelines that limited the Hong Kong banking community's mortgage<br />
exposure to 40% of their portfolios. At that time, many banks were at or near that limit.<br />
With a rapidly growing mortgage market, banks had to sell or securitize parts of their<br />
mortgage portfolio to comply with the HKMA guidelines. Soon after, the first mortgage<br />
backed security was issued in 1994. Since then, a variety of HK$- and US$-denominated<br />
MBS issues have come to market and have been sold both in Hong Kong and abroad.<br />
The Hong Kong <strong>Mortgage</strong> Corporation (HKMC), loosely modeled after USA's FNMA,<br />
was established in March 1997 with initial capital of HK$1 billion from the Exchange<br />
Fund (the paid-up capital has been increased to HK$2 billion together with a HK$1<br />
billion capital which can be called up if necessary). Its primary objective is the promotion<br />
of developing the secondary mortgage market in Hong Kong. A liquid, secondary<br />
mortgage market will help the authorized institutions address the above mentioned risks.<br />
In case of necessity, institutions can sell their mortgage loans in the secondary market to<br />
raise liquidity, by which they can manage their risks effectively.<br />
As of December 1999, the HKMC portfolio had 6,744 loans with outstanding principal<br />
balances of HK$ 8,752 million. HKMC has funded its purchases through a combination<br />
of discount and medium-term notes. HKMC issued two MBS’s in 1999, an issue of HK$<br />
1 billion <strong>for</strong> Dao Heng Bank in October and a deal of HK$ 630 million <strong>for</strong> American<br />
Express Bank in December. Both transactions were swaps (“back-to-backs”) of<br />
mortgages <strong>for</strong> HKMC securities (which have a 10% risk weight as opposed to a 50%<br />
whole loan risk weight).<br />
Policy Development<br />
HKMC launched a mortgage insurance program (MIP) in March 1999. Under the MIP,<br />
the HKMC provides insurance cover at a fee to approved sellers <strong>for</strong> an amount up to 15%<br />
of the property value. This allows banks to make loans with an LTV ratio up to 85%,<br />
without taking on additional risks. The insurance is written by private mortgage insurers<br />
and re-insured by HKMC.<br />
Sources and References<br />
Countrywide <strong>International</strong> Consulting Services<br />
7 2
1. IMF Statistics, 2000<br />
2. <strong>International</strong> Monetary Fund<br />
3. CIA World Factbook 2000 – Hong Kong<br />
4. Bank of East Asia, Economics Department<br />
5. Hong Kong <strong>Mortgage</strong> Corporation, Bi Monthly Report January 2000<br />
6. Hong Kong Monetary Authority<br />
7. Asian Development Bank<br />
Contacts<br />
1. Hong Kong <strong>Mortgage</strong> Corporation<br />
Office Address<br />
7th Floor Gloucester Tower<br />
11 Pedder Street<br />
2. Central Hong Kong SAR<br />
Telephone: (852) 2536 0000<br />
Fax: (852) 2536 0095<br />
http://www.hkmc.com.hk/<br />
3. Hong Kong <strong>Housing</strong> Authority<br />
33 Fat Kwong Street, Ho Man Tin<br />
Kowloon Hong Kong<br />
Tel: 852.2714.5119<br />
http://www.info.gov.hk/hd<br />
4. Hong Kong Monetary Authority<br />
30 th Fl, Garden Road, Hong Kong<br />
Tel: 852.2878.8196<br />
Fax: 852.2878.8197<br />
INDIA<br />
Economic Background<br />
Year Exchange Rate<br />
Rupee/US$<br />
Consumer Price<br />
Index<br />
Countrywide <strong>International</strong> Consulting Services<br />
Change In<br />
Consumer Prices<br />
Rupee US$<br />
Nominal GDP<br />
(Millions)<br />
Nominal GDP<br />
(Millions)<br />
1990 17.50 199.00 408,662 23,352<br />
1991 22.74 225.00 13.07% 477,814 21,012<br />
1992 25.92 243.00 8.00% 552,768 21,326<br />
1993 30.49 264.00 8.64% 630,772 20,688<br />
1994 31.37 289.00 9.47% 799,077 25,473<br />
1995 32.43 317.00 9.69% 943,408 29,091<br />
1996 35.43 350.00 10.41% 1,103,238 31,139<br />
1997 36.31 372.00 6.29% 1,285,259 35,397<br />
1998 41.26 429.00 15.32% 1,426,670 34,578<br />
1999 43.42 437.00 3.86% 1,646,610 37,925<br />
Source: IMF<br />
7 3
During the fiscal year (FY), 1999/2000 (ending 31 March), the Indian economy was on<br />
the way to recovery, with industrial output clearly on an upward trend. The industry<br />
sector grew, with the index of industrial production up by 6.2 percent during the first nine<br />
months of the year, compared with 3.7 percent in the previous corresponding period.<br />
However, because of weaker per<strong>for</strong>mance of the agriculture sector, GDP growth in FY<br />
1999/2000 declined to 5.9 percent, compared with 6.8 percent in the previous year.<br />
Inflation was down considerably to less than 4% from 15% the year be<strong>for</strong>e. By the end of<br />
February 2000, <strong>for</strong>eign exchange reserves (excluding gold and special drawing rights),<br />
estimated at $32.8 billion or eight months equivalent of imports, had increased by $3.3<br />
billion, compared with the level at the end of last fiscal year. Reflecting the stable outlook<br />
of the external economy, the pressure on the exchange rate eased, compared with that of<br />
the previous year.<br />
The fiscal situation at both central and state levels continued to deteriorate. This caused<br />
further concern <strong>for</strong> maintaining macroeconomic balances. In view of the rapidly growing<br />
fiscal deficit, the central Government's budget <strong>for</strong> FY 1999/2000 proposed several<br />
measures <strong>for</strong> fiscal strengthening. The budget simplified excise taxes and customs duties,<br />
raised levels of income taxes and corporate taxes, and increased duty rates and the prices<br />
of diesel fuel. The budget also proposed to quicken the pace of privatization with a target<br />
of Rs100 billion <strong>for</strong> FY 1999/2000.<br />
<strong>Housing</strong> <strong>Market</strong>s<br />
India’s population is the second largest in the world. In 1991 (the last census conducted)<br />
there were846 million in the country accounting <strong>for</strong> 16 per cent of the world’s population.<br />
It is estimated that India’s population surpassed 1 billion in 1999. In India, the major<br />
driver <strong>for</strong> housing finance is the country's large population and growing urbanization. The<br />
urban population comprised 20% of total population in 1971, increased to 26% in 1991<br />
and it is estimated at 30% in 1997.<br />
The total housing stock in the country was 148 million units in 1991; however, the<br />
useable housing stock was only 133.8 million units in 1991. India continues to face the<br />
problem of shortage of housing units in the country. The housing shortage was 23.3<br />
million units in 1981, and it came down to 22.9 million in 1991. It is estimated that the<br />
shortage may come down to a level of 19.4 million units by the year 2001.<br />
Historically, housing has been a self-help activity <strong>for</strong> a majority of households. A major<br />
portion of the cost of a dwelling unit is financed out of personal savings, borrowings from<br />
friends, relatives and from the in<strong>for</strong>mal sector. In the last thirty years, the entry of<br />
financial intermediaries in the <strong>for</strong>mal sector has facilitated the creation of housing stock.<br />
Despite the progress made thus far, significant housing shortages still exist. It is estimated<br />
that by 2001, there will be a shortage of 23 million units. Historical and projected trends<br />
in overall housing needs are shown in the table below:<br />
<strong>Housing</strong> In<strong>for</strong>mation<br />
Indicator (Millions) 1961 1971 1981 1991 2001<br />
Countrywide <strong>International</strong> Consulting Services<br />
7 4
Population 439.2 548.2 685.2 814.6 1000.0<br />
No of Households 83.5 97.1 123.4 146.1<br />
Total <strong>Housing</strong> Stock 79.3 93.0 116.7 149.0 179.0<br />
Below Standard <strong>Housing</strong> 11.0 10.4 16.6 33.9<br />
Usable <strong>Housing</strong> Stock 68.3 82.6 100.1 115.1 164.0<br />
<strong>Housing</strong> Shortage 15.2 14.5 23.3 31.0 23.0<br />
Rural Share 11.6 11.6 16.3 21.0 13.0<br />
Urban Share 3.6 2.9 7.0 10.0 10.0<br />
Source: NHB: Annual Report<br />
<strong>Mortgage</strong> <strong>Market</strong>s<br />
The Indian, housing finance system is relatively small, even by developing country<br />
standards. The ratio of mortgage debt outstanding to GDP is approximately 1%. The<br />
major reasons <strong>for</strong> the small size of the sector are the legacy of the directed credit system<br />
that did not allow traditional, financial institutions to competitively provide mortgage<br />
loans and the weak legal system that did not support the rights of mortgage lenders in the<br />
event of default. <strong>Housing</strong> finance has traditionally been provided by specialized, housing<br />
finance companies (HFCs), supported by regulatory preferences and refinancing from the<br />
National <strong>Housing</strong> Bank (NHB).<br />
The commercial banks are the largest mobilizer of savings in the country. The household<br />
sector’s savings in financial assets have been steadily increasing over the last three years<br />
from 8.9% of GDP in 1995-96 to 10.8% in 1996-97 and further to 11.4% in 1997-98.<br />
However, in the past, the savings mobilized were not lent back to the households <strong>for</strong><br />
shelter purposes. The reluctance on the part of the banks to extend credit <strong>for</strong> housing as a<br />
regular part of their business was basically due to their perceived role of financing<br />
working, capital needs of commerce, industry and trade. Yet another factor was that the<br />
banks did not want to tie up their short-term resources in extending long-term housing<br />
loans. Today, in India the commercial banks are required to earmark a minimum of 3% of<br />
their incremental deposits <strong>for</strong> extending to the housing sector. For the current year, 1999-<br />
2000, this works out to Rs 36,000 million (approx. US $ 827 million).<br />
The housing finance companies (HFCs) are the main housing finance providers in India.<br />
Currently, 26 HFCs are approved by NHB <strong>for</strong> refinance. Among the 26, six HFCs have<br />
more than 90% market share. The top six include: <strong>Housing</strong> Development <strong>Finance</strong><br />
Corporation (HDFC), Life Insurance Corporation <strong>Housing</strong> <strong>Finance</strong> (LIC), Canfin Homes<br />
(Canfin), GIC <strong>Housing</strong> <strong>Finance</strong> (GIC), SBI Home <strong>Finance</strong> (SBI Homes) and Dewan<br />
<strong>Housing</strong> <strong>Finance</strong> Corporation Ltd. (Dewan). The top six HFCs have grown at a<br />
Compound Annual Growth Rate (CAGR) of about 24% between 1994 and 1998, and<br />
cumulative disbursements as of March 1998 of Rs 19,200 crore (US$4.6 billion). HDFC<br />
continues to be the market leader with its market share (in terms of disbursements) having<br />
increased from 53% in 1994 to 69% in 1998. HDFC is the biggest player with a total<br />
1998 resource base (total liabilities and net worth) of Rs 9,926 crore (US$2.8 billion).<br />
The other sets of specialized housing finance institutions are the co-operative housing<br />
finance societies. They essentially have a two-tier structure. They are comprised of the<br />
Apex Cooperative <strong>Housing</strong> <strong>Finance</strong> Society (ACHFS) at the State level and the Primary<br />
Countrywide <strong>International</strong> Consulting Services<br />
7 5
Cooperative <strong>Housing</strong> <strong>Finance</strong> Society (PCHFS) at the retail level. There are 25 State level<br />
Apex societies, and the number of registered cooperative housing finance societies in the<br />
country is 90,000.<br />
Most housing finance institutions offer a standard, fixed rate mortgage to prospective<br />
borrowers. Usually, the housing loan can be repaid over a maximum period of 15 years.<br />
Repayment does not extend beyond the retirement age of a person (60 years) if employed<br />
or 65 years of age if self employed. Repayment of the loan is done through the equal,<br />
monthly installment method.<br />
The lender is required to pay a tax to the Government on interest income at the rate of 2%<br />
per annum. The lenders usually pass on this tax burden to the borrower. The banks and<br />
the housing finance companies also levy a fee <strong>for</strong> processing the application, and it varies<br />
between 0.5% to 1% of the loan amount. They also charge what is known as an<br />
administration fee of 1% of the loan amount.<br />
The interest rate on housing loans offered by the housing finance companies has been<br />
falling in the recent years, and as of the beginning of 2000 it reached the lowest in the last<br />
17 years. The interest rate on a loan amount of Rs 500,000 (US $ 11,765), which used to<br />
be in the range between 14.5-15.5% a year ago, has come down 100 basis points.<br />
Similarly, there has been a 100 basis points across the board reduction in the interest rates<br />
<strong>for</strong> loan amounts beyond Rs 500,000. The Reserve Bank of India has given the freedom<br />
to commercial banks to fix the interest rates on term loans beyond Rs 200,000. These<br />
rates are related to commercial bank’s prime lending rates, which is in the range of 12.5<br />
to 13% per annum. Since the cost of funds to the banking system is lower than the cost of<br />
funds to the specialized institutions, their interest rates are comparatively lower than the<br />
rates charged by the specialized, housing finance institutions.<br />
<strong>Housing</strong> Loans (in Rs million)<br />
1994-95 1995-96 1996-97 1997-98 1998-99<br />
Commercial<br />
7,486 7,992 18,056 10,767 * 14,972 *<br />
Banks<br />
<strong>Housing</strong><br />
<strong>Finance</strong><br />
Companies<br />
35,243 39,035 46,277 57,834 74,134<br />
ACHFS 5,303 3,430 3,147 5,196<br />
ARDBs 264 385 387 730 1,127<br />
Source: Vora * Allocation in respective years<br />
Apart from the various financial institutions mentioned above, which act as retail lenders,<br />
the Central and the State Governments also support housing finance. The Central<br />
Government has also set up the <strong>Housing</strong> & Urban Development Corporation (HUDCO),<br />
a housing finance company, to finance and undertake housing and urban development<br />
programs, to develop land <strong>for</strong> satellite townships, and also set up building centers. The<br />
State Governments, besides implementing the social housing schemes <strong>for</strong>mulated by the<br />
Central Government, also <strong>for</strong>mulate their own schemes <strong>for</strong> providing houses to the poor.<br />
Countrywide <strong>International</strong> Consulting Services<br />
7 6
The Life Insurance Corporation of India (LIC), as well as the General Insurance<br />
Corporation of India (GIC), support housing activity both directly and indirectly. LIC is<br />
statutorily required to invest 25 per cent of its net annual accretion in socially oriented<br />
schemes including housing. In June 1989, the LIC promoted a housing finance subsidiary,<br />
to lend directly to the public. GIC and its subsidiaries are required to invest 35% of their<br />
annual accretion by way of loans to socially oriented sectors. In July 1990, GIC<br />
established a separate subsidiary as a housing finance company to lend to the individuals<br />
directly and to provide funds <strong>for</strong> its operations.<br />
Policy Developments<br />
The housing finance system of India is poised <strong>for</strong> rapid growth and development. During<br />
the last few years, the market has seen significant growth reflecting a combination of<br />
economic growth, falling interest rates and financial sector deregulation. The growth of<br />
market-rate lending is likely to increase <strong>for</strong> several reasons including: (1) the introduction<br />
of a variety of fiscal incentives to borrowers and lending institutions; (2) the entry of<br />
major, new players into the mortgage lending business; (3) continuation of the favorable<br />
interest rate environment; and (4) development of new, institutional mechanisms to fund<br />
housing and re-allocate mortgage risk.<br />
The entry of new lenders is a major new development. The dominance of housing finance<br />
by the HFCs has been due partly to restrictions previously imposed on the banking sector.<br />
These restrictions are being removed and the overlap and competition between sectors is<br />
increasing. As a result, bank lending <strong>for</strong> housing is rising rapidly. At the same time that<br />
banks are targeting housing lending, additional, significant competition to HFCs has<br />
arisen from large, wholesale funded institutions, such as HUDCO (a government agency),<br />
Industrial Credit and Investment Corporation of India (ICICI), and Industrial<br />
Development Bank of India (IDBI). These institutions have recently declared an avid<br />
interest in making retail, housing loans. In addition, the big players in non-housing,<br />
consumer finance, including Sundaram and Tata, are implementing major housing<br />
lending ef<strong>for</strong>ts.<br />
The entry of new lenders has major implications <strong>for</strong> the funding needs of the sector. The<br />
HFCs have traditionally relied on bond finance and loans from the National <strong>Housing</strong><br />
Bank (NHB). More recently, many HFCs have shifted their fund-raising ef<strong>for</strong>ts towards<br />
raising fixed deposits from the public. The new entrants have, by and large, access to low<br />
cost deposits (banks) or capital markets (non-bank institutions).<br />
The NHB has played an important role in the development of the sector. Since its<br />
creation in 1988, the NHB has provided long-term funds to housing finance companies<br />
(HFCs), enabling them to expand both their volume of lending and term of individual<br />
loans. It has regulated and promoted these specialized, housing finance lenders. More<br />
recently, it has taken the lead in an important project to create the first Indian, mortgagebacked<br />
security.<br />
Creation of a secondary mortgage market in India faces significant and well-known<br />
obstacles. The most important of these obstacles are the weak, legal position of the<br />
Countrywide <strong>International</strong> Consulting Services<br />
7 7
mortgage and the imposition of stamp duties from three to seventeen percent on the<br />
registration and transfer of mortgage loans. There is promise <strong>for</strong> improvement in this<br />
area. The Reserve Bank of India (RBI) has created a working group to identify and<br />
recommend legislative and regulatory changes to improve the environment <strong>for</strong><br />
securitization. Some of the state governments have realized the importance of mortgage<br />
securitization and have reduced the stamp duty payable on the instrument of<br />
securitization to 0.1%.<br />
The <strong>Finance</strong> Act of 1999 announced a number of benefits <strong>for</strong> housing, which led to a<br />
spurt in the growth of retail lending during the year. These benefits included an increase<br />
in the tax exemption limit <strong>for</strong> interest on housing loans <strong>for</strong> self-occupied houses from Rs<br />
30,000 to Rs 75,000 and an increase in the depreciation rate on certain categories of<br />
corporate owned housing from 20% to 40%. In addition, scheduled commercial banks<br />
were required to earmark 3% (as against 1.5% earlier) of their incremental deposits <strong>for</strong><br />
housing.<br />
The <strong>Finance</strong> Act of 2000 has further enhanced benefits <strong>for</strong> individual homebuyers.<br />
Benefits under the current <strong>Finance</strong> Act include an increase in the tax exemption limit <strong>for</strong><br />
interest on housing loans <strong>for</strong> self-occupied houses from Rs 75,000 to Rs 1,00,000, an<br />
increase in benefit <strong>for</strong> principal repayments on housing loans under Rs 10,000 to Rs<br />
20,000 and exemption of capital gain tax <strong>for</strong> proceeds invested in a second house. These<br />
measures, together with the lower lending rates, stable property prices and increased<br />
income levels, have led to a substantial growth in retail business.<br />
Recently, a number of initiatives have been taken to improve the access of a majority of<br />
the population to the <strong>for</strong>mal finance sector. The Reserve Bank of India has set up a<br />
working group to study the functions of the Self-Help Groups (SHG) and Non-<br />
Governmental Organizations (NGOs). The study will examine their capacities <strong>for</strong><br />
expanding activities and deepening their roles, linking SHGs with banks, and capacity<br />
building of NGOs etc. Similarly, the emergence of the microfinance sector is also of<br />
recent origin in India. A few community based financial institutions (CFIs) also emerged.<br />
Sources and References<br />
1. Asian Development Bank, Annual Report 1999<br />
2. Diamond, D., “Prospects For <strong>Mortgage</strong> Securitization In India And The Potential<br />
Role For The ADB, Report <strong>for</strong> the Asian Development Bank, March 2000<br />
3. <strong>Housing</strong> <strong>Finance</strong> Development Corporation, Annual Report 1998,<br />
www.hdfcindia.com<br />
4. World Bank, www.worldbank.org<br />
5. IMF: <strong>International</strong> Financial Statistics, 2000 www.imf.org<br />
6. National <strong>Housing</strong> Bank, Annual Reports, 1997-1998<br />
7. Vora, P.P., The Indian <strong>Housing</strong> <strong>Finance</strong> System, <strong>Housing</strong> <strong>Finance</strong> <strong>International</strong>,<br />
December 1999<br />
Countrywide <strong>International</strong> Consulting Services<br />
7 8
Japan<br />
Economic Background<br />
Year Exchange Rate<br />
Yen/US$<br />
Consumer Price<br />
Index<br />
Countrywide <strong>International</strong> Consulting Services<br />
Change In<br />
Consumer Prices<br />
Yen US$<br />
Nominal GDP<br />
(Billions)<br />
Nominal GDP<br />
(Billions)<br />
1990 144.79 93.44 3.06% 430,040 2,970.09<br />
1991 134.71 96.49 3.27% 458,299 3,402.12<br />
1992 126.65 98.16 1.73% 471,064 3,719.42<br />
1993 111.20 99.40 1.26% 475,381 4,275.01<br />
1994 102.21 100.09 0.70% 479,260 4,688.97<br />
1995 94.06 100.00 -0.09% 483,220 5,137.36<br />
1996 108.78 100.13 13.00% 500,310 4,599.28<br />
1997 120.99 101.84 1.71% 507,852 4,197.47<br />
1998 130.91 102.50 65.00% 495,211 3,782.84<br />
1999 101.63 102.60 -0.19% 496,201 4,882.43<br />
Source: IMF<br />
In the wake of overheated economic per<strong>for</strong>mance in the late 1980's, Japan's bubble<br />
economy collapsed. Over the 1990s, the Japanese economy has dealt with sweeping<br />
financial and industrial re<strong>for</strong>ms. Following the recession of 1992, the country<br />
experienced a recovery lasting four years, largely due to stimulative fiscal policies, only<br />
to fall once again. In 1998, GDP growth fell 3%, and in 1999, it dropped another 10%.<br />
Inflation has been virtually non-existent in the last 10 years, with prices actually falling in<br />
1995 and 1999. Unemployment has experienced an upward trend over the entire decade.<br />
It peaked at 5% in 1999, a record <strong>for</strong> Japan; and the IMF expects it to go higher this year.<br />
Japan's economic difficulties stem from trouble in their financial markets. The magnitude<br />
of bad debt held by Japanese banks sparked the 1992 recession and paved the way <strong>for</strong><br />
wholesale re<strong>for</strong>m of Japan's financial system. Initiated by Prime Minister Hashimoto in<br />
November 1996, the so-called "big bang" plan calls <strong>for</strong> rapid write-down of underper<strong>for</strong>ming<br />
assets, increased oversight of institutions, accompanied with liberalization of<br />
capital controls and the introduction of previously prohibited financial instruments. These<br />
are all aimed at stabilizing and modernizing Japan's financial markets.<br />
To support investment during the structural re<strong>for</strong>ms, the Bank of Japan has maintained a<br />
"zero interest rate" policy. Since September 1995, the official discount rate has been held<br />
at 0.5%. Short-term, interest rates have declined accordingly, and since March 1999,<br />
they have been virtually zero, with long-term rates only slightly higher.<br />
With the stabilization of the financial system, the Yen has recently strengthened. After<br />
weakening steadily from 1995 to 1998, the exchange rate bottomed at Y145/$ in August<br />
1998. The Yen strengthened over 1999 to finish the year at Y102/$. However, this has<br />
hurt export per<strong>for</strong>mance in a country that relies heavily on international trade. As of<br />
August, the trade surplus <strong>for</strong> the year had dropped 9% in 1999 from the same period in<br />
1998, even though the bilateral surplus with the U.S. had increased.<br />
7 9
In spite of the economic challenges of the last 10 years, Japanese households are among<br />
the wealthiest and fiscally conservative in the world. Per capita, GDP is $36,539.<br />
Savings rates are extremely high, and debt burdens are extremely low, compared to<br />
income and expenditures. Personal bankruptcies are also very low; in 1997, they<br />
numbered only 600 per million in population (compared to 4,700 in the U.S).<br />
<strong>Housing</strong> <strong>Market</strong><br />
In 1993, there were nearly 46 million dwellings in Japan. 59.8% of these dwellings were<br />
owner-occupied. By the end of 1999, the number of homes reached 50 million. The<br />
owner-occupied rate has drifted downward since the mid-eighties peak of 62.4%, a trend<br />
brought about by high property prices and the sluggish economy. In 1987 and 1988, over<br />
half of new housing starts were <strong>for</strong> rental units. However, this trend has reversed. By<br />
1997, only 38% of new starts were <strong>for</strong> rental units with the slack being made up by homes<br />
built <strong>for</strong> sale.<br />
In the 1990s, residential investment fell, particularly in the last few years of the decade.<br />
After average annual increases of 4.5% from 1993-96, residential investment fell 16.3%<br />
in 1997, 13.7% in 1998 and about 6% in 1999.<br />
<strong>Housing</strong> Starts by Type of Use (thousands of units, %)<br />
Year Total <strong>Housing</strong><br />
Starts<br />
Countrywide <strong>International</strong> Consulting Services<br />
Owner-Occupied Rental <strong>Housing</strong> Employer-<br />
Supplied<br />
<strong>Housing</strong> For Sale<br />
1987 1,729 563 887 23 256<br />
1988 1,663 497 842 25 299<br />
1989 1,673 499 821 31 322<br />
1990 1,665 474 767 37 387<br />
1991 1,343 448 582 40 273<br />
1992 1,420 482 687 35 217<br />
1993 1,510 537 652 31 290<br />
1994 1,561 581 574 28 378<br />
1995 1,485 551 564 26 345<br />
1996 1,630 636 616 26 352<br />
1997 1,341 451 516 24 351<br />
Source: Ministry of Construction (HSOJ<br />
<strong>Housing</strong> prices steadily increased in the early part of 1990s and hit their highest figures at<br />
the end of 1997. With economic and financial crises at hand, housing prices decreased<br />
dramatically by the end of 1998. From 1990 to 1997, the prices of detached homes in<br />
Tokyo fell by an average of 1.5% per year. Condominium prices dropped even more - an<br />
average of 4.7%/year. Nevertheless, prices are still quite high by world standards.<br />
Ready-built houses in Tokyo still cost an average of 6.9 times annual income and condos<br />
cost 5.1 times annual income. As shown by the chart below, the housing prices had<br />
recovered somewhat by the end of 1999 and continue to increase in the early part of 2000.<br />
Ready Built Houses/Condominiums<br />
Year Annual Income Price Price/ Income Price Price/ Income<br />
8 0
1990 767 6,528 8.5 6,123 8.0<br />
1991 828 6,778 8.2 5,900 8.1<br />
1992 875 6,269 7.2 5,066 5.8<br />
1993 854 5,873 6.9 4,488 5.3<br />
1994 854 5,752 6.7 4,409 5.2<br />
1995 856 5,737 6.7 4,148 4.8<br />
1996 842 5,785 6.9 4,238 5.0<br />
1997 853 5,864 6.9 4,374 5.1<br />
Source: HSOJ 106<br />
<strong>Mortgage</strong> <strong>Market</strong><br />
About half of mortgage lending in Japan comes from the public sector, and the other half<br />
comes from the private sector. Over 80% of public sector lending comes from the<br />
Government <strong>Housing</strong> Loan Corporation (GHLC). Most of the remaining public sector<br />
funding comes from the Pension Welfare Service Public Corporation (PWSPC). On the<br />
private sector side, the combination of city banks, regional banks and trust account banks<br />
provide about 75% of the total. Credit associations and labor banks provide about 20%<br />
of private sector funding, while insurance companies and financial institutions provide<br />
the rest.<br />
The GHLC, established in 1950 as a special public corporation, is the largest mortgage<br />
institution in the world. Its objectives are to provide long-term capital at subsidized<br />
interest rates <strong>for</strong> the construction and purchase of housing to principally middle-income<br />
earners. As of 1999, the GHLC held Y 71.2 trillion of the outstanding balance of housing<br />
loans in Japan. This is 39 % of the Y 183 trillion total outstanding balance. Pension<br />
companies have another 8.3% of outstanding loans. The largest private sector lenders are<br />
city banks (19% of outstanding). New housing loans originated by GHLC in 1999<br />
consisted of 550,000 loan totaling an estimated Y 1.2 trillion.<br />
New Originations<br />
Fiscal Year 1992 1993 1994 1995 1996 1997<br />
Y Billion % Y Billion % Y Billion % Y Billion % Y Billion % Y Billion %<br />
Public Sector 7,909 42% 11,747 50% 14,883 53% 12,983 36% 14,355 45% 11,699 41%<br />
GHLC 6,093 32% 9,443 40% 12,615 45% 10,784 30% 11,844 37% 9,607 34%<br />
PWSPC 1,293 7% 1,677 7% 1,624 6% 1,575 4% 1,935 6% 1,543 5%<br />
Other 523 3% 627 3% 644 2% 624 2% 576 2% 550 2%<br />
Private Sector 10,870 58% 11,793 50% 13,375 47% 23,440 64% 17,528 55% 16,942 59%<br />
Banks 6,899 37% 7,782 33% 9,275 33% 17,684 49% 13,153 41% 12,752 45%<br />
Credit assoc 2,229 12% 2,430 10% 2,701 10% 4,292 12% 3,435 11% 3,451 12%<br />
Life Insurance 1,138 6% 955 4% 738 3% 884 2% 661 2% 498 2%<br />
Other 605 3% 627 3% 662 2% 580 2% 278 1% 241 1%<br />
Total New Originations 18,779 100% 23,540 100% 28,258 100% 36,422 100% 31,882 100% 28,642 100%<br />
Source: GHLC HSOJ 114<br />
Outstanding Balance of <strong>Housing</strong> Loans (Trillion Yen)<br />
Fiscal Year 1992 1993 1994 1995 1996 1997 1998 %<br />
Countrywide <strong>International</strong> Consulting Services<br />
8 1
Public Sector<br />
55.07 61.92 70.44 69.93 75.76 78.96 80.78 47%<br />
GHLC 43.59 49.17 57 57.25 62.45 64.87 66.28 82%<br />
PWSPC 8.41 9.35 10.02 9.51 10.19 10.48 14.33 18%<br />
Other 3.06 3.41 3.42 3.17 3.12 3.61 0.00 -<br />
Private Sector 77.54 79.31 80.77 89.39 89.41 89.78 91.82 53%<br />
Banks 44.08 44.69 45.74 52.53 56.52 60.15 37.56 41%<br />
Credit<br />
10.7 11.4 12.19 14.18 15.46 60.15 0.00 -<br />
Association<br />
Life Insurance 6.36 6.52 6.42 6.45 6.15 5.93 3.21 4%<br />
Other 16.4 16.69 16.41 16.23 11.28 7.05 8.17 9%<br />
Total 132.61 141.24 151.21 159.32 165.17 168.74 172.6 100%<br />
Source: GHLC<br />
GHLC mortgage terms vary depending on the particular program <strong>for</strong> which a borrower<br />
applies. The main criteria are based on the region, the type of structure and the floor size<br />
of the property. In 1998, a borrower with a newly-built wooden house under 175 square<br />
meters in a metropolitan area would receive a fixed rate mortgage <strong>for</strong> 10 years at 2.75%,<br />
and then adjust to 3.55% <strong>for</strong> the remaining 15 years of the mortgage.<br />
In July 1994, the Ministry of <strong>Finance</strong> stopped regulating mortgage rates, allowing<br />
institutions to fix rates at their discretion (JHLS 2). This deregulation liberalized<br />
mortgage financing significantly. Since then, many new types of mortgage products have<br />
been offered. In addition to conventional fixed and variable rate products, offerings<br />
include convertible loans (after initial fixed periods of 3, 5, or 10 years) and floating rate<br />
loans indexed to various interest rates.<br />
Almost 60% of outstanding loans were floating rate loans as of 1997. This represents a<br />
decline from nearly 70% in 1994, as many homeowners have recently locked in newer,<br />
low fixed rate products. Since 1990, private sector, fixed, mortgage rates have fallen<br />
from 8.3% to 4.7%. Start rates on variable rate, private mortgages have fallen from 8.5%<br />
to 2.6% over the same period. The typical LTV ratio on mortgages is 50-60%.<br />
Interest Rates<br />
Year Interbank Money<br />
<strong>Market</strong><br />
Deposit Rate <strong>Mortgage</strong><br />
Fixed (5 year)<br />
Countrywide <strong>International</strong> Consulting Services<br />
<strong>Mortgage</strong><br />
Variable<br />
Gov't Bond Yields<br />
Long-Term<br />
1990 7.24% 3.56% 8.28% 8.5% 7.36%<br />
1991 7.46% 4.14% 7.32% 6.9% 6.53%<br />
1992 4.58% 3.35% 6.60% 5.70% 4.94%<br />
1993 3.06% 2.14% 5.46% 3.80% 3.69%<br />
1994 2.20% 1.70% 6.00% 4.00% 3.71%<br />
1995 1.21% 0.90% 2.90% 3.25% 2.53%<br />
1996 0.47% 0.30% 3.50% 2.50% 2.23%<br />
1997 0.48% 0.30% 2.70% 2.50% 1.69%<br />
1998 0.37% 0.27% 2.60% 2.50% 1.10%<br />
1999 0.06%<br />
8 2
Source: IMF, GHLC<br />
The securitization market has begun to develop in Japan. The first securitization law, the<br />
Ministry of <strong>International</strong> Trade and Industry (MITI) law became effective in 1993. Since<br />
1997, asset securitization has accelerated <strong>for</strong> several reasons: 1) strong regulatory<br />
support continues to encourage it, 2) Japanese financial institutions can improve their<br />
regulated capital ratios, because securitization provides off-balance sheet treatment and 3)<br />
securitization provides alternative funding sources in a market facing liquidity problems.<br />
The first, significant, mortgage-backed security issue was developed in 1999. Arranged<br />
by Bear Stearns and Sanwa Securities, the Y 50 billion issue is collateralized by 5,169<br />
residential loans, and it has 4 senior classes and 1 mezzanine class. Sanwa Shinyo<br />
HOSHO KK, a subsidiary of Sanwa Bank, is the guarantor of the portfolio.<br />
The lack of legal and regulatory framework has prevented the development of a Japanese<br />
mortgage-backed securities market. Recently, the legal impediments have been relaxed<br />
through the adoption of several pieces of new legislation including the Perfection Law<br />
that permits perfection against third parties of assignments of claims by filing a<br />
registration with a local Legal Affairs Bureau.<br />
Policy Developments<br />
The <strong>Housing</strong> Construction Planning Law, enacted in 1966, outlines the objectives of<br />
housing policy in Japan. Each 5-year plan targets housing goals ranging from resolving<br />
housing shortages to upgrading urban housing standards. The objectives of the 7th<br />
<strong>Housing</strong> Construction 5-year Program, covering 1996 to 2000, were: 1) the <strong>for</strong>mation of<br />
good quality housing stock to meet the nation's needs, 2) the promotion of safe,<br />
com<strong>for</strong>table urban life and living environments, 3) provisions which foster an active<br />
elderly society and 4) <strong>for</strong>mation of good housing and living environment contributing to<br />
regional revitalization (HIJ 22). In this program, 7.3 million units were targeted <strong>for</strong><br />
construction with specific goals <strong>for</strong> public funding, rental housing <strong>for</strong> the elderly, and<br />
subsidized private funding.<br />
Sources and References<br />
1. IMF Statistics, 2000<br />
2. Bear Stearns, Japanese <strong>Housing</strong> Loans Securitization SHL 1999-1 Corporation Ltd.,<br />
May 1999<br />
3. Government <strong>Housing</strong> Loan Corporation, <strong>Housing</strong> Statistics of Japan 1998<br />
4. Japan External Trade Organization, The State of the Japanese Economy – Statistics<br />
and Trends through 3Q 1999<br />
5. <strong>International</strong> Monetary Fund, Japan: Economic and Policy Developments, October<br />
1999<br />
6. Central Intelligence Agency, The World Factbook, 1999 – Japan<br />
7. Government <strong>Housing</strong> Loan Corporation, <strong>Housing</strong> and the Government <strong>Housing</strong> Loan<br />
Corporation, Annual Report 1998<br />
Contacts<br />
Countrywide <strong>International</strong> Consulting Services<br />
8 3
1. Government <strong>Housing</strong> Loan Corporation<br />
Research and Survey Dept.<br />
1-4-10 Koraku, Bunkyo-ku<br />
Toyko 112-8570 Japan<br />
Tel: 81.3.5800.8076<br />
Fax: 81.3.5800.8257<br />
http://www.jyukou.go.jp<br />
Countrywide <strong>International</strong> Consulting Services<br />
8 4
Korea<br />
Economic Background<br />
Year Exchange Rate<br />
Won/US$<br />
Consumer Price<br />
Index<br />
Countrywide <strong>International</strong> Consulting Services<br />
Change In<br />
Consumer Prices<br />
Won US$<br />
Nominal GDP<br />
(Millions)<br />
Nominal GDP<br />
(Millions)<br />
1990 716.40 74.06 8.58% 178,797,000 249,577.05<br />
1991 760.80 80.94 9.30% 216,511,000 284,583.33<br />
1992 788.40 85.99 6.24% 245,700,000 311,643.84<br />
1993 808.10 90.09 4.77% 277,496,000 343,393.14<br />
1994 788.70 95.69 6.22% 323,407,000 410,050.72<br />
1995 774.70 100.00 4.50% 377,350,000 487,091.78<br />
1996 844.20 104.93 4.92% 418,479,000 495,710.73<br />
1997 1,695.00 109.58 4.44% 453,276,000 267,419.47<br />
1998 1,204.00 117.82 7.51% 449,509,000 373,346.35<br />
1999* 1,138.40 118.77 0.81% 483,777,800 424,962.93<br />
Source: IMF; *Bank of Korea<br />
With export-oriented industrialization, Korea enjoyed extensive growth, averaging over<br />
8% per annum <strong>for</strong> more than three decades. However, the Asian financial crisis of 1997<br />
revealed Korea’s inefficient and undisciplined financial sector causing the Korean<br />
economy to experience many challenges in the latter part of 1990s. In 1996, the current<br />
account deficit increased to $23 billion, amounting to approximately 5% of GDP. The<br />
Asian crisis resulted in massive depreciation of the Korean won. The value of the won,<br />
which had been approximately 900 per Dollar in October 1997, fell to 1,960 won per<br />
Dollar toward the end of 1997. The total, <strong>for</strong>eign debt also increased from approximately<br />
$29 billion at the end of 1989 to $105 billion at the end of 1996. By early 1997, a large<br />
number of non-per<strong>for</strong>ming loans had accumulated, causing many banks to be insolvent.<br />
With this large corporate insolvency, combined with the loss of confidence by investors, a<br />
mismatch of supply and demand was created in the domestic <strong>for</strong>eign exchange market.<br />
By November of 1997, Korea was in a state of defaulting on its debts. Consequently, the<br />
government turned to the IMF to request a financial package.<br />
Based on the agreement with the IMF, the Korean government pursued many economic<br />
and structural re<strong>for</strong>ms to stabilize the financial and corporate sectors. To restore<br />
confidence in the financial system, actions were taken to dissolve unsound financial<br />
institutions. To gain further confidence, an injection of public funds was put into viable<br />
institutions, while the IMF insisted on ef<strong>for</strong>ts to create efficient operations and a stable<br />
financial structure. The government also made ef<strong>for</strong>ts to increase efficiency in the<br />
financial sector by downsizing and privatizing appropriate public enterprises as well as<br />
discontinuing its control of the interest rates.<br />
The Korean economy has made substantial progress, and it is quickly recovering from its<br />
difficulties. GDP, which dramatically decreased in 1997 and 1998, was back into<br />
positive growth at a rate of 4.6% in the first quarter of 1999. The exchange rate has been<br />
8 5
stabilizing since the end of 1998 with 1,138 won per $1 at the end of 1999. Inflation has<br />
also fallen substantially, indicating a recovery <strong>for</strong> the Korean economy.<br />
<strong>Housing</strong> <strong>Market</strong><br />
The total housing stock, as of 1998, is estimated at 10.8 million units. The official census<br />
figures were 9.5 million units in 1995 and 7.3 million units in 1990 with the<br />
homeownership ratio being approximately 60%. Based on housing permits, the average,<br />
annual, housing production was about 621,000 during 1992-96 period. This figure<br />
declined to 596,400 in 1997 and further declined to 306,000 in 1998.<br />
<strong>Housing</strong> prices have steadily increased in the early part of 1990s and hit their highest<br />
figures at the end of 1997. With economic and financial crises at hand, housing prices<br />
decreased dramatically by the end of 1998. As shown by the chart below, the housing<br />
prices had recovered somewhat by the end of 1999 and continue to increase in the early<br />
part of 2000.<br />
<strong>Housing</strong> Price Nov. 1996 Oct. 1997 Nov. 1998 Aug.1999<br />
Seoul, Purchase Price 5,950 6,630 5,340 5,800<br />
Seoul, Chonsei Deposit 3,070 3,200 2,140 2,890<br />
New towns, Purchase Price 4,350 5,670 4,740 5,400<br />
New towns, Chonsei Deposit 2,250 2,470 1,610 2,710<br />
Exchange Rate (won/$) 829 965 1,234 1,185<br />
Source: Bu-dong-san Bank (thousand won per 3.3 sq. meters)<br />
The Ministry of Construction and Transportation (MOCT) revealed its plans in August of<br />
1999 to build between 500,000 and 600,000 houses, annually, <strong>for</strong> 3 consecutive years by<br />
the year 2002. It also announced a deregulation plan on non-construction zones in April<br />
of 2000. With these legislative changes, and with financial revitalization, the Korean<br />
housing market is expected to flourish in the next few years.<br />
<strong>Mortgage</strong> <strong>Market</strong><br />
Historically, the housing finance market has been largely dominated by the public sector.<br />
The National <strong>Housing</strong> Fund (NHF), the Korean <strong>Housing</strong> Bank and Kookmin Bank<br />
arranged all public funding. Life insurance companies, commercial banks and specialty<br />
finance companies provided private housing loans. These mortgages were primarily<br />
available to low and lower-middle income buyers with up to 40% of loan to value (LTV)<br />
ratios. Until 1997, the government controlled interest rates, keeping them below market<br />
and <strong>for</strong>cing the use of LTV as a rationing device.<br />
<strong>Mortgage</strong> Debt Outstanding (billion won) 1995 1996 1997 1998<br />
Public Sector<br />
National <strong>Housing</strong> Fund 19,300 22,872 26,456 29,486<br />
National Agricultural Cooperatives 1,275 1,562 1,869 2,077<br />
Private Sector<br />
<strong>Housing</strong> and Commercial Bank 14,192 15,076 16,839 17,157<br />
Countrywide <strong>International</strong> Consulting Services<br />
8 6
Commercial Banks 2,936 3,111 3,297 3,020<br />
Life Insurance Companies 1,143 1,202 2,057 762<br />
Installment <strong>Finance</strong> Companies 0 1,148 3,143 2,178<br />
Total (billion won) 38,846 44,971 53,661 54,680<br />
Source: Restructuring of the <strong>Housing</strong> <strong>Finance</strong> System and Broadening linkage with the Capital <strong>Market</strong>:<br />
"The <strong>Housing</strong> <strong>Finance</strong> <strong>Market</strong> in Korea", <strong>Housing</strong> and Commercial Bank. The Korean Experience; p52<br />
With the lack of readily available funds and complex application processes, many of the<br />
middle to upper class homebuyers had to resort to making all cash transactions, and many<br />
middle to lower-middle class households had to resort to rental housing through the<br />
“Chonsei” system. The Chonsei system is a rental contract where the tenant makes an upfront<br />
deposit, amounting usually to about half of the price of the house <strong>for</strong> a one or two<br />
year contract. Upon termination of the rental contract, through purchase or move, the<br />
lump sum amount is returned to the tenant.<br />
Interest rates were de-regulated in 1997 and commercial banks were allowed to make<br />
mortgage loans. In addition, the Korea <strong>Housing</strong> Bank was privatized, becoming the<br />
Korea <strong>Housing</strong> and Commercial Bank (H&CB).<br />
In an ef<strong>for</strong>t to inject additional funds into the housing market, the Korean government<br />
passed several laws starting in 1997, allowing <strong>for</strong> an establishment of the secondary<br />
mortgage market. A newly created conduit, The Korea <strong>Mortgage</strong> Corporation<br />
(KoMoCo), was set up as a joint venture by The Ministry of Construction and<br />
Transportation, Kookmin Bank, Korea Exchange Bank, H&CB, Samsung Life Insurance<br />
Co., and IFC. KoMoCo’s mandate is to securitize <strong>Housing</strong> Fund Loans as well as loans<br />
from private banks and other financial institutions. NewState Capital and The Korean<br />
<strong>Mortgage</strong> Corporation issued mortgaged-back securities worth 58.9 billion and 400<br />
billion won respectively at the beginning of 2000.<br />
All of these changes,, combined with privatization of previously public enterprises,, are<br />
enabling revitalization of the housing finance industry. The housing finance market is<br />
expected to grow substantially within the next few years.<br />
Policy Developments<br />
Significant policy changes with the goal to revitalize the real estate and housing finance<br />
industries have been made since 1997.<br />
� Privatization of the Korea <strong>Housing</strong> Bank – Initially set up by the government in 1967<br />
to provide a stable source of funds <strong>for</strong> housing, Korea <strong>Housing</strong> Bank held over 75%<br />
market share on new housing loans in 1995. As a result of the government’s<br />
commitment <strong>for</strong> a more efficient financial sector, KHB was privatized under the new<br />
name of <strong>Housing</strong> & Commercial Bank (H&CB) in 1996.<br />
� ABS and MBS Laws – The Korean government recently passed these two laws in<br />
relations to the housing market. These laws permit securitization of mortgages <strong>for</strong> the<br />
first time in Korea.<br />
Countrywide <strong>International</strong> Consulting Services<br />
8 7
� MBS Company Act 1999 – Recently passed law allowing <strong>for</strong> an establishment of<br />
Special Purpose Corporation to issue MBS in Korea.<br />
� MBS Tax Reduction Plan – The Ministry of <strong>Finance</strong> and Economy has plans to<br />
deduct a portion of the tax rate <strong>for</strong> small-sum purchasers of MBS to attract<br />
institutional as well as retail investors to the MBS market.<br />
� Maximum LTV Ratio – Starting in 1999, the Korean government increased the<br />
maximum Loan-to-Value Ratio from 40% to 65%.<br />
� Non-construction Zone Deregulation Plan – The government has plans to loosen the<br />
restrictions placed on non-construction zones to support the construction and real<br />
estate industries.<br />
� New <strong>Housing</strong> Plan – The Ministry of Construction and Transportation has announced<br />
its plans to build 500,000 to 600,000 houses <strong>for</strong> three consecutive years to assist lowincome<br />
buyers or renters.<br />
Sources and References<br />
1. <strong>International</strong> Monetary Fund, Statistics 2000<br />
2. CIA World Fact Book, “Korea, South” Online: Internet. August 2000. Available:<br />
http://www.odci.gov/cia/publications/factbook/geos/ks.html<br />
3. The Bank of Korea. Online: Internet. August 2000. Available:<br />
http://www.bok.or.kr/<br />
4. Ministry of Construction and Transportation. Online: Internet. May 2000.<br />
Available: http://www.moct.go.kr/mcte/e_index.htm<br />
5. Staff Writer, The Korea Herald. “Ministry unveils deregulation plan on nonconstruction<br />
zones” Online: Internet. May 2000. Available:<br />
http://www.koreaherald.co.kr/<br />
6. Staff Writer, The Korea Herald. “NewState Capital issues nation’s first MBS”<br />
Online: Internet. May 2000. Available: http://www.koreaherald.co.kr/<br />
7. Staff Writer, The Korea Herald. “KoMoCo issues mortgage-backed securities worth<br />
400 billion won” Online: Internet. May 2000. Available:<br />
http://www.koreaherald.co.kr/<br />
8. Korea Trade Promotion Corporation (KOTRA), In<strong>for</strong>mation about Korea – Economy.<br />
Online: Internet. May 2000. Available: http://www.kotra.or.kr/eng/info/main.php3<br />
9. Kim, Kyung-Hwan. <strong>International</strong> <strong>Housing</strong> <strong>Finance</strong> Sourcebook – Korea.<br />
10. Lee, Joong-hee and Lee, Sohan. <strong>International</strong> <strong>Finance</strong> Corporation, Restructuring of<br />
the <strong>Housing</strong> <strong>Finance</strong> System and Broadening Linkage with the Capital <strong>Market</strong>: The<br />
Korean Experience. 1998.<br />
11. BeVier, Michael. <strong>International</strong> Financial Corporation, Korea <strong>Mortgage</strong> Corporation.<br />
1999.<br />
12. Korea <strong>Mortgage</strong> Corporation. In<strong>for</strong>mation Package. 2000.<br />
13. NewState Capital. Study Tour to the U.S. – Korea Economic and <strong>Housing</strong> <strong>Market</strong><br />
Report. 2000.<br />
Countrywide <strong>International</strong> Consulting Services<br />
8 8
Malaysia<br />
Economic Background<br />
Year Exchange Rate<br />
currency/US$<br />
Consumer Price<br />
Index<br />
Countrywide <strong>International</strong> Consulting Services<br />
Change In<br />
Consumer Prices<br />
Ringgit US$<br />
Nominal GDP<br />
(Millions)<br />
Nominal GDP<br />
(Millions)<br />
1990 2.70 80.88 115701 42812.58<br />
1991 2.75 84.40 4.35% 132381 48138.55<br />
1992 2.55 88.43 4.77% 148537 58249.80<br />
1993 2.57 91.55 3.53% 165206 64282.49<br />
1994 2.62 94.96 3.72% 190274 72623.66<br />
1995 2.50 100.00 5.31% 218671 87468.40<br />
1996 2.52 103.49 3.49% 253732 100687.30<br />
1997 2.81 106.24 2.66% 281889 100316.37<br />
1998 3.92 111.84 5.27% 284474 72569.90<br />
1999* 3.80 114.91 2.74% 300,349 79,039<br />
Source: IMF; *Central Bank of Malaysia<br />
Like many countries in Asia, Malaysia was enjoying prosperous growth until the financial<br />
crisis in the region greatly impacted its economy. Despite the ef<strong>for</strong>ts made by the<br />
government to restore stability and confidence in financial markets by tightening the<br />
monetary policy, equity prices and the exchange rates continually fell. By the end of<br />
1997, the Malaysian currency had fallen 35 percent from the previous year, and the Kuala<br />
Lumpur Stock Exchange composite index fell 52 percent. In order to stabilize the<br />
economy, the government made a radical decision to suspend convertibility of the ringitt,<br />
which may impact future flows of <strong>for</strong>eign investment.<br />
Business and consumer confidence declined, causing contraction of consumer and<br />
investment spending by 1998. This led to difficulties <strong>for</strong> institutions in the financial<br />
sector as they faced the rising of non-per<strong>for</strong>ming loans and capital losses, simultaneously<br />
causing extreme conservatism in lending practices.<br />
Starting in 1998, the Malaysian government began making policy changes to support<br />
strengthening the financial system. It purchased non-per<strong>for</strong>ming loans by increasing<br />
government spending, indexed the exchange rate of the ringgit to the Dollar, reduced<br />
interest rates, and also implemented the restructuring of financial and corporate sectors<br />
<strong>for</strong> better controls <strong>for</strong> long-term stability of its economy.<br />
Interest Rates<br />
Year Money <strong>Market</strong> Treasury Bill Deposit Rate Base Lending Rate<br />
1990 6.81% 6.12% 5.90% 7.17%<br />
1991 7.83% 7.27% 7.18% 8.13%<br />
1992 8.01% 7.66% 7.97% 9.31%<br />
1993 6.53% 6.48% 7.04% 9.05%<br />
1994 4.65% 3.68% 4.94% 7.61%<br />
1995 5.78% 5.50% 5.93% 7.63%<br />
8 9
1996 6.98% 6.41% 7.09% 8.89%<br />
1997 7.61% 6.41% 7.78% 9.53%<br />
1998 8.46% 6.86% 8.51% 10.61%<br />
1999 3.38% 3.53% 4.21% 7.29%<br />
Source: IMF<br />
By the end of 1999, most sectors of the Malaysian economy were well on their way to<br />
recovery. Benchmark index and market capitalization had doubled in the Kuala Lumpur<br />
Stock Exchange since the previous year.<br />
<strong>Housing</strong> <strong>Market</strong><br />
With the decline of consumer confidence, asset prices, including property value, declined<br />
during the financial crisis. The Malaysian House Price Index (IHRM) declined by 9.4%<br />
in 1998 from the previous year. With the economy on its way to recovery, the IHRM<br />
declined by only 2.3% in 1999, compared to 1998, and the residential prices are expected<br />
to fully recover by the end of 2000.<br />
House Price Indicators (Types of <strong>Housing</strong>)<br />
Year IHRM Terraced Semi-detached Detached High-Rise Unit<br />
1990 4.1 5.3 4 1.3 8<br />
1991 25.5 13.5 10 14.3 7.2<br />
1992 12.2 8.8 7.5 10.1 0.1<br />
1993 4.9 4.4 3.3 7.5 -1.4<br />
1994 8 8.7 6.5 12 6.1<br />
1995 18.4 13.1 9.8 15.7 4.2<br />
1996 12.9 10.2 8.1 14.1 -1<br />
1997 1.9 10 2.9 4.3 -4.8<br />
1998 -9.4 -4.8 -8.1 -13.6 -6.2<br />
1999 -2.3 -3.5 -4.4 -6.7 -3.7<br />
Source: Department of Valuation and Property Services<br />
In January of 1999, a policy was introduced where banking institutions were no longer<br />
allowed to fund developments on new, residential properties costing more than RM<br />
250,000 per unit. This policy was intended to make sure that proper allocations of funds<br />
occurred in the sector of housing that needed an increase in supply.<br />
In 1999, a second, home ownership campaign was launched to clear out the excess stock<br />
of residential properties amounting to RM39 billion. 21.6% of the offered properties<br />
were sold with total market worth of RM 2.1 billion.<br />
Construction Sector Indicators<br />
Sales & Advertising Permits <strong>Housing</strong><br />
Loans <strong>for</strong> construction (RM million)<br />
Year New Renewals Approvals<br />
New Outstanding<br />
1995 717 906 113,183 16,084.5 20,232.9<br />
1996 729 930 115,540 19,393.5 27,787.2<br />
1997 867 919 188,400 18,631.9 42,615.9<br />
Countrywide <strong>International</strong> Consulting Services<br />
9 0
1998 612 1,255 194,092 5,619.8 45,091.7<br />
1999 705 1,102 183,041 7,893.7 43,646.8<br />
Source: Department of Valuation and Property Services<br />
As most of the sectors in Malaysia’s economy are recovering, the construction sector is<br />
still lagging as the only sector to show two, consecutive years of decline. However, as a<br />
percentage of total loans, loans made against properties increased from 35.1% in<br />
September of 1998 to 36.8% <strong>for</strong> the same period in 1999. The percentage of loans <strong>for</strong><br />
residential property increased from 9% to 11.5% during the same period.<br />
<strong>Mortgage</strong> <strong>Market</strong><br />
The building societies were the largest originators of housing finance in Malaysia during<br />
the early 1970s. Since then, commercial banks and financial companies as well as the<br />
Treasury <strong>Housing</strong> Loans Division (THLD) have emerged as major players in the housing<br />
finance market, resulting in the loss of market leader position of these building societies.<br />
From 1986 to 1996, the stock of outstanding, housing loans grew at a 13% annual rate.<br />
This was significantly higher than GDP growth or inflation rates. At the end of 1997,<br />
mortgage debt-to-GDP stood at 24.8%, a relatively high figure <strong>for</strong> an emerging market.<br />
RM Million<br />
80,000<br />
70,000<br />
60,000<br />
50,000<br />
40,000<br />
30,000<br />
20,000<br />
10,000<br />
0<br />
1981 1982 1983 1984 1985 1986 1987 1988 1989 1990 1991 1992 1993 1994 1995 1996 1997<br />
Source: Cheng 1998, Chiquier 1999<br />
Countrywide <strong>International</strong> Consulting Services<br />
Others<br />
Building Societies<br />
THLD<br />
<strong>Finance</strong> Companies<br />
Commercial Banks<br />
In 1986, Cagamas Berhad, a secondary mortgage corporation, was created to act as the<br />
intermediary between the primary lenders, and the ultimate investors by purchasing<br />
housing and other mortgage loans, and issuing debt securities to fund its purchases. It<br />
functions as a liquidity facility providing short and medium term finance and capital<br />
9 1
market access to mortgage lenders. Cagamas purchases mortgage loans from mortgage<br />
originators, with full recourse, at a fixed or floating rate <strong>for</strong> 3 to 7 years. This is in effect a<br />
secured financing with Cagamas, looking first to the credit of the financial institutions<br />
when mortgage loans default. Cagamas issues unsecured debt securities to investors, in<br />
the <strong>for</strong>m of fixed or floating rate bonds, short-term notes, or Cagamas Mudharabah<br />
(Islamic) Bonds.<br />
At the end of 1999, the total volume of debt securities issued by Cagamas amounted to<br />
RM 19,419 million, representing 25.1% of the outstanding housing loans of the financial<br />
institutions. Cagamas is by far the largest and the leading issuer of private debt securities<br />
in Malaysia, receiving the highest credit ratings by the two domestic rating agencies.<br />
Cagamas plans to move closer to becoming a true conduit by beginning non-recourse (or<br />
limited recourse) purchase in 1999. It plans to fund these purchases through issuance of<br />
long-term, fixed rate, multi-tranche securities.<br />
Sources and References<br />
1. <strong>International</strong> Monetary Fund. Statistics, 2000. Available: http:// www.imf.org<br />
1. Bank Negara Malaysia. Available: http://www.bnm.gov<br />
2. Malaysian Department of Valuation and Property Services<br />
3. Asian Development Bank, Asian Development Outlook 2000<br />
4. Cheng, Huang Sin. Secondary <strong>Mortgage</strong> <strong>Market</strong> and Capital <strong>Market</strong> in Malaysia:<br />
Case Study, 1996.<br />
5. Lea, Michael and Loïc Chiquier. Secondary <strong>Mortgage</strong> <strong>Market</strong> Development in an<br />
Emerging <strong>Market</strong>: the Case of Malaysia. World Bank, 2000.<br />
6. CIA the World Factbook 2000 Malaysia<br />
7. Cagamas Berhad. Available: http://www.cagamas.com.my/<br />
Countrywide <strong>International</strong> Consulting Services<br />
9 2
New Zealand<br />
Economic Per<strong>for</strong>mance<br />
Year Exchange<br />
Rate<br />
NZ$/US$<br />
Consumer<br />
Price<br />
Index<br />
Countrywide <strong>International</strong> Consulting Services<br />
Change In<br />
Consumer<br />
Prices<br />
New Zealand$ US$<br />
GDP<br />
(Millions)<br />
GDP<br />
(Millions)<br />
1990 1.68 90.36 5.51% 72,248 43,005<br />
1991 1.73 91.87 1.67% 72,277 41,779<br />
1992 1.86 92.81 1.03% 74,578 40,096<br />
1993 1.85 94.13 1.42% 80,824 43,689<br />
1994 1.69 96.40 2.40% 86,556 51,217<br />
1995 1.52 100.00 3.74% 91,461 60,172<br />
1996 1.45 102.30 2.30% 94,940 65,476<br />
1997 1.51 103.50 1.17% 98,025 64,917<br />
1998 1.87 104.83 1.29% 98,913 52,895<br />
1999 1.89 104.70 -0.12% 102,198 54,073<br />
Source: IMF<br />
After years of being dependent on the British market, New Zealand has successfully<br />
repositioned itself as a more developed, free market economy. With heavy emphasis on<br />
trade, they are becoming a leading, global competitor in world markets. Such strong<br />
reliance on trade has made New Zealand especially vulnerable to other international<br />
markets like Asia, Europe, and the United States. However, the future growth of the New<br />
Zealand economy will rely heavily on export per<strong>for</strong>mance.<br />
New Zealand has been recently battling steep drops in the value of its currency. The New<br />
Zealand Dollar has been close to its lowest level in history. Considering its average of<br />
NZ$1.45 per US$ in 1996 and its current rate in Oct 2000 of NZ$2.09 per US$, the New<br />
Zealand Dollar has substantially depreciated by some 44% in four years against the US<br />
Dollar.<br />
New Zealand’s economy shown evidence of a solid growth phase throughout the 1990s.<br />
At the beginning of the decade, GDP was at NZ$72,248 and grew steadily faster than the<br />
rate of inflation. By the end of the decade, GDP totaled approximately NZ$102,198.<br />
However, there was evidence of a slump towards the end of the decade. Concurrent with<br />
the Asian financial crisis, growth was at its lowest between 1997 and 1998 at about 1%.<br />
Tight monetary policy has benefited New Zealand with a decade of low inflation rates,<br />
the lowest in the industrial world. 1990 started off with the decade’s inflationary peak at<br />
5.51%. Rates began to decline, but rose slightly in 1995 up to 3.74%, and began a<br />
downward trend again with 1999 ending in negative inflation, -0.12%.<br />
<strong>Housing</strong> <strong>Market</strong><br />
Single, detached housing dominates New Zealand's housing stock. An average modern<br />
New Zealand home is single story with approximately 150 square meters in total area.<br />
Rates of home ownership are generally high, relative to world standards. According to the<br />
1996 census, the home ownership rate was 71% of the total population. This would<br />
9 3
eflect the general af<strong>for</strong>dability of housing in the New Zealand market at this time, and<br />
the fact that housing is the main area of investment <strong>for</strong> much of the habitants.<br />
The total number of occupied private and non-private dwellings in New Zealand was<br />
1,283,994 in 1996. Out of this total, 1,276,332 were occupied private dwellings. Of the<br />
total occupied private dwellings, 864,060 were owned with or without a mortgage. That<br />
represents 68% of all occupied private dwellings in New Zealand.<br />
<strong>Market</strong> Share of State/ Private New Homes<br />
Current<br />
Year<br />
Government Private<br />
1991 5.51% 94.48%<br />
1992 3.55% 96.44%<br />
1993 1.29% 98.71%<br />
1994 1.40% 98.60%<br />
1995 0.10% 99.90%<br />
1996 0.20% 99.80%<br />
1997 0.50% 99.50%<br />
1998 0.60% 99.40%<br />
1999 0.60% 99.40%<br />
Source: Statistics New Zealand<br />
The figures above mirror the overall af<strong>for</strong>dability of housing in the private sector and a<br />
stable, growing economy. More and more customers are opting <strong>for</strong> and/or qualifying <strong>for</strong><br />
new homes built <strong>for</strong> the private sector. In 1991 government-sponsored new housing<br />
construction accounted <strong>for</strong> 5.51% of all new housing projects. By 1999, governmentsponsored<br />
new housing accounted <strong>for</strong> less than 1% of construction projects.<br />
However, more recent indicators suggest that home af<strong>for</strong>dability is declining. In the 2 rd<br />
quarter of 2000, home af<strong>for</strong>dability declined by 7.2%. The median price of a home was at<br />
NZ$172,000 in the 2 nd quarter. This is up from NZ$169,000 from the previous year<br />
The construction industry in New Zealand is often measured by building consents<br />
(permits) terms. The following figures show the new dwelling construction trends over<br />
the past 10 years.<br />
� The industry peaked in 1995 with 23,681 consents issued.<br />
� The construction industry slowed by 13% since 1995 with a decreasing trend ending<br />
the decade at 20,695 consents being issued.<br />
� Further analysis of the figures reveal that apartment consents were on the rise, from<br />
1,195 in 1995 to 3,353 in 1999, while non-apartment consents have dropped over the<br />
decade, from 21,554 in 1991 to 19,864 in 1999.<br />
The increase in construction of apartments can be attributed to a change in zoning laws.<br />
These changes were conducive to more dense concentration of occupants within buildings<br />
and the enhancement of waterfront property.<br />
Countrywide <strong>International</strong> Consulting Services<br />
9 4
Year Consents/ Permits<br />
Issued<br />
1990 22,851<br />
1991 20,820<br />
1992 17,563<br />
1993 17,905<br />
1994 19,361<br />
1995 23,681<br />
1996 21,256<br />
1997 22,418<br />
1998 22,565<br />
1999 20,695<br />
Source: Statistics New Zealand<br />
<strong>Mortgage</strong> <strong>Market</strong><br />
<strong>Housing</strong> <strong>Finance</strong> is provided through the following government housing agencies:<br />
� <strong>Housing</strong> Corporation of New Zealand (HCNZ):<br />
HCNZ provides housing loans <strong>for</strong> those low income households which have difficulty<br />
obtaining loans in the private sector. It also provides home improvement loans and<br />
refinancing assistance, a rural lending program and facilitates selling <strong>Housing</strong> New<br />
Zealand rental houses to tenants. Total loan assets at the end of 1999 were<br />
approximately NZ$22 million.<br />
� <strong>Housing</strong> New Zealand, a Crown-owned company, is the largest provider of rental<br />
houses in New Zealand. HNZ also manages the government's Right-to-Buy (Home<br />
Buy) plan, in which tenants can buy the property they rent, or an alternative vacant<br />
<strong>Housing</strong> New Zealand property. All properties are sold at a price determined by an<br />
independent registered assessor. Customers may be eligible <strong>for</strong> a suspensory loan<br />
(administered by the <strong>Housing</strong> Corporation of New Zealand). There were 566 Home<br />
Buy sales <strong>for</strong> the year as of June 1998.<br />
Countrywide <strong>International</strong> Consulting Services<br />
9 5
Interest Rates<br />
Year Money<br />
<strong>Market</strong><br />
Deposit<br />
Rate<br />
First <strong>Mortgage</strong><br />
<strong>Housing</strong><br />
Rates*<br />
Countrywide <strong>International</strong> Consulting Services<br />
Avg. Variable<br />
<strong>Mortgage</strong><br />
Interest<br />
Rates*<br />
Treasury<br />
Bill<br />
Rate<br />
Gov't Bond<br />
Yields<br />
(Long Term)<br />
1990 12.61% 11.65% 15.20% 15.07% 13.78% 12.46%<br />
1991 7.59% 8.93% 11.30% 12.64% 9.74% 10.00%<br />
1992 7.59% 6.58% 8.90% 9.81% 6.72% 7.87%<br />
1993 4.96% 6.24% 7.75% 8.71% 6.21% 6.69%<br />
1994 9.44% 6.38% 10.19% 8.40% 6.69% 7.48%<br />
1995 8.77% 8.49% 10.41% 10.80% 8.82% 7.94%<br />
1996 7.89% 8.49% 10.05% 10.89% 9.09% 8.04%<br />
1997 8.84% 7.26% 9.94% 9.82% 7.53% 7.21%<br />
1998 4.91% 6.78% 6.50% 9.43% 7.10% 6.47%<br />
1999 5.63% 4.56% 7.24% 4.60% 6.13%<br />
Source: IMF; * Reserve Bank of New Zealand<br />
<strong>Mortgage</strong> rates began to decline from 1996 to 1998. As a result, the housing market had a<br />
momentary recovery when sales reacted to the lower rates. The housing market activity so<br />
far in the year 2000 is at its slowest since the 1998 Asian crisis. Home loan rates were<br />
slashed in hopes of stimulating the housing market by raising customer-borrowing<br />
confidence.<br />
The rate of default is slightly lower in New Zealand than in most countries. A very strong<br />
default deterrent can be attributed to the fact that recourse of New Zealand home loans<br />
generally goes to the borrower. In the event of mortgage default, all of the borrower’s<br />
assets are exposed.<br />
New Zealand financial institutions offer a wide variety of home loan products. All claim<br />
to give the borrower more control over their money and each plan can be customized to<br />
meet individual needs of the customer. Some of the Leading <strong>Mortgage</strong> lenders in New<br />
Zealand are as follows:<br />
� ABN AMRO Operating as a subsidiary of ABN, the Australian <strong>Mortgage</strong> Securities<br />
Ltd. (AMS) is a top player in the wholesale mortgage markets of Australia and New<br />
Zealand. AMS has several functions. They partake in product development, loan<br />
funding and transactional processing services <strong>for</strong> a wide range of mortgage managers.<br />
AMS is one of the largest issuers of <strong>Mortgage</strong> Backed Securities in this region.<br />
� Auckland Savings Bank (ASB): With over 150 years of serving New Zealand, ASB<br />
has a history of experience with mortgage finance in New Zealand dating back to the<br />
19 th century. In the early 1850s ASB began to offer mortgage financing. At this time it<br />
was not widely popular, but in due time it became one of its most sought-after<br />
services.<br />
� ANZ New Zealand ANZ offers a variety of mortgage loans catering to various needs<br />
of borrowers. These include a standard variable loan, ANZ Money Saver, which also<br />
is a variable rate loan, and ANZ FlexiPlus, which is a revolving line of credit.<br />
9 6
� Bank of New Zealand: Also offers a wide, flexible range of mortgage products.<br />
Some of these types are Rapid Repay, Global Plus, which allows you to earn frequent<br />
flyer miles on your home loan balance, standard, tailored, interest only, revolving<br />
credit lines, and 5% down payment loans.<br />
� National Bank of New Zealand Home loan products include their Thoroughbred<br />
Flexible loan, which gives the borrower an option to pay interest only or payoff as<br />
much as they would like, fixed rate loans, floating rate, or a combination of the both.<br />
� Westpac Banking Corporation (WBC) Offers fixed, floating, and capped rates <strong>for</strong><br />
their home loan products. In 1996 Westpac NZ merged with Trust Bank NZ. The new<br />
name was called Westpac Trust. In June of 1999, their total outstanding mortgage<br />
balances totaled NZ$824.2 million. WBC is also the parent company <strong>for</strong> Westpac<br />
Securities Administration, who is a top issuer of mortgage backed securities in the<br />
country.<br />
Sources and References<br />
1. <strong>International</strong> Monetary Fund. IMF Statistics, 2000<br />
2. “Country Real Estate Profiles,” 1999 Annual Convention Global Real Estate Forecast<br />
Sessions, Presented by Certified <strong>International</strong> Property Specialists.<br />
3. Reserve Bank of New Zealand. Available: http://www.rbnz.govt.nz<br />
4. The <strong>Housing</strong> Corporation of New Zealand. Available: http://www.hcnz.co.nz<br />
5. CIA – The World Factbook 2000 – New Zealand. Available:<br />
http://www.odci.gov/cia/publications/factbook/geos/nz<br />
6. “Westpac Securities Administration Ltd., WST Funding Trust New Zealand Sub-<br />
Series No.2 Ratings.” Fitch IBCA, 20 July 1999. Available: www.fitchibca.com<br />
7. ABN-AMRO Investment and Wholesale Banking. Available:<br />
http://www.abnamro.com.au/<br />
8. Auckland Savings Bank (ASB). Available: http://www.asbbank.co.nz/<br />
9. ANZ Banking Group: New Zealand. Available: http://www.anz.com/nz/default.asp<br />
10. Bank of New Zealand. Available: http://www.bnz.co.nz/<br />
11. National Bank of New Zealand. Available: http://www.nationalbank.co.nz/<br />
12. Westpac Banking Corporation: Available: http://www.westpactrust.co.nz<br />
Contacts<br />
1. Southern Cross Building Society<br />
Barrie Collett, General Manager<br />
PO Box 554<br />
Auckland, New Zealand 1001<br />
Tel: 64.09.303.1004<br />
Fax: 64.09.303.1381<br />
Email: southernxbuilding@clear.net.nz<br />
Countrywide <strong>International</strong> Consulting Services<br />
9 7
Philippines<br />
Economic Background<br />
Year Exchange Rate<br />
Peso/US$<br />
Consumer Price<br />
Index<br />
Countrywide <strong>International</strong> Consulting Services<br />
Change In<br />
Consumer Prices<br />
Peso US$<br />
Nominal GDP<br />
(Billions)<br />
Nominal GDP<br />
(Billions)<br />
1990 24.31 62.11 1,077.24 44<br />
1991 27.48 73.60 18.5% 1,248.01 45<br />
1992 25.51 79.92 8.59% 1,351.56 53<br />
1993 27.12 85.42 6.88% 1,474.46 54<br />
1994 26.42 92.56 8.36% 1,692.93 64<br />
1995 25.71 100.00 8.04% 1,905.95 74<br />
1996 26.22 109.01 9.01% 2,171.92 83<br />
1997 29.47 115.15 5.63% 2,423.64 82<br />
1998 40.89 126.70 10.03% 2,662.41 65<br />
1999* 39.09 135.17 6.69% 2,976.57 76<br />
Source: IMF; *Central Bank of Philippines<br />
The Philippines has faced many difficulties resulting from the weather, national poverty,<br />
as well as the Asian financial crisis. The El Niño drought of 1997 and 1998 heavily<br />
impacted the agriculture sector, creating a sharp downturn in its overall economy in 1998<br />
and the beginning of 1999. The economy recovered somewhat in 1999, but it was mainly<br />
attributed to the increase in output in the agriculture sector with a growth of 6.6% since<br />
the drought. The impact of the Asian financial crisis is still affecting the overall<br />
economy. Despite the fact that the services and retail sectors were resilient during the<br />
crisis, the overall economy only experienced mild growth with a GDP growth rate of<br />
3.2%. The main reason <strong>for</strong> this slow growth was due to the lack of per<strong>for</strong>mance in the<br />
industry sector, which only grew .5%.<br />
Since the crisis, consumer-demand <strong>for</strong> nonfood manufactured items have weakened, the<br />
construction sector has also contracted causing over-capacity and an increased number of<br />
non-per<strong>for</strong>ming loans. As shown below, interest rates were lowered to encourage credit<br />
demand. Several economic and policy changes were also in the works to restore investor<br />
confidence.<br />
Interest Rates Gov't Bond Yields<br />
Year Interbank Treasury Bill Deposit Rate Ave. Common 1-year 10-year<br />
Money <strong>Market</strong><br />
Lending Rate<br />
1990 14.80% 23.67% 19.54% 24.12%<br />
1991 15.70% 21.48% 18.80% 23.50%<br />
1992 16.70% 16.02% 14.27% 19.48%<br />
1993 13.70% 12.45% 9.61% 14.68%<br />
1994 13.40% 12.71% 10.54% 15.06%<br />
1995 12.10% 11.76% 8.39% 14.68% 13.61%<br />
1996 12.60% 12.34% 9.68% 14.84% 13.36% 16.00%<br />
1997 17.90% 12.89% 10.19% 16.28% 14.35% 16.96%<br />
9 8
1998 13.80% 15.00% 12.11% 16.78% 17.40% 19.00%<br />
1999 10.80% 10.00% 8.17% 11.78% 11.25% 15.23%<br />
Sources: IMF, Bangko Sentral ng Pilipinas (BSP)<br />
However, the economic re<strong>for</strong>m ef<strong>for</strong>ts have been not been implemented as planned.<br />
Many of the re<strong>for</strong>ms have been delayed, specifically in the banking and financial sectors,<br />
slowing down the economic recovery. Unemployment and the number of non-per<strong>for</strong>ming<br />
loans continue to be at a high level. At the same time, industrial activity, demand <strong>for</strong><br />
credit, and <strong>for</strong>eign private capital inflows have all been low.<br />
<strong>Housing</strong> <strong>Market</strong><br />
Residential Building Construction<br />
First Half of 1996 First Half of 1997<br />
Single 28,951 28,520<br />
Duplex 1,299 1,165<br />
Apartment 1,680 7,123<br />
Other 194 662<br />
Total 32,124 37,470<br />
Source: Republic of the Philippines, National Statistics Office<br />
New Residential Building Constructions (1997)<br />
Year Number Started Floor Area (sq.m.) Value (P1,000)<br />
1997 1st QTR 17,760 1,737,599 7,894,745<br />
1997 2nd QTR 19,710 1,814,939 8,080,776<br />
1997 3rd QTR 23,354 1,773,799 9,418,548<br />
Source: Republic of the Philippines, National Statistics Office<br />
<strong>Mortgage</strong> <strong>Market</strong><br />
The estimated size (outstanding balance) of the mortgage market (commercial plus<br />
residential) in 1997 was P300 billion with commercial banks and thrifts accounting <strong>for</strong><br />
P200 billion, private insurance companies <strong>for</strong> P13 billion and the government (including<br />
Pag-IGIB) P90 billion. Commercial banks have approximately P 135 billion in residential<br />
loans outstanding with nearly 2/3 in the <strong>for</strong>m of subdivision development and<br />
condominium construction lending. The largest private mortgage lender is the Bank of the<br />
Philippine Islands which had P14.4 billion outstanding at the end of 1996.<br />
A government mortgage insurance fund, the The Home Insurance and Guaranty<br />
Corporation (HIGC) insures most commercial bank mortgage loans. As of 4/30/98, it had<br />
guaranteed P 35.2 billion in outstanding balance of loans (about 1/3 of which are<br />
construction and development loans). The volume of new guarantees issued in both 1996<br />
and 1997 was approximately P8.5 billion.<br />
The largest overall mortgage lender in the Philippines is the Home Development Mutual<br />
Fund, known by its Phillipine acorynm as Pag-IGIB. It is a government pension fund<br />
<strong>for</strong>med to address the housing needs of private sector wage earners. The Fund provides<br />
loans at below market rates of interest to lower income households.<br />
Countrywide <strong>International</strong> Consulting Services<br />
9 9
Private housing finance in the Philippines has been mostly targeted at high-income<br />
households. One of the leading lenders, Bank of the Philippine Islands, only originates<br />
mortgage loans over P400K. These residential mortgages are made <strong>for</strong> amounts up to<br />
70% of the appraised value of the property and <strong>for</strong> up to 20 year terms. <strong>Mortgage</strong>s are<br />
also made <strong>for</strong> lot purchases, <strong>for</strong> construction loans <strong>for</strong> individuals to build houses on lots<br />
already owned, and <strong>for</strong> refinancing.<br />
Sources and References<br />
1. <strong>International</strong> Monetary Fund, IMF Statistics, 2000<br />
2. CIA the World Factbook 2000 the Philippines<br />
3. Republic of the Philippines, National Statistics Office<br />
4. Asian Development Bank, Asian Development Outlook 2000<br />
5. Bank of the Philippine Islands<br />
6. National Economic and Development Authority – the Philippines<br />
7. Ministry of <strong>Finance</strong> – the Philippines<br />
8. Development Bank of the Philippines<br />
9. Lea, Michael. Pag-IGIB/Urban Bank <strong>Housing</strong> <strong>Finance</strong> Proposal Assessment. August<br />
1998<br />
10. Gallardo, Joselito. Rationalizing <strong>Housing</strong> <strong>Finance</strong> and Developing Capital <strong>Market</strong>s:<br />
The Philippine Experience. January 1998.<br />
Countrywide <strong>International</strong> Consulting Services<br />
1 0 0
SINGAPORE<br />
Economic Background<br />
Year Exchange Rate<br />
Singapore $ /US$<br />
Consumer Price<br />
Index<br />
Countrywide <strong>International</strong> Consulting Services<br />
Change In<br />
Consumer Prices<br />
Singapore $ US$<br />
Nominal GDP<br />
(Millions)<br />
Nominal GDP<br />
(Millions)<br />
1990 1.74 92.90 3.4% 66,464 38,099<br />
1991 1.63 96.10 3.4% 73,947 45,352<br />
1992 1.64 98.30 2.3% 79,960 48,611<br />
1993 1.61 100.50 2.3% 93,102 57,899<br />
1994 1.46 103.60 3.1% 106,677 73,031<br />
1995 1.41 105.40 1.7% 118,195 83,571<br />
1996 1.40 106.90 1.4% 128,727 91,961<br />
1997 1.68 109.00 2.0% 140,466 83,835<br />
1998 1.66 108.80 -0.3% 138,529 83,426<br />
1999 1.67 109.20 0.4% 143,981 86,423<br />
Source: Singapore Department of Statistics<br />
Singapore is a small, well-developed country with strong service and manufacturing<br />
sectors and excellent international trading links. With an open market business<br />
environment and its emphasis on investment towards education and technology,<br />
Singapore has enjoyed solid growth <strong>for</strong> many years. However, impacted by the Asian<br />
economic crisis, lowering of demand and exchange rate depreciation has decreased its<br />
exports to the rest of Asia. The crisis also reduced regional lending as well as stock<br />
market and <strong>for</strong>eign exchange market activities. In addition, lower consumer sentiment<br />
and a decrease in tourism caused the retail sector to weaken. All of these factors<br />
contributed to the decrease of real gross domestic product (GDP) from its 1990’s range of<br />
approximately 12% to 1.5% in 1998, the lowest growth rate since 1985. However, the<br />
strength of the economy and timely policy responses allowed Singapore to weather the<br />
1998 Asian crisis better than other countries in the region.<br />
Singapore’s favorable per<strong>for</strong>mance can be attributed to a few factors. With a surplus<br />
budget, averaging 5% of GDP during fiscal years 1990-1998, Singapore had a substantial<br />
level of fiscal reserves. Monetary policy focused on the exchange rates and price<br />
stability, causing inflation to average about 2% during the period between 1990 and 1998.<br />
A strong and skilled labor market, open trade system, and properly supervised banking<br />
system all contributed to a more stable economic environment.<br />
Interest Rates <strong>Mortgage</strong> Rates Gov't Bond Yields<br />
Year Interbank<br />
Money <strong>Market</strong><br />
Prime Lending<br />
Rate<br />
Deposit Rate <strong>Finance</strong> Co. 15<br />
Year <strong>Housing</strong><br />
Loans<br />
1990 4.88% 7.73% 4.67% 7.36%<br />
1991 3.25% 7.10% 4.63% 7.36%<br />
1992 2.19% 5.55% 2.86% 6.64%<br />
1993 3.31% 5.34% 2.30% 6.48% 1.45%<br />
1-year 10-year<br />
1 0 1
1994 4.38% 6.49% 3.00% 7.05% 2.67%<br />
1995 2.44% 6.26% 3.50% 6.95% 2.00%<br />
1996 3.38% 6.26% 3.41% 6.81% 1.21%<br />
1997 6.63% 6.96% 3.47% 7.17% 1.85%<br />
1998 1.75% 5.90% 4.60% 7.31% 1.45% 4.48%<br />
1999 2.63% 5.80% 6.15% 1.48% 4.53%<br />
Source: Monetary Authority of Singapore<br />
<strong>Housing</strong> <strong>Market</strong><br />
Singapore is an island country occupying approximately 638 square kilometers of land.<br />
The government owns approximately 76% of the land and provides 60 to 99 year leases at<br />
market prices to housing developers. The public housing segment is administered<br />
exclusively by the <strong>Housing</strong> Development Board (HDB), a statutory board of the<br />
government of Singapore. The main objective of the HDB is to <strong>for</strong>mulate and implement<br />
public housing policies to support the building of communities. The proportion of<br />
households in Singapore living in public housing increased from 33% in 1970 to 86% in<br />
1998/1999. An important component of the housing system is owner-occupied public<br />
housing, which increased from 7% in 1970 to 91% in 1998.<br />
<strong>Housing</strong> <strong>Market</strong> A<br />
Year <strong>Housing</strong> Starts <strong>Housing</strong> Completions Permits Issued<br />
1995 45,635 31,289 60,091<br />
1996 40,327 32,661 51,634<br />
1997 51,104 39,670 60,668<br />
1998 34,171 54,308 34,837<br />
Source: Urban Development Authority<br />
The public sector contribution to housing has consistently been high. During the 1998/99<br />
fiscal year, the total number of flats sold was 95,179 units, comprising 34,700 new units<br />
and 60,459 resale units. A total of 7,937 new, private residential units (80%<br />
apartments/condominiums and 20% landed properties) were sold. This reflected a 30%<br />
increase in demand <strong>for</strong> new units compared to 1998. In 1999 Q4, overall private,<br />
residential property prices went up 33% from its previous year. In 2000, private,<br />
residential sales are projected at around 8,000 units with prices expected to rise by 10-<br />
15%.<br />
Public <strong>Housing</strong> 1996 1997 1998<br />
Percent of Population Living in Public Flats 86% 86% 86%<br />
Percent of Owner-Occupied Public Flats 91% 91% 91%<br />
Source: Singapore Department of Statistics<br />
Owner-Occupied Rental<br />
Public 77.0% 9.0%<br />
Private 10.5% 2.9%<br />
Countrywide <strong>International</strong> Consulting Services<br />
1 0 2
Other 0.0% 0.3%<br />
Total 87.5% 12.2%<br />
Source: Singapore Census of Population<br />
Residential Completions (Number of Units)<br />
1998 1999*<br />
Public & Private Sectors<br />
Detached Houses 417 198<br />
Semi-Detached Houses 388 442<br />
Terrace Houses 1,102 704<br />
Apartments 45,453 30,751<br />
Condominium Units 6,948 8,033<br />
Public Sector<br />
Apartments 40,270 28,196<br />
Condominium Units - 2,318<br />
Private Sector<br />
Detached Houses 417 198<br />
Semi-Detached Houses 388 442<br />
Terrace Houses 1,102 704<br />
Apartments 5,183 2,555<br />
Condominium Units 6,948 5,715<br />
* 1999 data is through November. Source: Urban Development Authority<br />
<strong>Mortgage</strong> <strong>Market</strong><br />
The <strong>Housing</strong> and Development Board (HDB) was established in 1960 in order to<br />
maximize limited, land resources and to solve acute, housing shortages that resulted from<br />
high population growth in the 1950’s. Most of the public housing erected by the HDB are<br />
high-rise “flats”. Depending upon af<strong>for</strong>dability and availability, Singaporeans may<br />
choose from six flat types that range from 1-room to 5-room and executive. The HDB<br />
manages most of the public, rental flats in Singapore, which are provided at a subsidized<br />
rate. In addition, the HDB purchases flats at market rates and sells them at heavily<br />
discounted prices. HDB provides loans <strong>for</strong> 20-year terms at subsidized rates <strong>for</strong> purchase<br />
of its flats. The interest rate is 0.1% above the Central Provident Fund (CPF) interest<br />
rate, and it is adjusted semi-annually. The HDB provided S$7.8 billion of loans in the<br />
1998.<br />
In fiscal year ended March 1999, there were 142 commercial banks, 70 merchant banks<br />
and 15 finance companies in Singapore. The total, private housing loans outstanding by<br />
commercial banks in Singapore was S$35.3 billion at the end of 1999. This represented<br />
an 11% increase from the previous year. However, the 5 local banks have a combined<br />
96% share of the mortgage market. Development Bank of Singapore (DBS) acquired the<br />
state-owned Postal Savings Bank (POSB) in November of 1998, boosting its market<br />
share to 47% by the end of 1999.<br />
Countrywide <strong>International</strong> Consulting Services<br />
1 0 3
Private <strong>Mortgage</strong> Lenders<br />
Countrywide <strong>International</strong> Consulting Services<br />
<strong>Market</strong> Share<br />
Development Bank of Singapore (DBS) 47%<br />
United Overseas Bank (UOB) 20.8%<br />
Overseas-Chinese Banking Corporation (OCBC) 12.8%<br />
Overseas <strong>Union</strong> Bank 9.4%<br />
Keppel TatLee Bank (KPB) 6%<br />
Total 96%<br />
Source: Novation Associates, LTD.<br />
While the contribution to mortgage finance by the private sector has been significant, the<br />
Central Provident Fund and the <strong>Housing</strong> and Development Board have been the biggest<br />
providers of financing. As of March 1999, the mortgage loans outstanding granted by<br />
HDB was S$49.1 billion, with S$14.8 billion mortgage loans granted during the fiscal<br />
year 1998/99.<br />
A principal source of mortgage finance is the Central Provident Fund (CPF), which was<br />
set up in 1955 to provide financial security <strong>for</strong> workers in their retirement. Since it’s<br />
inception, it has evolved into a comprehensive social security program that. In addition<br />
to retirement benefits, the CPF provides housing and medical benefits.<br />
In Singapore, it is mandatory <strong>for</strong> all employers and employees to contribute to the CPF,<br />
with both employers and employees contributing 20% of the worker’s wages. The CPF<br />
credits each worker’s account with contributions withheld from earnings and matching<br />
employer contributions. Contributions are tax-exempt, as is interest income. Rates<br />
change every six months based on the average 1-year deposit rates of the Big 4 Singapore<br />
banks. Workers can use savings <strong>for</strong> house purchases and mortgage payments but not rent.<br />
As such, it is a powerful tool to promote homeownership.<br />
Central Provident Fund - Withdrawals <strong>for</strong> <strong>Housing</strong> (S$ millions)<br />
1994 1995 1996 1997 1998<br />
Public & Residential 3,500.4 4,590.7 5,058.4 5,786.7 7,834.7<br />
Source: Monetary Authority of Singapore<br />
The CPF plays an important role in housing finance in Singapore. Workers have been<br />
able to withdraw funds from their CPF accounts <strong>for</strong> the purchase of public housing since<br />
1968, <strong>for</strong> the purchase of private housing since 1981, and <strong>for</strong> the upgrading of public flats<br />
and <strong>for</strong> investing in private residential properties since 1989.<br />
The CPF obtains a first lien on the property to recover savings and the financial<br />
institution records a second lien to cover the loan proceeds.<br />
Policy Developments<br />
The government also plays an important role in the overall economic stability as well as<br />
the housing finance industry.<br />
1 0 4
� As it relates to the overall economy, the Singapore government has increased<br />
development spending, causing the primary operating balance into a deficit of about<br />
.5% of GDP<br />
� The government of Singapore has, along with the fiscal and monetary policies,<br />
implemented structural changes to reduce costs and increase competitiveness of<br />
industries. The employer contribution rate to the Central Provident Fun, the<br />
a<strong>for</strong>ementioned saving scheme, has been decreased to half of its original rate; tax<br />
rebates and cuts were also introduced<br />
� As one of the largest contributors to Singapore’s GDP, the financial sector also<br />
needed re<strong>for</strong>ms in the areas of transparency and regulation. The government has<br />
raised the disclosure standards <strong>for</strong> banks, and it is focusing on supervision of financial<br />
institutions. The government is also making proactive changes to loosen the<br />
restrictions it previously had on globalization of the Singapore Dollar, as well as other<br />
regulatory changes to expand the investment fund management industry and the bond<br />
market<br />
Sources and Reference<br />
1. <strong>International</strong> Monetary Fund, Statistics 2000<br />
2. CIA World Fact Book, “Singapore” Online: Internet. August 2000. Available:<br />
http://www.odci.gov/cia/publications/factbook/geos/sn.html<br />
3. The Monetary Authority of Singapore. www.mas.gov.sg<br />
<strong>International</strong> Monetary Fund, “IMF Concludes Article IV Consultation with<br />
Singapore”. March 1999. www.imf.org<br />
4. Stone, Mark R. IMF Asia and Pacific Department. “Fundamentals, timely policy<br />
measures help Singapore weather Asian crisis.” 1999.<br />
5. <strong>Housing</strong> Development Board. “Statistics and Charts”. Online: Internet. Available:<br />
www.hdb.gov.sg<br />
6. Singapore Department of Statistics. www.singstat.gov.sg<br />
7. Singapore Urban Development Authority. www.ura.gov.sg<br />
8. Meleis, Sherief. Novation Associates, LTD. Singapore <strong>Mortgage</strong> Report. 2000.<br />
Countrywide <strong>International</strong> Consulting Services<br />
1 0 5
T AI W AN<br />
Economic Background<br />
Year Exchange Rate<br />
currency/US$<br />
Consumer Price<br />
Index<br />
Countrywide <strong>International</strong> Consulting Services<br />
Change In<br />
Consumer Prices<br />
New Taiwan$ US$<br />
Nominal GDP<br />
(Millions)<br />
Nominal GDP<br />
(Millions)<br />
1990 80.67 4.12%<br />
1991 83.60 3.63%<br />
1992 25.37 87.33 4.46% 5,338,952 210,443<br />
1993 26.62 89.90 2.94% 5,918,376 222,328<br />
1994 26.16 93.58 4.09% 6,463,600 247,079<br />
1995 27.22 97.02 3.68% 7,017,933 257,823<br />
1996 27.44 100.00 3.07% 7,678,126 279,815<br />
1997 32.52 100.90 .90% 8,328,780 256,112<br />
1998 32.16 102.60 1.68% 8,938,967 277,953<br />
1999* 31.34 102.78 .18% 9,312,246 297,136<br />
Source: Central Bank of China, Financial Statistics Monthly, Taiwan Area, ROC<br />
Taiwan has a dynamic , capitalistic economy with themajor concentration of resources<br />
shifting from traditional and basic manufacturing industries to high-tech and<br />
in<strong>for</strong>mationbased companies. The high-tech industry accounted <strong>for</strong> 39.1% of Taiwan’s<br />
total output of manufactured goods in 1998. In 1952 Agriculture accounted <strong>for</strong> 35% of<br />
gross domestic product (GDP), and it now contributes less than 3%. Taiwan’s<br />
conservative financial strategies enabled them to endure the 1998 Asian market crisis<br />
with comparatively minor economic suffering relative to many of its Asian counterparts.<br />
Real GDP growth averaged about 8.2% from 1992. The lowest GDP growth came in<br />
1999 at 4.2%. This can be attributed to a massive earthquake that struck Taipei in 1999.<br />
Reconstruction ef<strong>for</strong>ts were rapid, thus enabling Taiwan’s economy to weather the<br />
devastation with only a marginal decline in the production sector. It should be noted that<br />
<strong>for</strong> the future of the country’s growth, an underlying political concern involves Taiwan’s<br />
relationship with mainland China and the uncertainty of their reunification.<br />
Taiwan has managed to keep inflation in check throughout the last decade. The<br />
beginning of the 1990’s proved to hold the country’s highest inflationary rates <strong>for</strong> the<br />
decade with its peak in 1992 at 4.46%. By the end of the decade rates had dropped well<br />
below 4% with 1999 rates dropping to .18%.<br />
Unemployment figures indicate Taiwan’s highest rates were experienced in the later half<br />
of the decade. Rates slowly grew from 1.1% in 1992 to 2.9% in 1999.<br />
<strong>Housing</strong> <strong>Market</strong><br />
The Home Ownership rate is around 84% with high numbers of households owning more<br />
than one home. This indicates the mature nature of Taiwan’s housing market. In the<br />
country’s capital, Taipei, the average price of an existing housing unit in 1999 was<br />
NT$230,000 per ping (1 ping = 36 sq. ft). In other metropolitan areas, Taichung and<br />
Kaosing, the average price was NT$100,000 per ping.<br />
1 0 6
In order to jumpstart Taiwan’s sluggish real estate market, the Taiwanese government<br />
offered NT$150 billion in low interest loans <strong>for</strong> newly constructed units. By the end of<br />
1999 over 77,000 new units totaling NT$430.5 billion were offered on the market in<br />
comparison to just 22,000 the prior year; however recent, real estate industry estimates<br />
have shown about 1 million dwellings are either vacant or unsold. Government policies<br />
have rested high expectations on Taiwan’s real estate market to fuel traditional industries<br />
and stimulate the rest of the economy.<br />
<strong>Mortgage</strong> <strong>Market</strong><br />
Taiwan’s private mortgage market stood at NT$ 2,446 billion at the end of 1999. This<br />
was up 4.6% from 1998’s total of $2,338 billion. This market is distributed between stateowned<br />
and privately owned banks. The public housing market primarily serves Taiwan’s<br />
civil servants. A major portion of the mortgage market share has predominantly been in<br />
the hands of mid – size and smaller banks; however, more recently, larger banks and life<br />
insurers have been assertively acquiring more of the share in part due to the 50% riskasset-weighting<br />
factor of mortgages. The long-dated asset classification <strong>for</strong> mortgage<br />
loans is attracting life insurers to the market with intentions of balancing their assetliability<br />
maturity profile. The mortgage market has responded to this intense competition<br />
with a swift decline in interest rates.<br />
Altogether Taiwanese banks run about 47% of the mortgage loan market. Controlling<br />
approximately 20%, state-owned Land Bank of Taiwan dominates Taiwan’s mortgage<br />
market. The next largest share is held by First Commercial Bank and Chang Hwa<br />
Commercial Bank with 4.5% and 4.3%, respectively. Remaining shares are distributed<br />
among Hua Nan Commercial Bank, Chinatrust Commercial Bank, UWCCB, Bank<br />
SinoPac, and Taishin <strong>International</strong> Bank. 44% of SinoPac’s loan portfolio is dedicated to<br />
mortgage loans. While Hua Nan, First Commercial, and Chang Hwa have less than 20%<br />
of their portfolio mix invested in mortgage loans.<br />
Types of mortgages available in Taiwan are general housing, first-time homebuyer, home<br />
saver’s plan, labor insurance housing, subsidized public housing, investment-linked, and<br />
revolving housing credit. At the end of 1999, basic mortgage rates from various financial<br />
institutions ranged from 8.2% to 8.5%.<br />
Sources and References<br />
1. U.S. Central Intelligence Agency. The World Factbook. Washington: Central<br />
Intelligence Agency, 2000. Online: Internet. 18 August 2000. Available:<br />
http://www.odci.gov/cia/publications/factbook/tw.html#econ<br />
2. Novation Associates, LTD: Economics Unit. “Taiwan <strong>Mortgage</strong> <strong>Market</strong>.” 19 April,<br />
2000: 1-2<br />
3. Huang, Joyce. “Government Property Plan Comes Under Fire.” Taipei Times: Online<br />
Edition 5 August 2000. Online: Internet. 18 August 2000. Available:<br />
http://www.taipeitimes.com/news/2000/08/05/story/0000046520<br />
4. Chou, Stanley. “<strong>Finance</strong> Minister Backs Away from Cheap <strong>Mortgage</strong> Pledge.” Taipei<br />
Times: Online Edition 3 August 2000. Online: Internet. 18 August 2000. Available:<br />
http://www.taipeitimes.com/news/2000/08/03/story/0000046247<br />
Countrywide <strong>International</strong> Consulting Services<br />
1 0 7
5. Lin, Hwan C. “One Taiwan but Two Economies.” Taipei Times: Online Edition 17<br />
August, 2000. Online: Internet. 18 August 2000. Available:<br />
http://www.taipeitimes.com/news/2000/08/17/story/0000048158<br />
6. Ministry of Economic Affairs <strong>for</strong> the Republic of China on Taiwan Current Status of<br />
Economic Development: Economic Forecast, Statistics. n.p., n.d. Online: Internet. 21<br />
August 2000. Available:http://www.moea.gov.tw/~meco/Intro_e/xmoe1.htm;<br />
7. National Statistics of Taiwan, the Republic of China. <strong>Finance</strong>, Economic Indicators,<br />
Prices. n.p., n.d. Online: Internet. 21 August 2000. Available: http://www.stat.gov.tw<br />
Countrywide <strong>International</strong> Consulting Services<br />
1 0 8
T H AI L AN D<br />
Economic Background<br />
Year Exchange Rate<br />
Baht/US$<br />
Consumer Price<br />
Index<br />
Countrywide <strong>International</strong> Consulting Services<br />
Change In<br />
Consumer Prices<br />
Baht US$<br />
Nominal GDP<br />
(Millions)<br />
Nominal GDP<br />
(Millions)<br />
1990 25.59 100.00 2,183,500 85,326<br />
1991 25.52 105.70 5.70% 2,506,600 98,221<br />
1992 25.40 110.00 4.07% 2,830,900 111,453<br />
1993 25.32 113.70 3.36% 3,170,258 125,208<br />
1994 25.15 119.50 5.10% 3,634,497 144,513<br />
1995 24.92 126.40 5.77% 4,185,629 167,963<br />
1996 25.34 133.80 5.85% 4,608,491 181,866<br />
1997 31.36 146.80 9.72% 4,675,460 149,090<br />
1998 41.36 128.10 -12.74% 4,642,203 112,239<br />
1999* 37.84 128.60 0.39% 4,688,400 123,901<br />
Source: IMF Statistics, 2000; *Bank of Thailand, March 31,2000<br />
In 1999, <strong>for</strong> the first time since 1997, the Thai gross domestic product (GDP) registered a<br />
small year-on-year positive growth. The main contributor was an improvement in the<br />
manufacturing sector, which is the largest sector of the economy (32% of GDP in 1998).<br />
On the other hand, the overall rate of contraction in “real estate, renting and business<br />
activities” is reported to have deepened (-10.2%), and its contribution to GDP is currently<br />
small (3%). The overall price level in the economy exhibited deflation, with both the CPI<br />
and wholesale prices declining further in the early part of the year. It is a common view<br />
that the Thai economy has hit bottom. The questions now are the rate of recovery and<br />
what will be the effectiveness of recent stimulus packages.<br />
Liquidity in the domestic markets has greatly improved since the August 14, 1998<br />
package of banking measures. The commercial banks’ Minimum Lending Rate (MLR)<br />
has declined sharply from its high level in mid-1998. It continued to decline in the first<br />
half of 1999 and ranged from 8.75% to 9.0% at the end of 1999, as compared with a<br />
11.0% to 11.5% range at the beginning of 1999. However, new lending is minimal.<br />
Uncertainty about the timing, speed and scale of the economic recovery has sharply<br />
curtailed the demand <strong>for</strong> new credit as well as the willingness of banks to make new<br />
loans.<br />
In 1999, banking ef<strong>for</strong>ts remained focused on loan collection and portfolio restructuring,<br />
as the level of non-per<strong>for</strong>ming loans (NPL) was still very high (45% of total bank loans<br />
as of the end of March 1999). Banks’ senior management were concentrating their<br />
ef<strong>for</strong>ts on re-capitalization and raising fresh capital.<br />
<strong>Housing</strong> <strong>Market</strong><br />
1 0 9
From 1987 to 1996, the Thai economy grew at an average annual rate of more than 8%.<br />
The Stock Exchange of Thailand (SET) index of the property sector increased<br />
tremendously from approximately 91 at the end of 1988 to about 2,300 by the end of<br />
1993. This growth, combined with the availability of housing finance, resulted in an<br />
explosive housing boom. Fed by the easy availability of finance, private developers<br />
assumed more of a leadership role in housing construction.<br />
During the period 1992-1996, housing completion in the Bangkok Metropolitan Region<br />
expanded enormously, totaling 752,545 units (an average of 150,509 units per year),<br />
whereas the demand <strong>for</strong>ecasted by the National Economic and Social Development Board<br />
was only 376,520 units <strong>for</strong> the same period. This clearly indicates over-investment in<br />
housing. The excessive speculation of homebuyers resulted in huge oversupply of<br />
housing in the Bangkok Metropolitan Region. The Government <strong>Housing</strong> Bank (GHB)<br />
estimates that a total of about 300,000 housing units in the Bangkok Metropolitan<br />
Region, or about 14% of the total housing stock, were unoccupied at the end of 1995.<br />
This rapid expansion in the housing sector as well as the real estate market was<br />
unchecked and contributed to a bubble <strong>for</strong> the entire economy.<br />
According to that very basic and aggregated survey, the composition of the housing stock<br />
built between 1990 and April 1998 and the inventory of unsold units were as follows:<br />
Total <strong>Housing</strong> Production since 1990 and Unsold Units as of April 1998<br />
Total Number of Units Total Value in THB million<br />
<strong>Housing</strong><br />
Type<br />
Total units Not Sold<br />
Percent<br />
Unsold<br />
Total Value Unsold<br />
Percent<br />
Unsold<br />
Total 1,132,333 264,064 23% 1,605,556 412,027 26%<br />
Single House 143,360 45,508 32% 473,756 125,491 26%<br />
Duplex House 18,600 4,711 25% 29,432 7,351 25%<br />
Town House 407,181 76,451 19% 439,475 83,238 19%<br />
Shophouse 93,688 16,085 17% 217,845 41,671 19%<br />
Condominium 469,304 121,328 26% 445,089 134,277 30%<br />
Source: MOF real estate committee report.<br />
The continuing contraction of the real estate sector reflects a weak demand being met<br />
with significant oversupply and extremely high vacancy rates by international standards<br />
across almost all segments of the real estate industry (offices, retail and commercial,<br />
industrial, hotel and recreation). In 1999 there was a 20% vacancy rate in the residential<br />
sector and 30% of office space was vacant in the country’s capital, Bangkok. (over<br />
330,000 vacant residential dwellings). It is reported that the most severe oversupply<br />
occurred with condominium units originally built to meet investment demand. The<br />
FRA’s latest results <strong>for</strong> residential asset sales suggest that residential prices are bottoming<br />
out.<br />
<strong>Mortgage</strong> <strong>Market</strong><br />
The size of the mortgage market at the end of 1998 was 770.2 billion Baht, representing<br />
16.6% of GDP. The size of banks’ residential mortgage portfolios was shrinking at this<br />
time, not expanding. Potential new borrowers remained uncertain about the recovery,<br />
were concerned about job security and prospective asset appreciation in housing prices.<br />
Potential first-time homebuyers remained reluctant to enter a long-term debt commitment,<br />
Countrywide <strong>International</strong> Consulting Services<br />
1 1 0
in spite of significantly lower housing prices. Meanwhile, current borrowers were seeking<br />
to refinance their loans to take advantage of lower interest rates in 1999.<br />
The growth rate in mortgage debt outstanding ranged between 23% and 37% per annum<br />
in nominal terms between 1990 and 1996 be<strong>for</strong>e falling to 13% in 1997 and declining an<br />
additional 3% in 1998.<br />
Million Baht<br />
900,000<br />
800,000<br />
700,000<br />
600,000<br />
500,000<br />
400,000<br />
300,000<br />
200,000<br />
100,000<br />
0<br />
43%<br />
39%<br />
100,905 138,002181,475<br />
72,421<br />
Source: Government <strong>Housing</strong> Bank<br />
Expansion of Home Loan Outstanding<br />
37%<br />
32%<br />
242,768<br />
The Government <strong>Housing</strong> Bank had the largest share of the market at 37% in 1998.<br />
Commercial banks had a market share of 52% and finance companies and others shared<br />
the remaining 11%. The GHB share was up substantially from the mid-1990’s level of<br />
20%, reflecting the bank failures and retrenchment precipitated by the crisis.<br />
The standard mortgage instrument in Thailand has been a reviewable rate mortgage.<br />
Prior to 1999, the loans offered by GHB featured fixed payments and a flexible term.<br />
GHB changed its mortgage <strong>for</strong>mula in 1999 to allow mortgage payments to vary with<br />
interest rates, providing payment relief to cash-strapped borrowers.<br />
Since early 1999, home loans have been considered to be less risky than other loans<br />
because it was anticipated that real demand, rather than speculation, was what would<br />
drive the purchase of homes during this period. Thus, several banks have competed<br />
aggressively in extending home loans, including refinancing by offering very low<br />
mortgage rates, even lower than the banks’ minimum lending rate (MLR). Some banks<br />
offer only at 6.5 - 7.5% whereas the MLR is about 9.25%. Projecting low interest rate<br />
levels in the short-term, banks have initiated a new <strong>for</strong>m of mortgage loan with fixed<br />
Countrywide <strong>International</strong> Consulting Services<br />
792,683<br />
701,387<br />
34%<br />
37% 33%<br />
574,409<br />
29%<br />
443,815<br />
22%<br />
333,518<br />
770,169<br />
1989 1990 1991 1992 1993 1994 1995 1996 1997 1998 1999<br />
Years<br />
13%<br />
-3%<br />
Home Loan Outstanding % Growth Rates<br />
50%<br />
40%<br />
30%<br />
20%<br />
10%<br />
0%<br />
-10%<br />
% Growth Rates<br />
1 1 1
interest rates and terms varying between 18 months and two years, thereafter moving<br />
back to floating rates based on interest rate levels at the time.<br />
Policy Developments<br />
The Thai bond market is still small. Developing a deep bond market is one of the key<br />
financial objectives of the Thai government. In January 1999, there were THB800 billion<br />
of bonds outstanding, representing fewer than 300-bond issues, whose face value<br />
amounted to less than 20% of GDP (16%). The largest share of bond issues in number<br />
and in value (80%) were either issued or guaranteed by the government. Risk-free<br />
benchmarks are now available <strong>for</strong> maturity of up to 10 years.<br />
The development of the domestic bond market can be expected to play a major role in<br />
mortgage product innovations <strong>for</strong> consumers and better overall risk management in the<br />
mortgage markets. In keeping with this view, the Thai government created the Secondary<br />
<strong>Mortgage</strong> Corporation (SMC) in 1997 to develop a secondary mortgage market. The<br />
difficulties in the sector have precluded any progress with securitization. The prevailing<br />
view is that the development of a mortgage-backed securities (MBS) market will take<br />
considerable time.<br />
Sources and References<br />
1. IMF Financial Statistics, 2000<br />
2. Government <strong>Housing</strong> Bank 1998 Annual Report<br />
3. Richupan, Dr.Somchai, “Macroeconomic Instability and <strong>Housing</strong> <strong>Finance</strong>: Thailand’s<br />
Experience.” <strong>Housing</strong> <strong>Finance</strong> <strong>International</strong>, December 1999<br />
4. Ministry of <strong>Finance</strong> – committee on NESDB Conference on Thailand’s<br />
Competitiveness and Economic Recovery, Bangkok, May 1998<br />
5. B. Renaud, M. Zhang, and S. Koeberle, How the Real Estate Sector Undid Financial<br />
Institutions: What Can be Done Now?, NESDB Conference on Thailand’s<br />
Competitiveness and Economic Recovery, Bangkok, May 1998.<br />
Countrywide <strong>International</strong> Consulting Services<br />
1 1 2
CENTRAL & EASTERN EUROPE<br />
Countrywide <strong>International</strong> Consulting Services<br />
1 1 3
Regional Summary<br />
Central and Eastern Europe<br />
Most of the economies in Central & Eastern Europe can be classified as recovering from<br />
effects felt from initial privatization and transition to market economies. Overall, most of<br />
the countries have experienced growth since the 1989 recession and have enjoyed some<br />
<strong>for</strong>eign investment during the last decade. Inflation rates have come down significantly<br />
and banking systems have been developed.<br />
Homeownership rates are relatively high, particularly in Estonia, where owner-occupied<br />
housing is at 90%, as well as Hungary and Slovakia with ownership rates of 77% and<br />
73% respectively.<br />
% Owner-Occupied<br />
100%<br />
80%<br />
60%<br />
40%<br />
20%<br />
0%<br />
63%<br />
Czech<br />
Republic<br />
Home Ownership Rate<br />
90%<br />
77%<br />
The Czech Republic and Poland have among the highest volumes of mortgage debt<br />
outstanding.<br />
Countrywide <strong>International</strong> Consulting Services<br />
53%<br />
73%<br />
Estonia Hungary Poland Slovakia<br />
1 1 4
$2,000<br />
$1,500<br />
$1,000<br />
However, outstanding <strong>Mortgage</strong> Debt to Gross Domestic Product ratios are low,<br />
reflecting the recent development and low volume of mortgage finance activities in the<br />
region.<br />
10%<br />
$500<br />
8%<br />
6%<br />
4%<br />
2%<br />
0%<br />
$-<br />
Czech Republic<br />
3%<br />
$1,562<br />
Czech<br />
Republic<br />
EAST & CENTRAL EUROPE<br />
<strong>Mortgage</strong> Debt Outstanding (Millions $US)<br />
Estonia<br />
$198<br />
EAST & CENTRAL EUROPE<br />
Outstanding <strong>Mortgage</strong> Debt / GDP<br />
4%<br />
Hungary<br />
$429<br />
1%<br />
Privatization and transition to market has substantially re-configured the housing stock in<br />
many countries. In most countries, the transition has been supported by government<br />
programs and subsidies to cushion the shock of moving to market rents and prices.<br />
Countrywide <strong>International</strong> Consulting Services<br />
Latvia<br />
$668<br />
10%<br />
$1,388<br />
Poland<br />
1%<br />
Estonia Hungary Latvia Poland<br />
1 1 5
Nevertheless, in most of the countries the transition is incomplete, as sectors of the<br />
market remain protected through rent control.<br />
<strong>Mortgage</strong> finance has been slow to develop throughout the region reflecting high and<br />
volatile interest rates, uncertain employment prospects <strong>for</strong> borrowers, weak and evolving<br />
legal structure <strong>for</strong> property ownership and mortgage lending and lack of long term funds<br />
<strong>for</strong> banks. As postulated by Diamond [1999], households have been reluctant to borrow,<br />
even when offered deeply subsidized rates, reflecting an aversion to paying market rates<br />
of interest and on-going uncertainties about the economy.<br />
<strong>Mortgage</strong> funding comes primarily from bank retail deposits, personal cash, as well as<br />
Bausparkassen (Building Societies) contract savings programs. <strong>Mortgage</strong> bond<br />
legislation has been passed in a number of the countries. Securitization has been slow to<br />
emerge and there is limited mortgage bond activity as a source of funds in the region.<br />
Countrywide <strong>International</strong> Consulting Services<br />
1 1 6
BULGARIA<br />
Economic Background<br />
Year Exchange Rate<br />
Leva/US$<br />
Consumer<br />
Price<br />
Index<br />
Countrywide <strong>International</strong> Consulting Services<br />
Change In<br />
Consumer<br />
Prices<br />
Leva US$<br />
Nominal GDP<br />
(Millions)<br />
Nominal GDP<br />
(Millions)<br />
1990 2.17 23.80% 45.39<br />
1991 0.02 9.52 338.45% 135.71 6,785.50<br />
1992 0.02 18.21 91.30% 200.83 10,041.50<br />
1993 0.03 31.47 72.88% 298.93 9,964.33<br />
1994 0.05 61.71 96.06% 525.55 10,511.00<br />
1995 0.07 100.00 62.05% 880.32 12,576.00<br />
1996 0.18 223.01 123.01% 1,748.70 9,715.00<br />
1997 1.68 2636.55 1082.26% 17,103.40 10,180.60<br />
1998 1.76 3224.28 22.29% 21,577.00 12,259.66<br />
1999 1.84 N/A N/A N/A N/A<br />
Source: IMF<br />
In April 1997, the current ruling <strong>Union</strong> of Democratic Forces (UDF) government won<br />
pre-term parliamentary elections and introduced an IMF currency board system which<br />
succeeded in stabilizing the economy. The triple digit inflation of 1996 and 1997 has<br />
given way to an official consumer price increase of 6.2% in 1999. Following declines in<br />
GDP in both 1996 and 1997, the economy grew an officially estimated 3.5% in 1998 and<br />
2.5% in 1999. In September 1998, the IMF approved a three-year Extended Fund Facility,<br />
which provides credits worth approximately $900 million, designed to support Bulgaria's<br />
re<strong>for</strong>m ef<strong>for</strong>ts. In 1999, an unfavorable international environment - primarily caused by<br />
the Kosovo conflict - and structural re<strong>for</strong>ms slowed economic growth, but <strong>for</strong>ecasters are<br />
predicting accelerated growth over the next several years.<br />
The government's structural re<strong>for</strong>m program includes: (a) privatization and, where<br />
appropriate, liquidation of state-owned enterprises (SOEs); (b) liberalization of<br />
agricultural policies, including creating conditions <strong>for</strong> the development of a land market;<br />
(c) re<strong>for</strong>m of the country's social insurance programs; and (d) re<strong>for</strong>ms to strengthen<br />
contract en<strong>for</strong>cement and fight crime and corruption. On 5 July 1999 the leva was redenominated;<br />
the post-5 July 1999 leva is equal to 1,000 of the pre-5 July 1999 leva.<br />
<strong>Housing</strong> <strong>Market</strong><br />
<strong>Housing</strong> Investment<br />
Year % of GDP % of All Investments Number of<br />
New Units<br />
Average Size of<br />
New Units<br />
sqm<br />
1991 1.60 8.70% 19,423 70.9<br />
1992 1.50 6.60% 17,996 77.0<br />
1993 0.80 5.80% 11,021 81.6<br />
1994 0.50 3.30% 8,669 83.9<br />
1995 1.50 10.70% 6,815 8,601.0<br />
1 1 7
1996 1.40 10.00% 8,099 82.4<br />
1997 1.40 12.30% 7,452 86.7<br />
Source: UN<br />
The housing market is weak with a large portion of the stock in need of renovation. The<br />
number of new houses has dropped off significantly in recent years.<br />
Current low-income levels lead to distortions in household budgets. The ongoing<br />
increase of housing utility and services’ prices shrinks saving capabilities. There<strong>for</strong>e,<br />
even though homeowners may have strong equity position in their homes, most of them<br />
can not express this equity as a demand <strong>for</strong> loans.<br />
<strong>Mortgage</strong> <strong>Market</strong><br />
One bank in Bulgaria, the Bank SSB, has inherited the housing finance monopoly from<br />
the now extinct state-run bank. Refinancing and mortgage loans are funded with<br />
deposits. The other licensed banks are eligible to issue home loans, but have not yet<br />
begun to compete with the Bank SSB.<br />
<strong>Housing</strong> markets and housing lending have developed separately because the credit-tovalue<br />
ratio is very low. The inherited system of housing savings in the SSB is the same.<br />
New economic conditions have made saving <strong>for</strong> housing unattractive because the interest<br />
difference between fixed-term saving deposits and housing deposits has been positive.<br />
This has reduced the financing sources <strong>for</strong> home purchases and renovations, causing<br />
reductions in new construction as well.<br />
The only mortgage instrument is an annuity credit that acts like an Adjustable Rate<br />
<strong>Mortgage</strong> (ARM) with a base rate subject to adjustment to the “basic market interest rate”<br />
in which borrowers are permitted to prepay. All attempts to introduce more flexible<br />
mortgage instruments have failed due to unfavorable macroeconomic conditions.<br />
Demand is low <strong>for</strong> long-term mortgages because of low household ability to pay, whereas<br />
the funds are plentiful with the Bank SSB. The SSB still attracts 70% of the population’s<br />
savings, however not in accounts designated as home finance savings accounts. The<br />
relative share of housing deposits in Bank SSB has fallen to 1.6% of total deposits, the<br />
remainder of deposits being in savings accounts.<br />
Sources and References<br />
1. <strong>International</strong> Monetary Fund (IMF), 2000<br />
2. United Nations National Response Paper on Bulgaria, Workshop on <strong>Housing</strong> <strong>Finance</strong>,<br />
February 2000<br />
3. CIA, The World Factbook 2000<br />
Countrywide <strong>International</strong> Consulting Services<br />
1 1 8
CZECH REPUBLIC<br />
Economic Background<br />
Year Exchange Rate<br />
Koruny / US$<br />
Consumer Price<br />
Index<br />
Countrywide <strong>International</strong> Consulting Services<br />
Change In<br />
Consumer Prices<br />
Koruny US$<br />
Nominal GDP<br />
(Millions)<br />
Nominal GDP<br />
(Millions)<br />
1993 29.15 83.29 1,002,300 34,384<br />
1994 28.79 91.66 10.06% 1,148,600 39,896<br />
1995 26.54 100.00 9.10% 1,348,700 50,818<br />
1996 27.14 108.82 8.82% 1,532,600 56,470<br />
1997 31.70 118.01 8.45% 1,649,500 52,035<br />
1998 32.29 130.62 10.68% 1,776,700 55,023<br />
1999* 34.57 133.37 2.10% 1,833,000 53,023<br />
Source: IMF; *Czech Statistical Office<br />
The recession that immediately followed the ouster of the Communists in 1989 was less<br />
severe than elsewhere in the region, and real growth started by 1994-5 and hit almost 7 %<br />
in 1995. However, the economy stumbled again in 1997 under the weight of the failure<br />
of 3 banks and several scandals involving non-transparent dealings in publicly held<br />
companies. Foreign investors lost confidence because of the "shallow" privatization<br />
process, leaving previous managers entrenched with weak, corporate governance and<br />
limited access to <strong>for</strong>eign direct investment. This slowdown has continued through 1998<br />
and into 1999. Deeper structural re<strong>for</strong>ms are now awaited from the new government<br />
installed in 1998.<br />
<strong>Housing</strong> <strong>Market</strong><br />
As of 1995, the overall housing stock of 3.7 million units was distributed in the following<br />
manner:<br />
<strong>Housing</strong> Unit Status in 1995<br />
Owner Occupied<br />
Family Houses and Flats 43%<br />
Co-operatives 20%<br />
Public and Employer<br />
Rental 27%<br />
Private Rental 10%<br />
Source: Diamond 1999<br />
New construction activity fell sharply after 1990, because the traditional financing<br />
techniques had disappeared, and because real interest rates were high and real economic<br />
growth was negative. Starts made a rapid decline by 88 % to a low of 7,500 in 1993. The<br />
decline in completions was far more gradual until they bottomed in 1995 at 70 % lower<br />
than in 1989.<br />
STARTS AND COMPLETIONS OF HOUSING UNITS: 1989-1998<br />
# Of Units # Of Units<br />
1 1 9
Started<br />
Completed<br />
YEAR<br />
(000)<br />
(000)<br />
1989 56.0 55.1<br />
1990 61.0 44.6<br />
1991 10.9 41.7<br />
1992 8.4 36.4<br />
1993 7.5 31.5<br />
1994 11.0 18.2<br />
1995 16.5 12.7<br />
1996 22.7 14.5<br />
1997 33.2 16.8<br />
1998 35.0 22.2<br />
Source: Diamond 1999<br />
The recovery in the new housing market has continued through expanding subsidies and<br />
rising incomes in the top part of the population. However, the pace of new home<br />
construction has also benefited from a number of subsidy schemes. The largest is a major<br />
subsidy to local governments <strong>for</strong> the construction of additional rental units. The cost of<br />
these units is split in roughly equal shares between the central government, local<br />
government, and the would-be “tenant.” The tenant’s contribution is counted as a<br />
“prepayment” of rent <strong>for</strong> 20 years and in return the tenant is expected to end up with title<br />
after that period. However, full maintenance costs are expected to be charged as well,<br />
making these units more expensive than the existing municipal stock being rented at<br />
below maintenance costs. Over 35,000 of such units have been contracted since 1995<br />
(but many have not yet been started).<br />
In 1996, the government added a subsidy to residential loans taken from mortgage banks<br />
when used <strong>for</strong> new construction. A 4 % point buy-down from the market interest rate<br />
was granted, paid directly to the lender on a limited (but with a high limit) amount of<br />
loan. In addition, government debt became fully taxable after 1996, while mortgage<br />
bonds remained being tax-exempt. In 1998, all mortgagee interest became taxdeductible.<br />
<strong>Mortgage</strong> <strong>Market</strong><br />
The first, new finance subsidy to support housing was a Bausparkasse system adopted in<br />
1993. The resulting system has grown quite large, with about one-fourth of the<br />
population expected to be participating by the end of 1999. Four institutions were able to<br />
get into operation in the first year, and two more in 1994. The very first, the Czecho-<br />
Moravian Building Society, has remained in the lead of the other five since then. All six<br />
institutions have strong minority participation by German Bausparkassen, with majority<br />
ownership resting with a Czech universal bank.<br />
The Bausparkassen have been very successful in attracting savings, and they are starting<br />
to make a large number of loans. The return on savings has been attractive, being<br />
independent of the value of the low-rate housing loan. Over the minimum 5 year savings<br />
period, a 25 % premium on the annual contribution, on top of a 3-4 % return on accrued<br />
savings, has yielded a tax-exempt return of about 12 %. This is higher on an after-tax<br />
basis than most alternatives. Moreover, the Bausparkassen are giving savers a 1.5 %<br />
Countrywide <strong>International</strong> Consulting Services<br />
1 2 0
onus to the basic interest rate, if the savers decline their right to a 6-% loan at the<br />
completion of their 5-year saving period.<br />
The maximum amount of subsidy is achieved by saving at a rate of CZK 18,000 a year<br />
<strong>for</strong> 5 years. With interest and premium, this provides total savings of about CZK 120,000<br />
after 5 years. Matched with a loan of the same size and with a second savings amount<br />
and loan <strong>for</strong> a spouse, a couple can build a total of almost CZK 500,000 towards a<br />
housing investment. This relatively large amount, currently almost USD 15,000, is about<br />
50% of the cost of a modest existing flat, but only 25-35 % of the cost of a more<br />
substantial flat or a family house.<br />
As of the end of 1998, Bausparkassen customers had taken out almost 200,000 loans,<br />
dwarfing the roughly 20,000 regular mortgage loans outstanding. More than 75 % of<br />
these loans were “bridge” loans at market rate, to be paid off by a low-rate loan at the<br />
completion of the contract. Two-thirds of these were <strong>for</strong> the purchase of a housing unit.<br />
<strong>Mortgage</strong> banking legislation was passed in 1995. The design is not that <strong>for</strong>mally<br />
followed in Germany. Universal banks can obtain licenses <strong>for</strong> mortgage banking activity,<br />
as long as they keep separate legal and accounting records on the activity. The<br />
"mortgages" that provide the collateral <strong>for</strong> the mortgage bonds are not physically<br />
segregated from the other assets of the bank, but they are legally segregated in case of<br />
default or bankruptcy, so that they serve exclusively as first-rank collateral <strong>for</strong> the bonds.<br />
This mode of evolution of mortgage banking has allowed the seamless growth of<br />
mortgage lending in the Czech Republic as mortgage banking evolves. The banks have<br />
simply funded their lending from the general deposits of the bank or from mortgage bond<br />
issuances when that funding is attractive. So far, only about one third of the funding has<br />
been through bond issuance. The bonds have rates, 2-3 % points less than government<br />
bonds by virtue of being tax exempt.<br />
Seven mortgage banking licenses that have been issued. All but one of these licenses<br />
were given to universal banks, not specialized mortgage banks, and the one specialized<br />
mortgage bank found it uneconomical to operate in that fashion. One of the mortgage<br />
banks is exclusively focused on making loans on commercial real estate. Another one is<br />
oriented towards commercial loans, loans <strong>for</strong> rental residential developments, and loans<br />
<strong>for</strong> high-cost houses. Three major commercial banks are competing <strong>for</strong> the bulk of the<br />
household market.<br />
As of July 1999, the cumulative volume of owner-occupied residential mortgages<br />
approved by these three banks was 21,708 loans <strong>for</strong> a total of CZK 30.3 billion, or an<br />
average of about USD 40,000 (but many loans cover multiple unit family houses). The<br />
rate of lending had tapered off from 1996 (463 loans per month) through 1997 (260 per<br />
month). This was presumably due to the higher interest rates on loans starting in mid-<br />
1997 and the greater competition from Bausparkassen, where many more contracts are<br />
maturing into loans. Lending rebounded strongly in 1998 despite the high interest rates,<br />
Countrywide <strong>International</strong> Consulting Services<br />
1 2 1
probably due to the passage of tax deductibility of mortgage interest. Even at the higher<br />
current levels, a regular mortgage loan (in contrast to a Bauspar loan) is used in fewer<br />
than one in five housing purchases. When combined with outstanding Bauspar loans, the<br />
total outstanding loan balances are approximately CZK 54 billion or approximately 3% of<br />
GDP.<br />
Currently, the standard design <strong>for</strong> mortgages is a 20-year term, with a rate that is fixed <strong>for</strong><br />
5 years and prepayment that is subject to high, but negotiable, fees. Buyers of new<br />
houses, who qualify <strong>for</strong> a 4 percentage point subsidy from the government that is payable<br />
out to 20 years, find full term loans attractive. Even if not eligible <strong>for</strong> the direct subsidy,<br />
the interest on the loan is currently tax deductible, which reduces the effective real rate of<br />
interest to about zero %, at least <strong>for</strong> high-income borrowers in the 30-40 % tax brackets.<br />
As of June 1998, these loans were being offered at rates of about 14 % <strong>for</strong> the first 5<br />
years. However, rates came down sharply in March 1999, to 10 %. Underwriting on<br />
these loans is based on calculations designed to ensure that remaining discretionary<br />
income exceeds 1.6 times the minimum living income <strong>for</strong> that family size (this approach<br />
parallels the approach in Germany). The net effect, apparently, is <strong>for</strong> a payment-to-net<br />
income (PTI) ratio of about 30-35 %. In making these calculations, the 4 % subsidy is<br />
deducted from the rate (if applicable), and a share of the tax savings due from deducting<br />
the interest paid is also removed from the net mortgage payment.<br />
Interest Rates<br />
Year Lending Rate Deposit Rate <strong>Mortgage</strong> Rates<br />
1993 14.07% 7.03%<br />
1994 13.12% 7.07%<br />
1995 12.80% 6.96%<br />
1996 12.54% 6.71%<br />
1997 13.20% 7.71%<br />
1998 12.81% 8.08% 14.00%<br />
Source: IMF, Diamond<br />
Policy Developments<br />
The government will create a “State <strong>Housing</strong> Development Fund” in which non-budget<br />
funds will be accumulated <strong>for</strong> implementation of certain housing development measures,<br />
particularly two basic functions. First, funds will be accumulated with the purpose of<br />
providing guarantees <strong>for</strong> bank loans that are granted by mortgage and construction<br />
savings banks to municipalities and housing cooperatives. Second, funds will be<br />
accumulated to provide loans and subsidized interest rates <strong>for</strong> loans granted by mortgage<br />
and construction savings banks to municipalities and housing cooperatives.<br />
The government will provide support <strong>for</strong> collective investors-especially cooperatives and<br />
the <strong>for</strong>thcoming non-profit housing organizations. Government subsidy <strong>for</strong> construction<br />
savings plans and loans will be available to members of these legal entities <strong>for</strong> financing<br />
joint developments. The existing program, providing subsidies to municipalities <strong>for</strong><br />
Countrywide <strong>International</strong> Consulting Services<br />
1 2 2
construction of rental housing and technical infrastructure, will continue until activities of<br />
non-profit housing organizations sufficiently develop.<br />
Sources and References<br />
1. Diamond, D. “The Transition In <strong>Housing</strong> <strong>Finance</strong> In Central Europe And Russia”,<br />
Urban Institute, October 1999.<br />
2. Czech Ministry of Regional Development, various publications on housing subsidies<br />
and housing construction.<br />
3. IMF: <strong>International</strong> Financial Statistics, 2000<br />
4. Hegedus, J.; Tosics, I.; and Mayo, S., "Transition of the <strong>Housing</strong> Sector in the East<br />
Central European Countries," Review of Urban and Regional Development Studies,<br />
8, 1996.<br />
5. United Nations, National Response Paper on Czech Republic, Workshop on <strong>Housing</strong><br />
<strong>Finance</strong>, February 2000.<br />
Countrywide <strong>International</strong> Consulting Services<br />
1 2 3
ESTONIA<br />
Economic Background<br />
Year Exchange Rate<br />
Krooni/US$<br />
Consumer Price<br />
Index<br />
Countrywide <strong>International</strong> Consulting Services<br />
Change In<br />
Consumer Prices<br />
Krooni US$<br />
Nominal GDP<br />
(Millions)<br />
Nominal GDP<br />
(Millions)<br />
1990<br />
1991 1,832 n.a.<br />
1992 27.71 13,158 n.a.<br />
1993 13.22 52.59 89.81% 21,610 1,635<br />
1994 12.99 77.65 47.65% 29,645 2,282<br />
1995 11.46 100.00 28.78% 40,705 3,552<br />
1996 12.03 123.05 23.05% 52,446 4,360<br />
1997 13.88 136.07 10.58% 64,324 4,634<br />
1998 14.07 147.24 8.21% 73,213 5,204<br />
1999 14.68 152.09 3.30% 75,360 5,134<br />
Source: IMF<br />
Estonia regained its political independence on 20 August, 1991 and held its first elections<br />
in 1992. Structural re<strong>for</strong>ms and establishment of a market economy started immediately,<br />
and the economy stabilized by 1994. The banking establishments operating in the Soviet<br />
times ceased operations, and a new banking sector was established, entirely in private<br />
hands and mostly with private Estonian capital.<br />
A major assist to stabilizing the economy and supporting the new banks was the decision<br />
to follow a currency board approach to monetary policy. It started in June 1992, when the<br />
Estonian kroon was locked to the DEM at 8 EEK = 1 DEM. As it happened, this<br />
exchange rate made Estonian assets and wages attractive to <strong>for</strong>eign investors, particularly<br />
from Scandinavia. In addition, enterprises in the Baltic, Scandinavian states and Russia<br />
found Estonia a good place to do business. As a result, the real economy grew rapidly, a<br />
total of 20 % from 1994 to 1997, and a current account deficit, averaging almost 9 % of<br />
GDP annually, was financed largely out of <strong>for</strong>eign direct investment.<br />
With the inflow of capital and expansion in the demand <strong>for</strong> bank deposits, the money<br />
supply grew rapidly, with total bank deposits more than tripling from 1994 to 1997.<br />
Despite inflation averaging over 20 %, real wages rose by a total of 20 %.<br />
The economic boom ended when the market <strong>for</strong> emerging market equities was rocked by<br />
economic crises in Asia. This prompted a major sell-off in the thin Estonian Stock<br />
<strong>Market</strong> starting in October 1997. Emerging market debt was also suddenly appearing less<br />
desirable, and margins on <strong>for</strong>eign borrowing widened dramatically. The creditworthiness<br />
of banks was affected by their extensive holdings of equities. In addition, speculative<br />
pressures against the EEK increased, which also drove up short-term interest rates<br />
sharply. All of these pressures were increased further by the crisis in the Russian<br />
1 2 4
economy in August 1998. This put the economy into a recession in late 1998, from<br />
which it began to recover in 1999.<br />
<strong>Housing</strong> <strong>Market</strong><br />
The Estonian population was 1.46 million in 1997. This signifies an annual decline of<br />
1% since 1994. As in the case of some other transition economies, the process of<br />
privatizing the state-owned stock of housing has created a housing market that is<br />
unusually heavily owner-occupied, over 90 %. The real estate market can be divided into<br />
two: apartments and private houses. Currently apartments <strong>for</strong>m 85% of the market.<br />
Although new housing completions did not rise substantially, resales of homes did, by<br />
over 100 % from 1995 to 1997.<br />
YEAR<br />
% <strong>Housing</strong> Expenditure New (commissioned)<br />
in GDP<br />
residential buildings<br />
1992 n.a. 3405<br />
1993 8.4 2431<br />
1994 12.0 1953<br />
1995 13.7 1149<br />
1996 13.8 935<br />
1997 13.7 1003<br />
1998 n.a. 882<br />
Source: Estonia <strong>Housing</strong> Statistical Office, 1999<br />
According to the Estonian Statistical Office, the total area of constructed dwellings was<br />
121 000 m2 in 1997. Building permission was granted <strong>for</strong> the construction of more than<br />
15 000 m2. Similar developments can be perceived <strong>for</strong> 1998. In 1997, the value of<br />
dwelling space transactions was 3 485 million EEK. The average price of dwelling<br />
spaces is currently between 8000 and 12 000 EEK per m2 and these prices will rise.<br />
<strong>Mortgage</strong> <strong>Market</strong><br />
The steady improvement in economic conditions and low interest rates relative to rising<br />
nominal incomes began to make consumer borrowing of greater interest to the public.<br />
The rapid expansion in funds made banks more interested in providing loans.<br />
Meanwhile, legislation in 1995 strengthened the legal basis <strong>for</strong> loan recovery under<br />
housing loans, making mortgage lending more feasible.<br />
The banks remained concerned, however, about the prospect of making such long-term<br />
loans based on short-term deposits from an uncertain customer base. This impasse was<br />
ended when the European Bank <strong>for</strong> Reconstruction and Development (EBRD) offered<br />
access to long-term (10 years) funding specifically <strong>for</strong> residential mortgages (but in the<br />
<strong>for</strong>m of subordinated debt). Hansapank starting offering mortgages based on this facility<br />
in 1996. Uhispank (<strong>Union</strong> Bank) also tapped into similar EBRD funding and Hoiupank<br />
(Savings Bank) competed using primarily deposits. A rapid decline in margins combined<br />
with a decline in nominal interest rates to levels below inflation and a soaring stock<br />
market, ignited pent-up demand to borrow <strong>for</strong> housing. As 1997 progressed, residential<br />
Countrywide <strong>International</strong> Consulting Services<br />
1 2 5
mortgage lending soared to over EEK 150 million a month, and totaled over 2 % of GDP<br />
<strong>for</strong> the year.<br />
The period 1996 to October 1997 saw a rapid evolution in the access of Estonian banks to<br />
medium-to-long term financing from <strong>for</strong>eign institutional investors. In total, the banking<br />
sector increased the total of outstanding <strong>for</strong>eign debt from almost zero at the end of 1995<br />
to EEK 536 million at the end of 1996 and EEK 2.3 billion by September 1997 (a 400 %<br />
rise in 9 months). This inflow of <strong>for</strong>eign funding permitted total bank credit to expand by<br />
almost 90 % in 1997 although deposits rose by only 40 %.<br />
The tax deductibility of mortgage interest (at the flat 26 % rate) pushed effective nominal<br />
interest rates below 10 % and also below the inflation rate of 11 % in 1997. However, the<br />
number of housing purchase loans made in the peak year of 1997, about 7,000 net of<br />
loans <strong>for</strong> renovation (10,000 in total), was still less than one-fourth of the number of<br />
recorded sales of homes. Thus, as striking as the boom in mortgage lending was in that<br />
period, the majority of housing transactions remained all-cash purchases (as has been the<br />
case in Central European countries). The mortgage market made a strong debut, but was<br />
still in a nascent state.<br />
This initial boom in mortgages ended when the 1997 and 1998 economic crises. The end<br />
result was a tightening of underwriting conditions and a rise in rates to as high 13-14 %.<br />
In 1997, new originations dropped off some, but rose back to over EEK 100 million per<br />
month after short-term rates dropped again in April 1998. The market was hit even<br />
harder after Russia defaulted in August 1998 and averaged only EEK 57 million a month<br />
from then until rates dropped again in March 1999. As of mid-1999, lending is back at its<br />
previous peak pace of about 130 – 170 million kroons per month.<br />
In spite of stricter loan conditions and limited funds, there has been a continuous growth<br />
in mortgage loan balances. This is not the result of an increase in the volume of new<br />
loans, but rather due to the fact that the repayment of the principal on the loans so far<br />
issued, has been relatively small.<br />
<strong>Mortgage</strong> Balances<br />
million kroons 12/97 01/98 02/98 03/98 04/98 05/98 06/98 07/98 08/98<br />
<strong>Mortgage</strong> balances 2,125 2,185 2,218 2,267 2,347 2,434 2,722 2,769 2,784<br />
Monthly turnover 80,5 53,2 85,6 85,6 119,0 115,2 132,0 83,3 55,2<br />
Source: The Bank of Estonia<br />
<strong>Mortgage</strong>s constituted approximately 6% of the consolidated balances of the Estonian<br />
banks in May 1998 and approximately 10% of their total loan portfolios.<br />
All four major banks offer housing loans and three of the four are aggressively competing<br />
in the market. The dominant lender is Hansapank, which is the result of a merger in 1998<br />
of the two banks that were the largest housing lenders in 1997. The main competitors are<br />
Uhispank and Merita. Uhispank is also the result of merger in 1998, of the second and<br />
Countrywide <strong>International</strong> Consulting Services<br />
1 2 6
fourth largest banks (as of 1997). Both Hansapank and Uhispank are today controlled by<br />
Swedish institutions which are also strongly retail oriented and are presumably supportive<br />
the ef<strong>for</strong>ts of these Estonian institutions to expand in this area. Merita Bank, the largest<br />
Finnish bank be<strong>for</strong>e merging with a large Swedish bank in 1998, is the fourth competitor.<br />
Merita is pursuing a program of steady expansion of its Estonian exposure, fueled by<br />
direct funding in euros from the head office in Helsinki.<br />
Other than Merita, banks have begun to rely on medium-term (3-5 years) notes issued in<br />
the Eurobond market, as well as local deposits in DEMs, to fund housing loans <strong>for</strong> terms<br />
up to 15 years. The rate on these loans is expressed as a fixed margin over 6-month<br />
LIBOR. Recently, most loans have carried a margin of 8 %. The margin on <strong>for</strong>eign<br />
borrowing has been about 2-3 % over LIBOR, implying a gross lending margin of 5-6 %.<br />
However, this spread must cover also the cost of obligatory reserves with the Central<br />
Bank (13 % of funds paying only 2.0 % interest) and the cost of offshore bond issuance.<br />
These two together are about 1 %, leaving a gross margin of about 4-5 %, relatively low<br />
<strong>for</strong> housing lending in an emerging market and with relatively small loans (averaging<br />
EEK 200,000 or USD 14,000).<br />
Interest Rates<br />
Year Interbank<br />
Money <strong>Market</strong><br />
Deposit Rate Lending Rate<br />
1992 n.a. n.a. 30.50%<br />
1993 n.a. n.a. 27.30%<br />
1994 5.67% 11.51% 23.08%<br />
1995 4.94% 8.74% 15.95%<br />
1996 3.53% 6.05% 13.67%<br />
1997 6.45% 6.19% 19.82%<br />
1998 11.66% 8.07% 16.67%<br />
1999 4.92% 4.19%<br />
Source: IMF<br />
There is a portion of the market (about 20-25 %) which has different characteristics.<br />
Loans which are smaller than EEK 100,000 (about USD 7,000) are generally financed in<br />
EEK at a higher interest rate (floating based on bank’s ”base” rate; currently 13 %) over a<br />
shorter term. This allows the use of funding from local EEK deposits and the avoidance<br />
by more moderate income households of significant currency exposure. These EEK loans<br />
apply generally to renovation loans and loans <strong>for</strong> the purchase of lower price houses,<br />
especially in the rural areas.<br />
Credit risk does not seem to be a major concern of banks. The legal basis <strong>for</strong> loan<br />
recovery through <strong>for</strong>eclosure appears to be relatively certain but can be slowed down <strong>for</strong><br />
up to 2 years through litigation. However, there are two good reasons why defaulters do<br />
not generally resort to litigation. First, loan-to-value ratios (on first mortgages) are<br />
limited by law to 66 %, thus making it very likely that additional interest and fees will be<br />
costing the borrower and not the lender. Second, Estonia does not have a personal<br />
bankruptcy provision allowing the extinguishing of the unpaid debt on a <strong>for</strong>eclosed<br />
Countrywide <strong>International</strong> Consulting Services<br />
1 2 7
mortgage. Thus, the lender has the option of continuing to seek recompense beyond the<br />
value of the house.<br />
Policy Developments<br />
The Estonian <strong>Housing</strong> Foundation was founded in 1994 and restructured in 1998. It is<br />
the non-profit organization with a mission of creating loans <strong>for</strong> building, purchasing<br />
and/or reconstructing homes. The Foundation targets three key groups:<br />
1. Young Families<br />
2. Young school-teachers and teachers employed in rural schools<br />
3. Flat – owners associations and housing co-operatives when targeted <strong>for</strong> energy<br />
efficiency improvements in their area.<br />
The state has budgeted the following funds <strong>for</strong> this Foundation:<br />
1995 1996 1997 1998<br />
Funds assigned from the<br />
State budget – mil.kroon<br />
15.0 30.0 20.0 10.0<br />
Source: Estonian National Response Paper<br />
Sources and References<br />
1. Pricewaterhouse Coopers, “Banking and <strong>Finance</strong>” and “Quarterly Economic Report”,<br />
Tallinn, 1998, 1999.<br />
2. Diamond, D., “The Potential For A Secondary <strong>Market</strong> Mechanism In Estonia”, July<br />
1999.<br />
3. <strong>Housing</strong> Statistical Office of Estonia, 1999. ISBN 9985-74-110-2<br />
4. Statistical Yearbook 1999. Statistical Office of Estonia.<br />
5. Development Plan <strong>for</strong> <strong>Housing</strong> in Estonia until the year 2000. Ministry of Economic<br />
Affairs.<br />
6. United Nations, National Response Paper on Estonia, Workshop on <strong>Housing</strong> <strong>Finance</strong>,<br />
February 2000.<br />
Countrywide <strong>International</strong> Consulting Services<br />
1 2 8
HUNGARY<br />
Economic Background<br />
Year Exchange<br />
Rate<br />
Forints/US$<br />
Consumer<br />
Price<br />
Index<br />
Countrywide <strong>International</strong> Consulting Services<br />
Change In<br />
Consumer<br />
Prices<br />
Forints US$<br />
Nominal GDP<br />
(Millions)<br />
Nominal GDP<br />
(Millions)<br />
1990 63.21 32.45 28.97% 2,089,300 33,053.31<br />
1991 74.74 43.55 34.23% 2,498,300 33,426.55<br />
1992 78.99 53.55 22.95% 2,942,600 37,252.82<br />
1993 91.93 65.57 22.45% 3,548,300 38,597.85<br />
1994 105.16 77.94 18.87% 4,364,800 41,506.28<br />
1995 125.68 100.00 28.30% 5,561,900 44,254.46<br />
1996 152.65 123.49 23.49% 6,823,300 44,698.98<br />
1997 186.79 146.06 18.28% 8,461,550 45,299.80<br />
1998 214.40 167.06 14.37% 10,162,600 47,400.19<br />
1999 237.15 184.27 10.30% 11,420,000 48,155.18<br />
Source: IMF<br />
Hungary was one of the last of the Central European countries to begin an economic<br />
recovery. This partly reflected the negative growth in population over the period, but<br />
more importantly a different approach to restructuring the economy. To move the bulk of<br />
the economy to private ownership and at the same time attract <strong>for</strong>eign direct investment,<br />
direct sales of controlling or strategic interests were made of most state holdings,<br />
including major utilities and other infrastructure. The result was a sharp rise in<br />
unemployment but also a record amount of <strong>for</strong>eign direct investment (per capita). The<br />
unemployment rate peaked at 11.9% in 1993 and fell further throughout the 1990’s but<br />
remained at 7.8% at the end of 1998. Although a financial retrenchment in 1995 slowed<br />
the economy again, there is today a general expectation that the basis has been laid <strong>for</strong> an<br />
extended period of strong economic growth. GDP growth has been strong in recent<br />
years, with 4.9% in 1998 and 4.1% in 1999. Progress has been made on inflation, which<br />
fell from 18.3% in 1997 to less than 10% at the beginning of 2000.<br />
<strong>Housing</strong> <strong>Market</strong><br />
Hungary is well known <strong>for</strong> having started the transition with an economy that was more<br />
private-sector oriented than other <strong>for</strong>merly Communist countries. This applied as well to<br />
the production and ownership of housing. Since the early 1980s, most new construction<br />
had been in the <strong>for</strong>m of owner-occupied family houses and flats, and truly private<br />
condominium tenure was the norm, rather than the quasi-private co-operative structure<br />
common elsewhere.<br />
In 1990, 77 % of the stock was already owner-occupied. As rents were raised, and low<br />
prices set on the public rental stock, most of it also was privatized, producing one of the<br />
highest ownership rates in the world at an estimated 91 % in 1998. Moreover, re<strong>for</strong>ms of<br />
rental and <strong>for</strong>eclosure laws have established a strong legal basis <strong>for</strong> private rental and<br />
mortgage lending. Persons remaining in public rentals benefit from a housing allowance<br />
1 2 9
scheme, especially <strong>for</strong> buffering the effects of market level utility rates (owners can also<br />
benefit).<br />
<strong>Housing</strong> Unit Status in 1994<br />
Owner-occupied (incl. condos): 86%<br />
Public Rental (inc. employer) 13%<br />
Private Rental 1%<br />
Source: Diamond<br />
The adjustments in housing policy necessitated by the political changes in 1989 were<br />
changes more of magnitude rather than nature. The basic structure of supports <strong>for</strong> the<br />
sector, i.e., a system of grants and subsidized loans to private owners, was left in place<br />
and modified to accommodate the steep increase in inflation. The subsidy scheme put in<br />
place at the end of 1988, relying primarily on deep loan repayment subsidies, was<br />
replaced in 1994 by a scheme of large lump-sum payments to families with two or more<br />
children buying a new house. High nominal rates on housing loans could be moderated<br />
by use of a Deferred Payment <strong>Mortgage</strong>. Payments were set to amortize the loan at a 15<br />
% rate and the gap from the payment at a market rate of about 30 % was capitalized, with<br />
payments recast annually to fully amortize.<br />
In the first years of transition, the housing market was active and prices strong, especially<br />
in Budapest. <strong>Housing</strong> was quickly reallocated to more appropriate owners and frequently<br />
into commercial use in central Budapest. It was also seen initially as a protection against<br />
inflation running over 30 %. In 1995, the economy went through an austerity and<br />
retrenchment program, from which it and the housing market have emerged stronger<br />
since 1996. Inflation trended down sharply from a second peak of 28 % in 1995 to about<br />
10 % in 1999.<br />
New construction of housing was promoted by deep lump-sum subsidies starting in 1994,<br />
and had recovered to about half of the pre-transition level. However, there were no<br />
shortages in housing as of 1990, and a declining trend in population and the absence of<br />
large migrations to Budapest has muted the demand <strong>for</strong> new units. The level of housing<br />
completions by the late 1990s was less than half of that in 1989.<br />
COMPLETION OF HOUSING<br />
UNITS IN HUNGARY: 1989-1998<br />
# Of Units<br />
Completed<br />
YEAR<br />
(000)<br />
1989 51.5<br />
1990 43.8<br />
1991 33.2<br />
1992 25.8<br />
1993 20.9<br />
1994 20.9<br />
1995 24.7<br />
1996 28.3<br />
1997 28.1<br />
1998 20.3<br />
Source: Diamond 1999<br />
Countrywide <strong>International</strong> Consulting Services<br />
1 3 0
House prices started out high relative to incomes, but a steady decline in the price-income<br />
ratio since 1992 has brought prices in line with EU levels of 4-6 times the income of the<br />
purchaser. The absolute level of prices remains low by EU standards, with existing flats<br />
selling <strong>for</strong> USD 20-30,000.<br />
<strong>Mortgage</strong> <strong>Market</strong><br />
<strong>Mortgage</strong> lending was a major business in Hungary be<strong>for</strong>e the transition, because most<br />
new housing was subsidized via such loans to individual buyers (not cooperatives).<br />
However, the underwriting of such loans was perfunctory and recovery in case of default<br />
based entirely on garnishment of wages from the state employer.<br />
From 1989-93, the flow of mortgage lending <strong>for</strong> private housing remained relatively high,<br />
supported by the deep loan repayment subsidies as well as low-rate loans from employers<br />
and local governments. Almost all of this lending continued to be through the <strong>for</strong>mer<br />
state savings bank, despite the appearance of several competing commercial banks. Only<br />
in 1994 was the approach to underwriting changed fundamentally to coincide with the<br />
ending of deep loan subsidies and the start of privatization in the banking sector. Since<br />
then, the volume of lending has shrunk by more than 80 % in real terms, as households<br />
shifted to using their own (and relatives’) funds instead of bank funds bearing a real rate<br />
of over 10 % and nominal rates of 25-30 %.<br />
As in other CE transition countries, Hungary started with a dominant savings bank, the<br />
Orszagos Takarekpenztar (OTP), serving the household saving and loan market and<br />
funding the commercial banks. In addition, there were a number of large state-owned<br />
commercial banks set up just prior to 1989. Most have been privatized and sold to<br />
strategic investors. Despite these steps, OTP's grip on the retail deposit market has<br />
remained strong and has deterred entry into the housing finance market.<br />
OTP remains the dominant private housing finance provider in Hungary. In 1998, OTP<br />
made about 18,000 loans of all kinds <strong>for</strong> housing (not including loans it administered <strong>for</strong><br />
employers and local governments). The majority of these were conventional loans,<br />
without any <strong>for</strong>m of deep subsidy. OTP has also made a successful move into being a<br />
major player in the Bausparkasse business.<br />
As of 1998, there were two other commercial banks competing with OTP in making<br />
housing loans. Initially, neither competitor moved aggressively to take market share.<br />
However, the market competition is heating up. In 1998, K&H Bank made about 550<br />
loans <strong>for</strong> HUF 1.0 million each on average. In addition, Postabank started to offer<br />
housing loans, completing about 270 transactions. All loans by these banks are <strong>for</strong> 10-15<br />
years in term, at a rate that floats and is set unilaterally by the lender.<br />
Most borrowers choose the traditional variable rate mortgage (VRM) design, despite the<br />
mid-1999 interest rate of 22 %. These are underwritten to a maximum payment-to-net<br />
income ratio of 33 %. At such high interest rates, the maximum loan-to-value ratio of 80<br />
Countrywide <strong>International</strong> Consulting Services<br />
1 3 1
% is rarely a limitation. The typical borrower can carry a loan <strong>for</strong> at most about USD 5-<br />
7,000, about 25-35 % of the cost of even a modest existing flat. Notably, the actual<br />
average loan size <strong>for</strong> these standard VRMs is only about half this maximum, suggesting<br />
most people’s aversion to borrowing.<br />
The major alternative to the traditional design is the Deferred Payment <strong>Mortgage</strong> (DPM).<br />
This is a loan design whereby a payment interest rate is set (in the general case at 15 %)<br />
and the difference between that payment and the payment due at the full market rate (22<br />
%, but <strong>for</strong>merly 28-32 %) is deferred. Periodically, a new payment is set that will<br />
amortize the loan over the remaining term. In effect, it allows the bank to choose how<br />
much capitalization of the inflation premium to permit and it avoids the need <strong>for</strong> the<br />
customer to understand how price and wage indices are being applied. Current rates are<br />
about 22-23 %, despite inflation of about 10 % and Treasury rates of about 14 %.<br />
Countrywide <strong>International</strong> Consulting Services<br />
1 3 2
Interest Rates<br />
Year<br />
Treasury Bill<br />
Rate<br />
Lending Rate<br />
Deposit<br />
Rate<br />
1990 30.13% 28.78% 24.68%<br />
1991 34.48% 35.09% 30.41%<br />
1992 22.65% 33.05% 24.41%<br />
1993 17.22% 25.43% 15.65%<br />
1994 26.93% 27.40% 20.31%<br />
1995 32.04% 32.61% 26.10%<br />
1996 23.96% 27.31% 22.21%<br />
1997 20.13% 21.77% 18.54%<br />
1998 N/A N/A N/A<br />
Countrywide <strong>International</strong> Consulting Services<br />
<strong>Mortgage</strong><br />
rates<br />
Gov't Bond<br />
Yields<br />
1999 N/A N/A N/A 22-23% 14%<br />
Source: IMF, Diamond<br />
Only recently has Hungary come to inaugurate new housing finance structures.<br />
Bausparkasse legislation was passed in 1996 and first operations began in June 1997.<br />
Three institutions were able to get into operations in the first year, and one more started in<br />
1998. Notably, the largest single institution, the one sponsored by OTP, has no minority<br />
participation by a German or Austrian Bausparkasse. Growth in contracts has been<br />
strong. By the end of the third year, the number of contracts is expected to be about<br />
500,000.<br />
<strong>Mortgage</strong> banking legislation was enacted in 1997 and a government-sponsored mortgage<br />
bank began operations in 1999. Notably, the mortgage banking legislation has closely<br />
followed the German model, requiring that the banks be set up as separate institutions,<br />
with a large minimum capital and a separate supervisory structure. The legislation does<br />
not provide <strong>for</strong> any advantages or subsidies to mortgage banking over deposit-based<br />
finance. <strong>Mortgage</strong> bonds will be tax-exempt, but so are all bonds and savings accounts at<br />
this point.<br />
The level of outstanding mortgage debt has been falling, as earlier loans go into periods<br />
of lower subsidy (repayment subsidies attached in 1989-93 step down every 5 years). It is<br />
now below HUF 120 million, or only about 1 % of GDP.<br />
Sources and References<br />
1. Diamond, D., The Transition in <strong>Housing</strong> <strong>Finance</strong> In Central Europe And Russia:<br />
1989-1999, Report prepared <strong>for</strong> USAID, November 1999<br />
2. IMF: <strong>International</strong> Financial Statistics, 2000, www.imf.org<br />
3. World Bank, www.worldbank.org<br />
Contacts<br />
1. Dr. Hozsef Hegedus<br />
Metropolitan Research Institute<br />
Varoskutatas kft, Lonyay tuca 34<br />
H-1093 Budapest<br />
1 3 3
Tel: 36.1.137.9041<br />
Fax: 36.1.216.3001<br />
Email: Hegedus@mri.hu<br />
Countrywide <strong>International</strong> Consulting Services<br />
1 3 4
Latvia<br />
Economic Background<br />
Year Exchange<br />
Rate<br />
Lats/US$<br />
Consumer<br />
Price<br />
Index<br />
Countrywide <strong>International</strong> Consulting Services<br />
Change In<br />
Consumer<br />
Prices<br />
Lats US$<br />
Nominal GDP<br />
(Millions)<br />
Nominal GDP<br />
(Millions)<br />
1992 0.74 28.20 243.27% 1,004.55 1,357.50<br />
1993 0.68 58.87 108.77% 1,467.01 2,157.37<br />
1994 0.56 80.01 35.93% 2,042.55 3,647.41<br />
1995 0.53 100.00 24.98% 2,349.22 4,432.49<br />
1996 0.55 117.61 17.61% 2,829.13 5,143.87<br />
1997 0.58 127.54 8.44% 3,275.46 5,647.34<br />
1998 0.59 133.44 4.63% 3,773.52 6,395.80<br />
1999 0.59 136.63 2.39% 3,662.00 6,206.78<br />
Source: IMF<br />
Since regaining independence in 1991, Latvia has achieved macroeconomic stability and<br />
made substantial progress through economic re<strong>for</strong>ms, which have introduced a<br />
functioning market economy. Latvia has made important progress in structural re<strong>for</strong>ms in<br />
recent years, resulting in an increased role in the economy <strong>for</strong> the private sector. These<br />
achievements have clearly placed Latvia in the most advanced group of transition<br />
economies in Central and Eastern Europe. They have also been reflected in increased<br />
confidence in the economy, both domestically and internationally. The latter is<br />
substantiated by the large inflows of <strong>for</strong>eign direct investments. The exchange rate has<br />
been stable and inflation fell to 2.4% in 1999, well within EU targets.<br />
<strong>Housing</strong> <strong>Market</strong>s<br />
Land re<strong>for</strong>m and privatization were among the most important re<strong>for</strong>ms implemented by<br />
the Government of Latvia after regainning independence in 1991. A recovery of property<br />
and privatization have been necessary bases <strong>for</strong> the development of the real estate market<br />
in Latvia. The legal basis of the real estate market transactions in Latvia is implied in the<br />
provisions of the Civil Code and the Law on Land Books. The Civil Code serves as the<br />
legal basis <strong>for</strong> the solution of all major mortgage-related problems. The provisions of the<br />
Law on Land Books are aimed at their practical resolution. This law provides <strong>for</strong> the<br />
registration of real estates and ownership rights related to them.<br />
<strong>Housing</strong> Characteristics 2<br />
Real estate Units Registered in Land<br />
Books (thousand)<br />
Dwelling Stock (million m 2 ; end of period;<br />
total floor space)<br />
of which:<br />
1993 1994 1995 1996 1997 1998<br />
0,3<br />
53,1<br />
10,1<br />
36,4<br />
79,4<br />
133,5<br />
public 28,8 26,6 26,2 25,9 *** ***<br />
co-operative societies of dwelling owners 2,1 2,1 2,3 2,4 *** ***<br />
private 22,2 24,1 24,2 24,5 *** ***<br />
52,8<br />
52,7<br />
52,8<br />
52,9<br />
205,8<br />
53,0<br />
1 3 5
2 – State Land Service, Central Statistical Bureau of Latvia<br />
The legal basis of mortgage lending system in Latvia is implied in the provisions of the<br />
above mentioned laws –the Civil Code and the Law on Land Books, as well as the Law<br />
on Lending Institutions, the Law on <strong>Mortgage</strong> Bonds and the Law on Civil Process. All<br />
the necessary legal preconditions, a large amount of legally registered real estate, as well<br />
as the well-<strong>for</strong>med real estate market and the insignificant volume of real estate liens in<br />
the <strong>for</strong>m of mortgages have been the basis <strong>for</strong> a rapid development of mortgage lending<br />
in Latvia. However, development of the mortgage lending in Latvia is comparatively<br />
slow, hindered by such important obstacles as a limited long-term funding and relatively<br />
low solvency of the potential mortgage lenders. Activity in mortgage lending has sharply<br />
increased during last two years, especially in lending <strong>for</strong> individuals’ dwellings.<br />
There are three basic avenues <strong>for</strong> mortgage loans in Latvia – commercial banks,<br />
insuarance companies and several investment funds. There are eight to ten commercial<br />
banks which provide clients with such type of products. These are loans with a maturity<br />
of 5 to 10 years and the maximum amount of loan can be withdrawn (60-80% of real<br />
estate value). There are three types of mortgage loans offered by commercial banks –<br />
fixed interest rate mortgage loan, floating interest rate mortgage loan and “baloon-type”<br />
mortgage loan (mortgage loan where the borrower previously agreed to reenter an<br />
agreement on specific dates during the life-time of loan).<br />
<strong>Housing</strong> <strong>Finance</strong> 3<br />
Outstanding of mortgage loans in banking sector<br />
(million Lats; end of period)<br />
3<br />
– Latvian Association of Commercial Banks; Bank of Latvia<br />
Countrywide <strong>International</strong> Consulting Services<br />
1997 1998 June, 1999<br />
In 1998, the parliament, Saeima, accepted the Law on <strong>Mortgage</strong> Bonds that is aimed at<br />
the protecting investors and allows commercial banks to issue mortgage bonds, which is a<br />
classical tool <strong>for</strong> refinancing mortgage loans. Up to now only the State Joint Stock<br />
Company “<strong>Mortgage</strong> and Land Bank of Latvia” (MLB) has fulfilled all provissions of the<br />
Law on <strong>Mortgage</strong> Bonds and has obtained permission from the Securities <strong>Market</strong>s<br />
Commission to issue mortgage bonds. Outstanding mortgage bonds issued by the MLB<br />
was 530 thousand Lats at the end of August 1999.<br />
Sources and References<br />
1. IMF: <strong>International</strong> Financial Statistics, 2000<br />
Contacts<br />
1. Ministry of <strong>Finance</strong><br />
Valentīna Andrējeva ,State Secretary<br />
Smilšu iela 1<br />
Riga, LV-1050<br />
LATVIA<br />
Tel.: + 371 7212726<br />
8,9<br />
29,8<br />
39,4<br />
1 3 6
Fax: + 371 7095503<br />
2. Ministry of Environment Protection and Regional Development<br />
Vija Gēme, Head of the Building Department<br />
eldu iela 25<br />
Riga, LV-1494<br />
LATVIA<br />
Tel.: + 371 7026461<br />
Fax: + 371 7820442<br />
E-mail: house@novel.varam.gov.lv<br />
3. <strong>Mortgage</strong> and Land Bank of Latvia<br />
Inesis Feiferis, Chairman of the Board<br />
Doma laukums 4<br />
Riga, LV-1977<br />
LATVIA<br />
Tel.: + 371 7222945<br />
Fax: + 371 7820143<br />
E-mail: inesis@hipo.lv<br />
4. Latvian Asociation of Real Estate Appraisers<br />
Kr.Valdemāra iela 20<br />
5 th floor, apartment No. 9<br />
Riga, LV-1010<br />
LATVIA<br />
Tel.: + 371 7240681<br />
Fax: + 371 7240683<br />
E-mail: eiroeksperts@parks.lv<br />
Countrywide <strong>International</strong> Consulting Services<br />
1 3 7
P O L AN D<br />
Economic Background<br />
Year Exchange Rate<br />
Zlotys/US$<br />
Consumer Price<br />
Index<br />
Countrywide <strong>International</strong> Consulting Services<br />
Change In<br />
Consumer Prices<br />
Zlotys US$<br />
Nominal GDP<br />
(Millions)<br />
Nominal GDP<br />
(Millions)<br />
1990 0.95 16.84 555.38% 56,027 58,976<br />
1991 1.06 29.76 76.71% 80,883 76,305<br />
1992 1.36 43.24 45.33% 114,944 84,518<br />
1993 1.81 59.19 36.87% 155,780 86,066<br />
1994 2.27 78.87 33.25% 223,897 98,633<br />
1995 2.42 100.00 26.80% 306,318 126,578<br />
1996 2.70 120.15 20.15% 385,448 142,759<br />
1997 3.28 139.27 15.91% 469,372 143,101<br />
1998 3.48 155.60 11.73% 551,000 158,333<br />
1999 3.97 N/A N/A 612,000 154,156<br />
Source: IMF<br />
Poland is famous <strong>for</strong> having been the most aggressive of the CE countries in pursuing a<br />
trans<strong>for</strong>mation to the private market. From 1989-1992, it underwent what was called<br />
"shock therapy", when subsidies were stripped away from enterprises and consumer<br />
goods, including utility fees, and extensive privatization of small enterprises was carried<br />
out.<br />
As a result, the transition recession and recovery were telescoped in Poland, with real<br />
(measured) GDP collapsing by about 25 % in 1989-1992, and then starting to recover as<br />
early as 1992. From 1994 to today, Poland has enjoyed rapid recovery and rising real<br />
incomes, with the largest net increase in real incomes since 1989 of the CE countries.<br />
Inflation fell to 10% in 1999 as Poland progressed with a restructuring program preparing<br />
it <strong>for</strong> eventual entry into the EU. Interest rates continue to fall although lending spreads<br />
remain wide.<br />
1 3 8
Rat<br />
es<br />
30<br />
25<br />
20<br />
15<br />
10<br />
5<br />
0<br />
Source: Merrill et. al. 2000<br />
Comparison of Interest Rates<br />
Jan-97 Jun-97 Dec-97 Jun-98 Oct-98 May-99 Jul-99<br />
Date<br />
Countrywide <strong>International</strong> Consulting Services<br />
<strong>Mortgage</strong> Lending<br />
Rate<br />
Treasury Bill Rate<br />
(52 Weeks)<br />
Consumer Price<br />
Index<br />
Minimum 12 Month<br />
Deposit Rate<br />
Maximum 12 Month<br />
Deposit Rate<br />
<strong>Housing</strong> <strong>Market</strong><br />
Poland is by far the largest of the four Central European countries, with a population of<br />
over 38 million people and a housing stock of about 11 million units.<br />
During the Socialist period, there was first an emphasis on the production of state- and<br />
enterprise-owned rental flats and then later on co-operative owned and managed flats,<br />
some of which are considered to be rented from the co-operative and some viewed as<br />
being owned by the resident. However, throughout the Socialist period, there remained<br />
the possibility of obtaining a owner-occupied family house, if one could procure the land<br />
and building materials needed to complete it. As of 1990, the overall housing stock of<br />
11.4 million units was distributed in the following manner:<br />
<strong>Housing</strong> Tenure 1990<br />
Owner-occupied:<br />
Family Houses: 40 %<br />
Co-operatives: 13 %<br />
Rental:<br />
Public: 18 %<br />
Employer: 12 %<br />
Co-operative: 14%<br />
Private: 3 %<br />
Source: (Diamond 1999)<br />
The shock therapy in Poland led to very high inflation rates in 1989-91. One result was<br />
that most housing loans were indexed <strong>for</strong> inflation. The government undertook huge<br />
outlays to buffer the housing sector from both the inflation and the drastic decline in<br />
economy. Because of the availability of continued subsidies on the new "old" loans,<br />
construction of new housing did not fall off as rapidly in Poland. In fact, the completion<br />
of units stayed steady right through the period of shock therapy and into 1993, when it<br />
finally started falling from the range of 130-135,000 units to 90,000 units and eventually<br />
to the range of 60-80,000 units since 1995. On average, the decline in housing<br />
construction was much less than in the other Central European countries.<br />
1 3 9
COMPLETIONS OF HOUSING UNITS: 1989-1997<br />
# Of Units<br />
Completed<br />
YEAR<br />
(000)<br />
1989 150.2<br />
1990 134.2<br />
1991 136.8<br />
1992 133.5<br />
1993 94.4<br />
1994 76.1<br />
1995 67.1<br />
1996 62.1<br />
1997 73.7<br />
Source: Diamond 1999<br />
The government has not moved to <strong>for</strong>ce the privatization of the existing rental stock or to<br />
push rents toward market levels. The ownership of the existing stock of state-owned flats<br />
(which are generally more than 20 years old and often pre-war) was transferred to the<br />
municipal governments and these governments were <strong>for</strong>mally given responsibility <strong>for</strong><br />
housing issues. Rents have been very slow to rise (partly impeded by the removal of<br />
subsidies from energy consumption) to even covering the cost of basic maintenance. This<br />
situation has left the existing rental population without incentives to move or to buy their<br />
unit or invest in new housing or <strong>for</strong> potential investors to invest in existing private rental<br />
housing (except <strong>for</strong> new rental housing, which is exempt from rent controls).<br />
The continuation of deep subsidies to new construction in 1990-1995 limited the decline<br />
in housing starts but has also limited the bounce back from the lows that has been seen in<br />
other countries. Reported completions in 1997-1998 have stayed near the depressed<br />
levels of 1994-1996. However, the number of units under construction has risen sharply<br />
(by 100,000 from 1994 to 1998, to over 500,000). This supports the common view that<br />
the completion figures are being held down partly by the presence of tax incentives that<br />
delay declaration of "completion".<br />
<strong>Mortgage</strong> <strong>Market</strong><br />
The mortgage market in Poland is quite small, reflecting the legacy of the socialist system<br />
through the end of the 1980s and the combination of high inflation and interest rates and<br />
uncertain incomes. Until recently banks eschewed mortgage lending due to the liquidity<br />
risk of long term instruments and the credit risk inherent in a market with weak legal<br />
protection of the mortgage (below) and a lack of credit histories of borrowers. This is<br />
beginning to change, however, as the economy stabilizes and interest rates decline. The<br />
stock of mortgage loans outstanding has more than doubled each of the past 3 years but<br />
mortgage debt outstanding is only 1 % of GDP. Loans to individuals accounts <strong>for</strong> over 81<br />
% of housing lending; credits to developers stand at 15.2 % and commercial credits at 3.5<br />
% of the total.<br />
Table 1: Total <strong>Mortgage</strong> <strong>Finance</strong> Credits Outstanding<br />
Month & Year Total: PLN Mil. Number Of Loans<br />
(000s)<br />
Countrywide <strong>International</strong> Consulting Services<br />
Average Loan<br />
(000s)<br />
1 4 0
12/96 663.0 21.5 30.9<br />
12/97 1,502.2 42.5 35.3<br />
12/98 2,903.6 73.5 39.5<br />
6/99 3,952.6 96 41.2<br />
12/99 7,520.4 n.a. n.a.<br />
Source: Merrill et. al.<br />
Table 2: Increases in Total Consumer Credit and <strong>Mortgage</strong> Lending<br />
Period<br />
Increase in total due to<br />
consumers<br />
Increase in mortgage portfolio<br />
12/97 – 12/98 30% 82%<br />
12/97 – 06/99<br />
Source: Merrill et. al.<br />
54% 147%<br />
The mortgage market has become more competitive in the last few years. As recently as<br />
1996, only 3 banks other than PKO-BP (Powszechna Kasa Oszczednosci Bank<br />
Panstwowy) were offering mortgage finance. By 1998 there were more than 20 mortgage<br />
lenders with several banks including PKO-SA, PBG (Powszechny Bank Gospodarcz y<br />
S.A.), Bank Slaski, PBK (Powszechny Bank Gospodarczy S.A.) and BISE (Bank<br />
Inicjatyw Spoleczno-Ekonomicznych) beginning to accumulate significant portfolios. The<br />
dominant mortgage lender in Poland is the state-owned savings bank (PKO- BP),<br />
reflecting its unparalleled access to consumers and a relatively cheap retail deposit base.<br />
In the late 1990s, PKO’s lending share has fluctuated between 72 and 77 %. Notably,<br />
loans from other banks are significantly larger ($20,000) than those from PKO-BP<br />
(approximately $10,000) perhaps reflecting a higher share of loans <strong>for</strong> new construction.<br />
As of 1999, the main mortgage options are a Dual Index <strong>Mortgage</strong> (DIM), the classic<br />
Variable Rate <strong>Mortgage</strong> (VRM) and the <strong>for</strong>eign-currency denominated loans. A DIM, or<br />
Dual Indexed <strong>Mortgage</strong>, is a flexible term, negatively amortizing instrument in which the<br />
payment rate is set independent of the loan accrual rate. Payments vary with a wage index<br />
and the loan rate varies with a market rate index. If the change in payments due to the<br />
movement in the wage index is greater than the change in required payments due to<br />
interest rate change, the loan amortizes more rapidly. If interest rate change exceeds wage<br />
change, the term lengthens. A variant on the DIM with a higher rate of deferral is also<br />
offered by PKO-BP. Banks vary in the term of the loan, with some not exceeding 5-7<br />
years, most sticking to 15 years, but PKO-BP going to 20 years. All require a floating<br />
rate, usually unilaterally set by the bank according to its judgement as to the cost of funds<br />
and market rates. Most banks also make hard currency loans with a variable rate design<br />
<strong>for</strong> relatively short terms.<br />
Poland has a homegrown contract savings system. The kasa mieszkaniowe (KM) was<br />
established in legislation passed in October 1995. The KM system is motivated by tax<br />
advantages that are linked to the deposit of savings entitling the borrower to receive a<br />
below-market rate loan after completion of the savings period. The system is<br />
administered on a fixed margin basis by banks. It appears to have had relatively little<br />
success so far. The system was revamped in 1999 with a grant replacing the tax incentive.<br />
A Bausparkassen or kasa budowlane (KB) system has been proposed but not<br />
implemented.<br />
Countrywide <strong>International</strong> Consulting Services<br />
1 4 1
As in the other central European countries, Poland is moving towards attempting to fund<br />
a share of its long-term housing loans through bonds issued by specialized mortgage<br />
banks. As in the case of the Bauspar system, the basic legislation has been enacted, but<br />
the final shape of the system is being determined via an extended process of <strong>for</strong>mulating<br />
regulations.<br />
The legislation refers primarily to the classic design of the system in Germany, with<br />
separately capitalized entities engaging exclusively in a few lines of business and funding<br />
themselves nearly exclusively thorough bond issuance. To date only two mortgage bank<br />
licenses has been approved. There are several pending applications, most of which are<br />
from joint ventures between German mortgage banks and Polish commercial banks.<br />
<strong>Mortgage</strong> interest rates have fallen significantly over the past 2 years, from 26% in 1997<br />
to 16% in mid-1999. These are relatively high real rates, since inflation is at 10 % and<br />
generally declining. They reflect both high real rates in general funding markets and a<br />
high spread.<br />
As with all <strong>for</strong>mer socialist countries, the legal system has not been fully supportive of<br />
private property rights. This situation is improving, however. The government’s housing<br />
strategy clearly identifies the inefficiencies and weaknesses of the current registration and<br />
lien system, noting that only 30 % of all land is titled. They recommend full<br />
computerization of their system and increased efficiency in the title registration process.<br />
The mortgage lien has a low priority in Poland and can be superceded at any time by a<br />
government (statutory) lien (typically filed in order to recover tax deficiencies –<br />
individual, corporate or local government). The statutory lien priority has been eliminated<br />
<strong>for</strong> loans originated by mortgage banks and its removal <strong>for</strong> all types of residential<br />
mortgage loans is being pursued.<br />
Sources and References<br />
1. Loic Chiquier, “Dual Index <strong>Mortgage</strong>s: Lessons from <strong>International</strong> Practice and<br />
Conditions of Development in Poland”, <strong>Housing</strong> <strong>Finance</strong> <strong>International</strong>, September<br />
1998<br />
2. Diamond, D., The Transition In <strong>Housing</strong> <strong>Finance</strong> In Central Europe And Russia:<br />
1989-1999, Report prepared <strong>for</strong> USAID, November 1999<br />
3. IMF: <strong>International</strong> Financial Statistics, 2000<br />
4. Merrill, S., Kozlowski,E., Karas, P. and Laszek, J., “Poland: <strong>Housing</strong> <strong>Finance</strong> At The<br />
Millennium: An Assessment Of Achievements And Outstanding Issues” <strong>Housing</strong><br />
<strong>Finance</strong> <strong>International</strong>, 14, 4, June 2000<br />
5. Urban Institute Consortium, Polish <strong>Housing</strong> <strong>Finance</strong> Program,<br />
http://www.polandhousingfinance.org/reports.html<br />
Contacts<br />
Countrywide <strong>International</strong> Consulting Services<br />
1 4 2
1. Cracow Real Estate Institute<br />
Attn: Edward Kozlowski<br />
Tel: (+48) (22) 622 62 97<br />
Fax: (+48) (22) 621 60 22<br />
E-mail: kin_waw@kki.krakow.pl<br />
2. Polish Banks Association<br />
ul. Smolna 10a<br />
00-375 Warszawa<br />
Tel.(0-22) 828 14 09; 826 34 17; 826 34 19<br />
Fax. (0-22) 828 14 06<br />
E-mail: kontakt@zbp.pl<br />
Countrywide <strong>International</strong> Consulting Services<br />
1 4 3
ROMANIA<br />
Economic Background<br />
Year Exchange<br />
Rate<br />
Lei/US$<br />
Consumer<br />
Price<br />
Index<br />
Countrywide <strong>International</strong> Consulting Services<br />
Change In<br />
Consumer<br />
Prices<br />
Lei US$<br />
Nominal GDP<br />
(Billions)<br />
Nominal GDP<br />
(Billions)<br />
1990 22.43 858 38.25<br />
1991 76.39 2.89 230.62% 2,204 28.85<br />
1992 307.95 8.99 211.21% 6,029 19.58<br />
1993 760.05 31.94 255.17% 20,036 26.36<br />
1994 1,655.09 75.62 136.76% 49,773 30.07<br />
1995 2,033.28 100.00 32.24% 72,136 35.48<br />
1996 3,084.22 138.83 38.83% 108,391 35.14<br />
1997 7,167.94 353.69 154.76% 250,480 34.94<br />
1998 8,875.58 562.70 59.10% 338,670 38.16<br />
1999 15,332.80 820.44 45.80% N/A N/A<br />
Source: IMF<br />
Gross Domestic Product (GDP) has steadily decreased during the last decade in the wake<br />
of the decentralization of the Romanian economy. Additionally, the Consumer Price<br />
Index (CPI) has risen substantially and purchasing power of the nation has decreased.<br />
Subsequent to price deregulation in 1990, inflation increased dramatically. This was due<br />
primarily to the imbalance between supply and demand of goods & services combined<br />
with inefficient government policies <strong>for</strong> controlling inflation. This has limited access to<br />
credit as well as been a disincentive to invest <strong>for</strong> companies and individuals. Along with<br />
inflation has come a reduction in real incomes with net wages accounting <strong>for</strong> only ¼ of<br />
the GDP.<br />
Key to transitioning to a market economy has been privatization of industry, particularl y<br />
the state-owned housing stock. The share of the private sector economy has increased<br />
during the last 10 years in response to these ef<strong>for</strong>ts. Agriculture is now at 89%, retail<br />
trade over 70% and construction is over 75% privately owned. Employment also<br />
declined by 14% between 1990 and 1996.<br />
<strong>Housing</strong> <strong>Market</strong><br />
Romania has a large housing stock, with a large share of single family dwellings (55.4%).<br />
Multi-family structures account <strong>for</strong> 39% of all units. However, existing housing stock is<br />
in poor condition and deteriorating.<br />
Share of units in different types of<br />
buildings<br />
1977<br />
1992<br />
Single Family <strong>Housing</strong> 69.0% 55.4%<br />
Terrace <strong>Housing</strong> 9.8% 5.1%<br />
Multifamily Structures 20.6% 39.0%<br />
Source: UN National Research Institute URBANPROJECT<br />
1 4 4
<strong>Housing</strong> production after 1989 decreased dramatically, however there has been a large<br />
volume of improvements, alterations and extensions.<br />
Year<br />
New <strong>Housing</strong> Urban Areas Rural Areas<br />
1990 48,599 41,511 7,088<br />
1991 27,957 22,049 5,909<br />
1994 36,700 17,800 18,900<br />
1995 35,822 15,059 20,763<br />
1997 29,921 10,530 19,391<br />
1998 29,692 10,403 19,289<br />
1999 13,232* N/A N/A<br />
*1.01-30.09<br />
Source: UN National Research Institute URBANPROJECT<br />
Building Permits 1992-1998<br />
• Building Permits Granted 227,115<br />
• Authorized housing 327,930<br />
• New housing (registered by local councils) 240,967<br />
• New housing (registered statistically 1992-1998) 195,887<br />
Source: UN National Research Institute URBANPROJECT<br />
The housing market experienced a great boom in the first years of the transition. It was<br />
triggered by price deregulation, privatization of housing and abolition of <strong>for</strong>mer<br />
restrictions on private ownership. While housing prices in Bucharest on peripheral<br />
locations have fallen as compared to past years, they continue to rise in central areas.<br />
New housing prices have risen substantially, due primarily to increases in the cost of<br />
building materials.<br />
<strong>Mortgage</strong> <strong>Market</strong><br />
Privatization in the early stages of the transition has been considered an important means<br />
of reinstating and rein<strong>for</strong>cing property rights. Under terms of sale, virtually the entire<br />
population paid a price <strong>for</strong> their housing unit and any remaining debt was wiped out by<br />
inflation. In just a short time, Romania became a nation of debt-free homeowners.<br />
However, this high rate of ownership discourages job relocation where one would have to<br />
take on a new mortgage debt when purchasing a new home in another city.<br />
Policy Developments<br />
The National <strong>Housing</strong> Agency has laid the groundwork <strong>for</strong> a new institutional approach<br />
to housing policy issues, as well as mortgage finance issues.<br />
Sources and References<br />
1. IMF: <strong>International</strong> Monetary Fund, Financial Statistics, 2000. http://www.imf.org<br />
2. UN / ECE Environment and Human Settelements Division. “The Transition of the<br />
<strong>Housing</strong> System in Romania,” January 2000.<br />
Countrywide <strong>International</strong> Consulting Services<br />
1 4 5
Russia<br />
Economic Background<br />
Year Exchange<br />
Rate<br />
Ruble/US$<br />
Consumer<br />
Price Index<br />
Change In<br />
Consumer<br />
Prices<br />
Countrywide <strong>International</strong> Consulting Services<br />
Ruble US$<br />
Production Based<br />
Nominal GDP<br />
(Millions)<br />
Nominal GDP<br />
(Millions)<br />
1993 0.99 N/A 874.62% 171,510 173,242<br />
1994 2.19 N/A 307.63% 610,745 278,879<br />
1995 4.56 N/A 197.47% 1,540,490 337,827<br />
1996 5.12 N/A 47.73% 2,145,660 419,074<br />
1997 5.78 N/A 14.74% 2,521,940 436,322<br />
1998 9.71 N/A 27.67% 2,684,540 276,472<br />
1999 24.62 N/A 86.00% 4,545,000 184,606<br />
Source: IMF<br />
Liberalization and restructuring of the Russian economy started in 1992 with the collapse<br />
of the centralized and planned economy. The most cardinal changes in the Russian<br />
economy were under way in 1992 - 1993. The price liberalization of 1992 produced<br />
2,500 % inflation, followed by 850 % in 1993. This period saw the restructuring the<br />
economic management system in general, the onset of mass privatization in various<br />
sectors, including housing, and the emergence and dynamic growth of private companies<br />
and commercial banks.<br />
The process of re<strong>for</strong>ming in Russia turned out to be very painful <strong>for</strong> the majority of<br />
enterprises and residents. Russia witnessed a 50 % cut in the manufactured output from<br />
1991 to 1999, and a net decline of 40% in measured GDP between 1991 - 1998,<br />
accompanied by a dramatic fall in individual real incomes.<br />
However, from late 1994 the macroeconomic situation in Russia demonstrated a growing<br />
stability marked by the emergence of several promising trends in the economic<br />
development. During this period Russia witnessed the <strong>for</strong>mation of new credit, financial<br />
and industrial institutions typical <strong>for</strong> countries with strong market-oriented economies.<br />
An interest rate reduction in late 1995 resulted in the creation of a favorable environment<br />
<strong>for</strong> the development of long-term lending. The best period was 1997, when inflation was<br />
less than 11% and the growth in real individual incomes was 3.4%.<br />
The August 1998 financial turmoil resulted in the bankruptcy of a great number of<br />
companies, including many commercial banks. The federal government’s refusal to repay<br />
its internal debt resulted in frozen bank deposits and a declared moratorium on repayment<br />
of bank debt commitments; simultaneously the government abandoned a policy of<br />
keeping the Ruble exchange rate in the “currency corridor”. The downfall of the Ruble<br />
exchange rate demolished the value of Ruble savings and incomes in terms of USD and<br />
created a growth in inflation (rising from almost nothing to 80 % in 1998) due to the<br />
strong import-dependence of the Russian economy. However, <strong>for</strong> several industries, the<br />
1 4 6
crisis gave the opportunity to rapidly increase their output and offer their products on the<br />
domestic market as a substitute. In the first six months of 1999 the inflation rate was<br />
down to 24 %, and the Ruble/USD exchange rate stabilized at 24-25 Rubles per USD<br />
1.00.<br />
<strong>Housing</strong> <strong>Market</strong>s<br />
The onset of the general economic restructuring in Russia stimulated the re<strong>for</strong>ms in its<br />
housing sector, the priorities of which were <strong>for</strong>mulated in the Federal Law “On<br />
Fundamentals of the Federal <strong>Housing</strong> Policy” (1992). There were four major components<br />
of re<strong>for</strong>m. The first one was a gradual increase in rents and utility charges paid by tenants<br />
of state and municipal residential units. This program was launched in 1994, but progress<br />
has been slow, with actual coverage of all costs by tenants reaching only 35 % so far.<br />
The second task was the development of a competitive structure in the housing<br />
construction and maintenance sectors. The third task was the creation of a more efficient<br />
system of housing finance subsidies and the fourth was the promotion of the marketoriented<br />
instruments of housing finance.<br />
With less federal budget funds available to finance residential property construction, the<br />
responsibility to address the perennial shortage of housing was shifted to municipal<br />
budgets. The previous mechanism of free-of charge allocation of housing became nearly<br />
inoperative, so that in 1997 there was only a quarter as many units allocated as in 1990.<br />
Federal funding was restricted to a few highly targeted groups: military servicemen,<br />
including retired personnel; citizens resettled from Far North Regions and those displaced<br />
by the Chernobyl catastrophe.<br />
Creation of more effective budgetary housing subsidy schemes became an imperative<br />
alongside the task of creating market-based mechanisms <strong>for</strong> housing finance. In 1993,<br />
the President adopted the decree “On the Development and Introduction of Non-<br />
Budgetary Forms of Investment Into the <strong>Housing</strong> Sphere,” and the Government passed<br />
the Program “<strong>Housing</strong>” (with one of its components - housing finance - later, in 1996,<br />
detailed and expanded in a separate program “Your Home”). These documents set out<br />
the main steps, most of which are being implemented:<br />
1. The provision of up-front housing subsidies to individuals <strong>for</strong> construction or<br />
purchase of housing;<br />
2. The issue of housing certificates (bonds) or other securities to finance housing<br />
construction;<br />
3. The development of long-term mortgage lending;<br />
4. The creation of a secondary market through the <strong>for</strong>mation of the Federal Agency<br />
<strong>for</strong> <strong>Mortgage</strong> Lending.<br />
<strong>Mortgage</strong> <strong>Market</strong><br />
Countrywide <strong>International</strong> Consulting Services<br />
1 4 7
To fulfill the task of promotion of long-term residential mortgage lending it was first<br />
necessary to develop an adequate legislative framework. The previous legislation, in fact,<br />
deprived the lender of the right to satisfy his or her mortgage claims and evict the debtor<br />
from the mortgaged property in event of default.<br />
The Law “On Pledge” passed in 1992 and provided the general guidance <strong>for</strong> pledge<br />
transactions. The Decree “On <strong>Housing</strong> Loans” (1994) laid <strong>for</strong>th the procedures <strong>for</strong><br />
originating mortgage loans <strong>for</strong> purchase of housing units and land plots or housing<br />
construction. The Presidential Decree of 1996 <strong>for</strong>mulated once more the provisions of<br />
the draft Law “On <strong>Mortgage</strong>.” However, the court in its practice refused to recognize the<br />
decree as legitimate.<br />
In 1995-1996 the Civil Code of the Real Estate <strong>Finance</strong> was enacted. The Code<br />
established the general rules of using real estate, including residential real property, to<br />
secure loans. It also <strong>for</strong>mulated grounds <strong>for</strong> <strong>for</strong>eclosing a mortgaged residential<br />
property, but failed to make the procedure of defaulter eviction more expedient.<br />
Subsequently, the much-needed law “On State Registration of Real Estate Rights and<br />
Transactions” was passed in 1997. Finally in 1998 the Law “On <strong>Mortgage</strong> (Pledge of<br />
Real Estate)” was approved, which provided clear guidance on how to solve the<br />
<strong>for</strong>eclosure and eviction problem. According to this Law, the borrower and his household<br />
can be evicted from the mortgaged property in the event of default if the borrower gave<br />
written consent be<strong>for</strong>e moving into the purchased unit. However, the Law left unsettled<br />
the problem of eviction when minor children are present.<br />
In addition to high credit risks caused by the lack of well-defined provisions favoring<br />
banks in the event of loan default, the development of residential mortgage lending was<br />
also impeded by:<br />
- High and volatile inflation rates, implying great interest rate risk <strong>for</strong> long-term<br />
lending since banking system’s liabilities were heavily concentrated in short term<br />
accounts;<br />
- Extremely low housing af<strong>for</strong>dability;<br />
- Lack of the relevant expertise and skills in providing such services on long-term<br />
mortgage lending to clients;<br />
- A high rate of return of alternative hard currency operations and later, since 1994, of<br />
operations with treasury bills (GKOs) which provided alternative lower risk<br />
investments <strong>for</strong> banks.<br />
Despite problems in making long term loans <strong>for</strong> unit purchase, there has been progress in<br />
initiating mortgage lending. Banks became rather innovative in the creation of various<br />
“quasi mortgage” schemes, which made it possible to lower credit risks in the situation of<br />
legislative ambiguity. According to experts’ estimates (official statistics are unavailable),<br />
in 1997 the volume of extended loans totaled USD 100 million.<br />
Countrywide <strong>International</strong> Consulting Services<br />
1 4 8
Alongside the creation of conditions favorable <strong>for</strong> the promotion of long-term mortgage<br />
finance, the government has sought to promote housing finance beyond credit and<br />
banking institutions. The prime motivation <strong>for</strong> this ef<strong>for</strong>t was the promotion of the<br />
production and sale of new housing. Among other initiatives, developers attracted<br />
prospective housing purchasers at the construction stage (using share participation, or<br />
investment contracts). Developers also tried to sell completed housing “by installments”,<br />
where a purchaser pays <strong>for</strong> the unit during a set period of time and acquires the ownership<br />
right only upon full payment of its price.<br />
Regional and local authorities mostly issued certificates. In 1994 the total amount of<br />
issued certificates was about USD 250 million (Rbls. 500 billion). <strong>Housing</strong> certificates<br />
were particularly popular during the period of negative bank deposit interest rates (1994 -<br />
1995). Currently the issuance of such certificates is going down.<br />
A survey of interested banks conducted in early 1997 showed new trends in the<br />
development of mortgage lending. On the whole, loan terms were longer than be<strong>for</strong>e.<br />
Some banks had started making loans <strong>for</strong> five and even ten years. More active use was<br />
made of “pledge-purchase” housing rather than the common “rent-purchase” scheme.<br />
Experience had indicated that nonpayment on housing purchase loans was low and might<br />
be reduced to the minimum through use of prudent borrower qualification procedures,<br />
which made a “classic” mortgage contract possible.<br />
The financial crisis of August 1998 made commercial banks aware of the need to<br />
diversify their activities by expanding their services in more stable segments of the<br />
financial market than securities. Today many consider retail residential mortgage lending<br />
as one of the most promising types of these activities. Commercial banks make loans<br />
characterized by LTV ratios of over 50%, an interest rate varying from 20% to 28% on<br />
loans denominated in US Dollars, and 2 - 5 year terms of repayment with some up to 10<br />
years.<br />
The Agency <strong>for</strong> <strong>Housing</strong> <strong>Mortgage</strong> Lending was created to develop the secondary<br />
mortgage market in Russia. The Agency was founded in 1997 with the technical<br />
assistance of USAID. The Agency has proposed the following scheme of operations: it<br />
purchases mortgage loans which commercial banks have extended to private clients <strong>for</strong> a<br />
term of 5 - 10 years loan. The Agency will then issue securities, which will serve as a<br />
source of funds <strong>for</strong> the Agency and which will also carry the guarantee of the RF<br />
Government and/or governments of the Federation subjects.<br />
In 1999 the Agency launched a pilot project of refinancing housing mortgage loans<br />
extended by Saint Petersburg banks to private clients. The city administration of Saint<br />
Petersburg issued guarantees to back the debt commitments issued by the Agency <strong>for</strong><br />
mobilizing additional resources (USD 30 million).<br />
Be<strong>for</strong>e the August 1998 financial crisis most loan products offered by Moscow banks<br />
were Dollar-denominated with interest rates fixed at 22-27 %. The borrower made<br />
Countrywide <strong>International</strong> Consulting Services<br />
1 4 9
egular payments in Rubles at the current exchange rate. This instrument appeared to be<br />
rather effective during the periods of comparative equilibrium in the Ruble to Dollar<br />
exchange rate, when many companies pegged wages still paid in Rubles to the USD<br />
exchange rate. In such circumstances the loan instrument with a Dollar-denominated<br />
fixed interest rate was rather attractive <strong>for</strong> individual clients who, owing to this, were able<br />
to design their payments in advance.<br />
The financial crisis has dramatically changed the situation on the employment market in<br />
major cities, to say nothing about small cities and towns. A significant decline in<br />
individual incomes and unpredictable behavior of the Ruble exchange rate, which shows<br />
a persistent downward tendency, increased the credit and currency risks associated with<br />
the use of the currency-denominated loan instrument with fixed interest rate.<br />
The key factors restricting the demand <strong>for</strong> mortgage finance are a very high ratio of the<br />
unit price to household incomes <strong>for</strong> most households, the high real and nominal cost of<br />
long-term lending, lack of public confidence in the banking system, and general<br />
ambiguity of the economic situation. Prior to the devaluation shock, house price to<br />
income ratios had fallen to low levels in Moscow (2.6) and some other regions (Irkutsk<br />
4.4) but after the shock in 1998 had jumped back to early 1990 levels of 6 or more.<br />
Rapid inflation (at 54 % annual rate in the first half of 1999), high level of Ruble interest<br />
rates and bank costs, and perceived and real risks all dictate a high margin on retail<br />
mortgage lending. For example, Sberbank the <strong>for</strong>mer state saving bank and largest<br />
commercial bank in Russia originates mortgage loans at 42 % in Rubles. With average<br />
per capita income in Russia equal to 1000 Rubles (USD 40) and only 35% of residents<br />
having incomes above the average, any such loans are af<strong>for</strong>dable only <strong>for</strong> a very small<br />
fraction of households.<br />
Sources and References<br />
1. Diamond, D., The Transition In <strong>Housing</strong> <strong>Finance</strong> In Central Europe And Russia:<br />
1989-1999, Report prepared <strong>for</strong> USAID, November 1999<br />
2. IMF: <strong>International</strong> Financial Statistics, 2000<br />
3. Struyk R. and Kosareva N., “Natasha Mae: The First Secondary Facility in the<br />
Former Soviet Bloc”, <strong>Housing</strong> <strong>Finance</strong> <strong>International</strong>, 13, 3, March 1999<br />
Countrywide <strong>International</strong> Consulting Services<br />
1 5 0
SLOVAKIA<br />
Economic Background<br />
Year Exchange<br />
Rate<br />
Koruna/US$<br />
Consumer<br />
Price Index<br />
Countrywide <strong>International</strong> Consulting Services<br />
Change In<br />
Consumer<br />
Prices<br />
Koruna US $<br />
Nominal GDP<br />
(Millions)<br />
Nominal GDP<br />
(Millions)<br />
1991 N/A 59.22 61.22% N/A N/A<br />
1992 N/A 65.11 9.95% N/A N/A<br />
1993 30.77 80.24 23.24% 369,100 11,995<br />
1994 32.04 91.00 13.41% 440,500 13,748<br />
1995 29.71 100.00 9.89% 516,800 17,395<br />
1996 30.65 105.81 5.81% 575,700 18,783<br />
1997 33.62 112.27 6.11% 653,900 19,450<br />
1998 35.23 119.79 6.70% 717,400 20,363<br />
1999 41.40 132.46 10.57 779,300 18,824<br />
Source: IMF<br />
The recession in Slovakia that immediately followed 1989 was fairly severe (a net decline<br />
of 25% in measured GDP), but the recovery that started in 1994 has proceeded strongly<br />
thereafter. Real growth peaked at 7.4 % in 1995 and remained strong until recently.<br />
Direct <strong>for</strong>eign investment has been relatively low, apparently because of political<br />
uncertainties, but a strong export market has sustained economic growth<br />
Inflation was also relatively moderate, with a surge up to 60 % in 1991 followed by a<br />
decline to less than 10% since 1995. Despite a significant devaluation in the second half<br />
of 1998, inflation has remained low, running about 6-7 %. Growth has remained positive<br />
recently, although more muted. Unemployment has fluctuated in the 11-13% range in<br />
recent years.<br />
<strong>Housing</strong> <strong>Market</strong><br />
The Slovak Republic (Slovakia) was part of Czechoslovakia during the Socialist period<br />
and shared with the Czech Republic, as well as with Poland, an emphasis first on stateowned<br />
rental flats and then on co-operative owned and managed flats. However,<br />
throughout the socialist period, there remained the possibility of obtaining an owneroccupied<br />
family house, if one could procure the land and building materials needed to<br />
complete it. In fact, in the 1980s, about half of all new units were such family houses.<br />
Slovakia is nearly as large as the Czech Republic, but has only half of the population at<br />
5.5 million. The population is significantly rural, with 43% living in villages and only<br />
25% in towns of over 50,000. As of 1990, the overall housing stock of 1.8 million units<br />
was distributed in the following manner:<br />
<strong>Housing</strong> Unit Status in 1990<br />
1 5 1
Owner-occupied:<br />
Family Houses: 50 %<br />
Co-operatives: 23 %<br />
Public Rental: 27 %<br />
Other Rental<br />
(mostly employer): none<br />
Private Rental: none<br />
Source: (Diamond 1999):<br />
New production plunged sharply after 1990. Starts data were not compiled from 1992-<br />
1994, but even by 1991, starts had dropped 84 % from 1990 (to about 6,000 units), a bit<br />
sharper fall-off than in the Czech Republic. Data was compiled again after 1994 and<br />
shows the same low level until 1996.<br />
STARTS AND COMPLETIONS OF HOUSING UNITS: 1989-1997<br />
YEAR<br />
# Of Units<br />
Started<br />
(000)<br />
# Of Units<br />
Completed<br />
(000)<br />
1989 35.7 33.4<br />
1990 32.9 24.7<br />
1991 5.9 20.8<br />
1992 NA 16.4<br />
1993 NA 14.0<br />
1994 NA 6.7<br />
1995 4.0 6.2<br />
1996 6.4 6.3<br />
1997 12.8 7.2<br />
1998 16.9 8.3<br />
Source: Diamond 1999<br />
Faced with continuing low levels of housing activity, in 1995 government policy moved<br />
towards more immediate stimulation of housing construction. A large amount of funding<br />
Sk. 2.0 billion (about USD 62 million) was secured from the National Privatization Fund<br />
and placed into finishing uncompleted municipal flats. Then in 1996 a State <strong>Housing</strong><br />
Fund was set up to make low rate loans directly to households. It started at a relatively<br />
modest level of Sk. 800 million <strong>for</strong> about 1000 units in 1996, but ballooned to about Sk.<br />
3.5 billion in 1998, with plans to go to Sk. 6 billion in 1999.<br />
The general economic recovery that started in 1994 had not stimulated housing starts<br />
significantly. <strong>Housing</strong> financed by the State <strong>Housing</strong> Fund appears to account <strong>for</strong> most of<br />
the sharp recovery of housing starts (12,700 as of 1997), with approvals under that<br />
program alone providing <strong>for</strong> 7,000 units in 1997 and 1998.<br />
In addition to this recovery in the new construction sector, significant progress has been<br />
made since 1994 on "marketizing" the previous stock of municipal housing. The prices<br />
of the units have been set very low and as of 1998 it appears that about 40% of the units<br />
have been privatized, up from 2 % as of 1994.<br />
<strong>Mortgage</strong> <strong>Market</strong><br />
Slovenska Sporitelna (SLSP) (Slovakian Savings Bank) has dominated the Slovak retail<br />
banking market. SLSP made housing loans on the old terms of 2.7 % <strong>for</strong> 30 years<br />
Countrywide <strong>International</strong> Consulting Services<br />
1 5 2
through 1992, when 13,400 loans were made <strong>for</strong> Sk. 1.4 billion. For two years, it only<br />
offered shorter-term loans at commercial rates. It began offering long-term housing loans<br />
again in 1995, at a very preferential rate (11.5%) compared to commercial loans. After a<br />
slow start in 1995, almost 10,000 loans were made in 1996, <strong>for</strong> an average amount of<br />
USD 3,400, about the same as in 1992. The rate went up to 12.5% in 1997 and demand<br />
declined to only 1,200, but the average size jumped to USD 10,000. This pace was<br />
maintained in early 1998, but decreased after the mortgage rate was increased to 15.5% as<br />
of June 1998, in line with a general increase in interest rates.<br />
Interest Rates<br />
Year Lending Rate Deposit Rate<br />
1993 14.41% 8.02%<br />
1994 14.56% 9.32%<br />
1995 16.85% 9.01%<br />
1996 13.92% 9.30%<br />
1997 18.65% 13.44%<br />
1998 21.17% 16.25%<br />
1999 21.07% 14.37%<br />
Source: IMF<br />
In 1999, mortgage rates declined somewhat, to 13.50 %. However, this is significantly<br />
less than the return on government debt, which is running around 16 %. As noted below,<br />
this is presumably because of non-market pricing associated with government control of<br />
SLSP.<br />
Slovakia was the first Central European country to start a system of Building Societies<br />
(Bausparkassen). The needed legislation was passed in May 1992 and the Prva Stavebna<br />
Sporitelna (PSS) or “First Construction Saving Bank” started business in November<br />
1992. It was a partnership between SLSP; the largest German Bauspar, Schwabisch<br />
Halle; and a large Austrian Bauspar, Raiffeisen. Soon thereafter, the other major postsocialist<br />
bank, Vseobecna Uverova Banka (VUB) (General Credit Bank), joined with the<br />
Wüstenrot group to open up VUB-Wüstenrot in June 1993. However, PSS has captured<br />
about 85 % of the market.<br />
The Bausparkassen system grew quickly in Slovakia. This was partly because, in its<br />
original <strong>for</strong>mat, it offered the opportunity to cash out of an account after one year and still<br />
keep the premium. This created strong incentives to do that each year, rather than save <strong>for</strong><br />
several years. But even without these extraordinary returns being available, the tax-free<br />
40% premium promised a higher after-tax return on Bauspar savings than on<br />
unsubsidized market opportunities.<br />
Table 2 gives the cumulative results of the system.<br />
TABLE 2: ACTIVITIES OF BUILDING SOCIETIES IN SLOVAKIA<br />
1993 1994 1995 1996 1997 1998 1999<br />
Countrywide <strong>International</strong> Consulting Services<br />
1 5 3
(est.)<br />
New Contracts (000) 174 217 272 338 157 182 168<br />
Contracts Outstanding (000) 228 432 644 923 907 920 900<br />
Net Savings (Bil. Sk.) ? ? 12.9 21.1 32.6 40.0<br />
Net Loans (Bil. Sk.) 7 0. 0 0.0 0.0 0.3 2.2 6.0<br />
State Premiums (Bil. Sk.) 0.0 0.5 1.5 2.9 3.0 3.2<br />
Premiums/State Budget (%) 0.0 0.3 0.9 1.5 1.4 1.3<br />
Source: Diamond<br />
Slovakia has introduced mortgage banking modeled after the Czech Republic approach of<br />
allowing universal banks to obtain licenses <strong>for</strong> mortgage banking activity and fund loans<br />
out of deposits, as long as they keep separate legal and accounting records on the activity<br />
and are "primarily" funding loans from mortgage bonds. The arrival of mortgage banking<br />
has had little impact so far. Only three banks have obtained a mortgage-banking license;<br />
Vseobecna Uverova Banka (VUB) started operations in late 1997 and it has not issued<br />
any bonds. The significant difference between the two countries in their development of<br />
mortgage banks is that Slovakia has not initially endowed mortgage banking with as<br />
many subsidies as provided in the Czech Republic. The mortgage bonds are tax-exempt<br />
and this is worth about a 1.5-2.5 % advantage over the return on government bonds,<br />
which are subject to a 15 % withholding tax.<br />
Currently, the great majority of mortgages continue to be made by SLSP based on a<br />
standard adjustable rate design, usually <strong>for</strong> 15 years. The rate as of June 1999 was only<br />
13.25 %, down from 15.5 % in 1998 but up from 12.5 % applicable since 1996. SLSP has<br />
also started offering fixed rate loans at 13.5 % <strong>for</strong> 5 years, since the mortgage banking<br />
law requires that the term on the loan rate match the term on the bond.<br />
In Slovakia, the mortgage banking law allows LTV ratios only up to 60 %, not the 70 %<br />
as in the Czech Republic. However, VUB does offer additional loans beyond the<br />
"mortgageable" amount. The payment-to-net income (PTI) ratio is usually about 30-35 %.<br />
A recent feature on the Slovak housing finance market is the offering of "instant loans" by<br />
the Bauspars. Apparently, they will immediately provide a Bauspar loan at 6-7 %, or<br />
almost the conventional 6 % rate, if the saver deposits the full amount of the savings<br />
portion of a contract with the Bauspar. In effect, the Bauspar lends the borrower funds at<br />
7 % but half the funds come from the savers’ own funds, so the effective cost <strong>for</strong> the<br />
additional funds is 14 %, similar to the rate at a regular bank. However, as the loan is<br />
repaid, the principal payments are counted as "savings" under the Bauspar law and thus<br />
earn the 30 % premium. The net effect is that the cost of funds under this scheme <strong>for</strong> an<br />
immediate loan is lower than <strong>for</strong> loans from the regular bank.<br />
Sources and References<br />
1. Diamond, D. “The Transition In <strong>Housing</strong> <strong>Finance</strong> In Central Europe And Russia”,<br />
Urban Institute, October 1999.<br />
7 This includes only loans to regular clients. In 1997, there were also about Sk. 200 million in<br />
loans to companies <strong>for</strong> construction.<br />
Countrywide <strong>International</strong> Consulting Services<br />
1 5 4
2. IMF: <strong>International</strong> Financial Statistics, 2000<br />
Contacts<br />
1. Institute <strong>for</strong> Urban Economics<br />
Yelena Yelagina<br />
External Relations Officer<br />
12 th Floor<br />
36 Lyusinovskaya Str<br />
Moscow, Russia 119870<br />
Tel: 7.095.236.14.67<br />
Fax: 7.095.236.5286<br />
Email: Furbin1@cityline.ru<br />
Countrywide <strong>International</strong> Consulting Services<br />
1 5 5
WESTERN EUROPE<br />
Countrywide <strong>International</strong> Consulting Services<br />
1 5 6
Regional Summary<br />
Western Europe<br />
As the European <strong>Union</strong> moves <strong>for</strong>ward with its common currency, it is faced with the<br />
challenge of managing highly diverse rates of growth with a common monetary policy.<br />
The economies of the so-called peripheral countries (e.g., Ireland, Spain, Portugal) are<br />
booming, whereas the economies of the so-called core countries (e.g., France, Germany<br />
and Italy) are exhibiting slow growth with high rates of structural unemployment. The<br />
monetary policy of the European Central Bank has kept rates low to encourage growth in<br />
the core countries, but this has contributed to a substantial weakening of the Euro relative<br />
to the Dollar and Yen. It also risks exacerbating inflationary pressures in the peripheral<br />
countries.<br />
European housing markets are quite varied. Five countries have an owner-occupied rate<br />
of 75% or greater (Greece, Ireland, Italy, Norway, and Spain). However, Austria,<br />
Germany and Switzerland have homeownership rates of 50% or less. House prices also<br />
vary greatly, averaging more than $US 200,361 (<strong>for</strong> a 150 m2 house or 100 m2 flat) in<br />
Germany and the UK and less than less than $US 125,225 in Spain and Portugal.<br />
90%<br />
80%<br />
70%<br />
60%<br />
50%<br />
40%<br />
30%<br />
20%<br />
10%<br />
0%<br />
Austria<br />
50%<br />
Belgium<br />
65%<br />
Denmark<br />
51%<br />
Finland<br />
67%<br />
France<br />
54%<br />
Germany<br />
41%<br />
WESTERN EUROPE<br />
Rate of Homeownership<br />
Greece<br />
78% 80% 78%<br />
Ireland<br />
Countrywide <strong>International</strong> Consulting Services<br />
72%<br />
Italy<br />
Luxembourg<br />
Netherlands<br />
52%<br />
Norway<br />
76%<br />
Portugal<br />
66%<br />
Spain<br />
78%<br />
Sweden<br />
60%<br />
Switzerland<br />
31%<br />
67%<br />
United Kingdom<br />
1 5 7
The use of mortgage debt is also quite variable. Germany and the United Kingdom have<br />
the largest mortgage markets in terms of mortgage debt outstanding (1,120,803 million<br />
$US and 795,487 million $US, respectively).<br />
$1,250,000<br />
$1,000,000<br />
$750,000<br />
$500,000<br />
$250,000<br />
$-<br />
$9,480<br />
Austria<br />
Belgium<br />
$112,007<br />
$55,628<br />
WESTERN EUROPE<br />
<strong>Mortgage</strong> Debt Outstanding (Millions $US)<br />
$269,618<br />
$33,826<br />
Denmark<br />
Finland<br />
France<br />
Germany<br />
$1,120,803<br />
The size of the mortgage markets relative to the country economies is also quite variable.<br />
Outstanding <strong>Mortgage</strong> Debt–to-Gross Domestic Product ratios exceed 70% in 3 countries<br />
and 50% in 6 countries. However, <strong>Mortgage</strong> Debt–to-GDP is less than 10% in 3<br />
countries, and it is 30% or less in 9 countries. A number of factors create these<br />
differences including diverse economies (less debt in more volatile economies), diverse<br />
cultures (some favoring savings over debt), diverse housing markets and legal and tax<br />
system differences.<br />
Countrywide <strong>International</strong> Consulting Services<br />
$795,487<br />
$253,519 $154,811<br />
$96,969<br />
$65,540<br />
$195,228<br />
$20,926<br />
$8,856 $3,622<br />
$113,618<br />
$31,999<br />
Greece<br />
Ireland<br />
Italy<br />
Luxembourg<br />
Netherlands<br />
Norway<br />
Portugal<br />
Spain<br />
Sweden<br />
Switzerland<br />
United Kingdom<br />
1 5 8
100%<br />
75%<br />
50%<br />
25%<br />
0%<br />
5%<br />
25%<br />
70%<br />
30%<br />
20%<br />
WESTERN EUROPE<br />
Outstanding <strong>Mortgage</strong> Debt / GDP<br />
57%<br />
8%<br />
28%<br />
9%<br />
Countrywide <strong>International</strong> Consulting Services<br />
26%<br />
74%<br />
45%<br />
33%<br />
24%<br />
52%<br />
88%<br />
Austria<br />
Belgium<br />
Denmark<br />
Finland<br />
France<br />
Germany<br />
Greece<br />
Ireland<br />
Italy<br />
Luxembourg<br />
Netherlands<br />
Norway<br />
Portugal<br />
Spain<br />
Sweden<br />
Switzerland<br />
United Kingdom<br />
The principal lenders in Western Europe are banks (commercial, cooperative, savings).<br />
These institutions have over 60% of mortgage debt outstanding. Specialized institutions,<br />
such as building societies and mortgage banks, are declining in importance on an<br />
aggregate basis but are still important lenders in particular markets.<br />
40%<br />
35%<br />
30%<br />
25%<br />
20%<br />
15%<br />
10%<br />
Figure 1<br />
5%<br />
0%<br />
Universal/<br />
commercial<br />
banks<br />
<strong>Mortgage</strong><br />
banks<br />
Savings<br />
banks<br />
Cooperative<br />
& mut ual<br />
credit banks<br />
Source: European <strong>Mortgage</strong> Federation<br />
Building<br />
Societies<br />
<strong>Mortgage</strong> funding comes primarily from retail deposits in Western Europe, reflecting the<br />
dominance of banks as mortgage lenders. <strong>Mortgage</strong> Bonds are the second most important<br />
funding source accounting <strong>for</strong> 19% of mortgage funding. Securitization has existed in<br />
some countries like the United Kingdom <strong>for</strong> over a decade, whereas it is a new concept in<br />
the majority of the countries. As such, it accounts <strong>for</strong> only 1% of funding. In Austria,<br />
Bausparkassen<br />
Ot her<br />
specialised<br />
lenders<br />
Umbrella<br />
companies<br />
Insurance<br />
corporat. &<br />
pension<br />
f unds<br />
Ot her<br />
sectors<br />
57%<br />
1 5 9
France and Germany dedicated savings through contract savings plans provides a<br />
significant source of funding <strong>for</strong> housing.<br />
<strong>Mortgage</strong><br />
bonds<br />
19%<br />
MBS<br />
1%<br />
Other<br />
13%<br />
Dedicated<br />
savings<br />
5%<br />
Source: European <strong>Mortgage</strong> Federation<br />
Au s t r i a<br />
Economic Background<br />
Year Exchange<br />
Rate<br />
Schilling/US$<br />
Consumer<br />
Price<br />
Index<br />
Countrywide <strong>International</strong> Consulting Services<br />
Retail deposits<br />
62%<br />
Change In<br />
Consumer<br />
Prices<br />
Austrian<br />
Schilling<br />
Nominal GDP<br />
(Millions)<br />
US$<br />
Nominal GDP<br />
(Millions)<br />
1990 10.6770 85.27 1,813,480 169,849<br />
1991 10.6890 88.11 3.30% 1,945,820 182,039<br />
1992 11.3540 91.67 4.00% 2,057,270 181,193<br />
1993 12.1430 94.99 3.60% 2,125,340 175,026<br />
1994 10.9690 97.80 3.00% 2,237,940 204,024<br />
1995 10.0880 100.00 2.20% 2,328,740 230,843<br />
1996 10.9540 101.84 1.84% 2,414,640 220,435<br />
1997 12.6330 103.19 1.30% 2,514,370 199,032<br />
1998 11.7470 104.13 1.00% 2,622,630 223,260<br />
1999 13.7000 104.71 0.56% 2,677,705 195,453<br />
Source: IMF, Morgan Stanley, Economist<br />
Real GDP growth in Austria was <strong>for</strong>ecasted to rebound in 2000 as export markets<br />
continue to revive. GDP growth fell from 3.3% in 1998 to 2.1% in 1999, but it was<br />
<strong>for</strong>ecasted to rise to 3.3% again in 2000 (Morgan Stanley). Domestic demand is expected<br />
to accelerate due to an increase in family allowances and a reduction in income taxes,<br />
1 6 0
which took effect at the beginning of 2000. Austrian inflation remains below the Euroarea<br />
average, but it has been rising due to increasing energy prices.<br />
<strong>Housing</strong> <strong>Market</strong><br />
Year <strong>Housing</strong> Starts <strong>Housing</strong><br />
Completions<br />
Countrywide <strong>International</strong> Consulting Services<br />
House Price Index<br />
Permits Issued New* Existing**<br />
1992 42,000 40,900 51,900 85<br />
1993 52,000 43,400 58,300 91<br />
1994 59,000 48,800 61,000 119 95<br />
1995 56,000 53,400 66,700 123 98<br />
1996 55,000 53,000 65,000 125 100<br />
1997 54,000 53,000 60,000 128 102<br />
1998 48,000 57,800 49,700 131 103<br />
1999 46,000 54,220 47,000 134 103<br />
Source: EMF<br />
Austria has 3,413,000 dwelling units, with 50% owner-occupied. The population of the<br />
country is 8.07 million (1997). The property market in Austria has been rather stagnant<br />
over the past 3 years with new construction and permits below their 1994-1995 peaks. As<br />
a result, house prices have been flat or falling. The activity in the construction sector has<br />
shifted towards refurbishment and renovation. The average, building costs in Austria<br />
range from 100.000 Euro (houses <strong>for</strong> more than 2 families) up to 160.000 Euro (1-2<br />
family houses). on On average 49% (1-2 family houses) to 58% are financed on credit.<br />
<strong>Mortgage</strong> <strong>Market</strong><br />
The Austrian mortgage market is relatively small, with mortgage debt-to-GDP of only<br />
5%. As shown in the table below, statistics on the Austrian mortgage market include both<br />
residential and commercial mortgage loans, and they reflect only members of the<br />
European <strong>Mortgage</strong> Federation. The mortgage market has been stagnant, reflecting the<br />
slow economy and housing market. <strong>Mortgage</strong> loans are granted by 7 types of institutions,<br />
including joint stock banks, savings banks, mortgage banks (Landes-Hypothekenbanken),<br />
co-operative and agricultural co-operative banks, Bausparkassen and specialized banks.<br />
Residential and Commercial <strong>Mortgage</strong> <strong>Market</strong>* AS millions<br />
Year Outstanding<br />
<strong>Mortgage</strong><br />
Debt/GDP<br />
<strong>Mortgage</strong> Debt<br />
Outstanding<br />
New<br />
Originations<br />
Net<br />
New<br />
Originations<br />
Gross<br />
1992 5.5%<br />
1993 5.3%<br />
1994 5.3% 117,193 3,960 N/A<br />
1995 5.2% 122,734 5,537 16,504<br />
1996 5.1% 125,756 3,026 16,881<br />
1997 5.1% 130,046 4,296 16,377<br />
1998 5.0% 131,149 1,101 11,338<br />
1999 5.0% 130,214 936 12,797<br />
*EMF Members Only ; Source EMF<br />
1 6 1
The 5 building societies in Austria financed 2.2 Billion Euro in 1998 resulting in a 20%<br />
market share. The S Bausparkasse is the market leader in the building societies system<br />
with a market share of one third of all Austrian building societies. They are followed by<br />
Raiffeisen and Wüstenrot building societies.<br />
The types of products are dependent on the type of lender and funding instrument. Fixedinterest<br />
and variable-interest loans, with terms of up to 20 years, with and a period of<br />
fixed interest not exceeding 10 years, are the typical products offered by banks. Savings<br />
banks offer similar loans along with reviewable, interest rate loans. The mortgage banks<br />
originate 20 year20-year term loans, generally with a fixed interest period of 5-10 years.<br />
First mortgages with a maximum LTV of 60% of the conservatively estimated value of<br />
the real estate are eligible as cover <strong>for</strong> mortgage bonds.<br />
Interest Rates <strong>Mortgage</strong><br />
Countrywide <strong>International</strong> Consulting Services<br />
rates<br />
Year Money <strong>Market</strong> i.e. Deposit Fixed (# yrs.) Variable Long-Term Govt.<br />
Interbank<br />
Bond Yield<br />
1990 8.53% 3.41% N/A. 10.1% 8.74<br />
1991 9.10% 3.75% N/A. 10.3% 8.62<br />
1992 9.35% 3.69% N/A. 10.7% 8.27<br />
1993 7.22% 2.98% N/A. 8.4% 6.64<br />
1994 5.03% 2.31% 9.00% 8.5% 6.69<br />
1995 4.36% 2.19% 7.60% 7.0% 6.47<br />
1996 3.19% 1.71% 7.80% 6.5% 5.3<br />
1997 3.27% 1.50% 6.50% 5.5% 4.79<br />
1998 3.36% 1.50% 6.00% 5.0% 4.29<br />
1999 5.50% N/A. 4.09<br />
Source: EMF, IMF<br />
The Bausparkassen offer a savings contract of 6-7 years on average, after which the saver<br />
has a right to a loan. The government provides a savings bonus upon completion of the<br />
contract. The loans are available at a below market, fixed interest rate (fixed spread over<br />
savings rate) <strong>for</strong> maturities between 7 and 30 years. The Bausparkassen also grant, to a<br />
limited extent, temporary advances or bridging loans to their savers. At the end of 1999,<br />
rates on fixed rate loans were approximately 4.5%. The mortgage loans of building<br />
societies are in general limited to 138.000 Euro per person. 65.5% of the Austrian citizens<br />
have a savings account at one of the 5 building societies, totaling 5.285 million saving<br />
accounts.<br />
A substantial demand <strong>for</strong> “moderate-cost” housing resulted in legislation to create<br />
creating a new type of specialized bank, the so-called housing construction banks. These<br />
banks issue “housing construction loans”. the The interest rate on which is exempted to<br />
up to 4% from taxation. The funds contributed must be invested in subsidized housing<br />
construction. All Austrian credit institution sectors have a specialized bank of this kind.<br />
1 6 2
Most funding <strong>for</strong> mortgages comes from retail and contract savings deposits. The<br />
mortgage bond market in Austria has been shrinking, particularly due to repayments of<br />
bonds of public sector institutions.<br />
<strong>Mortgage</strong> Bonds (millions AS)<br />
Year Issued Outstanding<br />
1994 8,498 69,403<br />
1995 9,002 71,577<br />
1996 4,970 65,993<br />
1997 9,468 67,942<br />
1998 7,472 67,467<br />
1999 10,128 68,237<br />
Source: EMF<br />
Sources and References<br />
1. Austrian Association of Bausparkassen<br />
2. European <strong>Mortgage</strong> Federation, <strong>Mortgage</strong> and Property <strong>Market</strong>s in 1999, Brussels<br />
2000 www.hypo.org<br />
3. European <strong>Mortgage</strong> Federation, Hypostat 1988-1998, Brussels 1999<br />
4. IMF: <strong>International</strong> Financial Statistics, 2000 www.imf.org<br />
5. Morgan Stanley Dean Witter, Inside the Global Economy, May 2000.<br />
www.msdw.com<br />
Contacts<br />
1. Dr. Charlotte Harrer<br />
Die s Bausparkasse/Öffentlichkeitsarbeit<br />
Tel. 43.1. 71108 - 9326<br />
E-Mail: s.bausparkasse@telecom.at<br />
http://www.sbausparkasse.at/<br />
2. Association of Austraian Sparkassen<br />
Grimmelshauseng 1; A-1030 Wien<br />
Countrywide <strong>International</strong> Consulting Services<br />
1 6 3
Belgium<br />
Economic Background<br />
Year Belgian<br />
Franc/US$<br />
Consumer Price<br />
Index<br />
Countrywide <strong>International</strong> Consulting Services<br />
Change In<br />
Consumer Prices<br />
Belgian Franc US$<br />
Nominal GDP<br />
(Millions)<br />
Nominal GDP<br />
(Millions)<br />
1990 30.98 88.62 3.50% 6,593,000 212,815<br />
1991 31.27 91.46 3.20% 6,909,000 220,947<br />
1992 33.18 93.69 2.40% 7,273,000 219,198<br />
1993 36.11 96.27 2.80% 7,431,000 205,788<br />
1994 31.84 98.55 2.40% 7,793,000 244,755<br />
1995 29.42 100.00 1.45% 8,129,000 276,309<br />
1996 32.01 102.06 2.06% 8,304,000 259,419<br />
1997 36.92 103.72 1.10% 8,712,000 235,970<br />
1998 34.57 104.71 1.01% 9,089,000 262,916<br />
1999 40.10 105.88 1.10% -<br />
Source: EMF, IMF, Morgan Stanley, Economist<br />
Belgium’s economy has experienced modest growth over the past 2 years. GDP growth<br />
accelerated in the last half of 1999 as consumer confidence improved. Unemployment<br />
remained high, but it fell from 9.5% in 1998 to 9% in 1999. On the back of higher oil<br />
prices and rising economic activity, inflation accelerated at the end of 1999 and was<br />
<strong>for</strong>ecasted to rise to 1.7% in 2000. Over the past few years, Belgium has introduced a<br />
comprehensive plan to tackle its high unemployment rate. The measures are aimed at<br />
improving the skill level of the work<strong>for</strong>ce, raising supply and demand of labor and<br />
increasing labor market flexibility. An important step in this direction is a significant<br />
reduction in social security contributions, which will take place in the second quarter of<br />
2000.<br />
<strong>Housing</strong> <strong>Market</strong><br />
Year <strong>Housing</strong> Starts Permits Issued Transactions<br />
Involving<br />
Dwellings*<br />
House Price Index<br />
New Existing<br />
1992 46,644 50,076 104,875 108 115<br />
1993 43,705 55,008 104,118 110 123<br />
1994 51,821 55,720 104,101 111 132<br />
1995 55,795 40,708 96,262 113 138<br />
1996 40,708 39,600 102,444 113 144<br />
1997 39,600 46,269 105,000 113 148<br />
1998 32,634 39,167 109,250 116 150<br />
Source: EMF; * Estimate. Transactions on new buildings and own construction not included<br />
Belgium has 3,748,000 dwelling units with a 65% homeownership rate. The population is<br />
10.2 million. The housing market has been sluggish during the mid-1990s with housing<br />
starts and permits down over 30% from the 1995 high. Property transactions averaged<br />
1 6 4
around 105,000 per year and peaked during the annual “Batibouw” property construction<br />
<strong>for</strong>um. House prices <strong>for</strong> existing units rose 30% between 1992 and 1998, but the prices<br />
<strong>for</strong> new buildings rose by only 7%. The typical price <strong>for</strong> a 150m2 and 100m2 flat at the<br />
end of 1999 was 137,000 Euro.<br />
<strong>Mortgage</strong> <strong>Market</strong><br />
Belgium had a relatively low mortgage debt-to-GDP of 24% in 1998. Lending volume<br />
picked up due to a loan-refinancing wave in 1999 brought about by low interest rates.<br />
Residential <strong>Mortgage</strong> <strong>Market</strong> (Belgian Franc millions)<br />
Year Outstanding mortgage<br />
debt/GDP<br />
<strong>Mortgage</strong> Debt<br />
Outstanding<br />
Countrywide <strong>International</strong> Consulting Services<br />
New Originations<br />
Net<br />
New Originations<br />
Gross<br />
1991 20.6% 1,407,994 89,019 139,001<br />
1992 20.6% 1,435,951 N/A 210,129<br />
1993 21.0% 1,551,573 116,459 259,994<br />
1994 21.5% 1,648,218 96,668 340,004<br />
1995 21.1% 1,710,987 62,782 229,283<br />
1996 21.5% 1,824,997 113,982 401,764<br />
1997* 22.2% 2,022,903 232,032 543,759<br />
1998 24.6% 2,239,994 278,628 497,835<br />
Source: EMF *Change in series<br />
In recent years, refinancing has become more pronounced as shown in the Figure below.<br />
The peaks in activity correspond with the Batibouw <strong>for</strong>um. Refinancing may be attributed<br />
to new lenders (external) or a renegotiation of loan terms with the current lender<br />
(internal). Rising interest rates in early 2000 have sharply slowed refinancing activity.<br />
1.200<br />
1.000<br />
800<br />
600<br />
400<br />
200<br />
0<br />
1996-01<br />
03<br />
05<br />
Source: de Valck<br />
07<br />
Purchases<br />
Buiding house<br />
Rebuilding / trans<strong>for</strong>mation<br />
Purchase + rebuilding<br />
Other aims<br />
Refinancing<br />
09<br />
11<br />
1997-01<br />
03<br />
05<br />
07<br />
09<br />
11<br />
1998-01<br />
03<br />
05<br />
07<br />
09<br />
11<br />
1999-01<br />
03<br />
05<br />
07<br />
09<br />
11<br />
2000-01<br />
03<br />
05<br />
1 6 5
Approximately 91% of mortgage credit in 1998 was provided by commercial banks with<br />
mortgage banks providing 3% and insurance companies and pension funds providing the<br />
remainder. The big 6 banks, BACOB, BBL, CCB, CGER, Generale de Banque and KBC,<br />
accounted <strong>for</strong> 70% of the volume of mortgage credit granted in 1994-97.<br />
The fall in rates has also stimulated demand <strong>for</strong> long term, fixed rate mortgages (with rate<br />
fixed to maturity). The typical maturity of mortgage loans is 20 years, and both fixed and<br />
referenced (variable) rate mortgages are allowed. Variability cannot be less than one<br />
year, and typically, mortgage rates are revised every 1,3 or 5 years. There is a maximum<br />
1% per year variation during the first 3 years of the loan. Belgium has experienced growth<br />
of mortgage loans with a rate fixed up to maturity. They accounted <strong>for</strong> less than 20% of<br />
new production at the beginning of 1997 and <strong>for</strong> more than 80% in April 1999. Loans are<br />
prepayable but subject to a maximum prepayment penalty of 3 months interest.<br />
Interest Rates <strong>Mortgage</strong> rates<br />
Year Money <strong>Market</strong> i.e.<br />
Interbank<br />
Countrywide <strong>International</strong> Consulting Services<br />
Deposit Fixed (#yrs.) Variable<br />
Gov't Bond<br />
Yields<br />
Long-Term<br />
1990 8.53% 3.41% N/A 11.6% 10.1%<br />
1991 9.10% 3.75% N/A 11.6% 9.3%<br />
1992 9.35% 3.69% N/A 10.0% 8.6%<br />
1993 7.22% 2.98% N/A 8.8% 7.2%<br />
1994 5.03% 2.31% 10.40% 10.0% 7.8%<br />
1995 4.36% 2.19% 8.20% 7.9% 7.5%<br />
1996 3.19% 1.71% 7.30% 6.5% 6.5%<br />
1997 3.27% 1.50% 7.60% 6.9% 5.7%<br />
1998 3.36% 1.50% 7.60% N/A 4.7%<br />
1999* N/A N/A 6.90% N/A 4.8%<br />
*2nd quarter mortgage yield; Source: EMF, IMF<br />
Almost all funding is from deposits. BACOB Bank initially introduced housing loan<br />
securitization on the Belgian market in 1997. Two additional banks have subsequently<br />
made use of securitization, KBC and Générale de Banque. Outstanding balances of MBS<br />
were Euro 1,909 at the end of 1998. <strong>Mortgage</strong> bond legislation is under discussion. In<br />
February 1999, 11 Flemish, social housing institutions pooled their residential mortgage<br />
loans to securitize them through SKV-1 (EURO 324 million). This was the second<br />
transaction of its type following Belsca-1 that pooled residential mortgage loans of 13<br />
Walloon social housing institutions.<br />
Policy Development<br />
A new regulation on the joint settlement of debts has been adopted, allowing <strong>for</strong> either<br />
amicable settlement or compulsory liquidation. The law allows sale by private contract of<br />
the attached real estate as opposed to the public sale procedure.<br />
Reviewable rate mortgages have been replaced by a system based on indices (variation<br />
calculated according to the difference between the index at the time when the contract is<br />
1 6 6
concluded and the index at the time of the variation). The choice of index is not free. It<br />
must be linked to the regularity of the variability.<br />
Sources and References<br />
1. European <strong>Mortgage</strong> Federation, <strong>Mortgage</strong> and Property <strong>Market</strong>s in 1999, Brussels<br />
2000 www.hypo.org<br />
2. European <strong>Mortgage</strong> Federation, Hypostat 1988-1998, Brussels 1999<br />
3. IMF: <strong>International</strong> Financial Statistics, 2000 www.imf.org<br />
4. Morgan Stanley Dean Witter, Inside the Global Economy, May 2000.<br />
www.msdw.com<br />
5. de Valck, JL, The <strong>Mortgage</strong> <strong>Market</strong> in Belgium, presentation at the Pan-European<br />
<strong>Mortgage</strong> <strong>Market</strong> 2000 Conference, Barcelona, September 2000.<br />
6. Moodys, The Belgium Structured <strong>Finance</strong> <strong>Market</strong> 1999 Review and 2000 Outlook,<br />
January 2000<br />
7. Credit Suisse First Boston, “Euro-11 Special: <strong>Housing</strong> Matters”, Economics Research<br />
April 2000 www.csfb.com<br />
Contacts<br />
1. <strong>Union</strong> Professionnelle du Crédit - UPC<br />
Avenue de la Joyeuse Entrée 12/4<br />
1040 Bruxelles - Belgique<br />
Tel.: +32 (0)2 231 07 93<br />
Fax: +32 (0)2 230 45 47<br />
Email: secr@upc-bvk.be<br />
http:\\www.upc-bvk.be<br />
Countrywide <strong>International</strong> Consulting Services<br />
1 6 7
Denmark<br />
Economic Background<br />
Year Exchange Rate<br />
Kroner/US$<br />
Consumer Price<br />
Index<br />
Countrywide <strong>International</strong> Consulting Services<br />
Change In<br />
Consumer Prices<br />
Kroner US$<br />
Nominal GDP<br />
(Millions)<br />
Nominal GDP<br />
(Millions)<br />
1990 6.19 90.73 2.64% 825,310 133,330<br />
1991 6.40 92.91 2.40% 857,650 134,008<br />
1992 6.04 94.85 2.09% 887,870 146,998<br />
1993 6.48 96.05 1.26% 900,150 138,912<br />
1994 6.36 97.96 1.99% 965,720 151,843<br />
1995 5.60 100.00 2.08% 1,013,640 181,007<br />
1996 5.80 102.13 2.12% 1,066,810 183,933<br />
1997 6.60 104.36 2.18% 1,117,820 169,367<br />
1998 6.70 106.28 1.84% 1,166,640 174,125<br />
1999 7.40 2.50% 1,184,140 160,019<br />
Source: IMF, Morgan Stanley<br />
Economic growth slowed in 1999 primarily due to weakness in domestic demand. The<br />
unemployment rate fell from almost 13% in mid 1994 to just over 5% at the beginning of<br />
2000. The annual rate of inflation rose to 2.5% in 1999, and it is expected to remain<br />
somewhat higher than the Euroland average in 2000. Denmark held a referendum on<br />
joining the Euro currency in September 2000. The population rejected the proposal to<br />
join by a 53% to 47% majority. Nevertheless, the Danish economy is tightly tied to the<br />
Euro and the rejection is not anticipated to have major, economic effects.<br />
<strong>Housing</strong> <strong>Market</strong><br />
There were 2,476,000 dwelling units in Denmark. 51% were owner-occupied (1998).<br />
The population was 5.3 million. After a stagnant period in the early 1990s, housing<br />
construction and transactions rebounded.<br />
Year <strong>Housing</strong> Starts <strong>Housing</strong><br />
Completions<br />
Permits Issued Transactions<br />
Involving<br />
Dwellings<br />
Construction<br />
Cost Index<br />
Existing House<br />
Price Index<br />
1992 14,811 16,355 15,269 60,052 107 95<br />
1993 12,276 14,131 13,025 63,232 108 101<br />
1994 13,357 13,787 14,259 71,350 111 108<br />
1995 13,538 13,503 12,900 74,050 115 108<br />
1996 16,134 13,735 16,791 76,900 118 118<br />
1997 17,217 16,855 17,481 78,068 122 128<br />
1998 17,459 17,163 18,334 76,565 130 134<br />
1999 15,710 15,537 16,761 81,302 134 142<br />
Source: EMF<br />
1 6 8
In 1999, prices of single-family and terraced houses rose by about 9% compared to<br />
around 8% in 1998. For owner-occupied flats, prices rose by 5%. The typical price <strong>for</strong> a<br />
150m2 and 100m2 flat at the end of 1999 was 130,000 Euro. Realkreditrådet’s<br />
(Association of Danish <strong>Mortgage</strong> Banks) statistics indicate a drop in the number of<br />
transactions of single-family and terraced houses of just below 6% and 3% in 1999.<br />
There has also been a moderate fall in the number of housing starts and completions, but<br />
the number remains at a fairly high level. Denmark is known <strong>for</strong> having a highly efficient<br />
title registration system, which provides protection of lender mortgage rights that <strong>for</strong>m<br />
the security <strong>for</strong> mortgage bonds.<br />
<strong>Mortgage</strong> <strong>Market</strong><br />
Denmark has one of the most developed mortgage markets in Europe. The ratio of<br />
mortgage debt to GDP at 70% is one of the highest in Europe. Gross mortgage lending<br />
decreased slightly in 1999 compared with the historically high levels in the preceding<br />
year. Net lending also fell relative to 1998 reflecting a decreasing volume of lending <strong>for</strong><br />
owner-occupied housing. Net lending <strong>for</strong> non-residential purposes rose in 1999<br />
compared to the year be<strong>for</strong>e.<br />
Residential <strong>Mortgage</strong> <strong>Market</strong>* (DK million)<br />
Year Outstanding<br />
<strong>Mortgage</strong><br />
Debt/GDP<br />
<strong>Mortgage</strong> Debt<br />
Outstanding<br />
Countrywide <strong>International</strong> Consulting Services<br />
New Originations<br />
Net<br />
New Originations<br />
Gross<br />
Number of New<br />
<strong>Mortgage</strong> Loans<br />
1992 64.6% 525,737 56,273 111,996<br />
1993 61.3% 523,497 11,273 137,599 252,224<br />
1994 62.4% 561,301 18,870 177,103 314,586<br />
1995 60.3% 570,001 24,486 100,938 193,906<br />
1996 60.5% 606,998 35,338 139,419 250,987<br />
1997 65.1% 720,297 47,515 167,626 292,543<br />
1998 66.9% 780,349 54,845 252,298 379,876<br />
1999 70.3% 832,198 44,102 217,903 314,632<br />
Source: EMF *EMF members only<br />
The Danish mortgage market is dominated by 10 specialized mortgage banks that are<br />
regulated by the <strong>Mortgage</strong> Credit Act. The six largest are ranked by capital above. These<br />
institutions provide approximately 85% of the total credit. The remainder of credit is<br />
provided by commercial and savings banks often in the <strong>for</strong>m of unsecured “top-up” loans.<br />
There have been significant, structural changes in the Danish mortgage market in recent<br />
years. Commercial banks (e.g., Unibank and Den Danske Bank) have established<br />
mortgage banks, and mortgage banks have started or acquired commercial banks. As a<br />
result, competition has increased significantly.<br />
<strong>Mortgage</strong> Banks<br />
<strong>Mortgage</strong> Debt (end 1998)<br />
DKK million<br />
Nykredit 365.1<br />
Realkredit Danmark 316.6<br />
1 6 9
BRF Kredit 116.5<br />
Unikredit 70.1<br />
Danske Kredit 59.8<br />
Totalkredit (end 1997) 57.8<br />
Source: Nykredit<br />
Danish mortgage banks grant loans <strong>for</strong> residential, agricultural and commercial purposes.<br />
The maximum maturity <strong>for</strong> mortgage loans on residential and commercial properties is 30<br />
years. <strong>Mortgage</strong> banks can lend up to 80 percent of the value of residential property and<br />
up to 60% of the value of industrial property with a maximum LTV of:<br />
Loan Purpose<br />
Commercial 10%<br />
Agriculture 12%<br />
Rental <strong>Housing</strong> 20%<br />
Owner-occupied 56%<br />
dwellings<br />
Other 2%<br />
Source: Nykredit<br />
Almost all Danish mortgage loans are made on an annuity (level payment) basis. There<br />
are also some serial (equal principal payments) or bullet loans. The rate of interest is<br />
typically fixed <strong>for</strong> the life of the loan at a rate determined by prevailing market conditions<br />
at the time of issue of the backing mortgage bond. <strong>Mortgage</strong>s can be bond loans in which<br />
the principal corresponds to the volume of bonds the mortgage bank sells or cash loans<br />
where the principal matches the market value of the issued bonds. In the <strong>for</strong>mer, the<br />
borrower will not know the loan proceeds until the time of disbursement. In the latter, the<br />
loan proceeds are known, but the rate of interest and the actual monthly payments are not<br />
known until the bonds are sold. Any capital loss arising on the sale of the bonds is<br />
converted into tax-deductible interest <strong>for</strong> cash but not bond loans. With a bond loan,<br />
however, the borrower has an option to sell bonds at market value in order to prepay the<br />
loan (as opposed to paying off at par value with the cash loan).<br />
Fixed rate mortgage loans are fully prepayable at the option of the borrower with notice<br />
of at least 2 months be<strong>for</strong>e a repayment date (loans are typically paid quarterly). Variableinterest<br />
and index-linked loans are non-callable. The volume of variable rate loans (in<br />
which the rate adjusts every 1 to 10 years) has increased significantly. Danish mortgage<br />
banks have also started to offer mortgage loans in Euro and with interest rate caps. The<br />
spread between mortgage and government bonds primarily reflects the value of the<br />
borrower prepayment option. The mortgage banks add a 50-100 basis point spread to the<br />
mortgage bond yield to cover administrative costs and credit risk.<br />
Interest Rates <strong>Mortgage</strong> Rates<br />
Govt Bond<br />
Yields<br />
Year Money <strong>Market</strong> i.e.<br />
interbank<br />
Deposit Fixed (#yrs.) Variable Long-Term<br />
1990 10.97% 7.93% 11.20% 11.2% 10.74%<br />
1991 9.78% 7.15% 9.80% 9.8% 9.59%<br />
Countrywide <strong>International</strong> Consulting Services<br />
1 7 0
1992 11.35% 7.50% 10.10% 10.3% 9.47%<br />
1993 11.49% 6.52% 7.10% 7.2% 7.08%<br />
1994 6.30% 3.53% 9.70% 9.5% 7.41%<br />
1995 6.19% 3.85% 8.40% 8.0% 7.58%<br />
1996 3.98% 2.80% 7.50% 8.0% 6.04%<br />
1997 3.71% 2.65% 7.10% 7.2% 5.08%<br />
1998 4.27% 3.08% 6.04% N/A. 4.59%<br />
1999 3.37% 6.98% N/A. 4.30%<br />
Source: EMF, IMF<br />
The funding of the mortgage banks takes place through the issue of mortgage bonds. The<br />
rate of interest is fixed on the Copenhagen Stock Exchange on a daily basis. The<br />
mortgage bank funds a loan through issuance of a bond into an outstanding series. The<br />
Danish bond market is one of the largest in Europe, totaling nearly 100% of GDP of<br />
which mortgage bonds account <strong>for</strong> 60%. The yield spread between mortgage and<br />
government bonds narrowed from more than 200 basis points at the beginning of 1999 to<br />
140 basis points at the end of the year. The spread is primarily determined by borrower<br />
prepayment behavior.<br />
<strong>Mortgage</strong> Bonds (million DKK)<br />
Year Issued Outstanding<br />
1991 94,504 790,302<br />
1992 88,655 792,900<br />
1993 233,798 936,703<br />
1994 282,202 861,503<br />
1995 149,997 904,298<br />
1996 227,899 945,399<br />
1997 255,303 1,016,823<br />
1998 421,199 1,098,002<br />
1999 395,403 1,139,703<br />
Source: EMF<br />
The majority of mortgage bonds are held by financial institutions, insurance corporations,<br />
pension funds and the public sector. Insurance companies and pension funds hold 34%,<br />
financial institutions hold 27% and <strong>for</strong>eign investors hold 9%. As of June 1999,<br />
mortgage bonds became eligible collateral <strong>for</strong> loans from the Central Bank, thereby<br />
increasing their liquidity.<br />
In Denmark, a strong, legal environment supporting collateralized lending exists.<br />
<strong>Mortgage</strong> banks focus primarily on property valuation in their underwriting. Thanks to a<br />
favorable economic environment, the number of registered, en<strong>for</strong>ced sales was the lowest<br />
in the 1990s (2,400 in total). The number of actual <strong>for</strong>eclosures is significantly lower,<br />
with only 132 in 1998 and 107 in 1999.<br />
Policy Developments<br />
Countrywide <strong>International</strong> Consulting Services<br />
1 7 1
The 1998 “Whitsun” tax package had a discernable impact in 1999. The legislation<br />
reduced the rate at which interest payments on private debt are deductible from income<br />
<strong>for</strong> tax purposes from around 46% to 40%, increasing the after-tax costs of mortgage<br />
finance. In addition, the growth in property valuations increased the tax burden<br />
associated with the “rental value” of an owner-occupied home.<br />
A Bill has been introduced concerning increased supervision of banking groups and a<br />
loosening of the matching principle laid down in the <strong>Mortgage</strong> Credit Act. The matching<br />
principle regulates the mortgage bank’s interest rate and liquidity risk. The principle will<br />
be made more flexible so that mortgage banks may pool loans into larger issues and<br />
adjust the characteristics of the bonds to the wishes of investors. This will facilitate<br />
greater product innovation.<br />
Sources and References<br />
1. European <strong>Mortgage</strong> Federation, <strong>Mortgage</strong> and Property <strong>Market</strong>s in 1999, Brussels<br />
2000 www.hypo.org<br />
2. European <strong>Mortgage</strong> Federation, Hypostat 1988-1998, Brussels 1999<br />
3. Reakkreditrådet, Annual Report 1999: Summary<br />
4. Morgan Stanley Dean Witter, Inside the Global Economy, May 2000.<br />
www.msdw.com<br />
5. Nykredit, Danish <strong>Mortgage</strong> Bonds, 1999 www.nykredit.dk<br />
6. Urskov, E., “An Overview of the Danish <strong>Mortgage</strong> <strong>Market</strong>”, presentation at the Pan-<br />
European <strong>Mortgage</strong> <strong>Market</strong> 2000 Conference, Barcelona, September 2000.<br />
7. Credit Suisse First Boston, “Euro-11 Special: <strong>Housing</strong> Matters”, Economics Research<br />
April 2000 www.csfb.com<br />
Contacts<br />
1. Realkreditrådet<br />
Zieglers Gaard<br />
Nybrogade 12<br />
1203 København K<br />
Tel: 3312 4811<br />
http://www.realkreditraadet.dk/<br />
2. Nykredit A/SOtto Mønsteds Plads 9<br />
1780 København V.<br />
Tel. 33 77 20 00<br />
Fax. 33 77 21 20<br />
http://www.nykredit.dk/<br />
Countrywide <strong>International</strong> Consulting Services<br />
1 7 2
Finland<br />
Economic Background<br />
Year Exchange Rate<br />
Markkaa/US$<br />
Consumer Price<br />
Index<br />
Countrywide <strong>International</strong> Consulting Services<br />
Change In<br />
Consumer Prices<br />
Markkaa US$<br />
Nominal GDP<br />
(Billions)<br />
Nominal GDP<br />
(Billions)<br />
1990 3.82 89.81 6.10% 521.02 136.39<br />
1991 4.04 93.51 4.12% 498.07 123.28<br />
1992 4.48 95.94 2.60% 487.19 108.75<br />
1993 5.71 97.96 2.11% 493.06 86.35<br />
1994 5.22 99.02 1.08% 521.44 99.89<br />
1995 4.37 100.00 0.99% 561.39 128.46<br />
1996 4.59 100.62 0.62% 587.55 128.01<br />
1997 5.19 101.82 1.19% 632.88 121.94<br />
1998 5.34 103.24 1.39% 686.01 128.47<br />
1999E 104.44 1.16% 710,020<br />
Source: IMF, Bank of Finland<br />
Since recovering from a steep recession at the beginning of the 1990s, Finland has<br />
enjoyed robust economic growth. In the period between 1994-1998, GDP growth<br />
averaged 4.6% per year, which was noticeably faster than the Euro average. Growth<br />
continued in 1999, albeit at a slower pace than in the past few years. Preliminary<br />
estimates suggest that the economy grew at 3.5% in 1999, compared to 5% in 1998.<br />
Inflation was reduced to the low 1% range. Inflation increased towards the end of 1999,<br />
mainly because of higher oil prices and exceeded the Euroland average. Employment<br />
continued to grow and unemployment fell. Structural unemployment remained high,<br />
however. The seasonably adjusted unemployment rate was 6.7% at year-end. The<br />
structure of exports became more diversified and price competitiveness remained good.<br />
As traditional sectors were hit by the weakness of export demand, the growth of industrial<br />
production rested entirely on continued strong growth of the electronics and<br />
telecommunications sector.<br />
<strong>Housing</strong> <strong>Market</strong>s<br />
At the end of 1997, there were some 2,448 million dwellings in the Republic of Finland.<br />
Of this total, some 44% represent accommodation in blocks of flats, and 41% represents<br />
one-family houses. The owner-occupancy rate was 67% (1997). The rental stock was<br />
split between social rental (17%) and non-social (13% -- a portion of which receives<br />
interest subsidies). The population in 1997 was 5.117 million.<br />
Year <strong>Housing</strong> Starts <strong>Housing</strong><br />
Completions<br />
Permits Issued Transactions<br />
Involving<br />
Dwellings<br />
Construction<br />
Cost Index*<br />
All Dwellings*<br />
1992 31,606 31,606 33,416 67,994 100 90<br />
1993 27,434 30,412 29,145 75,175 101 65<br />
1994 26,820 26,731 24,417 71,088 102 69<br />
1995 18,310 25,031 19,289 68,200 103 67<br />
1996 23,564 20,837 25,708 83,300 103 70<br />
1 7 3
1997 29,804 26,854 32,750 81,400 105 82<br />
1998 31,597 29,842 33,947 108 91<br />
1999 34,980 27,760 37,928 110 106<br />
Source: EMF<br />
The fall in interest rates boosted private consumption and investment. <strong>Housing</strong> prices<br />
rose in response to lower interest rates, strong income expectations, a substantial increase<br />
in equity wealth and internal migration. The typical price <strong>for</strong> a 150m2 and 100m2 flat at<br />
the end of 1999 was 130,000 Euro. Although there was a marked increase in housing<br />
investment, it was not enough to eliminate the imbalance between supply and demand in<br />
growth centers. According to Statistics Finland, prices of existing flats in the country as a<br />
whole grew by 10.6% in the last quarter of 1999. Only one period in the last 30 years<br />
(1988-1991) have real house prices been higher than they were in 1999.<br />
<strong>Mortgage</strong> <strong>Market</strong>s<br />
As a result of low interest rates and strong housing demand, the stock of housing loans<br />
grew considerably in 1999. The stock of housing loans grew by 15.8% and new housing<br />
loans reached a record level. The average interest rate on new loans fell by 0.7% in the<br />
first half of the year, but rates climbed back to the level prevailing at the start of the year<br />
during the second half.<br />
The majority of housing finance in Finland is provided by the main commercial, cooperative<br />
and savings banks. Their share of outstanding loans as at Q3 1998 accounted<br />
<strong>for</strong> 63% of the total market, which includes both owner occupied property loans and<br />
rental property loans. This share increases to nearly 85% <strong>for</strong> loans to households. Major<br />
lenders include MeritaNordbanken, Leonia Bank, OKOBANK and OKO <strong>Mortgage</strong> Bank,<br />
Suomen Hypoteekkiyhdistys and the <strong>Housing</strong> Fund of Finland.<br />
Central Government funds account directly <strong>for</strong> some 21% of outstanding loans and<br />
indirectly, through funds advanced via municipalities <strong>for</strong> about a further 8%. Insurance<br />
institutions provide around 4%, with the remaining 3% being provided by other<br />
specialized financial institutions such as the <strong>Mortgage</strong> Society of Finland and Municipal<br />
<strong>Housing</strong> <strong>Finance</strong> Limited.<br />
Residential <strong>Mortgage</strong> <strong>Market</strong> (Markkaa million)<br />
Year Outstanding <strong>Mortgage</strong><br />
Debt/GDP<br />
<strong>Mortgage</strong> Debt<br />
Outstanding<br />
Countrywide <strong>International</strong> Consulting Services<br />
New Originations<br />
Net<br />
New Originations<br />
Gross<br />
1991 32.0% 174,401 8,000 35,602<br />
1992 33.9% 178,744 4,348 29,798<br />
1993 38.1% 177,338 (1,481) 30,628<br />
1994 37.2% 180,077 1,751 29,742<br />
1995 32.4% 177,211 (1,813) 27,155<br />
1996 31.0% 178,309 1,095 33,261<br />
1997 29.5% 186,763 8,454 39,384<br />
1998 30.3% 200,758 13,990 53,856<br />
Source: EMF<br />
1 7 4
Interest rates in 1999 fell to historically low levels. Banks make both fixed and variable<br />
rate loans. Variable rate loans are now indexed to Euribor. Fixed interest loans are<br />
available <strong>for</strong> periods of 3 and 5 years. After a period of fixed interest, the interest of the<br />
loan will be changed to Merita prime rate + a margin agreed upon at the beginning of the<br />
loan term. After the period of fixed interest, the customer can also agree upon a new<br />
period of fixed interest and agree upon possible changes to the repayment plan at the<br />
same time.<br />
Interest Rates<br />
Year Money <strong>Market</strong> i.e.<br />
Interbank<br />
Countrywide <strong>International</strong> Consulting Services<br />
Deposit <strong>Mortgage</strong> rate* Long-Term Govt bond<br />
Yield<br />
1990 14.00% 7.50% 14.00%<br />
1991 13.08% 7.50% 14.00%<br />
1992 13.25% 7.50% 14.20%<br />
1993 7.77% 4.75% 11.20% 8.84%<br />
1994 5.35% 3.27% 9.80% 9.03%<br />
1995 5.75% 3.19% 8.20% 8.78%<br />
1996 3.63% 2.35% 6.10% N/A<br />
1997 3.23% 2.00% 6.00% N/A<br />
1998 3.57% N/A 5.20% N/A<br />
1999 2.97% 1.22% 4.80% 4.72%<br />
Average rate offered by individual banks; Source: IMF, EMF<br />
<strong>Mortgage</strong> bond issuance has declined substantially since 1990. The total outstanding is<br />
now less than Euro 1 billion. A new <strong>Mortgage</strong> Bond Act took effect in January 2000.<br />
The Act regulates both mortgage banks and mortgage bonds and protects the name<br />
“mortgage bond”. Structure of mortgage bonds will largely follow the German<br />
Pfandbrief model.<br />
<strong>Mortgage</strong> Bonds (Millions of FM)<br />
Year Issued Outstanding<br />
1991 4,494 20,583<br />
1992 1,612 19,446<br />
1993 1,093 18,011<br />
1994 1,529 16,274<br />
1995 710 13,043<br />
1996 1,474 9,900<br />
1997 2,088 7,652<br />
1998 1,052 6,915<br />
Source: EMF<br />
Policy Developments<br />
The <strong>Housing</strong> Fund of Finland (ARA) is a government agency operating under the<br />
Ministry of the Environment, which manages operations related to state-subsidized<br />
lending <strong>for</strong> housing, interest-subsidized lending and renovation subsidies. The <strong>Housing</strong><br />
fund obtains funds from the state budget, interest payments and installments on old<br />
1 7 5
housing loans, loans from the capital market and securitization of state-subsidized<br />
housing (ARAVA) loans. ARA is the major issuer of MBS. The Fund has issued 4 large<br />
offshore blocks of securities (the Fennica program). This innovative program was the<br />
first securitization of social housing loans in Europe. The first issue was <strong>for</strong> $364 million<br />
in 1995. Subsequently, ARA has issued FM 1.5 billion in September 1996, FM 2.05<br />
billion in September 1998 and Euro 500 million in September 1999. The SPV is located<br />
in Ireland, which is characterized as a “securitization-friendly, tax efficient jurisdiction”.<br />
Although the loans are subsidized, investors receive a market rate of interest determined<br />
as a margin over LIBOR (issue 1) or HELIBOR (converted to Euribor) in issues 2 and 3.<br />
The structure of a typical transaction is shown in Figure 1.<br />
A new law governing mortgage banking entered into <strong>for</strong>ce at the beginning of 2000. The<br />
law covers mortgage banking activities conducted by special credit institutions that have<br />
the exclusive right to finance their operations by the issuance to the general public of<br />
bonds backed by real estate or government entities. The activities of mortgage banks were<br />
restricted to the granting of loans secured by shares of housing or real estate companies,<br />
occupancy rights or real estate mortgages. Loans can also be granted to government<br />
entities.<br />
Sources and References<br />
1. Bank of Finland http://www.bof.fi<br />
2. <strong>Housing</strong> Fund of Finland http://www.vyh.fi/ara/ara.htm<br />
3. Statistics Finland<br />
4. Ijäs, T. and H. Hiltunen, “Securitizing Funds For Social <strong>Housing</strong>”, Hosing <strong>Finance</strong><br />
<strong>International</strong>, 13, 2, December 1998<br />
5. IMF: <strong>International</strong> Financial Statistics, 2000<br />
Countrywide <strong>International</strong> Consulting Services<br />
1 7 6
6. European <strong>Mortgage</strong> Federation, <strong>Mortgage</strong> and Property <strong>Market</strong>s in 1999, Brussels<br />
2000 www.hypo.org<br />
7. European <strong>Mortgage</strong> Federation, Hypostat 1988-1998, Brussels 1999<br />
8. Credit Suisse First Boston, “Euro-11 Special: <strong>Housing</strong> Matters”, Economics Research<br />
April 2000 www.csfb.com<br />
Contacts<br />
1. ARA The <strong>Housing</strong> Fund of Finland<br />
PO Box 100<br />
FIN 00521 Helsinki<br />
Tel: 358.0.148.881<br />
Fax: 358.0.148.2582<br />
2. Finnish <strong>Mortgage</strong> Association<br />
Suomen Hypoteekkiyhdistys<br />
Yrjönkatu 9 A<br />
PL 509<br />
00101 HELSINKI<br />
Tel: (09) 228 361<br />
Fax: (09) 647 443<br />
Email hypo@hypoteekkiyhdistys.fi<br />
Countrywide <strong>International</strong> Consulting Services<br />
1 7 7
France<br />
Economic Background<br />
Year Exchange Rate<br />
Francs/US$<br />
Consumer Price<br />
Index<br />
Countrywide <strong>International</strong> Consulting Services<br />
Change In<br />
Consumer Prices<br />
Francs US$<br />
Nominal GDP<br />
(Millions)<br />
Nominal GDP<br />
(Millions)<br />
1990 5.45 89.58 3.38 6,509,500 1,194,404<br />
1991 5.64 92.47 3.23% 6,776,200 1,201,454<br />
1992 5.29 94.65 2.36% 6,999,060 1,323,074<br />
1993 5.66 96.65 2.11% 7,077,100 1,250,371<br />
1994 5.55 98.25 1.66% 7,389,700 1,331,477<br />
1995 4.99 100.00 1.78% 7,752,400 1,553,587<br />
1996 5.12 102.01 2.01% 7,951,400 1,553,008<br />
1997 5.84 103.23 1.20% 8,224,900 1,408,373<br />
1998 5.90 103.93 0.68% 8,564,700 1,451,644<br />
1999 6.51 104.48 0.53% 8,813,076 1,353,775<br />
Source: IMF, Morgan Stanley<br />
France has the 4 th largest world economy with a 1999 growth rate of 2.9%. The economy<br />
has per<strong>for</strong>med well in recent years, and the <strong>for</strong>ecast <strong>for</strong> 2000 was growth in the 3.5-4.0<br />
percent range. At 0.5% in 1999, French inflation was the lowest of the six largest<br />
Euroland countries. The French government has progressed in deregulating product and<br />
labor markets. Unemployment was high at 11 percent, but it is <strong>for</strong>ecasted to fall in<br />
coming years. Per capita income in 1997 was $21,169. A controversial new policy came<br />
into effect in 2000 --- the 35 hour (instead of 39 hour) workweek <strong>for</strong> companies<br />
employing more than 20 people. This policy may undermine French competitiveness and<br />
cap potential growth.<br />
<strong>Housing</strong> <strong>Market</strong><br />
Year <strong>Housing</strong> Starts Permits Issued Transactions Involving<br />
Dwellings<br />
Construction Cost<br />
Index*<br />
1992 277,000 340,700 605,800 106<br />
1993 256,500 325,700 584,500 107<br />
1994 302,200 360,500 670,000 107<br />
1995 285,900 311,800 683,000 107<br />
1996 273,800 306,800 694,500 110<br />
1997 253,900 273,600 669,000 112<br />
1998 278,200 355,600 112<br />
1999 309,700 327,500 113<br />
*1990=100; Source: EMF<br />
There were 28,945,000 dwelling units in France with a 1997 homeownership rate of 54%.<br />
The population was 58,723,000. 1999 was a favorable year <strong>for</strong> the property markets with<br />
the level of new construction at the highest in the past 10 years. The pick-up reflects the<br />
1 7 8
gradually improving economy, low interest rates and fiscal incentives. The number of<br />
building permits fell; however, as a tax assistance scheme <strong>for</strong> new rental property expired<br />
in August, 1999. The market <strong>for</strong> existing dwellings benefited from a reduction in transfer<br />
taxes and VAT. The number of real estate transactions was relatively low reflecting high<br />
transaction costs. The total number of transactions has increased over the past 2 years to a<br />
level of approximately 800,000. Transaction costs were lowered from 7.35% to 6.25% of<br />
the transaction price <strong>for</strong> existing properties in September 1999 and from 7.35% to 1.95%<br />
<strong>for</strong> new properties.<br />
House prices fell <strong>for</strong> 7 consecutive years but reversed the trend in 1998. Parisian house<br />
prices increased 3.7% in 1998, and they were <strong>for</strong>ecasted to increase 5% in 1999. The<br />
typical price <strong>for</strong> a 150m2 and 100m2 flat at the end of 1999 was 138,000 Euro. There<br />
were 640,000 transactions in 1999 up 3.8% from the prior year. The percentage of<br />
disposable income spent on housing has risen from 18.9% in 1990 to 22.5% in 1997.<br />
<strong>Mortgage</strong> <strong>Market</strong><br />
France has the third largest mortgage market in Europe, with outstanding balances of<br />
$271 billion at the end of 1999. Despite its relative affluence, France has a relatively<br />
small mortgage market accounting <strong>for</strong> only 20% of GDP, reflecting a legacy of high<br />
interest rates, previously nationalized banks and subsidies. The role of the state has<br />
declined sharply over the past decade. State regulated loans accounted <strong>for</strong> 50% of new<br />
lending in 1990 and less than 20% in 1999. Over the past 2 years the market has been<br />
enjoying moderate growth, reflecting low interest rates (refinancing), relatively high rates<br />
of new construction, and an increased interest in housing, as investment alternatives have<br />
given low savings rates. Refinance slowed as interest rates began to rise.<br />
Year Outstanding <strong>Mortgage</strong><br />
Debt/GDP<br />
<strong>Mortgage</strong> Debt<br />
Outstanding<br />
Mil FF<br />
Countrywide <strong>International</strong> Consulting Services<br />
New Originations<br />
Net<br />
(mil FF)<br />
New Originations<br />
Gross<br />
(mil FF)<br />
1992 23.0% 1,606,654 N/A 184,895<br />
1993 21.7% 1,529,674 N/A 183,558<br />
1994 21.1% 1,554,354 34,420 192,393<br />
1995 20.9% 1,593,781 22,155 182,593<br />
1996 20.4% 1,596,929 38,479 204,065<br />
1997 20.4% 1,658,846 44,988 222,929<br />
1998 20.0% 1,709,510 50,000 235,019<br />
1999* 20.0% 1,765,512 56,003 260,019<br />
*Provisional estimate; Source: EMF<br />
The French mortgage market is dominated by retail funded depository institutions.<br />
French banks are well capitalized and enjoy a relatively low retail cost of funds, in part<br />
due to a ban on payment of interest on current accounts, and their domination in attracting<br />
contract savings accounts.<br />
The French mortgage market shares are divided (in 1998) between commercial banks<br />
(33%), mutual and cooperative banks (mainly Crédit Agricole and Crédit Mutuel -–34%),<br />
1 7 9
the Caisse d’Epargne Group (savings banks) (13%), Crédit Foncier (12%) and specialized<br />
(wholesale-funded) institutions (8%). A victim of the property crisis of the early 1990s<br />
and weakened by the loss in 1995 of the monopoly of the distribution of state-subsidized<br />
loans <strong>for</strong> home ownership, the Crédit Foncier was sold to the Caisse d’Epargne in 1999.<br />
Wholesale lenders depending on non-retail funds including <strong>Union</strong> De Credit Pour Le<br />
Batiment (UCB – part of the Bank Paribas and now Banque National de Paris group) and<br />
Bank Henin have lost market share in the 1990s.<br />
French banks price mortgages quite aggressively, and they use them as relationship<br />
products to obtain long term customers to whom they cross-market other financial<br />
products. Margins on residential mortgages are thus quite low (around 1% in 1999).<br />
One reason banks can af<strong>for</strong>d to be aggressive on residential mortgages is their dominance<br />
in the provision of contract savings. The PEL (Plan E’pargne Logement) is a contract<br />
wherein the saver saves a certain sum over a period of time (minimum 4 years) and is<br />
eligible <strong>for</strong> a loan upon completing the contract. The rates on savings are set by the<br />
government, typically at a level that equates the after-tax yield on PEL and market<br />
savings accounts. The government provides a bonus upon completion of the contract.<br />
The loan must be <strong>for</strong> housing purpose, and the rate is set at a fixed spread over the<br />
savings rate. The lender offering the program can use the excess funds (Treasury) <strong>for</strong><br />
loans <strong>for</strong> housing purposes (broadly defined). Thus, the PEL provides the lender with a<br />
pool of below-market rate funds that it can use to subsidize housing loans. 8.5% of<br />
lending in 1998 was in the <strong>for</strong>m of PEL loans, down from 16% in 1997 and reflecting the<br />
falling interest rate environment.<br />
Interest Rates <strong>Mortgage</strong> Rates<br />
Gov’t Bond<br />
Yields<br />
Year Money <strong>Market</strong> i.e.<br />
Interbank<br />
Deposit Fixed Variable Long-Term<br />
1990 9.85% 4.50% 11.00% 10.9% 9.96%<br />
1991 9.49% 4.50% 11.20% 11.1% 9.05%<br />
1992 10.35% 4.50% 10.80% 10.7% 8.60%<br />
1993 8.75% 4.50% 8.80% 8.6% 6.91%<br />
1994 5.69% 4.56% 8.90% 8.7% 7.35%<br />
1995 6.35% 4.50% 8.60% 8.5% 7.59%<br />
1996 3.73% 3.67% 7.40% 7.3% 6.39%<br />
1997 3.24% 3.50% 6.70% 6.5% 5.63%<br />
1998 3.39% 3.21% 5.80% 5.9% 4.69%<br />
1999 3.50% 5.60% 5.30%<br />
Source: EMF, IMF<br />
The standard mortgage product is a 15-20 year fixed rate, amortizing mortgage,<br />
accounting <strong>for</strong> approximately 80% of all mortgage loans. Variable rate loans (VRMs)<br />
represent 80% of the loans distributed by specialized institutions, and only 20% of those<br />
are from the banking sector. VRMs are indexed, typically to Euribor, and often feature<br />
payment caps and/or the possibility to shift to a fixed rate at no cost. Several lenders<br />
introduced 30-year mortgage loans and flexible payment loans in 1999.<br />
Countrywide <strong>International</strong> Consulting Services<br />
1 8 0
There are three major types of mortgage loans in France, the free market (prêt eligible),<br />
regulated (prêt conventionné, or PC) and PAS (prêt d’accession Sociale). Rates on free<br />
market loans are set by the market. The terms of PC loans are regulated by the<br />
government and are typically 10-20 basis points less than market-rate loans. They are<br />
provided to preferred customers. Free market and PC loans accounted <strong>for</strong> 63% of the<br />
market in 1998.<br />
The PAS was introduced in 1993. Under this program, the government provides<br />
guarantees <strong>for</strong> loans to marginal borrowers. The bank pays a fee <strong>for</strong> this insurance, which<br />
is a function of the per<strong>for</strong>mance of its PAS loan portfolio. Subsidized loans to boost<br />
homeownership (PAP), that were previously distributed by Crédit Foncier de France and<br />
the credit immobilier companies, have been replaced by the zero rate loan that can be<br />
granted by all financial institutions. This change has contributed to a shift in the market<br />
share of different lenders towards banks and away from specialized institutions. Loan<br />
programs, geared toward the “semi-social” rental sector and managed by public housing<br />
bodies or private investors, are also available. Government subsidized loans accounted<br />
<strong>for</strong> 22.5% of lending in 1998.<br />
The credit position of the mortgage lender in France is not as strong as in many other<br />
developed countries. The <strong>for</strong>eclosure process is both time consuming (at least 30 months<br />
from initial delinquency to final disposal of the collateral) and costly (due to the delay and<br />
high transaction cost <strong>for</strong>eclosure losses can often account <strong>for</strong> a majority of the total loan<br />
amount by the time of disposition). As a result, lenders are conservative with 70%<br />
maximum LTV in many cases.<br />
<strong>Mortgage</strong> registration is costly in France (1 to 2 percent of the loan balance). The<br />
mortgage security is being replaced, to an increasing extent, by a personal surety (a<br />
guarantee given by specific financial institutions, such as Crédit Logement, <strong>for</strong> loans to<br />
private individuals) or by a financial guarantee, such as a stock portfolio. Whereas 10<br />
years ago, only the mortgage security existed in practice. Today, it covers about ¾ of<br />
loans to private individuals.<br />
The vast majority of funding is through retail deposits and PEL accounts. Wholesale<br />
funds are available through the Eurobond market, bonds issued by Caisse Refinancement<br />
Hypothecaire (CRH – a centralized bond issuer) and starting in 1999 issuance of<br />
mortgage bonds patterned after the German Pfandbriefe. CRH issued unsecured debt in<br />
the French markets and provided collateralized loans to its owner institutions (banks).<br />
Issuance of CRH bonds has been declining in recent years, reflecting the attractiveness of<br />
retail versus wholesale funds <strong>for</strong> banks.<br />
The new law governing the issuance of secured bonds, the Obligations Foncières,<br />
provides a vehicle <strong>for</strong> individual institutions to issue mortgage bonds. The new law<br />
provides <strong>for</strong> the creation of a new type of financial institution, the Société de Crédit<br />
Foncier, whose sole purpose is the refinancing of specific eligible assets through the<br />
Countrywide <strong>International</strong> Consulting Services<br />
1 8 1
issuance of Obligations Foncières, as well as through to a lesser extent. Other types of<br />
resources provide <strong>for</strong> a preference on the company’s assets linked to the bonds. The<br />
companies can be subsidiaries of banks and other financial institutions. The companies<br />
are separately capitalized, but they can be operated, virtually, with management by the<br />
sponsoring institution. The collateral <strong>for</strong> the bonds is subject to strict rules including a<br />
maximum of 60% loan-to-value ratio and oversight by a trustee.<br />
<strong>Mortgage</strong> Bonds (mil FF)<br />
Year Issued Outstanding<br />
1997 1,996 290,899<br />
1998 13,999 272,148<br />
1999 38,704 231,017<br />
<strong>Mortgage</strong>-Backed Securities (mil FF)<br />
Year Issued Outstanding<br />
1997 14,483 28,932<br />
1998 16,702 44,772<br />
1999 22,789 67,502<br />
Source: EMF<br />
A securitization framework exists, and it has been used by a number of lenders <strong>for</strong> oneoff<br />
transactions. The French securitization structure differs from that in the UK and the<br />
US. An issuer will sell loans to a “Fonds Commun de Créances” or FCC. To finance the<br />
acquisition of the loans, the FCC issues shares that represent ownership rights to the<br />
assets. FCC’s are akin to mutual funds, and they are a relatively flexible structure. The<br />
main issuers of MBS in France have been Crédit Foncier, Crédit Lyonnais and <strong>Union</strong> de<br />
Crédit pour le Batiment (UCB).<br />
Policy Developments<br />
The protection of borrowers against over-indebtedness is regulated by the NEIERTZ Act<br />
of 1989. This act provides that ad hoc committees, overseen by the Banque de France,<br />
can ask lending institutions to restructure the debt of over-indebted households. In 1998,<br />
the act was rein<strong>for</strong>ced with protective provisions <strong>for</strong> low-income borrowers. In 1999, the<br />
new law on “financial security” modified the Scrievner Law. It dictates that the<br />
maximum, early repayment penalty is equal to 6 months of interest with a limit of 3% of<br />
the outstanding penalty by banning the imposition of the penalty when a sale is imposed<br />
by an external event (death, job transfer etc.).<br />
The right of the lender to collect an indemnity in the event of early repayment has been<br />
abolished in the following 3 cases: when the early repayment is linked to the sale of the<br />
property <strong>for</strong> reasons of job mobility, or to the death of the borrower or of his/her spouse,<br />
or should the borrower or his/her spouse lose his/her job.<br />
Sources and References<br />
1. European <strong>Mortgage</strong> Federation, <strong>Mortgage</strong> and Property <strong>Market</strong>s in 1999, Brussels<br />
2000<br />
Countrywide <strong>International</strong> Consulting Services<br />
1 8 2
2. European <strong>Mortgage</strong> Federation, Hypostat 1988-1998, Brussels 1999<br />
3. INSEE 1998<br />
4. IMF: <strong>International</strong> Financial Statistics, 2000<br />
5. Taffin, C., Credit Foncier de France “Epargne-Logement” in France, <strong>Housing</strong> <strong>Finance</strong><br />
<strong>International</strong>, December 1998<br />
6. Taffin, C., Credit Foncier de France, “<strong>Housing</strong> Credit in France: Main Aspects and<br />
Recent Changes”, December 1998<br />
7. Taffin, C., The Rebirth of the Land Credit Companies”, <strong>Housing</strong> <strong>Finance</strong><br />
<strong>International</strong>, June 2000<br />
8. Selectaux.com, “French <strong>Mortgage</strong> <strong>Market</strong> Overview”, presentation at the Pan-<br />
European <strong>Mortgage</strong> <strong>Market</strong> 2000 Conference, Barcelona, September 2000.<br />
9. Credit Suisse First Boston, “Euro-11 Special: <strong>Housing</strong> Matters”, Economics Research<br />
April 2000 www.csfb.com<br />
Contacts<br />
1. Credit Foncier de France<br />
19 rue des Capucines<br />
75050 Paris Cedex 01<br />
Tel: 01.42.44.80.00<br />
Fax: 01.42.44.86.99<br />
http://www.creditfoncier.fr/<br />
Countrywide <strong>International</strong> Consulting Services<br />
1 8 3
Germany<br />
Economic Background<br />
Year Exchange Rate<br />
DM/US$<br />
Consumer Price<br />
Index<br />
Countrywide <strong>International</strong> Consulting Services<br />
Change In<br />
Consumer Prices<br />
DM US$<br />
Nominal GDP<br />
(Millions)<br />
Nominal GDP<br />
(Millions)<br />
1990 1.6200 85.73 2.70% 2,429,400 1,499,630<br />
1991 1.6600 87.10 1.59% 2,936,870 1,769,199<br />
1992 1.5600 91.50 5.06% 3,153,500 2,021,474<br />
1993 1.6500 95.58 4.46% 3,234,740 1,960,448<br />
1994 1.6200 98.19 2.73% 3,394,320 2,095,259<br />
1995 1.4300 100.00 1.84% 3,520,520 2,461,902<br />
1996 1.5000 101.49 1.49% 3,584,620 2,389,747<br />
1997 1.7300 103.27 1.75% 3,667,230 2,119,786<br />
1998 1.7600 104.26 0.96% 3,784,370 2,150,210<br />
1999 1.9500 104.96 0.67% 3,841,136 1,969,813<br />
Source: IMF, Morgan Stanley<br />
The German economy grew slowly during the mid- to late 1990s. Led by exports, the<br />
economy began to pick up in 1999. As the recovery started to spill over into domestic<br />
demand, real growth was expected to improve upon the 1.5% growth rate of 1999.<br />
Consumption was likely to increase due to a combination of rising real disposable<br />
income, falling unemployment and lower income and payroll tax. Investment spending<br />
was <strong>for</strong>ecasted to increase significantly, benefiting from a strong improvement in the<br />
business climate, rising capacity utilization and only a moderate increase in unit labor<br />
costs. Inflation was <strong>for</strong>ecasted to rise to approximately 1.4% <strong>for</strong> the year 2000, primarily<br />
reflecting higher oil prices. Wage growth was <strong>for</strong>ecasted to remain relatively moderate,<br />
and combined with on-going deregulation and increasing competition in the retail sector,<br />
it was expected to moderate the inflation. The unemployment rate has fallen slightly to<br />
approximately 8.5%, but high structural unemployment remains a concern.<br />
<strong>Housing</strong> <strong>Market</strong><br />
Over the past 19 years, the trend in building activity in Germany has been subject to<br />
substantial fluctuation as indicated by the evolution of building permits. Several factors<br />
account <strong>for</strong> the variation, including the trend in household net income, increased<br />
immigration into Germany and German reunification. These factors led to a high demand<br />
<strong>for</strong> accommodation with spillover effects on both new construction and redevelopment in<br />
the early 1990s.<br />
The number of building permits issued and the demand <strong>for</strong> housing finance loans fell<br />
during 1999, despite historically low mortgage interest rates and relatively low prices in<br />
the construction and property markets. State support <strong>for</strong> the construction and purchase of<br />
residential property has drastically decreased in past years. In addition, a stagnant<br />
economy has reduced demand.<br />
1 8 4
Germany is a densely populated country with approximately 82,037,000 inhabitants and<br />
approximately 35 million households. The share of owner-occupied housing units in<br />
Germany was about 40 percent. The remaining households are tenants and sub-tenants. In<br />
1998, about 98% of approximately 37 million housing units were located in residential<br />
buildings and approximately 2% were in other buildings with housing space.<br />
House Price Index<br />
Year <strong>Housing</strong><br />
Completions<br />
Permits Issued Transactions<br />
Involving<br />
Dwellings<br />
Countrywide <strong>International</strong> Consulting Services<br />
Construction Cost<br />
Index<br />
1991=100<br />
All Transactions<br />
1990=100<br />
1992 386,089 484,404 612,500 100 115<br />
1993 455,500 606,686 754,300 106 123<br />
1994 573,859 712,798 662,200 112 136<br />
1995 603,035 639,100 619,500 114 133<br />
1996 560,613 576,378 600,000 117 133<br />
1997 570,596 530,263 570,000 117 133<br />
1998 500,718 477,707 595,000 116 137<br />
1999 472,805 437,584 580,000 116 140<br />
Source: EMF<br />
The relatively low homeownership rate reflected strong preferences <strong>for</strong> rental housing in<br />
certain geographic areas, high average house prices, and a tax system that was biased<br />
more towards rental investment than homeownership (e.g., mortgage interest on owneroccupied<br />
homes is not a deductible expense). Homeownership rates are considerably<br />
lower in the <strong>for</strong>mer East Germany (approximately 25%). The median house price as of<br />
1997 was approximately DM400,000, and the ratio of median house price to median<br />
annual after-tax income was around 6 (empirica).<br />
<strong>Mortgage</strong> <strong>Market</strong><br />
The mortgage market in Germany is the largest market in Europe, with DM 2.18 trillion<br />
($1.12 trillion) in outstanding residential mortgage loans at the end of 1999. While the<br />
homeownership ratio of 40% is relatively low, the stock of mortgage debt outstanding<br />
was large in 1999(57 % of GDP) reflecting the high average price of owner-occupied<br />
housing.<br />
Year Outstanding <strong>Mortgage</strong><br />
Debt/GDP<br />
<strong>Mortgage</strong> Debt<br />
Outstanding<br />
DM million<br />
New Originations<br />
Net<br />
New Originations<br />
Gross<br />
1991 40.4% 1,143,450 48,771 116,931<br />
1992 41.0% 1,220,525 58,341 75,377<br />
1993 42.6% 1,348,560 99,799 129,370<br />
1994 45.0% 1,484,458 118,695 135,899<br />
1995 45.9% 1,601,151 105,615 116,694<br />
1996 48.3% 1,743,131 116,888 141,981<br />
1 8 5
1997 50.9% 1,863,158 118,043 120,073<br />
1998 52.4% 1,981,252 118,048 124,234<br />
1999 57.0% 2,188,155 110,798 134,839<br />
*includes housing loans not secured by mortgage<br />
The origination volume in 1998 was DM 134 billion ($69 billion), a relatively low<br />
percentage of the outstanding balance reflecting a low mobility rate, late age <strong>for</strong> first time<br />
home purchase (around 40 years of age) and the absence of financially motivated<br />
prepayment (which is precluded by contract <strong>for</strong> loans with rates fixed <strong>for</strong> more than one<br />
year). The lack of early prepayment is evident in the small difference between gross and<br />
net new lending. Germany experienced a decrease in net lending in 1999, reflecting a<br />
relatively weak economy and reduced incentives <strong>for</strong> construction.<br />
<strong>Market</strong> Share by Lender Type 1998<br />
Current Year Debt Outstanding<br />
Comm Banks* 16%<br />
Savings Banks 32%<br />
<strong>Mortgage</strong> Banks 15%<br />
Co-op Banks 12%<br />
Bausparkassen 11%<br />
Insurance Companies 8%<br />
Other** 6%<br />
Source: DePfa<br />
*Includes mixed mortgage/commercial banks 8<br />
**Includes <strong>for</strong>eign banks, private banks, banks with special functions<br />
The German banking sector and housing finance market are characterized by a three-tier<br />
structure: private, public and co-operative lender groups. Within each group there may be<br />
several different types of lenders, including specialized mortgage bank subsidiaries or<br />
Bausparkassen. The main mortgage lending groups and the approximate 1999 origination<br />
market share are: the Hypovereinsbank Group (7.6%), Schwäbisch Hall Group (7,1%),<br />
BHW Group (6.6%), Wustenröt Group (6.5%) and Deutsche Bank Group (3%). Overall<br />
public savings banks and Girozentralen have the largest market share of 32%. Over the<br />
past 2 decades, mortgage banks (primarily public mortgage banks) and Bausparkassen<br />
have lost market share to saving, cooperatives and especially commercial banks.<br />
Distinctions between the groups of institutions arise from the nature and extent of their<br />
mortgage lending and more importantly, the nature of the funds used <strong>for</strong> financing the<br />
housing loan. Both the mortgage banks (Hypothekenbanken) and contract savings<br />
8 The market share includes two “mixed” mortgage banks, including the Hypovereinsbank which<br />
is the largest lender in Germany. Mixed mortgage banks can raise funds through both deposits<br />
and mortgage bonds. The other 26 mortgage banks are “pure” meaning that they can only raise<br />
funds on the wholesale markets.<br />
Countrywide <strong>International</strong> Consulting Services<br />
1 8 6
institutions (Bausparkassen) are defined by an exclusive right to offer particular financing<br />
instruments. The mortgage banks normally grant mortgage loans <strong>for</strong> 25-30 years,<br />
generally, with an initial period of fixed interest of 5-10 years. The mortgage banks fund<br />
themselves primarily with collateralized mortgage bonds (Pfandbriefe), which are subject<br />
to specific and restrictive requirements (e.g., collateralized by mortgages with a<br />
maximum LTV of 60%).<br />
The Bausparkassen offer loan-linked savings programs. Approximately ½ of German<br />
households have one or more Bauspar contracts. A saver signs a contract to save a<br />
certain sum (typically 10-15% of the expected house price) over a period of time (5-7<br />
years), after which he/she is entitled to a loan in a matching amount. The savings and loan<br />
rates are fixed and typically below market. The loans are available <strong>for</strong> maturities between<br />
7 and 18 years. The system represents a “closed” system where loans and savings interest<br />
rates are independent of the market rate. The Bausparkassen rely almost entirely on<br />
contract savings plans <strong>for</strong> funds; hence, they must ration the new loans in accordance<br />
with available funds from new savers. Individual Bausparkasse offer a limited amount of<br />
bridge loans at market rates of interest that are prepaid when the borrower becomes<br />
eligible <strong>for</strong> the contract loan. The government provides a grant, equal to 10% of the<br />
annual savings (up to a limit of approximately $550 per year).<br />
Savings banks offer both reviewable rate loans and loans with short term fixed rates<br />
(typically up to 5 years). They receive funds from deposits and loans from<br />
Landesbanken. The co-operative banking system also has a liquidity facility (the DG<br />
Bank) and its own mortgage banks and Bausparkassen.<br />
An important aspect of German residential mortgage finance is the package character of<br />
mortgage lending. The typical financial structure <strong>for</strong> a first time buyer encompasses a first<br />
mortgage (60-70%), a Bauspar loan of approx. 20%, and often a personal loan. As a<br />
result of the packaged nature of lending, borrowers often obtain loans from three different<br />
lenders, e.g., a mortgage bank, a Bausparkasse and a universal bank. Institutions within<br />
different groups will offer housing finance packages from a single source.<br />
There is a relatively low level of product variation in Germany, reflecting in part the<br />
refinancing constraints of the specialized lenders. Traditionally, German borrowers have<br />
favored long-term, fixed-interest rate mortgages. There are few long-term fixed rate loans<br />
in the U.S. sense of the word. Although all loans with rates that are fixed <strong>for</strong> more than<br />
one year are referred to as fixed interest mortgages, the longest period, during which the<br />
rate is fixed, is 10 years. Technically, German fixed-interest mortgages are renegotiablerate<br />
mortgages, amortizing over 25-30 year terms, with rates fixed from one to ten years<br />
(similar to the Canadian roll-over mortgage). 9 There are also variable-rate mortgages,<br />
mainly offered by the savings banks. These loans are adjustable at the discretion of the<br />
lender (like the UK standard variable rate mortgage). Average interest rates (end of 1998)<br />
9 Most mortgages are annuity contracts with the principal repayment beginning at 1%.<br />
Countrywide <strong>International</strong> Consulting Services<br />
1 8 7
were 5.3% <strong>for</strong> 10 year fixed interest loans and 5.8% <strong>for</strong> variable rate loans. Rates rose by<br />
approximately 100 basis points in 1999.<br />
Interest Rates <strong>Mortgage</strong> Rates<br />
Year Money <strong>Market</strong> i.e.<br />
interbank<br />
Countrywide <strong>International</strong> Consulting Services<br />
Deposit Variable Fixed (10 yrs.) Long-Term<br />
Gov't Bond Yields<br />
1990 7.92% 7.07% 9.90% 9.90% 8.88%<br />
1991 8.84% 7.62% 10.20% 9.50% 8.63%<br />
1992 9.42% 8.01% 9.70% 8.60% 7.96%<br />
1993 7.49% 6.27% 7.80% 7.30% 6.28%<br />
1994 5.35% 4.47% 8.10% 8.80% 6.67%<br />
1995 4.50% 3.85% 6.90% 7.50% 6.50%<br />
1996 3.27% 2.83% 6.40% 7.10% 5.63%<br />
1997 3.18% 2.69% 6.30% 6.70% 5.08%<br />
1998 3.41% 2.88% 5.80% 5.29% 4.39%<br />
1999 2.73% 2.43% 6.40% 3.80%<br />
Source: IMF, EMF<br />
The Pfandbrief market is the largest segment of the German bond market, but it is also<br />
the largest non-government bond market in Europe. A strict regulatory framework<br />
secures the highest standards of asset quality.<br />
The Pfandbrief market, with a total outstanding of DM 1.7 trillion, make up the largest<br />
portion of the German bond market, even bigger than the Bunds and other paper of<br />
public-sector issuers. In the European market, only the volume of the Italian government<br />
bond market was greater. In terms of volume the Pfandbrief market has 42.6% share of<br />
the market. A segment of the Pfandbrief market is the Jumbo Pfandbrief, which is gaining<br />
importance. Jumbos are issues with principal of DM 1 billion and more in straight bond<br />
<strong>for</strong>mat with tight bid/offer spreads and a very active market.<br />
Pfandbrief bonds are secured by first-ranking mortgages or land charges (mortgage<br />
Pfandbrief) or loans in the public sector (public Pfandbrief). Over 70% of outstanding<br />
Pfandbriefe are public. These bonds may only be issued by private mortgage banks, ship<br />
mortgage banks or a few public-sector issuers. These products must meet all legal<br />
provisions applicable to the individual issuer group. This means that these bonds are<br />
standardized on a legal basis and with high, safety standards.<br />
The vast majority of Pfandbriefe outstanding carry a fixed coupon and are non-callable.<br />
Interest is usually paid annually, and maturities range from one to ten years. The majority<br />
of the Pfandbriefe are three, five and ten maturity.<br />
<strong>Mortgage</strong> Bonds<br />
Year Issued Outstanding<br />
1991 25,808 238,675<br />
1 8 8
1992 42,835 254,631<br />
1993 68,320 285,986<br />
1994 72,826 321,666<br />
1995 72,202 354,310<br />
1996 70,660 381,237<br />
1997 82,198 410,251<br />
1998 97,792 443,205<br />
1999 91,093 461,179<br />
*<strong>Mortgage</strong> and ship {Pfandbriefe: Sources: EMF<br />
There have been a couple of mortgage-backed securities issues in Germany, including the<br />
GEMs transaction by Rheinhyp in 1995 and the HAUS transaction by Deutsche Bank in<br />
1998. Both transactions were the sale of primarily second lien, residential mortgages<br />
(specifically a securitization of the above 60% LTV portion of mortgage loans funded by<br />
Pfandbriefe).<br />
Policy Developments<br />
The legislation governing the Bausparkassen has been amended to allow the<br />
Bausparkassen to participate in cross-border business in all European Member States of<br />
the OECD.<br />
Under the Single-family Home Assistance program, conditions governing the awarding of<br />
the single-family home bonus has changed as of January 2000, the income thresholds are<br />
being reduced by one-third; however, an additional flat rate <strong>for</strong> children is being<br />
introduced.<br />
The <strong>Mortgage</strong> Bond Act has been modified so that public bearer debentures may be<br />
brought in as a basis <strong>for</strong> the issuing of public mortgage bonds. The issuing of jumbo<br />
mortgage bonds has been simplified, and business opportunities have been opened up<br />
with a few neighboring eastern European states.<br />
Since January 1996, every first-time buyer of a new dwelling is entitled to a constant<br />
annual buydown that is paid over the first eight years. At present, it is 5.000 DM plus<br />
child allowance of 500 DM per child (up to 1,500 DM). For purchase of existing<br />
dwellings or shares in housing cooperatives, the base rate is half (2,500 DM). Also, tax<br />
deductibility of up-front costs has been cut to a maximum of 3,500 DM.<br />
Sources and References<br />
1. Empirica, “The Residential <strong>Mortgage</strong> <strong>Market</strong> in Germany - <strong>Market</strong> Structure and<br />
Procedures”, Bonn 1997<br />
2. European <strong>Mortgage</strong> Federation, <strong>Mortgage</strong> and Property <strong>Market</strong>s in 1999, Brussels<br />
2000<br />
3. European <strong>Mortgage</strong> Federation, Hypostat 1988-1998, Brussels 1999<br />
4. IMF: <strong>International</strong> Financial Statistics, 2000<br />
5. Deutsche Bundesbank, Monthly Reports, various issues<br />
Countrywide <strong>International</strong> Consulting Services<br />
1 8 9
6. Verband der Privaten Bausparkassen, Annual Report 1999<br />
7. Verband deutscher Hypothekenbanken, Annual Report 1999<br />
8. Arndt, Franz-Josef, “The German Pfandbrief and its Issuers”, <strong>Housing</strong> <strong>Finance</strong><br />
<strong>International</strong>, March 1999<br />
9. Merrill Lynch, “European MBS: The Case of Germany”, September 1999<br />
10. Fitch ICBA, “German Pfandbriefe and Analogous Funding Instruments Elsewhere in<br />
Europe – particularly France and Spain”, May 2000<br />
11. DePfa Hypotheken Management, “Trends in German Residential <strong>Mortgage</strong> <strong>Market</strong>s”,<br />
presentation at the Pan-European <strong>Mortgage</strong> <strong>Market</strong> 2000 Conference, Barcelona,<br />
September 2000.<br />
Contacts<br />
1. Association of Private Bausparkassen, (Verband der Privaten Bausparkassen e.V.)<br />
Klingelhöfer Str. 4<br />
10785 Berlin<br />
Tel: 030 / 590091-500<br />
Fax: 030 / 590091-501<br />
Email: bausparkassen@vdpb.de<br />
http://www.bausparkassen.de<br />
2. Association of German <strong>Mortgage</strong> Banks (Verband deutscher Hypothekenbanken e.V)<br />
Lützowufer 26<br />
10787 Berlin<br />
Tel: 0049-30-269940-0<br />
Fax: 0049-30-269940-29<br />
http:// www.pfandbrief.org<br />
Greece<br />
Economic Background<br />
Year Exchange Rate<br />
Drachmas/US$<br />
Consumer Price<br />
Index<br />
Countrywide <strong>International</strong> Consulting Services<br />
Change In<br />
Consumer Prices<br />
Drachmas US$<br />
Nominal GDP<br />
(Millions)<br />
Nominal GDP<br />
(Millions)<br />
1990 157.63 52.25 20.4 13,143,100 83,379<br />
1991 175.28 62.43 19.5 16,230,500 92,598<br />
1992 214.58 72.33 15.9 18,766,100 87,455<br />
1993 249.22 82.76 14.4 21,135,700 84,807<br />
1994 240.10 91.80 10.9 23,983,600 99,890<br />
1995 237.04 100.00 8.9 27,235,200 114,897<br />
1996 247.02 108.20 8.2 29,935,100 121,185<br />
1997 282.61 114.19 5.5 33,021,800 116,846<br />
1998 282.57 119.63 4.8 35,910,600 127,086<br />
1999 328.44 122.78 2.6 -<br />
Source: IMF<br />
1 9 0
The economy grew 3.5% in 1999, despite the adverse impact the war in Kosovo had on<br />
tourism in Greece. The key drivers of economic growth were public investment and<br />
improving business and consumer confidence induced by EMU convergence. The Greek<br />
government has applied <strong>for</strong> EMU entry in January 2001. Real GDP growth is likely to<br />
accelerate in 2000. Short-term interest rates are likely to fall sharply as the country<br />
completes its economic convergence towards the Euro zone. Inflation fell sharply during<br />
the 1990s, but it is likely to increase somewhat in 2000 reflecting the strong economy.<br />
<strong>Housing</strong> <strong>Market</strong><br />
There were 4,800,000 housing units in Greece in 1991. The country has one of the highest<br />
homeownership rates in Europe at 78% owner-occupied. The population was 10.5<br />
million (1997). Construction activity has been stable but with increasing demand due to<br />
robust growth and declining interest rates. Both house prices and construction costs have<br />
been rising.<br />
Year Permits Issued Transactions<br />
Involving<br />
Dwellings*<br />
Construction<br />
Cost Index<br />
1990=100<br />
1992 71,445 59,887 133<br />
1993 66,061 61,421 150<br />
1994 64,635 65,984 163<br />
1995 60,448 67,159 175<br />
1996 68,093 68,675 187<br />
1997 69,867 100,228 198<br />
1998 71,790 211<br />
1999e 65,500<br />
Source: EMF; *Includes transfers of flats<br />
<strong>Mortgage</strong> <strong>Market</strong><br />
The upward trend in the Greek economy since 1996, combined with the lowering of<br />
interest rates in 1997 and 1998, has led to a significant expansion in both consumer and<br />
mortgage lending. Net lending grew by 44% in 1999, and the ratio of mortgage debt to<br />
GDP, the lowest in the EU, grew from 6.2 to 8%. This trend is likely to continue in 2000<br />
and beyond.<br />
Residential <strong>Mortgage</strong> <strong>Market</strong> (GDM)<br />
Year Outstanding<br />
<strong>Mortgage</strong><br />
Debt/GDP<br />
<strong>Mortgage</strong> Debt<br />
Outstanding<br />
Countrywide <strong>International</strong> Consulting Services<br />
New Originations<br />
Net<br />
New Originations<br />
Gross<br />
Number of New<br />
Loans<br />
1991 4.6% 1,033,062 101,183 51,216 10,000<br />
1992 4.3% 1,029,939 96,186 57,774 10,473<br />
1993 4.2% 1,043,680 80,571 51,840 9,594<br />
1994 4.2% 1,077,407 96,186 64,332 12,053<br />
1995 4.5% 1,223,872 199,242 69,017 11,988<br />
1996 5.2% 1,571,453 347,269 114,923 16,383<br />
1997 5.8% 1,924,343 370,066 138,033 16,843<br />
1998 6.2% 2,208,841 386,617 20,436<br />
1 9 1
1999 8.0% 2,760,661 555,880 20,266<br />
EMF members only. includes residential loans not secured by mortgage; Source: EMF<br />
There has been gradual erosion in the share of traditional, state-owned mortgage banks<br />
and an increase in the share of commercial banks during the 1990s. The most important<br />
factor in this trend was the emergence of the National Bank of Greece (NBG) as the<br />
major player in the mortgage market, following its merger with the National <strong>Mortgage</strong><br />
Bank of Greece in late 1998. The NBG has a market share of approximately 40%. The<br />
NBG has taken over all of the functions of the NMBG, including the granting of<br />
government subsidized housing loans, which constitute a diminishing but still significant<br />
portion of the mortgage market. The 1998 market shares are 67% commercial banks,<br />
2.2% private mortgage banks, 30.8% other specialized lenders including state-controlled<br />
institutions such as the Postal Savings Bank, the Deposits and Loans Fund and the<br />
Agricultural Bank of Greece.<br />
The most common mortgage product has a 15-year maturity. In the past few years,<br />
greater variety has been introduced into the markets, with maturities varying from 3 to 25<br />
years. <strong>Mortgage</strong> interest rates fell into single digits <strong>for</strong> the first time in 1998.<br />
Interest Rates <strong>Mortgage</strong> Rates<br />
Year Treasury Bill Deposit Fixed (15yrs.) Variable<br />
1990 18.50% 19.52% 24.00%<br />
1991 18.79% 20.67% 25.00% 25.50%<br />
1992 17.69% 19.92% 25.00% 25.50%<br />
1993 18.23% 19.33% 24.00% 23.50%<br />
1994 N/A 18.92% 23.00% 23.00%<br />
1995 N/A 15.75% 17.00% 17.50%<br />
1996 11.92% 13.51% 15.50% 17.00%<br />
1997 N/A 10.11% 11.30% 15.30%<br />
1998 N/A 10.70% 9.80% 13.75%<br />
1999 N/A 8.68% 11.75%<br />
Source: EMF, IMF<br />
Loans are funded by deposits in Greece, as there is neither a mortgage bond nor an MBS<br />
market. There is an unfavorable tax regime <strong>for</strong> corporate bonds (20% tax on interest),<br />
compared to Greek government bonds (10% tax rate on interest). High interest rates that<br />
prevailed during the 1990s were also a disincentive to long term bond finance. With the<br />
expected convergence of interest rates with the Euro-zone in 2000, banks may begin<br />
issuing mortgage bonds and/or MBS.<br />
Policy Developments<br />
Consumer protection legislation, covering disclosure of data and transparency in loan<br />
contract terms and conditions, was introduced and expected to pass in 1999. Recently,<br />
the institution of a banking ombudsman was introduced. A National Land Registry was<br />
created in the late 1990s that will enhance the prospects of market development.<br />
Sources and References<br />
Countrywide <strong>International</strong> Consulting Services<br />
1 9 2
1. European <strong>Mortgage</strong> Federation, <strong>Mortgage</strong> and Property <strong>Market</strong>s in 1999, Brussels<br />
2000<br />
2. European <strong>Mortgage</strong> Federation, Hypostat 1988-1998, Brussels 1999<br />
3. IMF: <strong>International</strong> Financial Statistics, 2000<br />
4. Morgan Stanley Dean Witter, Inside the Global Economy, May 2000.<br />
www.msdw.com<br />
Contacts<br />
1. National Bank of Greece S.A.<br />
Strategic Planning and Research Division<br />
86 Eolou Str.<br />
102 32 Athens, Greece.<br />
Tel: 3341521<br />
Fax: 3251133<br />
http://www.ethniki.gr/<br />
Countrywide <strong>International</strong> Consulting Services<br />
1 9 3
Ireland<br />
Economic Background<br />
Year Exchange Rate<br />
Irish £/US$<br />
Consumer Price<br />
Index<br />
Countrywide <strong>International</strong> Consulting Services<br />
Change In<br />
Consumer Prices<br />
Irish £ US$<br />
Nominal GDP<br />
(Millions)<br />
Nominal GDP<br />
(Millions)<br />
1990 0.60 88.32 3.27% 28,524 47,540<br />
1991 0.62 91.14 3.19% 29,584 47,716<br />
1992 0.59 93.99 3.12% 31,406 53,231<br />
1993 0.68 95.31 1.41% 33,912 49,871<br />
1994 0.67 97.55 2.35% 36,479 54,446<br />
1995 0.62 100.00 2.51% 41,028 66,174<br />
1996 0.63 101.69 1.69% 45,210 71,762<br />
1997 0.66 103.16 1.44% 51,822 78,518<br />
1998 0.70 105.66 2.43% 59,637 85,196<br />
1999* 0.93 107.39 1.64% 65,242 79,563<br />
Source: IMF, *World Factbook<br />
Financial economists have dubbed the Irish economy, “The Celtic Tiger,” with real GDP<br />
growth rates of 6 to 10% and inflation at less than 3% during the second half of the<br />
1990s. Ireland ended the decade with 9.4% real GDP growth in 1999, by far the highest<br />
growth rate in Europe. Inflation rose to a European high of 2.5%. Labor shortages, rising<br />
wages and infrastructure bottlenecks will act to slow growth, but a tightening of monetary<br />
policy by the ECB will not stop the inflation rate from rising. The unemployment rate,<br />
which was as high as 12% in 1996, fell below 5% at the beginning of 2000.<br />
<strong>Housing</strong> <strong>Market</strong><br />
Ireland has 1,115,000 dwelling units and an 80% homeownership rate. This is the highest<br />
in Europe. The Irish population, which dipped below 3 million in the 1950s and 60s, is on<br />
the rise. It is estimated to reach 3.8 million in 2000. Culturally, homeownership is a very<br />
strong motivation supported by government and a legacy of prior periods of history.<br />
Currently reflecting the low, Euro zone interest rates, demand in the housing market is<br />
outstripping supply, particularly in the Dublin area where most of the population is<br />
concentrated. As a result, house prices have increased at an annual rate in excess of 15%<br />
over the past 3 years and over 20% the last two years. The government has intervened in<br />
the market to dampen demand, to increase the supply of housing, and to increase<br />
regulation of banks to ensure that lending criteria are maintained.<br />
Year <strong>Housing</strong><br />
Completions<br />
Permits Issued Transactions<br />
Involving Dwellings<br />
Construction Cost<br />
Index*<br />
New House Price<br />
Index*<br />
1992 22,464 9,156 44,433 106 105<br />
1993 21,391 8,801 45,390 108 106<br />
1994 26,863 9,920 50,204 112 111<br />
1995 30,575 10,928 49,288 116 118<br />
1996 33,725 12,016 61,006 118 133<br />
1997 38,842 13,729 64,652 122 154<br />
1 9 4
1998 42,349 16,719 68,925 125 190<br />
*1990=100; New House Price index <strong>for</strong> transactions with mortgage loans; Source: EMF<br />
The surge in economic growth has had a dramatic effect on house prices, with new and<br />
second hand house prices rising at an astonishing rate. The figures <strong>for</strong> new house prices<br />
from 1993 to 1998 are reflected as follows:<br />
New House Prices IEP<br />
Year Whole Country Dublin<br />
1993 50,000 59,500<br />
1996 68,600 76,400<br />
1997 79,600 94,400<br />
1998 (Q3) 97,600 127,000<br />
Source: Byrne, Department of the Environment<br />
New house prices, nationally, have increased by 95%, and Dublin house prices are up by<br />
113% in the same period. Since 1993, second hand house prices in Dublin have increased<br />
by 144% as against 100% nationally.<br />
Second Hand House Prices IEP<br />
Year Whole Country Dublin<br />
1993 52,600 60,500<br />
1996 67,400 82,200<br />
1997 80,276 102,400<br />
1998 (Q3) 110,300 147,600<br />
Source: Byrne, Department of the Environment<br />
There are a number of reasons <strong>for</strong> this dramatic rate of increase. Land supply constraints<br />
have been the main driving <strong>for</strong>ce behind house price increases. The level of demand has<br />
been further fuelled by the fact that Ireland has been experiencing net immigration over<br />
the past few years, with large numbers of highly qualified, young people returning to well<br />
paid positions in software, telecommunications and call center industries.<br />
A further contributing factor has been the huge increase in the level of properties being<br />
purchased <strong>for</strong> investment rather than <strong>for</strong> owner occupation. Lower interest rates, spiraling<br />
property prices and generous tax concessions have made residential investment extremely<br />
attractive. It is estimated that 80% of new apartments in the Dublin area are purchased by<br />
investors.<br />
The Irish government had become increasingly concerned at the overheating of the<br />
market. They commissioned one of Ireland’s leading financial economists, Dr. Peter<br />
Bacon, to prepare a report on housing prices. This was produced in April, and action was<br />
taken by the government, resulting in the following:<br />
a) A reduction in tax incentives <strong>for</strong> private investors<br />
b) A reduction in government tax on house prices<br />
c) Land rezoning incentives<br />
d) Increased funding <strong>for</strong> site development<br />
Countrywide <strong>International</strong> Consulting Services<br />
1 9 5
The effect of such measures has been slight in the short term, but it is expected that in the<br />
longer term they should dampen the overheating which has been experienced.<br />
<strong>Mortgage</strong> <strong>Market</strong><br />
<strong>Mortgage</strong> demand in the past few years has been strong, with gross advances rising<br />
between 20 an 30 percent per year and net advances rising by 30 to 40 percent per year.<br />
As a result, the mortgage debt outstanding grew relative to the economy with mortgage<br />
debt-to-GDP at 27.6% by the end of 1998. The volume of gross new lending <strong>for</strong> housing<br />
in 1999 was up 68% and 83% <strong>for</strong> net lending.<br />
Until the mid-1980s, the market was dominated by the Building Societies, which had up<br />
to 75% market share and the banks having less than 10%. In the mid-eighties, the banks<br />
moved aggressively into the market, and they have been there ever since. The lines of<br />
demarcation between banks and Building Societies have become blurred. Most<br />
institutions are perceived as being “mortgage lenders.” In 1980, there were 14 mutual<br />
Building Societies, but by the end of 1998, this number was reduced to two. This sharp<br />
reduction has come about through mergers and a number of conversions to bank (plc)<br />
charters.<br />
<strong>Mortgage</strong> lending is thus dominated by retail depository institutions (associated banks<br />
and building societies) with a market share of 91% of outstanding mortgage loans at the<br />
end of 1996. Conversions and mergers have significantly cut the building society share of<br />
the market. The main lenders operating in the market are Irish Permanent, First National<br />
Building Society, Allied Irish Bank, EBS Building Society and Bank of Ireland. Bank of<br />
Scotland, a UK bank, has recently entered the market using direct (phone and Internet)<br />
distribution.<br />
Year Outstanding<br />
<strong>Mortgage</strong><br />
Debt/GDP<br />
Millions IEP<br />
<strong>Mortgage</strong> Debt<br />
Outstanding<br />
Countrywide <strong>International</strong> Consulting Services<br />
New Originations<br />
Net<br />
New Originations<br />
Gross<br />
Number of New<br />
<strong>Mortgage</strong> Loans<br />
1992 21.6% 6,450 739 1,379<br />
1993 22.3% 7,285 814 1,343<br />
1994 23.0% 8,272 1,006 1,630<br />
1995 23.3% 9,300 1,091 1,780<br />
1996 25.8% 10,754 1,529 2,339<br />
1997 26.0% 13,362 2,212 2,822 57,901<br />
1998 27.6% 16,439 2,907 3,611 61,407<br />
1999 5,325 6,066<br />
Source: EMF, Walsh (1999)<br />
The typical mortgage loan maturity is 20 years. Lenders offer both reviewable rate and<br />
fixed rate mortgages, but fixed rate loans tend to be fixed <strong>for</strong> a period of time shorter than<br />
the life of the loan. Recently, longer maturity loans, flexible mortgages and split-term,<br />
fixed-rate loans have been introduced. Loan interest rates are fueling demand. Until<br />
recently, lenders earned healthy margins, as deposit rates are relatively quite low. Strong<br />
1 9 6
competition is also leading to more, aggressive underwriting. The average loan size<br />
increased sharply with average, new loans at IEP 88,500 and existing loans at IEP 94,800<br />
at the end of 1999.<br />
Interest Rates<br />
Year Money <strong>Market</strong><br />
Interbank<br />
Deposit <strong>Mortgage</strong> Rates Long-term Govt<br />
Bond Yields<br />
1992 15.12% 5.42% 14.00% 9.11%<br />
1993 10.49% 2.27% 7.70% 7.72%<br />
1994 5.75% 0.33% 7.20% 8.19%<br />
1995 5.45% 0.44% 7.50% 8.30%<br />
1996 5.74% 0.29% 7.10% 7.48%<br />
1997 6.43% 0.46% 7.50% 6.49%<br />
1998 3.23% 0.43% 6.00% 4.99%<br />
1999 3.14% 4.38%<br />
Source: EMF, IMF<br />
The vast majority of mortgage lending is funded through retail deposits. There is<br />
increasing competition <strong>for</strong> retail savings, which has put upward pressure on savings rates.<br />
Savings rates have been extraordinarily low since the mid-1990s. Securitization was<br />
introduced in 1996, and it has grown in importance. In 1999, MBS accounted <strong>for</strong><br />
approximately 20% of net mortgage lending. The introduction of mortgage bonds is under<br />
discussion.<br />
<strong>Mortgage</strong> Backed Securities (Millions IEP)<br />
Year Issued Outstanding<br />
1996 200 200<br />
1997 - 192<br />
1998 400 585<br />
1999* 1065<br />
Source: EMF, *Simpson<br />
Sources and References<br />
1. European Central Bank, Annual Report 1999 http://www.ecb.int<br />
2. European <strong>Mortgage</strong> Federation, <strong>Mortgage</strong> and Property <strong>Market</strong>s in 1999, Brussels<br />
2000 www.hypo.org<br />
3. European <strong>Mortgage</strong> Federation, Hypostat 1988-1998, Brussels 1999<br />
4. IMF: <strong>International</strong> Financial Statistics, 2000<br />
5. Byrne, D. “Ireland: <strong>Housing</strong> and <strong>Mortgage</strong> <strong>Market</strong>s and the Single Currency”,<br />
<strong>Housing</strong> <strong>Finance</strong> <strong>International</strong>, March 1999<br />
6. Walsh, M., “Ireland: Boom and Bubble”, presentation at the Pan-European <strong>Mortgage</strong><br />
<strong>Market</strong> 2000 Conference, Barcelona, September 2000.<br />
7. Simpson, J., “European Securitization”, presentation at the Pan-European <strong>Mortgage</strong><br />
<strong>Market</strong> 2000 Conference, Barcelona, September 2000.<br />
Contacts<br />
Countrywide <strong>International</strong> Consulting Services<br />
1 9 7
1. Irish <strong>Mortgage</strong> and Savings Association<br />
Heritage House<br />
23 St. Stephen's Green<br />
Dublin 2.<br />
Ireland<br />
Tel: 353.1.676.6333<br />
Fax: 353.1.661.8622<br />
Email: mortgage@indigo.ie<br />
Countrywide <strong>International</strong> Consulting Services<br />
1 9 8
Italy<br />
Economic Background<br />
Year Exchange Rate<br />
Lire/US$<br />
Consumer Price<br />
Index<br />
Countrywide <strong>International</strong> Consulting Services<br />
Change In<br />
Consumer Prices<br />
Nominal GDP<br />
(Millions)<br />
Lire US$<br />
Nominal GDP<br />
(Millions)<br />
1990 1,130 78.27 6.50 1,310,660,000 1,159,722<br />
1991 1,151 83.20 6.30 1,427,570,000 1,240,222<br />
1992 1,471 87.43 5.08 1,502,490,000 1,021,504<br />
1993 1,704 91.34 4.48 1,550,300,000 909,816<br />
1994 1,630 95.02 4.03 1,638,670,000 1,005,479<br />
1995 1,585 100.00 5.24 1,772,250,000 1,118,336<br />
1996 1,531 103.97 3.97 1,872,630,000 1,223,485<br />
1997 1,759 106.09 2.04 1,950,680,000 1,108,851<br />
1998 1,653 108.17 1.96 2,034,560,000 1,230,754<br />
1999 1,926 109.96 1.66 2,063,043,840 1,071,155<br />
Source: IMF, Morgan Stanley, Economist<br />
GDP growth in 1999 was weak (1.4%), and Italy continued to under-per<strong>for</strong>m the<br />
Euroland average (by 0.8 percentage points). This continued the trend throughout the<br />
1990s. However, there are signs of improvement. In the second half of 1999, Italy grew<br />
at an annualized rate of 3%, and early 2000 data suggested a continued recovery. Exports<br />
are leading the recovery, growing at a 15% annualized rate since the second quarter of<br />
1999. Investment climate was also favorable; however, private consumption remains<br />
weak. Inflation has been declining steadily during the decade but has also begun to creep<br />
up, driven mainly by the increase in oil prices. Italy has substantially liberalized portions<br />
of the economy, such as telecoms and utilities. In addition, wage demands remain<br />
moderate, reflecting the Social Pact agreed to at the end of 1998. This agreement,<br />
between the government, business and unions, states that Euroland inflation will be the<br />
benchmark <strong>for</strong> future wage agreements. Unemployment remains high at 11.4%, but it<br />
was <strong>for</strong>ecasted to fall to the 10.5% range in 2000.<br />
<strong>Housing</strong> <strong>Market</strong><br />
There were 26,300,000 dwelling units (1995) in Italy, with a home ownership rate of<br />
78%. The population was 57.5 million (1997). The housing market has been relatively<br />
stagnant in recent years, reflecting the slow growth in the economy as a whole. In 1998,<br />
the number of transactions was the highest since 1991. The housing market began to<br />
recover in 1999, reflecting low interest rates, a fiscal incentive <strong>for</strong> new construction and<br />
first time buyer demand. The typical price <strong>for</strong> a 150m2 and 100m2 flat at the end of 1999<br />
was 127,000 Euro.<br />
Year <strong>Housing</strong> Starts <strong>Housing</strong><br />
Completions<br />
Permits Issued Transactions<br />
Involving<br />
Dwellings<br />
House Price Index<br />
All Dwelling Units<br />
1992 211,526 277,627 48,734 465,373 100<br />
1 9 9
1993 188,595 282,087 43,458 501,891 112<br />
1994 176,664 259,252 44,141 495,178 119<br />
1995 41,828 502,500 120<br />
1996 483,800 116<br />
1997 155,626 34,910 523,600 118<br />
1998 567,340 118<br />
Source: EMF<br />
<strong>Mortgage</strong> <strong>Market</strong><br />
Italy has the seventh largest mortgage market in Europe, with an outstanding balance of<br />
$94 billion at the end of 1999 third quarter. Italy’s mortgage market is particularly small,<br />
relative to the size of its economy with a mortgage debt to GDP ratio of only 9%. The<br />
small size reflects a legacy of high interest rates, weak legal status of the mortgage, nonconsumer-oriented<br />
banks and a strong savings tradition.<br />
Italy’s mortgage market registered strong growth in 1998 (in excess of 17%), and 1999<br />
was a continuation of this pattern. The historically low interest rates are a major factor in<br />
this growth. In addition, commercial banks have “rediscovered” mortgages, and in 1998<br />
they launched strong advertising campaigns and fierce price competition. <strong>Mortgage</strong> debt<br />
outstanding has grown by more than 14% per year over the past 2 years. As a result, the<br />
mortgage debt-to-GDP ratio, the lowest in Europe outside of Greece, has increased from<br />
7 to 9 percent.<br />
Year Outstanding <strong>Mortgage</strong><br />
Debt/GDP<br />
<strong>Mortgage</strong> Debt<br />
Outstanding<br />
Mil L<br />
Countrywide <strong>International</strong> Consulting Services<br />
New Originations Net<br />
Mil L<br />
New Originations<br />
Gross Mil L<br />
1991 5.4% 76,762,662 11,189,731<br />
1992 5.3% 78,600,897 10,667,866<br />
1993 6.1% 94,406,150 8,158,465<br />
1994 6.1% 99,769,172 5,672,770<br />
1995 7.6% 135,227,991 -<br />
1996 7.5% 140,231,127 6,422,217 33,296,030<br />
1997 7.3% 144,363,654 8,303,327 40,387,784<br />
1998 8.1% 164,536,399 18,645,722 51,402,561<br />
1999* 9.0% 188,136,562 29,823,826 55,758,348<br />
*end of 3rd quarter; Source: EMF - -<br />
The legal and regulatory system may be a deterrent to rapid expansion. Foreclosure can<br />
take 5-7 years if contested by the borrower. However, a new law comes into <strong>for</strong>ce in<br />
2000 that can accelerate the legal process (maximum 2 years) by reducing the number of<br />
steps. The maximum LTV <strong>for</strong> bank mortgages is 80%, and only purchase mortgages<br />
receive a 50% risk weight (refinanced loans have a 100% risk weight).<br />
Like most European countries, Italy is heavily over-banked (970 banks with over 24,000<br />
outlets) and dominated by retail-funded depositories. The top five mortgage lenders are<br />
estimated to have a combined market share of 45%. Until the end of 1993, only<br />
2 0 0
specialized institutions were allowed to make long term loans. This restriction was<br />
dropped, and most specialized institutions have been merged into commercial and savings<br />
banks. Until 1998, mortgage lending was not a priority area <strong>for</strong> most banks.<br />
The typical maturity of a mortgage loan is 10-15 years, and the average LTV <strong>for</strong><br />
residential mortgage loans is 50%. Lenders offer both fixed and variable rate loans.<br />
Variable rate loans are tied to a reference rate published by the Bank of Italy. Fixed rate<br />
mortgage rates rose to 6.1% by the end of 1999.<br />
Interest Rates <strong>Mortgage</strong> Rates<br />
Gov't Bond<br />
Yields<br />
Year Money <strong>Market</strong> ie Deposit Fixed (#yrs.) Variable Long-Term Govt<br />
Interbank<br />
Bond Yield<br />
1990 12.38% 6.80% 14.90% 14.70% 11.51%<br />
1991 12.21% 6.64% 14.40% 13.50% 13.18%<br />
1992 14.02% 7.11% 15.80% 18.00% 13.27%<br />
1993 10.20% 7.79% 11.30% 11.30% 11.31%<br />
1994 8.51% 6.21% 11.10% 11.20% 10.56%<br />
1995 10.46% 6.45% 12.80% 11.60% 12.21%<br />
1996 8.82% 6.49% 9.10% 9.40% 9.40%<br />
1997 6.88% 4.83% 7.20% 7.90% 6.86%<br />
1998 4.99% 3.16% 5.50% 4.90%<br />
1999 2.95% 1.61% 6.10%<br />
Source: EMF, IMF<br />
Loans are funded primarily with retail deposits in Italy. The Bank of Italy has rules on<br />
asset-liability matching <strong>for</strong> banks that constrain the fixed rate lending by lenders with a<br />
large proportion of assets in mortgages. A securitization law was passed in April 1999,<br />
and it is expected to be a competitive source of finance.<br />
All mortgages in Italy are funded by deposits. Legislation passed in April 1999 introduced<br />
regulations <strong>for</strong> securitization and a framework <strong>for</strong> structures such as special purpose<br />
vehicles. The largest European ABS transaction in 1999 was a $4.7 billion transaction<br />
launched by INPS, the main Italian Social Security institution. The collateral consists of<br />
contributions due to INPS in arrears.<br />
Policy Developments<br />
A law adopted in July 1999 requires loan contracts to stipulate the method of calculating<br />
prepayment penalties. Tax deductibility has been extended to interest paid on renegotiated,<br />
(refinanced) first mortgage loans.<br />
Sources and References<br />
1. European <strong>Mortgage</strong> Federation, <strong>Mortgage</strong> and Property <strong>Market</strong>s in 1999, Brussels<br />
2000 www.hypo.org<br />
2. European <strong>Mortgage</strong> Federation, Hypostat 1988-1998, Brussels 1999<br />
3. IMF: <strong>International</strong> Financial Statistics, 2000<br />
Countrywide <strong>International</strong> Consulting Services<br />
2 0 1
4. Moodys Structured <strong>Finance</strong>: 1999 Year in Review and 2000 Outlook, February 2000<br />
www.moodys.com<br />
5. Morgan Stanley Dean Witter, Inside the Global Economy, May 2000.<br />
www.msdw.com<br />
6. Credit Suisse First Boston, “Euro-11 Special: <strong>Housing</strong> Matters”, Economics Research<br />
April 2000 www.csfb.com<br />
Contacts<br />
1. Associazione Bancaria Italiana ABI<br />
Piazza del Gesù, 49<br />
00186 Roma (Italy)<br />
Tel: +39-06-67671<br />
Fax: +39-06-6767457<br />
Email: abi@abi.it<br />
Countrywide <strong>International</strong> Consulting Services<br />
2 0 2
Luxembourg<br />
Economic Background<br />
Year Exchange Rate<br />
currency/US$<br />
Consumer Price<br />
Index<br />
Countrywide <strong>International</strong> Consulting Services<br />
Change In<br />
Consumer Prices<br />
Francs US$<br />
Nominal GDP<br />
(Billions)<br />
Nominal GDP<br />
(Millions)<br />
1990 33.42 87.14 3.70% 359.02 10.74<br />
1991 34.15 89.85 3.12% 389.92 11.42<br />
1992 33.18 92.69 3.15% 417.79 12.59<br />
1993 36.11 96.00 3.58% 456.80 12.65<br />
1994 31.84 98.12 2.20% 498.59 15.66<br />
1995 29.42 100.00 1.92% 518.80 17.63<br />
1996 32.01 101.39 1.39% 546.30 17.07<br />
1997 36.92 102.78 1.37% 587.04 15.90<br />
1998 34.57 103.77 0.96% 631.06 18.25<br />
1999 104.81 1.00%<br />
Source: IMF<br />
Luxembourg has a stable, high-income economy that features moderate growth, low<br />
inflation, and low unemployment. The industrial sector, until recently dominated by steel,<br />
has become increasingly more diversified to include chemicals, rubber, and other<br />
products. During the past decades, growth in the financial sector has more than<br />
compensated <strong>for</strong> the decline in steel. Services, especially banking, account <strong>for</strong> a growing<br />
proportion of the economy. Luxembourg has especially close trade and financial ties to<br />
Belgium and the Netherlands, and as a member of the EU, Luxembourg enjoys the<br />
advantages of the open European market.<br />
<strong>Housing</strong> <strong>Market</strong><br />
There were 145,000 dwelling units in Luxembourg, 72% of which are owner-occupied.<br />
The population was 424,000 (1997).<br />
Year Permits Issued Transactions<br />
Involving<br />
Dwellings<br />
Construction<br />
Cost Index*<br />
1992 4,316 3,667 112<br />
1993 4,022 3,030 114<br />
1994 2,744 115<br />
1995 2,797 117<br />
1996 3,411 118<br />
1997 122<br />
1998 125<br />
1990=100; Source EMF<br />
2 0 3
<strong>Mortgage</strong> <strong>Market</strong><br />
Millions Francs<br />
Year <strong>Mortgage</strong> Debt<br />
Outstanding<br />
New Originations<br />
Net<br />
Countrywide <strong>International</strong> Consulting Services<br />
New Originations<br />
Gross<br />
Outstanding <strong>Mortgage</strong><br />
Debt/GDP<br />
1991 1,058<br />
1992 1,088<br />
1993 990<br />
1994 123,335 - 41,961 25.7%<br />
1995 134,605 10,903 44,273 26.2%<br />
1996 137,917 3,288 46,908 25.7%<br />
1997 147,364 9,457 50,956 26.0%<br />
Source: EMF<br />
Approximately 80% of mortgage credit is supplied to private households by universal<br />
banks. The main lender in Luxembourg is a public bank, the “Banque et Caisse<br />
d’Epargne de l’Etat”, which has an approximate market share of 60%. Private,<br />
commercial banks, cooperative banks and pension funds share the remaining market.<br />
Loans are funded by deposits.<br />
The vast majority of mortgage loans in Luxembourg are variable interest rate loans.<br />
Stable, long-term rates encouraged increased issuance of fixed rate mortgages in recent<br />
years. There is a growing demand <strong>for</strong> loans with 5 to 10 year fixed interest periods.<br />
Prepayment penalties exist between interest adjustment periods.<br />
Deposit Fixed (#yrs.) Variable<br />
Gov't Bond<br />
Yields<br />
Long-Term<br />
Interest Rates <strong>Mortgage</strong> Rates<br />
Year Money <strong>Market</strong> i.e.<br />
Interbank<br />
1990 9.67% 6.00% 9.50% 8.30% 8.51%<br />
1991 9.10% 6.00% 9.50% 8.30% 8.15%<br />
1992 8.93% 6.00% 9.50% 8.30% 7.90%<br />
1993 8.09% 5.33% 9.50% 7.00% 6.93%<br />
1994 5.16% 5.00% 7.50% 6.50% 6.38%<br />
1995 4.26% 5.00% 7.00% 6.50% 6.05%<br />
1996 3.29% 3.54% 7.00% 6.50% 5.21%<br />
1997 3.36% 3.46% 6.00% 5.50% 5.39%<br />
1998 3.48% 3.31% 6.00% 5.50% 5.29%<br />
1999 N/A N/A N/A N/A N/A<br />
Source: EMF, IMF<br />
Sources and References<br />
1. European <strong>Mortgage</strong> Federation, <strong>Mortgage</strong> and Property <strong>Market</strong>s in 1999, Brussels<br />
2000<br />
2. European <strong>Mortgage</strong> Federation, Hypostat 1988-1998, Brussels 1999<br />
3. CIA, The World Factbook 2000<br />
2 0 4
4. IMF: <strong>International</strong> Financial Statistics, 2000<br />
Countrywide <strong>International</strong> Consulting Services<br />
2 0 5
Netherlands<br />
Economic Background<br />
Year Exchange<br />
Rate<br />
NLG/US$<br />
Consumer<br />
Price<br />
Index<br />
Countrywide <strong>International</strong> Consulting Services<br />
Change In<br />
Consumer<br />
Prices<br />
NLG US$<br />
Nominal GDP<br />
(Millions)<br />
Nominal GDP<br />
(Millions)<br />
1992 1.81 93.99 3.18% 566,100 312,762<br />
1993 1.94 95.31 2.58% 579,040 291,804<br />
1994 1.74 98.11 2.80% 608,420 332,782<br />
1995 1.60 100.00 1.92% 634,740 380,263<br />
1996 1.74 102.02 2.02% 661,830 364,793<br />
1997 2.02 104.22 2.16% 703,390 327,639<br />
1998 1.89 106.28 1.98% 750,550 372,164<br />
1999 2.19 108.63 2.21% 777,570 342,717<br />
Source: IMF, Economist, Morgan Stanley<br />
The Netherlands has been the strongest growing economy in Euroland in recent years.<br />
GDP grew at 3.6-3.7% in 1998, and 1999 showed no signs of abating. Stronger export<br />
growth was expected to make up <strong>for</strong> slightly slower domestic demand growth. Consumer<br />
spending growth, which outpaced disposable income growth <strong>for</strong> some years, should cool<br />
down in 2000 as should wealth effects from soaring stock and housing markets diminish.<br />
The economy is in some danger of overheating. Unemployment remains below 3% and<br />
the number of job vacancies is rising above the number of unemployment. Inflation was<br />
quite low during the 1990s. Upward pressure on wages, along with a projected increase in<br />
VAT and energy taxes, is likely to push inflation above 3%. The hot property market is<br />
another source of inflationary pressure.<br />
<strong>Housing</strong> <strong>Market</strong><br />
There were 6,388,000 dwelling units in the Netherlands of which 52% were owneroccupied<br />
(1999). The population was 15.5 million. Holland is the most densely populated<br />
country in the world except <strong>for</strong> Hong Kong, and most journeys take less than two hours<br />
by car. This reduces the effect of changes in local, economic conditions on borrowers, as<br />
they can move jobs without having to move homes. The owner-occupied share, while<br />
traditionally low, has been rising as a result of government policy and rising prices. The<br />
increase in home ownership has been driven by the Dutch government, which has<br />
provided state guarantees <strong>for</strong> low-income homeowners, and they have allowed interest<br />
payable on mortgages to be tax deductible.<br />
Both the high level of demand <strong>for</strong> owner-occupied housing and limited production of new<br />
dwellings because of the scarcity of suitable building sites, have contributed to<br />
extraordinary rates of house price inflation over the past 4 years. <strong>Housing</strong> starts declined<br />
by 19% from their decade high in 1994. However, housing transactions were up 30<br />
percent or more from their mid-1990s levels. The increase in house prices is expected to<br />
2 0 6
moderate, however (down to single digit increases). The typical price <strong>for</strong> a 150m2 and<br />
100m2 flat at the end of 1999 was 172,000 Euro.<br />
Year <strong>Housing</strong> Starts <strong>Housing</strong><br />
Completions<br />
Countrywide <strong>International</strong> Consulting Services<br />
Permits Issued Transactions<br />
Involving<br />
Dwellings<br />
House Price<br />
Index New*<br />
House Price<br />
Index Existing*<br />
1992 85,100 86,200 87,000 245,300 108 112<br />
1993 86,000 83,689 89,500 198,000 111 122<br />
1994 102,929 87,369 107,764 215,000 113 131<br />
1995 95,918 93,836 98,405 225,000 118 137<br />
1996 95,817 88,934 102,119 260,000 122 151<br />
1997 98,002 92,315 101,501 281,000 125 163<br />
1998 85,871 90,516 87,673 280,000 129 181<br />
1999 83,400 78,625 84,201 292,000 133 216<br />
1990=100; Source: Hypostat<br />
<strong>Mortgage</strong> <strong>Market</strong><br />
The Dutch mortgage market is the fourth largest in Europe with approximately $245<br />
billion outstanding at the end of 1999. However, in terms of new originations, it is the<br />
second largest, with gross advances of $88 billion in 1999, a growth of 28%. Growth in<br />
recent years has been fueled by a combination of low interest rates, rising house prices<br />
(fueling an investment demand <strong>for</strong> housing) and a generous tax treatment of<br />
homeownership (full deductibility of mortgage interest and introduction of tax<br />
advantaged endowment and investment-linked mortgages). The mortgage debt-to-GDP<br />
ratio is now the highest in the EU at 74%.<br />
Year Outstanding <strong>Mortgage</strong><br />
Debt/GDP<br />
<strong>Mortgage</strong> Debt<br />
Outstanding<br />
(NLG mil)<br />
New Originations<br />
Net<br />
(NLG mil)<br />
New Originations<br />
Gross<br />
(NLG mil)<br />
1991 41.1% 222,781 13,811 35,957<br />
1992 43.2% 244,034 15,329 43,221<br />
1993 45.4% 263,533 26,010 54,979<br />
1994 48.0% 293,776 29,176 72,784<br />
1995 50.3% 317,940 30,514 65,391<br />
1996 54.2% 356,514 44,443 91,177<br />
1997 60.1% 420,759 56,298 118,208<br />
1998 69.6% 489,592 60,444 155,553<br />
1999 73.9% 561,800 73,540 201,236<br />
Source: Hypostat<br />
The Dutch mortgage market is highly concentrated, and it is dominated by retail-funded<br />
depository institutions, which accounted <strong>for</strong> 85% of the outstanding residential loans. The<br />
remaining 15% of the market are funded by insurance companies and pension funds. At<br />
the end of 1998, the approximate market shares of major lenders were Rabobank 23%,<br />
Abn-Amro 17%, and ING 16% (including Postbank). Bouwfonds is the largest developer<br />
of owner-occupied houses in the Netherlands. One of the activities of Bouwfonds<br />
2 0 7
concerns the origination and servicing of mortgage loans. Their mortgage origination and<br />
servicing subsidiary is Stater, which services the Bouwfonds loans and sub-services<br />
approximately 25% of the Dutch market. In late 1999, Abn-Amro announced that it was<br />
purchasing Bouwfonds. Also picking up share of the Dutch market is The Bank of<br />
Scotland, which has started an Internet lending business, Eubos, in the Netherlands.<br />
The standard mortgage instrument in the Netherlands is a renegotiable rate instrument.<br />
This instrument amortizes over a 25-30 year period with periodic rate adjustments (e.g.,<br />
1-10 years). During the period the rate is fixed, early repayment is subject to a<br />
prepayment penalty, but the borrower can refinance without penalty at the end of the<br />
fixed rate period. Because of the low level of interest rates (5.5% at the end of 1999),<br />
longer fixed rate periods up to or in excess of 10 years are in demand. Until 1995, the<br />
annuity mortgage loan was the most popular. Since 1995, the endowment or pension<br />
mortgage (non-amortizing mortgage with repayment from proceeds of an insurance<br />
policy) has become the most popular, reflecting a favorable fiscal treatment. Recently<br />
there has been a proliferation of investment-based mortgages. Rates <strong>for</strong> 5-year renegotiable<br />
rate loans reached a decade low of 4.4% in mid-1999 be<strong>for</strong>e increasing to<br />
5.5% by the end of the year.<br />
Interest Rates <strong>Mortgage</strong> Rates<br />
Year Money<br />
<strong>Market</strong> i.e.<br />
Interbank<br />
Countrywide <strong>International</strong> Consulting Services<br />
Deposit Fixed (#yrs.) Variable Long-term Govt<br />
Bond Yield<br />
1990 N/A 3.31% 9.80% 9.60% 10.08%<br />
1991 N/A 3.18% 9.70% 9.50% 9.17%<br />
1992 N/A 3.20% 8.70% 8.50% 9.11%<br />
1993 N/A 3.11% 6.90% 6.70% 7.72%<br />
1994 5.75% 4.70% 8.20% 8.00% 8.19%<br />
1995 5.45% 4.40% 6.50% 6.30% 8.30%<br />
1996 5.74% 3.54% 6.00% 5.80% 7.48%<br />
1997 N/A 3.18% 6.20% 6.00% 6.49%<br />
1998 3.07% 3.10% 6.00% N/A 4.99%<br />
1999 3.21% 2.74% 5.50% N/A 4.92%<br />
Source: EMF, IMF<br />
<strong>Mortgage</strong> funding in the Netherlands is mainly by deposits. As mortgage banks have<br />
been subsumed into commercial banks, the issuance of mortgage bonds has ceased. MBS<br />
issuance started in 1996 with an issuance by Fortis, and it has continued to grow in<br />
importance. Driven by ABN AMROs Euro 2.5 billion issuance, 1999 was the most active<br />
in terms of issuance. ABN AMRO is the largest issuer of MBS in the Netherlands.<br />
<strong>Mortgage</strong> Bonds (mil NLG)<br />
Year Issued Outstanding<br />
1997 651 3,588<br />
1998 757 3,445<br />
1999 0 2,600<br />
2 0 8
<strong>Mortgage</strong>-Backed Securities (mil NLG)<br />
Year Issued Outstanding<br />
1997 1,976 1,976<br />
1998 2,016 4,029<br />
1999 5,090<br />
Source: EMF, Merrill Lynch<br />
Policy Developments<br />
The government of the Netherlands is preparing a tax re<strong>for</strong>m package that will take effect<br />
in 2001. The current principle of full deductibility of mortgage interest will be replaced<br />
by a system whereby deductibility will be limited to interest on mortgage loans taken out<br />
<strong>for</strong> the purpose of owner-occupation.<br />
Sources and References<br />
1. European <strong>Mortgage</strong> Federation, <strong>Mortgage</strong> and Property <strong>Market</strong>s in 1999, Brussels<br />
2000 www.hypo.org<br />
2. European <strong>Mortgage</strong> Federation, Hypostat 1988-1998, Brussels 1999<br />
3. IMF: <strong>International</strong> Financial Statistics, 2000<br />
4. Merrill Lynch, European MBS: The Case of the Netherlands, September 1999<br />
www.ml.com<br />
5. Morgan Stanley Dean Witter, Inside the Global Economy, May 2000.<br />
www.msdw.com<br />
6. Sources:Hypostat 1987-1997<br />
7. FitchICBA, “Dutch Default Model”, May 1997 www.FitchICBA.com<br />
8. Credit Suisse First Boston, “Euro-11 Special: <strong>Housing</strong> Matters”, Economics Research<br />
April 2000 www.csfb.com<br />
Contacts<br />
1. Netherlands Banking Association<br />
Email: algermeen@nvb.nl<br />
Countrywide <strong>International</strong> Consulting Services<br />
2 0 9
Norway<br />
Economic Background<br />
Year Exchange<br />
Rate<br />
currency/US$<br />
Consumer<br />
Price<br />
Index<br />
Countrywide <strong>International</strong> Consulting Services<br />
Change In<br />
Consumer<br />
Prices<br />
Kroner US$<br />
Nominal GDP<br />
(Billions)<br />
Nominal GDP<br />
(Billions)<br />
1990 6.26 88.92 4.11% 722.71 115.45<br />
1991 6.48 91.96 3.42% 763.41 117.81<br />
1992 6.21 94.12 2.34% 784.93 126.40<br />
1993 7.09 96.26 2.27% 823.70 116.18<br />
1994 7.06 97.60 1.40% 867.56 122.88<br />
1995 6.34 100.00 2.46% 928.75 146.49<br />
1996 6.45 101.26 1.26% 1020.05 158.15<br />
1997 7.07 103.87 2.58% 1084.79 153.44<br />
1998 7.55 106.22 2.26% 1100.77 145.80<br />
1999 7.80 108.69 2.33% N/A N/A<br />
Source: IMF<br />
After 5 years of robust growth, Norway’s GDP, roughly 20% of which is oil, gas and<br />
shipping production, expanded by a mere 0.9% in 1999. Although the slowdown was<br />
broad-based, a sharp contraction in offshore and oil investments was a major drag on<br />
demand. Prospects <strong>for</strong> 2000 look better. Private and public consumption was expected<br />
to rise at growth rates of more than 2%. A significant fall in interest rates (a cut of 250<br />
basis points to 5.5%) will help stimulate the economy. Export growth was also <strong>for</strong>ecasted<br />
to rise <strong>for</strong> the year.<br />
Strong growth has been good <strong>for</strong> the labor market. Unemployment has fallen to 3.2% in<br />
both 1998 and 1999. A record number of people in the work <strong>for</strong>ce have created a very<br />
tight labor market. This situation is expected to be maintained, and it will keep<br />
household, financial positions strong. Average wage inflation in 1999 was estimated at<br />
5.1%, a 1.4 percentage point reduction from the previous year. The growth in consumer<br />
prices was 2.3% in 1999, the same growth rate as 1998 and close to the average of the<br />
1990s.<br />
<strong>Housing</strong> <strong>Market</strong><br />
There were 1,850,000 dwelling units in Norway, 76% owner-occupied. The population<br />
was 4.4 million. Demand in the housing market has been outstripping supply. House<br />
prices rose an average 17% on a national basis in 1999. In choice locations prices have<br />
risen even more. This trend reflects favorable income and employment growth, and it is<br />
expected to continue. The 2ndQ 1999 average price per m2 <strong>for</strong> all structures was<br />
NOK10000. <strong>Housing</strong> starts have fallen <strong>for</strong> 3 consecutive years and were 15% below their<br />
decade high in 1999.<br />
2 1 0
Year <strong>Housing</strong> Starts <strong>Housing</strong><br />
Completions<br />
Countrywide <strong>International</strong> Consulting Services<br />
Transactions<br />
Involving<br />
Dwellings<br />
Construction Cost<br />
Index**<br />
Existing House<br />
Price Index**<br />
1992 15,600 17,789 70,700 104 95<br />
1993 16,194 15,897 83,800 104 96<br />
1994 21,240 17,836 110,100 107 108<br />
1995 19,721 18,849 110,500 113 117<br />
1996 18,743 17,443 112,400 114 126<br />
1997 21,259 18,416 120,400 117 138<br />
1998 19,646 20,659 113,000 120 150<br />
1999* 18,000 19,000 117,261 123 175<br />
*estimated; ** 1990=100 <strong>for</strong> construction, 1991=100 <strong>for</strong> existing house price; Source: EMF<br />
<strong>Mortgage</strong> <strong>Market</strong><br />
There is strong and increasing competition in the residential mortgage market in Norway.<br />
From 1998 to 1999 the volume of residential mortgage lending increased by 7.5%. By<br />
the end of 1999 37% of all lending in Norway was <strong>for</strong> residential housing.<br />
There has been considerable structural change in the Norwegian financial market in<br />
recent years. Mergers and acquisitions have created financial conglomerates that account<br />
<strong>for</strong> an increasing proportion of the supply of financial services. Notably in 1999, <strong>Union</strong><br />
Bank of Norway and Gjensidige merged, as did Den Norske Bank and Postbanken. Most<br />
of the <strong>for</strong>mer, independent mortgage institutions have been bought by banks or<br />
trans<strong>for</strong>med into banks. Commercial banks, savings banks and state banks now dominate<br />
the market. At the end of 1998, commercial and savings banks granted 37% and 43% of<br />
total residential mortgage credit respectively. State banks and mortgage institutions<br />
accounted <strong>for</strong> 14 percent and 2 percent of the volume.<br />
Year <strong>Mortgage</strong> Debt<br />
Outstanding<br />
NOKr millions US $ millions<br />
New Originations<br />
Net<br />
Outstanding<br />
<strong>Mortgage</strong><br />
Debt/GDP<br />
<strong>Mortgage</strong> Debt<br />
Outstanding<br />
New Originations<br />
Net<br />
1992 44,999 439 46.1%<br />
1993 44,691 -94 45.1%<br />
1994 46,405 1,401 44.8% 386,359 11,664<br />
1995 48,659 2,188 43.4% 404,541 18,191<br />
1996 52,966 2,743 42.7% 426,636 22,095<br />
1997 56,460 3,769 41.9% 457,158 30,518<br />
1998 55,420 3,889 44.7% 491,653 34,501<br />
1999 65,422 4,548 528,381 36,732<br />
Source: EMF<br />
<strong>Mortgage</strong> lenders offer both fixed-rate and reviewable rate loans. Reviewable rate loans<br />
have the dominant market position. Normal loan-to-value ratios <strong>for</strong> residential properties<br />
are 80%, and the typical maturity is 15 to 20 years. Average interest rates <strong>for</strong> mortgage<br />
loans with reviewable interest rates decreased to 7.1% at the end of 1999, compared to<br />
9.5% at the end of 1998. Bank interest margins, measured as the difference between<br />
2 1 1
interest rates on lending and deposits, peaked in 1989 at 6.3 percentage points. By the<br />
end of the fourth quarter of 1999, the margin had shrunk to 3.2 percentage points.<br />
Competitive pressure on margins is expected to continue in the years ahead.<br />
Interest Rates<br />
Year<br />
3-Month<br />
Interbank<br />
Deposit<br />
Countrywide <strong>International</strong> Consulting Services<br />
<strong>Mortgage</strong> Rates<br />
Reviewable<br />
rate*<br />
Reviewable<br />
rate**<br />
Gov't Bond<br />
Yields<br />
Long-Term<br />
1990 11.54% 9.68% 13.10% 14.30% 10.72%<br />
1991 10.56% 9.60% 13.10% 13.90% 9.87%<br />
1992 11.83% 10.69% 12.50% 13.80% 9.78%<br />
1993 7.27% 5.51% 7.40% 8.60% 6.52%<br />
1994 5.85% 5.21% 8.10% 8.10% 7.13%<br />
1995 5.48% 4.95% 6.70% 7.40% 6.82%<br />
1996 4.90% 4.15% 5.90% 6.20% 5.94%<br />
1997 3.73% 3.63% 5.90% 5.60% 5.13%<br />
1998 5.79% 7.24% 7.50% 9.50% 5.35%<br />
1999 6.87% 7.10% 5.38%<br />
* mortgage institutions rate fixed <strong>for</strong> 2 years ** commercial and savings banks, loans to the public sector;<br />
Source: EMF<br />
Banks use deposits as their main source of funding. However, growth in lending in recent<br />
years has exceeded growth in deposits placing pressure on banks to raise funds in the<br />
capital markets. This pressure was at least temporarily alleviated in the second half of<br />
1999. By the end of the year, deposits financed slightly less than 70% of the banks<br />
lending. Private mortgage institutions fund themselves mainly on the bond market or<br />
receive funding from a mother bank. The state banks borrow directly from the<br />
government. <strong>Mortgage</strong> bond issuance has increased each of the last 2 years.<br />
<strong>Mortgage</strong> Bonds (Millions of NoKr)<br />
Year Issued Outstanding<br />
1994 14,404 51,487<br />
1995 8,879 50,215<br />
1996 6,984 67,275<br />
1997 5,919 70,898<br />
1998 8,117 81,617<br />
1999 11,767 87,985<br />
Source: EMF<br />
Policy Developments<br />
In June 1999, a new Act on financial transactions was adopted to govern relationships between<br />
consumers and financial institutions, particularly as relates to provision of in<strong>for</strong>mation and<br />
content of agreements.<br />
Sources and References<br />
1. European <strong>Mortgage</strong> Federation, <strong>Mortgage</strong> and Property <strong>Market</strong>s in 1999, Brussels 2000<br />
www.hypo.org<br />
2 1 2
2. European <strong>Mortgage</strong> Federation, Hypostat 1988-1998, Brussels 1999<br />
3. IMF: <strong>International</strong> Financial Statistics, 2000<br />
4. Morgan Stanley Dean Witter, Inside the Global Economy, May 2000. www.msdw.com<br />
Contacts<br />
1. Norwegian Financial Services Association,<br />
Postal address:<br />
Postboks 2473 Solli<br />
0202 Oslo<br />
Office address:<br />
Hansteensgt. 2 Oslo<br />
Tel: + 47 - 23 28 42 00<br />
Fax: + 47 - 23 28 42 01<br />
Email: fnh@fnh.no<br />
http:// www.fnh.no<br />
Countrywide <strong>International</strong> Consulting Services<br />
2 1 3
PORTUGAL<br />
Economic Background<br />
Year Exchange Rate<br />
PE/US$<br />
Consumer Price<br />
Index<br />
Countrywide <strong>International</strong> Consulting Services<br />
Change In<br />
Consumer Prices<br />
PE US$<br />
Nominal GDP<br />
(Millions)<br />
Nominal GDP<br />
(Millions)<br />
1990 133.60 70.65 13.37 9,855,100 73,766<br />
1991 134.18 78.67 11.35 11,315,200 84,329<br />
1992 146.76 85.71 8.94 12,759,000 86,938<br />
1993 176.81 91.54 6.80 13,463,100 76,144<br />
1994 159.09 96.04 4.92 14,628,900 91,954<br />
1995 149.41 100.00 4.12 15,817,700 105,868<br />
1996 156.39 103.12 3.12 16,803,600 107,447<br />
1997 183.33 105.35 2.16 17,905,200 97,667<br />
1998 171.83 108.27 2.78 19,245,700 112,004<br />
1999 110.80 2.34<br />
Source: IMF<br />
The current growth rate of the Portuguese economy is quite strong, driven mainly by<br />
export growth. The economy grew 3.5% in 1998, 3.2% in 1999, and growth of 4.2% is<br />
<strong>for</strong>ecast in 2000. Domestic demand is showing signs of a slowdown, which will<br />
somewhat offset the impact of export demand. Economic growth is creating some<br />
inflationary pressure, but the inflation rate was low at 2.4% in 1999. The unemployment<br />
rate has been falling, from 6.7% in 1998 to 4.4% in 1999.<br />
<strong>Housing</strong> <strong>Market</strong><br />
There were 4,181,000 dwelling units in Portugal. 66% of these were owner-occupied.<br />
The population was 9.96 million (1997). <strong>Housing</strong> activity picked up in the 1997-99 time<br />
period, reflecting the buoyant economy and falling interest rates. <strong>Housing</strong> starts reached a<br />
high <strong>for</strong> the decade in 1998. Construction costs have been rising sharply in recent years.<br />
The typical price <strong>for</strong> a 150m2 and 100m2 flat at the end of 1999 was 96,000 Euro.<br />
Year <strong>Housing</strong><br />
Completions<br />
Permits<br />
Issued<br />
Transactions<br />
Involving<br />
Dwellings<br />
Construction Cost<br />
Index<br />
House Price<br />
Index –<br />
All Dwellings<br />
1992 52,185 35,796 150,182 117<br />
1993 63,199 36,800 166,030 121 100<br />
1994 59,353 40,927 178,073 129 107<br />
1995 65,304 40,184 186,920 137 110<br />
1996 65,607 40,581 185,980 143 113<br />
1997 78,403 44,200 148 117<br />
1998 84,520 47,988 152 113<br />
Source: EMF<br />
<strong>Mortgage</strong> <strong>Market</strong><br />
2 1 4
The mortgage market in Portugal grew rapidly in the mid- to late 1990s. <strong>Mortgage</strong> debt<br />
outstanding grew by 24%, 27%, 26% and 35% in the years 1995-1998. As a result,<br />
mortgage debt-to-GDP, which had been quite low at 13.4% as late as 1993, was a<br />
respectable 33% by 1998. Reflecting a strong economy and record low interest rates,<br />
continued growth is expected. In 1997 there were 157,300 residential mortgage loans<br />
granted.<br />
Residential <strong>Mortgage</strong> <strong>Market</strong><br />
Year Outstanding <strong>Mortgage</strong><br />
Debt/GDP<br />
<strong>Mortgage</strong> Debt<br />
Outstanding<br />
Countrywide <strong>International</strong> Consulting Services<br />
New Originations<br />
Net<br />
New Originations<br />
Gross<br />
1991 11.3% 1,291,402 183,664 170,172<br />
1992 12.1% 1,571,932 213,668 201,935<br />
1993 13.4% 1,886,915 333,657 235,963<br />
1994 16.1% 2,348,945 462,071 355,907<br />
1995 18.8% 2,955,203 606,160 762,069<br />
1996 22.5% 3,735,202 779,920 1,016,539<br />
1997 26.3% 4,729,006 980,680 1,418,783<br />
1998 33.3% 6,403,596 1,674,626 1,925,429<br />
Source: EMF<br />
Universal banks dominate the market. The main lenders are Caixa Geral de Depositos,<br />
Credito Predial Portugues, Montepio Geral, Banco Gonsecas & Burnay Sa and Banco<br />
<strong>International</strong> de Credito. With deregulation, liberalization, and internationalization of<br />
banking, competition has grown in recent years in both the subsidized and non-subsidized<br />
sectors. A majority of the banking groups, which have <strong>for</strong>med in recent years, include a<br />
bank specialized in property finance.<br />
The typical mortgage has a maturity of 15 years and a maximum loan-to-value ratio of<br />
90%. The only instruments offered are variable rates with reference rates varying<br />
annually. <strong>Mortgage</strong> rates reached quite low levels (4.8%) by 1999, and competition was<br />
strong.<br />
Interest Rates <strong>Mortgage</strong> Rates<br />
Year Money <strong>Market</strong> i.e.<br />
Interbank<br />
Deposit Variable interest Long-term Govt. Bond<br />
1990 13.12% 13.99% 20.50% 18.55%<br />
1991 15.50% 14.80% 20.30% 18.27%<br />
1992 17.48% 14.59% 18.40% 15.38%<br />
1993 13.25% 11.06% 14.60% 12.45%<br />
1994 10.62% 8.37% 13.00% 10.83%<br />
1995 8.91% 8.38% 12.40% 10.34%<br />
1996 7.38% 6.32% 11.00% 7.25%<br />
1997 5.78% 4.56% 8.00% 5.48%<br />
1998 4.34% 3.37% 5.70% 4.30%<br />
1999 2.71% 2.41% 4.80%* 5.40%<br />
Source: EMF, IMF * third quarter<br />
2 1 5
<strong>Mortgage</strong> loans are mostly funded with deposits. There is a small mortgage bond market<br />
that saw Euro 49 million issued in 1997 reaching 99 million outstanding. A law passed in<br />
November 1999 introduced a securitization framework along with rules governing the<br />
setting up and activity of funds management companies.<br />
Policy Development<br />
Access to subsidies has been restricted in recent years. Discussions are underway<br />
concerning the regulation of over-indebtedness and mechanisms <strong>for</strong> simplifying contracts<br />
and regulating the involvement of notaries. A new regulation adopted in August 1999<br />
provided the framework <strong>for</strong> the use of electronic signatures and electronic documents.<br />
Sources and References<br />
1. European <strong>Mortgage</strong> Federation, <strong>Mortgage</strong> and Property <strong>Market</strong>s in 1999, Brussels<br />
2000 www.hypo.org<br />
2. European <strong>Mortgage</strong> Federation, Hypostat 1988-1998, Brussels 1999<br />
3. IMF: <strong>International</strong> Financial Statistics, 2000<br />
4. Morgan Stanley Dean Witter, Inside the Global Economy, May 2000.<br />
www.msdw.com<br />
5. Credit Suisse First Boston, “Euro-11 Special: <strong>Housing</strong> Matters”, Economics Research<br />
April 2000 www.csfb.com<br />
Countrywide <strong>International</strong> Consulting Services<br />
2 1 6
Spain<br />
Economic Background<br />
Year Exchange<br />
Rate<br />
Pesetas/US$<br />
Consumer<br />
Price<br />
Index<br />
Countrywide <strong>International</strong> Consulting Services<br />
Change In<br />
Consumer<br />
Prices<br />
Pesetas US$<br />
Nominal GDP<br />
(Millions)<br />
Nominal GDP<br />
(Millions)<br />
1990 101.93 77.75 6.72 50,145,200 491,957<br />
1991 103.91 82.36 5.93 54,927,300 528,605<br />
1992 102.38 87.24 5.92 59,105,000 577,310<br />
1993 127.26 91.23 4.57 60,952,600 478,961<br />
1994 133.96 95.53 4.72 64,811,500 483,812<br />
1995 124.69 100.00 4.68 69,780,100 559,629<br />
1996 126.66 103.56 3.56 73,743,300 582,215<br />
1997 146.41 105.60 1.97 77,896,600 532,044<br />
1998 149.40 107.54 1.83 82,650,400 553,216<br />
1999 165.00 110.02 2.31 85,708,465 519,445<br />
Source: IMF, Morgan Stanley<br />
The Spanish economy enjoyed another impressive year in 1999. GDP growth was 3%,<br />
only slightly below the 4% increase of 1998 and 1.5 percentage points higher than the<br />
Euroland average. The drivers were private consumption, which was up 4.5% in real<br />
terms, and construction, which was up 8.4%. Additional factors included strong<br />
employment growth (3.3%) and a significant cut in personal income taxes. Strong growth<br />
and higher oil prices have put some pressure on Spanish inflation recently. CPI inflation<br />
rose from 1.8% in 1998 to 2.3% in 1999, but it is expected to level off around 2.5% in<br />
2000. The unemployment rate remains high, but labor market re<strong>for</strong>ms have encouraged<br />
increased hiring. As a result the unemployment rate of 18.8% in 1998 fell to 15.9% in<br />
1999, and it is expected to decline another percentage point in 2000.<br />
<strong>Housing</strong> <strong>Market</strong><br />
With population in 1997 at 39,348,000, Spain is the 4 th largest EU country. Spain has one<br />
of the highest homeownership rates in Europe. 78% (1991) of 18,775,000 dwellings are<br />
owner-occupied. The construction sector has been particularly vibrant with housing starts<br />
in 1999 at an unprecedented level of 505,000 units. There are signs of slowdown,<br />
however. Construction costs are growing very quickly and delays in building and land<br />
acquisition are rising. In the second quarter of 1999, a total of 154,553 new homes were<br />
started, which was a year-on-year increase of 26.3% in the first six months of the year. In<br />
the whole of the first half, housing starts increased at a year-on-year rate of 28.4%, giving<br />
the highest volume of starts <strong>for</strong> the decade. Apartments accounted <strong>for</strong> nearly 70% of the<br />
starts in 1999.<br />
House prices rose by 12% in 1999, thus contributing to a rising inflation rate. The average<br />
price was of Ptas 129,855/square meter at the end of the first half of 1999, which was a<br />
year-on-year increase of 10%. Since the first quarter of 1998, when prices began to rise,<br />
2 1 7
housing appreciated by 12.4%. The typical price <strong>for</strong> a 150m2 and 100m2 flat at the end of<br />
1999 was 118,000 Euro. The price/income ratio at beginning of 1999 was 4.2.<br />
Year <strong>Housing</strong> Starts <strong>Housing</strong><br />
Completions<br />
Countrywide <strong>International</strong> Consulting Services<br />
Permits Issued Existing Dwelling<br />
Unit Price*<br />
New Dwelling Unit<br />
Price*<br />
1992 210,500 205,720 222,900 113 109<br />
1993 197,300 205,317 218,500 112 113<br />
1994 228,900 219,511 270,000 113 116<br />
1995 303,100 242,100 310,400 117 122<br />
1996 286,800 253,400 284,600 120 125<br />
1997 322,700 272,400 339,500 121 128<br />
1998 407,380 275,570 432,728 127 130<br />
1999 505,500 320,972 520,804 140 132<br />
1990=100; Source: EMF<br />
<strong>Mortgage</strong> <strong>Market</strong><br />
Despite a high homeownership rate, Spain has a relatively low rate of mortgage<br />
indebtedness, reflecting the fact that its economy and financial system were liberalized<br />
only at the beginning of the 1990s. The mortgage debt-to-GDP ratio was relatively low at<br />
24%, despite a high homeownership rate of 78%. But it has risen from 14% as late as<br />
1993. <strong>Mortgage</strong> debt accounted <strong>for</strong> 43% of private sector loans at the end of 1998. The<br />
market has been growing rapidly in recent years, and it now ranks as the fifth largest in<br />
Europe with outstanding balances of approximately $150 billion at the end of 1999. In<br />
1999, Spain had the fourth largest European level of mortgage originations at $40 billion.<br />
This was up 14% from the previous year. Growth has been fueled by low interest rates,<br />
high rates of mortgage prepayment and increased competition among retail lenders.<br />
Pesetas (millions)<br />
Year Outstanding <strong>Mortgage</strong><br />
Debt/GDP<br />
<strong>Mortgage</strong> Debt<br />
Outstanding<br />
New Originations<br />
Net<br />
New Originations<br />
Gross<br />
1991 15.1% 8,381,726 1,045,964 2,158,394<br />
1992 15.1% 9,001,483 949,627 2,145,786<br />
1993 14.0% 8,597,008 1,139,776 2,727,465<br />
1994 16.8% 10,933,433 1,915,193 3,042,216<br />
1995 18.0% 12,515,305 1,196,117 2,610,310<br />
1996 19.0% 13,865,133 1,926,281 3,418,420<br />
1997 22.0% 17,153,589 2,979,335 4,821,945<br />
1998 23.0% 21,224,168 3,974,983 5,939,155<br />
1999 24.0% 25,558,047 4,333,880 6,774,209<br />
Source: EMF<br />
Commercial and savings banks (Cajas de Ahorro) dominate mortgage lending in Spain.<br />
As of April 1999, the savings banks had a market share of 52.5%, and the commercial<br />
banks had a market share of 39.8%. The rest correspond to credit cooperatives (5%) and<br />
<strong>Mortgage</strong> Companies (2%). The market is relatively concentrated. At the end of 1998 the<br />
2 1 8
value of the top mortgage lenders (two savings banks and two commercial banks)<br />
accounted <strong>for</strong> approximately 50% of the total mortgage market, and the two largest<br />
amounted to 24% of the market. Towards the end of 1999, these 2 lenders, BBV and<br />
Argentaria, merged. The merger <strong>for</strong>med the largest commercial bank and mortgage<br />
lender in Spain. Spain’s large commercial banks are among the most international,<br />
financial institutions in Europe. Both BBV Argentaria and Banco Santander Central<br />
Hispano are active in Latin America and, through cross-share ownership in several<br />
European countries as well.<br />
Loan types include fixed and variable rate, amortizing loans as well as constant payment<br />
annuity loans. Most mortgages (80% in 1996) originated in Spain are variable rate.<br />
Traditionally, Spanish lenders made fixed rate loans with hefty prepayment penalties. In<br />
the mid-1990s, in response to consumer pressure to refinance older high rate mortgages,<br />
the government imposed a ceiling penalty of 1% <strong>for</strong> ARMs and 3% <strong>for</strong> FRMs. Loan<br />
terms range between 10 and 20 years, with nearly 2/3 over 15 years. The typical loan size<br />
is Euro 30,000 to 90,000. The Spanish mortgage market is strongly regulated by the Bank<br />
of Spain, which sets standards <strong>for</strong> mortgage underwriting. Typically the maximum LTV<br />
is limited to 80%, and the maximum debt-to-income ratio is 40%.<br />
The rate <strong>for</strong> variable rate loans is indexed annually. Indexation is based on one of the five<br />
indices published monthly by the Bank of Spain: the rate of the average mortgage loan<br />
granted by banks, the rate of the average mortgage loan granted by savings banks, the<br />
average six month moving average rate negotiated in the secondary market <strong>for</strong> public debt<br />
between 2 and 5 years, MIBOR (Madrid Inter-bank Offer Rate) at one year, and the asset<br />
interest rate of savings banks.<br />
Interest rates continued to fall and reached historically low levels in 1999. At the end of<br />
1999, non-subsidized mortgage rates stood at 4.40%. The average interest rate at banks<br />
was 4.32%, as compared to 4.65% at savings banks. The average interest rate <strong>for</strong> all<br />
institutions was 4.47% in August. Spanish lenders are beginning to offer mortgages with<br />
payment flexibility and longer payback periods. Margins have fallen from over 200 basis<br />
points in April 1999 to 100 basis points in April 2000. As of 1998, 81% of Spanish loans<br />
had rates determined by the free market.<br />
Interest Rates<br />
Year Money <strong>Market</strong> i.e.<br />
Interbank<br />
Countrywide <strong>International</strong> Consulting Services<br />
Deposit <strong>Mortgage</strong><br />
Rates<br />
(variable)<br />
Long-Term<br />
Govt Bond Yield<br />
1990 14.76% 10.65% 14.68%<br />
1991 13.20% 10.47% 12.43%<br />
1992 13.01% 10.43% 12.17%<br />
1993 12.33% 9.63% 10.30% 10.16%<br />
1994 7.81% 6.70% 8.70% 9.69%<br />
1995 8.98% 7.68% 8.90% 11.04%<br />
1996 7.65% 6.12% 6.90% 8.18%<br />
1997 5.49% 3.96% 5.60% 5.84%<br />
2 1 9
1998 4.34% 2.92% 4.90% 4.55%<br />
1999 2.72% 1.85% 4.40% 4.30%<br />
Source: EMF, IMF<br />
Deposits fund a vast majority of mortgage loans in Spain. However, wholesale finance is<br />
growing in importance. <strong>Mortgage</strong> bonds (“Cedulas Hipotecarias”) were introduced in<br />
1981 but grew only moderately, never representing more than 5% of total mortgage<br />
funding. Demand is growing, reflecting lower interest rates and rapid growth of pension<br />
and investment funds (strong demand). The issuance of mortgage bonds was robust in<br />
1999, with approximately Euro 1 billion issued. 10% risk weighting <strong>for</strong> mortgage bonds<br />
was established in May 1999, accounting <strong>for</strong> some of the growth.<br />
<strong>Mortgage</strong> Bonds (ESP million)<br />
Year Issued Outstanding<br />
1991 251,206 667,226<br />
1992 189,529 669,500<br />
1993 349,351 875,607<br />
1994 273,237 910,684<br />
1995 464,360 1,095,863<br />
1996 292,019 1,079,250<br />
1997 362,866 1,135,733<br />
1998 243,454 1,285,246<br />
1999 865,817 1,907,443<br />
Source: EMF<br />
The securitization of real estate loans picked up in early 1999. In the first half of the year,<br />
six issues of mortgage-backed bonds were registered at the CNMV (Spanish SEC) <strong>for</strong> a<br />
total of Ptas 635 billion. The total amount of mortgages securitized in Spain since 1992,<br />
when this process started, is of nearly Ptas 1.5 trillion. Three-quarters of this have been<br />
issued in the last twelve months. The main issuers of MBS have been Caha de Ahorros<br />
and Banco Santander. A recent ruling of the Central Bank, allowing mortgage bonds and<br />
MBS to be eligible collateral <strong>for</strong> rediscount, has led to an upsurge in issuance. In June<br />
2000, two large deals of Euro 514 billion and Euro 459 billion were announced by a<br />
consortium of regional savings banks and <strong>Union</strong> De Creditos Immobiliarios, the Spanish<br />
mortgage lender owned by Banco Santander Central Hispano and BNP Paribas,<br />
respectively.<br />
<strong>Mortgage</strong>-Backed Securities (ESP million)<br />
Year Issued Outstanding<br />
1993 34,489 34,043<br />
1994 82,256 111,260<br />
1995 110,569 202,926<br />
1996 2,855 159,889<br />
1997 116,104 243,785<br />
1998 640,225 830,919<br />
Countrywide <strong>International</strong> Consulting Services<br />
2 2 0
1999 981,093 1,616,191<br />
Source: EMF<br />
Policy Developments<br />
A new <strong>for</strong>eclosure law was approved in January 2000 that will reduce by 20% the value<br />
of properties going through <strong>for</strong>eclosure. The amount of the notary’s fee <strong>for</strong> mortgage<br />
deed registration has been reduced by 25%. The level of mortgage interest deductibility<br />
has been lowered as has the fiscal advantage attached to housing savings accounts.<br />
Following the implementation of Article 22§4 of the UCITS directive, the cedulas<br />
hipotecarias have been allowed a 10% weighting.<br />
The present housing subsidy system, Vivienda de Protección Oficial, has 3 main<br />
components: First, local councils provide developers with land <strong>for</strong> building “statesubsidized”<br />
housing, which they have to sell at a certain price. Second, requirements are<br />
established <strong>for</strong> accessing these homes, most important of which is an income limit based<br />
on income tax returns. Third, there is a privileged financing schemes <strong>for</strong> developers and<br />
<strong>for</strong> people buying the homes. In the latter, the interest rates are fixed on an annual basis<br />
as a percentage (70%) of the index <strong>for</strong> all financial institutions in the previous year.<br />
Sources and References<br />
1. European <strong>Mortgage</strong> Federation, <strong>Mortgage</strong> and Property <strong>Market</strong>s in 1999, Brussels<br />
2000 www.hypo.org<br />
2. European <strong>Mortgage</strong> Federation, Hypostat 1988-1998, Brussels 1999<br />
3. Argentaria, Real Estate, Volume 2, No. 20, October 1999<br />
4. IMF: <strong>International</strong> Financial Statistics, 2000<br />
5. Moodys Structured <strong>Finance</strong>: 1999 Year in Review and 2000 Outlook, February 2000<br />
www.moodys.com<br />
6. Morgan Stanley Dean Witter, Inside the Global Economy, May 2000.<br />
www.msdw.com<br />
7. Spanish <strong>Mortgage</strong> Association (Asociación Hipotecaria Española), Present Situation<br />
and Recent Evolution of the Spanish <strong>Mortgage</strong> <strong>Market</strong>, presentation at the Pan-<br />
European <strong>Mortgage</strong> <strong>Market</strong> 2000 Conference, Barcelona, September 2000<br />
http://www.asoc-hipotecaria.es<br />
8. Fitch ICBA, “Spanish <strong>Mortgage</strong> Default Model”, January 1999 www.fitchicba.com<br />
9. Credit Suisse First Boston, “Euro-11 Special: <strong>Housing</strong> Matters”, Economics Research<br />
April 2000 www.csfb.com<br />
Countrywide <strong>International</strong> Consulting Services<br />
2 2 1
SWEDEN<br />
Economic Background<br />
Year Exchange Rate<br />
Kronor/US$<br />
Consumer Price<br />
Index<br />
Countrywide <strong>International</strong> Consulting Services<br />
Change In<br />
Consumer Prices<br />
Kronor US$<br />
Nominal GDP<br />
(Millions)<br />
Nominal GDP<br />
(Millions)<br />
1992 5.82 91.20 2.29% 1,441,720 247,718<br />
1993 7.78 95.43 4.64% 1,446,200 185,887<br />
1994 7.72 97.53 2.20% 1,531,100 198,329<br />
1995 7.13 100.00 2.53% 1,649,900 231,403<br />
1996 6.71 100.40 0.47% 1,688,200 251,595<br />
1997 7.63 100.99 0.52% 1,738,900 227,903<br />
1998 7.95 100.85 -0.14% 1,800,580 226,488<br />
1999 8.26 101.31 0.45% 1,869,002 226,271<br />
Source: IMF, Morgan Stanley<br />
Swedish economic growth continued to be strong. GDP grew by 3% in 1998 and 3.8% in<br />
1999, and all indications are <strong>for</strong> even stronger growth in 2000. Impetus comes from<br />
consumer spending fuelled by record high consumer confidence and solid job creation.<br />
Private spending will be boosted by robust employment growth and income tax cuts in<br />
2000 and 2001. In addition, there is a continued high level of investment spending in<br />
in<strong>for</strong>mation and communication technology. Inflation has remained relatively subdued<br />
despite the acceleration in growth, mainly due to large-scale telephony and utilities<br />
deregulation putting downward pressure on prices. Inflation has been virtually nonexistent<br />
over the past 4 years, but it is expected to rise modestly in the next 2 years.<br />
There is speculation about a referendum on Sweden’s entrance to EMU, but such a<br />
referendum is unlikely until after the next elections.<br />
<strong>Housing</strong> <strong>Market</strong><br />
There are 4,200,000 dwellings in Sweden, of which 60% are owner-occupied. The<br />
population was 8.85 million (1997). The housing market suffered through a depression in<br />
the early 1990s with housing starts falling from a level of 50,000-70,000 per year to<br />
12,000 to 13,000. The 1999 level of 15,000 starts was the highest since 1993. The<br />
housing market picked up in 1999, reflecting strong, economic growth and low interest<br />
rates. Existing house prices rose above 1990 levels <strong>for</strong> the first time in 1998 and<br />
increased by 9.3% in 1999. <strong>Housing</strong> starts were at very low levels throughout the decade.<br />
The typical price <strong>for</strong> a 150m2 and 100m2 flat at the end of 1999 was 133,000 Euro.<br />
Year <strong>Housing</strong> Starts <strong>Housing</strong><br />
Completions<br />
Transactions<br />
Involving<br />
Dwellings**<br />
Construction Cost<br />
Index*<br />
Existing House<br />
Price*<br />
1992 52,000 57,319 33,300 105 97<br />
1993 12,000 56,912 35,700 106 86<br />
1994 12,000 21,630 42,700 107 90<br />
1995 12,000 12,000 41,900 114 91<br />
1996 13,000 11,000 46,600 115 91<br />
1997 12,200 13,000 54,700 116 98<br />
2 2 2
1998 12,450 11,500 52,200 120 107<br />
1999 15,000 14,000 57,100 122 117<br />
*1990=100; **1-2 family units. New dwellings not included; Source: EMF<br />
<strong>Mortgage</strong> <strong>Market</strong><br />
After several years of declining activity, the mortgage market picked up in 1999 with<br />
outstanding mortgage loans increasing every month. The growth spurt reflected strong<br />
economic growth and low interest rates. Gross lending picked up significantly in 1996,<br />
and it continued to rise throughout the decade. Net lending increased significantly, but<br />
did not, however, approach levels of the beginning of the decade.<br />
Specialized mortgage credit institutions, most of which are owned by commercial banks,<br />
are the largest source of credit in the Swedish market. Their loans are secured mainly<br />
with mortgages or local, government guarantees. The mortgage credit institutions<br />
constitute the Swedish membership of the European <strong>Mortgage</strong> Federation and grant<br />
approximately 80% of the mortgage credit in Sweden. The remainder is granted by<br />
banks. The two largest mortgage credit institutions are Spintab, owned by Swedbank,<br />
and SHB (Stadshypotek), owned by Handelsbank. Each holds about 30% each of the<br />
total market. SBAB and Nordbanken Hypotek each have approximately a 14% market<br />
share and SEB has 11%. At the beginning of 2000 a new company, EuropeLoan, entered<br />
the Swedish market. This company, which is based in Belgium, provides mortgage loans<br />
only through the Internet.<br />
Millions SK<br />
Year Outstanding <strong>Mortgage</strong><br />
Debt/GDP<br />
<strong>Mortgage</strong> Debt<br />
Outstanding*<br />
Countrywide <strong>International</strong> Consulting Services<br />
New Originations<br />
Net*<br />
New Originations<br />
Gross*<br />
1992 57.1% 831,253 62,716 100,588<br />
1993 66.3% 899,004 66,804 102,798<br />
1994 63.4% 900,800 1,774 68,304<br />
1995 64.3% 922,608 21,775 86,002<br />
1996 59.0% 946,203 23,677 161,598<br />
1997 57.3% 939,101 (7,153) 167,100<br />
1998 52.2% 939,296 228 158,498<br />
1999 52.0% 971,099 31,801 171,798<br />
*Specialized lenders only; Source: EMF<br />
<strong>Mortgage</strong> credit institutions provide credit not only <strong>for</strong> residential property (apartments,<br />
co-operates associations, residential leases, private houses, country cottages) but also <strong>for</strong><br />
commercial property. In 1999, the distribution by loan purpose was:<br />
Loan Purpose<br />
Single family 47.61%<br />
Multi family 40.86%<br />
Comm. Prop 3.33%<br />
Coop. Shares 4.16%<br />
Other 4.04%<br />
Source: SEB<br />
2 2 3
Swedish lenders grant both fixed and variable rate mortgage loans. Fixed rate loans are<br />
typically granted at a rate fixed <strong>for</strong> 2-5 years. During 1999, short-term interest rates were<br />
lower than long term rates. As a result, the proportion of loans at a variable rate rose to<br />
nearly 50% of all loans. <strong>Mortgage</strong> rates fell to decade lows of 5-5.5% in 1998 be<strong>for</strong>e<br />
rising in 1999. There is a good deal of product innovation taking place, including offering<br />
caps and floors, bundling mortgages with other financial products and giving “Internet<br />
discounts”.<br />
Interest Rates <strong>Mortgage</strong> Rates<br />
Year Money <strong>Market</strong><br />
i.e. Interbank<br />
Countrywide <strong>International</strong> Consulting Services<br />
Deposit Fixed 2years Fixed 5year Long-Term<br />
Govt Bond<br />
Yields<br />
1992 18.42% 7.80% 10.02%<br />
1993 9.08% 5.10% 8.00% 10.50% 8.54%<br />
1994 7.36% 4.91% 11.40% 12.30% 9.41%<br />
1995 8.54% 6.16% 8.70% 8.90% N/A<br />
1996 6.28% 2.47% 5.60% 6.90% N/A<br />
1997 4.21% 2.50% 6.20% 6.60% N/A<br />
1998 4.24% 1.91% 5.00% 5.50% 4.20%<br />
1999 3.14% 7.10% 5.60%<br />
Source: EMF, IMF<br />
The mortgage institutions finance their lending mainly by issuing mortgage bonds and<br />
certificates. <strong>Mortgage</strong> certificates are shorter term than mortgage bonds. The relationship<br />
between the two primarily depends on interest rates and the demand <strong>for</strong> different maturity<br />
instruments. In 1999, about 67% of lending were financed by mortgage bonds and 11%<br />
by mortgage certificates. In 1998 the figures were 70% and 6%, respectively. The bankowned<br />
companies also raise funds via their parent banks.<br />
<strong>Mortgage</strong> Bonds (million SK)<br />
Year Issued Outstanding<br />
1992 170,710 787,102<br />
1993 231,099 872,997<br />
1994 218,302 838,002<br />
1995 135,602 792,000<br />
1996 159,496 660,504<br />
1997 209,601 690,183<br />
1998 247,704 740,256<br />
1999 201,604 690,942<br />
Source: EMF<br />
Sources and References<br />
1. European <strong>Mortgage</strong> Federation, <strong>Mortgage</strong> and Property <strong>Market</strong>s in 1999, Brussels<br />
2000 www.hypo.org<br />
2. European <strong>Mortgage</strong> Federation, Hypostat 1988-1998, Brussels 1999<br />
2 2 4
3. IMF: <strong>International</strong> Financial Statistics, 2000<br />
4. Morgan Stanley Dean Witter, Inside the Global Economy, May 2000.<br />
www.msdw.com<br />
5. Svenska Bankföreningen (Swedish Bankers’ Association), 1999<br />
www.bank<strong>for</strong>eningen.se<br />
6. Swedish Board on Hosing Building and Planning, www.boverket.se<br />
7. Swedish Central Bank www.riksbank.se<br />
8. Credit Suisse First Boston, “Euro-11 Special: <strong>Housing</strong> Matters”, Economics Research<br />
April 2000 www.csfb.com<br />
Contacts<br />
1. The Swedish Bankers Association<br />
Regeringsgaten 38<br />
PO Box 7603<br />
SE 10394<br />
Stockholm<br />
Tel: 46.8.453.4400<br />
Fax: 46.8.796.9395<br />
http://www.bankgoreningen.se<br />
Countrywide <strong>International</strong> Consulting Services<br />
2 2 5
SWITZERLAND<br />
Economic Background<br />
Year<br />
Exchange<br />
Rate<br />
Francs/US$<br />
Consumer<br />
Price<br />
Index<br />
Countrywide <strong>International</strong> Consulting Services<br />
Change In<br />
Consumer<br />
Prices<br />
Francs US$<br />
Nominal GDP<br />
(Millions)<br />
Nominal GDP<br />
(Millions)<br />
1990 1.39 85.60 5.41% 317,300 228,273<br />
1991 1.43 90.60 5.84% 333,660 233,329<br />
1992 1.41 94.27 4.05% 342,360 242,809<br />
1993 1.48 97.40 3.32% 349,800 236,351<br />
1994 1.37 98.22 0.84% 357,460 260,920<br />
1995 1.18 100.00 1.81% 363,330 307,907<br />
1996 1.24 100.81 0.81% 365,830 295,024<br />
1997 1.45 101.29 0.48% 371,590 256,269<br />
1998 1.45 101.35 0.06% 380,010 262,076<br />
1999 1.50 102.18 0.82% N/A N/A<br />
Source: IMF<br />
The World Competitiveness Yearbook in 1997 cited Switzerland as having the highest<br />
income and private consumption per capita in the world as well as strong internal and<br />
external price stability.<br />
The gross domestic product of Switzerland in 1998 was approximately CHF380 billion,<br />
and it is predicted to grow by around 2 percent in 1999. Switzerland has experienced a<br />
protracted period of economic stagnation since 1990. This was mainly due to low,<br />
domestic consumer demand, a heavy recession in the construction sector, tight fiscal<br />
policy and the strength of the Swiss Franc against other major currencies impeding<br />
satisfactory export growth.<br />
The year on year inflation rate was zero percent during the first quarter of 1998, but it was<br />
expected to rise in 1999 to levels above 1 percent per annum in the wake of strong<br />
economic recovery.<br />
In May 1998, the seasonally adjusted unemployment rate in Switzerland was<br />
approximately 3.9% of the adult working population, and this rate was expected to drop<br />
further throughout 1998 and 1999.<br />
<strong>Housing</strong> <strong>Market</strong><br />
Approximately 31 percent of the Swiss population are homeowners. The relatively low<br />
percentage of home ownership is mainly due to high land prices as a result of land<br />
shortages and high property prices due to high construction standards and expensive<br />
labor.<br />
Owing to Switzerland’s small size, it is relatively easy <strong>for</strong> people to change employment<br />
without moving house. This leads to a low turnover rate <strong>for</strong> residential property. The<br />
2 2 6
average number of occupants is less than 2.5 people per dwelling. In addition, due to the<br />
high cost of residential property, homeowners tend to have higher personal wealth than<br />
other comparable countries in Europe. They rarely buy property until their 30s, with the<br />
average age of a first time buyer being 36 years. As many purchasers have already started<br />
families by this time, the property is generally purchased with a view to staying in it until<br />
much later in life than in other comparable countries. This also gives rise to a low level<br />
of new homeowners.<br />
There are no long-term property price statistics available in Switzerland, but indices have<br />
been published by the real estate research company, Wuest and Partners, which dates<br />
back to 1980. From 1980 to 1991, residential property prices in all of Switzerland rose<br />
approximately by 128 percent. Since then, prices have fallen constantly year on year with<br />
a total fall of approximately 25 percent from 1991 to 1997; however, the average price of<br />
a home is still higher than the rest of Europe. During the first quarter of 1998, a<br />
turnaround has become clearly visible as indices have shown increases in residential<br />
property prices. Historically, there have been regional differences in property prices in<br />
different parts of Switzerland.<br />
<strong>Mortgage</strong> <strong>Market</strong><br />
<strong>Mortgage</strong> loans <strong>for</strong> home ownership in Switzerland are largely provided by banks,<br />
insurance companies and pension funds. As at the end of 1997, the total amount of<br />
domestic mortgage loans advanced was CHF532 billion. The amount of mortgage loans<br />
made by Swiss banks grew by 7.5 percent per annum. Roughly two thirds of these loans<br />
were made to private households, a quarter to non-financial businesses and the remainder<br />
to financial businesses and others.<br />
It should be noted that Switzerland has a level of per capital retail mortgage financing that<br />
is significantly higher than all European countries. 1998 <strong>Mortgage</strong> lending practices in<br />
Switzerland was equal to ECU28,077 per capita. The closest markets are Denmark at<br />
ECU14,940 and The Netherlands at ECU14,033. Considering the high volume of loans, it<br />
is of no surprise that Switzerland has the highest level of outstanding mortgage debt /<br />
GDP at 87.7%.<br />
Banks provide approximately 95% of mortgage lending in Switzerland. The three largest<br />
Swiss Banks, Swiss Bank Corporation, <strong>Union</strong> Bank of Switzerland and Credit Suisse<br />
Group, have together a total of about thirty-nine percent of the mortgage loan market.<br />
The 24 Cantonal banks have the next largest share of the mortgage loan market with<br />
about thirty-five per cent of the total. The remainder of the market is made up by regional<br />
and savings banks, Raiffeisen (co-operative) banks, insurance companies and other<br />
financial institutions. The rest of the market share is made up predominantly with the life<br />
insurance companies and pension funds.<br />
Swiss residential mortgage loans are basically of two types. Firstly, a variable rate<br />
mortgage loan with a rate being bank-administrated which follows closely the prevailing<br />
interest rates. The rate is adjusted periodically according to capital markets. The rents in<br />
Countrywide <strong>International</strong> Consulting Services<br />
2 2 7
Switzerland are linked to the variable mortgage rates of the Cantonal banks. This leaves<br />
the variable rate market subject to political bias. Secondly, there is a fixed rate mortgage<br />
loan (which appeared first in the early 1980s.) These rates are mostly fixed <strong>for</strong> a period of<br />
3 to 5 years. After this time the rates are adjusted <strong>for</strong> the next period, or the borrower has<br />
the option to switch to a variable rate mortgage and back again at the end of another<br />
period. The fixed rate mortgage loan will usually not be repayable early, and if it is, it will<br />
only be repayable upon payment of a prepayment charge, which is usually equivalent to<br />
the full cost to the lender of the repayment of the mortgage loan.<br />
There is no single interest rate that applies to all mortgage loans. Lenders have different<br />
rates <strong>for</strong> different products, existing and new loans, first and second mortgages, and risks<br />
attached to different types of property and different debtors.<br />
In Switzerland, banks have traditionally funded mortgage loans from savings deposits<br />
made by customers. Since the 1990s, banks have also sourced mortgage funding from<br />
other products, including fixed and floating rate note issues and mortgage bonds. The<br />
value of mortgage bonds outstanding amounted to EUR 21.1 billion at the end of 1998,<br />
making mortgage bonds the second largest securities segment after confederate bonds<br />
(EUR 27.6 billion). <strong>Mortgage</strong> bonds financed approximately 7% of the outstanding<br />
mortgage loans in 1998, and this proportion is expected to rise. New production of<br />
mortgage loans was EUR 7.3 billion in 1998, and mortgage bonds outstanding rose by<br />
EUR 3.1 billion.<br />
Centralized mortgage bond issuers are (names) Swiss Pfandbriefbank der<br />
Schweizerischen Hypothekarinstitute. These institutions act as centralized bond issuers<br />
<strong>for</strong> mortgage lenders, raising funds through sale of bonds and providing loans to banks.<br />
There is currently only one issuance of MBS in Switzerland. This issuance is from <strong>Union</strong><br />
Bank of Switzerland. The Swiss mortgage market is not conducive to securitization.<br />
Partly responsible <strong>for</strong> the unfriendly MBS market is the fact that the mortgage market is<br />
not uni<strong>for</strong>m, with the 26 Cantonal banks having different legislation. Also obstructing<br />
mortgage-backed securitization is the fact that historical data can not easily be obtained<br />
from the banks. This is necessary <strong>for</strong> the rating process. So far, Swiss regulating rules do<br />
not make MBS issuance a relatively easy and efficient process.<br />
Security interests over residential property are generally created under Swiss law in one<br />
of two ways: through a mortgage on real property (Grundpfandverschreibung) or a<br />
mortgage note (Schuldbriefe). The Schuldbriefe is the most common method to secure<br />
mortgage loans. It entitles the holder, on presentation to the appropriate debt en<strong>for</strong>cement<br />
office, to realize the security evidenced by the Schuldbriefe and to sue on the personal<br />
covenant of the debtor to pay amounts outstanding under the mortgage loan. A<br />
Schuldbrief can be used to secure all types of credit to the debtor.<br />
The average period from a debtor’s default until sale of the property through the auction<br />
process is between one and two years. On the sale of the property, the lender will be<br />
entitled to recover from the net proceeds of sale the principal amount due in respect of the<br />
Countrywide <strong>International</strong> Consulting Services<br />
2 2 8
mortgage loan, up to three years’ interest (if owing), plus interest from the date of filing<br />
of the request <strong>for</strong> auction.<br />
In practice, lenders will generally attempt to find a means of repayment of the debt<br />
without recourse to the auction process, such as a voluntary sale of the property by the<br />
debtor or by encouraging the debtor to remortgage with another bank. Such actions are<br />
taken, because the amount recovered at auction will usually be less than that obtainable<br />
through a voluntary sale.<br />
Sources and References<br />
1. Schweizerischer Bankverein (Deutschland) AG SBC Warburg Dillon Read. “Tell<br />
<strong>Mortgage</strong>-Backed Trust, 1998-1.” June 15 1998.<br />
2. <strong>International</strong> Monetary Fund: IMF Statistics, 2000<br />
3. Credit Suisse Economic Research, EBIC Economic Business and In<strong>for</strong>mation Center<br />
Countrywide <strong>International</strong> Consulting Services<br />
2 2 9
UNITED KINGDOM<br />
Economic Background<br />
Year Exchange Rate<br />
£/US $<br />
Consumer Price<br />
Index<br />
Countrywide <strong>International</strong> Consulting Services<br />
Change In<br />
Consumer Prices<br />
British £ US $<br />
Nominal GDP<br />
(Millions)<br />
Nominal GDP<br />
(Millions)<br />
1990 0.56 84.61 9.48% 554,490 990,161<br />
1991 0.57 89.57 5.85% 582,950 1,022,719<br />
1992 0.57 92.91 3.73% 606,580 1,064,175<br />
1993 0.67 94.36 1.56% 637,820 951,970<br />
1994 0.65 96.70 2.48% 676,040 1,040,062<br />
1995 0.63 100.00 3.41% 712,550 1,131,032<br />
1996 0.64 102.45 2.45% 754,600 1,179,063<br />
1997 0.61 105.66 3.13% 803,890 1,317,852<br />
1998 0.60 109.27 3.42% 843,730 1,406,217<br />
1999 0.62 110.97 1.56% 861,448 1,389,433<br />
Source: IMF, Morgan Stanley<br />
The UK economy has been a strong per<strong>for</strong>mer over the past 2 years. GDP growth in<br />
1999 was over 2.1% with inflation falling to a decade low of 1.56%. The labor market<br />
was buoyant with falling unemployment and strong earnings growth. The unemployment<br />
rate fell to 4% at the end of 1999, a 20 year low. The IMF recognized the UK as having<br />
made significant progress in addressing labor market rigidities, which in turn lead to a<br />
reduction in structural unemployment. Quarterly growth was down to 0.4% in the first<br />
quarter of 2000, reflecting the strength of the pound sterling and continued high real<br />
interest rates. Industrial production has slowed, while the service sector remained<br />
buoyant. This has created concerns of a 2-speed economy.<br />
<strong>Housing</strong> <strong>Market</strong><br />
As of 1997, there were 24,216,000 dwelling units in the UK. At 67%, the UK has one of<br />
the higher home-ownership rates in Europe. The population was 58.2 million (1997).<br />
The macro-economic environment has been conducive to growth in the housing market.<br />
House prices increases have accelerated over the past two years. However, housing<br />
supply has been unresponsive to price, magnifying the effects of growing demand.<br />
Despite the strong growth in demand, the 1999 number of housing starts was virtually<br />
unchanged from the level of the previous year of just over 179,000. Both the Halifax and<br />
Nationwide house price indices have shown house prices in the first quarter of 2000<br />
around 15% higher than a year earlier. The level of property transactions showed a<br />
healthy 9% growth in 1999. The mix adjusted (mortgaged), average house price in the<br />
UK at the end of 1999 was £93,500 ($150,800). The ratio of house price-to-earnings was<br />
4. This was the highest level since 1991.<br />
(Thousands)<br />
2 3 0
Year <strong>Housing</strong> Starts <strong>Housing</strong> Completions Transactions Involving<br />
Dwellings<br />
Countrywide <strong>International</strong> Consulting Services<br />
House Price Index: All<br />
dwellings<br />
1992 154,100 167,300 1,138,100 95<br />
1993 182,300 176,100 1,195,000 93<br />
1994 199,700 183,900 1,275,000 95<br />
1995 167,100 188,600 1,134,000 96<br />
1996 172,400 178,300 1,241,000 99<br />
1997 188,600 177,900 1,440,000 108<br />
1998 180,100 170,100 1,348,000 120<br />
1999 179,700 170,800 1,469,000 134<br />
Source: EMF<br />
<strong>Mortgage</strong> <strong>Market</strong><br />
The UK has the second largest mortgage market in Europe with US $ 796 billion in<br />
outstanding residential mortgage loans at the end of 1999. The stock of mortgage debt is<br />
relatively large, compared to the size of the economy (57%), reflecting the high<br />
homeownership rate and a high degree of indebtedness. The UK had a record high<br />
volume of mortgage originations (gross advances) of $184.5 billion in 1999, reflecting a<br />
relatively high mobility rate and substantial growth in loans <strong>for</strong> home purchase. The level<br />
of origination is the highest in Europe. The rate of increase in 1999 was over double that<br />
between 1997 and 1998. While the increase in 1998 was driven by re-mortgage<br />
(mortgage refinance) activity (approximately 30% of mortgage originations), the main<br />
boost in 1999, was the surging house buying market. As a result the level of net<br />
originations (gross lending less amortization and prepayment) was only 33% of gross<br />
originations.<br />
<strong>Mortgage</strong> <strong>Market</strong> £ millions<br />
Year Outstanding<br />
<strong>Mortgage</strong><br />
Debt/GDP<br />
<strong>Mortgage</strong> Debt<br />
Outstanding<br />
New Originations<br />
Net<br />
New Originations<br />
Gross<br />
Number of new<br />
housing loans<br />
approved<br />
1990 54.5% 294,689 33,352 69,830<br />
1991 54.7% 319,123 25,906 64,399<br />
1992 52.8% 341,689 18,514 54,011<br />
1993 59.0% 359,868 16,751 54,423<br />
1994 55.9% 377,321 19,289 58,114<br />
1995 54.6% 391,515 15,210 57,457<br />
1996 60.9% 407,662 19,016 71,322<br />
1997 56.8% 431,418 23,829 77,194 1,186,000<br />
1998 53.1% 455,834 25,181 89,206 1,035,000<br />
1999 57.2% 493,815 37,894 114,417 1,181,000<br />
Source: EMF<br />
The UK market was traditionally dominated by building societies. They are depository<br />
institutions that specialize in housing finance. As recently as 1996 the building society<br />
market share was 55% of both outstanding mortgages and new originations. Their market<br />
share plummeted to 23% by 1999, reflecting institutions converting from a building<br />
society to a commercial bank charter. The commercial bank market share has increased<br />
2 3 1
to more than 70%, with specialized lenders (non-depository institutions similar to US<br />
mortgage banks) accounting <strong>for</strong> the remaining 7%. In recent years, the specialized lenders<br />
have focused on the emerging sub-prime market. The largest UK mortgage lenders are<br />
Halifax, Abbey National, C&G/Lloyds TSB, Nationwide Building Society, and the<br />
Woolwich plc.<br />
Largest <strong>Mortgage</strong> Lenders (Ranked by <strong>Mortgage</strong> Assets)<br />
Name of Group Year Ended £ billion<br />
Halifax plc 31-Dec-99 93<br />
Abbey National 31-Dec-99 64.9<br />
Lloyds TSB 31-Dec-99 47.5<br />
Nationwide BS 04-Apr-99 36.9<br />
Woolwich plc 31-Dec-99 25.5<br />
UK savings and lending markets are rapidly changing. New entrants are taking substantial<br />
market share in both retail savings and mortgage lending. Standard Life and Prudential<br />
(through its Egg brand) entered in the market at the beginning of 1999 and provided 20%<br />
of net advances (mainly refinancing loans from building society and commercial bank<br />
lenders) during the first half of the year. Other non-traditional institutions with strong<br />
brands such as Virgin, Tesco and Sainsbury have aggressively entered the savings and<br />
mortgage loan markets as well.<br />
The standard mortgage instrument in the UK is a discretionary ARM – a loan the rate of<br />
which is determined and adjusted by the lender at its discretion (known as the Standard<br />
Variable Rate SVR). The rates on this loan are typically set as a spread (historically 200+<br />
basis points) over the average, retail cost of funds. The wide spreads on existing loans<br />
and the discretionary power of lenders allowed them to compete <strong>for</strong> market share by<br />
offering heavily discounted start rates and even cash-backs to new borrowers. The effect<br />
of the discounting can been seen in the lower, average rate <strong>for</strong> all borrowers as compared<br />
to the basic SVR rate below. In recent years, short term, fixed rate mortgages have<br />
accounted <strong>for</strong> 30 to 50% of new originations. These loans have rates fixed <strong>for</strong> 1 to 5<br />
years after which time they convert to SVR. As of June 1999, 20% by number and 27%<br />
by value, were fixed rate mortgages. This is a significant increase over June 1997, when<br />
13% by number and 19% by value were fixed rate.<br />
A recent innovation in the UK market is the flexible mortgage. The instrument was a<br />
reaction to the difficulties faced by borrowers in the early 1990s and to the changing<br />
nature of the labor market. Although the characteristics of flexible mortgages vary, they<br />
are commonly associated with ef<strong>for</strong>ts to assist households facing more unpredictable<br />
income streams such as the self-employed and those on short-term contracts. There<strong>for</strong>e,<br />
they allow <strong>for</strong> underpayments or overpayments and so-called “payment holidays”. Some<br />
flexible mortgages allow consumers to consolidate both secured and unsecured lending<br />
into one loan. Other products go a step further and incorporate a current account facility.<br />
Countrywide <strong>International</strong> Consulting Services<br />
2 3 2
Interest Rates <strong>Mortgage</strong> Rates Gov't Bond Yields<br />
Year Money <strong>Market</strong><br />
i.e. Interbank<br />
Deposit Average<br />
All Borrowers<br />
Countrywide <strong>International</strong> Consulting Services<br />
Basic Rate Short-term Long-term<br />
1990 14.64% 12.54% 14.34% 14.48% 12.08% 11.08%<br />
1991 11.77% 10.28% 11.39% 11.52% 10.18% 9.92%<br />
1992 9.39% 7.46% 8.98% 8.98% 8.94% 9.12%<br />
1993 5.46% 3.97% 7.94% 7.99% 6.65% 7.87%<br />
1994 4.76% 3.66% 7.84% 8.14% 7.83% 8.05%<br />
1995 5.98% 4.11% 7.48% 7.98% 7.93% 8.26%<br />
1996 5.89% 3.05% 6.51% 7.00% 7.28% 8.10%<br />
1997 6.56% 3.63% 7.58% 8.16% 6.98% 7.09%<br />
1998 7.09% 4.48% 7.29% 7.75% 5.77% 5.45%<br />
1999 6.49% 6.88%<br />
Source: IMF, BSA (mortgage rates <strong>for</strong> building societies)<br />
Basic rate is the standard variable rate charged by societies at their discretion. Average mortgage<br />
rates reflect initial period fixed rates and discounts.<br />
The legal system is supportive of mortgage lending in the UK. During the early 1990s,<br />
there was a high level of arrears. This was due to a down turn in the economy, and the<br />
situation of negative equity faced by large numbers of highly leveraged homeowners.<br />
The arrears (3 months +) and possessions have declined significantly from 5.4% of all<br />
loans in the peak year of 1993 to 1.77% at the end of 1999.<br />
The majority of institutions in the UK have traditionally funded mortgage loans through<br />
retail and wholesale (floating rate note) markets. The UK has been on the <strong>for</strong>efront of<br />
securitization in Europe. The first MBS was issued in 1985, and in most years since then,<br />
the volume of UK issuance has been greater than that of any other European country. The<br />
value of MBS issued in 1999 was $8.3 billion. This was more than double the $3.9 billion<br />
issued in 1998. In the UK, new issues of MBS in 1999 totaled EUR 8.2 billion, which<br />
represents 4.5% of gross mortgage lending in the period. MBS are becoming more<br />
popular as a method of removing assets from balance sheets to reduce the amount of<br />
capital, which has to be retained. As the market <strong>for</strong> mortgages becomes more competitive<br />
in the UK, the use of MBS is likely to become more common. A major change in MBS<br />
issuance is the emergence of major bank issuers, such as Abbey National.<br />
<strong>Mortgage</strong> Backed Securities<br />
Year Issued<br />
1991 2,342<br />
1992 418<br />
1993 1,020<br />
1994 2,333<br />
1995 -<br />
1996 -<br />
1997 1,937<br />
1998 2,348<br />
1999 5,127<br />
Source: EMF<br />
2 3 3
Policy Developments<br />
A voluntary code aimed at promoting good practice in the mortgage selling process,<br />
including the provision of advice to customers and relations with borrowers over the life<br />
of the loan, was adopted by mortgage lenders in mid-1997. Reflecting the fact that half of<br />
all mortgages are channeled via intermediaries, the Code was extended to include<br />
intermediaries in April 1998. However, the efficacy of the code of conduct <strong>for</strong> mortgage<br />
lenders has been strongly questioned, and the possibility of regulating mortgage activities<br />
is under examination.<br />
The government has recently announced details <strong>for</strong> a new voluntary CAT (Charges,<br />
Access and Terms) standard <strong>for</strong> mortgages. There will be two CAT standards: one <strong>for</strong><br />
variable rate mortgages and one <strong>for</strong> fixed and capped rate mortgages. In effect, CAT<br />
standards are a benchmark <strong>for</strong> mortgages. Interest rates on CAT variable rate loans must<br />
be set no higher than 2% above the base rate. For fixed and capped rate loans redemption<br />
charges should be no more than 1% of the loan <strong>for</strong> each remaining year of the fixed or<br />
capped rate period. The CAT mortgage also has interest calculated daily.<br />
Sources and References<br />
1. European <strong>Mortgage</strong> Federation, <strong>Mortgage</strong> and Property <strong>Market</strong>s in 1999, Brussels<br />
2000 www.hypo.org<br />
2. European <strong>Mortgage</strong> Federation, Hypostat 1988-1998, Brussels 1999<br />
3. Coles, A., “Securitization: What Is Different About the USA”, <strong>Housing</strong> <strong>Finance</strong><br />
<strong>International</strong>, March 1999<br />
4. Council of <strong>Mortgage</strong> Lenders, <strong>Housing</strong> <strong>Finance</strong>, 46, May 2000<br />
5. IMF: <strong>International</strong> Financial Statistics, 2000<br />
6. Morgan Stanley Dean Witter, Inside the Global Economy, May 2000.<br />
www.msdw.com<br />
7. Moodys Structured <strong>Finance</strong>: 1999 Year in Review and 2000 Outlook, February 2000<br />
www.moodys.com<br />
8. Coogan, Michael, Recent Developments in the UK <strong>Housing</strong> and <strong>Mortgage</strong> <strong>Market</strong>s<br />
<strong>Housing</strong> <strong>Finance</strong> <strong>International</strong>, March 1998<br />
9. Heard, C. and P. Williams. “Flexible <strong>Mortgage</strong>s: The Product <strong>for</strong> the Next<br />
Millennium”, <strong>Housing</strong> <strong>Finance</strong> <strong>International</strong>, September 1998<br />
Contacts<br />
1. Council of <strong>Mortgage</strong> Lenders<br />
Michael Coogan, Secretary General<br />
3 Savile Row<br />
London<br />
W1X 1AF<br />
Tel: 020 7437 0075<br />
Fax: 020 7434 3791<br />
Email: info@cml.org.uk<br />
http://www.cml.org.uk<br />
Countrywide <strong>International</strong> Consulting Services<br />
2 3 4
2. British Building Societies Assn<br />
Adrian Coles, Secretary General<br />
3 Savile Row<br />
London<br />
W1X 1AF<br />
Tel: 44.171.437.0655<br />
Fax: 44.171.734.6416<br />
Email: adrian.coles@bsa.org.uk<br />
Countrywide <strong>International</strong> Consulting Services<br />
2 3 5
CENTRAL & SOUTH AMERICA<br />
Countrywide <strong>International</strong> Consulting Services<br />
2 3 6
Regional Summary<br />
Central & South America<br />
The regions of Central and South America have commonly been hard hit by the financial<br />
crises of the past decade. The regional economies experienced small, steady growth until<br />
the last half of the 1990s. The Mexican financial crisis, the Asian financial crisis, and<br />
more recently the Russian financial crisis have all impacted the economic growth of this<br />
region. In addition, the effects of the El Nino weather pattern in 1998 caused deterioration<br />
in much of the regional economies and financial systems – the latter as banks were <strong>for</strong>ced<br />
to accommodate the devastated fishing and agriculture sectors.<br />
Inflation has been a major contributor to the slow pace of the financial sector and housing<br />
finance development. For much of the decade, inflation rates resided at the double digit<br />
and some instances, triple and quadruple digit marks. Controlling inflation has become<br />
the primary policy goal of most the countries in the region. While inflation rates are still<br />
quite high in some of the nations, countries like Argentina, Brazil, Guatemala, Panama,<br />
and Peru have implemented strict monetary policies to manage inflation rates below 4%<br />
<strong>for</strong> at least the last three years. Ecuador, the only country with an increasing inflation rate,<br />
officially adopted the US Dollar as its national currency at the beginning of 2000.<br />
65.00%<br />
55.00%<br />
45.00%<br />
35.00%<br />
25.00%<br />
15.00%<br />
5.00%<br />
-5.00%<br />
Source: IMF<br />
Argentina<br />
Brazil<br />
CENTRAL & SOUTH AMERICA<br />
Inflation Rates<br />
Chile<br />
Colombia<br />
Ecuador<br />
Central and South American countries have high rates of homeownership reflecting a<br />
cultural preference and the lack of rental housing policies and finance.<br />
Countrywide <strong>International</strong> Consulting Services<br />
Guatemala<br />
Panama<br />
Paraguay<br />
Peru<br />
1995 1999<br />
Uruguay<br />
2 3 7
90%<br />
80%<br />
70%<br />
60%<br />
50%<br />
40%<br />
30%<br />
20%<br />
10%<br />
0%<br />
1991<br />
77%<br />
CENTRAL & SOUTH AMERICA<br />
Rate of Homeownership<br />
1998<br />
70%<br />
<strong>Housing</strong> shortages have been and continue to be a concern <strong>for</strong> just about all of Central<br />
and South American countries. The lack of long-term finance, along with the inability to<br />
obtain cost-effective techniques <strong>for</strong> construction are some of the deterrents present in<br />
keeping up with the area’s housing demands. The average number of people per<br />
household has been dropping, causing more strain on the area’s housing deficit. <strong>Housing</strong><br />
starts, while still growing, are lagging behind population growth trends and total demand.<br />
In general, poverty has been another barrier to the ability to create a viable housing<br />
market.<br />
Lack of capital <strong>for</strong> funding long–term loans is one key aspect plaguing the mortgage<br />
markets of Central and South America. The effects of high inflation have eroded capital<br />
balances which in turn have limited supply. With financing not so easily obtained or<br />
offered, most homes are purchased or built without <strong>for</strong>mal financing. Countries like Chile<br />
& Columbia have pioneered the use of inflation indexed mortgages to combat trends of<br />
high inflation mortgage af<strong>for</strong>dability.<br />
Countrywide <strong>International</strong> Consulting Services<br />
1995<br />
61%<br />
1997<br />
75%<br />
Argentina Brazil Ecuador Paraguay<br />
2 3 8
16.00%<br />
14.00%<br />
12.00%<br />
10.00%<br />
8.00%<br />
6.00%<br />
4.00%<br />
2.00%<br />
0.00%<br />
3.83%<br />
CENTRAL & SOUTH AMERICA<br />
Outstanding <strong>Mortgage</strong> Debt/GDP<br />
7.40%<br />
10.57%<br />
While <strong>for</strong>mal housing finance systems are new to some areas of the region, it should be<br />
noted that by the end of the 1990s, outstanding mortgage debt was on the rise. This can be<br />
attributed to more stable economic policies, and increasing sophistication of lenders.<br />
Usually, depending on the cost of the dwelling and/or personal income, housing finance<br />
<strong>for</strong> this region can be obtained through commercial and public-owned banks and financial<br />
institutions.<br />
The 1990’s also brought the introduction of mortgage backed securities to the Latin<br />
American region. In 1994 Colombia issued the first mortgage securitization transaction<br />
in Latin America, and there have been four securitization transactions in Argentina since<br />
1997.<br />
Countrywide <strong>International</strong> Consulting Services<br />
2.00%<br />
14.00%<br />
Argentina Brazil Chile Ecuador Panama Peru<br />
2%<br />
2 3 9
Argentina<br />
Economic Background<br />
Year Exchange Rate<br />
Pesos /US$<br />
Consumer Price<br />
Index<br />
Countrywide <strong>International</strong> Consulting Services<br />
Change In<br />
Consumer Prices<br />
Pesos US$<br />
Nominal GDP<br />
(Thousands)<br />
Nominal GDP<br />
(Thousands)<br />
1990 0.56 24.74 2313.96% 68,922,300 123,075,536<br />
1991 1.00 67.21 171.67% 180,898,000 180,898,000<br />
1992 0.99 83.95 24.90% 226,847,000 229,138,384<br />
1993 1.00 92.86 10.61% 236,505,000 236,505,000<br />
1994 1.00 96.73 4.18% 257,440,000 257,440,000<br />
1995 1.00 100.00 3.38% 258,032,000 258,032,000<br />
1996 1.00 100.16 0.16% 272,150,000 272,150,000<br />
1997 1.00 100.69 0.53% 292,859,000 292,859,000<br />
1998 1.00 101.62 0.92% 298,131,000 298,131,000<br />
1999 1.00 100.43 -1.17% 283,100,000 283,100,000<br />
Source: IMF<br />
Argentina has an economy based primarily on manufacturing, and to a lesser extent<br />
agriculture. Throughout the 1980s and early 1990s, it suffered bouts of hyper-inflation<br />
that severely constrained the growth of the financial and mortgage markets.<br />
Since 1992 the country has experienced remarkable economic improvement. Strict<br />
monetary and fiscal policy of the Menem government has resulted in inflation that has<br />
been near zero since 1996. Until a recession hit in 1998, Argentina experienced<br />
consistently strong growth in real GDP.<br />
Despite its recovery, Argentina has found that it is not immune to contagion from<br />
financial crises in other parts of the world. Argentina experienced a liquidity crisis in its<br />
banking sector in 1995. Due in part to investor reaction to the Mexican financial crisis,<br />
many Argentine banks were pushed to the brink of insolvency. Economic growth has<br />
been a challenge to Argentina over the last two years as the economy has stagnated while<br />
dealing with new political and structural changes. GDP growth <strong>for</strong> 2000 is <strong>for</strong>ecasted at<br />
2.5%. Unemployment stands at 15%, and it is higher in the interior of the country.<br />
Economic growth and stability aside, recent regulatory and monetary measures have made<br />
Argentina a far more attractive place <strong>for</strong> <strong>for</strong>eign businesses. The “new” Argentine<br />
economy has encouraged a repatriation of national capital held abroad, reversing the<br />
massive capital outflows of the past (as indicated by the huge increase in <strong>for</strong>eign currency<br />
time deposits held by Argentine banks). Foreign capital is again available after the exodus<br />
of 1995. Greater financial solvency, transparency, and security of the financial system<br />
now offer a more solid market <strong>for</strong> <strong>for</strong>eign banks and broker-dealers.<br />
<strong>Housing</strong> <strong>Market</strong><br />
2 4 0
Development of the Argentine residential real estate market was severely constrained by<br />
the macroeconomic instability of the 1980s. The inability to obtain cost-effective funding<br />
<strong>for</strong> construction and the inability of potential purchasers to obtain long term financing<br />
resulted in a severe housing deficit. A 1994 study indicated the deficit to be<br />
approximately 3 million units.<br />
Recovery of the general economy has resulted in a recovery in the real estate sector.<br />
Af<strong>for</strong>dable long term financing has made it possible to increase the rate of building. This<br />
is seen in the issuance of residential building permits which increased (in terms of total<br />
area) 34% between December 1996 and December 1997.<br />
Year<br />
Construction<br />
Cost<br />
Index<br />
%Change in<br />
Construction<br />
Cost Index<br />
Countrywide <strong>International</strong> Consulting Services<br />
Population<br />
(Millions)<br />
Total<br />
Dwelling<br />
Stock<br />
(1000)<br />
Permits<br />
Issued<br />
(1000 Sq Meters)<br />
1990 32.53<br />
1991 32.97 10,080<br />
1992 33.42 - 4,800<br />
1993 100.0 33.87 - 4,500<br />
1994 102.3 2.30% 34.32 - 6,552<br />
1995 104.6 2.25% 34.77 - 3,912<br />
1996 101.2 -3.25% 35.22 - 4,032<br />
1997 102.0 0.79% 35.67 12,000 5,400<br />
Source: Cardiff Consulting Services, Argentina: <strong>Market</strong> Review, October 1998<br />
Aiding the recovery of the market has been the cost of construction, which has remained<br />
relatively low. In 1996 the change in the construction cost index was –3.25% as<br />
compared to general inflation, which was at .16%. In 1997 construction costs rose .79%,<br />
which was slightly higher than inflation. The expected trend in the construction industry<br />
is continued growth through the end of the 1990s.<br />
Average single family home prices in the country averaged US$ 45,000, and the owner<br />
occupancy rate according to the 1980 census was 68%.<br />
<strong>Mortgage</strong> <strong>Market</strong><br />
Relative to many countries, the Argentine housing finance market is very small. By mid-<br />
2000 the mortgage debt outstanding to GDP ratio was around 4.0%. This situation is due<br />
to the relative newness of the housing finance industry. Prior to 1991 the Argentine<br />
mortgage market was virtually non-existent. Inflation eroded real balances and resulted<br />
in a lack of long term funds that could be used <strong>for</strong> housing. Consequently, homes were<br />
purchased with cash and short term personal loans.<br />
Economic stabilization, which began to take effect in the early 1990s, made mortgage<br />
lending possible. Interest rates, which were in the 4 digits in 1990, were down to the<br />
single digits by 1994. Contagion from the Mexican financial crisis of December 1994<br />
dampened the growth of the mortgage market but it has since experienced a recovery.<br />
2 4 1
Since 1994, the trend of the market has seen a gradual increase. Outstanding mortgage<br />
debt increased from $ 5.2 billion in 1994 to $ 16.5 billion in 1999. On a per capita basis<br />
mortgage debt grew over 90%, from $ 137 to $ 264, between 1994 and 1998.<br />
In addition to stable macroeconomic policy, other factors contributing to the gradual<br />
growth of the mortgage market include: increasing sophistication of lenders, ability of<br />
lenders to access long term funds, the development of mortgage securitization and the<br />
Central Bank’s focus on standardization of mortgage product and documentation.<br />
Millions of Pesos<br />
Year BH<br />
Lending*<br />
BH<br />
Outstanding<br />
Countrywide <strong>International</strong> Consulting Services<br />
System<br />
<strong>Mortgage</strong> Debt<br />
Outstanding<br />
System<br />
Lending**<br />
Outstanding<br />
<strong>Mortgage</strong><br />
Debt/GDP<br />
1996 844 3,287 11,000 - 3.45%<br />
1997 989 3,084 12,800 1,992 3.70%<br />
1998 - 3,629 15,387 2,300 3.83%<br />
1999 425 4,625 16,500 1,274<br />
Source: Cardiff Consulting Services, Argentina: <strong>Market</strong> Review, October 1998<br />
*Including Construction Loans<br />
**Estimated<br />
There are two primary sources <strong>for</strong> housing finance in Argentina: Commercial banks and<br />
programs funded by the Banco Hipotecario (BH). In addition, a government run program,<br />
FONAVI, provides subsidized housing to the lowest income sectors. Finally, there are an<br />
indeterminate number of investment clubs known as Circulo Cerrados (known in Mexico<br />
as Autofinanciamientos) which provide housing loans through in<strong>for</strong>mal contract savings<br />
programs.<br />
The Argentine mortgage market is dominated by the Banco Hipotecario (BH). For the<br />
past five years, BH has funded 40% of all residential mortgages. The BH was originally<br />
started as a government-housing bank active in both the construction and financing of<br />
residential dwellings. The charter of BH was changed in 1990 to that of a second tier<br />
housing bank, purchasing mortgages from banks on recourse and issuing bonds in the<br />
domestic and international capital markets. After its privatization in 1997, BH shut down<br />
its conduit activities and re-entered the market through a retail branch network. In 2000 it<br />
re-activated its conduit network.<br />
As of December 1999, the BH loan portfolio totaled US$ 4.6 billion. In 1999 BH funded<br />
approximately $ 425 million in total mortgages. The BH mortgage portfolio consists of<br />
both fixed and adjustable mortgages denominated in both Pesos and Dollars. BH mainly<br />
provides financing <strong>for</strong> the purchase of residential housing. However, BH, in conjunction<br />
with other private and public sector banks, also provides lines of credit to residential<br />
builders.<br />
2 4 2
BH provides various methods <strong>for</strong> the financing of housing. These include Certificados de<br />
Ahorro Popular para la Vivienda (CAPVs) and Titulos de Ahorro y Vivienda (TIAVIs).<br />
The CAPVs are a type of contract savings program and are denominated in Dollars. The<br />
savings account has a term of two years and an interest rate of LIBOR plus 2%. After<br />
maturity the holder of a CAPV can receive a mortgage. The maximum amount of the<br />
mortgage is 2.5 times the final value of the CAPV with a maximum loan amount of US$<br />
10,000. The term of the loan can be between 5 and 15 years and carries an interest rate of<br />
LIBOR plus 8%. TIAVIs are bullet bonds issued by the BH in Dollars, with an interest<br />
rate of LIBOR plus 2%. The bonds are payable quarterly <strong>for</strong> a period of four years. The<br />
funds obtained from the TIAVI are used to finance the purchase of finished housing<br />
construction.<br />
In July 1997, the Argentine Congress passed a Privatization Law, which trans<strong>for</strong>med the<br />
bank into an incorporated company. BH’s privatization took place in March 1999,<br />
through an initial public offering in which the government sold 42 million shares (46% of<br />
BH). A group of related real estate companies controlled by the George Soros Group<br />
gained a 14.5% stake in BH and call options to acquire an additional 13%. Additional<br />
shareholders include various construction companies with 5%, employees with 5%, and<br />
other private investors. It is expected that the government will sell the remainder of its<br />
shares in 2000.<br />
The commercial banking sector has undergone a process of consolidation. At the<br />
beginning of the 1980s there were about 500 banks in Argentina. As of June 1998, there<br />
were 132 banks: 19 state-owned, provincial and municipal banks and 113 private banks.<br />
Because of high consumer demand the commercial banks have increased their respective<br />
levels of mortgage lending. Commercial banks provide almost 60% of the finance <strong>for</strong><br />
residential housing. They originate approximately US$ 1 billion per year and currently<br />
hold US$ 6.5 billion in portfolio. Despite the increase in mortgage lending, most<br />
commercial banks run relatively less efficient operations than do banks in the United<br />
States; this translates into high spreads (e.g., the average spread between 30 day deposits<br />
and 10 year Pesos denominated mortgages in 1997 was 5.6%).<br />
The largest private mortgage lenders are Banco Galicia, Banco Río de la Plata, Banco<br />
Francés Bansud, Banco Crédito Argentino, and Banco Roberts and have a combined<br />
market share in the residential mortgage market of over 50%.<br />
The majority of mortgage lending is in US$. As of June 1999, 65% of outstanding<br />
mortgage portfolios were denominated in US$ with the remainder denominated in Pesos.<br />
US$ denominated mortgages usually have a 10-year term; interest rates on US$<br />
mortgages averaged 11% by the end of the second quarter 1998.<br />
Other mortgage products have also been introduced, such as the "12/16" mortgage which<br />
has a term of 12 years and a maximum LTV of 80%. Adjustable rate mortgages are also<br />
available and are denominated in both Pesos and Dollars. Loans are fully amortizing<br />
Countrywide <strong>International</strong> Consulting Services<br />
2 4 3
mortgages subject to prepayment in full without penalty, although penalties apply to some<br />
partial prepayments.<br />
LTVs have gradually increased since the early 1990’s. In 1996 LTVs typically ranged<br />
from 50% to 75%. Currently, commercial banks will lend up to 90% LTV providing the<br />
credit is of superior quality. The average loan size is approximately US$ 60,000.<br />
However, most commercial banks will lend as low as US$ 1,000.<br />
Year Money<br />
<strong>Market</strong><br />
Pesos<br />
Money<br />
<strong>Market</strong><br />
US$<br />
180 Day<br />
Residential<br />
Construction Loan<br />
(US$)<br />
Countrywide <strong>International</strong> Consulting Services<br />
Deposit<br />
30 Day<br />
Rate<br />
10 Year<br />
Peso<br />
<strong>Mortgage</strong><br />
Loan<br />
Reviewable rate<br />
saving &<br />
commercial<br />
banks<br />
1990 1517.88%<br />
1991 71.33% 61.68%<br />
1992 15.11% 16.78%<br />
1993 6.31% 11.34%<br />
1994 7.66% 6.20% 8.08% 16.18% 10.06%<br />
1995 9.46% 8.40% 11.90% 16.84% 17.85%<br />
1996 6.23% 5.91% 15.45% 9.50% 13.00% 10.51%<br />
1997 5.85% 5.99% 14.84% 6.20% 11.84% 9.24%<br />
1998 7.56% 12.38% 10.64%<br />
Source: Cardiff Consulting Services, Argentina: <strong>Market</strong> Review, October 1998<br />
Interest rates have come down considerably since the early 1990s. This has helped fuel<br />
the increased demand <strong>for</strong> mortgage finance. Peso denominated mortgages typically carry<br />
a higher interest rate than do US$ denominated mortgages; as of March 1998 the spread<br />
between the two was approximately 1.38%.<br />
The secondary mortgage market is small, but it is continuing to develop. Aided by<br />
changes in securities and banking laws, BH has completed four securitizations since<br />
1997. The first was a US$ 93 million issue with a 76:24 blend of variable rate and fixed<br />
rate mortgage respectively. The second issue was US$ 106 million with at 47:53 blend of<br />
variable and fixed rate mortgages. The senior securities achieved an investment grade<br />
rating in the US (higher than the Argentine sovereign rating at the time of issue) through<br />
the use of senior subordination and reserve funds <strong>for</strong> credit enhancement. BH’s last<br />
securitization took place in March of 2000. The principle amount of the securitization<br />
was US$ 195 million with both variable and fixed rate securities. The average rate was<br />
10.59%. It is anticipated that BH will continue to securitize, thus increasing the<br />
availability of funds in the mortgage market.<br />
Policy Developments<br />
Fondo Nacional de la Vivienda (FONAVI) provides housing and housing finance to low<br />
income families. It uses funds obtained through a payroll tax to fund subsidized housing.<br />
FONAVI produces approximately 25,000 homes per year.<br />
2 4 4
In recent years the Argentine legal system has been revised in order to facilitate the<br />
development of the primary mortgage market. Laws 19.550 and 24.441 are of particular<br />
relevance.<br />
Law number 19.550 article 118 stipulates that publicly held corporations, limited<br />
partnerships, civil associations, cooperatives and corporations may issue debt securities in<br />
Pesos or any other <strong>for</strong>eign currency and secured by mortgages and other financial<br />
instruments.<br />
Law 24.441 specifically addresses the issues of securitization. It provides, among other<br />
things, the ability to <strong>for</strong>eclose on delinquent property, allows the reassignment of<br />
mortgages without the authorization of the mortgagor, reduction in notario fees, and a<br />
<strong>for</strong>mat <strong>for</strong> standardizing loans.<br />
In mid-2000, BH and the <strong>International</strong> <strong>Finance</strong> Corporation announced the creation of the<br />
SCCH, a conduit company chartered to purchase mortgage loans and issue mortgagebacked<br />
securities from BH and other banks.<br />
Sources and References<br />
1. Banco de Galicia - www.bancogalicia.com.ar<br />
2. Banco Hipotecario<br />
3. Banco Central de la República Argentina (BCRA) http://www.bcra.gov.ar/<br />
4. Secretaría de Hacienda (Ministry of <strong>Finance</strong>) Inversiones y Representaciones S.A.<br />
(IRSA) (Residential and Commercial Real Estate Developer) www.irsa.com.ar<br />
5. DEBA Memoria Anual 1993-1996. Asociacion de Bancos Argentinos.<br />
6. Ambito Financiero, Argentina. Various issues<br />
7. Banco Hipotecario Annual Report 1999<br />
8. Boletín Estadístico, various months, Banco Central de la República Argentina.<br />
9. Barron’s “In Business Again: Don’t cry <strong>for</strong> Argentina’s property market” March 30,<br />
1998.<br />
10. Duff & Phelps Credit Rating Co., BH I <strong>Mortgage</strong> Fund, Residential <strong>Mortgage</strong>-Backed<br />
New Financing Report, 1996<br />
11. El Cronista, Argentina. Various issues<br />
12. Memoria Anual 1997, Banco Central de la Repœblica Argentina.<br />
13. Prensa Económica, Argentina. Various months.<br />
Countrywide <strong>International</strong> Consulting Services<br />
2 4 5
BRAZIL<br />
Economic Background<br />
Year<br />
Exchange Rate<br />
Real/US$<br />
Consumer Price<br />
Index<br />
Countrywide <strong>International</strong> Consulting Services<br />
Change In<br />
Consumer Prices<br />
1990 2947.73%<br />
1991 432.79%<br />
1992 0.14 951.65%<br />
Real US$<br />
Nominal GDP<br />
(Millions)<br />
Nominal<br />
GDP<br />
(Millions)<br />
1993 0.12 2.77 1927.98% 14,097 117,476<br />
1994 0.85 60.24 2075.89% 349,205 410,829<br />
1995 0.97 100.00 66.01% 646,192 666,177<br />
1996 1.04 115.76 15.76% 778,887 748,930<br />
1997 1.12 123.78 6.93% 864,111 771,528<br />
1998 1.21 127.74 3.20% 899,814 743,648<br />
1999 1.79 133.95 4.86% 960,858 536,792<br />
Source: IMF<br />
Prior to the institution of the RealPlan in 1994, uncontrollable inflation rates had<br />
disrupted economic activity and discouraged <strong>for</strong>eign investment. Since 1994, tight<br />
monetary policy has brought inflation to more controllable levels, with consumer prices<br />
increasing by only 3% in 1998, as compared to more than 2000% in 1994. Inflation<br />
increased somewhat in 1999, up to 4.8%.<br />
Brazil’s economic per<strong>for</strong>mance during 1998 was strongly impacted by its attempts to<br />
insulate the country from the external economic problems in Asia and Russia. In an<br />
ef<strong>for</strong>t to preserve investor confidence, interest rates in Brazil were doubled to<br />
approximately 43% in October 1997. The Real was subsequently devalued stimulating<br />
export growth and the economy began to recover in 1999.<br />
Brazil has experienced a decreasing trend in economic growth and an increase in<br />
unemployment (the unemployment rate jumped to 7.8% by the first half of 1998.) This<br />
decreasing trend was consistent throughout much of the past ten years due to inflation and<br />
a tightened credit sector. Resulting from the hyperinflation of the early 1990s, it is very<br />
difficult to compare GDP figures from earlier periods. However, it is estimated that GDP<br />
growth slowed from 5.7% in 1994 to 3.0% in 1997.<br />
<strong>Housing</strong> <strong>Market</strong><br />
Brazil's population of 160 million is the largest in Latin America and the sixth largest in<br />
the world. Demand <strong>for</strong> housing is particularly high; some estimates put the housing<br />
deficit at over 5 million units with additional requirements at 1 million units per year.<br />
2 4 6
According to the 1991 Population Census, approximately 70% of all residential homes<br />
are owner-occupied, while 16% are rented, 13% are lent, and 1% are classified as other.<br />
Additionally, most residential units are located in high rise buildings called vertical<br />
condominiums. The most common size of living space consists of 2 bedrooms, a living<br />
room, bath and kitchen.<br />
In March 1999, national construction costs were at R$ 287.75 per square meter, reflecting<br />
a 1.73% increase since January of that year. The total increase in construction costs <strong>for</strong><br />
1998 was only 1.56%. Despite increases in construction costs, housing prices are<br />
generally decreasing, with the exception of prices in Sao Paulo (which are the highest in<br />
the country). From April 1998 to April 1999, the average price per square meter in the<br />
rest of the country decreased by 26%. Urbanization is increasing at a rapid rate, resulting<br />
in an increased demand <strong>for</strong> cost-effective, low-income housing.<br />
<strong>Mortgage</strong> <strong>Market</strong><br />
Since the 1960s Brazil's housing finance system has been based on the legal and<br />
regulatory framework of the Sistema <strong>Finance</strong>iro Habitaçao (SFH). The SFH helped<br />
provide housing finance by channeling funds from special savings programs and the<br />
national worker’s compensation/unemployment fund, the Fundo de Garantia do Tempo<br />
de Servico (FGTS), to long term financing <strong>for</strong> the purchase or construction of residential<br />
housing. The current outstanding balance of loans originated through this system is<br />
approximately US$ 36.1 billion or only 0.5% of GDP.<br />
Under the SFH system, deposit taking institutions are required by law to invest at least<br />
70% of their SFH deposits (basic passbook-type savings deposits) in housing loans with<br />
a 12% real rate ceiling on the interest rate. As of February 1999 savings deposits that<br />
were required to be invested in housing totaled over 26% of the total deposits held by<br />
Brazilian financial institutions. Of the remaining 30% of deposits, 15% is placed on<br />
reserve at the Central Bank and 15% can be invested in any legal investment- including<br />
housing - with no interest rate limits. It was indicated by a number of banks that very little<br />
of the remaining 15% is actually invested in residential housing.<br />
The deposit rate <strong>for</strong> the SFH is set by the government, and as of spring 1999, it was 6%<br />
per year plus inflation. This results in a 6% real rate spread between SFH mortgages and<br />
deposits. However, none of the top banks invested more that the required 70% in<br />
mortgages. <strong>Mortgage</strong>s are originated only as necessary to maintain the 70% investment<br />
ratio (and to avoid a large penalty.)<br />
After almost collapsing in the late 1980s and early 1990s, the Brazilian residential<br />
housing finance sector has managed to survive but has not grown appreciably. While the<br />
number of residential units financed increased from 62,794 in 1995 to 85,487 in 1997, in<br />
nominal terms, the total R$ value of originations declined 22%. This is due, in large part<br />
to the hesitancy of commercial banks to originate any more than the required amount of<br />
savings system loans. It is also due to commercial banks severely rationing credit <strong>for</strong><br />
Countrywide <strong>International</strong> Consulting Services<br />
2 4 7
non-subsidized mortgages to only the highest wage earners (approximately the top 5% of<br />
the income distribution). Official statistics on lending to this sector were unavailable,<br />
although estimates based on Central Bank estimates indicate an outstanding balance of<br />
approximately US$ 3 billion <strong>for</strong> non-subsidized residential loans.<br />
<strong>Mortgage</strong> Originations- System Total<br />
Originations<br />
(R$Million)<br />
Originations<br />
(US$Million)<br />
Countrywide <strong>International</strong> Consulting Services<br />
Number of Units<br />
<strong>Finance</strong>d<br />
1995 1,877 1,804 62,794<br />
1996 1,463 1,306 96,787<br />
1997 1,724 1,425 85,487<br />
1998 2,095 1,211 -<br />
Source: Central Bank<br />
The largest originator in the country is Caixa Econômica Federal. It originates mortgages<br />
through a number of different programs, the largest of which utilizes a 12% rate mortgage<br />
indexed to the TR. It funds its mortgage operations with the resources of the worker's<br />
unemployment fund, the Fundo de Garantia do Tempo de Serviço (FGTS) and SFH<br />
deposits. The FGTS was established in 1966, and it was designed to provide insurance in<br />
the case of unemployment. The fund is capitalized through a mandatory 8% contribution<br />
made by an employer on behalf of its employees. The largest commercial mortgage<br />
originator is Bradesco. Bradesco is also the largest commercial bank in Latin America.<br />
In 1998 it had total assets of US$ 40.9 billion.<br />
While it is still being driven mainly by government sponsored or mandated programs,<br />
significant changes are taking place in the sector. In particular, Brazil is now in the<br />
process of replacing the old SFH with a new system, the Sistema <strong>Finance</strong>iro Imobiliário<br />
(SFI). While many of the SFH programs will be maintained, the SFI will provide legal<br />
mechanisms that will allow lenders to rapidly <strong>for</strong>eclose on delinquent mortgages. The SFI<br />
also provides the legal and regulatory framework <strong>for</strong> allowing the securitization of<br />
mortgages.<br />
Originations made between 1968 and 1994 consisted of dual-index (DIM) mortgages.<br />
DIMs were designed to protect a borrower against payment shock in a volatile<br />
macroeconomic environment while maintaining inflation adjusted return <strong>for</strong> the lender.<br />
DIMs have been given partial responsibility <strong>for</strong> the Brazilian bank crises. These loans<br />
were replaced by price-level adjusted mortgage (PLAM) in 1994, which is set at a fixed<br />
interest rate and then indexed on a monthly basis to the TR index.<br />
The average loan size <strong>for</strong> housing is approximately R$ 60 thousand, and banks require<br />
borrowers to earn a minimum of R$ 2,000 – R$ 2,500 per month be<strong>for</strong>e they can be<br />
eligible <strong>for</strong> a loan. This income range eliminates over 75% of the population from<br />
lending programs.<br />
In 1996, the mortgage debt to GDP ratio was 7.7%, but the mortgage debt outstanding<br />
increased from R$ 46.5 million to R$ 59.7 million during the same period due to negative<br />
2 4 8
amortization. For example, originations decreased from R$ 1,877 million in 1995 to R$<br />
1,463 million in 1996. Non-per<strong>for</strong>ming loans are a very significant aspect of the<br />
Brazilian mortgage portfolios. As of February of 1999, the housing finance sector<br />
possessed R$ 4.5 billion in defaulted mortgages.<br />
Residential <strong>Mortgage</strong> <strong>Market</strong> (Millions) US$<br />
Year <strong>Mortgage</strong><br />
Debt<br />
Outstanding<br />
New<br />
Originations<br />
Countrywide <strong>International</strong> Consulting Services<br />
Outstanding<br />
<strong>Mortgage</strong><br />
Debt/GDP<br />
<strong>Mortgage</strong><br />
Debt<br />
Outstanding<br />
New<br />
Originations<br />
1994 46,499.00 54,704.71<br />
1995 56,184.00 1,877.00 13.30% 57,921.65 1,935.05<br />
1996 59,696.00 1,463.00 7.70% 57,400.00 1,406.73<br />
1997 62,413.00 1,724.00 7.20% 55,725.89 1,539.29<br />
1998 67,066.00 2,095.00 7.40% 55,426.45 1,731.40<br />
1999 N/A N/A N/A N/A N/A<br />
Source: IDB<br />
Policy Developments<br />
The IMF created a 3-year stand-by agreement <strong>for</strong> SDR 13 billion, which was approved on<br />
November 13, 1998, and provided the nation with much needed credibility. The<br />
agreement was revised in March of 1999, leaving the country with a goal of obtaining a<br />
3.1% surplus GDP in 1999, 3.25% surplus GDP in 2000, and 3.35% surplus GDP by<br />
2001. These goals were necessary to lower the net public sector debt, which had jumped<br />
to approximately 53% of GDP in January of 1999, to 46% of GDP by the end of 2001.<br />
The Companhia Brasileira de Securitização (CIBRASEC) was created in 1997 to become<br />
the catalyst agent of the mortgage market in Brazil. The CIBRASEC concept is based on<br />
the successful model of the securitization companies in the US such as Fannie Mae.<br />
CIBRASEC, a private company will be the main agent of the secondary market <strong>for</strong> real<br />
estate receivables in Brazil.<br />
Sources and References<br />
1. IDB Country Assessment: Brazil, by James D. Dinsmoor (Country Economist)<br />
http://www.iadb.org/regions/re1/sep/br/br-sep.htm<br />
2. CIA World Fact Book – September 1999<br />
3. World Bank, www.worldbank.org<br />
4. Bernstein, Steven A. “Real Estate <strong>Finance</strong> in Brazil: The State of the <strong>Market</strong> 1999.”<br />
Prepared <strong>for</strong> the <strong>Mortgage</strong> Bankers Association of America, June 1999<br />
5. Pinto-Lima, L., “<strong>Mortgage</strong> Lending in Brazil”, <strong>Housing</strong> <strong>Finance</strong> <strong>International</strong>, June<br />
1998<br />
Contacts<br />
1. ABECIP - Associação Brasileira das Entidades de Crédito Imobiliário e Poupança<br />
Avenida Paulista, 1439 - sobreloja<br />
2 4 9
Cep - 01311-200 São Paulo - SP<br />
Tel: (55 011) 285-4855<br />
Fax: (55 011) 284-8366<br />
Email: abecip@abecip.org.br<br />
2. CIBRASEC<br />
Brazilian Securitization Company<br />
Tel: (55 011) 3266-3223<br />
Fax: (55 011) 3266-3229<br />
Email: www.cibrasec.com.br<br />
Countrywide <strong>International</strong> Consulting Services<br />
2 5 0
CHILE<br />
Economic Background<br />
Year Exchange Rate<br />
Pesos /US$<br />
Consumer Price<br />
Index<br />
Countrywide <strong>International</strong> Consulting Services<br />
Change In<br />
Consumer Prices<br />
Pesos US$<br />
Nominal GDP<br />
(Millions)<br />
Nominal GDP<br />
(Millions)<br />
1990 336.86 52.32 26.03% 9,245,500 27,446.12<br />
1991 374.87 63.72 21.78% 12,100,500 32,279.19<br />
1992 382.33 73.55 15.43% 15,185,400 39,718.04<br />
1993 431.04 82.91 12.73% 17,974,900 41,701.23<br />
1994 404.09 92.39 11.44% 21,395,300 52,946.87<br />
1995 407.13 100.00 8.24% 25,875,700 63,556.36<br />
1996 424.97 107.36 7.36% 28,268,400 66,518.58<br />
1997 439.81 113.95 6.14% 31,774,000 72,244.83<br />
1998 473.77 119.77 5.11% 33,577,700 70,873.42<br />
1999 530.07 123.76 3.34% 34,326,700 64,758.81<br />
Source: IMF, IDB<br />
Chile experienced a steady increase in GDP throughout 1991-97, falling only with the<br />
international economic crises of 1998. With inflation decreasing, the government has<br />
made ef<strong>for</strong>ts to develop <strong>for</strong>eign export markets. The Chilean economic goal of 5%<br />
economic growth depends on world prices, continued <strong>for</strong>eign investment, and the<br />
government’s ability to maintain favorable financial accounts. Chile’s economic outlook<br />
is positive. Recent political changes in the government have not had a substantial impact<br />
on the Chilean economic environment.<br />
From 1991 to 1997, Chile experienced an average 7% growth in GDP, with the service<br />
industry as its largest contributor. This indicates an increase in productivity, which in<br />
turn means more employment. In 1990, the unemployment rate was at 8.1%, and was<br />
approximately 6.1% by the end of the third quarter 1998. Inflation in Chile has seen a<br />
decreasing trend, and the rate during 1999 was the lowest in 60 years. The average annual<br />
inflation rate by 1998 was 5.11%, compared to 26.03% annual inflation during 1990.<br />
<strong>Housing</strong> <strong>Market</strong><br />
The housing market has seen improvement in the last six years. The average household<br />
size has decreased to 3.7 individuals per family unit, compared to the ratio of 4.1 in 1992.<br />
The population in Chile has gone from 13.1% in 1990 to 14.8% in 1998, creating a<br />
significant demand <strong>for</strong> new homes. Chile’s inability to meet demand with adequate<br />
funding has resulted in the existence of the country’s housing shortage.<br />
There were approximately 141,000 housing starts in 1996, and it is estimated that over<br />
the next 25 years, Chile will need 1.8 million new homes. According to government<br />
estimates, in order to meet the market pressures resulting from the new rates of household<br />
size and to prevent the expansion of the housing shortage, approximately 82,000 new<br />
dwellings will need to be developed each year. This presents a potentially favorable<br />
mortgage market, with approximately half of the total private housing market (without<br />
2 5 1
subsidies) centered in Santiago, the nation’s capital. However, over the last year new<br />
Chilean housing construction has been plagued by the adverse effects of a recession. To<br />
reduce the large numbers of unoccupied new homes already on the market, the Chilean<br />
government has introduced tax incentive plans to motivate new buyers.<br />
<strong>Mortgage</strong> <strong>Market</strong><br />
Millions Pesos US$ (Millions)<br />
Year <strong>Mortgage</strong> Debt<br />
Outstanding<br />
New<br />
Originations<br />
Countrywide <strong>International</strong> Consulting Services<br />
Outstanding<br />
<strong>Mortgage</strong><br />
Debt/GDP<br />
<strong>Mortgage</strong> Debt<br />
Outstanding<br />
New<br />
Originations<br />
1990 601,631.96 6.51% 1,786.00 0.00<br />
1991 826,963.22 133,453.72 6.83% 2,206.00 356.00<br />
1992 1,065,553.71 182,753.74 7.02% 2,787.00 478.00<br />
1993 1,435,794.24 256,468.80 7.99% 3,331.00 595.00<br />
1994 2,055,201.74 132,541.52 9.61% 5,086.00 328.00<br />
1995 2,834,846.19 123,767.52 10.96% 6,963.00 304.00<br />
1996 2,987,964.07 122,816.33 10.57% 7,031.00 289.00<br />
1997 3,359,708.59 127,984.71 10.57% 7,639.00 291.00<br />
Source: Pardo<br />
The Chilean housing finance market is the maturest market in Latin America. Long term<br />
mortgage financing <strong>for</strong> terms up to 30 years was reintroduced to the Chilean economy in<br />
the 1970s after the attempts of failed savings and loans to utilize inflation-indexed<br />
financing. Since the early 1980s, revenues from the fully funded private pension plans<br />
and other institutional investors have contributed to the ability of the capital market to<br />
attract mortgage backed securities.<br />
The mortgage market in Chile is fairly small, with the 1997 outstanding mortgage debt to<br />
GDP ratio at approximately 11%. New originations in 1997 were slightly under US$ 300<br />
million, while outstanding mortgages alone were estimated at US$ 7.6 billion during the<br />
same period. The average outstanding unsubsidized loan balance was US$ 21,900 at the<br />
beginning of 1997.<br />
The standard instrument in Chile is an inflation indexed fixed rate mortgage. The loan<br />
has a fixed rate of interest with the mortgage balance and hence payment indexed <strong>for</strong><br />
inflation. Rates have dropped nearly 1.5 points in the past decade, down to around 8% in<br />
1999. Rates did spike up after the Brazilian devaluation to around 11% in 1998.<br />
There are two types of mortgage finance instruments used in Chile, the <strong>Mortgage</strong> Letter<br />
or <strong>Mortgage</strong> Bond and the <strong>Mortgage</strong> Loan or Endorsable <strong>Mortgage</strong> Credits (EMC). With<br />
a mortgage letter, a bank takes a mortgage <strong>for</strong> a housing acquisition in a given amount<br />
and term, issues certificates (or letters), which are securities offered to the investors of the<br />
property at a discount rate. The mortgage loan is a mortgage backed security in the <strong>for</strong>m<br />
of money, not certificates, and can be pooled and converted into assets with great<br />
liquidity and low risk.<br />
2 5 2
The banking system has been the main originator of housing loans, mostly financed by<br />
the sale of their long-term mortgage-backed bonds in the Santiago Stock Exchange.<br />
Representing the liabilities of the issuing bank, Chile’s mortgage lending backed by<br />
mortgage bonds equaled US$ 6.2 billion at the end of 1997. The face value of the bond<br />
can be issued <strong>for</strong> up to 75% of the property given as collateral, and monthly payments<br />
may not exceed 25% of the borrower’s income. These financing tools can be utilized <strong>for</strong><br />
general financing or <strong>for</strong> housing financing purposes.<br />
<strong>Mortgage</strong> Bonds —or “Letras de Crédito”, as they are called in Chile’s Banking Law—<br />
are the most traditional tools <strong>for</strong> mortgage financing. Banks issue bonds on behalf of<br />
borrowers, which are sold on the Stock Exchange at market value (similar to the Danish<br />
system). Capital <strong>for</strong> mortgage bond type financing comes mostly from pension funds with<br />
49% of the total mortgage bond holdings. Banks and life insurance companies make up<br />
another 47%. Less than 1% comes from <strong>for</strong>eign investment funds.<br />
Newer to Chile’s financial market are the Endorsable <strong>Mortgage</strong> Credits, EMC <strong>for</strong> short –<br />
the “mutuo hipotecario endosable” in Spanish. These mortgage instruments can be either<br />
issued by banks or mortgage credit companies. The maximum LTV ratio allowed <strong>for</strong><br />
EMC issuance is equal to 80%, and the payments may not exceed 30% of the borrower’s<br />
income. EMC are generally used <strong>for</strong> commercial real estate and higher priced housing.<br />
The total of EMC stock reached US$ 2.42 billion at the end of 1997. Across the market<br />
EMC are not the popular choice <strong>for</strong> financing. EMC are not considered securities, but<br />
they are intended to be sold to secondary market conduits that would then pool and<br />
securitize them. At the end of 1997 investors other than the originators held 37.5% of<br />
EMC balances. A market has developed, and the securitization of pooled EMC is an<br />
undeveloped business opportunity in the Chilean market.<br />
A revised securitization law was passed in August 1999 which eased some of the<br />
restrictions present in the prior law. According to Moody’s, there are still significant<br />
obstacles to securitization in general and to a bank’s ability to securitize its own assets in<br />
particular.<br />
Policy Developments<br />
The government continues to be extremely active in (subsidized) housing finance. In<br />
1997, the private sector originated 79,000 (58%) of the new loans, while the public sector<br />
originated 58,000 (42%) of new loans. Two thirds of the sector is subsidized with the<br />
state providing up-front grants <strong>for</strong> house purchases. The state-owned Banco del Estado is<br />
Chile’s largest loan originator, but its market share decreased from 40% in 1996 to 36%<br />
in 1997. Competition in Chile’s housing finance market has been the cause <strong>for</strong> this<br />
reduced market share. Competition has in turn resulted in lower financing costs, but the<br />
costs are still higher than other developed markets.<br />
Sources and References<br />
13. IMF Statistics, 2000<br />
Countrywide <strong>International</strong> Consulting Services<br />
2 5 3
14. IDB Country Assessment: Chile, by Roberto Garcia Lopez (Country Economist)<br />
http://www.iadb.org/regions/re1/sep/ch/ch-sep.htm<br />
15. World Bank, www.worldbank.org<br />
16. El Banco Central de Chile<br />
17. http://www.bcentral.cl/Indicadores/Excel/tasabcch.xls<br />
18. CIA World Fact Book, 1999<br />
19. Garcia, Pedro D. “Real Investment Opportunities in Chile.” December 1999<br />
20. Moodys, “<strong>International</strong> Asset-Backed Securities <strong>Market</strong>s: The Expansion Continues”,<br />
February 2000<br />
21. Pardo, Claudio A.“<strong>Housing</strong> Financing in Chile.” <strong>Housing</strong> <strong>Finance</strong> <strong>International</strong>,<br />
September 1999<br />
Countrywide <strong>International</strong> Consulting Services<br />
2 5 4
COLOMBIA<br />
Economic Background<br />
Year Exchange Rate<br />
Peso /US$<br />
Consumer Price<br />
Index<br />
Countrywide <strong>International</strong> Consulting Services<br />
Change In<br />
Consumer Prices<br />
Peso US$<br />
Nominal GDP<br />
(Billions)<br />
Nominal GDP<br />
(Billions)<br />
1990 568.73 32.87 29.14% 20,228 35.57<br />
1991 706.86 42.86 30.40% 26,107 36.93<br />
1992 811.77 54.45 27.03% 33,515 41.29<br />
1993 917.33 66.76 22.61% 43,898 47.85<br />
1994 831.27 82.67 23.84% 67,533 81.24<br />
1995 987.65 100.00 20.96% 84,439 85.49<br />
1996 1,005.33 120.24 20.24% 100,711 100.18<br />
1997 1,293.58 142.92 18.86% 121,708 94.09<br />
1998 1,507.52 172.01 20.35% 142,543 94.55<br />
1999 1,873.77 191.30 11.21% 152,195 81.22<br />
Source: IMF, IDB; *Bank of Republic of Colombia 1999 Nominal GDP est<br />
Columbia has developed a reputation <strong>for</strong> being one of Latin America’s most stable<br />
economies attributed to its conservative economic policies. In the 1980s when most of the<br />
other economies in Latin America were collapsing, Columbia managed their external debt<br />
with no defaults or renegotiations. More recently, the Russian and Asian market crisis<br />
have embedded their mark on Columbia’s economy.<br />
The GDP growth rate in 1998 was a mere 0.2%, the lowest growth rate in 50 years. This<br />
can be attributed to a combination of low world oil prices, reduced export demand,<br />
guerrilla violence, the thriving illegal drug industry, and a loss of investment flows. The<br />
Central Bank was <strong>for</strong>ced to increase interest rates and the monetary policy was tightened<br />
with hopes of defending the Peso against increasing deficits. The increasing political and<br />
economic uncertainties have slowed the economy, as well as the government’s ability to<br />
implement its social and economic agenda. The nation went from having a fiscal surplus<br />
of 2.5 % in 1994, to a fiscal deficit of 2.4% by 1999. In addition to this fiscal deficit in<br />
GDP, government was <strong>for</strong>ced to declare emergency measures to prevent a banking crisis.<br />
Inflation remains high and consistent. In 1991, inflation had reached more than 30%,<br />
decreasing to 18.86% by 1997, and again experiencing an increase to 20.35% by 1998.<br />
The decade ended with a significant decrease in inflation with rates dropping to 11.21%<br />
in 1999. Meanwhile, the unemployment rate peaked to nearly 20% (of a 16.8 millionlabor<br />
<strong>for</strong>ce), the highest in decades. Interest rates have been high in the nation’s attempts<br />
to defend the Pesos and avoid a banking crisis similar to those experienced throughout the<br />
region.<br />
2 5 5
Interest Rates<br />
Year Interbank Money<br />
<strong>Market</strong><br />
Deposit Rate <strong>Mortgage</strong> Rates<br />
1990 36.44% 42.25%<br />
1991 37.23% 47.13%<br />
1992 26.67% 37.28%<br />
1993 25.84% 35.81%<br />
1994 29.42% 40.47%<br />
1995 22.40% 32.34% 42.72%<br />
1996 28.37% 31.15% 41.99%<br />
1997 23.83% 24.13% 34.22%<br />
1998 35.00% 32.58% 42.24%<br />
Source: IMF, IDB<br />
A national development plan, known as “el Salto Social” or the “Social Leap”, has been<br />
initiated. The program focuses on four areas: 1) social development, 2) increasing<br />
economic competitiveness, 3) environment and decentralization, and 4) institutional<br />
strengthening. Some key objectives of the plan are to create 1.6 million new jobs and<br />
generate an economic growth rate of 5.3% annually. To implement their plan the<br />
Colombian government has initiated steps such as devaluation of the currency, creation of<br />
lines of credit <strong>for</strong> financial institutions, and projects to enable refinancing. Also, loan<br />
assistance has been granted from the Inter American Bank, World Bank, and investments<br />
from the <strong>International</strong> <strong>Finance</strong> Corporation. An initial, favorable response to their plan<br />
resulted in a drop in the market interest rate to near 20% in 1995, but it returned to an<br />
escalated 35% in 1998. Also to further develop the secondary mortgage market,<br />
securitization companies have been anticipated in the development of a legal framework<br />
that would enable them to purchase mortgages from originators and convert them into<br />
securities.<br />
<strong>Housing</strong> <strong>Market</strong><br />
The majority of the Colombian housing market is concentrated in urban areas. In 1993,<br />
census statistics estimated that the existing housing stock was 6.9 million units. In 1998<br />
it was estimated that of the approximate 7.1 million homes within the country, almost 5.4<br />
million exist in urban areas. The population in 1998 was 40.83 million. According to the<br />
National Planning Department, the number of households will double by the year 2020.<br />
There<strong>for</strong>e, over the next 20 years it will be necessary to build more than 4 million new<br />
residences.<br />
Colombia’s social housing stock is made up of dwellings priced up to 2,300 UPACs (Unit<br />
of Constant Purchasing Power), or approximately US$ 20,250. These dwellings are<br />
subsidized through government supported funds totaling around US$ 2000 each.<br />
<strong>Mortgage</strong> originators are required to allocate 20% of their total funding to social housing<br />
with a 20% down payment coming from the borrower. Current estimates place the total,<br />
social housing portfolio at US$ 1.8 billion with an average, social housing loan size of<br />
US$ 6,000 and monthly payment of approximately US$ 93.<br />
Countrywide <strong>International</strong> Consulting Services<br />
2 5 6
<strong>Mortgage</strong> <strong>Market</strong><br />
The Colombian home finance industry was created in 1972 with the exclusive purpose of<br />
acquiring savings from the public and originating mortgages in UPAC (Unit of Constant<br />
Purchasing Power) instead of the national currency (Peso). The UPAC mortgage is a type<br />
of price-level adjusted mortgage in which there is a fixed rate of interest and a periodic<br />
adjustment of the mortgage balance <strong>for</strong> inflation as measured by UPAC. One of the<br />
characteristics of the Colombian UPAC system is that it allows <strong>for</strong> small initial monthly<br />
payments, a key factor in developing countries that have low family incomes. The<br />
borrower is not required to pay the nominal rate (including expected inflation) of the loan<br />
in the early years. Rather the balance is adjusted to reflect UPAC variation. The basic<br />
idea is to maintain the value of the unpaid balance of the mortgage in terms of constant<br />
purchasing power. Under the UPAC system, more than 1 million mortgages have been<br />
originated, with approximately 800,000 outstanding, <strong>for</strong> a value of more than $9 billion.<br />
There are several types of lending institutions in Colombia. Commercial banks and<br />
mortgage companies are the largest contributors to mortgage financing with a 40% share<br />
of the market (DAVIVIENDA is the sole largest originator). Until 1990 only the savings<br />
and housing companies (CAVs) could issue inflation indexed deposits and loans. This<br />
facilitated the savings and housing corporations to build a strong capital foundation <strong>for</strong><br />
which to fund mortgage activity. In 1990 the legal basis <strong>for</strong> specialization was eliminated<br />
as were the privileges given to intermediaries like the CAVs. These measures were<br />
aimed at increasing competition among financial intermediaries. As a result of the<br />
change in the regulatory framework, many CAVs merged with bank holding companies<br />
or converted into commercial banks.<br />
When the financial system was opened up to competition, the UPAC <strong>for</strong>mula had to be<br />
changed to enhance the mortgage industry’s ability to compete <strong>for</strong> savings deposits. The<br />
UPAC was linked to a market interest rate by defining it as 74% of the DTF (name given<br />
to the CD rate). In this way, increases in the market rate would be reflected both in asset<br />
and liability yields. The system worked well <strong>for</strong> a number of years, but in the financial<br />
markets crisis of 1997-98, exaggerated increases in market rates of interest were reflected<br />
in mortgage balances and monthly installments. These increases exceeded, in many<br />
cases, the diminished capacity of borrowers affected by unemployment and the economic<br />
crisis. This produced a deterioration of credit quality and greatly increased the number of<br />
<strong>for</strong>eclosures and repossessions.<br />
Although the government has made progress in reducing interest rates, a decision of the<br />
Constitutional Court, reflecting political pressure, ordered the Central Bank to change the<br />
UPAC <strong>for</strong>mula and once again link it to inflation without reference to the level of the<br />
market interest rate. The government has received full power from the Congress to<br />
introduce necessary adjustments to ensure stability of the mortgage market. The solutions<br />
currently under analysis include expansion of the secondary mortgage market, support of<br />
the government in managing financial risk, and introduction of new long-term funding<br />
instruments such as mortgage bonds (letras hipotecarias).<br />
Countrywide <strong>International</strong> Consulting Services<br />
2 5 7
Real estate finance in Colombia also includes long-term mortgages and special loans <strong>for</strong><br />
builders, called construction loans. These construction loans are short-term credit lines<br />
granted to provide the liquidity needed to finance a construction project. The loan<br />
duration <strong>for</strong> a construction loan is calculated to the construction time plus the sales<br />
period. These construction loans are not typically paid off in cash, however. They are<br />
generally substituted with long-term mortgages granted to the buyers of the property.<br />
Combined exploration ef<strong>for</strong>ts of the Colombian Government and Davivienda resulted in<br />
the first mortgage securitization transaction in 1994. Duff & Phelps of Colombia had<br />
given a AAA rating to this initial deal that was also honored as the first securitization in<br />
Latin America. Since Davivienda’s first transaction, other Colombian savings and<br />
housing corporations have been introduced to the secondary mortgage market. The<br />
current total of Colombian mortgage backed securities in the market equal US$ 308<br />
million. The Colombian mortgage industry has only begun to realize the potential of the<br />
MBS market. Only 7% of the total mortgage portfolio are represented by securitized<br />
mortgages. Pension funds have been the main purchasers of MBS. A private pension<br />
fund system was created in Columbia in 1994. Eight pension funds currently manage a $<br />
3.5 billion portfolio with great growth potential.<br />
Sources and References<br />
1. IDB Country Assessment: Colombia, by Carlos Oliva (Country Economist)<br />
http://www.iadb.org/regions/re3/sep/co-sep.htm<br />
2. World Bank, www.worldbank.org<br />
3. CIA World Fact Book, 1999<br />
4. Forero, Efrain F. “The Home <strong>Mortgage</strong> Industry in Colombia.” <strong>Housing</strong> <strong>Finance</strong><br />
<strong>International</strong>, September 1999<br />
5. Gomez, Guillermo, “The <strong>Mortgage</strong> Business in Colombia”, <strong>Housing</strong> <strong>Finance</strong><br />
<strong>International</strong>, December 1996<br />
6. IMF: <strong>International</strong> Financial Statistics, 2000<br />
7. Yahoo Int’l <strong>Finance</strong> Center: Economist Intelligence Unit Briefs. August 15 2000. “<br />
Court Upholds Controversial New <strong>Mortgage</strong> System.” Available: Internet. September<br />
11, 2000. http://biz.yahoo.com/ifc/co/news/81500-1.html<br />
Countrywide <strong>International</strong> Consulting Services<br />
2 5 8
Ecuador<br />
Economic Background<br />
Year Exchange<br />
Rate Sucres/US$<br />
Consumer Price<br />
Index<br />
Countrywide <strong>International</strong> Consulting Services<br />
Change In<br />
Consumer<br />
Prices<br />
Sucres US$<br />
Nominal GDP<br />
(Billions)<br />
Nominal GDP<br />
(Billions)<br />
1990 767.75 19.17 -32.70% 8,204 10.69<br />
1991 1,046.25 28.53 48.80% 12,296 11.75<br />
1992 1,533.96 44.04 54.37% 19,414 12.66<br />
1993 1,919.11 63.85 44.97% 27,451 14.30<br />
1994 2,196.72 81.38 27.45% 36,478 16.61<br />
1995 2,564.49 100.00 22.88% 46,005 17.94<br />
1996 3,189.46 124.37 24.37% 60,727 19.04<br />
1997 3,998.26 162.49 30.65% 79,040 19.77<br />
1998 5,446.57 221.14 36.10% 107,421 19.72<br />
1999 11,786.80 336.67 52.24% 161,350 13.69<br />
Source: IMF; IDBSTA<br />
The prosperity and growth that was associated with Ecuador in the mid 1990’s<br />
transitioned into a serious economic dilemma in the latter half of the decade. In 1998,<br />
petrochemical production and agriculture, two industries that typically make up 25% of<br />
the country’s GDP and 95% of total exports, were in turmoil. Plunging oil prices and the<br />
devastating weather from El Niño caused a 21.3% or US$ 500M reduction in exports.<br />
This shortfall, in combination with a weakened banking sector, contributed to mounting<br />
pressure <strong>for</strong> the government to shore up the faltering Ecuadorian economy.<br />
Even with ef<strong>for</strong>ts in reorganizing state owned sectors (electricity, petroleum, and<br />
telecommunications), reducing deficit spending, and fostering free trade, the government<br />
could not resolve some of the leading economic issues stemming from bureaucratic<br />
missteps. By the beginning of 1999, Ecuador was suffering from the consequences of<br />
multiple interim governments. The fiscal deficit ballooned 7%, and six of the country’s<br />
major banks were in the hands of regulators. Austerity measures <strong>for</strong> controlling inflation<br />
eventually succumbed to the increased economic volatility and created a 36% devaluation<br />
of the sucre vis-à-vis the US Dollar. These problems thrusted Ecuador further into<br />
political crisis and lead to the eventual default on its international debt in September<br />
1999.<br />
<strong>Housing</strong> <strong>Market</strong><br />
In 1995, 61% of the 1.4M available homesteads were owner occupied; 26% were rentals,<br />
and 13% were held in other <strong>for</strong>ms of tenure. Ecuador’s severe housing shortage has been<br />
acerbated by the number of natural disasters in the mid to late 1990’s. It is estimated that<br />
nationally, almost 1.7M dwellings are needed with most of the construction focused in<br />
the hard-struck oceanic and agrarian communities. Given that 37% of the population<br />
2 5 9
(mostly low-income households) currently reside in these rural areas, the demographics<br />
<strong>for</strong> rebuilding Ecuador’s housing stock are not easily answered.<br />
Urban migration is relieving some of the stresses surrounding housing in rural Ecuador.<br />
Most of the current construction is centered in urban communities. Of 1997 residential<br />
construction, 46% were single family homes, 17% were 2 to 4 unit dwellings, and 37%<br />
were multifamily.<br />
Homes By Construction Type<br />
# <strong>Housing</strong><br />
Total 1,360,471<br />
Rental 356,250<br />
Antichresis 3,853<br />
Anticresis-Arriendo 3,030<br />
Own Paid off 722,212<br />
Own Borrow 108,013<br />
Gratuitous 145,789<br />
Received through services 21,159<br />
Other 165<br />
INEC -Homes 1995<br />
<strong>Mortgage</strong> <strong>Market</strong><br />
Approximately 70% of all households in Ecuador are built without <strong>for</strong>mal financing. Of<br />
those that do carry some <strong>for</strong>m of borrowing, approximately ¾ of the debt is in the range<br />
of US$ 3,800 and US$ 11,500. In 1997 the country’s total outstanding mortgages stood<br />
between US$ 300M and US$ 400M with demand steadily growing.<br />
Traditionally, Ecuador has had to rely on public and private institutions to provide<br />
housing finance <strong>for</strong> the population. At the end of 1996, 250 institutions comprised the<br />
banking industry with approximately the same amount of non-standardized mortgage<br />
products available to the consumer. Given the nature of Ecuador’s under-developed<br />
equity markets and economic condition, financial institutions typically seek to maximize<br />
liquidity through covering only those mortgage products that can round out their existing<br />
portfolios.<br />
As a supplement to <strong>for</strong>mal private sector mortgage lending, the Ecuadorian government<br />
chartered Banco Ecuatoriano de la Vivenda (BEV) in 1961 <strong>for</strong> the purpose of providing<br />
housing <strong>for</strong> low-income families. Since its inception, BEV has become the country’s<br />
largest originator. BEV offers mortgages, grants, direct subsidies, and financing <strong>for</strong><br />
renovation and construction. In 1998, over half of BEV’s assets, or US$ 137M, were in<br />
the <strong>for</strong>m of outstanding loans with a delinquency rate of 4.1%. Given this, Banco<br />
Ecuatoriano ranks 10 th among Ecuador’s top financial institutions.<br />
In 1997, Banco Ecuatoriano, along with 26 Ecuadorian institutions, created Compañia de<br />
Titularizacion Hipotecaria (CTH) as a conduit <strong>for</strong> secondary mortgage lending. This<br />
Countrywide <strong>International</strong> Consulting Services<br />
2 6 0
organization, fashioned after the system in the United States, is tasked with creating<br />
liquidity in the primary mortgage market in order to give greater public access to housing<br />
finance. It has created a standardized seller/servicer guide, which assists originators in<br />
determining which con<strong>for</strong>ming loans are permissible <strong>for</strong> resale. The products CTH will<br />
accept are very diverse. It has designated that it will purchase loans valued in numerous<br />
common currencies (ESS, US$, CVU), be geographically heterogeneous regarding<br />
originators and borrowers, and support all housing types from low income to luxury to reconstruction.<br />
Compañia de Titularizacion Hipotecaria has started out slowly. It has begun by<br />
purchasing and retaining loans with its core capital in order to determine the<br />
characteristics of mortgages within the industry. Future expectations are that the<br />
corporation will have purchased over US$ 200M in loans by 2001 and be in the initial<br />
stages of offering its first mortgage backed security. In securitizing these assets, CTH<br />
believes that it should first target the domestic equity markets – in particular the investors<br />
from the government’s privatization fund, Fondo de Solidaridad, and the social security<br />
fund Instituto Ecuatoriano de Seguridad Social (IESS). In doing this, they believe that<br />
there will be a stronger resolution by the government to support and guarantee these<br />
securities.<br />
Policy Developments<br />
The ministry of Urban Development and <strong>Housing</strong> (MIDUVI) dominates the development<br />
of policy surrounding low income housing in Ecuador. In 1995, MIDUVI created a<br />
guarantee program through the <strong>Housing</strong> Bank that provided below market rate capital <strong>for</strong><br />
residential construction and mortgages. This program was structured to relieve liquidity<br />
issues that institutions were having in regards to utilizing short-term deposits to fund<br />
long-term borrowing. By funding 75% of the outstanding loan balance, MIDUVI was<br />
indirectly supporting institutional participation in mortgage lending. Although initial<br />
results from the guarantee program looked promising, ultimately, adoption of it was not<br />
widespread.<br />
Recently, the changing political climate in Ecuador has created an alternative to indirect<br />
financing through the Incentives <strong>for</strong> <strong>Housing</strong> (SIV) program. In 1998 MIDUVI<br />
developed a system of one-time, non-reimbursable grants directly payable to the<br />
borrower. The focus of these grants is to promote savings and real estate investment<br />
between lower and middle class Ecuadorians. The ministry hopes that the secondary<br />
effect of such subsidies will spur growth through heightened residential construction and<br />
ultimately increase the standard of living in Ecuador.<br />
Sources and References<br />
1. Comment & Analysis; Country Ecuador: Review 1999, Profile Americas Review<br />
World of In<strong>for</strong>mation, December 20, 1999, Statistics Forecast; Pg. 1.<br />
2. Ecuador Sets The Pace In Latin <strong>Mortgage</strong> <strong>Market</strong>, Securities Data Publishing Asset<br />
Sales Report <strong>International</strong>, March 8, 1999, Vol. 2 No. 5 Pg. 1.<br />
Countrywide <strong>International</strong> Consulting Services<br />
2 6 1
3. Corporate <strong>Finance</strong> Updates, Latin<strong>Finance</strong>, Latin American Financial Publications,<br />
March 1, 1999, Pg. 82.<br />
4. Compañia de Titularizacion Hipotecaria (CTH), URL http://cth.fin.ec (Español)<br />
5. World Bank, www.worldbank.org<br />
Contacts<br />
1. Ministerio de Desarrollo Urbano y Vivienda (MIDUVI<br />
10 de Agosto 2270 y Cordero, Quito Ecuador<br />
Tel: 693.223.8060<br />
Fax: 593.256.6785<br />
http://www.pub4.ecua.net.ec/miduvi/ (Español)<br />
2. Superintendencia de Bancos<br />
Ave 12 de Octubre 1561 y madrid piso 16<br />
Quito, Ecuador<br />
Tel: 593.255.4422<br />
Fax: 593.255.4832<br />
http://www.superban.gov.ec/<br />
3. Inter-American Development Bank<br />
1300 New York Avenue<br />
NW, Washington, DC 20577<br />
USA<br />
Tel: 202.623.1000<br />
http://www.iadb.org<br />
4. Bolsa de Volares de Quito<br />
Londres Building- 8th Floor<br />
Ave. Amazonas 540 and Carriónm<br />
Quito, Ecuador<br />
Tel: 593.252.6805<br />
Fax: 593.250.0942<br />
http://www.ccbvq.com<br />
5. Bolsa de Volares de Guayaguil<br />
9 de Octubre 110 y Pichincha<br />
Guayaquil Ecuador<br />
Tel: 593.456.1519<br />
Fax: 593.456.1871<br />
http://www.bvg.fin.ec/<br />
6. Banco Central del Ecuador<br />
Casilla Postal 339<br />
Av. 10 de Agosto y Briceno<br />
Countrywide <strong>International</strong> Consulting Services<br />
2 6 2
Quito, Ecuador<br />
Tel: 593.258.2577<br />
Fax: 593.258.0158<br />
http://www.bce.fin.ec/ (Español)<br />
Countrywide <strong>International</strong> Consulting Services<br />
2 6 3
GU AT E M AL A<br />
Economic Background<br />
Year Exchange<br />
Rate<br />
Quetzales /US$<br />
Consumer Price<br />
Index<br />
Countrywide <strong>International</strong> Consulting Services<br />
Change In<br />
Consumer Prices<br />
Quetzales US$<br />
Nominal GDP<br />
(Millions)<br />
Nominal GDP<br />
(millions)<br />
1990 5.01 50.78 41.22% 34,317 6,850<br />
1991 5.04 67.62 33.17% 47,302 9,385<br />
1992 5.27 74.41 10.05% 53,985 10,244<br />
1993 5.82 83.21 11.82% 64,243 11,038<br />
1994 5.65 92.24 10.86% 74,669 13,216<br />
1995 6.04 100.00 8.41% 85,157 14,099<br />
1996 5.97 111.06 11.06% 95,479 15,993<br />
1997 6.18 121.31 9.23% 107,873 17,455<br />
1998 6.85 129.77 6.97% 121,127 17,683<br />
1999 7.82 136.08 4.86% N/A N/A<br />
Source: IMF<br />
The Peace Accords, signed in 1996, provided an end to a 34-year-old civil war. They<br />
provided a basis <strong>for</strong> the development of sustainable, economic and social policies in<br />
Guatemala. During 1998, economic activity in Guatemala continued to expand, but it<br />
slowed by the last quarter due to high interest rates, Hurricane Mitch, and a decline in<br />
sugar and coffee prices. The GDP rose by almost 5% in 1998, which was up from the<br />
previous two years. Many policy changes have been made in recent years in attempts to<br />
trans<strong>for</strong>m the country’s financial, economic, social, and structural systems. In doing so,<br />
Guatemala has increased privatization and broken up many monopolies, thus allowing an<br />
inflow of domestic and <strong>for</strong>eign investment.<br />
Private consumption grew by about 5% in 1998, which can be attributed to an increase in<br />
income and expanding access to credit. Private investment grew 13%, as a result of<br />
relatively low interest rates (in terms of lending), easy access to credit, and strong<br />
domestic demand, especially in the construction sector. Construction and real estate have<br />
been reacting to private investment and the increasing availability of af<strong>for</strong>dable mortgage<br />
loans since 1997.<br />
<strong>Housing</strong> <strong>Market</strong><br />
2 6 4
Year<br />
Population<br />
(Millions) <strong>Housing</strong> Starts*<br />
1990 82.59 158,872<br />
1991 87.84 115,543<br />
1992 89.54 206,423<br />
1993 91.21 235,911<br />
1994 93.01 261,925<br />
1995 90.49 173,178<br />
1996 96.58 65,784<br />
1997 96.40 190,549<br />
1998 100.24<br />
1999<br />
*Or Completions, Permits<br />
<strong>Mortgage</strong> <strong>Market</strong><br />
Average lending rates declined in 1997 from 22% to 16%. They remained at the same<br />
general level until October of 1998, but then climbed again to 18.5% by the end of the<br />
year as the government made attempts to decrease the excessive growth in private sector<br />
credit. As of January 1997, loan terms range from 5 years to 20 years with an average of<br />
15. Typical loan-to-value ratios range from 60%-100% with the average being<br />
approximately 90%. Payment to income ratios (PTI), which measure a borrower's debt<br />
burden, range from 25% to 40%. Commercial banks tend to originate lower PTI loans.<br />
As of 1997, there are 3 commercial banks engaged in housing finance, Vivibanco, Banco<br />
Continental G&T, and Bancafe. In addition, the state banks, Crédito Hipotecario<br />
Nacional and Banco Nacional de la Vivienda (BANVI), a low income subsidy program<br />
(FOGUAVI), and a mortgage insurance program (FHA), were involved in finance of<br />
housing. In 1995, there was Q 305 million in outstanding mortgage notes (Cédulas<br />
Hipotecarias).<br />
Banks fund their mortgages with deposits, which average from 4%-9% and mortgage<br />
bonds (Bonos Hipotecarios), which are collateralized by mortgages and other assets. The<br />
typical rate in early 1997 of the mortgage bonds was 16% <strong>for</strong> a term of 1 to 3 years. The<br />
bonds are traded at two bolsas and are typically purchased by pension funds and insurance<br />
companies.<br />
A cornerstone of the housing finance sector is the Instituto de Fomento de Hipotecas<br />
Aseguradas (FHA). This governmental institution’s role is twofold. First, it provides<br />
mortgage insurance in the case of default. Second, it proscribes building standards by<br />
setting architectural and construction guidelines as well as supervisory oversight <strong>for</strong> all<br />
FHA approved construction. Almost all commercial bank mortgage loans are insured by<br />
the FHA. The interest income from FHA insured loans is exempt from taxation.<br />
In order to address the lack of low income housing finance, the government launched the<br />
Fondo Guatemalteco Para La Vivienda (FOGUAVI) in 1995. It is designed to increase<br />
the supply of af<strong>for</strong>dable housing through subsidized housing finance; subsidization<br />
consists of both interest rate and up-front cash grants. FOGUAVI’s initial capitalization<br />
Countrywide <strong>International</strong> Consulting Services<br />
2 6 5
of Q 100 million is split among three commercial banks and the Crédito Hipotecario<br />
Nacional that are all authorized to originate FOGUAVI loans. While it is significant that<br />
an operational framework is now in place to address the country’s low income housing<br />
problems, its current funding level FOGUAVI will probably finance fewer than 4,000<br />
units in 1997.<br />
Sources and References<br />
1. Inter-American Development Bank Country Assessment: Guatemala, by Ronan Le<br />
Berre (Country Economist) http://www.iadb.org/regions/re2/sep/gu-sep.htm<br />
2. Cardiff Consulting Services, “The Guatemalan <strong>Housing</strong> <strong>Finance</strong> Sector”, Report<br />
prepared <strong>for</strong> the InterAmerican Development Bank, January 1997.<br />
3. World Bank, www.worldbank.org<br />
Countrywide <strong>International</strong> Consulting Services<br />
2 6 6
P AN AM A<br />
Economic Background<br />
Year<br />
Exchange<br />
Rate<br />
Balboas/US$<br />
Consumer<br />
Price<br />
Index<br />
Countrywide <strong>International</strong> Consulting Services<br />
Change In<br />
Consumer<br />
Prices<br />
Balboas US$<br />
Nominal GDP<br />
(Millions)<br />
Nominal GDP<br />
(millions)<br />
1990 1.00 94.40 0.77% 5,313.20 5,313.20<br />
1991 1.00 95.59 1.26% 5,842.30 5,842.30<br />
1992 1.00 97.33 1.82% 6,641.40 6,641.40<br />
1993 1.00 97.78 0.45% 7,252.70 7,252.70<br />
1994 1.00 99.02 1.27% 7,733.90 7,733.90<br />
1995 1.00 100.00 0.99% 7,906.10 7,906.10<br />
1996 1.00 101.26 1.26% 8,151.10 8,151.10<br />
1997 1.00 102.53 1.26% 8,657.50 8,657.50<br />
1998 1.00 103.17 0.63% 9,143.80 9,143.80<br />
1999 1.00 104.51 1.30% 9,546.13 9,546.13<br />
Source: IMF<br />
The geographical location of Panama gives it an economy that is service-based, mainly in<br />
the areas of banking, commerce, and tourism. Since the 1994 election of President Perez<br />
Balladares, Panama has experienced great economic re<strong>for</strong>m aimed at opening the trade<br />
sector, attracting <strong>for</strong>eign investment, privatizing state-owned enterprises, instituting fiscal<br />
re<strong>for</strong>m, and creating jobs. Economic growth has since presented definite signs of<br />
recovery in that social services are expanding, and the unemployment rate is decreasing.<br />
Additionally, Panama joined the World Trade Organization in 1998 and approved a tariff<br />
reduction that gave the country the lowest average tariff rates in Latin America.<br />
GDP has experienced growth, though at a decreasing rate throughout the last ten years.<br />
GDP increased from approximately US$ 8.7 million to US$ 9.0 million in 1998,<br />
however, the growth rate decreased from 4.7% in 1997 to approximately 3.9% in 1998.<br />
In 1998, it is estimated that construction and transportation/communications were the two<br />
largest contributors to GDP.<br />
Inflation has remained extremely low between 1990-98, peaking at 1.82% in 1992, and<br />
reaching its lowest point of 0.45% in 1993. Consumer prices were 1.26% higher in 1997<br />
than the previous year, and the inflation rate decreased to 0.63% during 1998, despite<br />
agricultural losses. The unemployment rate is fairly high, with key points of 16.105% in<br />
1991, 13.30% in 1993, and 13.40% in 1997.<br />
<strong>Housing</strong> <strong>Market</strong><br />
In the Metropolitan area of Panama City, the housing market can be divided into four<br />
categories. The first is the In<strong>for</strong>mal <strong>Housing</strong> portion in which houses are built on lands<br />
that do not belong to the tenants or builders, often against the will of the owner of the<br />
land and without possession of the title or right to rent/lease the property. The second<br />
2 6 7
portion is the Social Interest <strong>Housing</strong> (or low income) portion. In this portion of the<br />
sector, houses are constructed and financed mainly through special subsidies provided by<br />
the central government, which holds the title of the land and the right to rent the property.<br />
The next portion of the housing market consists of Lower Middle to Middle Class<br />
housing. This portion of housing is financed mainly through private funds, however,<br />
some opt <strong>for</strong> a long-term loan with interest covering a selling price of up to US$ 62,500.<br />
Finally, the top portion of the housing market consists of Middle Upper to Upper Class<br />
housing. This section of housing is also paid mainly through private money, however,<br />
long-term loans are also available <strong>for</strong> selling prices of US$ 62,501 and above.<br />
That being said, it is important to note that as late as 1990, 47% of the population in<br />
Panama was living in poverty. There<strong>for</strong>e, the largest portion of the housing sector is the<br />
lower income market, mainly concentrated in rural areas of the country. No records were<br />
available <strong>for</strong> prior years, but in 1999 8,900 building permits were issued <strong>for</strong> new home<br />
construction 1 .<br />
<strong>Mortgage</strong> <strong>Market</strong><br />
All together there are seven financial institutions that are involved in Panama’s local<br />
mortgage market. Created in 1973, the National <strong>Mortgage</strong> Bank (Banco Hipotecario<br />
Nacional, BHN) remains the largest financing institution in Panama. It was designed<br />
primarily to finance national housing programs, but it also has oversight authority <strong>for</strong> the<br />
National System <strong>for</strong> <strong>Housing</strong> Savings and Loans (Sistema Nacional de Ahorro Prestamo<br />
para la Vivienda, SNAP). By the end of 1993, BHN had B$ 135 million in outstanding<br />
mortgage debt. Based upon initial estimates, the total outstanding mortgage debt <strong>for</strong> all 7<br />
institutions in 1999 was approximately US$ 1.3 billion, and there were US$ 14.455<br />
million in new mortgage loan originations. 10<br />
La Hipotecaria (<strong>for</strong>merly known as Wall Street Compania Hipotecaria) is another<br />
significant financing institution. Their lending requirements are very strict, requiring a<br />
great deal of investigation into the applicant’s credit history, ability to pay, and income<br />
range. They were the first company in Central America to successfully issue and sell a<br />
structured mortgage-backed security (MBS). The Panamanian SEC approved the MBS<br />
issue of US$ 15 million, and it is fully subscribed by local banks and insurance<br />
companies.<br />
Public sector financing comes from the Residence Savings Fund (Fondo de Ahorro<br />
Habitacional, FONDAHVI). It is a pension fund that was created in 1991 and requires<br />
workers to pay 1% of their earnings into the fund. Savings and loans to only middle and<br />
upper income groups, however, originate private sector lending. Chiricana de Ahorro y<br />
Prestamo, Interiorana de Ahorro y Prestamo, and SAVISA are the three existing private<br />
10 Approximate estimate provided by John D. Rauschkolb, Gerente General of La Hipotecaria; 4<br />
September 2000.<br />
Countrywide <strong>International</strong> Consulting Services<br />
2 6 8
institutions. In 1993, they generated a combined total of 60 loans <strong>for</strong> a value of US$ 1.1<br />
million. Private lending is the smallest portion of the mortgage market.<br />
Interest Rates <strong>Mortgage</strong> Rates: Panama Reference Rate<br />
Year Deposit Rate Q1 Q2 Q3 Q4<br />
1990 8.40% 13.00% 13.00% 13.25% 13.25%<br />
1991 7.73% 13.25% 13.00% 11.50% 12.25%<br />
1992 5.67% 12.50% 12.00% 12.00% 11.75%<br />
1993 5.90% 11.50% 11.25% 11.25% 11.00%<br />
1994 6.11% 10.75% 10.75% 10.75% 10.75%<br />
1995 7.18% 10.75% 10.75% 11.00% 10.75%<br />
1996 7.20% 10.75% 10.75% 10.75% 10.50%<br />
1997 7.03% 10.50% 10.50% 10.50% 10.50%<br />
1998 6.76% 10.25% 10.00% 10.25% 10.00%<br />
1999* N/A 10.00% 9.75% 9.75% 9.75%<br />
Similar to a prime rate <strong>for</strong> mortgages, interest rates in Panama are measured by their<br />
country’s Reference Rate. The Reference Rate has remained at 9.75% <strong>for</strong> most of 1999<br />
and 2000. This is down significantly from the beginning of the decade when the rate<br />
peaked at 13.00%. Reserved <strong>for</strong> a bank’s best clients, jumbo mortgage rates are around<br />
1% lower than the Reference Rate 1.<br />
Since La Hipotecaria’s first issue of Panama’s mortgage bonds, there are a total of 4<br />
issues of the mortgage-backed security circulating in the country’s local market. Each<br />
issue totaled $15,000,000. 2 issues in 1995 and 1 issue in 1996 both completed by Chase<br />
Manhattan Bank. The most recent issue in 1999 was done by La Hipotecaria. They plan to<br />
have another issue in 2000.<br />
Policy Developments<br />
• Recent policy - developments focus on four areas: 1) private sector development and<br />
employment creation, 2) fiscal adjustment and public sector modernization, 3)<br />
poverty alleviation and human resources development, and 4) environmental<br />
conservatism.<br />
• Banco Continental de Panama – The <strong>International</strong> <strong>Finance</strong> Corporation in Panama<br />
has initiated this US$ 5 million program. It is a line of credit to the Banco<br />
Continental de Panama <strong>for</strong> lending to small and medium-sized private sector<br />
companies. It approves loans up to US$ 750,000 with maturities as long as 7 years.<br />
The goal of this program is to seek international competitiveness.<br />
Sources and References<br />
1 Rauschkolb, 2000<br />
Countrywide <strong>International</strong> Consulting Services<br />
2 6 9
1. IDB Country Assessment: Panama, by Gilberto Chona (Country Economist)<br />
http://www.iadb.org/regions/re2/sep/pn-sep.htm<br />
2. World Bank, www.worldbank.org<br />
3. CIA World Fact Book, 1999<br />
4. Rauschkolb, John; La Hipotecaria; email correspondence<br />
Contacts<br />
1. La Hipotecaria<br />
John D Rauschkolb, Gerente General<br />
P.O. Box 6-809 El Dorado<br />
Panama, Republic of Panama<br />
Tel: 265.1183 or 269.6768<br />
Fax: 507.265.1217<br />
Email: johnrauschkolb@hotmail.com<br />
Countrywide <strong>International</strong> Consulting Services<br />
2 7 0
Paraguay<br />
Economic Background<br />
Year Exchange<br />
Rate<br />
Guaranies/US$<br />
Index 1990<br />
Consumer Price<br />
Index<br />
Countrywide <strong>International</strong> Consulting Services<br />
Change In<br />
Consumer<br />
Prices<br />
Guaranies US$<br />
Current<br />
Nominal GDP<br />
(Millions)<br />
Current<br />
Nominal GDP<br />
(Millions)<br />
1990 1,229.80 43.24 -27.60% 6,474,520 5,265<br />
1991 1,325.18 53.72 24.23% 8,280,765 6,249<br />
1992 1,500.26 61.88 15.19% 9,670,816 6,446<br />
1993 1,744.35 73.14 18.21% 11,991,710 6,875<br />
1994 1,904.76 88.19 20.57% 14,960,131 7,826<br />
1995 1963.02 100.00 13.40% 17,698,589 8,982<br />
1996 2056.81 109.81 9.81% 19,905,300 9,650<br />
1997 2177.86 117.48 6.99% 21,852,400 9,974<br />
1998 2726.49 131.03 11.53% 24,917,659 9,042<br />
1999 3119.07 139.88 6.75% N/A N/A<br />
Source: IDBSTA<br />
Paraguay has been in crisis throughout much of the 1990s. After the overthrow of the<br />
Stroessner dictatorship in 1989, the country saw only modest growth. Between 1990 and<br />
1998, GDP averaged 2.4%, much lower than the 9% average seen in 1970s and 80s.<br />
Many factors contributed to this anemic growth; however, declining exports, a series of<br />
banking failures, and political strife were considered the major impetuses <strong>for</strong> the<br />
country’s economic predicament.<br />
Paraguay is highly dependent on exports to bolster its economy. Two sectors comprise<br />
the bulk of the country’s exports, agriculture and hydroelectric power. Agribusiness, the<br />
primary driver, constitutes almost 27% of the nation’s total GDP. Throughout the<br />
decade, production in principal agricultural staples such as soybean, cotton, cattle, and<br />
<strong>for</strong>estry products have been affected by severe regional weather conditions and<br />
fluctuating global prices. These factors have reduced the export base and subsequently,<br />
the overall economic health of the nation.<br />
Adding to problems, Paraguay encountered numerous financial crises in the 1990s. Poor<br />
internal controls and lack of adequate government regulation were the cause of many<br />
national banks buckling under economic instability. The repercussions were that the<br />
government took over six banks and distributed US$ 600M to support the deposit<br />
guarantor fund. In total, 74 of the nation’s 103 banks closed and the government passed<br />
much needed banking and financial re<strong>for</strong>m legislation.<br />
Since 1989, when democracy was put in place, the government has gone through a<br />
number of political crises with the most recent centered around the presidency of Raul<br />
Cubas and General Lino Oviedo. These issues culminated to the assassination of the<br />
Vice President, and Cubas and Oviedo fled the country in 1999.<br />
2 7 1
<strong>Housing</strong> <strong>Market</strong><br />
Due to a poor national infrastructure and extreme poverty, Paraguay has had difficulties<br />
in creating a viable housing market that does not rely on government subsidies. A recent<br />
United Nation’s update places approximately 15% of the population in abject poverty<br />
with little or no viable shelter available. Of the population that can be considered above<br />
the poverty line, housing is provided mainly through ownership or rental. A 1997 survey<br />
within the country noted that of the available housing almost 75% was comprised of<br />
owner occupied properties while 14% was rentals and the remaining 11% was in other<br />
<strong>for</strong>ms of tenure.<br />
Survey of housing 1997-1998<br />
Type Total<br />
Own 602,278 74.5%<br />
Rental 114,734 14.2%<br />
Yielded 83,912 10.4%<br />
Paying in Quotas 5,177 0.6%<br />
Occupant in Fact 1,165 0.1%<br />
Other 1,111 0.1%<br />
Total 808,377<br />
DGEEC<br />
<strong>Mortgage</strong> <strong>Market</strong><br />
With the issues surrounding the housing market, the government of Paraguay has become<br />
the main source <strong>for</strong> housing construction and finance. Through programs administered by<br />
the National <strong>Housing</strong> Council (Consejo Nacional de la Vivienda CONAVI), middle and<br />
low income families receive subsidies and grants <strong>for</strong> the acquisition, construction or<br />
improvement of housing. Upper income lending is provided primarily by private sector<br />
savings and loans associations (Sociedades de Ahorro y Prestamos, SAP).<br />
In order to keep housing loans af<strong>for</strong>dable, CONAVI has adopted the double indexed<br />
mortgage (DIM) as its principle loan instrument <strong>for</strong> housing loans. The Paraguayan DIM<br />
amortizes the principal loan balance with a market rate (or sometimes subsidized rate) of<br />
interest. Borrower payments start at a low rate, and they are subsequently raised with<br />
increases in the minimum wage index.<br />
Policy Developments<br />
In 1998, the Cubas Government <strong>for</strong>mulated policy that bolstered the housing sector.<br />
CONAVI’s was restructured so that it had the authority to better accommodate the<br />
increasing housing demand as well as address poverty issues and implement program<br />
improvements in rural areas. In addition to changes in CONAVI, the government<br />
mandated the National <strong>Housing</strong> Council to lay the foundation <strong>for</strong> a secondary housing<br />
market.<br />
Countrywide <strong>International</strong> Consulting Services<br />
2 7 2
In 1999, Law 861de, “Banks and Financier’s”, was enacted to assist in the <strong>for</strong>malization<br />
of standards <strong>for</strong> mortgage documentation. Supported by the Ministerio de Hacienda<br />
(Ministry of Property), this legislation addresses which minimum requirements must be<br />
established and verified by institutions wishing to grant mortgages.<br />
Although Law 861de puts in place an important component to developing a market,<br />
Paraguay must address many other basic problems be<strong>for</strong>e launching a <strong>for</strong>mal mortgage<br />
system. Among the larger issues to be confronted are the lack of title registration and the<br />
removal of obligatory provisions that the banks require of the borrower be<strong>for</strong>e a mortgage<br />
is granted.<br />
Sources and References<br />
1. “Comment & Analysis; Country Paraguay: Review 1999,” Profile Americas Review<br />
World of In<strong>for</strong>mation, December 20, 1999, Statistics Forecast; Pg. 1<br />
2. “Dirección General de Estadisticas y Censos, Asunción,” http://www.dgeec.gov.py/<br />
3. “Ministerio de Hacienda,” http://www.hacienda.gov.py/<br />
4. “Situación Económica Reciente,” Paragua, Banco Internamericano de Desarrollo,<br />
1999 http://www.iadb.org/regions/re1/sep/pr/pr-sep.htm<br />
5. “President Cubas Presents Plans <strong>for</strong> Economic Re<strong>for</strong>m,” Cerro Cora TV, Asuncion,<br />
0055 gmt, August 18, 1998<br />
6. “Latin American Weekly Report,” Latin American Newsletters, October 26, 1995,<br />
Section WR-95-41 Pg 491<br />
7. “Crisis Threatens The Wasmosy Cabinet,” Latin American Newsletters, June 24,<br />
1997, Section WR-97-25 Pg 290<br />
8. “2000 Congressional Presentation – Paraguay,” US Agency <strong>for</strong> <strong>International</strong><br />
Development, http://www.info.usaid.gov/pubs/cp2000/lac/paraguay.html<br />
Contract<br />
1. Banco Central del Paraguay<br />
Gerencia de Estudios Economicos Pablo V1 y Sgto. Marecos<br />
Casilla Postal 861<br />
Asunción, Paraguay<br />
Tel: 595-21-490-166/9<br />
Fax: 595-21-447-645<br />
http://www.bcp.gov.py/<br />
2. Centro de Análisis y Difusión de Economía Paraguaya (CADEP)<br />
Piribebuy 1.058 e/ Colon y Hernandarias<br />
Asuncion, Paraguay<br />
Tel: 595-21-494-140<br />
http://www.cadep.org.py/<br />
3. Consejo Naciónal de La Vivienda<br />
Independencia Naciónal No 909<br />
Countrywide <strong>International</strong> Consulting Services<br />
2 7 3
Asunción, Paraguay<br />
Tel: 595-21-491-021<br />
Fax 595-21-491-000<br />
4. Dirección General de Estadisticas y Censos, Asunción<br />
Tel: 595-21-610-331<br />
http://www.dgeec.gov.py/<br />
5. Interamerican Development Bank (BID)<br />
Edif. Aurora – 1-3 pisos<br />
Caballero esq. Eligio Ayala, Cassilla 1209<br />
Asunción, Paraguay<br />
Tel: 595-21-492-061<br />
Fax 595-21-446-537<br />
http://www.iadb.org/<br />
6. Ministerio de Hacienda<br />
Chile 128 y Palma<br />
Asunción, Paraguay<br />
Tel: 595-21-492-599<br />
Fax 595-21-448-283<br />
http://www.hacienda.gov.py/<br />
Countrywide <strong>International</strong> Consulting Services<br />
2 7 4
PERU<br />
Economic Background<br />
Year Exchange Rate<br />
Nuevos<br />
Soles/US$<br />
Consumer<br />
Price Index<br />
Countrywide <strong>International</strong> Consulting Services<br />
Change In<br />
Consumer<br />
Prices<br />
Nuevos Soles US$<br />
Nominal GDP<br />
(Billions)<br />
Nominal GDP<br />
(Billions)<br />
1990 0.52 5.54 7481.66% 6.372 12.254<br />
1991 0.96 28.21 409.53% 32.921 34.293<br />
1992 1.63 48.95 73.53% 52.005 31.905<br />
1993 2.16 72.72 48.58% 81.898 37.916<br />
1994 2.18 89.99 23.74% 110.412 50.648<br />
1995 2.31 100.00 11.13% 133.258 57.687<br />
1996 2.60 111.54 11.54% 149.504 57.502<br />
1997 2.73 121.09 8.56% 173.689 63.622<br />
1998 3.16 129.86 7.25% 183.842 58.178<br />
1999* 3.51 134.37 3.47% 193.586 55.153<br />
Source: IMF; *Central Reserve Bank of Peru<br />
Prior to 1998, Peru was experiencing a long period of economic expansion driven by<br />
strong, long-term private investment. The economy changed, however, to one<br />
characterized by economic contraction caused by weak investment. The disastrous El<br />
Niño and the economic crises in both Asia and Russia mainly caused the change. A bank<br />
credit crisis led to re<strong>for</strong>ms in monetary policy that alleviated some of the financial strain.<br />
However, Peru still remains vulnerable to <strong>for</strong>eign investment concerns.<br />
The El Niño storm caused great physical losses in Peru. Exports dropped 16% in Dollar<br />
terms, and imports dropped by 4.1% in Dollar terms. The current account deficit<br />
increased from 5.2% of GDP in 1997 to 6.0% of GDP in 1998. The international reserves<br />
of the Peruvian Central Bank declined by US$ 950 million, in order to compensate <strong>for</strong> the<br />
additional account deficit. This was the first reduction of international reserves in a<br />
decade. Finally, El Niño caused some deterioration in the financial system itself because<br />
banks were <strong>for</strong>ced to accommodate <strong>for</strong> the credit rollovers of fishing and agricultural<br />
institutions.<br />
The financial crises in both Asia and Russia, and more recently in Brazil affected Peru.<br />
The Asian crisis led to a mild reduction in demand <strong>for</strong> Peru’s exports. When the Russian<br />
financial crisis developed in August of 1998, <strong>for</strong>eign investors panicked. Banks lost<br />
their credit lines with<br />
<strong>for</strong>eign investors, which caused a liquidity crisis in Peru by September of that year.<br />
The banking crisis in Peru lead to a spike in money market interest rates, a decreasing<br />
trend in GDP, and a recession in the urban sectors such as manufacturing, construction,<br />
and trade. The loss of bank credit halted the economic recovery that had followed El<br />
Niño.<br />
2 7 5
<strong>Housing</strong> <strong>Market</strong><br />
Prior to 1990, obtaining the proper legal title and permits to own and build on property in<br />
Peru could take upwards of 7 years. This bureaucratic hindrance contributed to the stress<br />
on Peru’s housing market’s inability to meet the public demand <strong>for</strong> adequate housing<br />
supply. Such market conditions encouraged construction of substandard, in<strong>for</strong>mal<br />
dwellings such as shantytowns. By 1990 50% of Peru’s housing stock consisted of such<br />
dwellings. In order to improve housing market conditions, a non-governmental<br />
organization, the Institute <strong>for</strong> Liberty and Democracy (ILD), was developed. Objectively,<br />
the ILD planned to achieve the provision of a binding, legal proof of ownership to<br />
Peruvian citizens that would substantiate their properties as collateral and enable them to<br />
build on their lands, subsequently, developing a popular mortgage and credit insurance<br />
market.<br />
The complete housing shortage of Peru (including all dwellings with inadequate, standard<br />
utilities) is equal to 1.5 million units. Each year this deficit increases by 100,000, which is<br />
scarcely countered by construction growth of 30,000 to 35,000 annually.<br />
<strong>Mortgage</strong> <strong>Market</strong><br />
After years of failure, Peru’s mortgage market has ventured into a new beginning. At the<br />
end of the 1980s through the beginning of the 1990s, long term financing was not<br />
available. <strong>Mortgage</strong> financing alternatives were limited to private funding sources with<br />
short maturities and high interest rates. By the end of 1999, Peruvian financial institutions<br />
had incurred mortgage stock worth approximately US$ 1.1 Billion.<br />
In order to tap into the B and C mortgage market, the Peruvian government started the<br />
Mivivienda Fund in 1998. The intended purpose of the program was to provide mortgage<br />
loans to those of the population with monthly incomes between US$ 330-1,150. The fund<br />
has not met government expectations. Mivivienda was funded by mandatory<br />
contributions equaling 5% of payroll with a ceiling cap. This tax was renamed the<br />
Extraordinary Solidarity Tax, and it is scheduled to be phased out by the end of 2000.<br />
Supplying the middle to middle-low income sector of the Peruvian population with<br />
attainable mortgage financing has not been achieved through this program, <strong>for</strong> as of May<br />
2000 only 250 operations have been funded.<br />
Currently, real estate retail loans are only offered to the high to middle income sectors of<br />
the population. There is anticipation of a securitization institution to provide funding <strong>for</strong><br />
origination and securitizing real estate loan portfolios. The plan includes origination<br />
being outsourced to banks or a servicing facility.<br />
Policy Developments<br />
Peru has made changes in its conduct of monetary policy. To ease some amount of the<br />
liquidity crises, the Central Bank of Peru took several actions:<br />
• It released its <strong>for</strong>eign exchange liquidity<br />
Countrywide <strong>International</strong> Consulting Services<br />
2 7 6
• Provided liquidity from the Treasury<br />
• Provided additional credit lines through the state-owned Corporacion Financiera de<br />
Desarrollo<br />
• Reduced the average legal reserve requirements on <strong>for</strong>eign currency deposits<br />
• Set up a mechanism through which banks could swap their non-per<strong>for</strong>ming assets <strong>for</strong><br />
interest bearing bonds.<br />
Fiscal policy was the second type of re<strong>for</strong>m in Peru. The nation, in conjunction with the<br />
IMF, set a target of 1.7% surplus GDP <strong>for</strong> 1998. The slowdown in economic activity<br />
prevented the country from reaching the goal (actual surplus equaled 1.3%) due to<br />
unrealizable tax revenues. However, with an improved economic environment, a similar<br />
goal is soon attainable.<br />
Sources and References<br />
1. IDB Country Assessment: Peru, by Alberto Melo (Country Economist)<br />
http://www.iadb.org/regions/re3/sep/pe-sep.htm<br />
2. Inter-American Development Bank<br />
3. CIPS Country Profile: Peru; Online: Internet. 12 September, 2000. Available -<br />
http://www.onerealtorplace.com/intlprof.nsf/<br />
4. Niezen, Alex. “The <strong>Mortgage</strong> Industry in Peru Entering the New Milenium.” n.p, n.d.<br />
Countrywide <strong>International</strong> Consulting Services<br />
2 7 7
URUGUAY<br />
Economic Background<br />
Year Exchange<br />
Rate<br />
Pesos/US$<br />
Consumer<br />
Price<br />
Index<br />
Countrywide <strong>International</strong> Consulting Services<br />
Change In<br />
Consumer Prices<br />
Pesos US$<br />
Nominal GDP<br />
(Millions)<br />
Nominal GDP<br />
(Millions)<br />
1990 1.59 9.26 112.53% 9,784.00 6,153.46<br />
1991 2.49 18.71 101.97% 20,271.30 8,141.08<br />
1992 3.48 31.52 68.46% 35,867.90 10,306.87<br />
1993 4.42 48.57 54.10% 54,513.50 12,333.37<br />
1994 5.60 70.30 44.74% 82,111.20 14,662.71<br />
1995 7.11 100.00 42.25% 114,572.00 16,114.21<br />
1996 8.71 128.34 28.34% 152,449.00 17,502.76<br />
1997 10.04 153.78 19.82% 188,529.00 18,777.79<br />
1998 10.82 170.41 10.81% 218,145.00 20,161.28<br />
1999 11.34 180.05 5.66% N/A N/A<br />
Source: IMF<br />
The conservative monetary and fiscal policies are aimed at reducing inflation; other<br />
priorities include moving toward a more market-oriented economy, completing re<strong>for</strong>m of<br />
the social security system, and increasing investment in education. Economic<br />
per<strong>for</strong>mance remains sensitive to conditions in Argentina and Brazil, largely because<br />
more than half of Uruguay's trade is conducted with its partners in Mercosur (the<br />
Southern Cone Common <strong>Market</strong>).<br />
The international financial crises led to a sharp decrease in several areas of revenue <strong>for</strong><br />
Uruguay. But despite the decline in revenue, Uruguay managed to control inflation and<br />
decrease consumer prices through December 1998. This was accomplished through<br />
implementation of wage indexation and the use of the exchange rate <strong>for</strong> a nominal price<br />
anchor. Inflation decreased from over 100% during the early part of the 1990s, to 28.34%<br />
in 1996, and further decreased to 10.81% by 1998.<br />
Moreover, GDP grew by 4.3% between January and September 1998, but the increase<br />
slowed during the last quarter. The expansion existed mostly in non-tradable sectors such<br />
as construction, via investment outlays of the Ministry of Transportation & Public Works,<br />
the Power Company (UTE) <strong>for</strong> renew transmission lines, and the National Port<br />
Administration (ANP) to retrofit the ports.<br />
Household incomes in Montevideo, Uruguay’s capital, were approximately 4% higher in<br />
1998 than in 1997. This is a result of rising salaries and pension, and the temporary<br />
decline in unemployment during 1997.<br />
The interest rate on Peso deposits (less than six months) decreased from a 1997 average<br />
of 19.6% to a 15.1% in 1998. The average prime lending rate also declined from 39.2%<br />
to 30% during the same period.<br />
2 7 8
<strong>Housing</strong> <strong>Market</strong><br />
Between 1990 and 1998, the population in Uruguay grew from 3.11 to 3.29 million. This<br />
population is distributed among 970,000 households, leaving approximately 156,000<br />
vacant residences. There are three classifications of lending candidates in Uruguay. The<br />
first is a group of “Society Clients,” composed of households with monthly income below<br />
US$ 450. These households create 50% of the total current demand in the housing<br />
market. The other 50% of the market demand are divided into two categories. The<br />
“Subsidiary Banking Customers,” have a monthly income between US$ 450 – US$ 900,<br />
and the “Banking Customers,” have a monthly income of over US$ 900. Additionally,<br />
the National <strong>Mortgage</strong> Bank of Uruguay projected, based on the 1996 census, that<br />
200,000 new residences need to be developed between 1996-2006 in order to<br />
accommodate the population and demand.<br />
Year<br />
Population<br />
(Millions)<br />
1990 3.11<br />
1991 3.13<br />
1992 3.15<br />
1993 3.17<br />
1994 3.20<br />
1995 3.22<br />
1996 3.24<br />
1997 3.27<br />
1998<br />
1999<br />
3.29<br />
<strong>Mortgage</strong> <strong>Market</strong><br />
<strong>Housing</strong> finance is provided in two ways. First it comes from the households themselves,<br />
and second, it comes from National <strong>Mortgage</strong> Bank of Uruguay. The Bank holds 85% of<br />
the local mortgage market, and it acts as a public instrument to facilitate access to<br />
housing, fostering the construction industry, and offering a full range of banking services<br />
(emphasizing in housing finance). Most originations made by the Bank are made at a readjustable<br />
unit (URs). This unit is adjusted monthly to the Salary Average Index, and it<br />
varies between 7-12%.<br />
The private sector is showing an increased interest in the housing market. Private market<br />
mortgage loans generally target the middle to high-income portion of the market, with<br />
rates that fall into a range between 16-20%.<br />
Sources and References<br />
1. IDB Country Assessment: Uruguay, by Ximena Morey (Country Economist)<br />
http://www.iadb.org/regions/re1/sep/ur/ur-sep.htm<br />
2. CIA World Fact Book 1999 (Internet Publication)<br />
http://www.odci.gov/cia/publications/factbook/uy.html<br />
3. Boz, Enrique S. “<strong>Housing</strong> <strong>Finance</strong> in Uruguay.” September 1999<br />
Countrywide <strong>International</strong> Consulting Services<br />
2 7 9
4. World Bank, www.worldbank.org<br />
Countrywide <strong>International</strong> Consulting Services<br />
2 8 0
NORTH AMERICA & CARRIBEAN<br />
Countrywide <strong>International</strong> Consulting Services<br />
2 8 1
Regional Summary<br />
North America<br />
North America is experiencing unprecedented economic growth. The United States<br />
economy is in the midst of an unprecedented economic expansion. Unemployment rates<br />
have reached an all time low. Domestic strength along with the growth of the U.S.<br />
economy has boosted growth in the Canadian economy as well. Over the last decade,<br />
Mexico’s economy experienced steady growth with the exception of the national currency<br />
deflation crisis in 1994-1995 and with the Asian financial crisis in 1998. Poverty at a rate<br />
of 28% of that country’s population continues to hinder economic growth in contrast to<br />
the rest of the region.<br />
Homeownership rates are high in all three countries. In the US, homeownership (and the<br />
debt finance of housing) is encouraged through the tax code. These incentives are absent<br />
in Canada and Mexico which nonetheless also have high rates of owned housing. In<br />
Canada and the US, there are vibrant second hand housing markets that facilitate<br />
mobility. In Mexico, lack of clear title, expensive title registration and transfer inhibit<br />
development of a secondary housing market.<br />
100.0%<br />
80.0%<br />
60.0%<br />
40.0%<br />
20.0%<br />
0.0%<br />
NORTH AMERICA<br />
Rate of Homeownership<br />
66.8% 63.8%<br />
The US has the largest mortgage market in the world with outstanding balances of US<br />
$4.65 trillion and loan origination totals in 1999 $1.3 trillion (second highest ever).<br />
Residential mortgage debt-to-GDP in the US is 50.2%. In Canada, mortgage debt-to-GDP<br />
is relatively high at 44.5%. The mortgage market of Mexico is far less developed as<br />
reflected in a low and relatively constant ratio of 9%. Mexico’s low totals reflect a legacy<br />
of high and volatile rates of inflation and substantial government involvement in the<br />
market.<br />
Countrywide <strong>International</strong> Consulting Services<br />
84.0%<br />
United States Canada Mexico<br />
2 8 2
60.0%<br />
50.0%<br />
40.0%<br />
30.0%<br />
20.0%<br />
10.0%<br />
0.0%<br />
50.2%<br />
The source of mortgage funding varies from one country to the next in North America. In<br />
1999 approximately 60.8% of total mortgage originations in the U.S. were funded<br />
through securitization activities. 11 The remaining originations were funded either through<br />
whole loan sales or held in a portfolio. The Canadian market is dominated by banks<br />
which fund mortgages with deposits, debentures and investment certificates. Funding in<br />
Mexico comes primarily from payroll deductions, World Bank loans, and the<br />
government. Loan arrangements with the World Bank at the end of 1999 have the<br />
potential plans of developing a secondary mortgage market.<br />
Caribbean<br />
The economic situations of each Caribbean nation can vary. Twelve of the island nations<br />
and coastal countries have come together to <strong>for</strong>m the organization, Caribbean Community<br />
(CARICOM). In June of 2000 CARICOM implemented plans to practice free movement<br />
of people and capital among the members with future plans to include a single currency<br />
system.<br />
The focus of the Sourcebook concentrates on the Caribbean nations of Barbados,<br />
Dominican Republic, Jamaica, and Trinidad & Tobago. All of these countries have a<br />
large reliance on the construction, tourism, and <strong>for</strong> some, the telecommunications sectors<br />
of their economy.<br />
Poverty and social problems are escalated by high rates of unemployment in this region.<br />
While Trinidad & Tobago have experienced decreasing rate trends of unemployment<br />
attributed to growth in the construction sector, rates remain at a high level of 9.5%. For<br />
Jamaica, slowing GDP growth rates are to blame <strong>for</strong> double-digit unemployment figures.<br />
Barbados, also experiencing decreasing trends, remains relatively typical <strong>for</strong> the region<br />
with 12.3% unemployment in 1998.<br />
Inflation rates are not consistent <strong>for</strong> all of the countries in this region. Inflation <strong>for</strong><br />
Barbados has been in the single digits <strong>for</strong> the whole decade with rates peaking at 7.7%<br />
and dipping well below 3%. The Dominican Republic also has experienced relatively low<br />
rates in the single digits <strong>for</strong> much of the decade. Mounting inflation rates have been<br />
11 Source: Inside MBS & ABS; August 4, 2000.<br />
NORTH AMERICA<br />
Outstanding <strong>Mortgage</strong> Debt/GDP<br />
Countrywide <strong>International</strong> Consulting Services<br />
44.4%<br />
9.0%<br />
United States Canada Mexico<br />
2 8 3
undermining the Jamaican economy with the highest rates over 75% in the beginning of<br />
the decade until finally dropping to single digits starting in 1997. Inflation in Trinidad &<br />
Tobago trended downward <strong>for</strong> most of the 90’s with rates going back up again in 1998<br />
because of higher food costs attributed to El Nino.<br />
The housing market has shown some signs of growth in this region, but it is still hindered<br />
with significant housing shortages. Homeownership rates are high. However, accurate<br />
figures were obtained only from Jamaica at 60% and Trinidad & Tobago at 74%.<br />
<strong>Mortgage</strong> financing can be obtained from several sources, both public and private<br />
throughout the Caribbean. In the Dominican, the most popular source comes from savings<br />
and loan institutions. Building Societies and the <strong>Housing</strong> Trust provide housing finance<br />
to lower and middle sectors of the population of Jamaica. The National <strong>Housing</strong><br />
Authority mainly funds mortgages <strong>for</strong> the lower income bracket of Trinidad & Tobago. In<br />
Barbados there are five major contributors to housing finance, the largest being trust<br />
companies.<br />
20.0%<br />
15.0%<br />
10.0%<br />
5.0%<br />
0.0%<br />
CARIBBEAN<br />
Outstanding <strong>Mortgage</strong> Debt-to-GDP<br />
16.0%<br />
4.1%<br />
Of the countries featured in the Sourcebook <strong>for</strong> the Caribbean region, Trinidad & Tobago<br />
is the only country with a secondary mortgage market institution. The Home <strong>Mortgage</strong><br />
Bank (HMB) is a secondary market facility with the primary function of buying and<br />
selling loans between financial institutions. Although not covered in this volume, the<br />
Eastern Caribbean Home <strong>Mortgage</strong> Bank was established in 1995 to create a secondary<br />
market among the members of the Eastern Caribbean Dollar Area (EC$.) These include<br />
Anguilla, Antigua and Barbuda, Dominica, Grenada, Montserrat, St. Kitts/Nevis, St.<br />
Lucia, and St. Vincent and the Grenadines.<br />
Countrywide <strong>International</strong> Consulting Services<br />
11.7%<br />
Barbados Dominican Republic Jamaica<br />
2 8 4
BARBADOS<br />
Economic Background<br />
Year Exchange Rate<br />
Barbados $ / US$<br />
Consumer Price<br />
Index<br />
Countrywide <strong>International</strong> Consulting Services<br />
Change In<br />
Consumer Prices<br />
Barbados $ US$<br />
Nominal GDP<br />
(Millions)<br />
Nominal GDP<br />
(Millions)<br />
1990 2.00 86.04 3.07% 3,440.10 1,720.05<br />
1991 2.00 91.43 6.26% 3,393.40 1,696.70<br />
1992 2.00 97.00 6.09% 3,183.00 1,591.50<br />
1993 2.00 98.08 1.11% 3,301.10 1,650.55<br />
1994 2.00 98.16 0.08% 3,473.90 1,736.95<br />
1995 2.00 100.00 1.88% 3,728.40 1,864.20<br />
1996 2.00 102.39 2.39% 3,993.00 1,996.50<br />
1997 2.00 110.28 7.71% 4,371.00 2,185.50<br />
1998 2.00 108.88 -1.27% 4,680.00 2,340.00<br />
1999 2.00 110.51 1.50% 4,861.90 2,430.95<br />
Source: IMF<br />
Preliminary estimates by the Central Bank of Barbados indicate that the Barbados<br />
economy grew 7 percent in 1998, reflecting continued positive response to domestic<br />
policy re<strong>for</strong>ms initiated in recent years. Policy re<strong>for</strong>ms are aimed at reducing the<br />
relatively high unemployment rate, encouraging <strong>for</strong>eign investment, and privatizing stateowned<br />
enterprises.<br />
GDP has grown steadily throughout the past ten years, but at varying rates. The higher<br />
rate of GDP growth in 1998 led to an increase in employment. The average<br />
unemployment rate decreased in 1998 to 12.3% from 14.5% in the previous year.<br />
Consumer prices decreased by an average of 1.2% in 1998, resulting from lower import<br />
taxes, and favorable external developments (i.e. – declining world oil prices, low US<br />
price inflation, depreciation of the Japanese Yen). Throughout 1990-1998, inflation<br />
remained in single digits with a peak of 7.7% in 1997, and the lowest increase being<br />
0.08% in 1994.<br />
A higher rate of activity in construction, a major <strong>for</strong>eign exchange-using sector, was the<br />
leading source of economic expansion. It showed a sharp increase of 16.4% in 1998.<br />
There was a 39.8% increase in the sale/purchase of construction products including<br />
cement blocks, clay tiles, and plastics. Activity in the construction sector was driven by<br />
the increase in tourism, road rehabilitation, and private sector investments such as a golf<br />
project, upscale condos, hotel renovations, and resort building. The construction sector<br />
provided 10.5% of the total employed labor <strong>for</strong>ce. This sector showed the greatest<br />
increase in jobs <strong>for</strong> the economy.<br />
<strong>Housing</strong> <strong>Market</strong><br />
2 8 5
In general, the housing market in Barbados has been responsive to market <strong>for</strong>ces<br />
throughout the past 30 years, with a relatively strong increase in new units. The<br />
population in Barbados is between 260,000 to 280,000, and there are approximately<br />
80,000 household units, with an average household size of 3.5 individuals (down from<br />
4.0). Additionally, housing costs increased during 1980-1995 period. This led to a<br />
doubling of costs <strong>for</strong> small homes.<br />
A significant trend in the housing market has been a shift from wooden homes towards<br />
brick homes. In 1970, approximately 75% of homes in Barbados were classified as<br />
wooden, decreasing to 57% by 1980, and further decreasing to 40% by 1990.<br />
Additionally, the majority of these new homes are constructed directly <strong>for</strong> homeowners,<br />
as opposed to private real estate developers.<br />
<strong>Mortgage</strong> <strong>Market</strong><br />
The housing finance sector in Barbados has flourished since its modest beginnings in<br />
1970s. It was estimated that by 1997, mortgage lending was at 16-17% of the country’s<br />
GDP. This level is comparatively higher than lending in other developing countries.<br />
Additionally, the housing finance sector has proven to be competitive, illustrating that<br />
sector expansion is consumer driven, and it is not subject to government allocations or<br />
monopoly restrictions. Moreover, the government has made <strong>for</strong>eign real estate<br />
purchasing easier. The Government of Barbados has eliminated a 10% Property Transfer<br />
Tax, so that the only additional fees in <strong>for</strong>eign purchasing are attorney fees and a 15%<br />
VAT.<br />
<strong>Mortgage</strong> debt outstanding increased over the past decade. In 1990, the mortgage debt<br />
outstanding was US$ 259.7 million with a debt to GDP ratio of 7.5%. By 1995, however,<br />
the outstanding mortgage debt was US$ 305.90, with a debt to GDP ratio of 8.2%.<br />
<strong>Mortgage</strong>s are originated by one of the five major contributors to the housing finance<br />
sector. In descending order they are:<br />
1. Trust Companies – Trust companies only take time deposits, do not offer current<br />
accounts, and are extremely active in making residential mortgage loans. At the end<br />
of 1996, residential mortgage debt outstanding was at BD 344 million, which<br />
consisted of 54% of the entire mortgage market (up from 40% in 1986). Additionally,<br />
trust companies as a whole reported an average yield of 11% on its loan portfolio in<br />
1996.<br />
2. Insurance Companies – Insurance companies are looking <strong>for</strong> long-term debt<br />
instruments and consider mortgages an attractive asset. The two largest insurance<br />
company lenders are Barbados Mutual Life Assurance Society and Life of Barbados.<br />
Overall, insurance companies have held between 25-30% of the mortgage market<br />
since 1980, with an outstanding mortgage balance of BD 160 million in 1997.<br />
3. Barbados <strong>Mortgage</strong> <strong>Finance</strong> Company (BMFC) – This institution is funded by the<br />
Government of Barbados, and has always been identified with lending to moderate-
income portion of the population. In fact, the average loan size in their portfolio<br />
during 1996 was BD 43,000. In 1996, BFMC had an outstanding mortgage debt of<br />
BD 101 million, which gave it one of the largest single portfolios of housing loans.<br />
4. Banks – The next largest lenders are the banks. Banks as a whole possess<br />
approximately BD 35 million in long-term loans and are the most common source of<br />
funds <strong>for</strong> home improvement loans.<br />
5. Credit <strong>Union</strong>s – Credit unions, as a group, consist of the smallest portion of the<br />
housing market. In 1997, it was estimated that they generated BD 19 million in<br />
housing loans.<br />
However, they do not report the compositions of their loan portfolios. Another estimate<br />
is that<br />
of the BD 19 million, half went to long-term mortgages <strong>for</strong> construction or purchase, the<br />
majority of the second half went to home improvements.
There is no requirement that the rates on existing loans be changed simultaneously with<br />
the rate <strong>for</strong> new loans. However, most lending institutions feel that creating different<br />
rates would cost them goodwill of the borrowers and opt not to have different rates. With<br />
little rate competition, the current lending rate was at 8% in 1994, 10% in 1997, and<br />
remained at 9% in 1998.<br />
Residential <strong>Mortgage</strong> <strong>Market</strong> (Millions)<br />
Year <strong>Mortgage</strong> Debt<br />
Outstanding<br />
(Barbados $)<br />
Outstanding<br />
<strong>Mortgage</strong><br />
Debt/GDP<br />
<strong>Mortgage</strong> Debt<br />
Outstanding<br />
(US$)<br />
Outstanding<br />
<strong>Mortgage</strong><br />
Debt/GDP<br />
1990 519.40 15.10% 259.70 7.55%<br />
1991 554.60 16.34% 277.30 8.17%<br />
1992 569.60 17.90% 284.80 8.95%<br />
1993 573.70 17.38% 286.85 8.69%<br />
1994 591.30 17.02% 295.65 8.51%<br />
1995 611.80 16.41% 305.90 8.20%<br />
1996 637.20 15.96% 318.60 7.98%<br />
Source: IDB<br />
Policy Developments<br />
There were two major policy developments made during 1997-1998 that affected the<br />
economy in Barbados. They were:<br />
� The Value Added Tax Exemption (VAT) – This change in government policy sought<br />
to alleviate the impact of abnormally high inflation, which resulted within the nine<br />
months that the VAT was implemented.<br />
� CARICOM Common External Tariff – This change in government policy further<br />
re<strong>for</strong>med the trade regime by reducing the tariff on extra-regional imports by<br />
approximately 5%.<br />
Sources and References<br />
1. IDB Country Assessment: Barbados, by Michael Tharkur (Country Economist)<br />
http://www.iadb.org/regions/re3/sep/ba-sep.htm<br />
2. Inter-American Development Bank, Country Summary: Barbados<br />
3. Diamond, Douglas B. “<strong>Housing</strong> <strong>Finance</strong> in Barbados.” March 1998<br />
4. World Bank, www.worldbank.org<br />
5. <strong>International</strong> Monetary Fund: IFC Statistics, 2000<br />
Contacts<br />
1. Barbados <strong>Mortgage</strong> <strong>Finance</strong> Company, Ltd<br />
Ms. Wavney Nicholls, Manager<br />
Corner 6 th Avenue Belleville & Pine Road<br />
St. Michael, Barbados, West Indies<br />
Tel: 1.246.427.5780<br />
Fax: 1.246437.8390
289<br />
2. Caribbean Assoc. of <strong>Housing</strong> <strong>Finance</strong> Institution CASHFI<br />
Joe Bailey, Secretary General<br />
7 Belmont Road<br />
Kingston, Jamaica 5<br />
Tel: 1.876.968.3855<br />
Fax: 1.876.926.5598
CANADA<br />
Economic Background<br />
Year Exchange Rate<br />
Canadian $ /US$<br />
Consumer Price<br />
Index<br />
290<br />
Change In<br />
Consumer Prices<br />
Canadian $ US$<br />
Nominal GDP<br />
(Millions)<br />
Nominal GDP<br />
(Millions)<br />
1990 1.17 89.48 4.76% 669,510 572,231<br />
1991 1.15 94.51 5.62% 676,480 588,243<br />
1992 1.21 95.93 1.51% 724,960 599,140<br />
1993 1.29 97.70 1.84% 767,510 594,969<br />
1994 1.37 97.88 19.00% 807,090 589,117<br />
1995 1.37 100.00 2.17% 833,920 608,701<br />
1996 1.36 101.58 1.58% 873,920 642,588<br />
1997 1.38 103.22 1.62% 873,950 633,297<br />
1998 1.48 104.24 0.99% 895,700 605,203<br />
1999 1.49 106.04 1.72% 926,154 621,580<br />
Source: IMF, CMHC estimate GDP 1999<br />
The economy grew at a brisk 4.7% annual pace in the third quarter of 1999, improving on<br />
the strong per<strong>for</strong>mances in the first two quarters. Domestic strength, coupled with<br />
continued strong growth of the U.S. economy and an improving world economy, point to<br />
a healthy near term outlook. GDP is expected to continue to grow at more than 3 percent<br />
per annum <strong>for</strong> the next two years. The booming U.S. economy is boosting manufacturers<br />
in central Canada and the Maritime Provinces are enjoying a recovery. Coming off the<br />
strongest employment growth of the 1990s at 2.8%, job growth slowed in 1999, but it was<br />
still strong. The unemployment rate fell from 8.3% to 7.6%. Inflation, at less than 2%,<br />
remained in check.<br />
<strong>Housing</strong> <strong>Market</strong><br />
At the end of 1996 there were 10,820,050 dwelling units in Canada with an owneroccupation<br />
rate of 63.8%. A strengthened labor market and continued economic growth<br />
helped the housing market remain vibrant in 1999 despite higher mortgage rates. <strong>Housing</strong><br />
starts rose 9% <strong>for</strong> the year. The improved per<strong>for</strong>mance in 1999 followed a weak<br />
per<strong>for</strong>mance in 1998 in which starts fell 6.5%. <strong>Housing</strong> sales enjoyed their best year since<br />
1996, registering a 6 percent growth. House prices rose a modest 3 percent, and they are<br />
expected to show similar growth in 2000. Rental markets continued to tighten in 1999.<br />
The vacancy rate in privately owned apartments of 3+ units was at 2.6%, which was the<br />
lowest rate since October 1987. Despite the tightening supply, rent increases were<br />
moderate in most areas with the exception of several Prairie centers and Ontario. Rental<br />
construction was expected to increase, thus leading to increased market stability in 2000.<br />
Year <strong>Housing</strong><br />
Starts<br />
<strong>Housing</strong><br />
Completions<br />
1992 168,271 146,274<br />
1993 155,443 132,749<br />
Residential<br />
Sales<br />
Average Price:<br />
All Dwellings C$
291<br />
1994 154,057 134,076<br />
1995 110,933 99,089 251,741 150,368<br />
1996 124,713 95,980 321,586 150,848<br />
1997 147,040 117,821 329,956 154,644<br />
1998 137,439 113,529 314,323 152,363<br />
1999 149,968 334,043 157,414<br />
Source: CMHC<br />
<strong>Mortgage</strong> <strong>Market</strong><br />
<strong>Mortgage</strong> market growth was strong in 1999, reflecting the vibrant housing market and<br />
economy. <strong>Mortgage</strong> credit outstanding was 5.3 percent higher in the third quarter of 1999<br />
relative to the third quarter of 1998. This followed growth rates of 5.2% in both 1997 and<br />
1998. Loan approvals fell in 1998 but rebounded in the first two quarters of 1999.<br />
<strong>Mortgage</strong> debt-to-GDP is relatively high at 44.5% given the fact that there is no tax<br />
incentive <strong>for</strong> mortgage debt in Canada.<br />
Residential <strong>Mortgage</strong> <strong>Market</strong> (Millions Canadian $)<br />
Year <strong>Mortgage</strong> Debt<br />
Outstanding<br />
Loan Approvals (C$<br />
million)<br />
Loan Approved<br />
(units)<br />
Outstanding <strong>Mortgage</strong><br />
Debt/GDP<br />
1992 295,228 82,934 1,047,914 40.7%<br />
1993 313,703 71,007 883,162 40.9%<br />
1994 332,549 65,116 764,042 41.2%<br />
1995 342,058 52,085 643,536 41.0%<br />
1996 359,272 70,671 840,044 41.1%<br />
1997 376,725 75,317 839,107 43.1%<br />
1998 398,468 71,861 755,003 44.5%<br />
1999 411,567 44.4%<br />
*third quarter Source: CMHC<br />
Chartered banks enhanced their market share of new mortgage business in 1998. Their<br />
market share of conventional financing grew to 85.3% in 1998, up from 83.7% in 1997 in<br />
line with ongoing changes in the structure of Canadian financial markets. At the same<br />
time the banks market share of NHA insured loans fell 0.8 percentage points to 64.9%.<br />
<strong>Market</strong> Share by Lender Type 1998 <strong>Market</strong> Share by Loan Type 1998<br />
Comm<br />
Banks<br />
Debt<br />
Outstanding<br />
64.0% 71.0%<br />
Trust Cos. 6.0% 8.0%<br />
Caisses &<br />
Co-op<br />
Life and<br />
Pension<br />
<strong>Finance</strong> &<br />
Loan<br />
Source: CMHC<br />
14.0% 14.0%<br />
7.0% 2.0%<br />
9.0% 5.0%<br />
Approvals Debt<br />
Outstanding<br />
Approvals<br />
NHA Insured 40% 42%<br />
Conventional 60% 58%<br />
Source: CMHC
292<br />
Four banks control about 50% of mortgage lending:<br />
• Royal Bank of Canada @ 14.6%<br />
• Toronto Dominion @ 14.5%<br />
• CIBC @ 12%<br />
• Bank of Montreal @ 9.8%.<br />
Roughly 70% of Canadians rely on a single provider <strong>for</strong> all their banking needs.<br />
The principal mortgage instrument in Canada is the rollover mortgage, a <strong>for</strong>m of variablerate<br />
loan. Borrowers select a period of time between one and five years during which the<br />
mortgage interest rate is fixed. During this period, they can prepay or refinance the<br />
mortgage but are subject to a penalty of three months interest. At the rollover date they<br />
select another period, again from one to five years during which the rate is fixed. During<br />
the fixed interest period, lenders charge steep penalties <strong>for</strong> prepayment. The typical term<br />
<strong>for</strong> loans is 30 years. There is little lending at LTVs above 75%. A sub-prime market is<br />
just beginning to develop.<br />
Interest Rates Govt. Bond<br />
Yields<br />
Year Interbank Deposit Treasury <strong>Mortgage</strong> <strong>Mortgage</strong> Mid Long<br />
Money Rate Bill Rate rates 1 year rates 5 year Term Term<br />
<strong>Market</strong><br />
fixed fixed<br />
1990 11.62 12.81 12.81 11.19 10.85<br />
1991 7.40 8.62 8.73 9.16 9.76<br />
1992 6.79 6.67 6.59 7.43 8.77<br />
1993 3.79 4.92 4.84 6.46 7.85<br />
1994 5.54 5.59 5.54 7.79 8.63<br />
1995 5.71 7.15 6.89 7.64 8.28<br />
1996 3.01 4.33 4.21 6.19 7.92 6.21 7.50<br />
1997 4.34 3.59 3.26 5.54 7.07 5.33 6.42<br />
1998 5.11 5.03 4.73 6.50 6.93 5.16 5.47<br />
1999 4.76 4.91 4.72 6.97 7.75 5.50 5.69<br />
Source IMF, <strong>Mortgage</strong> rates CHMC (1999 Q3).<br />
Canadian lenders fund mortgage loans with deposits, debentures and investment<br />
certificates that have fixed rates <strong>for</strong> the same period as the mortgages. A mortgage<br />
backed securities market was created in Canada in 1977 when the Canadian <strong>Mortgage</strong><br />
and <strong>Housing</strong> Corporation (CMHC) sold a large portion of its portfolio. CMHC<br />
guarantees MBS backed by federally insured (NHA) loans. Although a significant source<br />
of finance, the secondary mortgage market has not achieved the prominence of that in the<br />
U.S. Canadian lenders have had less incentive to sell mortgages, and as a consequence,<br />
liquidity in Canadian MBS is not as great as <strong>for</strong> U.S. MBS. As of the end of 1998,<br />
outstanding MBS of $24.6 billion constituted 5 percent of outstanding mortgage loans<br />
and 12 percent of outstanding NHA insured loans.<br />
NHA <strong>Mortgage</strong> Backed Securities (millions of C$)
Year Issued Outstanding<br />
1992<br />
1993<br />
1994<br />
1995<br />
1996<br />
1997 6,949 14,787<br />
1998 9,076 19,101<br />
1999* 8,710 24,598<br />
* Quarter 3; Source: CHMC<br />
293<br />
Policy Developments<br />
CMHC is a crown corporation owned by the Canadian government. The CMHC is the<br />
main instrument of housing policy in Canada. It was created in 1954 to provide default<br />
insurance on loans secured by homes and also to buy and sell NHA-insured mortgages. It<br />
does little direct lending today but rather insures loans through the NHA program and<br />
issues MBS. In recent years, CMHC has been operating on commercial principals.<br />
Sources and References<br />
1. American Banker, April 27, 1998<br />
2. CMHC <strong>Mortgage</strong> <strong>Market</strong> Trends, Fourth Quarter 1999<br />
3. CHMC <strong>Housing</strong> Outlook, First Quarter 2000<br />
4. CMHC, Canadian <strong>Housing</strong> Statistics, 1998<br />
5. IMF: <strong>International</strong> Financial Statistics, 2000<br />
6. World Bank, www.worldbank.org<br />
Contacts<br />
1. Canada <strong>Mortgage</strong> and <strong>Housing</strong> Corporation.<br />
700 Montreal Road,<br />
Ottawa, Ontario<br />
Tel: 613.748.2000<br />
www.cmhc-schl.gc.ca
DOMINICAN REPUBLIC<br />
Economic Per<strong>for</strong>mance<br />
Year Exchange<br />
Rate<br />
Pesos/US$<br />
Consumer<br />
Price Index<br />
294<br />
Change In<br />
Consumer<br />
Prices<br />
Pesos US$<br />
Nominal GDP<br />
(Millions)<br />
Nominal GDP<br />
(Millions)<br />
1990 11.35 169.96 50.46% 60,305 5,313<br />
1991 12.66 106.49 47.08% 96,333 7,609<br />
1992 12.58 106.44 4.26% 112,698 8,959<br />
1993 12.77 7.26 5.25% 121,808 9,539<br />
1994 13.06 103.28 8.26% 137,566 10,533<br />
1995 13.46 100.00 12.54% 162,283 12,057<br />
1996 14.06 98.73 5.40% 183,532 13,053<br />
1997 14.37 95.29 8.30% 215,064 14,966<br />
1998 15.79 88.89 4.49% 241,910 15,320<br />
1999* N/A N/A N/A N/A N/A<br />
Source: IMF<br />
The Dominican Republic has an economy that is characterized by high economic growth,<br />
low inflation, and continuous reduction in the national debt. Throughout the 1990s,<br />
tourism, construction and telecommunications sectors have been the main source of<br />
growth <strong>for</strong> the country, registering more than 60% of the growth <strong>for</strong> the past five years.<br />
There was a slight contraction in 1998 due to Hurricane George, but consumer prices and<br />
the exchange rate remained stable. In 1999 the Dominican economy sustained growth<br />
with a low rate of inflation. Additionally, economic stability and growth, and increased<br />
confidence have led to a significant expansion of the Republic’s banking sector. The<br />
Republic was not directly affected by the international financial crisis.<br />
Between 1992-1998, the Dominican Republic has experienced stable, economic growth<br />
patterns. During 1998 alone, GDP increased by 7.3%. Growth has averaged 7.6% over<br />
the past three years. This was one of the most substantial increases in all of Latin<br />
America. All this despite the US$ 2.2 billion lost due to damages and a short-term food<br />
shortage caused by Hurricane George.
295<br />
Inflation throughout the 1990s remained in the single digits, with the exception of 1994-<br />
95, when it peaked at over 12%. Inflation in 1998 was under 5%. Projections <strong>for</strong><br />
inflation in 1999 are estimated at 7.25 to 8%.<br />
In line with the growing economy, the unemployment rate has experienced a significant<br />
decrease. In 1991 the unemployment rate was recorded at 19.6%, and it decreased to<br />
14.3% by 1998. Construction, tourism, and telecommunications sectors contributed<br />
greatly to the approximately 200,000 new jobs that were created in 1999.<br />
<strong>Housing</strong> <strong>Market</strong><br />
Despite the promising growth rate in the construction sector, a housing shortage still<br />
exists in the Dominican Republic. The housing deficit is estimated at 600,000 units. In<br />
order to eliminate this shortage and to account <strong>for</strong> a growing population, annual<br />
investments in the housing sector of 30,000 million Pesos are required.<br />
In June of 2000 it was reported that under the administration of President Leonel<br />
Fernandez, RD$ 2,000 million was invested in a program managed by the Instituto<br />
Nacional de la Vivienda (INVI.). The investment went towards 83 housing projects<br />
managed by the INVI. This project includes 51,276 houses. Of this total, 39,845 were a<br />
part of a repair and construction program to benefit families who lost their homes as a<br />
result of Hurricane George.<br />
<strong>Mortgage</strong> <strong>Market</strong><br />
The main sources of household financing in the Dominican Republic come from savings<br />
and loan associations. There are a total of seventeen associations in the country. Catering<br />
mostly to middle-income homebuyers, these associations make up 19% of the financial<br />
system’s assets. Lower-income households rely on the National <strong>Housing</strong> Institute and<br />
household finance companies <strong>for</strong> obtaining their financing. Regulating the savings and<br />
loan institutions is the responsibility of the National <strong>Housing</strong> Bank (Banco Nacional de la<br />
Vivienda – BNV.) To maintain their regulation, the BNV imposes per family lending<br />
caps on all loans originated by the savings and loan institutions.<br />
Another 10% of the country’s financial assets are held by fourteen mortgage banks that<br />
serve mostly upper-income borrowers. The largest mortgage bank is the Dominican<br />
<strong>Mortgage</strong> Bank (Banco Hipotecario Dominicano – BHD.) These institutions also differ<br />
from the savings and loans in their ability to offer financing <strong>for</strong> short-term, medium-term,<br />
and long-term commercial construction projects. BNV and the Central Bank are<br />
responsible <strong>for</strong> the regulation of the mortgage banks, but with less strict regulations<br />
compared to their S&L counterparts.<br />
<strong>Housing</strong> finance has shown considerable growth over the past 5 years. At year-end of<br />
1995, outstanding mortgages equaled 4,512 million Pesos and totaling 4,441 loans. By<br />
1998 these numbers had just about doubled to 8,608 loans totaling 9,868.7 million Pesos.
296<br />
Policy Developments<br />
Foreign Investment Law (1995) – Based on free trade, this law establishes equal<br />
treatment of local and <strong>for</strong>eign investors.<br />
Free Trade Agreement (1995) –This law establishes free trade with Central America.<br />
Additional agreements were signed with France, Chile, Ecuador, and Taiwan <strong>for</strong> the<br />
protection of investments.<br />
General Re<strong>for</strong>m of Public Enterprises Law (1997) – This law expands the area<br />
allowing <strong>for</strong>eign investment. It also facilitates the privatization of several state-operated<br />
institutions, including the Dominican Electrical Company (CDE).<br />
Sources and References<br />
1. IDB Country Assessment: Colombia, by Jose Juan Gomes Lorenzo (Country<br />
Economist)<br />
http://www.iadb.org/regions/re2/sep/dr-sep.htm<br />
2. World Bank. Available: www.worldbank.org<br />
3. CIA World Fact Book, 1999<br />
4. El Banco Central de la Republica Dominica. Available: http://www.bancentral.gov.do<br />
5. "Evolution of the Economy, Monetary Policy and Outlook <strong>for</strong> Investment in the<br />
Dominican Republic". Address of Governor Hector Valdez Albizu of the Central<br />
Bank of the Dominican Republic, at the Adam Smith Seminar (June 9-11, 1999).<br />
6. “Fernandez Administration Built 51,276 <strong>Housing</strong> Units.” Dominican Republic One<br />
Daily News. June 15,2000. Available: http://www.dr1.com/daily/news061500.shtml<br />
7. Library of Congress. Country Studies: Dominican Republic. Banking and Financial<br />
Services. Available: http://lcweb2.loc.gov/cgibin/query/r?frd/cstdy:@field(DOCID+do0071)<br />
8. “The Dominican Republic Productive Sectors Remain Strong.” Caribbean<br />
Association of <strong>Housing</strong> <strong>Finance</strong> Institution – CASHFI Newsletter. August 2000.<br />
Contacts<br />
1. Caribbean Assoc. of <strong>Housing</strong> <strong>Finance</strong> Institution CASHFI<br />
Joe Bailey, Secretary General<br />
17 Belmont Road<br />
Kingston, Jamaica 5<br />
Tel: 1.876.968.3855<br />
Fax: 1.876.926.5598
J AM AI C A<br />
Economic Background<br />
Year Exchange<br />
Rate<br />
Jamaican $ /US$<br />
Consumer<br />
Price Index<br />
297<br />
Change In<br />
Consumer<br />
Prices<br />
Jamaican $ US$<br />
Nominal GDP<br />
(Millions)<br />
Nominal GDP<br />
(Millions)<br />
1990 8.04 18.89 21.96% 30,518 3,796<br />
1991 21.49 28.53 51.07% 45,217 2,104<br />
1992 22.18 50.58 77.30% 73,253 3,303<br />
1993 32.47 61.75 22.07% 99,843 3,075<br />
1994 33.20 83.40 35.06% 132,377 3,987<br />
1995 39.62 100.00 19.91% 170,133 4,294<br />
1996 34.87 126.41 26.41% 203,109 5,825<br />
1997 36.34 138.61 9.66% 220,556 6,069<br />
1998 37.05 150.58 8.63% 251,122 6,778<br />
1999 41.29 266,592 6,457<br />
Source: IMF<br />
In 1998, price stability and low inflation were the two favorable factors that can be<br />
mentioned that counterbalanced the large fiscal deficit of the Jamaican economy.<br />
Jamaica, like many other developing countries, has been affected by the economic crises<br />
in Asia, Russia, and more recently Brazil. A National Roundtable, created by the Prime<br />
Minister in 1999, has met to discuss the problems of the economy, and divided the<br />
problem (and task at hand) into five major areas. The areas of re<strong>for</strong>mation/reconstruction<br />
are the macroeconomic structures of the nation, the partnership of growth and<br />
development, the social infrastructure, the physical infrastructure, and international<br />
competitiveness.<br />
Inflation steadily decreased throughout the majority of the 1990s, also attributing to the<br />
price and exchange rate stability in the country. For example, the 1997 rate of inflation of<br />
9.66% was the first time the country had seen a single-digit increase in almost ten years.<br />
Inflationary pressures, however, are again mounting.<br />
GDP continues to grow, but at a slower rate. In 1992, Jamaica had a GDP growth rate of<br />
1.2%, compared to a 0.5% GDP growth rate in 1995, and –1.4% by 1996. The slowing<br />
GDP growth rate led to increased unemployment. Of the approximate 2.5 million people<br />
in Jamaica, estimates show that the unemployment rate was at 16.5%, up from 16% in<br />
1996, and 15.4% in 1994.<br />
The slowing GDP and increasing unemployment are reflections of the nation’s fairly high<br />
interest rates, resulting from tight monetary policy that aims at defending the national<br />
currency and a large fiscal deficit. Treasury bills peaked at 42.9% in 1994, and saw its<br />
lowest rate of 21.4% in 1997. Additionally, the deposit rate also experienced a high in<br />
1994 of 36.4%, and then decreased to 13.9% by 1997.
298<br />
<strong>Housing</strong> <strong>Market</strong><br />
The housing market in Jamaica is flourishing, showing several trends of expansion. By<br />
1995, it was estimated that 45% of the approximate 2.5 million in the country owned their<br />
homes, up from 27.5% in the previous year, and 6.2% in 1990. In fact, new originations<br />
went from approximately 5,556 units in 1992 (valued at J$ 1,540.5 million), to<br />
approximately 10,277 units in 1995 (valued at J$ 16,771 million). Home ownership<br />
continues to experience an increasing trend, but at a slower rate. In 1999 the ownership<br />
rate was at 60.1%.<br />
Despite the increasing trend of new originations, the housing construction sector has<br />
experienced the opposite. The contraction within the sector is attributed to two main<br />
factors. The first is that value of construction material imports increased by<br />
approximately 2% in 1998, the highest increase since 1992. The second factor<br />
contributing to the contraction is the reduced activities of the Portmore Pines and Cedar<br />
Grove Estates housing projects. <strong>Housing</strong> starts decreased by 41.2% to 4,232 units during<br />
1997, the lowest since 1992. Similarly, completions decreased by 40.4% to 3,694 units.<br />
This was also a low point since the early half of the decade.<br />
Despite these changes within the sector, construction has continued to significantly<br />
contribute to the growth of GDP. In 1990 and 1991, the sector recorded 9.8% of GDP,<br />
decreasing to 9.4% by 1995, and finishing the decade at approximately 8.4% of GDP.<br />
Year Population<br />
(Millions)<br />
Owner<br />
Occupancy<br />
<strong>Housing</strong> Starts*<br />
1990 2.41 0.06 3,070.00<br />
1991 2.37 0.06 4,810.00<br />
1992 2.40 0.07 5,710.00<br />
1993 2.42 0.11 6,045.00<br />
1994 2.46 0.27 6,028.00<br />
1995 2.49 0.45 7,171.00<br />
1996 2.52 3,422.00<br />
1997 2.55 3,373.00<br />
*Or Completions, Permits<br />
Source: IMF; Planning Institute of Jamaica. Available: http://www.mechala.com/devsegmt.htm<br />
<strong>Mortgage</strong> <strong>Market</strong><br />
There are four general classifications of sources <strong>for</strong> loan originations in Jamaica. They<br />
are:<br />
1. National <strong>Housing</strong> Trust - The National <strong>Housing</strong> Trust continued to be the dominant<br />
lending institution in Jamaica. Its originations grew by 22.7% in 1997, with a 51.5%<br />
increase in value (J$ 1.4 billion). Also in 1997, the NHT increased its individual<br />
home loan limit from J$ 600,000 to J$8 00,000, and from J$ 2 million to J$ 2.4<br />
million <strong>for</strong> co-applicant home loans.<br />
2. Building Societies – The Building Societies offer special mortgage rate plans to meet<br />
the needs of lower-income individuals, helping them to buy a home. In 1998, they
299<br />
financed a combined 1,077 mortgages, down from 2,497 in 1997. The number of<br />
building societies has decreased from over 20 to approximately 10 due to tightened<br />
economic conditions and the increased competitiveness of the NHT.<br />
3. Commercial Bank Loans and Advances – There is very little data on commercial<br />
bank lending portfolios, however, it is known that this portion of the financing sector<br />
has experienced continued decline since 1995.<br />
4. “Other” <strong>Mortgage</strong> Providers – This portion consists mainly of credit unions and<br />
two major life insurance companies. In 1998, credit unions financed 28 mortgages <strong>for</strong><br />
a value of J$ 28.9 million, up from 10 mortgages in 1997, <strong>for</strong> a total value of J$ 11.4<br />
million. This increase in the market share of mortgage financing is attributed to its<br />
more competitive interest rates. In terms of the insurance companies, available data<br />
reports that they financed a combined 42 mortgages in 1998 <strong>for</strong> a value of J$ 27.3<br />
million, up from 35 mortgages in 1997.<br />
Generally, the mortgage finance sector has experienced decreasing lending rates, reaching<br />
a peak of 49.5% in 1994. It then fell to a rate of 34.7% by 1998.<br />
Policy Developments<br />
In recent years, the Government of Jamaica has sought a more appealing business<br />
environment by lowering interest rates selectively. For example, the Bank of Jamaica<br />
repossession rate was reduced from 29% in 1997 to 22% <strong>for</strong> the majority of the first<br />
quarter of 1999. This initiative has sparked decreases in the lending and Treasury bill<br />
rates.<br />
The Financial Sector Adjustment Company (FINSAC) was set up in 1997 to implement<br />
the rescue of failed institutions and long-term re<strong>for</strong>ms. The organization is pursuing a<br />
plan of consolidating financial institutions under two entities: a commercial bank (<strong>Union</strong><br />
Bank), and an insurance company (Independent). The consolidation is a repackaging of<br />
the institutions <strong>for</strong> future divestment.<br />
Sources and References<br />
1. IDB Country Assessment: Jamaica, by Desmond Thomas (Country Economist)<br />
2. http://www.iadb.org/regions/re3/sep/ja-sep.htm<br />
3. Inter-American Development Bank<br />
4. Bank of Jamaica<br />
5. Caribbean Association of <strong>Housing</strong> <strong>Finance</strong> Institutions. “Construction and<br />
Installation.” 1998<br />
6. Caribbean Association of <strong>Housing</strong> <strong>Finance</strong> Institutions. “CASHFI Newsletter.” July<br />
1998<br />
7. Statistical Institute of Jamaica<br />
8. National <strong>Housing</strong> Trust<br />
9. The World Bank – “Country Report: Jamaica.” www.worldbank.org<br />
10. CIA World Fact Book, 1999
300<br />
Contacts<br />
1. Caribbean Assoc. of <strong>Housing</strong> <strong>Finance</strong> Institution CASHFI<br />
Joe Bailey, Secretary General<br />
17 Belmont Road<br />
Kingston, Jamaica 5<br />
Tel: 1.876.968.3855<br />
Fax: 1.876.926.5598<br />
2. National <strong>Housing</strong> Trust<br />
Earl Samuels, Managing Director<br />
4 Park Boulevard<br />
Kingston, Jamaica 5<br />
Tel: 1.876.926.7165 Fax: 1.876.968.3286<br />
Email: esamuels@cwjamaica.com<br />
3. Victoria Mutual Building Society<br />
Karl P Wright, CEO<br />
73-75 Hald Way Tree Road<br />
Kingston, Jamaica<br />
Tel: 1.876.968.1765 Fax: 1.876.968.1762<br />
Email: manager@vmbs.com
MEXICO<br />
Economic Background<br />
Year Exchange<br />
Rate<br />
Pesos/US$<br />
Consumer<br />
Price Index<br />
301<br />
Change In<br />
Consumer Prices<br />
Pesos US$<br />
Nominal GDP<br />
(Billions)<br />
Nominal GDP<br />
(Billions)<br />
1990 2.95 44.53 26.65% 738.90 250.47<br />
1991 3.07 54.63 22.66% 949.15 309.17<br />
1992 3.12 63.10 15.51% 1,125.33 360.68<br />
1993 3.11 69.25 9.75% 1,256.20 403.92<br />
1994 5.33 74.07 6.97% 1,420.16 266.45<br />
1995 7.64 100.00 35.00% 1,837.02 240.45<br />
1996 7.85 134.38 34.38% 2,503.81 318.96<br />
1997 8.08 162.10 20.63% 3,178.95 393.43<br />
1998 9.87 187.91 15.93% 3,791.19 384.11<br />
1999 9.51 219.07 16.58% 4,588.47 482.49<br />
Source: IMF; *Banco de Mexico<br />
Mexico has a substantially free market economy. The nation experienced steady growth<br />
throughout most of the 1990s, with two periods in exception: 1994-95 (the national<br />
currency deflation crisis) and the second quarter of 1998 (the Asian financial crisis). A<br />
great deal of privatization occurred between 1982 and 1998, which has contributed<br />
greatly to economic growth, increased employment, and produced higher wages. Despite<br />
the robust economy, Mexico still faces many structural problems including a poverty rate<br />
of over 28% of the country’s population.<br />
With the exception of the two periods previously mentioned, economic indicators have<br />
been consistent in their trends. Gross Domestic Product increased from 3.0% in 1993 to<br />
8.4% in 1994, decreased to –23.5% in 1995, and then increased again to 10.2% in 1997.<br />
The second quarter crisis in 1998 left the GDP at 4.8%. The construction sector has<br />
remained a strong contributor to the growth in GDP. In 1994, construction had an annual<br />
growth rate of 8.4% in terms of GDP, (-23.5% growth <strong>for</strong> 1995), and reached a 10.2%<br />
growth rate by 1997. Again, due to the 2 nd quarter crisis, the annual construction growth<br />
rate decreased to 4.8% by 1998.<br />
Since the 35% jump in consumer prices in 1995, Mexico has been successfully fighting<br />
inflation. Inflation during 1997 was 20.6%, and despite the turmoil in 1998, the inflation<br />
rate further decreased to 15.9%. Preliminary estimates suggest inflation fell further in<br />
1999. The official unemployment rate in 1998 was registered at 2.6%; however, there is<br />
considerable underemployment and extreme poverty throughout the nation.<br />
<strong>Housing</strong> <strong>Market</strong><br />
The Mexican population as of 1999 was 98 million. This included 21 million households.<br />
The urban growth rate remains high. The rate of new household <strong>for</strong>mation is 600,000 -
302<br />
700,000 a year. It is estimated that 84% of all homes are owner-occupied and less than<br />
10% of the housing stock is mortgaged. SEDESOL, the Ministry of Social Development,<br />
estimates that 3 million housing units are inadequate or deficient.<br />
There are three distinct types of housing markets in Mexico: <strong>for</strong>mal private sector, <strong>for</strong>mal<br />
public sector, and the in<strong>for</strong>mal. Formal private and public sector homes are built by<br />
developers and are titled properties, whereas the in<strong>for</strong>mal sector consists mainly of<br />
squatters. In<strong>for</strong>mal construction occurs gradually on land which may or may not be<br />
registered and titled to the occupant, and which may not initially have municipal services.<br />
Between 50-65% of all new homes built in Mexico each year are of this type.<br />
The Mexican housing stock grows between 500,000 and 750,000 units per year.<br />
Approximately 85% of the <strong>for</strong>mal housing starts since 1995 have been built by the pubic<br />
sector. In 1997, 190,549 new homes were completed. The growth rate of construction of<br />
new homes has slowed to lack of financing. Unit sizes range between 50 m2 in the social<br />
sector to 125-275 m2 in the private residential market. The average prices in 1999 were:<br />
Economic Group Distribution US$ Income Range US$ House Prices<br />
Social 24.6% $3,000-$7,500 $13,900<br />
Economic 40.5% $7,500-$15,000 $20,200<br />
Middle 23.8% $15,000-$30,000 $47,400<br />
Residential 9.0% $30,000-$60,000 $100,000<br />
Residential Plus 2.2% $60,000+ $378,100<br />
Source: Softec<br />
Except <strong>for</strong> the middle market, home prices adjusted <strong>for</strong> inflation have shown a significant<br />
reduction since 1993. This reflected the lingering effects of the two economic downturns,<br />
as well as increased competition and efficiency among developers.<br />
<strong>Mortgage</strong> <strong>Market</strong><br />
Year <strong>Mortgage</strong> Debt<br />
Outstanding<br />
Pesos (billions) US$ (billions)<br />
New<br />
Originations<br />
Outstanding<br />
<strong>Mortgage</strong><br />
Debt/GDP<br />
<strong>Mortgage</strong> Debt<br />
Outstanding<br />
New<br />
Originations<br />
Outstanding<br />
<strong>Mortgage</strong><br />
Debt/GDP<br />
1991 47.81 12,689.00 5.04% 15.57 4,133.22 5.04%<br />
1992 77.83 25,271.00 6.92% 24.95 8,099.68 6.92%<br />
1993 109.12 25,525.00 8.69% 35.09 8,207.40 8.69%<br />
1994 145.87 30,136.00 10.27% 27.37 5,654.03 10.27%<br />
1995 220.85 14,785.00 12.02% 28.91 1,935.21 12.02%<br />
1996 251.79 19,015.00 10.06% 32.08 2,422.29 10.06%<br />
1997 280.38 9,107.00 8.82% 34.70 1,127.10 8.82%<br />
Source: IDB<br />
<strong>Mortgage</strong> debt, as a percentage of GDP, has remained roughly constant at 9%. This<br />
number is somewhat misleading however, as much of the post-1994 increase reflects<br />
negative amortization. <strong>Mortgage</strong> originations were affected by the 1994 economic crisis.<br />
Private sector mortgage lending virtually disappeared, and originations went from N$
303<br />
30,136 million in 1994, to N$ 19,015 million in 1996, to a low of N$ 9,107 million in<br />
1997. Moreover, delinquency began to increase because of increasing unemployment and<br />
poor loan servicing and origination. In an attempt to rescue the mortgage market system,<br />
the Government of Mexico bought most of the delinquent loans at the time. As of<br />
September of 1999, the government purchased US $80 billion in bad loans, totaling 20%<br />
of GDP.<br />
The structure of the mortgage market as of the late 1990s is shown in Figure 1:<br />
OFFICIAL<br />
Banxico<br />
Hacienda<br />
Donors<br />
FONHAPO FOVI<br />
Figure 1<br />
MEXICO: STRUCTURE OF THE HOUSING FINANCE SYSTEM, 1996<br />
Commercial<br />
Banks/<br />
SOFOLES<br />
State<br />
Pensions<br />
MANDATED<br />
PENSIONS<br />
FOVISSSTE INFONAVIT<br />
Commercial<br />
Banks<br />
VOLUNTARY<br />
SAVINGS<br />
BORROWERS<br />
Low Income Moderate Income High<br />
Source: IncomeBernstein,<br />
Lea and Renaud 1997<br />
Autofinanciiamientos<br />
Funding <strong>for</strong> mortgage lending comes from four main sources: a 5% payroll deduction that<br />
goes into funds called INFONAVIT <strong>for</strong> private sector workers and FOVISSTE <strong>for</strong> public<br />
sector workers. INFONAVIT is the largest originator of mortgages in Mexico today.<br />
World Bank loans and Mexican Federal Budget contributions are on lent by FOVI to<br />
banks and SOFOLS, which are special purpose non-bank financial institutions.<br />
Commercial banks also fund loans from deposits. There was a dramatic decline in bank<br />
lending after the 1995 financial crisis. Prior to that time, 60% of originations came from<br />
banks with the leading lenders Banamex, Bancomer, Banco Serfin and Inverlat. Lending<br />
is also done by Autofinanciamientos, which are a closed savings and loans system which<br />
are also very popular in assisting with the purchase of cars (25-30% of total sales). It is<br />
estimated that there are 100,000 members in such programs generating 500-1,000 new<br />
loans per month. The structure of originations by number of loans is shown in the<br />
following chart:
# mortages originated<br />
400,000<br />
350,000<br />
300,000<br />
250,000<br />
200,000<br />
150,000<br />
100,000<br />
50,000<br />
0<br />
304<br />
<strong>Mortgage</strong>s Originated by Main Programs<br />
1990 1991 1992 1993 1994 1995 1996 1997 1998<br />
Source: Softec<br />
FONHAPO<br />
FOVISSSTE<br />
Banks<br />
FOVI<br />
INFONAVIT<br />
The primary mortgage product in Mexico is the dual index mortgage (DIM). The DIM<br />
separates loan accrual rate, which is based on a market interest rate such as certificate of<br />
deposit or treasury (CETES), and the borrower payment rate which is indexed to the<br />
minimum wage. The maximum term is set at 30 years but the initial term is less (e.g., 20<br />
years) in order to account <strong>for</strong> the negative amortization that occurs when market rate<br />
changes are greater than wage changes. This instrument is used by FOVI and the<br />
SOFOLs. INFONAVIT uses a variant of this instrument.<br />
There are three types of mortgage instruments in Mexico. They are:<br />
1. FOVI – A Dual Index <strong>Mortgage</strong> (DIM), with 25-30 year maturity. It is indexed to the<br />
minimum wage and balance 5% fixed (inflation indexed) accrual rate. It has a<br />
maximum LTV of 90%, and prior to the 1994 crisis, the balance was indexed to CPP.<br />
2. INFONAVIT – Price Level Adjusted <strong>Mortgage</strong> (PLAM) that is indexed to the<br />
minimum wage. Payment maximum is 25% of actual borrowed income. It has 25-30<br />
year maturity, payments are made bi-monthly through direct debit.<br />
3. Restructured Commercial Bank Loans – PLAM (referred to as UDI). Various<br />
accrual rates indexed daily to UDIs (Price Index). Most have 5-10 years of payment<br />
subsidies from the government.<br />
SOFOLES, which in Spanish means Limited Purpose Financial Institutions, are private<br />
mortgage banking institutions in Mexico. They can not take deposits from the public, but<br />
they are authorized to lend to any income level. However, these banks currently lend<br />
exclusively to the public sector and low-income individuals. SOFOLES servicing is very
305<br />
aggressive in comparison with that of the country’s other financing institutions as<br />
evidenced by low relative default rates. Recently, the SOFOLES began originating loans<br />
other than those in the FOVI program. The largest SOFOL, Su Casita, issued a small<br />
mortgage-backed bond in mid-2000.<br />
PROSAVI is the country's main, very-low income program <strong>for</strong> housing finance. The<br />
program is administered by FOVI. It provides highly subsidized housing finance <strong>for</strong> the<br />
purchase of houses that cost less than US$ 10,000. The PROSAVI program provides a<br />
20% up-front subsidy. The borrower is obligated to make an additional 10% down<br />
payment resulting in a loan-to-value ratio of 70%. This is in contrast to the standard<br />
FOVI programs that require a 10% down payment resulting in a 90% loan-to-value ratio.<br />
Policy Developments<br />
� Stand-by Agreement with the IMF – This was a broad three-year external financing<br />
program totaling US$ 23.7 billion, consisting of $ 16.9 billion in credit from<br />
international organizations and $ 6.8 billion in contingent credit arrangements with<br />
the U.S. and Canadian monetary authorities.<br />
� In 1999, FOVI obtained a World Bank loan of US$ 505 million. The preparation <strong>for</strong><br />
the loan was a three year process that targeted FOVI as being the center-piece of the<br />
Mexican housing finance system. One potential outcome of this process is the<br />
creation of a secondary mortgage market.<br />
Sources and References<br />
1. IDB Country Assessment: Mexico, by Ignacio Trigueros (Country Economist)<br />
http://www.iadb.org/regions/re2/sep/me-sep.htm<br />
2. World Bank, www.worldbank.org<br />
3. CIA World Fact Book, 1999<br />
4. El Banco de Mexico. Available: http://www.banxico.org.mx/<br />
5. Payeras, Manuel Z. “<strong>Housing</strong> <strong>Finance</strong> in Mexico: Current Conditions and<br />
Challenges.” September 1999.<br />
6. Bernstein, S., Lea, M. and Renaud, B., Mexico’s <strong>Housing</strong> <strong>Finance</strong> System 1991-96,<br />
Privatization in an Unstable Environment, Paper presented at the AREUEA<br />
<strong>International</strong> Real Estate Conference, U.C. Berkeley, June 1-2 1997.<br />
7. Bernstein, S. ed., Mexico-United States Bi-national Conference on the Development<br />
of a Secondary <strong>Mortgage</strong> <strong>Market</strong> in Mexico Conference Summary, Office of Federal<br />
<strong>Housing</strong> Enterprise Oversight, June 1999<br />
8. Softec, Mexican <strong>Housing</strong> Overview 1999<br />
Contacts<br />
1. Softec S.C.<br />
San Jeronimo 428<br />
Jardines del Pedregal<br />
Mexico DF 01900<br />
Tel: 52.56.68.1683
Fax: 52.56.68.1689<br />
306
TRINIDAD & TOBAGO<br />
Economic Background<br />
Year Exchange<br />
Rate<br />
currency/US$<br />
Consumer<br />
Price Index<br />
307<br />
Change In<br />
Consumer<br />
Prices<br />
TT$ US$<br />
Nominal GDP<br />
(Millions)<br />
Nominal GDP<br />
(Millions)<br />
1990 4.25 71.36 11.06% 21,539.30 5,068.07<br />
1991 4.25 74.06 3.78% 22,558.60 5,307.91<br />
1992 4.25 78.83 6.44% 23,118.10 5,439.55<br />
1993 5.81 87.37 10.84% 24,490.50 4,215.23<br />
1994 5.93 95.07 8.81% 29,312.00 4,943.00<br />
1995 6.00 100.00 5.18% 31,697.00 5,282.83<br />
1996 6.19 103.41 3.40% 34,448.10 5,565.12<br />
1997 6.30 107.15 3.63% 36,552.40 5,801.97<br />
1998 6.60 113.17 5.61% 38,197.10 5,787.44<br />
1999* 6.27 117.02 3.40% 41,044.90 6,546.24<br />
Source: IMF; *Source: Central Bank of T&T<br />
Between 1993 and 1998, Trinidad & Tobago experienced economic growth. Increased<br />
construction, growing activity in the transport, wholesale and retail sectors, and<br />
investment have all contributed to the growth. The unemployment rate has decreased,<br />
and the external current account deficit improved slightly. However, there remains a<br />
fiscal balance deficit. Overall, the economic indicators suggest that Trinidad & Tobago<br />
holds a stable financial position. Caribbean Community Organization members, including<br />
Trinidad & Tobago, are currently in the planning stages to develop a single Caribbean<br />
currency <strong>for</strong> all 12-island nation members. One of the developments of the common<br />
market to go into effect in June 2000 is the introduction of free movement of people and<br />
capital among the island countries.<br />
GDP is currently experiencing an upward growth trend, and in 1999 it was up 5.1% from<br />
4% in 1998. This is greatly attributed to the oil and gas sector. Unemployment is typically<br />
high in Trinidad & Tobago. The unemployment rate fell from 10% in the third quarter of<br />
1997 to 9.5% in the third quarter of 1998. The steady decline in the unemployment rate is<br />
the result of an increase in the number of jobs in the construction (27.7% increase),<br />
transport, communications, and the wholesale/retail sectors.<br />
The inflation rate began an upward trend in 1998, due mostly to an increase in food<br />
prices, which increased by approximately 14% between 1997 and 1998, again, due to<br />
decline in agriculture from the El Niño weather. Due to a strong anti-inflationary<br />
monetary policy and a stable exchange rate, Trinidad & Tobago has been able to keep<br />
inflation in check with rates dropping back to 3.4% in 1999, the lowest since 1996.
308<br />
Interest rates have also remained high, with nominal rates on six-month deposits at<br />
approximately 7.9% by 1998. Relatively high interest rates limit the amount of private<br />
investment within the country.<br />
<strong>Housing</strong> <strong>Market</strong><br />
The housing market in Trinidad and Tobago has remained fairly stable. In 1990, the<br />
stock of occupied housing was 271,871 units. Of this number, 74% were owned (201,930<br />
units), 13.26% were privately rented (36,040 units), and 0.47% were classified as squatter<br />
housing (1,289 units).<br />
Construction has not met the demand <strong>for</strong> new housing units. In fact, construction of new<br />
units decreased from an average of 6,700 per year in the late 1980s, to 1,502 new units in<br />
1990. Demand greatly outweighs the supply.<br />
<strong>Mortgage</strong> <strong>Market</strong><br />
There are several mortgage-financing companies in the country. The National Insurance<br />
Board (NIB), the National <strong>Housing</strong> Authority (NHA), and the Trinidad & Tobago<br />
<strong>Mortgage</strong> <strong>Finance</strong> Company (TTMF) are the public sector organizations. Loan<br />
associations, trust companies, life insurance companies, pension funds and commercial<br />
banks are the private lending companies.<br />
The NHA mainly lends to lower-income groups, implementing government housing<br />
programs. It provides 30-40 year mortgage loans of up to TT$ 100,000 at rates from<br />
5.5% to 7% depending on family income (capped at TT$ 4,500 per month) and the<br />
amount of the loan. The TTMF is controlled, owned, and financed by both the<br />
Government and the National Insurance Board. This institution provides loans ranging<br />
from TT$ 142,000 – 237,000 at rates between 8.0% and 9.5%, with up to 30-year<br />
maturities. The NIB does not originate loans itself. Instead, the company employs seven<br />
financial institutions as agents which grant the loans on its behalf and manage/service<br />
them in exchange <strong>for</strong> fees ranging from 0.75% per annum to 1.5% per annum of loans<br />
outstanding less principal.<br />
There are several mortgage program options available. The First Time Home Buyers<br />
Program is offered to those who are purchasing a home <strong>for</strong> the first time with a property<br />
value less than TT$ 300,000 with rates ranging from 8-9%. These loans are offered by<br />
Trinidad & Tobago <strong>Mortgage</strong> <strong>Finance</strong> Co., Ltd, <strong>for</strong> those persons who do not already own<br />
property. For property or construction costs priced in excess of TT$ 150,000 to a<br />
maximum of TT$ 600,000, there is Home <strong>Mortgage</strong> Bank’s Homeowner Prime <strong>Mortgage</strong><br />
Facility at 11.5% with a maximum term of 25 years.<br />
The Home <strong>Mortgage</strong> Bank (HMB) is a secondary market facility with the primary<br />
function of buying and selling loans between financial institutions. It finances its<br />
purchases through the issuance of debt and mortgage-backed securities. The main goals<br />
of this institution are as follows:
309<br />
• Develop and maintain an organized secondary market that will increase the<br />
availability of mortgage financing<br />
• Contribute to the mobilization of long term savings <strong>for</strong> housing investment<br />
• Support the development of a national system of housing finance to promote the<br />
growth and development of the capital market<br />
As of the end of 1998, HMB had TT$ 630 million of bonds outstanding. In 1999 it began<br />
issuing Guaranteed <strong>Mortgage</strong> Investment Certificate (GareeMICs), the first collateralized<br />
mortgage obligation securities to be offered in the local capital market. This instrument<br />
is a type of mortgage-backed security with several maturity tranches.<br />
Policy Developments<br />
• There has been a major downsizing and refocusing of the public sector with an<br />
extensive program of divestment of public employment. Most commercial<br />
enterprises are being privatized, and privatization is being introduced to public<br />
utilities.<br />
• The US Department of <strong>Housing</strong> and Urban Development announced in October 1999<br />
that, along with Overseas Private Investment Corporation, ef<strong>for</strong>ts would be made to<br />
introduce a domestic and international mortgage market in the Caribbean and Central<br />
America. This will include the development of financing tools to promote US private<br />
investors to originate mortgages <strong>for</strong> the low-income public sector at competitive rates.<br />
Sources and References<br />
1. IDB Country Assessment: Trinidad & Tobago, by Badrul Haque (Country<br />
Economist)<br />
Available: http://www.iadb.org/regions/re3/sep/tt-sep.htm<br />
2. CIA World Fact Book, 1999<br />
3. World Bank. Trinidad & Tobago. Available: http://www.worldbank.org<br />
4. “Profile of Caribbean.” Available: http://www.onerealtorplace.com<br />
5. The Home <strong>Mortgage</strong> Bank. Available: http://www.homemortgagett.com<br />
6. Central Bank of Trinidad & Tobago. Available: http://www.central-bank.org.tt<br />
Contacts<br />
1. Home <strong>Mortgage</strong> Bank<br />
Calder Hart, General Manager<br />
14 th Fl. Central Banki ng Bldg.<br />
PO Box 255<br />
Port of Spain, Trinidad<br />
Tel: 1.868.625.4972<br />
Fax: 1.868.623.3167<br />
2. Trinidada & Tobago <strong>Mortgage</strong> <strong>Finance</strong> Co Ltd<br />
Kazim Ali, Managing Director<br />
Albion Court 61 Dundonald St.
PO Box 1096<br />
Port of Spain, Trinidad<br />
Tel: 1.868.624.7776<br />
Fax: 1.868.623.9212<br />
Email: ttmfceo@tstt.net.tt<br />
310<br />
3. Caribbean Assoc. of <strong>Housing</strong> <strong>Finance</strong> Institution CASHFI<br />
17 Belmont Road<br />
Kingston, Jamaica 5<br />
Tel: 1.876.968.3855<br />
Fax: 1.876.926.5598
United States<br />
Economic Background<br />
Year Exchange Rate<br />
US$/ECU<br />
311<br />
Consumer Price Index Change In Consumer<br />
Prices<br />
Nominal GDP<br />
(Billions)<br />
1990 1.27 85.74 5.40% 5,803.2<br />
1991 1.24 89.37 4.23% 5,986.2<br />
1992 1.30 92.08 3.03% 6,318.9<br />
1993 1.17 94.80 2.95% 6,642.3<br />
1994 1.19 97.27 2.61% 7,054.3<br />
1995 1.31 100.00 2.81% 7,400.5<br />
1996 1.27 102.93 2.93% 7,813.2<br />
1997 1.13 105.34 2.34% 8,300.8<br />
1998 1.12 106.97 1.55% 8,759.9<br />
1999 109.31 2.19% 9,248.5<br />
Source: IMF<br />
The U.S. economy is in the midst of an unprecedented post-war boom. For the fourth<br />
consecutive year, the economy expanded by more than 4 percent, well above the average<br />
growth rate, since 1973 of 3 percent. The booming stock market continued to improve<br />
household balance sheets, and the average unemployment rate fell to a 30-year low of 4.2<br />
percent. Consumer price inflation accelerated to 2.2 percent during the year from 1.6<br />
percent in 1998. Concerns about further acceleration led the Federal Reserve to raise its<br />
federal funds rate target by three-fourths of a percentage point in the second half of 1999.<br />
Real interest rates remain rather high, reflecting the large demand <strong>for</strong> capital to fund the<br />
record current account deficit and record levels of consumer debt.<br />
Interest Rates <strong>Mortgage</strong> Rates Gov't Bond Yields<br />
Year Interbank<br />
Money<br />
<strong>Market</strong><br />
CD<br />
Secondary<br />
Mkt Rate<br />
Treasury<br />
Bill<br />
Rate<br />
30 Year<br />
Fixed<br />
Rate<br />
1 Year<br />
ARM<br />
Short-term Long-Term<br />
1990 8.10% 8.15% 7.51% 10.39% 9.15% 8.25% 8.55%<br />
1991 5.69% 5.84% 5.41% 9.66% 8.26% 6.81% 7.86%<br />
1992 3.52% 3.68% 3.46% 8.50% 6.59% 5.31% 7.01%<br />
1993 3.02% 3.17% 3.02% 7.48% 5.74% 4.44% 5.87%<br />
1994 4.20% 4.63% 4.27% 8.17% 6.42% 6.26% 7.08%<br />
1995 5.84% 5.92% 5.51% 8.18% 7.13% 6.26% 6.58%<br />
1996 5.30% 5.39% 5.02% 7.98% 7.06% 5.99% 6.44%<br />
1997 5.46% 5.62% 5.07% 7.89% 6.90% 6.10% 6.35%<br />
1998 5.35% 5.47% 4.82% 7.19% 6.46% 5.14% 5.26%<br />
1999 4.97% 5.33% 4.66% 7.44% 6.53% 5.49% 5.64%<br />
Source: IMF, Federal <strong>Housing</strong> finance Board. <strong>Mortgage</strong> Rates effective<br />
<strong>Housing</strong> <strong>Market</strong>s<br />
The U.S. housing market began 2000 on a high note. Buoyed by the longest economic<br />
expansion in history, home sales, homeowner rates, and the value of residential
312<br />
construction all set new records in 1999. Thanks to strong income growth, housing<br />
af<strong>for</strong>dability remained good <strong>for</strong> most Americans despite rising interest rates, home prices<br />
and rents. Despite more than a full percentage point increase in interest rates over the<br />
course of the year, both home sales and the value of residential construction reached new<br />
highs in 1999. Single-family starts continued to climb during the year reaching their<br />
highest level since 1978. Multi-family starts fell slightly however.<br />
Thousands<br />
Year <strong>Housing</strong><br />
Starts<br />
% Multi-family <strong>Housing</strong><br />
Completions<br />
New Single<br />
Family Home<br />
Sales<br />
Existing Single-<br />
Family Home<br />
Sales<br />
1990 1,192.7 22.0% 1,308.0 534 3211<br />
1991 1,013.9 14.0% 1,090.8 509 3220<br />
1992 1,199.7 12.0% 1,157.5 610 3520<br />
1993 1,287.6 10.0% 1,192.7 666 3802<br />
1994 1,457.0 15.0% 1,346.9 670 3946<br />
1995 1,354.1 18.0% 1,312.6 667 3812<br />
1996 1,476.8 18.0% 1,412.9 757 4196<br />
1997 1,474.0 20.0% 1,400.5 804 4382<br />
1998 1,616.9 19.0% 1,474.2 886 4970<br />
1999 1,666.5 18.0% 1,636.1 907 5197<br />
Source: HUD<br />
House prices in most parts of the country increased. The rate of increase has exceeded the<br />
general inflation rate in each of the last 6 years. House price appreciation has become<br />
much more uni<strong>for</strong>m across the country as the economic expansion continued.<br />
House Prices<br />
Year Average New<br />
Single-Family<br />
House Price<br />
Median New<br />
Single Family<br />
House Price<br />
Average Existing<br />
Single Family<br />
House Price<br />
Median Existing Single<br />
Family<br />
House Price<br />
1990 149,800 122,900 118,600 95,500<br />
1991 147,200 120,000 128,400 100,300<br />
1992 144,100 121,500 130,900 103,700<br />
1993 147,700 126,500 133,500 106,800<br />
1994 154,500 130,000 136,800 109,900<br />
1995 158,700 133,900 139,100 113,100<br />
1996 166,400 140,000 141,800 115,800<br />
1997 176,200 146,000 150,500 121,800<br />
1998 181,900 152,500 159,100 128,400<br />
1999 195,800 160,000 168,300 133,300<br />
Source: HUD<br />
Powered by strong income and employment growth, the national homeownership rate<br />
reached a new annual high of 66.8% in 1999 and continued to climb across all geographic<br />
regions, age groups and racial/ethnic groups. Homeownership has gotten an extra lift<br />
from mortgage industry innovation and outreach to low income borrowers. With the<br />
introduction of low down-payment products, flexible underwriting standards and
313<br />
improved risk assessment tools, lenders have helped millions of low-income families buy<br />
first homes. For example, loans to low income buyers in metropolitan areas increased by<br />
55% between 1993 and 1998, compared with a 40% increase in loans to high income<br />
borrowers.<br />
<strong>Mortgage</strong> <strong>Market</strong><br />
Originations of single-family mortgages reached $ 1.3 trillion in 1999. That volume was<br />
the second highest total ever, down 10 percent from the preceding year’s record.<br />
Quarterly originations declined steadily during the year, as the rising-rate environment<br />
decreased borrower incentives to refinance existing mortgages. Originations of<br />
conventional mortgages declined more than total originations, as home loans insured by<br />
the Federal <strong>Housing</strong> Administration and guaranteed by the Veterans Administration<br />
increased to record levels. FHA originations rose 19 percent in 1999, while VA<br />
production increased 16 percent. The share of mortgages with FHA or VA financing rose<br />
to 13 percent, the highest since 1994. Net new insurance of conventional loans written by<br />
private mortgage insurers increased slightly to nearly $ 189 billion. Originations of subprime<br />
mortgages rose 7 percent to $ 160 billion, 12.2 percent of the conventional market.<br />
Residential <strong>Mortgage</strong> <strong>Market</strong> (Billions US$)<br />
Year 1-4 Family<br />
<strong>Mortgage</strong> Debt<br />
Outstanding<br />
New<br />
Originations<br />
Gross<br />
Outstanding 1-4<br />
Family <strong>Mortgage</strong><br />
Debt/GDP<br />
Total <strong>Mortgage</strong><br />
Debt<br />
Outstanding<br />
1990 2,617 458 45.1%<br />
1991 2,781 562 46.5%<br />
1992 3,036 894 48.0% 4,091<br />
1993 3,225 1,020 48.6% 4,261<br />
1994 3,355 769 47.6% 4,393<br />
1995 3,510 639 47.4% 4,604<br />
1996 3,722 785 47.6% 4,902<br />
1997 3,960 859 47.7% 5,217<br />
1998 4,328 1,450 49.4% 5,728<br />
1999* 4,647 1,310 50.2% 6,181<br />
* 1999 3rd quarter debt outstanding; Source: Federal Reserve, OFHEO<br />
Higher mortgage rates altered the characteristics of conventional, single-family mortgages<br />
originated in 1999. According to Freddie Mac, the average monthly share of mortgages<br />
made to refinance existing loans was 32 percent, down from 52 percent in 1998. During<br />
1999, the refinance share fell from 50 percent in the first quarter to 22 percent in the third<br />
and fourth quarters. With rising rates, fewer homebuyers refinanced their homes to reduce<br />
their payments. More who did so took out equity by increasing the size of their loan. As<br />
in the previous year, the vast majority of refinancing borrowers chose long-term fixedrate<br />
loans.<br />
Rising mortgage rates also led more borrowers to choose ARMs over fixed-rate loans in<br />
1999. The ARM share of conventional single-family originations, after reaching a low in<br />
the fourth quarter of 1998, had climbed a year later to its highest level since the third<br />
quarter of 1996. According to the Federal <strong>Housing</strong> <strong>Finance</strong> Board survey, the ARM share
314<br />
of the market on a quarterly average basis rose from 12 percent in 1998 to nearly 22<br />
percent in 1999. The decline in FRMs was much more pronounced in the jumbo market.<br />
The fixed-rate share of jumbo loans, based on the number of mortgages, fell from 60<br />
percent in 1998 to 41 percent in 1999. The fixed-rate share of con<strong>for</strong>ming mortgages fell<br />
from 90 percent to 83 percent. Many depository institutions prefer to retain adjustablerate<br />
loans in their portfolios rather than sell them to the secondary market, because they<br />
can earn attractive spreads with acceptable levels of interest rate risk by financing ARMs<br />
with short-term liabilities.<br />
The proportion of single-family mortgages originated by the largest lenders continued to<br />
increase in 1999, consistent with the consolidation trend in the financial services industry.<br />
The top 25 originators accounted <strong>for</strong> 57 percent of all single-family originations in 1999,<br />
up from 55 percent in 1998 and more than double their market share in the early 1990s.<br />
Lenders continued to rely on multiple channels of production to originate loans. Of all<br />
single-family mortgages originated in 1999, 26 percent were acquired from brokers, 36<br />
percent came from correspondent lenders (lenders who fund a loan and sell it to another<br />
lender), and 39 percent were originated through retail channels.<br />
The U.S. mortgage market is characterized by specialization in origination, servicing and<br />
funding. Thus, the same lenders that originate do not necessarily service or fund loans.<br />
Servicing has also become more consolidated with the top 10 servicers controlling 40.6%<br />
of the market. The largest originators and servicers in 1999 were:<br />
Top Originators<br />
Twelve Months 1999<br />
Top Servicers<br />
December 31, 1999<br />
Institution $Billions Institution $Billions<br />
1. Chase Home <strong>Finance</strong> 93.4 1. Chase Home <strong>Finance</strong> 310.9<br />
2. Norwest <strong>Mortgage</strong> 82.0 2. Bank America 294.6<br />
3. Countrywide 75.4 3. Norwest <strong>Mortgage</strong> 279.6<br />
4. Bank America 63.2 4. Countrywide 245.8<br />
5. Washington Mutual 41.5 5. Washington Mutual 159.5<br />
6. Fleet Boston Financial 35.1 6. GMAC <strong>Mortgage</strong> Corp 150.9<br />
7. HomeSide Lending, Inc. 29.0 7. HomeSide Lending, Inc. 150.7<br />
8. ABN AMRO <strong>Mortgage</strong> Grp. 28.3 8. Fleet <strong>Mortgage</strong> Group 150.5<br />
9. Cendant <strong>Mortgage</strong> Services 25.6 9. First Nationwide <strong>Mortgage</strong> 96.5<br />
10. National City <strong>Mortgage</strong> Co. 23.6 10. Citicorp <strong>Mortgage</strong> Inc. 89.6<br />
Top 10 Totals 497.0 Top 10 Totals 1928.7<br />
Others 778.0 Others 2826.4<br />
Total $1310.0 Total $4,755.1<br />
Source: Inside <strong>Mortgage</strong> <strong>Finance</strong>
315<br />
Residential 1-4 family mortgage debt outstanding grew by 9% in 1998 and 7% through<br />
the third quarter of 1999 to a level of $ 4.6 trillion. Total mortgage debt outstanding<br />
including multi-family and commercial mortgages was $ 6.18 trillion with multi-family<br />
accounting <strong>for</strong> 6% and commercial accounting <strong>for</strong> 17% of the outstanding. Residential<br />
mortgage debt-to-GDP was 50% and total mortgage debt-to-GDP stood at 68%.<br />
An increasing share of mortgage debt outstanding is in the <strong>for</strong>m of mortgage-backed<br />
securities. Through the third quarter of 1999, 47% of all mortgage debt was securitized<br />
and approximately 59% of single-family mortgage debt was securitized.<br />
<strong>Market</strong> Share by Investor 1999 (3 rd Q)<br />
Current Year Debt Outstanding<br />
Comm Banks 23.0%<br />
Savings Banks 11.0%<br />
Life Cos 4.0%<br />
Federal Agency 5.0%<br />
<strong>Mortgage</strong> Pools/Trusts 47.0%<br />
Individuals/Other 10.0%<br />
Source: Federal Reserve<br />
The main issuers of mortgage-backed securities in the US are the large governmentsponsored<br />
enterprises, Fannie Mae and Freddie Mac. These institutions purchase A<br />
quality mortgage loans and fund themselves either through the issuance of mortgage passthrough<br />
securities or debt (callable and straight). Between them, Fannie Mae and Freddie<br />
Mac funded $ 1.96 trillion in residential mortgage loans as of the end of 1999 or more<br />
than 42% of residential mortgage debt outstanding. Their balance sheet breakdown at the<br />
end of 1999 is shown below:<br />
Fannie Mae Freddie Mac<br />
Retained <strong>Mortgage</strong> Portfolio $522,977 $322,914<br />
MBS Outstanding $679,169 $537,883<br />
MBS Issuance $300,689 $239,783<br />
Net Income $3,912 $2,223<br />
Capital $17,629 $11,525<br />
Source: OFHEO<br />
In recent years, the enterprises have substantially increased the size of their retained<br />
mortgage portfolios (up 3.5 times <strong>for</strong> Fannie Mae and 14 times <strong>for</strong> Freddie Mac since<br />
1990). This trend reflects the ability of the enterprises to issue callable debt, which<br />
allows them to better manage the optionality of their retained mortgage portfolios. The<br />
growth of the enterprises has raised some concerns about encroachment on the private<br />
sector. In 1999 a group called FMWatch was created to monitor their activities and lobby<br />
against expansion of their charters.<br />
As government-sponsored enterprises, Fannie Mae and Freddie Mac are chartered by the<br />
US government but owned by the public (shares are traded on the New York Stock<br />
Exchange). Their government charter provides a number of benefits including a line of
316<br />
credit from the US Treasury and exemption from Securities and Exchange Commission<br />
registration of their securities. Their charters are limited to providing a secondary market<br />
in residential mortgages.<br />
The other major government player in the secondary market is Ginnie Mae (the<br />
Government National <strong>Mortgage</strong> Association). Ginnie Mae is a government agency and its<br />
securities are issued with a payment guarantee backed by full faith and credit of the U.S.<br />
Ginnie Mae provides timely payment guarantees on pools of FHA and VA-insured<br />
mortgages issued primarily by mortgage companies. As of the third quarter of 1999,<br />
there were $ 582 billion in outstanding GNMA-guaranteed securities.<br />
There are more than 20 private conduits that issued mortgage-backed securities in the US.<br />
The loans they securitize are jumbo loans (with outstanding balances greater than the loan<br />
limits imposed on the enterprises) or less than A quality loans which are ineligible <strong>for</strong><br />
purchase.<br />
The Federal Home Loan Bank System provides collateralized loans to its member<br />
institutions funded by the issuance of debt (straight and callable). There are 12 district<br />
banks and Bank System members include Federal and State chartered thrift institutions,<br />
commercial banks, credit unions and insurance companies. As of the end of 1999, the<br />
FHLBs had $397.8 billion in outstanding advances to their members with total assets of $<br />
583 billion and total debt (consolidated) obligations of $ 525 billion.<br />
In 1997, the Federal Home Loan Bank of Chicago introduced a new program, <strong>Mortgage</strong><br />
Partnership <strong>Finance</strong>, in which member institutions originate loans on behalf of the FHLB<br />
and provide credit enhancement in the <strong>for</strong>m of a small subordinated tranche and earn out<br />
of a portion of the servicing fee. Under the MPF Program, the FHLB provides the funding<br />
<strong>for</strong> MPF loans (the liquidity risk) and manages their interest rate and prepayment risks<br />
and the lender bears a majority of the credit risk. This program differs from that of<br />
Fannie Mae and Freddie Mac in which the credit risk is transferred to the enterprise.<br />
Sources and References<br />
1. Joint Center <strong>for</strong> <strong>Housing</strong> Studies of Harvard University, The State of the Nation’s<br />
<strong>Housing</strong> 2000<br />
2. Morgan Stanley Dean Witter, Inside the Global Economy, May 2000<br />
3. IMF: <strong>International</strong> Financial Statistics, 2000<br />
4. Office of Federal <strong>Housing</strong> Enterprise Oversight, Report to Congress 2000<br />
5. U.S. Department of <strong>Housing</strong> and Urban Development, U.S. <strong>Housing</strong> <strong>Market</strong><br />
Conditions, August 2000<br />
6. Inside <strong>Mortgage</strong> <strong>Finance</strong>, various issues<br />
7. Freddie Mac, Secondary <strong>Mortgage</strong> <strong>Market</strong>s: <strong>Market</strong> Trends 1999, April 1999<br />
Contacts<br />
1. Federal Home Loan Bank of Chicago,<br />
11 E. Wacker Dr.,
Chicago IL 60601,<br />
Tel: (312) 565-5689<br />
http://www.fhlb.com<br />
2. Fannie Mae<br />
3900 Wisconsin Avenue<br />
NW, Washington, DC 20016-2892<br />
Tel: (202) 752-7000<br />
http://www.fanniemae.com<br />
3. Freddie Mac<br />
8200 Jones Branch Drive<br />
McLean, VA 22102-3110<br />
Tel: (703) 903-2000<br />
http://www.freddiemac.com<br />
317<br />
4. <strong>Mortgage</strong> Bankers Asssociation of America<br />
1919 Pennsylvania Avenue, NW.<br />
Washington, DC 20006-3438<br />
Tel: (202) 557-2700<br />
Email: membership@mbaa.org clientservicesonline@mbaa.org<br />
http://www.mbaa.org/about/<br />
5. Office of Federal <strong>Housing</strong> Enterprise Oversight (OFHEO)<br />
1700 G Street, NW 4th Floor<br />
Washington, DC 20552<br />
Tel: (202) 414-3800<br />
http://www.ofheo.gov<br />
6. U.S. Department of <strong>Housing</strong> and Urban Development<br />
451 7th Street,<br />
SW, Washington, DC 20410<br />
Tel: (202) 708-1112<br />
http://www.hud.gov<br />
7. Countrywide Home Loans<br />
4500 Park Granada<br />
Calabasas CA 91302,<br />
Tel: 1-800-556-9568<br />
http://www.countrywide.com

