Annual report 2006.pdf - Hutt City Council
Annual report 2006.pdf - Hutt City Council
Annual report 2006.pdf - Hutt City Council
- No tags were found...

You also want an ePaper? Increase the reach of your titles
YUMPU automatically turns print PDFs into web optimized ePapers that Google loves.
2006<strong>Annual</strong> ReportFor the year ended 30 June 2006
ContentsContact Us......................................................................................................................................................... 2Vision for <strong>Hutt</strong> <strong>City</strong>............................................................................................................................................ 3Report from <strong>Council</strong>........................................................................................................................................... 4Report from the Staff......................................................................................................................................... 6Strategic Framework.......................................................................................................................................... 8Report on Strategic Measures............................................................................................................................. 9Report on Governance......................................................................................................................................14Report on Staff Management.............................................................................................................................18Report on Social Development..........................................................................................................................20Report on Our Commitment to the Treaty of Waitangi.......................................................................................23Report on Economic Development....................................................................................................................24Report on the Environment...............................................................................................................................27Report on Financial Policies..............................................................................................................................37Financial Statements........................................................................................................................................ 43• Report of the Auditor-General........................................................................................................................................................................................ 44• Significant activity summary...........................................................................................................................................................................................47• Five-year financial summary.......................................................................................................................................................................................... 90• Financial statements....................................................................................................................................................................................................... 91• Statement of accounting policies................................................................................................................................................................................... 94• Notes to the financial statements ............................................................................................................................................................................... 100• Financial summary of major capital and operating projects..................................................................................................................................... 114• <strong>Council</strong>-controlled organisations................................................................................................................................................................................. 117<strong>Hutt</strong> <strong>City</strong> Profile............................................................................................................................................. 122Appendices• Definitions......................................................................................................................................................................................................................124• Source of information for level of achievement.......................................................................................................................................................... 126• Political structure.......................................................................................................................................................................................................... 127• Mayor and councillors.................................................................................................................................................................................................. 128• Community boards and ward committee members................................................................................................................................................... 129• Management structure................................................................................................................................................................................................. 130ISSN: 1171-9990
Contact UsRegistered OfficeAddress: <strong>Hutt</strong> <strong>City</strong> <strong>Council</strong>, 30 Laings Road, Lower <strong>Hutt</strong>Postal Address:Telephone:Private Bag 31 912, Lower <strong>Hutt</strong>(04) 570 6666 or 0800 HUTT CITYFacsimile: (04) 569 4290Email:Website:contact@huttcity.govt.nzwww.huttcity.infoContact Us
Vision for<strong>Hutt</strong> <strong>City</strong>The Community Plan provides direction for <strong>Council</strong>’s plans, policies and strategies and gives a long term focus to all<strong>Council</strong>’s activities. This <strong>Annual</strong> Report measures performance against the community plan targets.The Community Plan has five key areas:People<strong>Hutt</strong> <strong>City</strong> <strong>Council</strong> Strategic Goals• A vibrant and diverse city.• Accessible and high quality leisure activities and facilities.• A connected, safe and healthy community.Utility Services<strong>Hutt</strong> <strong>City</strong> <strong>Council</strong> Strategic Goal• Affordable, sustainable, accessible and high quality services.Environment<strong>Hutt</strong> <strong>City</strong> <strong>Council</strong> Strategic Goal• A clean, healthy, attractive and sustainable environment.Economy<strong>Hutt</strong> <strong>City</strong> <strong>Council</strong> Strategic Goal• A strong, enterprising and diverse economy.Organisation<strong>Hutt</strong> <strong>City</strong> <strong>Council</strong> Strategic Goals• A best practice organisation that provides value for money and prudent management.• An organisation that values its customers and staff.Vision for <strong>Hutt</strong> <strong>City</strong>
Report from<strong>Council</strong>Welcome to the 2006 <strong>Annual</strong> Report. This document outlines the <strong>Hutt</strong> <strong>City</strong> <strong>Council</strong>‘s activities over the past twelve months.It’s been a year of significant progress for the council. We fulfilled our promise to ratepayers to hold rate increases to below the rateof inflation, and this will continue in 2007 and every year after that to 2016. This is and will result in a reduction in rates,in real terms.We remain committed to reducing the level of long-term debt so that we may free up funds otherwise used to pay interest on debt.Instead we have invested that money to develop the city’s infrastructure and almost doubled the amount of capital expenditureover the past twelve months, from $22 million in 2005 to $38 million in 2006.Most of this has been for flood protection. The devastating floods of 2004 and 2005 cruelly exposed the inadequacy of some of thecity’s stormwater system. Stage One of work on Wainuiomata’s Black Creek is almost complete, Stage Two is about to begin, and wehave decided to bring forward Stage Three, from 2015/16 to 2010/11. Construction of the pumping station where the Opahu Streamjoins the <strong>Hutt</strong> River is also well underway.We continue to work collaboratively with the Greater Wellington Regional <strong>Council</strong> to find solutions for cleaning up pollution andminimising the flood risk on the Waiwhetu and Awamutu streams.Work continues on the Silverstream landfill, which, once completed, will be a world-class, environmentally responsible, sustainablelandfill facility that will last for more than 50 years.<strong>Hutt</strong> <strong>City</strong> continues to enjoy a strong economic surge. This year saw Westfield Queensgate completed except for the 1400-seatVillage Cinema, which is due to open soon. Long-standing local business Titan opened a new $4 million state-of-the-art head officein Seaview, while Noel Leeming opened new premises in the CBD.Exciting developments completed or still under construction include the Pak N Save supermarket in Brunswick Street, the HarveyNorman store at the corner of Rutherford Street and Melling Bridge and the soon to open Les Mills gymnasium at the former MitreTen site.As Mayor it’s heartening to see businesses like these investing in <strong>Hutt</strong> <strong>City</strong> because it reflects confidence in our future. Theycontribute more jobs, growth and prosperity for the city, and for that I sincerely thank them.The CBD has begun transformation with the upgrade of Margaret Street, which improves pedestrian access between WestfieldQueensgate and retail shops on High Street. <strong>Council</strong> has committed more funding for further enhancement of the CBD as partof the CBD Masterplan project. It is important to continue the integration of Queensgate and the rest of the CBD.<strong>Hutt</strong> <strong>City</strong> was the talk of the region following the launch of new tongue in cheek billboards around Wellington <strong>City</strong> designed toattract visitors and raise the profile of the city. The campaign helped reshape the image and perceptions of <strong>Hutt</strong> <strong>City</strong> by using goodhumour, self confidence and understatement.<strong>Council</strong>, in partnership with Work and Income, launched a major new initiative into help people, especially school leavers, intoskilled jobs. TradeStart began in December 2005. It provides information about trades and training opportunities. The YouthTransition Service project, again in partnership with Work and Income, is another example of <strong>Council</strong> helping our young peoplereach their potential.Report from <strong>Council</strong>
Our vision is to make <strong>Hutt</strong> <strong>City</strong> a family friendly city – and we are achieving that. We are home to many high quality schools andtertiary institutions and blessed with recreational facilities the envy of most other cities. With crime on the way down, and jobopportunities on the rise, we are an attractive place for families wanting a fresh start.I want to thank our councillors and council officers for their hard work, enthusiasm and commitment over the past twelve months.Together we are making <strong>Hutt</strong> <strong>City</strong> an even better place to live, work and play.David OgdenMAYOROn behalf of <strong>Council</strong>Report from <strong>Council</strong>
Report onStrategic MeasuresStrategic Measures – Peoplemillion perannum3.0Community facility use2.52.01.5TargetPeerAverage1.019971998 1999 2000 2001 2002 2003 2004 2005 2006<strong>Council</strong> monitors use of its key facilities. The graph shows visitors to libraries, pools and museums. <strong>Council</strong> has a target ofmaintaining visitor numbers to these key facilities steady at about 2.1 million each year, which is significantly higher than thecommunity facility use in other similar cities. The steady target recognises the growing number of competing recreation optionsavailable and the limited ability of <strong>Council</strong> to invest in enhanced facilities. Expectedly, the target was not achieved in 2006 dueto the closure of the Dowse for redevelopment.Strategic Measures – Utility ServicesDefectindex6Road condition54Lower score =better performance32101998 1999 2000 2001 2002 2003 2004 2005PeerAverageLongtermtargetDefects in roading surfaces are measured on the above index. This graph shows the historical condition of the roads in <strong>Hutt</strong> <strong>City</strong>and <strong>Council</strong>’s target. There has been a gradual deterioration since the results achieved in 1998, although average road conditionremains better than that in peer cities. <strong>Council</strong> recently began directing a greater proportion of expenditure towards roadmaintenance and revised the focus of maintenance programmes in order to reverse this unfavourable trend.Report on Strategic Measures
Incidentsper kmWater services – reliabilityLower score =better performanceLongtermtarget1999 2000 2001 2002 2003 2004 2005 2006This graph measures combined incidents per kilometre in the water supply, wastewater and stormwater networks. A favourabletrend can be seen, but results remain slightly worse than peer averages. The main reason for this is the age and condition profileof pipes. <strong>Council</strong>’s asset renewal programme will address this issue. <strong>Council</strong> has a long-term target of reducing incidents below thepeer average, as indicated by the line on this graph.Strategic Measures – EnvironmentResults in relation to environmental measures are included in the Report on the Environment on pages 27 to 36.Report on Strategic Measures10
Strategic Measures – Economy<strong>Annual</strong>movement8%Gross Domestic Product6%4%2%0%1998 1999 2000 2001 2002 2003 2004 2005-2%-4%<strong>Hutt</strong> <strong>City</strong> GDPWellington Region GDPThe performance of the local economy has not been strong and has not compared favourably with New Zealand as a whole.The economy has been in transition since the closure of the motor vehicle assembly industry in the city and the downsizingof other large employers. In response, <strong>Council</strong> adopted an economic development strategy in 2002. The strategy aims to buildthe city’s economy, particularly in the areas of business numbers, jobs, events and tourism. The long-term target is for local grossdomestic product growth to exceed the regional average. A significant improvement in economic performance is apparent since2002. Visitor numbers, job numbers and population are also showing improving trends.Strategic Measures – Organisation$m90Rates (inflation adjusted)140%80120%70Long term target below 100%100%6080%5060%401991199219931994199519961997Actual & forecast rates (LHS)1998This graph shows historical rate levels. It highlights the reductions achieved from 1999 onwards, offset by modest increases inrecent years to cover the cost of wastewater treatment facilities.The graph also measures rates per capita in comparison with our peers (other similar local authorities). Historically <strong>Hutt</strong> <strong>City</strong> rates percapita have been well above peer average. This is partially due to many peer authorities owning major profitable businesses such asports, airports, forestry and electricity companies, that help to keep rates down. <strong>Council</strong>’s long term target is to deliver rate levels lessthan the peer average per capita, and the graph highlights the significant relative improvement that has already been achieved.19992000200120022003200420052006Rates per Capita, % of peer average (RHS)40%Report on Strategic Measures11
$m16014012010080604020Net Debt (inflation adjusted)2010 target below $60m250%200%150%100%50%00%19931994199519961997199819992000200120022003200420052006Actual & forecast rates (LHS)Debt per Capita, % of peer average (RHS)This graph shows historical net debt levels. It highlights the considerable success <strong>Council</strong> has had in reducing debt levels since1993. At that time debt levels in <strong>Hutt</strong> <strong>City</strong> were more than twice the average for similar local authorities.The increase in debt in 2002 was due to the unavoidable requirement to fund the construction of the wastewater treatmentfacilities at Seaview. However, debt levels are below the average of peer local authorities and are forecast to fall further.100%Customer Satisfaction90%Bestpracticetarget80%<strong>Annual</strong>Planmeasure70%60%1995 1996 1997 1998 1999 2000 2001 2002 2003 2004 2005 2006Report on Strategic Measures<strong>Council</strong> monitors customer satisfaction levels with <strong>Council</strong> services annually by way of an independently conducted survey.The graph shows there were significant improvements until 2000 and that satisfaction ratings have maintained a high levelsince then.<strong>Council</strong> budgets to maintain satisfaction levels that are higher than the 84% average achieved by other similar local authorities.<strong>Council</strong> has a long-term target of achieving results regarded as best practice which are above 90%.12
100%Staff Satisfaction90%Bestpracticetarget80%<strong>Annual</strong>Planmeasure70%60%2002 2003 2004 2005 2005 BPTW<strong>Council</strong> has been measuring overall satisfaction levels of staff for the last four years through an independent survey.<strong>Council</strong> budgets to maintain staff satisfaction levels of at least 80% and generally remunerates staff at close to market averagelevels. Nevertheless, <strong>Council</strong> has a long-term target of achieving at least 90% satisfaction, by addressing staff concerns raisedduring the annual survey, where possible through modest cost solutions.The 2005 results show further improvements but are not necessarily directly comparable as two different survey formats wereused. The second 2005 result is based on the John Robertson Associates Best Places to Work Survey (BPTW).Report on Strategic Measures13
Report onGovernanceLocal democracy is about:• conducting business in an open, transparent, and democratically accountable manner• giving effect to identified priorities and desired outcomes in an efficient and effective manner• having regard to the views of all communities within a district• prudent stewardship and the efficient and effective use of its resources in the interests of its district or region• taking into account ––––the social, economic, and cultural well-being of people and communitiesthe need to maintain and enhance the quality of the environmentthe reasonably foreseeable needs of future generations• fair and effective representation for individuals and communities• all qualified persons have a reasonable and equal opportunity to ––––cast an informed vote:nominate 1 or more candidates:accept nomination as a candidate:• public confidence in, and public understanding of, local electoral processes<strong>Hutt</strong> <strong>City</strong> <strong>Council</strong> is made up of the former Eastbourne Borough, Petone Borough, Wainuiomata District and Lower <strong>Hutt</strong> <strong>City</strong><strong>Council</strong>s and the <strong>Hutt</strong> Valley Drainage Board, which were amalgamated in 1989. <strong>Council</strong> has two separate components – thepolitical body (the elected members), and the corporate body, (the administrators). <strong>Council</strong> is governed by a Mayor (Mayor DavidOgden), who is the Chair, and eleven <strong>Council</strong>lors, all of whom are elected by <strong>Hutt</strong> <strong>City</strong> citizens for a three year term of office.To ensure that each part of the city is represented around the <strong>Council</strong> table, it is divided into six separate wards and the voters ineach ward elect two members (in the case of the Western Ward one member) to represent them on <strong>Council</strong>. The Mayor is elected‘at large’ which means that all citizens can vote for the Mayor.Political GovernanceThe concept of governance refers to the manner in which <strong>Council</strong> exercises its role and authority. The concept includes:• leadership and vision• consultation and citizen involvement• strategic policy setting• decision making and• auditing the organisation’s results.Report on GovernanceThe elected <strong>Council</strong> sets the broad strategic direction and policies for the Chief Executive and staff to implement and audits theresults. <strong>Council</strong> ensures, on behalf of the community, that the organisation achieves what it should and that it avoids undesirablesituations and circumstances. The Chief Executive of <strong>Council</strong> is the sole employee of the elected members of <strong>Council</strong>. The ChiefExecutive in turn is the employer of all other <strong>Council</strong> staff members. The Chief Executive is responsible to <strong>Council</strong> for:• implementing the decisions of <strong>Council</strong>• providing advice to <strong>Council</strong>, Community Board and Ward Committee members and• ensuring all functions delegated to the Chief Executive or to any other employees are carried out.14
<strong>Hutt</strong> <strong>City</strong> <strong>Council</strong>’s vision for the city is ‘A Great Place to Live, Work and Play’. To achieve that vision <strong>Council</strong> has a number ofstrategic goals:• a vibrant and diverse city• accessible and high quality leisure activities and facilities• a connected, safe and healthy community• affordable, sustainable, accessible and high quality services• a best practice organisation that provides value for money and prudent management• an organisation that values its customers and staff• a strong, enterprising and diverse economy• a clean, healthy, attractive and sustainable environment.These strategic goals are linked to Community Outcomes the community has identified as being of importance. The LocalGovernment Act 2002, amongst other things, requires territorial authorities to carry out a process to identify the outcomes itscommunity wants for the long term good of the city. Community Outcomes are those outcomes identified by the community asbeing a priority to improve the social, economic, environmental and cultural well-being of <strong>Hutt</strong> <strong>City</strong>.Treaty of WaitangiThe <strong>Council</strong> takes into account the principles of the Treaty of Waitangi and ensures that a sincere partnership is maintainedbetween the mana whenua and elected <strong>Council</strong>. This recognition and relationship has been achieved through the developmentof agreements and a Code of Conduct. <strong>Council</strong> works hard to make sure all parties are kept informed and have the opportunity totake part in <strong>Council</strong>’s affairs. A full statement regarding the Treaty of Waitangi can be found on page 23.Roles and responsibilities<strong>Council</strong> currently provides the following services (although <strong>Council</strong> does not necessarily carry out the services itself):• essential physical services such as water supply, roads, drainage, sewerage and collecting and disposing of rubbish• parks, sports fields, recreational facilities, libraries, museums, community centres and housing• resource management planning and emergency management• essential regulatory duties such as environmental health, building inspection and animal control and• promotion and advocacy of the social and economic well-being of the city’s residents.Report on Governance15
Political StructureThe <strong>Council</strong> has created a number of committees and working groups to undertake preparatory work before matters reach the full<strong>Council</strong>, perform regulatory and monitoring functions, which frees the <strong>Council</strong> to focus on matters relating to strategic direction,policy-making and governance. The responsibilities of the <strong>Council</strong>’s three principal Standing Committees are as follows:Strategy and Policy Committee – the role of this committee is to assist <strong>Council</strong> with its policy development, for example,undertaking consultation and hearing submissions, resulting in fully considered policies going to <strong>Council</strong> for adoption.Operations and Compliance Committee – this committee is responsible for ensuring that <strong>Council</strong>’s statutory and regulatoryresponsibilities are met, that relevant legislation is complied with, and that <strong>Council</strong>’s policies, as they are being implemented,are meeting stated objectives.Finance and Audit Committee – this committee is responsible for reviewing progress towards achievement of all of <strong>Council</strong>’sfinancial objectives, and Statements of Corporate Intent for the <strong>Council</strong>’s Controlled Organisations. The committee is alsoresponsible for approving the audit process and programme for <strong>Council</strong> for each financial year and reviewing financial informationat the completion of the annual examination of <strong>Council</strong>’s finances.The following committees are also Standing Committees of <strong>Council</strong> but meet less frequently than the three principal StandingCommittees:District Plan Committee – this committee hears and decides all matters concerning the District Plan and administration of theDistrict Plan and hears submissions on proposed Changes to the District Plan.Hearings Committee – responsible for determining resource consent applications, and exercise of <strong>Council</strong>’s statutory and regulatoryresponsibilities in the areas of resource management, Sale of Liquor and the Reserves Act.Community Grants Committee – responsible for administering and allocating <strong>Council</strong> funded grants such as the Community Housesand Marae Funding Schemes and the Community Development Fund, and the Creative New Zealand (Creative Communities)Scheme.Community Plan Committee – which is responsible for the development of a framework and timetable for the planning process,appropriate public consultation and statements to the media, the hearing of public submissions on the Community Plan, andmaking recommendations to <strong>Council</strong> on the adoption of <strong>Council</strong>’s <strong>Council</strong> Community Plan.Governance Working Group – which is responsible for assisting <strong>Council</strong> meet its governance obligations.<strong>Council</strong> has two special committees – the <strong>Hutt</strong> Valley Services and Civic Honours Committees. The <strong>Hutt</strong> Valley Services Committeeis a Joint Committee with Upper <strong>Hutt</strong> <strong>City</strong> <strong>Council</strong>. This committee is primarily concerned with the shared services of the two<strong>Council</strong>s, which are the Silverstream landfill and the <strong>Hutt</strong> Valley bulk wastewater network. The Civic Honours Committee meetsonce a year to consider and select the recipients of annual Civic Honours awards.<strong>Hutt</strong> <strong>City</strong> <strong>Council</strong> is a member of Greater Wellington (Wellington Regional <strong>Council</strong>’s) <strong>Hutt</strong> River Floodplain Management Committeeand the Waiwhetu Stream Advisory Committee. The <strong>Hutt</strong> River Floodplain Management Committee is concerned with theimplementation of flood mitigation measures for the <strong>Hutt</strong> River. The Waiwhetu Stream Advisory Committee was established tooversee the development of a management plan for the Waiwhetu Stream.<strong>Hutt</strong> <strong>City</strong> <strong>Council</strong> is also a member of the Wellington Regional Strategy Forum. The purpose of this Forum is to develop a long term(10-20 years) direction for an internationally competitive region. The project will be completed in July 2006.<strong>Hutt</strong> <strong>City</strong> <strong>Council</strong> also has three elected Community Boards – Eastbourne, Petone and Wainuiomata – and four Ward Committees– Central, Eastern, Northern and Western. The role of these local representatives is to support <strong>Council</strong> in its governance role byfacilitating local input into <strong>Council</strong>’s decision-making processes. <strong>Council</strong> also delegates to Community Boards and Ward Committeesa range of functions including providing their local community’s input into strategic planning, resource management and roadsafety issues; maintaining an overview of roadworks, water supply, sewerage, stormwater drainage, waste management and trafficmanagement for its local area; and deciding traffic management issues.Report on Governance<strong>Council</strong>, its principal Standing Committees and the Community Boards and Ward Committees normally meet once every six weeks.All meetings convened by <strong>Council</strong> are publicly advertised each month and are open to the public, except for those parts of themeeting from which the public is excluded in accordance with the requirements of the Local Government Official Information andMeetings Act 1987. Agendas for meetings of <strong>Council</strong>, its Committees, Community Boards and Ward Committees are available tomembers of the public before the meeting either on the <strong>Council</strong>’s website or from <strong>Council</strong>’s offices, libraries and service centres.There are many different ways in which members of the public can voice their opinions to <strong>Council</strong> and its Committees, includingpresentation of petitions, deputations and through the public comment section, which is held for a period of up to 30 minutes atthe beginning of each public meeting.16
Corporate Governance<strong>Hutt</strong> <strong>City</strong> <strong>Council</strong> management is focused on:• being accountable• ensuring good management• being open and consultative• providing value for money and• being customer driven.There are a number of formal corporate management teams operating alongside group and divisional management teams. Thekey teams are the Executive Management Team, the Customer Strategy Team and the Information Management Team. All containrepresentatives from across the organisation and are responsible for the strategy, policy and overall operation of their particularteam focus.All divisions and business units of <strong>Hutt</strong> <strong>City</strong> <strong>Council</strong> set their objectives in line with the Community Plan. The results of customersurveys and feedback are also incorporated in work plans. Divisional managers meet regularly with their staff, either fortnightly ormonthly, to review the performance of their division or business unit. In addition coaching and feedback sessions are conductedwith individual staff members to ascertain performance against objectives set in the performance appraisal process. Divisional andbusiness unit managers meet with their general manager regularly.Managers have within their job descriptions the responsibility for staff development and the setting of learning/training objectives.These are set annually as part of the performance appraisal process and also as part of the individual coaching and review processwhich reacts flexibly to customer and staff requirements.Report on Governance17
Report onStaff Management<strong>Hutt</strong> <strong>City</strong> <strong>Council</strong> values the people who choose to work in the organisation, and aims to be a “high performing organisationregarded as one of the best places to work”.Our position as a top performing organisation is measured on an international scale by our participation in the Baldridge Awards.In 2004, <strong>Council</strong> was recognised with a Bronze Award. Only one local authority has ever received an award above this level.In 2005 <strong>Council</strong> commenced participating in the annual Best Places to Work Survey. The first results show <strong>Council</strong> is not currentlyregarded as one of the best places to work. Therefore, <strong>Council</strong> intends using the feedback received from the survey to implementimprovements and help achieve its aim.Staff Performance ResultsThe staff performance management system is an annual process, one of the outcomes of which is assessment of staff membersagainst the requirements in his/her job description, as reflected in an annual performance agreement.The results of annual performance assessments are used to set staff remuneration in comparison to market median levels. Staff areremunerated between 85% and 110% of the market median salary level for similar positions.A separate team bonus is dependent on achievement of organisation wide goals, and is paid to all staff who are performing at asatisfactory level in their role.Staff InvolvementThe improvement scheme initiated in 2000 encourages staff to become involved in improving work practices, customer interface,safety and satisfaction. 742 improvements were recorded in 2005/2006, well exceeding the target of 700.Staff Health and Safety<strong>Council</strong> is committed to providing a work environment that promotes and supports the wellbeing of all employees. We havebrought together a number of initiatives, benefits and personal development opportunities under a Wellness Programme– aholistic approach to the wellbeing of our staff.A reduction in the number of work place accidents is <strong>report</strong>ed in this year. Only 13 accidents were <strong>report</strong>ed, which is the lowestlevel ever achieved by <strong>Council</strong>.30Accidents25201510Report on Staff Management502001 2002 2003 2004 2005 2006Departmental health and safety audits are conducted internally on a quarterly basis, and an independent audit of Health andSafety throughout the organisation is undertaken annually. All staff are encouraged to observe safe working practices to ensuretheir safety and the safety of others.18
20%Staff Turnover15%10%5%0%2001 2002 2003 2004 2005 2006One of <strong>Council</strong>'s goals is to keep staff turnover below 15%. This goal has been achieved, although turnover has increased in 2005and 2006. This appears to be at least partially due to national shortages of skills in some key areas of <strong>Council</strong> operations.Training and Development<strong>Council</strong> endeavours to ensure that staff are developed and trained to enable them to make the most effective contribution to theorganisation goals, and to assist in fulfilment of individual aspirations thus enhancing job satisfaction and contribution.A recent addition to the training and development programme has been a leadership programme for senior managers, and anamended version espousing the same language and values for team leaders.Equal Employment OpportunitiesEveryone has the right to equal employment opportunities. <strong>Council</strong> is committed to the principle of equal employmentopportunities in recruiting, employing, training and promoting its staff.The principles of the Equal Employment Programme are to:• provide fair and proper treatment for staff• eliminate inequality in employing any person or group of persons• ensure that no preference or discrimination is made on the basis of gender, transgender, marital status, religious or ethicalbelief or its absence, colour, race, ethnicity, nationality, health, disability, age, sexual orientation, pregnancy, political opinion,employee association involvement, employment status, beneficiary status, family status or the identity of a partner or relative,and• require supervisors and managers to be responsible and accountable for the implementation and integration of equalemployment opportunities.The goals of the Equal Employment Programme are to integrate equal employment principles and practices into <strong>Council</strong>’s activitiesand culture and to realise the business benefits to <strong>Council</strong> of valuing and fully utilising its human resources.This year <strong>Council</strong> continued its Equal Employment Programme which:• informs and raises the awareness of all staff on equal employment issues• monitors the working environment to ensure that it is free of all discrimination• ensures that employment related decisions and processes are based on skill and abilities and made on merit• encourages the fullest use of individual talents and skills.Report on Staff Management19
Report onSocial DevelopmentOverviewIn 2003 <strong>Council</strong> developed 10 community outcomes following a significant consultative process with residents. These outcomeshave helped focus <strong>Council</strong>’s activities and efforts on issues of importance to the community. Around half of the communityoutcomes concern social development and the <strong>Council</strong> has worked to be an effective contributor to achieving these outcomes in avariety of ways. This <strong>report</strong> on Social Development highlights some of the key projects and developments in these areas over thelast year.<strong>Council</strong> PrioritiesThe <strong>Council</strong>’s priorities are aligned to the community outcomes. Five outcomes encompass social development issues. These arelisted below, along with some of the key projects the <strong>Council</strong> has been involved in 2005/06. Many other agencies have a significantimpact on social development in the <strong>City</strong> and the <strong>Council</strong> works with these to achieve greater results. The <strong>Hutt</strong> Valley GovernanceGroup was established in 2003 as a result of both the <strong>Council</strong>’s and central government’s desire to develop a ‘whole of government’approach to the provision of services within the <strong>Hutt</strong> Valley. Its membership comprises representatives from <strong>Hutt</strong> <strong>City</strong> <strong>Council</strong>,Upper <strong>Hutt</strong> <strong>City</strong> <strong>Council</strong>, government departments and other government funded agencies that provide services to the <strong>Hutt</strong> Valley.The purpose of the Group is to improve the overall coordination, policies and programmes of its members, to enhance the wellbeingof the <strong>Hutt</strong> Valley. This initiative is expected to assist the achievement of social development outcomes in the future asagencies work more effectively together, aligning resources and efforts to maximise positive individual and community outcomes.Community Outcome - Everyone has affordable access to services that improve healthThe <strong>Council</strong> does not have a direct role in the provision of health services. However, it maintains a close relationship with the <strong>Hutt</strong>Valley District Health Board and is working on several joint initiatives with the DHB, for example, establishment of a joint DisabilityAdvisory Group.Community Outcome – A city that is safe, friendly and welcoming, where peopleexperience a sense of belongingCommunity Development is a Business Unit within the Development Services Group of <strong>Hutt</strong> <strong>City</strong> <strong>Council</strong>. Community Developmentactively works with a range of groups and organisations to foster a more inclusive society as well as promoting the interests of theirvarious members. Examples include support for the <strong>Hutt</strong> Ethnic <strong>Council</strong>, Friends of New Settlers, the <strong>Hutt</strong> Valley Youth WorkersNetwork and <strong>Hutt</strong> <strong>City</strong> <strong>Council</strong>’s own youth council, Youth Infusion.Community Development FundReport on Social DevelopmentThis was the third year of <strong>Council</strong>'s annual contestable funding for community groups with the establishment of the CommunityDevelopment and Small Grants Funding Schemes. The total funding available to the community was $206,000 in recognition ofthe vital and valuable work undertaken by a range of community groups in the <strong>City</strong>. This year funds were allocated as follows;Community Development Fund $145,000, Small Grants Fund $25,000, Regional Grants $33,000 and $3,000 towards administration.The funding schemes are to provide support to those groups that provide services that contribute to the community outcomesidentified in the Long Term <strong>Council</strong> Community Plan.<strong>City</strong> SafetyThis year has seen major initiatives in the Safe <strong>City</strong> field. The CCTV system in the CBD has been reviewed and a <strong>report</strong> has beendone on the levels of crime in suburban shopping centres. A policy is being developed on CCTV management. New patrols werepiloted in Jackson Street Petone targeting the evenings when the most <strong>report</strong>ed incidents occurs. This pilot has led to a newarrangement of targeted Crime Prevention patrols in both Jackson Street and the CBD being initiated based on the crime levels inthese areas.There has been support given to the Tamaiti Whangai project for development of the programme targeting at risk families andyoung people in Naenae. <strong>Council</strong> has concentrated on alcohol issues through co-ordinating the work of a multi-agency LiquorLiaison Group, supporting Controlled Purchase Operations and running door staff training. <strong>Council</strong> has taken a leadership role in anew project targeting patrols by Maori Wardens to the cities licensed premises, called Te Ara Poka Tika (Project Walkthrough). There20
has been projects' targeting the area of Youth Access to Alcohol (YATA). There has also been an emphasis on theft of and from cars,and an ongoing project has been developed targeting personal responsibility, environmental design and ownership issues.Over time all these initiatives will enable a more concentrated focus on safety issues by the <strong>Council</strong>, in conjunction with relevantagencies and community organisations.<strong>Hutt</strong> <strong>Council</strong> of Social ServicesThe <strong>Council</strong> supported the establishment of the <strong>Hutt</strong> <strong>Council</strong> of Social Services (HCOSS) through direct funding and officers’ time.The establishment committee for the HCOSS held several community meetings to obtain support and buy in. The committeedeveloped its constitution and trust members have been appointed. To date over forty local community groups are registered asmembers of the HCOSS. The establishment of the HCOSS for the <strong>City</strong> will assist the coordination of social services, networks betweenorganisations and groups and improved support for the important work undertaken by its members.Bylaw review programmeThe <strong>Council</strong> is required, under the Local Government 2002, to review all its existing Bylaws by July 2008. A primary focus of<strong>Council</strong>’s Bylaws is concerned with the health and safety of the community. During the 2005/06 year the following bylaws havebeen reviewed:• Public Places Bylaw 1997;• Trade Waste Bylaw 1997;• Libraries Bylaw 1997;• Museum Bylaw 1997; and• Swimming Pool Bylaw 1997Community Outcome - Everyone has affordable access to excellent educational servicesAs with health services, the <strong>Council</strong> does not have a direct role in educational service provision. Many community houses, whichare funded by the <strong>Council</strong>, ran a variety of educational programmes over the year, and the Community Development Business Unitorganised over a dozen training courses for community groups. The <strong>Council</strong> also maintains a constructive relationship with Weltec,a significant provider of tertiary education in the <strong>City</strong>.Youth Transition ServiceThe <strong>Hutt</strong> Valley Youth Transition Service was launched by the Minister of Social Development, the Hon. David Benson-Pope, on20 February 2006. The <strong>Hutt</strong> Valley Youth Transition Service is the first Youth Transition Service (YTS) to involve two Territorial LandAuthorities working together for the benefit of young people who are transitioning from school to tertiary education, training oremployment.The Mayors’ Taskforce for Jobs and the Government’s agreed vision for YTS development has been adapted to suit the <strong>Hutt</strong> Valley asfollows:“By 2008 all 15-19 year olds in the <strong>Hutt</strong> Valley will be engaged in work, education, or training, or other options which lead to longtermeconomic independence and wellbeing”.Vibe was selected as the <strong>Hutt</strong> Valley YTS provider in 2005, and they are now contracted to The Ministry of Social Development fora three year period to deliver youth transition services valley-wide. All young people aged 15-19 will be given individual support toaccess available employment, education and training opportunities.Vibe YTS works in partnership with government agencies, local schools, employers, training organisations and community-basedorganisations to build goodwill, collaboration and partnerships to assist our young people to achieve their career aspirations. VibeYTS brokers interventions and employment or training placements for all young people in the <strong>Hutt</strong> Valley.The work of Job Track has been incorporated into the services provided by Vibe YTS, and the Job Track programme has ended. JobTrack was an initiative between <strong>Hutt</strong> <strong>City</strong> <strong>Council</strong> and Work and Income to provide information, support and advice for 16-18 yearold school leavers who had not identified future career paths.A Strategic Steering Group was formed in February 2006 to provide advice and support for Vibe YTS, to ensure that a youthdevelopment approach is followed in meeting the objectives of the YTS Strategic Plan.Report on Social Development21
Community Outcome - Everyone has a quality standard of affordable housingThe <strong>Council</strong> provides housing for the elderly and socially disadvantaged. Occupation rates for these properties remained highduring the year and these homes are keenly sought by those who qualify.Last year <strong>Council</strong> become a member of Healthy Housing Steering Group. This Group was established by the <strong>Hutt</strong> Valley DistrictHealth Board (HVDHB). Members include Housing New Zealand, <strong>Hutt</strong> <strong>City</strong> <strong>Council</strong>, EnergySmart, <strong>Hutt</strong> Mana Charitable Trust andthe Wellington School of Medicine. During its strategic planning the HVDHB identified healthy housing as a priority public healthissue in the <strong>Hutt</strong> Valley. Housing is a key determinant of population health and improving the condition and state of housing willenable improvements to health and well being, and the prevention of hospital admissions.The purpose of the <strong>Hutt</strong> Housing Steering Group is to provide a co-ordinated and collaborative approach to housing projects beingundertaken in the <strong>Hutt</strong>. The Housing Steering Group will:• provide a forum for the various agencies and stakeholders to share information about the initiatives that are being undertakenin the area of housing in the <strong>Hutt</strong> Valley• ensure that there is a co-ordinated approach and that duplication is not taking place or that areas of high need are not missingout on housing initiatives• explore options of collaborative funding and implementation of housing projects in the <strong>Hutt</strong>.In December 2005 the Group decided that further planning was needed to identify some specific projects and issues the Groupcould focus on. Following a strategic planning exercise the Group developed a draft terms of reference that included a number ofnew projects that could be progressed. The Group will be meeting in August 2006 to finalise and ratify the terms of reference.Community Outcome – Affordable access to community facilities that include arts, culturaland recreational optionsThe <strong>Council</strong> provides a significant range of services that contribute to this outcome, including libraries, museums, pools, parks andsportsgrounds. Aside from these core services, a number of other community facilities and events are supported by the <strong>Council</strong>such as community houses, community halls, Youth Forum, and Multi Ethnic Day. Community houses organise and run a variety ofactivities and programmes for their local areas and community halls are used extensively across the <strong>City</strong> by a range of groups andorganisations.In 2001 the Community Development Business Unit commissioned consultants to identify and assess community needs in eightgeographical locations around the city. These have recently been updated and will help inform the work undertaken by theCommunity Development Unit over the next few years.The needs of Pacific and Refugees and Migrants to the city have also been undertaken and will also help inform the work ofCommunity Development.New Settlers CentreThe <strong>Council</strong> in partnership with the Department of Labour and relevant community groups, have been supporting theestablishment of a New Settlers Centre to be centrally located at the Te Awakairangi Community Resource Centre in Laings Road.<strong>Hutt</strong> <strong>City</strong>’s Youth Centre - PhonicReport on Social DevelopmentFinancial support for the <strong>City</strong>’s youth centre from the <strong>Council</strong> has enabled this service to continue to operate. Throughout the yearthe Youth Centre has been involved in many projects including the <strong>Council</strong>’s Expo, Guitar Wars and Star Search in several localschools. Hip hop and Graf Art courses, dance and DJ lessons were also organised at Phonic.22
Report onOur Commitmentto the Treaty of Waitangi<strong>Council</strong> has an obligation to take into account the principles of the Treaty of Waitangi – Te Tiriti O Waitangi – and to recognise andprovide for the special relationship between and with Maori, their culture, traditions, land and taonga.The obligation to consult includes recognising those who have mana whenua, or inherited rights of land ownership. Within <strong>Hutt</strong><strong>City</strong> this consists of the Wellington Tenths Trust, and <strong>Council</strong> also recognises the Te Runanganui o Taranaki Whanui ki te Upoko o teIka a Maui. Both these groups represent Te Atiawa and the Taranaki tribes within the Wellington region.A Memorandum of Agreement has been established which governs the relationship between Te Atiawa and the elected <strong>Council</strong>.Consultation also extends to urban Maori now resident in <strong>Hutt</strong> <strong>City</strong> including Te Taura here o Te Awakairangi and the sevenMarae within <strong>Hutt</strong> <strong>City</strong>.Key Principles• To take into account the principles of the Treaty of Waitangi – Te Tiriti O Waitangi• To use the Memorandum of Agreement to promote consultation effectively with Te Atiawa• To continue with the established contractual arrangements with the Wellington Tenths Trust and Te Runanganui o TaranakiWhanui ki te Upoko o te Ika a Maui and following Marae in the city:–––––Koraunui MaraeTe Mangungu MaraeWainuiomata MaraeTe KaKano o te Aroha MaraeWaiwhetu Marae––Kokiri MaraeTe Tatau o te Po Marae• To pursue <strong>Council</strong>’s statutory obligations under Part II of the Resource Management Act 1991.Goals• To maintain consultation and involvement with Te Atiawa• To consult with Te Taura here o Te Awakairangi• To consult the seven Marae within <strong>Hutt</strong> <strong>City</strong>.Programme• Ongoing promotion of the Memorandum of Agreement• Working to maintain the relationship with the Te Runanganui o Taranaki Whanui ki te Upoko o te Ika a Maui, the WellingtonTenths Trust, Te Taura here o Te Awakairangi and the seven Marae within <strong>Hutt</strong> <strong>City</strong>• Ensuring that all parties are kept informed of <strong>Council</strong>’s developments and given the opportunity to take part in <strong>Council</strong>’s affairs.Report on Our Commitment to the Treaty of Waitangi23
Report onEconomic DevelopmentIntroductionContinued implementation of the Economic Development Strategy (“EDS”) has been a key priority of <strong>Council</strong>, which as one of manyplayers in the economic development of <strong>Hutt</strong> <strong>City</strong> is committed to encouraging a strong, enterprising and diverse economic base.The primary purpose of the EDS is to increase the number of jobs available within <strong>Hutt</strong> <strong>City</strong> over the 5-year time frame 2002–2007.Current SituationReporting the results for the third full year since the EDS was signed off, <strong>Hutt</strong> <strong>City</strong>’s economic performance was better in allmeasures <strong>report</strong>ed for the 2004–2005 year than for the previous year and in most cases greater than those experienced across theWellington Region. We continue to see positive growth in all of the four major measures of performance.• Job numbers increased by 4.6%, with a net increase of 1,787 Full Time Equivalents for the year (2003-2004, 2.2%)• There were 145 new businesses created in 2004-2005 (2003–2004, 289)• GDP/Value Added rose by 4.1% (2003–2004, 2.2%)• The number of residents was estimated to have risen by 200 (2003-2004, 300)These are continued encouraging results. Job numbers in particular are to be noted. The EDS identified a target of 37,716 jobs by2007. As at March 2005, there were 40,357 jobs in <strong>Hutt</strong> <strong>City</strong>.<strong>Council</strong> is continuing to work hard to attract industries and businesses to locate in <strong>Hutt</strong> <strong>City</strong> to ensure a broad-based economy. Anumber of these new businesses and new developments were completed during the past 12 months.Key Priorities<strong>Council</strong>’s key priorities are based on its role in economic development and the areas of focus that the business community has toldit to give attention to. These are:1. Implementation of the Economic Development Strategy2. Retention, growth and attraction of businesses3. Increasing the recognition of <strong>Hutt</strong> <strong>City</strong> as a place to do business4. Continued relationship development and relation management with key partners and other organisations.1. IMPLEMENTATION OF THE ECONOMIC DEVELOPMENT STRATEGY (EDS)The EDS targets a scenario of 0.7% growth per annum – 0.3% to replace those jobs lost each year and 0.4% real growth.Report on Economic DevelopmentTo achieve this, the focus is on four outcomes:• More businesses operating in <strong>Hutt</strong> <strong>City</strong>• Recognition of <strong>Hutt</strong> <strong>City</strong> as a business location and vibrant city• Continued investment in current and new business activities• An available skilled workforce.<strong>Council</strong>'s role is to achieve the EDS outcomes by:a) Taking a primary role in the “more business” and “recognition” outcomes, working in partnership with relevant local, regionaland national organisations. These include Business <strong>Hutt</strong> Valley, Positively Wellington Business, the Foundation for Research,Science and Technology and New Zealand Trade & Enterprise.b) Taking primary role in the “skilled workforce” outcome with the development of TradeStart in conjunction Work & Income.c) Taking an increasing role in the “continued investment” outcome in conjunction with organisations such as Smartlinx 3 Limitedand the Regional Economic Development Agency (Positively Wellington Business).24
2. RETENTION, GROWTH AND ATTRACTION OF BUSINESSESGrowth in jobs can come about from either the development of more businesses or retention of and growth in current businesses.This is a key to the future economic growth of the city. In the 12 months to March 2005, 145 new businesses were created in the city.During the year Westfield completed the long awaited expansion of Queensgate and work is now well underway on the addedcinema complex. Other large developments either completed or commenced during the year include the new Pak’N Save, newHarvey Norman Centre, NZ Van Lines and Mitre 10 Mega.The city Visitor Information Centre continues to benefit from its accreditation to the Visitor Information Network with a rise ininternational visitors through the centre, many of whom were here with the 2005 Lion’s rugby tour. Enhanced services such asaccommodation, travel and activity bookings have helped to attract increasing numbers of visitors to the centre. <strong>Council</strong> continuesto fund events in the city, such as the Petone Fiesta, Touch Nationals, and the Crazyman multisport race. The 18 events supportedby <strong>Council</strong> through the Events Assistance Fund during the 2005/2006 year generated an estimated $6.5 million in economic activity.Working with businesses in the Wingate industrial region, <strong>Council</strong> has continued implementation of a three-year development planfor the area with installation of entry signage and new landscaping work completed and the development of a landscape designguide for the businesses in the area. <strong>Council</strong> continues to work with business steering groups in Seaview/Gracefield and Petone toidentify and work on initiatives in these areas.Significant urban enhancement work is currently being completed in Homedale Village and will shortly be undertaken in Moerashopping centre. A review of the Suburban Shopping Centre Fund policy was completed during the year and is guiding future<strong>Council</strong> investment in suburban shopping centre upgrades.<strong>Council</strong>, along with CBD Plus, has taken a significant role in the development of a long-term strategic framework for future urbanenhancement of the CBD. The first initiative under this framework, the Retail Connector was completed during the year andplanning for further initiatives in the early part of the next financial year is underway.<strong>Council</strong> continued its involvement in Smartlinx 3 Limited along with the <strong>Council</strong>s of Porirua and Upper <strong>Hutt</strong> and individualsand businesses from the three cities. This company was established to develop an open, competitive high band-widthtelecommunications infrastructure. Networks were established in each of the three cities and a number of customers including the3 <strong>Council</strong>s are taking services from providers using the Smartlinx 3 network. An opportunity to rapidly expand the network throughfunding assistance from the Broadband Challenge Fund led to a further capital injection by existing shareholders, conditional onreceiving matched funding from the Broadband Challenge Fund. The results of an application for this funding should be knownearly in the new financial year.3. INCREASING THE RECOGNITION OF HUTT CITY AS A PLACE TO DO BUSINESS<strong>Council</strong>’s business newsletter “Thrive” continues to be well received by <strong>Hutt</strong> <strong>City</strong> businesses. Published quarterly and now into itsseventeenth edition, the newsletter outlines issues of interest to business and highlights businesses in the city.A new business attraction brochure “Creating Business Success – <strong>Hutt</strong> <strong>City</strong>” was launched outlining the benefits of living, playingand operating a business in <strong>Hutt</strong> <strong>City</strong>, The brochure prepared by <strong>Council</strong> is being used by commercial agents for use in attractingnew businesses to the city.<strong>Council</strong>’s Business Communication Programme included mayoral visits to businesses, mayoral breakfasts and presentations bysenior <strong>Council</strong> staff to business groups. Regular updates to the real estate industry were made during the year and it is planned tobroaden the group to other professionals in the next year. <strong>Council</strong> staff continue a regular meeting programme with businesses inthe city.<strong>Council</strong>’s support of the Wellington Region Gold Awards to business continued this year, with <strong>Hutt</strong>-based businesses winning two ofthe nine category awards, including the ACC Thinksafe Workplace Safety Award for the fourth consecutive year. <strong>Council</strong> continued itsbranding campaign to promote <strong>Hutt</strong> <strong>City</strong> with large scale billboards in Wellington promoting the benefits of living and working inthe <strong>Hutt</strong>.4. CONTINUED RELATIONSHIP DEVELOPMENT AND MANAGEMENT<strong>Council</strong> cannot achieve all the outcomes and strategies outlined in the EDS by itself. It needs to build and maintain strongrelationships with businesses and business organisations that can assist in the achievement of the EDS outcomes.Following the creation of the creative manufacturing cluster by Positively Wellington Business (PWB), work is now well underwayin preparing a proposal to develop a Greater Wellington Industry Development Centre in support of this cluster and themanufacturing industries in the region.Report on Economic Development25
Weltec, formally launched its Centre for Smart Product and through its Director of Innovative Manufacturing, is taking a leadingrole in the development of advanced capability in the manufacturing sector in the region.<strong>Council</strong> launched TradeStart a Trades Information Centre in November working alongside Industry Training Organisations,Polytechnics, schools and businesses to increase the number of people getting into apprenticeships and trades training. The Centrehas exceeded all expectations and the one year pilot funded by Work & income has been extended for a further two years. Over 200people have been referred on to ITO’s and training institutes with a large number commencing trades training and apprenticeships.PWB’s immigration attraction programme has successfully assisted a growing number of <strong>Hutt</strong> <strong>City</strong> businesses address skill shortagesover the past year.Business <strong>Hutt</strong> Valley, a joint venture between the <strong>Hutt</strong> Valley Chamber of Commerce and CBD Plus, launched in July 2005 hasresulted in a stronger representation of the business community across the city.During the year <strong>Council</strong> assisted the Jackson Street Program undertake projects identified in its three Year Strategic Plan and againassisted Development Wainuiomata undertake a promotion programme of the visitor attractions in Wainuiomata called “Explorethe Other Side”, and also complete a review of its development plan.Wellington Regional StrategyThis is a joint project of the councils of the Wellington metropolitan region and in association with Positively Wellington Business,working together to build an internationally competitive Wellington region. A large component of the work in this two year projectwill be focused on economic development within the region and how to achieve competitive growth. The project started formallyon 1 July 2004. The first deliverable from the project, a discussion document, was issued during the year outlining the initialthinking on the Growth Framework and seeking feedback. The research to date has identified four focus areas;• Effective leadership and partnerships• Quality regional form and systems• Unlocking economic potential• Internationalisation.The next series of deliverables from this project is expected to be available for consultation in August 2006. For more informationon this go to www.wrs.govt.nzReport on Economic Development26
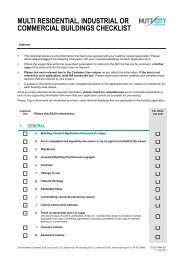
Report on theEnvironment<strong>Hutt</strong> <strong>City</strong> residents place a clean and healthy environment high on the list of outcomes they want to see for the <strong>City</strong>. This is evidentfrom some of the ten Community outcomes identified in the Community Plan, including:• Clean air, water and land• A city that is safe, friendly and welcoming, where people experience a sense of belonging• A diverse natural environment that is accessible, enjoyable and safe• A healthy balance between natural and built environments• A built environment that is attractive and safeThis section outlines some of the projects, programmes and issues that <strong>Council</strong> has been involved in over the 2005/06 year whileworking towards meeting these outcomes.WastewaterConstruction of the 10 million litre wastewater storage tank at Silverstream is progressing well, with all wall panels erected andpreparations underway to start placing the concrete roof. The work is on programme, and operational testing will take placetowards the end of July 2006.The tank will be the largest for this purpose in New Zealand when completed. The project includes a 1,200 litres a second pumpingstation which will be used to fill the tank. The facility will significantly reduce the frequency of wastewater overflows into the <strong>Hutt</strong>River which can occur during periods of high rainfall and local flooding. The dilution, settling and fine screening in the tank willmarkedly improve the quality of the discharge of the few remaining overflows during these extreme events.Other <strong>Council</strong> programmes are underway to reduce wastewater overflows, including the private drains policy being implemented inthe Waiwhetu.BiodiversityThe city boundaries now include three unfenced mainland island projects andone island sanctuary. Volunteer pest trapping has enabled the reintroduction ofNorth Island Brown Kiwi at Rimutaka Forest Park. <strong>Hutt</strong> <strong>City</strong> is fortunate to havenatural occurrences of kaka and NZ falcon. The improving condition of the parksis evident in the use of street edge trees. This past year a falcon took to roostingin one at Waiwhetu and a bellbird nested successfully in another at Easbourne.Recommencing bird monitoring from Stokes Valley to Gracefield would be usefulto gauge whitehead and bellbird presence compared to 1980s data.<strong>Hutt</strong> <strong>City</strong> <strong>Council</strong> Communications Manager Don Carson (left) provided a videocommentary from the Turere Stream release point back into Wainuiomata Marae.Biodiversity PlantingThe stunning biodiversity that quietly exists within the valley was illustratedthis year by a land snail survey at Waiwhetu. Surprisingly, the number of nativespecies that were discovered in distinct communities in an urban park was similarto the number of species found in undisturbed north west Nelson forest (highestrecorded in South Island).Re-vegetation species are selected and eco-sourced to suit a range of sites and environments throughout the city. Emphasis isplaced on choosing pioneer species to facilitate establishment. Plants are used in re-vegetation of slip sites and community revegetationprojects.Report on the Environment27
Coastal RestorationCoastal projects continue to increase in number and popularity. The beachby HW Shortt Rec has been transformed by weed removal and planting withspinifex, pingao and native shrubs and coastal herbs. Weed removal has ledto species such as coastal celery establishing by themselves. The volunteergroup <strong>report</strong>s that the visible improvements to the beach have resulted inseveral walkers starting to pick up rubbish on a regular basis.Days Bay residents helped with experimental erosion control planting,and are keen to continue despite initial setbacks. Friends of Petone Beachstarted work in two project areas, one using only spinifex to build dunesfrom flat sand, and the other replacing marram dune with pingao.Members of Friends of Petone Beach planting pingao.WetlandsWetlands are a rare ecosystem type. Most of the wetlands in the regionhave been lost, with only between 7% - 14% remaining. This year<strong>Council</strong> surveyed a wetland in Parkway. It was found to have highrepresentative value and will be retained in <strong>Council</strong> ownership. It is adiverse ecosystem and has some unusual features, for example, Oleariavirgata which is not common in wetlands in the Wellington region.It features some intact ecotones from dry kamahi forest throughoccasionally flooded kahikatea to carex sedgeland. This naturalwetland will provide inspiration for the ecological zone being plannedfor Hugh Sinclair Park.Pest Plant and Boundary Weed Control ProgrammeMohaka wetland, Parkway.As part of its pest plant and boundary weed programme <strong>Council</strong> has a number of strategies and projects operating.Education:Prevention is better than cure. The publication, “Plant Me Instead” developed with the Department of Conservation, GreaterWellington Regional <strong>Council</strong> and Wellington <strong>City</strong> <strong>Council</strong> has been distributed to <strong>Council</strong> libraries and service centres, local gardencentres, landscape contractors, secondary schools and is soon to go out to primary schools as a resource tool.Volunteer Programmes:Volunteers, through programmes such as Weed busters, undertake weed control on beaches and Key Native Ecosystem sites such asGalbraiths Gully and Haywards Reserve.Monitoring and Early intervention:<strong>Council</strong> monitors potential new threats and shares early intervention control work with Greater Wellington Regional <strong>Council</strong> forspecies such as Bomarea, Mile-a-minute and Madeira Vine.Report on the EnvironmentControl programmes including site led and individual species:Site led work includes beaches and coastal zones, Key Native Ecosystems, and boundary weed control (BWC) along high profilereserves (such as those along main arterial routes, and near playgrounds, sports parks and entrances to suburbs) where there is agood background of native bush bordered by a band of weeds such as gorse blackberry and broom. Clearing the weeds providesan immediate landscape enhancement without the need for extensive re-vegetation planting.28
Pest Animal Control<strong>Council</strong> continued to work with Greater Wellington Regional <strong>Council</strong> on possum control programmes with 50:50 funding of theParkway bush area in Wainuiomata. This complemented the control programme in the new East Harbour Regional Park, theWainuiomata Catchment area and the TB possum control programme in the Wainuiomata Coast Road area.The Possumbuster trap loan scheme continued to operate with some 350 traps out on loan to residents. Volunteer trappers operatein Stokes Valley, Eastern Hills, Jubilee Park and Galbraiths Gully. <strong>Council</strong> has increased the number of rat poison stations on thePetone Foreshore in an attempt to eradicate the rats.Dangerous Pine RemovalThe second stage of the Ferry Road pine removal has been completed. There are approximately 100 trees still remaining in a smallstand to the North of the reserve. These trees will be removed in the third stage scheduled to happen in the 2006/07 financial year.A small stand of large, old and dangerous pines are scheduled to be removed by helicopter from Muritai Road in Eastbourne.<strong>Council</strong> Officers, with the help of Arbourtech Services, have developed a list of all problem pine stands in the <strong>City</strong> maintained bythe <strong>Hutt</strong> <strong>City</strong> <strong>Council</strong>. Cost estimates and priority ratings have been allocated to each stand.Keep <strong>Hutt</strong> <strong>City</strong> Beautiful ActivitiesKeep <strong>Hutt</strong> <strong>City</strong> Beautiful Week 200525 schools and 22 groups, including businesses, community groups and families, participated in the Keep <strong>Hutt</strong> <strong>City</strong> Beautiful CleanUp Week. Over 2000 rubbish bags and 12,000 disposable gloves were distributed.Paint <strong>Hutt</strong> <strong>City</strong> Beautiful1st Waterloo Scouts and Wainuiomata residents led the charge to Paint <strong>Hutt</strong> <strong>City</strong> Beautiful during the 2005 Keep <strong>Hutt</strong> <strong>City</strong> BeautifulWeek. The Scouts painted the garages behind Waterloo shopping centre. They have adopted the area, which faces Waterloo School,to maintain it graffiti-free.The paint out day in Wainuiomata involved over twenty residents from the Westminster Road area turning out to help clean themain walkway. Fifty litres of paint were needed to do the job.The year’s most unique community initiative was led by the Stokes Valley Combined Churches who organised a “Graffiti Free Day” inlieu of their annual Christmas Carols.Arbor DayTo celebrate Arbor Day this year Keep <strong>Hutt</strong> <strong>City</strong> Beautiful decidedto celebrate the contributions made by the two “grandfathers” ofthe Keep <strong>Hutt</strong> <strong>City</strong> Beautiful Executive Committee: Roy Hewsonand Stan Butcher. Roy is a founding member of the committee,and he managed to persuade Stan to join.A northern rata was planted at Avalon Park, honouring Stanand a kowhai planted in Petone’s Garden of Remembrancehonouring Roy.Stan Butcher, Pam Mayston (Forest & Bird Kiwi Conservation Club)and Roy Hewson (left to right), with the northern rata planted tohonour Stan.Report on the Environment29
Graffiti in Our <strong>City</strong>The budget for graffiti removal in the 2005/06 financial year increased to $150,000, of this $20,000 was allocated for anti-graffitieducation (see Art 4 Change below). This year <strong>Council</strong>’s contractor removed 1730 graffiti “hits” totalling 3918.5 m2 of area clearedof graffiti. All tags are photographed. During this time 701 “blanket permissions” to have graffiti removed were given by propertyowners.Graffiti is removed from <strong>Council</strong> owned buildings and properties and other high priority (priority 1) locations including privateresidential and commercial properties, the CBD, CBD service lanes and suburban shopping centres within 24 hours of being<strong>report</strong>ed and permission being granted from property owners, subject to weather. Sites with a large backlog of historical graffitioften require significant resources to remove tagging. These areas, including alleyways and reserve fences, are classified priority 2projects.<strong>Council</strong> is progressively working with retailers towards having a voluntary code restricting of spray paint at point of sale andensuring that cans are less accessible to being stolen. This is due to the fact that aerosol cans contain solvents that are a health riskand can be addictive to users, as well as their use as an implement of graffiti.Art 4 ChangeNaenae SchoolThe Naenae School mural featured in last year’s <strong>Annual</strong> Reportwon the Resene Paints Best School Mural for 2005, announced inNovember.Moera KindergartenA mural project was undertaken with young students from MoeraKindergarten. Students initiated drawings, and they were “finished”off by artist Dan Mills. The kindergarten’s teachers, students, andparents thoroughly enjoyed the project and the end result.Pacific Island Health CentreThe completed mural at Moera Kindergarten.The owner of the building asked <strong>Council</strong> to create some appropriatehealth messages in a mural designed for the Pacific Island Health Centre. The wall was regularly graffitied as it was a light-coloured,plain wall on a prominent Naenae corner site. The painting of the wall attracted some Year 7 students from Naenae Intermediate,who have asked to join the next Art 4 Change programme. One student had previously been involved with the Naenae PrimarySchool mural. Local residents have commented how nice it is to see an attractive mural instead of a plain, graffitied wall.Drains to StreamsEastern <strong>Hutt</strong> Rotary is to fix 200 Drains to Streams plaques adjacent to stormwater drains on selected Eastern <strong>Hutt</strong> streets. Rain andstorms have caused this project to postponed until July 2006. <strong>Council</strong> has noted pollution incidents in the area and attributed themto do-it-yourself householders dumping pains wash water into stormwater drains, and/or allowing car washing detergents to enterdrains that lead to streams.Toxic AlgaeReport on the EnvironmentFollowing the deaths of three dogs as a result of consuming toxic cyanobacterial mats from the <strong>Hutt</strong> River in late November,restrictions were placed on the use of local waterways for recreational purposes. Regular monitoring of local rivers was undertakenby Environmental Health Officers throughout the summer months for the presence of Cyanobacterial mats and tests on waterquality were also conducted by Cawthron Institute Nelson on behalf of Greater Wellington Regional <strong>Council</strong>. Low river flows, warmwater temperatures and strong sunlight resulted in the presence mats in local rivers until late Autumn.30
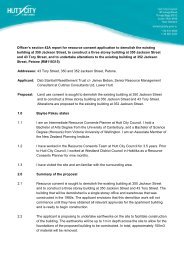
Pollution IncidentsGreater Wellington monitors pollution within <strong>Hutt</strong> <strong>City</strong>. In the 2004/2005 financial year there were 306 pollution incidents within<strong>Hutt</strong> <strong>City</strong> compared to 269 in the previous year. Incidents relating to odour are by far the most common incident type. While theirnumbers increased from 130 in 2003/04 to 149 in 2004/05, as a percentage of total pollution incidents odour decreased from 55%to 43%. The “Other” category includes natural occurrences, dead animals, vehicles and all other incidents.Breakdown of pollution incidentsSolid Waste3%Unconsentedworks4%Smoke & dust4%Other7%Harzadousmaterial3%Odour43%Sewage8%Silt12%Hydrocarbons4%Liquid Waste12%Data supplied by Greater Wellington Regional <strong>Council</strong>Air QualityGreater Wellington monitors air quality in the city at two sites. One is situated in Birch Street near the Waterloo Interchange(referred to as Lower <strong>Hutt</strong>) and the other is in Wainuiomata. The Lower <strong>Hutt</strong> monitoring station collects data on three differentvariables: particulate mater (PM10), carbon monoxide (CO) and nitrogen oxide (NO2). The Wainuiomata monitoring station collectsPM10 data only, and takes readings approximately every third day.Birch Street24 hour average PM10Wainuiomata24 hour average PM10Acceptable30%Acceptable9%Alert6%Excellent18%Good70%The results are shown in terms of the percentage of time that readings fell in certain air quality categories. The categories usedrange from Excellent, Good, Acceptable and Alert to Action. They relate to national standards and guidelines for ambient air quality.The “Alert” category means that the level reached is between 66% and 100% of the maximum acceptable level specified in therelevant national standard or guideline. The results suggest there are air quality issues and potential for adverse human healtheffects in Wainuiomata, particularly during winter months.Good67%Report on the Environment31
Excellent56%24 hour average NO 2Good44%8 hour average COGood3%Excellent97%Results of CO and NO 2 monitoring at Lower <strong>Hutt</strong> show concentrations of both variables to be well within acceptable levels. Bothvariables register higher levels during the winter months. These results are similar to previous years.Water QualityThe Macroinvertebrate Index (MCI) was developed in New Zealand and is widely used to measure water quality. The MCI ismeasured annually as most invertebrates have annual life cycles. The results of the MCI reflect the quality of the water over anumber of months, as invertebrates must survive in the waterway for their entire life cycle. MCI scores are expected to decrease assampling sites move downstream due to differences in stream habitats (ie. Warmer water, less shading).Macroinvertebrate Index (MCI)Score16015014013012011010090807060504030201002002 2003 2004 2005Clean WaterPossible mild polutionProbable moderate polutionProbable severe polutionWOA1 WOA2 ORONGO HUTT1 HUTT2 HUTT3SiteReport on the EnvironmentSampling sites: Two on the Wainuiomata River: WOA1 at Manuka Track and WOA 2 at White Bridge; Orongorongo River near theriver mouth; three on the <strong>Hutt</strong> river: HUTT 1 near Manor Park, HUTT 2 at Melling and HUTT 3 at Boulcott. Data supplied by GreaterWellington Regional <strong>Council</strong>.The quality of water in the Wainuiomata River continues to improve. Samples taken from near White Bridge (WOA2) indicatepossible mild pollution, a steady improvement from probably severe pollution in 2002. This is due to sewage no longer beingdischarged into the river. Samples taken near Manuka Track (WOA1) continue to indicate clean water.Readings on the <strong>Hutt</strong> River at Manor Park (HUTT1) also indicate clean water, an improvement on 2004. Meanwhile, there has beena drop in water quality at the sampling site near the Boulcott Golf Course (HUTT3) from clean water to possible mild pollution.There has also been a drop in readings registered at the Orongorongo River mouth (ORONGO), with samples now indicatingprobable moderate pollution.32
Solid Waste<strong>Council</strong> continued working towards the targets outlined in the <strong>Hutt</strong> Valley Waste Management Plan throughout this financial year.The table shows that there was 131,907 tonnes of waste disposed to <strong>Hutt</strong> <strong>City</strong> <strong>Council</strong> landfills during the 2004/2005 financial year.This is a 13%, 20,000 T decrease in the amount of waste disposed compared to the previous year.This decrease can largely be attributed to the fact that there were no flood events resulting in significant slip clean ups during thisfinancial year.160000Tonnes of Refuse Disposed To Landfill150000140000Tonnes13000012000011000010000097/98 98/99 99/00 00/01 01/02 02/03 03/04 04/05 05/06DateTextiles6%Ferrous Metals7%Glass3%Landfill Waste CompositionNappies and SanitaryRubber 1%1%Non-Ferrous metals1%Rubble andConcrete15%Plastic7%PotentiallyHazardous8%Non gardenOrganic11%Garden Organic12%Paper13%Timber15%Report on the Environment33
Organic WasteThis year approximately 15,830 tonnes of organic garden waste was disposed to landfill. <strong>Council</strong>’s target, as outlined in the 2004<strong>Hutt</strong> Valley Waste Management Plan, is to reduce this amount to 9,000 tonnes by December 2005 and to around 1,000 tonnes by2010 where this is economically viable.Although the December 2005 target has not been met in May this financial year a private business commenced operation ofa Vertical Composting Unit system in <strong>Hutt</strong> <strong>City</strong> and the affect of this will be monitored during the next financial year. <strong>Council</strong>supports this venture as we believe this new business will have a very positive impact on helping us towards achieving our organicgarden waste target.Organic waste currently going into the landfill is contributing to the methane gas produced which is converted to electricity by thegas to electricity power plant at the landfill.RecyclingAll <strong>Hutt</strong> <strong>City</strong> residents have access to recycling services, through the residential kerbside collection and/or the recycling stationsthroughout the <strong>City</strong>. <strong>Hutt</strong> <strong>City</strong> residents recycled more during the past year than in any previous year. A survey conducted in Januaryshowed that 72% of households use the kerbside recycling collection service with 45% of households putting their recycling bin outin any one week.Recyclables Collected <strong>Annual</strong>ly from the kerbside and Recycling Stations700060005000Tonnes4000300020001000097/98 98/99 99/00 00/01 01/02 02/03 03/04 04/05 05/06DateFA total of 6,066 tonnes of recyclables were collected from kerbside and recycling stations this year. This is an increase of 20% onthe previous year. The volume of recyclables collected at kerbside and recycling centres has steady increased since 1998; see tableabove. Recycling helps reduce the demand for new materials and diverts materials from being deposited in a landfill.Launch of WasteSmart – the smart way to shopAfter three years of hard work by Earthlink and <strong>Council</strong>, Earthlink’sWasteSmart recycling shop was officially opened on 8th April this year.Report on the EnvironmentInside the WasteSmart shopThe opening was a family affair with free sausage sizzle and bouncycastle rides, plus lots of bargains and give aways. More than 700people attended the opening day.At WasteSmart you will find preloved treasures that have been restoredand repaired by skilled Earthlink staff. You can drop items off forWasteSmart at the Silverstream Landfill recycling area or you cancontact Earthlink to arrange a collection.If you are looking to find a few treasures for yourself you can visitWasteSmart at 24 Goodshed Road Upper <strong>Hutt</strong>. WasteSmart – Smart forthe Environment and Smart for your Budget.34
Hazardous Waste CollectionThe Household Hazardous Waste Collection was provided again this year on 28th August 2004. 407 <strong>Hutt</strong> <strong>City</strong> Households tookadvantage of this free service, a 10% increase in attendance rate compared to last year. Wastes such as pesticides, herbicides, poolchemicals, cleaning chemicals, paint, oil, and batteries were collected. This represented a total of 6,000 kg of hazardous waste a26% increase on the total amount of waste collected last year.Vehicles queuing at the Hazardous Waste CollectionWaste Minimisation School TourDuring the months of March to May this year a school waste minimisation tour trial was undertaken. The need for the programmewas largely driven by teachers who were having difficulty arranging educational visits to the landfill and recycling facilities.The tour starts by visiting AllBrite recycling facility, then we make our way to Silverstream Landfill and complete the tour at theEarthlink ‘WasteSmart’ recycling facility.Activities throughout the day reinforce the concept of ‘reducing waste’ the concept at the top of the waste minimisation hierarchy‘reduce, reuse, recycle, recover and residual management’. The best option is always not to create the waste in the first place.Feedback was extremely positive and we plan to continue making this tour available to schools during the 06/07 year.EnviroschoolsCurrently five schools are undertaking the Enviroschools programme with help from <strong>Council</strong>. Wa Ora Montessori, Naenae Primary,Raphael House Rudolph Steiner and Wainuiomata Intermediate Schools have been taking part in the programme for a year and ahalf and Randwick School has recently joined.The Enviroschools Programme is a whole school approach to environmental education and facilitates staff and students to create asustainable school.Enviroschool AwardsAll four facilitated schools undertaking the Enviroschools programme over the last year achieved a Bronze Award. This is a wonderfulresult and indicative of all the hard work they have put in over the last year. Muratai School also earned a Bronze Award.Enviroschools EventSharing of ideas and improvements between schools is a critical part of the Enviroschools programme and this was achieved in2005 by a bus tour around the various schools in <strong>Hutt</strong> <strong>City</strong> involved with the <strong>Council</strong> facilitated programme. Teachers from schoolsconsidering joining the programme also attended. The day was found to be extremely enjoyable and informative by all studentsand teachers.Report on the Environment35
Business Environmental Management ProgrammesDuring the last 12 months <strong>Council</strong> has introduced two new Environmental Management programmes for business.The first ‘EnviroSmart’ is a national programme which builds on the BusinessCare programme <strong>Council</strong> has run over the last fewyears. The EnviroSmart programme focuses on improving the environmental performance of businesses nationwide. The Ministryfor the Environment together with twenty-two other council in nine regions are sponsoring EnviroSmart.Six <strong>Hutt</strong> <strong>City</strong> businesses have joined the two year programme this year and it is hoped that 10 more businesses will be includedover the next two years.The second programme which has recently been introduced to the Wellington Region is the Sustainable Business Network (SBN)Awards. Businesses joining the awards will assess their sustainability with the help of the SBN facilitator and will receive a full<strong>report</strong> with recommendations on how they can improve. <strong>Council</strong> sponsorship has helped promote the Awards in our area with thegoal of at least 7 businesses in <strong>Hutt</strong> <strong>City</strong> taking part.EnergyWise <strong>Council</strong>In March this year <strong>Council</strong> became the 25th Local Authority to become and Energy Wise <strong>Council</strong>, in partnership with the EnergyEfficiency and Conservation Authority (EECA). As an EnergyWise <strong>Council</strong> we have agreed to establish a corporate policy on energyefficiency, which will include targets for improved energy efficiency.As outlined by EECA CEO Heather Staley there are significant cost savings to be made by using energy more efficiently and a 10%savings on <strong>Council</strong>’s current energy spend of $2.5million is $250,000.From left CEO Rik Hart, Mayor David Ogden and EECA CEO Heather Staley signing theEnergyWise MOU.Since the signing of the MOU significant work has been undertaken to determine and track <strong>Council</strong>’s energy use. Further work willcontinue into the new financial year identifying areas were <strong>Council</strong> can improve.Report on the Environment36
Report onFinancial Policies<strong>Council</strong>’s Community Plan contains financial and other policies required by the Local Government Act 2002. While not arequirement of the legislation, <strong>Council</strong> considers it important to <strong>report</strong> its performance against the financial policies contained inthe Community Plan.Development and Financial Contributions Policy ReportBackgroundThe Development and Financial Contributions Policy describes what financial contributions <strong>Council</strong> will require from developerswhen their property developments impose increased demand on <strong>Council</strong> services. <strong>Council</strong> has previously chosen to rely on thefinancial contributions specified in chapter 12 of the District Plan. <strong>Council</strong> has adopted a new policy with effect from 1 July 2006that will impose development contributions from that date.Summary of financial contributions<strong>Council</strong> received $0.667 million in reserve contributions from developers during the year.Liability Management Policy ReportBackgroundThe Liability Management Policy states <strong>Council</strong>’s policies in relation to interest rate exposure, liquidity, credit exposure, debtrepayment, specific borrowing limits and the giving of security.Overall Performance<strong>Council</strong> monitors compliance with the liability management policy on a monthly basis. There was 100% compliance with Policylimits during 2005/2006.Full details of the <strong>Council</strong>’s debt, its maturity dates and interest costs are disclosed in note 11 of the Financial Statements. Furtherinformation in relation to interest rate risk and fair values of the <strong>Council</strong>’s debt are disclosed in note 17 of the Financial Statements.Borrowing LimitsThe table below shows the limits on borrowing contained in the <strong>Council</strong>’s Liability Management Policy and the actual position at30 June 2006.RatioActual30 June 2006PolicyLimitNet debt to equity 10%
Investment Policy ReportBackgroundThe Investment Policy states <strong>Council</strong>’s objectives in relation to financial and equity investments, and policies in relation toinvestment mix, acquisition, risk assessment, management, and <strong>report</strong>ing.Overall Performance<strong>Council</strong> is a net borrower, and as such has minimised the amount of investments held to those necessary to meet specific businessobjectives. No breaches of the Investment Policy were <strong>report</strong>ed during the 2005/2006 financial year.Investment LimitsThe Investment Policy does not contain specific financial limits against investment classes, but does refer to the followingcounterparty credit limits.CounterpartyMinimum creditratingActual30 June 2006PolicyLimitNZ Government A- $0.1 million unlimitedState Owned Enterprises A- Nil $5.0 millionNZ Registered Banks:WestpacTrust A- $9.7 million $15.0 millionANZ National A- $8.9 million $15.0 millionBank of New Zealand A- $7.4 million $15.0 millionCorporate Bonds A- Nil $2.0 millionLocal Authority Bond Trust Nil $2.0 millionLocal Government Finance Corporation Nil $2.0 millionLocal Government Stock - rated A- Nil $2.0 millionLocal Government Stock - unrated Nil $0.5 millionCredit risk on interest rate risk management instruments is estimated by the following formula:Credit risk = notional value x years to maturity x 4.0%Revenue and Financing Policy ReportBackgroundThe Revenue and Financing Policy contains <strong>Council</strong>’s policies in respect of funding operating and capital expenditure from availablesources. It is an important policy as it determines who pays for <strong>Council</strong>’s activities.Summary of cost allocationsThe summary on the following page shows each <strong>Council</strong> activity and the proportion of costs that <strong>Council</strong>’s Revenue and FinancingPolicy determines should be funded by various private and public funding sources. Private funding sources are generally user pays,whereas public funding comes from general rates.Report on Financial PoliciesThe summary compares these policy funding proportions against actual funding sources for 2005/2006, with explanations forvariances over 5%.38
Revenue and Financing Policy: Summary of Cost AllocationsREVENUE AND FINANCING POLICY INDICATIVE ALLOCATION OF COSTS ACTUAL 2005/2006PRIVATE FUNDING %PRIVATE FUNDING % PUBLIC FUNDING %Fees &ACTIVITYChargesOperatingSubsidiesOtherRevenueTargetedRatesPrivateTotalResidential& OtherBusiness Utilities Rural PublicTotalPrivateTotalVariancefrom Target1. Libraries 4 – 2 – 6 74 15 4 1 94 7 12. Museums * 5 – 15 – 20 51 25 3 1 80 11 (9) *3. Aquatics and Recreation 30 – 5 – 35 51 10 3 1 65 33 (2)4. Parks and Reserves 10 – – – 10 71 15 4 – 90 9 (1)5. Community Support * – – – – – 78 16 5 1 100 11 11 *6. Community Property * 55 – – – 55 35 7 2 1 45 47 (8) *7. Roading and Traffic 14 12 – – 26 18 43 13 – 74 30 48. Water Supply * 17 – – 73 90 8 2 – – 10 96 6 *9. Wastewater 4 13 – 78 95 4 1 – – 5 98 310. Stormwater * – – – – – 57 39 4 – 100 (9) (9) *11. Solid Waste * 124 – – – 124 (19) (4) (1) – (24) 167 43 *12. Environmental Management 53 – – – 53 7 40 – – 47 54 113. Emergency Management – – 7 – 7 73 15 4 1 93 3 (4)14. Local Urban Design – – – – – 9 90 1 – 100 – –15. Economic Development * – – – – – – 89 11 – 100 17 17 *16. Elected Members – – – – – 78 16 5 1 100 3 317. Advice and Support – – – – – 78 16 5 1 100 – –* Refer to explanations on the following page.Report on Financial Policies39
* Explanations of significant variances in private funding percentages:MuseumsThe private funding target was not achieved as the Dowse hasbeen closed for redevelopment.Community SupportThe private funding target was exceeded by 11% as a result ofobtaining external funding for several programmes.Community PropertyThe private funding target was not achieved. A rental reviewhas since been implemented that will increase private fundinglevels to policy requirements.Water SupplyThe private funding target was exceeded by 6% as a result of areduction in operating costs.StormwaterThe private funding target was not achieved as a result of areduction in the accrued central government subsidies expectedto partially cover storm related costs in 2004.Solid WasteThe private funding target was exceeded by 36% as a resultof increased volumes to landfills and increased pricing tomaintain regional relativity.Economic DevelopmentThe private funding target was exceeded by 17% as a resultof external funding being obtained to support events, andincorporating the revenue and expenditure of the VisitorInformation Centre in this activity.Funding Impact Statement ReportBackgroundThe Funding Impact Statement describes the funding mechanisms the <strong>Council</strong> intends using each year to achieve the fundingproportions indicated by the Revenue and Financing Policy. Among other things, this Statement explains in detail how rates are tobe calculated.Specific TargetsThe following pie graphs show the proportion of funding forecast from each mechanism in the Funding Impact Statement and theactual funding received in 2005/2006.2005/2006 Funding Impact Statement ForecastInterest & dividends0%Fees & charges24%Generalrates46%Report on Financial PoliciesOperatingsubsidies4%Other4%Targetedrates22%40
2005/2006 Actual FundingInterest & dividends0%Fees & charges23%Generalrates46%Targetedrates22%Operatingsubsidies6%Other3%Rates Remission and Postponement Policies ReportBackground<strong>Council</strong> has adopted policies in relation to the remission and postponement of rates. There are a number of circumstancesin which applications are considered. Circumstances include where the ratepayer is a sporting or community organisation, achurch, a school, a kindergarten or play centre, or a hospital, provided the property is used for the benefit of the communityand not for profit. Remissions are also granted on privately owned land protected for conservation purposes, or to businessesfor economic development reasons i.e. to encourage new businesses, increase the investment of existing businesses and topromote employment.Summary of remissions and postponementsRates RemissionsActual30 June 2006$000Actual30 June 2005$000Economic development remisions 358 –School remissions 150 164Church remissions 27 26Hospital remissions 15 15Kindergarten/playcentre remissions 18 7Sports body remissions 2 3Flooding remissions 3 25Penalty remissions 22 13Other remissions 8 11Total remissions including GST 603 264Report on Financial Policies41
Financial ReportingReport on Financial Policies42
Financial StatementsFinancial StatementsPage• Report of the Auditor-General 44• Significant activity summary 47• Five-year financial summary 90• Statement of financial performance 91• Statement of movements in equity 91• Statement of financial position 92• Statement of cash flows 93• Statement of accounting policies 94• Notes to financial statements 100• Financial summary of major capital and operating projects 114• <strong>Council</strong>-Controlled Organisations 117Financial Statements43
Report of theAuditor-GeneralAUDIT REPORTTO THE READERS OF hutt city council andGROUP’SANNUAL REPORTFOR THE YEAR ENDED 30 June 2006The Auditor-General is the auditor of <strong>Hutt</strong> <strong>City</strong> <strong>Council</strong> (the <strong>City</strong> <strong>Council</strong>) and group. The Auditor-General hasappointed me, Laurie Desborough, using the staff and resources of Audit New Zealand, to carry out the auditon his behalf. The audit covers the <strong>City</strong> <strong>Council</strong>’s compliance with the requirements of Schedule 10 of the LocalGovernment Act 2002 that apply to the annual <strong>report</strong> of the <strong>City</strong> <strong>Council</strong> and group for the year ended 30 June2006, including the financial statements.Qualified opinion – our work was limited because land and buildings andinfrastructural asset classes were not revalued to fair value at 30 June 2006As stated in the accounting policies, the <strong>City</strong> <strong>Council</strong> and group recognises its land and buildings and certaininfrastructural asset classes at fair value. Financial Reporting Standard No. 3 Property, Plant and Equipmentrequires entities that recognise classes of property, plant and equipment at fair value to carry out revaluationswith sufficient regularity to ensure that revalued property, plant and equipment is not included at a value thatis materiality different to fair value.There are reliable indicators based on Quotable Value Limited, Statistics New Zealand and Land TransportNew Zealand indices that there is likely to have been a material increase in the value of land and buildingsand infrastructural asset classes. However, the <strong>City</strong> <strong>Council</strong> and group has not carried out a revaluation andwe are unable to determine the amount of the adjustment required.In our opinion:• except for the effect of the departure from Financial Reporting Standard No. 3 as outlined above,the financial statements of the <strong>City</strong> <strong>Council</strong> and group on pages 47 to 121:–comply with generally accepted accounting practice in New Zealand; andReport of the Auditor-General–In our opinion:fairly reflect the <strong>City</strong> <strong>Council</strong> and group’s financial position as at 30 June 2006.• the financial statements of the <strong>City</strong> <strong>Council</strong> and group on pages 47 to 121:–fairly reflect the <strong>City</strong> <strong>Council</strong> and group’s results of operations and cash flows for the year ended30 June 2006.44
• The service provision information of the <strong>City</strong> <strong>Council</strong> and group on pages 47 to 89 fairly reflects the levelsof service provision as measured against the intended levels of service provision adopted, as well as thereasons for any significant variances, for the year ended on that date; and• The <strong>City</strong> <strong>Council</strong> has complied with the other requirements of Schedule 10 of the Local Government Act2002 that apply to the annual <strong>report</strong> (the “other requirements”).The audit was completed on 8 August 2006, and is the date at which our opinion is expressed.The basis of our opinion is explained below. In addition, we outline the responsibilities of the <strong>City</strong> <strong>Council</strong> andthe Auditor, and explain our independence.Basis of opinionWe carried out the audit in accordance with the Auditor-General’s Auditing Standards, which incorporate theNew Zealand Auditing Standards. However, the scope of our work was limited because land and buildings andinfrastructural asset classes were not revalued.We planned and performed the audit to obtain all the information and explanations we considered necessaryin order to obtain reasonable assurance that the financial statements and the other requirements did not havematerial misstatements, whether caused by fraud or error.Material misstatements are differences or omissions of amounts and disclosures that would affect a reader’soverall understanding of the financial statements and the other requirements. We are unable to determinewhether there are material misstatements in relation to land and buildings and infrastructural asset classes thatwere not revalued because the scope of our work was limited, as we referred to in our opinion.The audit involved performing procedures to test the information presented in the financial statements and theother requirements. We assessed the results of those procedures in forming our opinion.Audit procedures generally include:• determining whether significant financial and management controls are working and can be relied on toproduce complete and accurate data;• verifying samples of transactions and account balances;• performing analyses to identify anomalies in the <strong>report</strong>ed data;• reviewing significant estimates and judgements made by the <strong>Council</strong>;• confirming year-end balances;• determining whether accounting policies are appropriate and consistently applied; and• determining whether all required disclosures are adequate.We did not examine every transaction, nor do we guarantee complete accuracy of the financial statements andthe other requirements.We evaluated the overall adequacy of the presentation of information in the financial statements and the otherrequirements. We did not obtain all the information and explanations we required because land and buildingsand infrastructural asset classes were not revalued, as explained above.Responsibilities of the <strong>Council</strong> and the AuditorThe <strong>Council</strong> is responsible for preparing financial statements in accordance with generally accepted accountingpractice in New Zealand. Those financial statements must fairly reflect the financial position of the <strong>City</strong> <strong>Council</strong>and group as at 30 June 2006. They must also fairly reflect the results of operations and cash flows for the yearended on that date. The <strong>Council</strong> is also responsible for preparing the information in the other requirements,including service provision information that must reflect the <strong>Council</strong>’s level of service provision. The <strong>Council</strong>’sresponsibilities arise from Section 98 and Schedule 10 of the Local Government Act 2002.Report of the Auditor-General45
We are responsible for expressing an independent opinion on the financial statements and the otherrequirements and <strong>report</strong>ing that opinion to you. This responsibility arises from section 15 of the Public AuditAct 2001 and section 99 of the Local Government Act 2002.IndependenceWhen carrying out the audit we followed the independence requirements of the Auditor-General, whichincorporate the independence requirements of the Institute of Chartered Accountants of New Zealand.Other than the audit and in conducting the audit of the Long Term <strong>Council</strong> Community Plan, we have norelationship with or interests in the <strong>City</strong> <strong>Council</strong> or any of its subsidiaries.L H DesboroughAudit New ZealandOn behalf of the Auditor-GeneralWellington, New ZealandReport of the Auditor-General46
Significant Activity SummaryActual30 June 2006$000Net (Deficit)/Surplus Before Tax<strong>Annual</strong> Plan30 June 2006$000Actual30 June 2005$000Rate RequirementPer ResidentActual30 June 2006$Achievement vsPerformanceMeasuresActual30 June 2006Libraries (5,547) (5,833) (5,645) 55.5 444Museums 261 1,505 (1,801) (2.6) 4Aquatics and Recreation (3,264) (3,299) (3,088) 32.6 44Parks and Reserves (8,215) (8,043) (8,166) 82.2 44Community Support (1,988) (2,029) (1,848) 19.9 44Community Property (1,903) (1,536) (1,860) 19.0 444Roading and Traffic (10,049) (10,461) (10,771) 137.9 44Water Supply (9,782) (10,531) (10,348) 97.3 444Wastewater (12,144) (12,312) (12,391) 121.4 44Stormwater (5,279) (4,800) (5,360) 52.8 4Solid Waste 3,565 3,229 3,012 (35.7) 4Environmental Management (2,650) (2,672) (2,304) 26.5 44Emergency Management (602) (564) (504) 6.0 444Local Urban Design (360) (477) (197) 3.6 444Economic Development (2,262) (2,410) (2,345) 22.6 44Elected Members (1,596) (1,622) (1,432) 16.0 444Advice and Support (3,239) (3,239) (3,226) 32.4 444Managing Services 2,548 – 1,097 (25.5) 444The net (deficit)/surplus before taxshows the net cost of the <strong>Council</strong>’sactivities for the year in comparisonto the 2005/2006 Community Planand the previous year.The rate requirement per resident shows theaverage cost to each individual in the city for thelisted <strong>Council</strong> activities. A negative value in thiscolumn indicates that the activity produced a netfinancial benefit to each individual.Key for Performance Measures444 All performance measures have been achieved44 Most performance measures have been achieved4 Some performance measures have been achieved8 No performance measures have been achievedSignificant Activity Summary47
GroupPeopleMountain-biking <strong>Hutt</strong> <strong>City</strong>’s hills, rainy afternoons spent in the local library, coffee at the Dowse, Sundays with the kids at theSettlers’ Museum, sport on a Saturday morning, summer picnics at Percy’s Reserve – these are the activities that help make <strong>Hutt</strong><strong>City</strong> a great place to live, work and play. Our city is about our people and <strong>Hutt</strong> <strong>City</strong> <strong>Council</strong> is proud to be delivering services in thefollowing areas.Significant Activity1. Libraries 492. Museums 513. Aquatics and Recreation Programmes 544. Parks and Reserves 565. Community Support 586. Community Property 60Group – People48
1. LibrariesWhat we do<strong>Council</strong> provides, maintains and manages a central and seven libraries in <strong>Hutt</strong> <strong>City</strong>. These are run as a single citywide service. Theirprimary role is to provide written and recorded media, such as books, videos, DVDs and access to electronic information. Thismaterial is used for many purposes including entertainment, learning and research.Why we do it<strong>Council</strong>’s provision of services and facilities in the form of libraries means that all `citizens have access to information, knowledge,and learning opportunities. The services and facilities are a collective resource that is greater than any individual or family couldafford or accommodate. This supports community education, literacy and recreation.How we contribute to <strong>Hutt</strong> <strong>City</strong> <strong>Council</strong> strategic goals and city-wide community outcomes• Advocate for and facilitating public access to information, knowledge and information technology• Provide equality of access and opportunity to information services throughout the city• Provide exemplary service, at all times, that is recognised by the community• Maximise opportunities to innovatively deliver informationHow we Check ProgressPerformance measures Level of achievement Source of InformationAchieve the benchmark of 1,560,000library visits or virtual visits;Achieve the benchmark of 1,778,000transactions (issues and enquiries):Achieve the following net direct costof $3.18 (draft) per transaction:Achieve the following net direct costof $2.82 (draft) per transaction:Note: Amended direct cost measure$3.18Programmes to maintain and improvecurrent services are completed on time,to the required standard and withinoverall budget.That the percentage of residents whouse the library service during the year isabove peer <strong>Council</strong> average.That the percentage of residents whoare satisfied with the library service isabove peer <strong>Council</strong> average.2006: Achieved 2,010,8692005: Achieved 1,980,6802006: Achieved 1,898,5572005: Achieved 1,850,6162006: Achieved $2.922005: Achieved $3.052006: Achieved2005: Achieved2006: 81%Peer <strong>Council</strong> average not available2005: 86%Peer <strong>Council</strong> average not available2006: Achieved 98%Peer <strong>Council</strong> average 97%2005: Not achieved 98%Peer <strong>Council</strong> average 98%Monthly Management ReportsMonthly Management ReportsOperational expenditure against issuesMonthly Management ReportsNRB Communitrak SurveyNRB Communitrak SurveyGroup – People49
LIBRARIES – NET COST OF SERVICEFor the year ended 30 June 2006Actual30 June 2006$000Plan30 June 2006$000Actual30 June 2005$000OPERATING REVENUEUser charges 418 386 391Other revenue (4) 8 5Total operating revenue 414 394 396OPERATING EXPENDITUREEmployee costs 2,544 2,539 2,370Support costs 1,990 1,990 1,960Operating costs 576 596 608Interest expense 44 44 42Depreciation 807 1,058 1,061Total operating expenditure 5,961 6,227 6,041NET DEFICIT BEFORE TAX (5,547) (5,833) (5,645)CAPITAL EXPENDITURE 690 729 1,720SIGNIFICANT ASSET ACQUISITIONS OR REPLACEMENTS AND VARIATIONS FROM THE LTCCPActual30 June 2006$000Plan30 June 2006$000Actual30 June 2005$000Central Library upgrade – – 791The Central Library was upgraded because it did not meet curent building standards, or provide for the needs of a modern libraryservice. The project was completed in the 2005 financial year and had a total cost of $4.131 million.There were no significant variations between the LTCCP’s projections of capital expenditure and the actual expenditure duringthe year.Group – People50
2. MuseumsWhat we doThe <strong>Council</strong> operates two museums. The Dowse Art Museum - collects and displays fine art as well as decorative and applied arts,and celebrates a wide range of creative activities from music to design and film. The Petone Settlers - Museum specialises in thesocial history of the lower <strong>Hutt</strong> Valley and Petone. These institutions are open to the public at no charge, other than for specialexhibitions.Why we do it<strong>Council</strong>’s provision of museums means that people have access to arts and cultural facilities that enrich, inspire and offer a rangeof life-long learning opportunities. The museums act as a focal point for the community, and enhance cultural life, diversity, andpromote public pride and community values.How we contribute to <strong>Hutt</strong> <strong>City</strong> <strong>Council</strong> strategic goals and city-wide community outcomes• Provide facilities and programmes that meet the expectations of user groups and customers• Be recognised by the community for providing exemplary service at all times• Maintain the museums as safe, friendly and stimulating public space for all citizens and visitors to the <strong>City</strong>How we check progressPerformance Measures Level of Achievement Source of InformationAt least 80% of <strong>Hutt</strong> <strong>City</strong> residents aresatisfied with museum services, 70% ofvisitors rate the museum experience asvery good or betterProgrammes to maintain and improvecurrent services are completed on time,to the required standard and withinoverall budget.2006: Achieved – 91% of all residentssatisfied with the DowseVisitor satisfaction not availableas Dowse only open from July 05– September 05Achieved – 95% of all residents satisfiedwith the Petone Settlers MuseumAchieved 90% of all visitors rated theexperience as good or better with thePetone Settlers MuseumSettlers <strong>Annual</strong> survey 97.9% ratedexperience good or better2005: Achieved 95% satisfiedPeer <strong>Council</strong> Average: 93%Not Achieved 65% visitors rate very goodor better2006: Achieved for both the Dowseand Petone Settlers Museum. Somemaintenance projects not completedthis year as they are part of theDowse redevelopment scheduled tobe completed in October 2007. Eg.Security System & Grease Trap, SeismicStrengtheningMonthly Management ReportsNRB Communitrak SurveySettlers Museum <strong>Annual</strong> SurveyMonthly Management Reports2005: Achieved - Except security system& grease trap upgrade which will becompleted in 2005/06 as part of Dowseredevelopment.Group – People51
Performance Measures Level of Achievement Source of InformationDowse – 20,000 (due to the prolongedclosure for upgrading) visitors July 2005to September 2005Dowse – 90,000 visitors per yearNet direct cost per visitorSettlers – 23,000 visitors per yearSettlers – 23,000 visitors per yearNet direct cost per visitor $17.872006: Not Achieved - Dowse onlyreached 10,984 visitors before closurein Sept 05. This was due to the Dowsefinal exhibition opening later thananticipated. Delays were unavoidable.2005: Not Achieved 76,388. The need tofocus staff energy & gallery space on theDowse extension fundraising activitiesresulted in a lower profile programmethan anticipated with lower visitornumbers.2006: Not applicable due to prolongedclosure Sept 05 – Jan 072005: Not achieved $18.18. As a result oflower than expected visitor numbers.2006: Not Achieved - but an increaseon previous year to 19,237. Partlycaused by a drop in the number ofgroup visits.2005: Not achieved 18,799. A newapproach to programmes andpromotions was launched in December2004 which has resulted in visitornumber increases exceeding the targetfor the final 2 quarters of the 2004financial year.2006: Not achieved - $23.56 –asresult of lower than expected visitornumbers.2005: Not achieved $21.96As a result of lower than expected visitornumbers.Monthly Management ReportsMonthly Management ReportsThe percentage of residents who aresatisfied with the Dowse and Settlers’Museums is above peer <strong>Council</strong> average.2006: Not Achieved – Dowse 91%Peer <strong>Council</strong> average 93%Achieved – Petone Settlers Museum 95%Peer <strong>Council</strong> average at 93%.2005: Achieved 95.5%Peer <strong>Council</strong> average 93%Monthly Management ReportsNRB Communitrak SurveyGroup – People52
MUSEUMS – NET COST OF SERVICEFor the year ended 30 June 2006Actual30 June 2006$000Plan30 June 2006$000Actual30 June 2005$000OPERATING REVENUEUser charges 11 118 116Capital subsidies 1,970 3,250 –Other revenue 203 203 233Total operating revenue 2,184 3,571 349OPERATING EXPENDITUREEmployee costs 687 804 823Support costs 471 464 451Operating costs 569 603 684Interest expense 67 67 64Depreciation 129 128 128Total operating expenditure 1,923 2,066 2,150NET DEFICIT BEFORE TAX 261 1,505 (1,801)CAPITAL EXPENDITURE 2,857 4,195 155SIGNIFICANT ASSET ACQUISITIONS OR REPLACEMENTS AND VARIATIONS FROM THE LTCCPActual30 June 2006$000Plan30 June 2006$000Actual30 June 2005$000Dowse upgrade (external subsidies total 67% of planned gross costs) 2,800 4,120 141The Dowse is being upgraded to extend and improve exhibition and public space. The project commenced in the 2005 financialyear and continues into the 2006 and 2007 financial years. The original total project cost was $5.250 million, but additional costsof $0.500 million are now expected. External contributions of $3.500 million are anticipated, leaving a total <strong>Council</strong> contributionof $2.250 million.The underexpenditure on the Dowse upgrade during 2006 represents a timing difference only. There were no other significantvariations between the LTCCP’s projections of capital expenditure and the actual expenditure during the year.Group – People53
3. Aquatics and RecreationWhat we do<strong>Council</strong> provides and maintains six swimming pools in <strong>Hutt</strong> <strong>City</strong> as part of its portfolio of recreational facilities. Recreationalprogrammes are community-based and designed to encourage residents to engage in a range of recreational activities.Why we do itParticipation in recreation, sports, fitness and cultural activities positively affects people’s lives. Providing these high quality servicesat a low user cost makes them available to the whole community. Quality recreation services are essential to the quality of life for<strong>Hutt</strong> <strong>City</strong> citizens. Aquatics and recreational programmes also make an important contribution to creating an attractive area forpeople and businesses considering moving to <strong>Hutt</strong> <strong>City</strong>.How we contribute to <strong>Hutt</strong> <strong>City</strong> <strong>Council</strong> strategic goals and city-wide community outcomes• Provide quality experiences in safe environments• Meet the community’s need for active recreational opportunities through the development and maintenance of poolsand recreation programmes• Promote participation in recreation amongst a broad range of people in <strong>Hutt</strong> <strong>City</strong>How we Check ProgressPerformance Measures Level of Achievement Source of InformationAt least 300 programmes and events arecarried out with an increasing trend inparticipation across all programmes.2006: Not Achieved – 246 programmesand events with 16,137 participants.Cancellation of the Youth LeadershipProgramme and consolidation ofholiday programmes has resulted inthis measure not being achievedMonthly Management Reports2005: Achieved. 305 programmes werecarried out with 83,141 participantsThe percentage of <strong>Hutt</strong> <strong>City</strong> residentswho used a pool during the year isabove peer <strong>Council</strong> average.2006: 68%No peer average available2005:70%NRB Communitrak SurveyAll HCC pools achieve and maintain ACCPoolsafe certification.2006: Achieved2005: AchievedMonthly Management ReportsHCC maintains its ‘Out of School Careand Recreation (‘OSCAR’) accreditationfor all school holiday programmes.2006: Achieved2005: AchievedMonthly Management ReportsThe percentage of <strong>Hutt</strong> <strong>City</strong> users aresatisfied with recreation programmes isabove peer average2006: 94%No peer average available2005: Achieved 94%Peer <strong>Council</strong> average not availableNRB Communitrak SurveyGroup – PeopleThe percentage of <strong>Hutt</strong> <strong>City</strong> residentswho are satisfied with the pools is abovepeer <strong>Council</strong> average2006: 92%No peer average available2005: 94%Peer <strong>Council</strong> average 91%NRB Communitrak Survey54
Performance Measures Level of Achievement Source of InformationProgrammes to maintain and improvecurrent services are completed on time,to the required standard and withinoverall budgetAt least 750,000 people access the poolsper year.Achieve an average net direct cost peruser of $3.96 per visit.2006: Achieved2005: Achieved2006: Achieved 771,7792005: Achieved 785,0322006: Achieved $3.522005: Achieved $3.31Monthly Management ReportsMonthly Management ReportsOperational expenditure against usernumbersAQUATICS AND RECREATION – NET COST OF SERVICEFor the year ended 30 June 2006Actual30 June 2006$000Plan30 June 2006$000Actual30 June 2005$000OPERATING REVENUEUser charges 1,410 1,321 1,458Other revenue 192 224 188Total operating revenue 1,602 1,545 1,646OPERATING EXPENDITUREEmployee costs 1,873 1,880 1,855Support costs 475 475 499Operating costs 1,867 1,837 1,756Interest expense 68 68 66Depreciation 583 584 558Total operating expenditure 4,866 4,844 4,734NET DEFICIT BEFORE TAX (3,264) (3,299) (3,088)CAPITAL EXPENDITURE 174 588 346SIGNIFICANT ASSET ACQUISITIONS OR REPLACEMENTS AND VARIATIONS FROM THE LTCCPThere were no significant asset acquisitions or replacements, and no significant variations between the LTCCP’s projections ofcapital expenditure and the actual expenditure during the year other than timing differences on completion of several minorprojects.Group – People55
4. Parks and ReservesWhat we do<strong>Council</strong> provides and maintains active and passive recreational facilities in <strong>Hutt</strong> <strong>City</strong> for the enjoyment and well being of the public.These are largely free of charge. Recreation areas are natural and built with the majority of effort targeted at maintenance andreturning areas to their natural state. ‘Parks and Reserves’ also includes <strong>Council</strong>’s cemeteries.Why we do itThe provision and maintenance of parks, reserves and street gardens create a pleasant environment in which to live and work,which is an important part of the city’s vision. Providing and maintaining these areas at high quality and low user cost makes themavailable to the whole community.How we contribute to <strong>Hutt</strong> <strong>City</strong> <strong>Council</strong> strategic goals and city-wide community outcomes• Provide quality experiences in safe environments• Meet the community’s need for active recreational opportunities through the development and maintenance of sports areas• Maintain cemetery facilities and environments to the satisfaction of customers• Foster the physical and social health of residents through recreation and sports participation.How we Check ProgressPerformance Measures Level of Achievement Source of InformationThe percentage of <strong>Hutt</strong> <strong>City</strong> users whoare satisfied with parks and reserves areabove peer <strong>Council</strong> average.2006: Not Achieved 98%Peer <strong>Council</strong> average 98%2005: Not Achieved 97%Peer <strong>Council</strong> average 98%NRB Communitrak SurveySports fields are used at least 80% of theircarrying capacity.2006: Achieved 99% summer& 96% winterMonthly Management Reports2005: Achieved 93% summer, 85% winter95% of sports fields meet the standardsagreed with sports codes.2006: Achieved 97%2005: Achieved 99%Complaints from users during 2005/2006Group – PeopleProgrammes to maintain and improvecurrent services are completed on time,to the required standard and withinoverall budget.2006: Achieved – Except for• Walter Nash Stadium Trust for thetransfer of the Stadium to <strong>Council</strong>due to failure to agree on conditions• <strong>Hutt</strong> Park redevelopment to enableworks to be programmed with thenew sports house development• Percy Reserve Upgrade with delays tothe SH2 upgrade• <strong>Hutt</strong> Recreation Ground drainagedue to contractor availability• Halfcourt facility in Maungaraki toallow decisions from the communityon a preferred site• Korohiwa Landscaping due touncertainty over the developmentproposal• Projects carried over 2006/072005: Not Achieved – <strong>Hutt</strong> Park SportsZone Development, <strong>Hutt</strong> Village Green,Memorial Park Grandstand and PercyScenic Reserve Upgrade that has beencarried over to 2005/06Monthly Management Reports56
Performance Measures Level of Achievement Source of InformationThe percentage of <strong>Hutt</strong> <strong>City</strong> residentswho are satisfied with cemeteries isabove peer <strong>Council</strong> average.2006: Achieved 94%Peer <strong>Council</strong> average 88%2005: Achieved 93%Peer <strong>Council</strong> Average:88%NRB Communitrak Surveyparks AND reserves – NET COST OF SERVICEFor the year ended 30 June 2006Actual30 June 2006$000Plan30 June 2006$000Actual30 June 2005$000OPERATING REVENUEUser charges 777 883 877Operating subsidies – – 5Other revenue 8 5 8Total operating revenue 785 888 890OPERATING EXPENDITUREEmployee costs 495 466 462Support costs 413 413 537Operating costs 6,692 6,583 6,701Interest expense 537 537 515Depreciation 863 932 841Total operating expenditure 9,000 8,931 9,056NET DEFICIT BEFORE TAX (8,215) (8,043) (8,166)CAPITAL EXPENDITURE 1,992 3,381 2,118SIGNIFICANT ASSET ACQUISITIONS OR REPLACEMENTS AND VARIATIONS FROM THE LTCCPActual30 June 2006$000Plan30 June 2006$000Actual30 June 2005$000<strong>Hutt</strong> Park village green and sports zone 79 700 661Korohiwa landscape development – 500 –<strong>Hutt</strong> Park is being upgraded to make better use of this large area of recreational space. Further expenditure on <strong>Hutt</strong> Park wasdelayed while options for a Sports Zone development were investigated. Those investigations were satisfactorily concluded duringthe year, and the Sports Zone development is now likely to proceed. While <strong>Council</strong> will incur costs in relation to public space onfacilities on <strong>Hutt</strong> Park, the substantive investment is likely to be funded by Pelorus Trust.The Korohiwa landscape development of $0.5 million was cancelled.There were no other significant variations between the LTCCP’s projections of capital expenditure and the actual expenditureduring the year.Group – People57
5. Community SupportWhat we do<strong>Council</strong> seeks to support its community through appropriately responding to community needs. This support includes facilitation,advocacy, consultation and service provision, and allocation of grants to community organisations and groups. These services arecarried out through the <strong>Council</strong>’s Community Development Business Unit or through private contracts.Why we do it<strong>Council</strong> has a policy of understanding and identifying its communities and the wider social issues that impact on them. Throughgreater knowledge of local needs, <strong>Council</strong> is able to suitably respond to social issues affecting the communities it represents andtheir members and groups. The support that the <strong>Council</strong> contributes assists groups to achieve their goals where it would nototherwise have been possible due to lack of resources.How we contribute to <strong>Hutt</strong> <strong>City</strong> <strong>Council</strong> strategic goals and city-wide community outcomes• Support the provision of community, cultural and social services by other organisations• Assist with the development of community groups• Undertake research and consultation to ensure the council is informed of community needs• Provide advice and advocacy support• Administer funding and provide grants for community organisations and groups.How we Check ProgressPerformance Measures Level of Achievement Source of InformationConducting needs assessment surveys,safety audits and facilitation of networks,forums and meetings so the CommunityOutcomes meet the terms and conditionsdescribed in the annual work plan.Delivering community developmentprogrammes to meet the terms andconditions described in the annualwork plan.Community grants programmes arecompleted on time, to the requiredstandard and within overall budget.2006: Achieved2005: Achieved2006: Achieved2005: Achieved2006: Achieved2005: Not Achieved – Further work onbuilding capability and capacity of safetyproviders required before all of safetyinitiative fund is allocated, $70,000 carryover 2005/06.Monthly Management ReportsManagement ReportsManagement ReportsGroup – People58
COMMUNITY SUPPORT – NET COST OF SERVICEFor the year ended 30 June 2006Actual30 June 2006$000Plan30 June 2006$000Actual30 June 2005$000OPERATING REVENUEUser charges 15 20 19Operating subsidies 73 – 5Other revenue 170 146 138Total operating revenue 258 166 162OPERATING EXPENDITUREEmployee costs 539 493 484Support costs 340 338 452Operating costs 1,367 1,364 1,074Total operating expenditure 2,246 2,195 2,010NET DEFICIT BEFORE TAX (1,988) (2,029) (1,848)CAPITAL EXPENDITURE – – –SIGNIFICANT ASSET ACQUISITIONS OR REPLACEMENTS AND VARIATIONS FROM THE LTCCPThere were no significant asset acquisitions or replacements, and no significant variations between the LTCCP’s projections ofcapital expenditure and the actual expenditure during the year.Group – People59
6. Community PropertyWhat we do<strong>Council</strong> manages a variety of properties for use by the community. The main portfolios are community and civic halls andvenues, public toilets, community houses, <strong>Council</strong>’s administration building, and housing units for the elderly and disadvantaged.Progressive reviews of these facilities ensure they remain efficient and meet changing public requirements.Why we do itCommunity and civic halls and venues provide an environment for a diverse range of social, cultural and community-basedactivities, including clubs, indoor sports, band practice, arts and theatre. Public toilets are provided which are physically accessible,appropriately located, designed and built, and cleaned and maintained to standards that safeguard public health. <strong>Council</strong>continues to assess its property needs in terms of the properties it currently owns and occupies.How we contribute to <strong>Hutt</strong> <strong>City</strong> <strong>Council</strong> strategic goals and city-wide community outcomes• Ensure local communities have access to venues for recreational, cultural and governance activities.• Identify and continue to seek opportunities for <strong>Council</strong> to divest of properties that are not considered to be within <strong>Council</strong>’score business.• Provide well-maintained and safe living environments for tenants that are affordable and meet the needs of customers.• Being a successful advocate of the community’s housing needs.How we Check ProgressPerformance Measures Level of Achievement Source of InformationAt least 90% occupancy for rental housing 2006: Achieved 95%Management ReportsAt least 90% occupancy for commercialpropertiesIdentify and continue to seekopportunities for <strong>Council</strong> to divest itselfof properties that are not considered tobe within <strong>Council</strong>’s core businessProgrammes to maintain and improvecurrent services are completed on time,to the required standard and withinoverall budget.2005: Achieved 97%2006: Achieved 100%2005: Achieved 99%2006: Achieved2005: Achieved2006: Achieved – Except carryoverto 2006/07 for Stokes Valley Libraryentrance2005: Achieved – Except upgrade toTown Hall and upgrade CommunityHouse signage that has been carried overto 2005/06Management ReportsManagement ReportsManagement ReportsGroup – People60
COMMUNITY PROPERTY – NET COST OF SERVICEFor the year ended 30 June 2006Actual30 June 2006$000Plan30 June 2006$000Actual30 June 2005$000OPERATING REVENUEUser charges 1,682 1,644 1,586Total operating revenue 1,682 1,644 1,586OPERATING EXPENDITUREEmployee costs 235 234 201Support costs (1,159) (1,160) (1,118)Operating costs 2,792 2,582 2,900Interest expense 322 322 309Depreciation 1,395 1,202 1,154Total operating expenditure 3,585 3,180 3,446NET DEFICIT BEFORE TAX (1,903) (1,536) (1,860)CAPITAL EXPENDITURE 605 843 660SIGNIFICANT ASSET ACQUISITIONS OR REPLACEMENTS AND VARIATIONS FROM THE LTCCPThere were no significant asset acquisitions or replacements, and no significant variations between the LTCCP’s projections ofcapital expenditure and the actual expenditure during the year.Group – People61
GroupInfrastructureSafer, well-lit walkways and footpaths, non-congested traffic during peak hours, easily located car parks, high-quality drinkablewater, effective treatment and disposal of effluent, quality drainage systems to prevent flooding – these are the elements of<strong>Hutt</strong> <strong>City</strong>’s infrastructure that make daily life that much easier and more enjoyable.Significant Activity7. Roading and Traffic 638. Water 659. Wastewater 6710. Stormwater 6911. Solid Waste 71Group – Infrastructure62
7. Roading and TrafficWhat we doThis activity includes the professional and technical work involved in providing ongoing management of the city’s roading network.It also provides for improvement and day-to-day operation and maintenance of footpaths, road pavement/reconstruction/upgrades,traffic signals, and signs, street lighting, parking services, bridge maintenance and various road safety activities. These initiativesare supported through policy development, forward planning, development control, road safety co-ordination, and various systemsmanagement.Why we do itPublic ownership of the road corridor ensures appropriate property access and freedom of travel throughout the area for allcitizens. Sealed roads, footpaths and streetlights are provided for the efficient and safe travel of motor vehicles, bicycles andpedestrians.How we contribute to <strong>Hutt</strong> <strong>City</strong> <strong>Council</strong> strategic goals and city-wide community outcomesProvide a safe, reliable and efficient roading and pedestrian network, in harmony with the city’s natural environment andrepresenting best value.How we Check ProgressPerformance Measures Level of Achievement Source of InformationThe percentage of <strong>Hutt</strong> <strong>City</strong> residentswho are satisfied with the standard andsafety of streets, roads and footpaths isabove peer <strong>Council</strong> average.2006: Achieved - Roading 76%Peer <strong>Council</strong> average 71%Footpaths 89%Peer <strong>Council</strong> average 74%NRB Communitrak Survey2005: Achieved 77% roading / 85%footpathsPeer <strong>Council</strong> average: 71% roading / 74%footpathsThe percentage of <strong>Hutt</strong> <strong>City</strong> residentswho are satisfied with the cleanlinessof roads and gutters around the <strong>City</strong> isabove peer <strong>Council</strong> average.2006: Achieved 89%Peer <strong>Council</strong> average 78%2005: Achieved 90%NRB Communitrak SurveyThe percentage of <strong>Hutt</strong> <strong>City</strong> residentswho are satisfied with the safety andconvenience of movement aroundthe <strong>City</strong>’s streets is above peer <strong>Council</strong>average.2006: 83% No Peer <strong>Council</strong> averageavailable2005: 87%NRB Communitrak SurveyThe percentage of <strong>Hutt</strong> <strong>City</strong> residentswho are satisfied with street lightingaround the city is above peer <strong>Council</strong>average.2006: Not Achieved 88%Peer <strong>Council</strong> average 89%2005: Achieved 92%NRB Communitrak SurveyThe trend of reducing injury accidentsthrough the joint efforts of the <strong>Council</strong>,the Police and other agencies ismaintained.2006: Achieved2005: AchievedAccident data supplied by the LandTransport Safety Authority. (Note thatdata is supplied to end of each calendaryear; latest data available is to Dec 2005)Group – Infrastructure63
Performance Measures Level of Achievement Source of InformationProgrammes to maintain and improvecurrent services (asset renewals,maintenance and operations) completedon time, to the required standard andwithin overall budget2006: Achieved – Except for SilverstreamBridge seismic strengthening andMoores Valley Culvert replacementprojects2005: Achieved – Except for SilverstreamBridge, Moores Valley Culvert replacement,Taita Shop Bus Access, Pedestrian LightingImprovements, Wainuiomata Hill RoadSafety Barrier and Port Road to PointHoward Cycleway carried over to 2005/06Management ReportsROADING AND TRAFFIC – NET COST OF SERVICEFor the year ended 30 June 2006Actual30 June 2006$000Plan30 June 2006$000Actual30 June 2005$000OPERATING REVENUEUser charges 2,668 2,442 2,509Operating subsidies 2,592 2,662 3,263Capital subsidies 3,741 3,377 3,828Other revenue 566 518 497Total operating revenue 9,567 8,999 10,097OPERATING EXPENDITUREEmployee costs 995 995 910Support costs 1,962 1,962 1,913Operating costs 8,092 8,150 9,915Interest expense 1,704 1,703 1,635Depreciation 6,863 6,650 6,495Total operating expenditure 19,616 19,460 20,868NET DEFICIT BEFORE TAX (10,049) (10,461) (10,771)CAPITAL EXPENDITURE 8,583 8,875 7,821SIGNIFICANT ASSET ACQUISITIONS OR REPLACEMENTS AND VARIATIONS FROM THE LTCCPThere were no significant individual asset acquisitions or replacements, and no significant variations between the LTCCP’sprojections of capital expenditure and the actual expenditure during the year other than timing differences on completion ofcertain projects.Group – Infrastructure64
8. WaterWhat we do<strong>Council</strong> provides a sustainable and high quality water supply to the community for domestic and commercial use. <strong>Council</strong>purchases bulk water from Wellington Regional <strong>Council</strong>/Greater Wellington, which it distributes to the community through the city’swater supply system. <strong>Council</strong> monitors water quality and plans for the future water supply needs of the city.Why we do itThe supply of high quality, affordable water contributes to:• The health of the community• Community safety through the fire fighting capability of the water supply system• Industrial and residential development.How we contribute to <strong>Hutt</strong> <strong>City</strong> <strong>Council</strong> strategic goals and city-wide community outcomes• Contribute to the health of the community through a continuous high quality drinking water supply at low cost• Contribute to community safety through the fire fighting capability of the water supply system• Provide a high quality, cost effective water supply supporting development in the cityHow we Check ProgressPerformance measures Level of achievement Source of InformationThe percentage of <strong>Hutt</strong> <strong>City</strong> residentswho are satisfied with the water supplyservices is above peer <strong>Council</strong> average.Compliance with NZ Drinking WaterStandards for NZ 2002Fewer than eight unplanned supplyinterruptions per 100 connections2006: Achieved 96%Peer <strong>Council</strong> average 91%2005: Achieved 97%Peer <strong>Council</strong> average: 91%2006: Achieved2005: Achieved2006: Achieved2005: AchievedNRB Communitrak SurveyPotable Water Testing Contract ReportsIncident ReportsGroup – Infrastructure65
WATER – NET COST OF SERVICEFor the year ended 30 June 2006Actual30 June 2006$000Plan30 June 2006$000Actual30 June 2005$000OPERATING REVENUEUser charges 2,095 2,105 2,072Capital subsidies (56) – –Total operating revenue 2,039 2,105 2,072OPERATING EXPENDITUREEmployee costs 5 5 35Support costs 330 330 424Operating costs 8,480 9,272 9,012Interest expense 589 589 565Depreciation 2,417 2,440 2,384Total operating expenditure 11,821 12,636 12,420NET DEFICIT BEFORE TAX (9,782) (10,531) (10,348)CAPITAL EXPENDITURE 1,895 1,709 1,197SIGNIFICANT ASSET ACQUISITIONS OR REPLACEMENTS AND VARIATIONS FROM THE LTCCPThere were no significant asset acquisitions or replacements, and no significant variations between the LTCCP’s projections ofcapital expenditure and the actual expenditure during the year other than timing differences on completion of certain projects.Group – Infrastructure66
9. WastewaterWhat we do<strong>Council</strong> provides a wastewater system to collect and treat household and commercial effluent in a way that meets public healthand environmental standards. The Seaview treatment plant has been operating since November 2001, and has resulted in asignificant improvement to the environment.Why we do itThrough collecting, treating and disposing of wastewater, <strong>Council</strong> provides a service to residents and businesses, which supportsdevelopment in the city, and protects the physical environment and the health of the community.How we contribute to <strong>Hutt</strong> <strong>City</strong> <strong>Council</strong> strategic goals and city-wide community outcomes• Contribute to the health of the community through the efficient collection, treatment and disposal of wastewater in anenvironmentally sustainable manner• Provide a high quality, cost effective wastewater system supporting development in the city.How we Check ProgressPerformance measures Level of achievement Source of InformationPercentage of <strong>Hutt</strong> <strong>City</strong> residents thatare satisfied with wastewater services isabove peer council average.Programmes to maintain and improvecurrent services are completed on time,to required standard and within overallbudget.Fewer than 1.8 wastewater reticulationincidents per kilometre of pipeline<strong>report</strong>ed to the <strong>Council</strong>.Seaview wastewater treatment facilitiesachieve 100% compliance with relevantresource consent requirements.2006: Achieved 92%Peer <strong>Council</strong> average 90%2005: Achieved 96%Peer <strong>Council</strong> Average: 89%2006: Achieved – Except TeMaruaPumping Station rising main. TypeA and B Network Development, andPipeline Cyclic Replacment Projectshave been carried over to the 2006/07financial year2005: Not Achieved – WainuomataSewer, TeMarua Pumping Station, andExcess flow management carried over to2005/062006: Achieved2005: Achieved2006: Achieved2005: AchievedNRB Communitrak SurveyManagement ReportsIncident ReportsIncident ReportsEffluent Quality Testing ReportsGroup – Infrastructure67
WASTEWATER – NET COST OF SERVICEFor the year ended 30 June 2006Actual30 June 2006$000Plan30 June 2006$000Actual30 June 2005$000OPERATING REVENUEUser charges 831 806 771Operating subsidies (47) – 206Upper <strong>Hutt</strong> <strong>City</strong> <strong>Council</strong> operating contribution 1,845 2,046 1,907Capital subsidies – 120 –Total operating revenue 2,629 2,972 2,884OPERATING EXPENDITUREEmployee costs 10 10 35Support costs 739 726 745Operating costs 8,380 8,842 8,937Interest expense 1,101 1,101 1,056Depreciation 4,543 4,605 4,502Total operating expenditure 14,773 15,284 15,275NET DEFICIT BEFORE TAX (12,144) (12,312) (12,391)CAPITAL EXPENDITURE 10,838 12,412 2,735SIGNIFICANT ASSET ACQUISITIONS OR REPLACEMENTS AND VARIATIONS FROM THE LTCCPActual30 June 2006$000Plan30 June 2006$000Actual30 June 2005$000Excess flow management(Upper <strong>Hutt</strong> <strong>City</strong> <strong>Council</strong> contributes 32% of gross costs)7,330 7,290 863A peak flow wastewater storage facility is being constructed at Silverstream. This will reduce the risk of wastewater overflowsduring periods of heavy rainfall. The project commenced during the 2005 financial year and will be completed early in the 2007financial year.There were no other significant variations between the LTCCP’s projections of capital expenditure and the actual expenditureduring the year other than timing differences on completion of certain projects.Group – Infrastructure68
10. StormwaterWhat we do<strong>Council</strong> provides a stormwater drainage system to manage surface water runoff from urbanised catchments in a way that achievesan optimum balance between the level of protection and cost to the community.Why we do it<strong>Hutt</strong> <strong>City</strong> has most of its development concentrated on flat valley plains where there is potential for flooding. The effective controlof stormwater is necessary to protect the health and safety of the community and minimise property damage. The most efficientmeans of achieving this is through a comprehensive stormwater system.How we contribute to <strong>Hutt</strong> <strong>City</strong> <strong>Council</strong> strategic goals and city-wide community outcomes• Contribute to the safety of the community by minimising the incidence of flooding• Minimise property damage due to flooding and thus supporting the economy of the city• Provide a cost effective stormwater system that supports development in <strong>Hutt</strong> <strong>City</strong>.How we Check ProgressPerformance measures Level of achievement Source of InformationThe percentage of <strong>Hutt</strong> <strong>City</strong> residentswho are satisfied with stormwaterservices is above peer <strong>Council</strong> average.Fewer than two stormwater reticulationincidents per five kilometres of publicstormwater drain <strong>report</strong>ed to the<strong>Council</strong>.Programmes to maintain and improvecurrent services are completed on time,to the required standard and withinoverall budget.2006: Not Achieved 68%Peer <strong>Council</strong> average 78%2005: Not achieved 59%. A clear resultdue to recent flood events. Fundingincreased to $17 m over next ten yearsfor stormwater.Peer <strong>Council</strong> average:77%2006: Achieved2005: Achieved2006: Achieved – Except completion ofexcavation work for the Opahu Streampumping station structure will becarried into 2006/07 due to poorweather2005: Achieved – Except for Black Creekimprovements carried over 2005/06 andexcluding exceptional flood event costsNRB Communitrak SurveyIncident ReportsManagement ReportsGroup – Infrastructure69
STORMWATER – NET COST OF SERVICEFor the year ended 30 June 2006Actual30 June 2006$000Plan30 June 2006$000Actual30 June 2005$000OPERATING REVENUEUser charges 2 – 2Operating subsidies (425) 5 881Other revenue 9 – 9Total operating revenue (414) 5 892OPERATING EXPENDITUREEmployee costs 10 10 35Support costs 333 333 344Operating costs 2,170 2,031 3,583Interest expense 659 659 632Depreciation 1,693 1,772 1,658Total operating expenditure 4,865 4,805 6,252NET DEFICIT BEFORE TAX (5,279) (4,800) (5,360)CAPITAL EXPENDITURE 3,773 4,240 1,893SIGNIFICANT ASSET ACQUISITIONS OR REPLACEMENTS AND VARIATIONS FROM THE LTCCPActual30 June 2006$000Plan30 June 2006$000Actual30 June 2005$000Black Creek Wainuiomata upgrade 1,493 1,500 –Opahu Stream pumping station 1,002 1,500 –Major improvements were made to the storm water capacity of Black Creek Wainuiomata. A pumping station is being constructedto reduce the incidence of flooding by the Opahu Stream. The project was not able to be completed by 30 June and is likely to cost$0.400 million more than budget, bringing the total cost to $1.900 million.There were no other significant asset acquisitions or replacements, and no other significant variations between the LTCCP’sprojections of capital expenditure and the actual expenditure during the year.Group – Infrastructure70
11. Solid WasteWhat we do<strong>Council</strong> contracts out the collection of the city’s refuse and recycling. It also owns and operates two landfills to provide for thedisposal of residual waste. An annual waste minimisation programme is run to promote the concepts of ‘reduce, reuse, and recycle’to businesses and citizens.Why we do itSolid waste management is necessary for the health and quality of life of the community, the local economy and the environment.<strong>Council</strong> wishes to promote recycling and waste reduction, and to provide for the disposal of the city’s solid waste.How we contribute to <strong>Hutt</strong> <strong>City</strong> <strong>Council</strong> strategic goals and city-wide community outcomes• Encourage waste minimisation and environmentally friendly practices• Ensure refuse is managed and disposed of in a safe, efficient and sustainable manner that maintains the city’s natural andaesthetic values.How we Check ProgressPerformance measures Level of achievement Source Of InformationThe percentage of <strong>Hutt</strong> <strong>City</strong> residentswho are satisfied with the city’s refusecollection service is above peer <strong>Council</strong>average.2006: Not Achieved 90%Peer <strong>Council</strong> average 91%2005: Achieved 95%Peer <strong>Council</strong> average: 91%NRB Communitrak SurveyThe percentage of <strong>Hutt</strong> <strong>City</strong> residentswho are satisfied with the city’s refusedisposal facilities is above peer <strong>Council</strong>average.2006: Achieved 84%Peer <strong>Council</strong> average 81%2005: Achieved 92%Peer <strong>Council</strong> average: 81%NRB Communitrak SurveyThe percentage of <strong>Hutt</strong> <strong>City</strong> residentswho are satisfied with the city’s recyclingservice is above peer <strong>Council</strong> average.2006: Achieved 92%Peer <strong>Council</strong> average 86%2005: Achieved 96%Peer <strong>Council</strong> average: 86%NRB Communitrak SurveyCompliance with landfill managementplans and discharge consents.2006: Achieved – Except one notifiedbreach at Wainuiomata relating toodour associated with Exide slagManagement Reports2005: Achieved – Except for theWainuiomata Landfill in relation tocontaminated stormwater overflowingfrom the landfill into the silt pond during2004 floodProgrammes to maintain and improvecurrent services are completed on time,to the required standard and withinoverall budget.2006: Achieved – Except for part ofStage 2 carried over to 2006/072005: Achieved Except for SilverstreamLandfill stage 2 carried over to 2005/06Management ReportsGroup – Infrastructure71
SOLID WASTE – NET COST OF SERVICEFor the year ended 30 June 2006Actual30 June 2006$000Plan30 June 2006$000Actual30 June 2005$000OPERATING REVENUEUser charges 8,860 8,309 8,058Total operating revenue 8,860 8,309 8,058OPERATING EXPENDITUREEmployee costs 40 40 79Support costs 103 103 96Operating costs 4,863 4,549 4,482Depreciation 289 388 389Total operating expenditure 5,295 5,080 5,046NET SURPLUS BEFORE TAX 3,565 3,229 3,012CAPITAL EXPENDITURE 3,881 4,190 1,307SIGNIFICANT ASSET ACQUISITIONS OR REPLACEMENTS AND VARIATIONS FROM THE LTCCPActual30 June 2006$000Plan30 June 2006$000Actual30 June 2005$000Silverstream Landfill stage two 3,847 3,940 1,252The useful life of stage one of the Silverstream Landfill is nearing an end. Work is underway on a major project to develop stage twoof the landfill and provide for the future solid waste disposal needs of the <strong>Hutt</strong> Valley. The project will span several financial yearsand cost close to $9 million.There were no significant variations between the LTCCP’s projections of capital expenditure and the actual expenditure duringthe year.Group – Infrastructure72
GroupEnvironmentEnvironmental policies and plans are necessary for the sustainable development of our city. Resource consents and by-lawscontribute to sound environmental health. <strong>Council</strong> also manages emergency planning in case of flooding, earthquake orserious fire.Significant Activity12. Environmental Management 7413. Emergency Management 77Group – Environment73
12. Environmental ManagementWhat we do<strong>Council</strong> develop, implement and monitor the District Plan, relevant bylaws and other environmental policies and plans forthe sustainable development of <strong>Hutt</strong> <strong>City</strong>, including environmental education and promotion. <strong>Council</strong>’s statutory resourcemanagement and building approval and inspection functions, environmental health and animal control are also included underthis activity. Regular inspections are carried out to ensure compliance with legislative requirements, the District Plan, resourceconsent and building consent conditions as well as bylaw requirements. Inspections of business and food premises, certification,liquor licensing, pollution control, trade waste and monitoring of beaches are also undertaken to promote and protect publichealth and safety in <strong>Hutt</strong> <strong>City</strong>. Noise and hazardous substances also fall under this activity.Why we do itThis activity is fundamental to achieving a clean healthy, attractive and sustainable environment. There is also a legal requirementfor this activity.How we contribute to <strong>Hutt</strong> <strong>City</strong> <strong>Council</strong> strategic goals and city-wide community outcomes• Develop and implementing sound environmental policies and rules which encourage sustainable development and reflectcommunity views• Maintain a safe and healthy city and maximising appropriate development• Control dogs so that residents are safe, annoyance factors are minimised and the welfare of animals protected• Provide service from <strong>Council</strong> that is timely, efficient and customer friendly.How we Check ProgressPerformance measures Level of achievement Source of InformationAnimal Control customer satisfactionlevels are above peer <strong>Council</strong> average.District Plan changes are prepared andprocessed as agreed by <strong>Council</strong>.The Keep <strong>Hutt</strong> <strong>City</strong> Beautiful Programmeis implemented in conjunction withcommunity group representatives.The percentage of <strong>Hutt</strong> <strong>City</strong> users whoare satisfied with the inspection serviceand requests for service is above peer<strong>Council</strong> average.2006: Achieved 81%Peer <strong>Council</strong> average 76%2005: Achieved 82%Peer <strong>Council</strong> average: 76%2006: Achieved2005: Achieved2006: Achieved2005: Achieved2006: Achieved 89%Peer <strong>Council</strong> Average 67%2005: Achieved 82% for inspectionservice.85% satisfaction with requests for serviceNBR Communitrak Survey<strong>Council</strong> MinutesDivisional RecordsEvaluation of survey formsGroup – Environment74
Performance measures Level of achievement Source of InformationAll notified applications not requiringa hearing submitted for decision within15 working days.80% of non-notified land use consentswill be issued within 15 working days.90% of premises registered or licensedwithin 30 days of the date of application.80% of <strong>Hutt</strong> <strong>City</strong> users are satisfied withthe service in processing non-notifiedland use resource consents.80% of hearing participants are satisfiedthey have received a fair hearing.At least 80% of hearings decisions issuedwithin ten working days of the hearing.90% of applications for building consentsdetermined within 15 working days.2006: Not Achieved 55% – 9 notifiedconsent applications without hearing:Of these only 5 issued within 15 workingdaysNote: Measure was previously 10 days(the Act specifies 20 working days)2005:Not achieved 94% 18 decisionssubmitted, however one fell outside thetimeframe but within statutory period.The measure specified is half of the timeperiod specified in the Act which is 20working days2006: Achieved 83%Note: Measure was previously 10 days(the Act specifies 20 working days)2005: Not achieved 68%.93.7% of decisions released withinstatutory period of 20 working days2006: Achieved 97%2005: Achieved 98%2006: Achieved 94%2005: Achieved 88%2006: Achieved 81%2005: Not achieved 75%2006: Not Achieved 70% – the consultantemployed to prepare some hearingdecisions was able to meet RMAtimeframes (15 days) only2005: Achieved 100%2006: Not achieved 70% – within 15working days; implementation of thenew Building Act, staff shortages andthe implementation of a new computersystem have all contributed to thisfigure (this is an estimate as figuresunavailable for two months of the yeardue to change in computer system)2005: N/A new measure for 2006Computer Database RecordsComputer Database RecordsCustomer SurveySurvey of participantsComputer Database RecordsComputer Database RecordsGroup – Environment75
ENVIRONMENTAL MANAGEMENT – NET COST OF SERVICEFor the year ended 30 June 2006Actual30 June 2006$000Plan30 June 2006$000Actual30 June 2005$000OPERATING REVENUEUser charges 2,959 2,539 2,789Operating subsidies – – 3Other revenue 201 28 117Total operating revenue 3,160 2,567 2,909OPERATING EXPENDITUREEmployee costs 3,473 3,169 3,050Support costs 860 859 754Operating costs 1,473 1,205 1,404Depreciation 4 6 5Total operating expenditure 5,810 5,239 5,213NET DEFICIT BEFORE TAX (2,650) (2,672) (2,304)CAPITAL EXPENDITURE – – 28SIGNIFICANT ASSET ACQUISITIONS OR REPLACEMENTS AND VARIATIONS FROM THE LTCCPThere were no significant asset acquisitions or replacements, and no significant variations between the LTCCP’s projections ofcapital expenditure and the actual expenditure during the year.Group – Environment76
13. Emergency ManagementWhat we do<strong>Council</strong> develops, implements and monitors citywide emergency management plans, and promotes community preparedness foremergencies. Under the 2002 Civil Defence Emergency Management Act, <strong>Council</strong> must work co-operatively with other authoritiesin the region to plan for and to respond to hazards, risks and emergencies. <strong>Council</strong> also has plans in place for dealing with andpreventing rural fires. <strong>Council</strong> maintains the in-house capacity to co-ordinate responses to civil defence and rural fire emergencies.Why we do itThis activity is fundamental to achieving citywide preparedness for emergencies. There is also a legal requirement for this activityunder the Forest and Rural Fires Act and the Civil Defence Emergency Management Act.How we contribute to <strong>Hutt</strong> <strong>City</strong> <strong>Council</strong> strategic goals and city-wide community outcomes• Prepare residents for an emergency so that the impact on the community is minimised and people are safe.How we Check ProgressPerformance measures Level of achievement Source of InformationThe percentage of <strong>Hutt</strong> <strong>City</strong> residentswho are prepared for an emergency isabove that of peer <strong>Council</strong>s.Emergencies responded to in accordancewith the corporate Emergency Plan, CivilDefence Plan and related procedures.Rural fire emergencies responded to inaccordance with the Rural Fire Plan andrelated procedures.2006: 60%Peer <strong>Council</strong> not available2005: 60%Peer <strong>Council</strong> average not available2006: Achieved2005: Achieved2006: Achieved2005: AchievedNBR Communitrak SurveyManagement Reports and debrief notesWellington Regional Rural FireCommittee RecordsEMERGENCY MANAGEMENT – NET COST OF SERVICEFor the year ended 30 June 2006Actual30 June 2006$000Plan30 June 2006$000Actual30 June 2005$000OPERATING REVENUEOperating subsidies 4 40 395Other revenue 13 – 4Total operating revenue 17 40 399OPERATING EXPENDITUREEmployee costs 224 227 473Support costs 231 231 235Operating costs 150 132 181Interest expense – – 1Depreciation 14 14 13Total operating expenditure 619 604 903NET DEFICIT BEFORE TAX (602) (564) (504)CAPITAL EXPENDITURE 85 85 –SIGNIFICANT ASSET ACQUISITIONS OR REPLACEMENTS AND VARIATIONS FROM THE LTCCPThere were no significant asset acquisitions or replacements, and no significant variations between the LTCCP’s projections ofcapital expenditure and the actual expenditure during the year.Group – Environment77
GroupEconomyAre we creating the right business environment and growing <strong>Hutt</strong> <strong>City</strong> in a way that will make it a great place to live, work andplay? The ‘Economy’ section of this document looks at our plans in the areas of employment, encouragement of local business andcontributing to our region’s development.Significant Activity14. Local Urban Design 7915. Economic Development 81Group – Economy78
14. Local Urban DesignWhat We DoThe <strong>Council</strong> aims to develop an urban environment that will help attract people and investment and enhance the city’s image.<strong>Council</strong> also recognises the role <strong>Hutt</strong> <strong>City</strong>’s heritage and features play in the city’s image.Why We Do ItThe public space of <strong>Hutt</strong> <strong>City</strong> is managed and developed by <strong>Council</strong> on behalf of the community. It is important that urban designand infrastructure support and provide for modern business environment requirements. The whole community can benefit fromthe preservation of buildings of architectural, heritage and historic value, but the work required is often of no benefit to the owneror occupier.How we contribute to <strong>Hutt</strong> <strong>City</strong> <strong>Council</strong> strategic goals and city-wide community outcomes• Develop an urban environment that helps to retain and attract businesses, people and investment• Retain heritage buildings and features for future generations• Facilitate the requirements and development of business areas• Identify business and community needs, and plan and develop these.How we Check ProgressPerformance measures Level of achievement Source of InformationBusiness area development projects arecompleted on time, to the satisfaction ofbusinesses and within overall budget.Urban design and enhancement projectsare completed on time, to the requiredstandard and within overall budget.Earthquake Risk and Heritage BuildingFund projects are completed on time, tothe required standard and within overallbudget.Suburban Shopping centre programmesto improve services (asset upgrades andnew assets) completed on time, to therequired standard and within overallbudget.2006: Achieved2005: Achieved Except CBD developmentcarried over to 2005/062006: Achieved2005: Achieved Except CBD Masterplanstage 1 carried over to 2005/062006: No complying applicationsreceived2005: Achieved2006: Achieved2005: AchievedManagement ReportsManagement ReportsManagement ReportsManagement ReportsGroup – Economy79
LOCAL URBAN DESIGN – NET COST OF SERVICEFor the year ended 30 June 2006Actual30 June 2006$000Plan30 June 2006$000Actual30 June 2005$000OPERATING REVENUECapital subsidies – – 101Total operating revenue – – 101OPERATING EXPENDITUREEmployee costs 32 32 29Support costs 98 98 93Operating costs 123 175 78Interest expense 5 5 5Depreciation 102 167 93Total operating expenditure 360 477 298NET DEFICIT BEFORE TAX (360) (477) (197)CAPITAL EXPENDITURE 1,379 1,480 551SIGNIFICANT ASSET ACQUISITIONS OR REPLACEMENTS AND VARIATIONS FROM THE LTCCPActual30 June 2006$000Plan30 June 2006$000Actual30 June 2005$000CBD Masterplan 1,131 1,230 75<strong>Council</strong> is undertaking a range of improvements in the CBD designed to better intergrate the city with the new WestfieldQueensgate development and make the environment more attractive to shoppers. Additional expenditure is anticipated in futurefinancial years.There were no significant variations between the LTCCP’s projections of capital expenditure and the actual expenditure duringthe year.Group – Economy80
15. Economic DevelopmentWhat We Do<strong>Council</strong> has a leading role in fostering <strong>Hutt</strong> <strong>City</strong>’s growth in a number of ways. These include creating a business-friendlyenvironment, facilitating the expansion and creation of local businesses and employment, increasing tourism and events in <strong>Hutt</strong><strong>City</strong>, and contributing to regional growth through regional economic development.Why We Do ItIndividual businesses generally have insufficient incentives to explore opportunities that benefit <strong>Hutt</strong> <strong>City</strong> as a whole, as wellas themselves. <strong>Hutt</strong> <strong>City</strong>’s businesses and residents benefit from the <strong>Council</strong>’s support of the business sector as well as from thepromotion and recognition of <strong>Hutt</strong> <strong>City</strong> as a business location and vibrant city.How we contribute to <strong>Hutt</strong> <strong>City</strong> <strong>Council</strong> strategic goals and city-wide community outcomes• Facilitate the expansion of existing businesses and creation of new businesses by making <strong>Hutt</strong> <strong>City</strong> the preferred choice ofbusiness location within the region• Ensure doing business in <strong>Hutt</strong> <strong>City</strong> is easy and cost-effective through good business practices, efficient infrastructure anduse of innovative partnerships including <strong>Council</strong> and other organisations• Improve awareness and use of e-commerce and knowledge economy solutions as a way to communicate and do businesslocally, nationally and internationally• Create business communities with a sense of vibrancy and life and generate a sense of identity. This will be assisted by awider range of recreation, retail and entertainment options within or closer to business areas• Assist with the development of a skilled workforce• Encourage development and undertake of events.How we Check ProgressPerformance measures Level of achievement Source of InformationEconomic Development Strategyimplementation programs are completedon time, to the required standard andwithin overall budget.2006: Achieved – Except for RetailCoordinator & Seaview/Gracefieldproject2005: Achieved – Except for Seaview/Gracefield and Wingate developmentscarried over 2005/06Management RecordsAchieve job and GDP growth in <strong>Hutt</strong> <strong>City</strong>by improved ranking of <strong>Hutt</strong> <strong>City</strong> relativeto Peer Group of New Zealand cities.2006: Achieved – 5th ranked jobgrowth; 5th ranked GDP growth2005: Achieved 6th ranked job growth;8th ranked GDP growthBusiness Economic Research LimitedJackson Street Programme business planmilestones met.2006: Achieved2005: AchievedManagement RecordsMeet development Wainuomatamilestones.2006: Achieved2005: AchievedManagement RecordsCBD+ business plan milestones met.2006: AchievedManagement RecordsRegional Economic Development Agencybusiness plan milestones are met.2005: Achieved2006: Achieved2005: AchievedManagement RecordsGroup – Economy81
Performance measures Level of achievement Source of InformationAchieve job growth rate in <strong>Hutt</strong> <strong>City</strong>equivalent to 0.7%pa over the 2002-2007.2006: Achieved – 4.6% job growth foryear ended 31 March 2005Economic impact of events is satisfactory.At least 80% of <strong>Hutt</strong> <strong>City</strong> residents aresatisfied with the visitor informationservices and special events.2005: Achieved improvement.2.2% GDP & 2.2% job growth year ended31 March 20042006: Achieved2005: Achieved2006: Achieved 94%2005: Achieved 95%Economic Impact Assessment ModelNBR Communitrak SurveyECONOMIC DEVELOPMENT – NET COST OF SERVICEFor the year ended 30 June 2006Actual30 June 2006$000Plan30 June 2006$000Actual30 June 2005$000OPERATING REVENUEUser charges 169 125 –Operating subsidies 157 – 5Other revenue 128 11 228Total operating revenue 454 136 233OPERATING EXPENDITUREEmployee costs 415 314 305Support costs 551 550 517Operating costs 1,735 1,667 1,742Interest expense 15 15 14Total operating expenditure 2,716 2,546 2,578NET DEFICIT BEFORE TAX (2,262) (2,410) (2,345)CAPITAL EXPENDITURE 256 480 69SIGNIFICANT ASSET ACQUISITIONS OR REPLACEMENTS AND VARIATIONS FROM THE LTCCPThere were no significant asset acquisitions or replacements, and no significant variations between the LTCCP’s projections ofcapital expenditure and the actual expenditure during the year.Group – Economy82
GroupOrganisation<strong>Council</strong> carries out numerous functions and services – everything from managing profitable investments and planning for <strong>Hutt</strong><strong>City</strong>’s future through to the administration of water services and answering general questions from <strong>Hutt</strong> <strong>City</strong> residents. <strong>Council</strong>always endeavours to ensure that <strong>Hutt</strong> <strong>City</strong> is a great place to live, work and play.Significant Activity16. Elected Members 8417. Advice and Support 8618. Managing Services 87Group – Organisations83
16. Elected MembersWhat We Do<strong>Council</strong> is an elected body that governs the direction and objectives of the activities it is responsible for on behalf of <strong>Hutt</strong> <strong>City</strong>.Community representatives on Community boards and Ward Committees are part of <strong>Council</strong> and provide local input intogovernance issues.Why We Do ItThis is a legal requirement.How we contribute to <strong>Hutt</strong> <strong>City</strong> <strong>Council</strong> strategic goals and city-wide community outcomesThe long-term goals are to provide superior governance, in order to achieve Community Outcomes in the most efficient and timelymanner.How we Check ProgressPerformance measures Level of achievement Source of InformationThe percentage of <strong>Hutt</strong> <strong>City</strong> residentswho have seen or read <strong>Council</strong>spublished information in the year isabove peer <strong>Council</strong> average.The percentage of <strong>Hutt</strong> <strong>City</strong> resident’ssatisfaction with the performance ofthe Mayor and <strong>Council</strong>lors is above peer<strong>Council</strong> average.<strong>Hutt</strong> <strong>City</strong> residents’ satisfaction with theway rates are spent is above peer <strong>Council</strong>average.Average of <strong>Hutt</strong> <strong>City</strong>’s residents’satisfaction across all standardcommunity survey questions is abovepeer <strong>Council</strong> average.2006: Achieved 72%Peer <strong>Council</strong> average not available2005: 69%Peer <strong>Council</strong> average not available2006: Achieved 91%Peer <strong>Council</strong> average 84%2005: Achieved 89%Peer <strong>Council</strong> average 84%2006: Achieved 85%Peer <strong>Council</strong> Average 79%2005: Achieved 87%Peer <strong>Council</strong> average 79%2006: Achieved 87%Peer <strong>Council</strong> average 84%2005: Achieved 89%Peer <strong>Council</strong> average 84%NRB Communitrak SurveyNRB Communitrak SurveyNRB Communitrak SurveyNRB Communitrak SurveyGroup – Organisation84
ELECTED MEMBERS – NET COST OF SERVICEFor the year ended 30 June 2006Actual30 June 2006$000Plan30 June 2006$000Actual30 June 2005$000OPERATING REVENUEUser charges 3 – 3Other revenue 40 – –Total operating revenue 43 – 3OPERATING EXPENDITUREEmployee costs 927 909 838Support costs 551 545 516Operating costs 161 168 81Total operating expenditure 1,639 1,622 1,435NET DEFICIT BEFORE TAX (1,596) (1,622) (1,432)SIGNIFICANT ASSET ACQUISITIONS OR REPLACEMENTS AND VARIATIONS FROM THE LTCCPThere were no significant asset acquisitions or replacements, and no significant variations between the LTCCP’s projections ofcapital expenditure and the actual expenditure during the year.Group – Organisation85
17. ADVICE AND SUPPORTWhat we doThis activity involves the process of policy formation, consultation and public accountability on behalf of the <strong>Council</strong>.Why we do itProfessional advice and support is necessary to assist the community and their representatives on the <strong>Council</strong>, Community Boardsand Ward Committees to make informed decisions on behalf of the community.How we contribute to <strong>Hutt</strong> <strong>City</strong> <strong>Council</strong> strategic goals and city-wide community outcomes<strong>Council</strong> provides advice and support to elected members and community representatives, which enables them to functioneffectively.How we Check ProgressPerformance measures Level of achievement Source of InformationThe majority of <strong>Council</strong>lors <strong>report</strong> thatthey are satisfied or more than satisfiedwith formal advice received from officers.2006: Achieved 92%2005: Achieved 92%CEO Performance ReviewADVICE AND SUPPORT – NET COST OF SERVICEFor the year ended 30 June 2006Actual30 June 2006$000Plan30 June 2006$000Actual30 June 2005$000OPERATING REVENUEOther revenue – – 91Total operating revenue – – 91OPERATING EXPENDITUREEmployee costs – – 14Support costs 3,204 3,204 3,013Operating costs 35 35 290Total operating expenditure 3,239 3,239 3,317NET DEFICIT BEFORE TAX (3,239) (3,239) (3,226)SIGNIFICANT ASSET ACQUISITIONS OR REPLACEMENTS AND VARIATIONS FROM THE LTCCPThere were no significant asset acquisitions or replacements, and no significant variations between the LTCCP’s projections ofcapital expenditure and the actual expenditure during the year.Group – Organisation86
18. Managing ServicesWhat we doThis activity incorporates the organisational support functions that help <strong>Council</strong> to provide its other activities in the most efficientand effective manner. It includes:• Communications• Customer Services• Finance• General Administration• Information Services• Legal and Secretariet Services• Planning and Policy• Staff ServicesDue to an organisation review on 1 May 2006 a number of divisions names have been amended to better reflect the functionsundertaken.Why we do itThis activity contributes to all community outcomes by supporting all of <strong>Council</strong>’s other activities.How we contribute to <strong>Hutt</strong> <strong>City</strong> <strong>Council</strong> strategic goals and city-wide community outcomes• Prioritise and manage operating and capital expenditure• Establish prudent risk management policies and monitoring compliance• Implement the Baldridge Business Excellence Framework and obtaining bi-annual evaluation from the New ZealandBusiness Excellence Foundation• Participate in peer benchmarking exercises and pursuing identified best practice• Operate a continuous improvement programme• Elicit regular feedback from customers and staff, and address identified concerns.How we Check ProgressPerformance measures Level of achievement Source of InformationCapital and operating results are keptwithin overall budget.2006: Achieved – the net operatingresult was $3.0m better than budget.Capital expenditure was $7.2m belowbudget (due to projects carried overto 2006/07)Monthly Management Reports2005: Achieved – Operating results were$0.4 million better than budget. Capitalresults were $1.7 million better thanbudgetLess than 6 work related accidentsresulting in time off work.2006: Achieved – 3 work relatedaccidents resulted in time off workduring the year2005: Achieved – 5 work related accidentsresulted in time off work during the yearMonthly Management ReportsGroup – Organisation87
Performance measures Level of achievement Source of InformationNo significant non-compliance instancesin relation to compliance with legal andpolicy requirements.Submit application for assessment by theBusiness Excellence Foundation.Results exceed peer organisationaverages in at least 80% of measures.Achieve more than 700 organisationimprovements, as <strong>report</strong>ed by staff.Satisfaction ratings in surveys ofcustomer satisfaction exceed 80%.Satisfaction ratings in surveys of staffsatisfaction exceed 80%.2006: Achieved – No significant noncomplianceinstances <strong>report</strong>ed2005: Achieved – No significant noncomplianceinstances <strong>report</strong>ed2006: Achieved – Application submittedin May 20062005: Achieved. Bronze2006: Achieved – Key measures ofcustomer satisfaction, staff satisfactionand financial control are better thanpeer averages2005: Achieved – Key measures ofcustomer satisfaction, staff satisfactionand financial control are better than peeraverages2006: Achieved 742 improvements,as <strong>report</strong>ed by staff2005: Achieved – 744 improvementsregistered2006: Achieved 87%2005: Achieved 89%2006: Achieved 89%2005: Achieved 90%Legal Compliance ReportsReport of the New Zealand BusinessExcellence FoundationMonthly Management ReportsMonthly Management ReportsNRB Communitrak Survey2006: Best Places to Work Survey2005: ACNielsen staff surveyStaff turnover is kept to less than 15%. 2006: Achieved 14%Monthly Management Reports2005: Achieved 14%Group – Organisation88
MANAGING SERVICES – NET COST OF SERVICEFor the year ended 30 June 2006Actual30 June 2006$000Plan30 June 2006$000Actual30 June 2005$000OPERATING REVENUEUser charges 847 730 841Operating subsidies 44 – 12Capital contributions 1,269 160 232Dividend income – – 28Interest income 101 – 9Profit on sale of assets 1,901 – 166Other revenue 219 77 388Total operating revenue 4,381 967 1,676OPERATING EXPENDITUREEmployee costs 5,228 5,417 5,069Operating costs 7,542 5,905 6,031Interest expense (465) – 153Depreciation 1,107 1,186 918Total operating expenditure 13,412 12,508 12,171Operating deficit before adjustments (9,031) (11,541) (10,495)Net costs allocated to significant activities 11,579 11,541 11,592Net surplus before tax 2,548 – 1,097Tax expense – – –NET SURPLUS AFTER TAX 2,548 – 1,097CAPITAL EXPENDITURE 1,279 2,322 1,419SIGNIFICANT ASSET ACQUISITIONS OR REPLACEMENTS AND VARIATIONS FROM THE LTCCPThere were no significant asset acquisitions or replacements, and no significant variations between the LTCCP’s projections ofcapital expenditure and the actual expenditure during the year other than timing differences on completion of certain projects.Group – Organisation89
Five-YearFinancial SummaryActual30 June 2006$000Budget30 June 2006$000Actual30 June 2005$000Actual30 June 2004$000Actual30 June 2003$000Actual30 June 2002$000NotesFINANCIAL PERFORMANCERates revenue 68,493 67,921 65,825 62,400 60,022 56,373Other operating revenue 37,617 34,214 34,443 32,392 30,793 23,074Total operating revenue 106,110 102,135 100,268 94,792 90,815 79,447Depreciation 20,809 21,134 20,198 19,566 19,092 16,906Interest expense 4,735 5,200 5,227 5,220 5,916 4,856Other expenditure 72,185 70,432 73,118 68,887 64,350 57,167Total operating expenditure 97,729 96,766 98,543 93,673 89,358 78,929Operating surplus before adjustments 8,381 5,369 1,725 1,119 1,457 518Property plant and equipment– – – – 1,877 16,309adjustments(i)Tax (expense)/benefit – – – – – (21)Net surplus after tax 8,381 5,369 1,725 1,119 3,334 16,806Capital expenditure 38,287 45,529 22,017 22,901 15,868 75,289FINANCIAL POSITIONCash and short term deposits 5,041 2,200 5,529 4,960 6,730 7,141Sinking funds 233 – 216 201 1,148 12,450Fixed assets 802,004 821,889 800,813 801,550 806,868 750,053Other assets 36,842 12,683 22,309 21,615 11,930 18,296Public debt (74,455) (75,424) (73,556) (70,624) (72,737) (94,442)Other liabilities (29,143) (24,319) (23,725) (26,777) (22,546) (27,603)Equity 740,522 737,029 731,586 730,925 731,393 665,895FINANCIAL RATIOSNet public debt to total assets 8.4% 8.8% 8.4% 8.3% 8.2% 9.7%Interest expense to total operatingrevenue 4.5% 5.1% 5.2% 5.5% 6.5% 6.1%Increase/(decrease) in inflationadjusted rates revenue 0.7% (0.2)% 2.7% 1.8% 4.4% (2.5)%KEY FINANCIAL RESULTSFinancial StatementsThe net surplus after tax for the year ended 30 June 2006 of $8 million was $3 million above budget. Capital expenditure for theyear ended 30 June 2006 of $38 million was $7 million below budget. Funding has been carried over to the next financial yearfor completion of certain capital projects.Public debt increased by $1 million during the financial year.Explanatory notes:(i): Contributions towards bulk wastewater capital projects received from Upper <strong>Hutt</strong> <strong>City</strong> <strong>Council</strong> have been excluded fromcapital subsidies received from 1 July 2002. Capital subsidies received have been <strong>report</strong>ed as part of operating revenue from1 July 2003.Previously they were <strong>report</strong>ed with property plant and equipment adjustments.90
Financial StatementsStatement of Financial PerformanceFor the year ended 30 June 2006Actual<strong>Council</strong>30 June 2006$000Budget<strong>Council</strong>30 June 2006$000ActualGroup30 June 2006$000Actual<strong>Council</strong>30 June 2005$000ActualGroup30 June 2005$000NotesOPERATING REVENUERates revenue 1 68,493 67,921 68,493 65,825 65,825Revenue from activities 1 33,179 32,906 34,130 32,165 32,917Other revenue 1 4,438 1,308 4,430 2,278 2,279Total operating revenue 106,110 102,135 107,053 100,268 101,021OPERATING EXPENDITUREExpenditure on activities 2 97,729 96,766 98,510 98,543 99,182Total operating expenditure 97,729 96,766 98,510 98,543 99,182Operating surplus before tax 8,381 5,369 8,543 1,725 1,839Tax expense 3 – – – – –NET SURPLUS AFTER TAX 8,381 5,369 8,543 1,725 1,839Explanation of the <strong>Council</strong>’s net surplus after tax<strong>Council</strong> made a net surplus after tax of $8.381 million compared with a budgeted net surplus after tax of $5.369 million. Theoperating result was therefore $3.012 million better than budget.The reason for the result being better than budget is detailed in note 20 on major budget variations.The net surplus after tax has been used to repay debt after adjusting for items not having a cash flow nature and items supportingcapital expenditure.Statement of Movements in EquityFor the year ended 30 June 2006NotesActual<strong>Council</strong>30 June 2006$000Budget<strong>Council</strong>30 June 2006$000ActualGroup30 June 2006$000Actual<strong>Council</strong>30 June 2005$000ActualGroup30 June 2005$000Net surplus after tax 8,381 5,369 8,543 1,725 1,839OTHER RECOGNISED REVENUES ANDEXPENSESIncrease/(decrease) in revaluation reservesand other movements 4 555 – 555 (1,063) (1,063)Total recognised revenue and expensesfor the year8,936 5,369 9,098 662 776Equity at beginning of the year 731,586 731,660 732,222 730,924 731,446EQUITY AT END OF THE YEAR 4 740,522 737,029 741,320 731,586 732,222Financial StatementsThe accompanying accounting policies and notes form an integral part of these Financial Statements91
STATEMENT OF FINANCIAL POSITIONAs at 30 June 2006NotesActual<strong>Council</strong>30 June 2006$000Budget<strong>Council</strong>30 June 2006$000ActualGroup30 June 2006$000Actual<strong>Council</strong>30 June 2005$000ActualGroup30 June 2005$000EQUITYAccumulated funds 4 410,187 409,758 410,985 402,540 403,176<strong>Council</strong> created reserves 4 12,275 8,403 12,275 11,243 11,243Restricted reserves 4 54 52 54 52 52Asset revaluation reserves 4 318,006 318,816 318,006 317,751 317,751TOTAL EQUITY 740,522 737,029 741,320 731,586 732,222Represented by:CURRENT ASSETSCash and short term deposits 5,041 2,200 5,078 5,529 5,539Accounts receivable and prepayments 5 9,319 9,143 9,305 8,599 8,723Inventories 8 – 16 16 23Sinking funds 142 – 142 132 132Properties intended for resale 2,679 – 2,679 3,518 3,518Total current assets 17,189 11,343 17,220 17,794 17,935NON-CURRENT ASSETSProperty, plant and equipment 6 802,004 821,889 805,376 800,813 803,807Assets under construction 6 21,694 413 21,695 7,048 7,093Investment in subsidiaries 7 2,545 2,545 – 2,545 –Investment in associates 8 224 224 224 224 224Sinking funds 91 – 91 84 84Other assets 9 373 358 373 359 359Total non-current assets 826,931 825,429 827,759 811,073 811,567TOTAL ASSETS 844,120 836,772 844,979 828,867 829,502CURRENT LIABILITIESBank overdraft (unsecured) 2,012 – 2,012 2,132 2,132Public debt 11 49,085 60,424 49,085 48,153 48,153Accounts payable 5,831 6,000 5,857 5,477 5,493Employee entitlements 13 1,247 1,200 1,247 1,142 1,142Deposits held 408 300 408 337 337Other liabilities 14 16,262 13,637 16,297 11,399 11,382Total current liabilities 74,845 81,561 74,906 68,640 68,639NON-CURRENT LIABILITIESPublic debt 11 25,370 15,000 25,370 25,403 25,403Employee entitlements 13 570 650 570 522 522Other liabilities 14 2,813 2,532 2,813 2,716 2,716Total non-current liabilities 28,753 18,182 28,753 28,641 28,641TOTAL LIABILITIES 103,598 99,743 103,659 97,281 97,280NET ASSETS 740,522 737,029 741,320 731,586 732,22292Financial StatementsStatement of Compliance and ResponsibilityThe <strong>Council</strong> and management of <strong>Hutt</strong> <strong>City</strong> <strong>Council</strong> confirm that all statutory requirements in relation to the annual <strong>report</strong>, asoutlined in Schedule 10 of the Local Government Act 2002, have been complied with.Mayor Chief Executive General Manager Business ServicesThe accompanying accounting policies and notes form an integral part of these Financial Statements
STATEMENT OF CASH FLOWSFor the year ended 30 June 2006NotesActual<strong>Council</strong>30 June 2006$000Budget<strong>Council</strong>30 June 2006$000ActualGroup30 June 2006$000Actual<strong>Council</strong>30 June 2005$000ActualGroup30 June 2005$000CASH FLOWS FROM OPERATING ACTIVITIESCash was provided from:Rates revenue 68,328 67,921 68,328 65,177 65,177User charges and other income 36,544 34,124 37,541 34,643 35,323Interest received 174 90 175 171 173Net GST received from Inland Revenue – – – 142 142Regional council rates 12,828 11,100 12,828 12,689 12,689117,874 113,235 118,872 112,822 113,504Cash was applied to:Payments to suppliers and employees (68,331) (70,132) (68,947) (75,047) (75,537)Interest paid (4,598) (5,200) (4,588) (4,974) (4,965)Net GST paid to Inland Revenue (268) – (268) – –Regional council rates (12,819) (11,100) (12,819) (12,520) (12,520)(86,016) (86,432) (86,622) (92,541) (93,022)Net cash flows from operating activities 15 31,858 26,803 32,250 20,281 20,482CASH FLOWS FROM INVESTING ACTIVITIESCash was provided from:Sale of property, plant and equipment 2,757 10,890 2,757 226 228Sale of sinking fund investments 1,770 – 1,770 1,646 1,646Other investment receipts 109 – 232 36 3564,636 10,890 4,759 1,908 2,230Cash was applied to:Purchase and construction of property, plant(35,971) (42,555) (36,459) (21,602) (22,190)and equipmentContributions to sinking funds (1,770) – (1,770) (1,654) (1,654)Other payments and investments (20) – (20) (69) (72)(37,761) (42,555) (38,249) (23,325) (23,916)Net cash flows from investing activities (33,125) (31,665) (33,490) (21,417) (21,686)CASH FLOWS FROM FINANCING ACTIVITIESCash was provided from:Funds raised from public debt 222,424 226,963 222,424 231,262 231,262Cash was applied to:Repayment of public debt (221,525) (222,052) (221,525) (228,330) (228,330)Net cash flows from financing activities 899 4,911 899 2,932 2,932Net (decrease)/increase in cash balance (368) 49 (341) 1,796 1,728Cash balance at beginning of the year 3,397 2,151 3,407 1,601 1,679CASH BALANCE AT END OF THE YEAR 3,029 2,200 3,066 3,397 3,407Cash balance at end of the year comprises:Cash and on call deposits 5,041 2,200 5,078 5,529 5,539Bank overdraft (unsecured) (2,012) – (2,012) (2,132) (2,132)CASH BALANCE AT END OF THE YEAR 3,029 2,200 3,066 3,397 3,407Financial StatementsThe accompanying accounting policies and notes form an integral part of these Financial Statements93
Statement ofAccounting Policies1. Reporting Entity and Statutory BaseThe <strong>Hutt</strong> <strong>City</strong> <strong>Council</strong> (referred to as “<strong>Council</strong>”) is a territorial local authority governed by the Local Government Act 2002.The <strong>Council</strong> was first formed as Lower <strong>Hutt</strong> <strong>City</strong> <strong>Council</strong> on 1 November 1989 by the amalgamation of five local authorities.The name of <strong>Council</strong> was changed to “The <strong>Hutt</strong> <strong>City</strong> <strong>Council</strong>” by a special Act of Parliament on 8 October 1991.The Group consists of <strong>Council</strong>, its subsidiaries, Seaview Marina Limited (previously named Caulfold Holdings Limited) and<strong>Hutt</strong> Holdings Limited (previously named Centre <strong>City</strong> Plaza Limited) (both 100% owned), <strong>Hutt</strong> Valley Youth Health Trust(an insubstance subsidiary), the Silverstream Gas Joint Venture (7% owned) and associate Wellington Water ManagementLimited.These Consolidated (or “Group”) Financial Statements have been prepared in accordance with the requirements of the LocalGovernment Act 2002, which includes the requirement to comply with generally accepted accounting practice.2. Measurement BaseThese Financial Statements have been prepared using a historical cost basis, modified by the revaluation of certain assets.3. Specific Accounting PoliciesA. Basis of consolidationSubsidiariesSubsidiaries are those entities controlled by <strong>Council</strong>.These Group Financial Statements include <strong>Council</strong> and its subsidiaries, except for <strong>Hutt</strong> Valley Youth Health Trust, which hasnot been consolidated. The effect of not consolidating <strong>Hutt</strong> Valley Youth Health Trust is immaterial. The purchase methodis used to prepare these Group Financial Statements. Corresponding assets, liabilities, revenues and expenses are addedtogether on a line by line basis. All significant inter-entity transactions are eliminated on consolidation.Goodwill arising on the acquisition of a subsidiary represents the excess of the purchase price over the fair value of theidentifiable net assets acquired. Goodwill is stated at cost and amortised to the Statement of Financial Performance on astraight line basis over five years.All subsidiaries have 30 June balance dates except for <strong>Hutt</strong> Valley Youth Health Trust, which has a 30 September balance date.AssociatesAssociates are entities in which <strong>Council</strong> has significant influence, but not control, over the operating and financial policies.94Statement of Accounting Policies<strong>Council</strong> has one associate, Wellington Water Management Limited. The Group’s share of post acquisition gains and lossesof Wellington Water Management Limited are recognised as a component of revenue in the Statement of FinancialPerformance.The financial statements are unaudited and the balance date for Wellington Water Management Limited is 30 June. TheAssociate’s results have been included in these financial statements.Joint venture<strong>Council</strong> has a 7% interest in the Silverstream Gas Joint Venture. <strong>Council</strong>’s interest in the joint venture is accounted for usingthe proportionate method of consolidation.The financial statements of the joint venture are prepared by Mighty River Power and are based on generally acceptedaccounting practice in New Zealand. The measurement base is historical cost and accrual accounting is used to recogniseand match the cost of services provided with revenues earned.The financial statements are unaudited and the balance date for the Silverstream Gas Joint Venture is 30 June. Joint ventureresults have been included in these Financial Statements.
B. Budget figuresThe budget figures are those approved by <strong>Council</strong> at the beginning of the year after a period of consultation with the publicas part of the Community Planning process. The budget figures have been prepared in accordance with generally acceptedaccounting practice and are consistent with the accounting policies adopted by <strong>Council</strong> for the preparation of theseFinancial Statements.C. RevenueRates revenue is recognised when levied.Water billing revenue is recognised on an accrual basis. Unbilled sales, as a result of unread meters at year-end, are accruedon an average usage basis.Subsidies from Transfund New Zealand and grants from other government agencies are recognised as revenue uponentitlement, which is when conditions pertaining to eligible expenditure have been fulfilled.Other grants and bequests, and assets vested in <strong>Council</strong> - with or without conditions - are recognised as revenue whencontrol over the assets is obtained.Dividends are recognised on an accrual basis net of imputation credits.D. Construction ContractsProfits on contracts are recognised progressively over the period of each contract. The amount recognised in the Statementof Financial Performance, and the value of contract work in progress, are established by assessment of individual contractstaking into account the proportion of work completed, cost analysis and estimated final results.Foreseeable losses on a contract are recognised immediately.E. Goods and Services Tax “GST”These Financial Statements have been prepared exclusive of GST with the exception of accounts receivable and accountspayable, which are stated inclusive of GST. When GST is not recoverable as an input tax then it is recognised as part of therelated asset or expense.F. TaxationIncome tax expense is recognised in the Statement of Financial Performance in respect of the current year’s surplus afterallowing for permanent differences.Deferred tax is determined on a comprehensive basis using the liability method. Deferred tax assets attributable to timingdifferences or income tax losses are only recognised when there is virtual certainty of realisation.G. EquityEquity is the community’s interest in <strong>Council</strong> and the Group as measured by total assets less total liabilities. Equity isclassified into a number of reserves to enable clearer identification of the specified uses that <strong>Council</strong> and the Group makeof their accumulated surpluses. The components of equity are:• Accumulated funds• <strong>Council</strong> created reserves• Restricted reserves• Asset revaluation reserves.Reserves represent a particular use to which various parts of equity have been assigned. Reserves may be legally restrictedor created by <strong>Council</strong> or the Group.<strong>Council</strong> created reserves are established by <strong>Council</strong>. They may be altered without reference to any third party or the courts.Transfers to and from these reserves are at the discretion of <strong>Council</strong>.Restricted reserves are subject to specific conditions accepted as binding by <strong>Council</strong>, which may not be revised by <strong>Council</strong>without reference to the courts or third party. Transfers from these reserves may be made only for specified purposes orwhen certain conditions are met.Statement of Accounting Policies95
H. Accounts ReceivableAccounts receivable are recognised at expected realisable values after providing for doubtful and uncollectable debts.I. InventoriesInventories are recognised at the lower of their cost, determined on a first-in first-out basis, and net realisable value.J. Property, Plant and EquipmentExpenditure of a capital nature of $1,000 or more for information technology hardware, and $2,500 or more for otheritems, has been capitalised. Expenditure of less than $1,000 for information technology hardware, or less than $2,500 forother items, has been charged to operating expenditure.Property, plant and equipment consists of:• Infrastructure assetsInfrastructure assets are the fixed utility systems owned by the <strong>Council</strong> and include resource consents. Each asset typeincludes all items that are required for the network to function. For example, sewerage reticulation includes reticulationpiping and sewer pump stations.• Operational assetsThese include land, buildings, improvements, library books, plant and equipment, and motor vehicles.• Restricted assetsRestricted assets are parks and reserves owned by the <strong>Council</strong> that cannot be disposed of because of legal or otherrestrictions and provide a benefit or service to the community.Upper <strong>Hutt</strong> <strong>City</strong> <strong>Council</strong>’s interest in the bulk wastewater systemThe <strong>Hutt</strong> Valley and Wainuiomata bulk wastewater system is managed by the <strong>Council</strong>. Upper <strong>Hutt</strong> <strong>City</strong> <strong>Council</strong> pays anannual levy to the <strong>Hutt</strong> <strong>City</strong> <strong>Council</strong> based on an apportionment formula equating to between 26% and 31% of the fundingrequirements. While Upper <strong>Hutt</strong> <strong>City</strong> <strong>Council</strong> does not have legal ownership of the bulk wastewater system, it is entitled toa share of the proceeds from any sale of the assets.Upper <strong>Hutt</strong> <strong>City</strong> <strong>Council</strong>’s interest in the bulk wastewater system assets is deducted from the value of property plant andequipment recognised in the Statement of Financial Position. Funding contributions from Upper <strong>Hutt</strong> <strong>City</strong> <strong>Council</strong> arerecognised as revenue in the Statement of Financial Performance if the contributions are for the operation of the bulkwastewater system. Funding contributions for capital work are recognised as an increase in Upper <strong>Hutt</strong> <strong>City</strong> <strong>Council</strong>’sinterest in the bulk wastewater system assets.ValuationAll assets are valued at historical cost except for the following:• Land and buildings have been valued at fair value. Revaluations are carried out five yearly• Infrastructure assets have been valued at optimised depreciated replacement cost. Revaluations are carried out fiveyearly. The exceptions are:96Statement of Accounting Policies–––wharves, which are valued at indemnity value, reflecting their minimum residual valuetraffic signs, which are stated at costinfrastructure land under roads, which is valued at 45% of the average land market value• Seaview Marina Limited’s assets are valued at depreciated historical cost• Library literary assets are valued at depreciated replacement cost in accordance with draft guidelines released by theNew Zealand Library Association and the National Library of New Zealand. Revaluations are carried out five yearly.All revaluations are carried out by independent valuers who specialise in the asset classes listed above. The exception islibrary literary assets, which are valued by staff with specialist knowledge in this area.Property, plant and equipment valuation increases and decreases are charged to the appropriate asset revaluation reserves.If the decreases would have resulted in a debit balance in the asset revaluation reserve, then this debit balance would berecognised as an expense in the Statement of Financial Performance.
Any subsequent increase on revaluation that off-sets the previous decrease in value in the Statement of FinancialPerformance will be recognised first in the Statement of Financial Performance up to the amount previously expensed, andthen credited to the revaluation reserve for that class of asset.Costs incurred in obtaining any resource consents are capitalised as part of the asset to which they relate. If a resourceconsent application is declined then all capitalised costs are written off.AdditionsAdditions between valuations are recorded at cost, except for vested assets. Certain infrastructure assets and land have beenvested in the <strong>Council</strong> as part of the subdivisional consent process. Vested infrastructure assets have been valued based onthe actual quantities of infrastructure components vested and the current ‘in the ground’ cost of providing natural services.Vested infrastructure assets are recognised as revenue in the Statement of Financial Performance.Assets under constructionAssets under construction are included at cost. The total cost of a project is transferred to the relevant capital class on itscompletion and then depreciated.K. DepreciationDepreciation is provided on a straight-line basis on all property, plant and equipment at rates that will write off the cost (orvaluation) of the assets to their estimated residual values over their useful lives, except for the following:• art, museum collections and land are not depreciated.The expected useful economic lives have been estimated as follows:Estimated economic livesyearsOperational assetsBuildings 50 – 80Piers at Seaview Marina 25Parking meters 15Office equipment 10Plant 10Pay and display 10Recycling depots 5 – 10Playground equipment 5 – 10Computer equipment 3 – 5Infrastructure assetsBridges 75 – 100Drainage including manholes and drainpipe 50 – 80Kerbing 80Footpaths 50Unsealed pavement (base course and sub base) 50Street lights 29Wharves 15Road surface 20Traffic signals and signs 16Reservoirs 80Storm water pipe network assets 60 – 100Water pipe network assets 60 – 90Seaview wastewater treatment plant 20Milliscreen plant 26Pump and gauging stations 20 – 50Sewerage pipe network assets 40 – 80Gauging, milliscreen and reservoir equipment 15Pump station control equipment 8 – 10Resource consentsconsent termStatement of Accounting Policies97
L. InvestmentsInvestments in subsidiariesInvestments in subsidiaries are valued at the lower of their cost and net realisable value. Increases and decreases in thevalue of investments are recorded in the Statement of Financial Performance.Investments in associatesInvestments in associates are valued at the lower of their cost and net realisable value in <strong>Council</strong>’s Statement of FinancialPosition. Increases and decreases in the value of investments are recorded in the Statement of Financial Performance.Investment propertiesInvestment properties are revalued annually at net current value by an independent registered valuer. Increases anddecreases in the value of assets are credited to the appropriate asset revaluation reserves. If the decreases would haveresulted in a debit balance in the asset revaluation reserve, then this debit balance has been expensed in the Statement ofFinancial Performance. There is no depreciation recognised on investment properties.Other investmentsAll other investments are valued at the lower of their cost and net realisable value.M. Sinking fundsFunds have been set aside to meet future repayments of loans. These funds are invested with the Sinking FundCommissioners of the <strong>City</strong> of Lower <strong>Hutt</strong> and the National Provident Fund. Interest earned on sinking funds is recognised asrevenue in the Statement of Financial Performance.N. Employee entitlementsProvision is made in respect of the Group’s liability for annual leave, long service leave, and retirement gratuities. <strong>Annual</strong>leave has been calculated on an actual basis at current rates of pay, while the other provisions have been calculated on anactuarial basis based on the present value of expected future entitlements.O. LeasesOperating LeasesLeases where the lessor effectively retains substantially all the risks and benefits of ownership of the leased items areclassified as operating leases. Payments under these leases are recognised as expenses and income is recognised as revenuein the Statement of Financial Performance in the periods in which they are incurred.P. Landfill post closure costsAs operator of the Silverstream and Wainuiomata landfill sites, the <strong>Council</strong> has an obligation to ensure the ongoingmaintenance and monitoring services at these landfill sites after closure. The <strong>Council</strong> also has an obligation to monitorclosed landfill sites previously operated by local authorities subsequently amalgamated to form the <strong>Hutt</strong> <strong>City</strong> <strong>Council</strong>.98Statement of Accounting PoliciesA site restoration and aftercare provision has been recognised as a liability in the Statement of Financial Position. Provisionis made for the present value of closure and post closure costs when the obligation for post closure arises. The calculatedcost is based on estimates of future site trade waste charges and monitoring costs. The estimated length of time needed forpost closure care is Silverstream 30 years, and Wainuiomata 28 years.The calculations assume no change in the legislative requirements or technological changes for closure and post closuretreatment. The discount rate used is a pre tax rate that reflects current market assessments of the time value of money andthe risks specific to the <strong>Council</strong>.Q. Financial instrumentsThe <strong>Council</strong> is party to financial instruments as part of its normal operations. These financial instruments include cash andon call deposits, accounts receivable, investments, accounts payable, public debt, deposits held, other liabilities, financialguarantees and interest rate swaps and options.Revenue and expense arising from these financial instruments is recognised in the Statement of Financial Performance.The financial instruments are recognised in the Statement of Financial Position in accordance with the accounting policiesoutlined below.
Cash and on call deposits, accounts payable, public debt, deposits held and other liabilitiesThese financial instruments are recognised in the Statement of Financial Position on a historical cost basis.Accounts receivable and investmentsRelated accounting policies are described in sections H and L above.Financial guaranteesFinancial guarantees are not recognised in the Statement of Financial Performance unless it becomes probable that afinancial loss will be incurred as a result of a guarantee. Financial guarantees are disclosed in note 19 of the FinancialStatements.Interest rate swaps and options<strong>Council</strong> enters into interest rate swaps and options to hedge interest rate risk associated with public debt. The followingaccounting treatments are applied:• The net differential paid or received on interest rate swaps is recognised as a component of interest income or expenseover the period of the agreement• Interest rate option premiums paid or received and net settlements on maturity are amortised as a component ofinterest income or expense over the period of the underlying asset or liability• As all interest rate swaps and options are hedges of underlying assets or liabilities, they are not stated at market valuein the Statement of Financial Position. However, any interest differentials paid or received, option premiums and netsettlements that are unamortised at balance date are recognised in the Statement of Financial Position.R. Operating statements included in the Statement of Service PerformanceThe operating statements <strong>report</strong> the net cost of services for significant activities of <strong>Council</strong>. <strong>Council</strong> has derived the net costof services for each significant activity using the cost allocation system outlined below.• Direct costs are charged directly to significant activities. Indirect costs are charged to the significant activities based oncost drivers and related activity or usage information• Each significant activity has been charged an internal interest cost. The net interest cost incurred by <strong>Council</strong> is allocatedto each significant activity based on the net book value of property plant and equipment used by the activity.S. Statement of cash flowsCash means cash balances on hand, in bank accounts, demand deposits and other highly liquid investments which <strong>Council</strong>or the Group holds as part of its day-to-day cash management.Operating activities include cash received from all income sources within <strong>Council</strong> and the Group and cash paid for thesupply of goods and services. Agency transactions (the collection of regional council rates) are recognised as receipts andpayments in the Statement of Cash Flows given that they flow through the <strong>Council</strong>’s main bank account.Investing activities are those activities relating to the acquisition and disposal of non-current assets.Financing activities include the change in equity and debt capital structure of the <strong>Council</strong> and the Group.4. Changes in Accounting PoliciesThere are no significant changes in accounting policies. All policies have been applied on bases consistent with those usedin previous years.Statement of Accounting Policies99
Notes to theFinancial Statements1. OPERATING REVENUEActual<strong>Council</strong>30 June 2006$000Budget<strong>Council</strong>30 June 2006$000ActualGroup30 June 2006$000Actual<strong>Council</strong>30 June 2005$000ActualGroup30 June 2005$000RATES REVENUE 68,493 67,921 68,493 65,825 65,825ACTIVITIES REVENUEUser charges 17,324 16,545 18,275 16,361 17,113Subsidies 9,898 11,500 9,898 10,610 10,610Regulatory revenue 4,077 3,222 4,077 3,413 3,413Penalties 1,880 1,639 1,880 1,781 1,781Total activities revenue 33,179 32,906 34,130 32,165 32,917OTHER REVENUEInterest revenue 191 90 183 178 179Profit on sale of property, plant and equipment 1,901 – 1,901 166 166Dividends – – – 28 28Miscellaneous revenue 2,346 1,218 2,346 1,906 1,906Total other revenue 4,438 1,308 4,430 2,278 2,279TOTAL OPERATING REVENUE 106,110 102,135 107,053 100,268 101,021Rates revenue is <strong>report</strong>ed in these financial statements on a net basis after deducting rates remitted under <strong>Council</strong>’s rate remissionpolicies totalling $536,000 (2005: $234,000). <strong>Council</strong>’s policy (set out in the Community Plan) enables consideration of rates remissionsin a number of circumstances including where the ratepayer is a sporting or community organisation, a church, school, kindergarten,or play centre, or a hospital provided the property is used for community benefit and not for profit. Rates remissions can also beconsidered for economic development reasons or where privately owned land is protected for conservation purposes.Notes to the Financial Statements2. OPERATING EXPENDITUREActual<strong>Council</strong>30 June 2006$000Budget<strong>Council</strong>30 June 2006$000ActualGroup30 June 2006$000Actual<strong>Council</strong>30 June 2005$000ActualGroup30 June 2005$000Auditors’ fees– for auditing the financial statements 135 125 145 115 124– for auditing the Community Plan 59 60 59 – –– for other services – – – – –Bad debt expense 2 60 2 35 35Depreciation 20,809 21,134 20,963 20,198 20,340Directors’ fees – – 30 – 30Entertainment 81 92 81 70 70Grants and donations 21 25 21 21 21Insurance expenses 942 1,011 981 1,225 1,263Interest expense 4,735 5,200 4,735 5,227 5,068Movement in provision for doubtful debts (67) 25 (67) (100) (97)Remuneration to councillors, community board634 615 634 589 592and ward committee membersRent and lease expenses 686 596 686 586 586Subscriptions 67 51 67 55 55Asset Write-off 1,366 – 1,366 – –Other operating expenses 68,259 67,772 68,807 70,522 71,095TOTAL OPERATING EXPENDITURE 97,729 96,766 98,510 98,543 99,182100
3. TAXATIONActual<strong>Council</strong>30 June 2006$000ActualGroup30 June 2006$000Actual<strong>Council</strong>30 June 2005$000ActualGroup30 June 2005$000Net surplus before tax 8,381 8,543 1,725 1,839Prima facie tax @ 33% 2,766 2,819 569 607Tax effect of permanent differences (2,764) (2,764) (556) (556)Losses not recognised (2) (55) (13) (51)TOTAL TAX EXPENSE – – – –Tax expense comprises:Current taxation – – – –Deferred taxation – – – –TOTAL TAX EXPENSE – – – –ParentTax losses of $3,027,645 (2005: $3,034,397), tax effect of $999,123 (2005: $1,001,351), have not been recognised, but will beavailable for offset against future income derived by <strong>Council</strong> or any member of the same wholly owned group subject to legislativerequirements being met. It is not intended that any tax losses (2005: $nil ), will be used to offset against income derived by othergroup companies during the 2006 income tax year.ConsolidatedTax losses of $21,106,336 (2005: $21,276,477), tax effect of $6,965,091 (2005: $7,021,218), have not been recognised, but will beavailable for offset against future income derived by <strong>Council</strong> or any member of the same wholly owned group subject to legislativerequirements being met.4. EQUITYActual<strong>Council</strong>30 June 2006$000ActualGroup30 June 2006$000Actual<strong>Council</strong>30 June 2005$000ActualGroup30 June 2005$000ACCUMULATED FUNDSBalance at beginning of the year 402,540 403,176 403,605 404,127Net surplus after tax 8,381 8,543 1,725 1,839Interest allocated to reserves (749) (749) (458) (458)Other movements 300 300 – –Net transfers from reserves (285) (285) (2,332) (2,332)BALANCE AT END OF THE YEAR 410,187 410,985 402,540 403,176COUNCIL CREATED RESERVESBalance at beginning of the year 11,243 11,243 8,451 8,451Transfers to accumulated funds (976) (976) (921) (921)Transfers from accumulated funds 1,261 1,261 3,256 3,256Interest earned 747 747 457 457BALANCE AT END OF THE YEAR 12,275 12,275 11,243 11,243RESTRICTED RESERVESBalance at beginning of the year 52 52 52 52Transfers to accumulated funds – – (3) (3)Transfers in – – 1 1Notes to the Financial Statements101
4. EQUITYActual<strong>Council</strong>30 June 2006$000ActualGroup30 June 2006$000Actual<strong>Council</strong>30 June 2005$000ActualGroup30 June 2005$000Interest earned 2 2 2 2BALANCE AT END OF THE YEAR 54 54 52 52ASSET REVALUATION RESERVESLandBalance at beginning of the year 124,968 124,968 125,233 125,233Changes in asset value – – – –Revaluation attributed to assets sold or decommissioned andother movements (300) (300) (265) (265)BALANCE AT END OF THE YEAR 124,668 124,668 124,968 124,968BuildingsBalance at beginning of the year 32,884 32,884 33,684 33,684Changes in asset value* 555 555 – –Revaluation attributed to assets sold or decommissioned andother movements – – (800) (800)BALANCE AT END OF THE YEAR 33,439 33,439 32,884 32,884Roading InfrastructureBalance at beginning of the year 83,861 83,861 83,861 83,861Changes in asset value – – – –Revaluation attributed to assets sold or decommissioned andother movements – – – –BALANCE AT END OF THE YEAR 83,861 83,861 83,861 83,861Water InfrastructureBalance at beginning of the year 76,038 76,038 76,038 76,038Changes in asset value – – – –Revaluation attributed to assets sold or decommissioned andother movements – – – –BALANCE AT END OF THE YEAR 76,038 76,038 76,038 76,038Notes to the Financial StatementsTOTAL ASSET REVALUATION RESERVEBalance at beginning of the year 317,751 317,751 318,816 318,816Changes in asset value 555 555 – –Revaluation attributed to assets sold or decommissioned (300) (300) (1,065) (1,065)BALANCE AT END OF THE YEAR 318,006 318,006 317,751 317,751TOTAL EQUITYBalance at beginning of the year 731,586 732,222 730,924 731,446Movements during the year 8,936 9,098 662 776BALANCE AT END OF THE YEAR 740,522 741,320 731,586 732,222* Correction to asset revaluation reserve due to 2002 revaluation error.102
5. ACCOUNTS RECEIVABLE AND PREPAYMENTSActual<strong>Council</strong>30 June 2006$000ActualGroup30 June 2006$000Actual<strong>Council</strong>30 June 2005$000ActualGroup30 June 2005$000Trade receivables 1,656 1,753 1,588 1,717Rates receivable 1,826 1,826 1,825 1,825Due from Subsidiary Company 98 – – –Prepayments 367 369 840 840Sundry debtors 4,797 4,797 4,040 4,047GST receivable 1,132 1,132 916 916Provision for doubtful debts (557) (572) (610) (622)TOTAL ACCOUNTS RECEIVABLE AND PREPAYMENTS 9,319 9,305 8,599 8,7236. PROPERTY, PLANT AND EQUIPMENTActualDepreciation30 June 2006$000ActualCost/valuation30 June 2006$000ActualAcc Depn30 June 2006$000ActualBook value30 June 2006$000ActualCost/valuation30 June 2005$000ActualAcc Depn30 June 2005$000ActualBook value30 June 2005$000OPERATIONAL ASSETSLand 64 25,260 145 25,115 25,018 81 24,937Buildings 2,782 68,546 10,064 58,482 66,301 7,225 59,076Parking meters 77 789 307 482 742 229 513Office equipment 71 1,455 1,004 451 1,375 944 431Plant 391 4,348 2,052 2,296 4,206 1,679 2,527Recycling depots – 16 16 – 16 16 –Playground and reserve 73 1,555 940 615 1,383 866 517equipmentEDP equipment and 1,061 8,261 5,648 2,613 7,435 5,132 2,303softwareLibrary books 752 5,118 3,529 1,589 4,513 2,777 1,736Collections – 1,812 – 1,812 1,812 – 1,812Total operational assets 5,271 117,160 23,705 93,455 112,801 18,949 93,852INFRASTRUCTURE ASSETSLand – 100,131 – 100,131 100,226 – 100,226Seawalls 38 5,923 150 5,773 5,922 112 5,810Wharves 128 2,282 1,414 868 2,241 1,286 955Bridges 496 25,385 1,964 23,421 25,385 1,469 23,916Road structures 195 8,691 652 8,039 8,463 456 8,007Roading 5,534 247,570 20,300 227,270 237,561 14,766 222,795Streetlights 316 5,759 1,160 4,599 5,394 844 4,550Traffic signals 118 1,329 454 875 1,107 336 771Traffic signs 44 623 291 332 531 248 283Stormwater 1,685 92,809 6,595 86,214 89,941 4,911 85,030Water supply 2,395 80,273 9,421 70,852 78,377 7,025 71,352Bulk wastewater 3,776 119,132 14,742 104,390 118,003 11,025 106,978Less UHCC interest in bulkwastewater assets* (1,178) (37,291) (4,717) (32,574) (34,973) (3,539) (31,434)Local wastewater 1,573 57,934 6,355 51,579 55,623 4,723 50,900SCADA 147 1,463 582 881 1,458 433 1,025Resource consents 247 3,992 2,139 1,853 3,992 1,892 2,100Total infrastructure assets 15,514 716,005 61,502 654,503 699,251 45,987 653,264Notes to the Financial Statements103
6. PROPERTY, PLANT AND EQUIPMENTActualDepreciation30 June 2006$000ActualCost/valuation30 June 2006$000ActualAcc Depn30 June 2006$000ActualBook value30 June 2006$000ActualCost/valuation30 June 2005$000ActualAcc Depn30 June 2005$000ActualBook value30 June 2005$000RESTRICTED ASSETSLand 6 53,933 17 53,916 53,575 11 53,564Total restricted assets 6 53,933 17 53,916 53,575 11 53,564Sub total 20,791 887,098 85,224 801,874 865,627 64,947 800,680Joint venture assets 18 152 22 130 343 210 133TOTAL COUNCILPROPERTY, PLANT ANDEQUIPMENT 20,809 887,250 85,246 802,004 865,970 65,157 800,813SUBSIDIARY FIXED ASSETSSeaview marina 154 3,775 403 3,372 3,242 248 2,994TOTAL GROUPPROPERTY, PLANT ANDEQUIPMENT 20,963 891,025 85,649 805,376 869,212 65,405 803,807*Includes Upper <strong>Hutt</strong> <strong>City</strong> <strong>Council</strong>’s share of resource consentsASSETS UNDER CONSTRUCTIONActual<strong>Council</strong>30 June 2006$000ActualGroup30 June 2006$000Actual<strong>Council</strong>30 June 2005$000ActualGroup30 June 2005$000Buildings 9,153 9,153 2,762 2,762EDP equipment and software 462 462 742 742Seawalls – – 8 8Land 21 21 – –Plant 4 4 – –Bridges 255 255 94 94Road structures 33 33 61 61Roading 130 130 107 107Wharves – – 41 41Stormwater 1,002 1,002 – –Bulk wastewater 10,634 10,634 3,233 3,233Seaview Marina – 1 – 45TOTAL ASSETS UNDER CONSTRUCTION 21,694 21,695 7,048 7,093Notes to the Financial StatementsVALUATIONProperty, plant and equipment have been valued in accordance with the accounting policies set out on page 94. The valuationsincluded in the above figures are as follows:• Land and buildings were valued by Quotable Value New Zealand as at 1 July 2002. The valuer was Andrew ParkynB.Com(VPM),PG Dip (Com)• Infrastructure assets were valued by Beca Valuation Limited as at 1 July 2002, with the following exceptions:– Wharves were valued by Ian Macallan & Co Limited as at 1 July 1990– Infrastructure land under roads were valued by Quotable Value New Zealand as at 1 July 2002. The valuer wasAndrew Parkyn B.Com(VPM),PG Dip (Com)• The Beca Valuations Limited valuer was Brian Kellett, MIMechE,Ceng,Reng,MIPENZ,SNZPI,Reg Plant & MachineryValuer– Library literary assets were valued by library staff who are specialised in this area as at 1 July 2002– Wainuiomata and Silverstream landfills were valued by Quotable Value New Zealand as at 1 July 2002. The valuerwas Andrew Parkyn B.Com(VPM), PG Dip (Com).104
7. INVESTMENT IN SUBSIDIARIESActual<strong>Council</strong>30 June 2006$000ActualGroup30 June 2006$000Actual<strong>Council</strong>30 June 2005$000ActualGroup30 June 2005$000SEAVIEW MARINA LIMITEDBalance at beginning of the year 2,495 – 2,495 –BALANCE AT END OF THE YEAR 2,495 – 2,495 –HUTT HOLDINGS LIMITEDBalance at beginning of the year 50 – 50 –BALANCE AT END OF THE YEAR 50 – 50 –<strong>Hutt</strong> Holdings Limited and Seaview Marina Limited are 100% owned subsidiaries.8. INVESTMENT IN ASSOCIATESActual<strong>Council</strong>30 June 2006$000ActualGroup30 June 2006$000Actual<strong>Council</strong>30 June 2005$000ActualGroup30 June 2005$000WELLINGTON WATER MANAGEMENT LIMITEDBalance at beginning of the year 224 224 224 224BALANCE AT END OF THE YEAR 224 224 224 224Wellington Water Management Limited was set up in 2004 to manage <strong>Hutt</strong> <strong>City</strong> <strong>Council</strong> and Wellington <strong>City</strong> <strong>Council</strong> water assets.Wellington Water Management Limited endeavours to breakeven, with all costs being funded by the two councils.Ownership is shared by the two councils in the following proportions:Shares on issue <strong>Hutt</strong> <strong>City</strong> Wellington <strong>City</strong>Class A shares (voting entitlements) 300 150 150Class B shares (financial entitlements) 300 112 1889. OTHER ASSETSActual<strong>Council</strong>30 June 2006$000ActualGroup30 June 2006$000Actual<strong>Council</strong>30 June 2005$000ActualGroup30 June 2005$000OTHER ASSETS - NON-CURRENT PORTIONNZ Local Government Insurance Company 234 234 234 234Community loans 173 173 193 193Smartlynx 3 Limited 75 75 55 55Other assets 145 145 145 145Provision for community loans and other assets (254) (254) (268) (268)Total other assets - non-current portion 373 373 359 359TOTAL OTHER ASSETS 373 373 359 359Notes to the Financial Statements105
10. JOINT VENTURE<strong>Council</strong> has a 7% participating interest in the Silverstream Gas Joint Venture. The principal activity of the joint venture isconverting gas to electricity.SHARE OF ASSETS EMPLOYEDThe joint venture’s unaudited results for the year ended 30 June 2006 are included in these Financial Statements under theclassifications shown below:Actual<strong>Council</strong>30 June 2006$000ActualGroup30 June 2006$000Actual<strong>Council</strong>30 June 2005$000ActualGroup30 June 2005$000Share of revenue 91 91 45 45Share of expenses (70) (70) (54) (54)SHARE OF NET SURPLUS/(DEFICIT) 21 21 (9) (9)Property, plant and equipment 130 130 133 133Accounts receivable 75 75 57 57Accounts payable (2) (2) (7) (7)TOTAL SHARE OF ASSETS EMPLOYED 203 203 183 18311. PUBLIC DEBTThese are loans raised by <strong>Council</strong> for its various activities and projects. The details are:Actual<strong>Council</strong>30 June 2006$000ActualGroup30 June 2006$000Actual<strong>Council</strong>30 June 2005$000ActualGroup30 June 2005$000Current portion 49,085 49,085 48,153 48,153Non-current portion 25,370 25,370 25,403 25,403TOTAL PUBLIC DEBT 74,455 74,455 73,556 73,556PUBLIC DEBT MATURITY PROFILENotes to the Financial StatementsActualInterest cost30 June 2006$000Actual<strong>Council</strong>30 June 2006$000ActualGroup30 June 2006$000Actual<strong>Council</strong>30 June 2005$000ActualGroup30 June 2005$000Years of Repayment2005/2006 2,259 – – 48,153 48,1532006/2007 915 49,085 49,085 – –2007/2008 7 70 70 70 702008/2009 1 18 18 24 242009/2010 833 15,005 15,005 15,005 15,0052010/2011 2 55 55 60 602011 onwards 718 10,222 10,222 10,244 10,244TOTAL PUBLIC DEBT 4,735 74,455 74,455 73,556 73,556SECURITYA debenture trust deed has been established and Perpetual Trust Limited appointed as Trustee. All public debt is secured by acharge over all rating in favour of the Trustee.106
12. CREDIT FACILITIES<strong>Council</strong> has an undrawn $25 million wholesale advance facility with Westpac and an undrawn $30 million wholesale facility withANZ Banking Group. The Facilities are secured under the Debenture Trust Deed described in note 11.13. EMPLOYEE ENTITLEMENTSActual<strong>Council</strong>30 June 2006$000ActualGroup30 June 2006$000Actual<strong>Council</strong>30 June 2005$000ActualGroup30 June 2005$000Time in lieu 10 10 10 10<strong>Annual</strong> leave 1,237 1,237 1,132 1,132Long service leave 32 32 20 20Retirement gratuities 538 538 502 502TOTAL EMPLOYEE ENTITLEMENTS 1,817 1,817 1,664 1,664Disclosed as follows:Current 1,247 1,247 1,142 1,142Non-current 570 570 522 522TOTAL EMPLOYEE ENTITLEMENTS 1,817 1,817 1,664 1,66414. OTHER LIABILITIESActual<strong>Council</strong>30 June 2006$000ActualGroup30 June 2006$000Actual<strong>Council</strong>30 June 2005$000ActualGroup30 June 2005$000OTHER LIABILITIES – CURRENT PORTIONAccrued interest expenses 403 403 439 439Other accrued expenses 13,693 13,728 9,495 9,522Due to subsidiary companies – – 44 –Third party funds 150 150 127 127Miscellaneous current liabilities 2,016 2,016 1,294 1,294Total other liabilities – current portion 16,262 16,297 11,399 11,382OTHER LIABILITIES – NON-CURRENT PORTIONProvision for landfill aftercare** 2,813 2,813 2,716 2,716Total other liabilities – non-current portion 2,813 2,813 2,716 2,716TOTAL OTHER LIABILITIES 19,075 19,110 14,115 14,098MOVEMENTS IN PROVISIONS LandfillAftercare$000Balance at beginning of the year 2,716Additional provisions made during the year 169Amounts charged to provision during the year (72)BALANCE AT END OF THE YEAR 2,813** PROVISION FOR LANDFILL AFTERCARE<strong>Council</strong> has financial commitments for the costs associated with its future obligations for final closure and post-closure obligationswith respect to landfills it owns. Estimates for final closure and post closure costs are developed using input from <strong>Council</strong>’sengineers and accountants and are reviewed by management, typically at least once a year.Closure responsibilities include final cover and application of vegetation, completing facilities for leachate collection, water qualityand gas monitoring.Notes to the Financial Statements107
Post closure activities include leachate, water and gas monitoring and remedial measures such as ongoing site maintenance fordrainage systems, final cover and vegetation.<strong>Council</strong> currently operates two landfills. These are Silverstream (Stage 1) and Wainuiomata. These landfills have a remaining capacityof 227,000 (2005: 300,000) cubic metres (eighteen months) and 332,500 (2005: 290,000) cubic metres (six years) respectively. <strong>Council</strong>is also monitoring gas, leachate, and water for five closed landfills identified as potential risks.The long term nature of the liability means that there are inherent uncertainties in estimating costs that will be incurred.The provision has been estimated taking into account existing technology and is discounted at a rate of 6.65% (2005: 6.67%).The accounting treatment of this provision is described in detail in the Statement of Accounting Policies.15. RECONCILIATION OF NET SURPLUS AFTER TAX WITH CASH FLOWS FROM OPERATING ACTIVITIESActual Actual<strong>Council</strong> Group30 June 2006 30 June 2006$000 $000Actual<strong>Council</strong>30 June 2005$000ActualGroup30 June 2005$000NET SURPLUS AFTER TAX 8,381 8,543 1,725 1,839Add/(less) non-cash items:Depreciation 20,809 20,963 20,198 20,340Interest income accrued to investments and special funds (31) (12) (40) (40)Bad debt expense and other non-cash items 940 940 (23) (23)Add/(less) movements in working capital:Increase in accounts receivable and other assets (876) (836) (285) (325)Increase/(decrease) in creditors 1,249 1,285 (1,892) (1,889)Increase in provisions and other liabilities 3,287 3,286 764 763Add/(less) items classified as investing activities:Profit on sale of property, plant and equipment andother movements(1,901) (1,919) (166) (183)NET CASH FLOWS FROM OPERATING ACTIVITIES 31,858 32,250 20,281 20,48216. TRANSACTIONS WITH RELATED PARTIESThe <strong>Council</strong> had the following material transactions:WITH SEAVIEW MARINA LIMITEDDuring the year <strong>Council</strong> repaid advances to Seaview Marina Limited totalling $41,249 (2005: <strong>Council</strong> repaid $319,355).Total advances outstanding at 30 June 2006 amounted to $nil (2005: $40,978). Interest is charged on outstanding advances atmarket rates and amounted to $271 for the year ended 30 June 2006 (2005: $9,358).During the year <strong>Council</strong> provided loan funding for Seaview Marina Limited. Interest is payable at the 90 day bank bill rate plus2% margin. The amount outstanding at balance date was $103,879 (2005: $nil).Notes to the Financial StatementsInterest charged on this loan amounted to $9,308 for the year ended 30 June 2006 (2005: $nil).For the year ended 30 June 2006, the <strong>Council</strong> charged Seaview Marina Limited $14,000 as professional service fees (2005: $22,451).WITH HUTT HOLDINGS LIMITEDDuring the year <strong>Hutt</strong> Holdings advanced to <strong>Council</strong> $2,364 (2005: <strong>Hutt</strong> Holdings advanced to <strong>Council</strong> $30,809).Total advances outstanding at 30 June 2006 amounted to $5,841 (2005: $3,477). Interest is charged on outstanding advances atmarket rates and amounted to $441 for the year ended 30 June 2006 (2005: $1,024).WITH WELLINGTON WATER MANAGEMENT LIMITEDFor the year ended 30 June 2006, <strong>Council</strong> charged Wellington Water Management Limited $12,287 (2005: $21,968), for services provided.For the year ended 30 June 2006, Wellington Water Management Limited charged <strong>Council</strong> $1,016,334 for professional service fees(2005: $1,000,191).As at 30 June 2006 <strong>Council</strong> owed Wellington Water Management Limited $nil (2005: $119,268).As at 30 June 2006 Wellington Water Management Limited owed <strong>Council</strong> $833 (2005: $16).108
WITH COUNCILLORS AND COMMUNITY BOARD AND WARD COMMITTEE MEMBERSDuring the year ended 30 June 2006, <strong>Council</strong> transacted business on normal commercial terms with Kevin Hislop Architects,a business managed by Kevin Hislop husband of <strong>Council</strong>lor Deborah Hislop, for $3,704 (2005: $11,570). The amount payableas at 30 June 2006 was $nil (2005: $nil). These transactions related to the provision of architectural services.During the year ended 30 June 2006, <strong>Council</strong> transacted business on normal commercial terms with DTS Limited for $19,156(2005: $nil). The chair of the Northern Ward Committee, Steve Ritchie, has a shareholding in DTS Limited and is managing director.The amount payable as at 30 June 2006 was $nil (2005: $nil). These transactions related to the provision of internet services.During the year ended 30 June 2006, <strong>Council</strong> transacted business on normal commercial terms with Smartlinx3 Limited for $86,728(2005: $40,000). The chair of the Northern Ward Committee, Steve Ritchie, is a director in Smartlinx3, and an 11% shareholding inSmartlinx3 is held by DTS Investments Limited of which Steve Ritchie is also a shareholder and director. <strong>Council</strong> also has an 11%shareholding in Smartlinx3 Limited. The amount payable as at 30 June 2006 was $2,614 (2005: $nil). These transactions relatedto the provision of network capability to enable internet provision services and payment for calls on share capital issued by thecompany to <strong>Council</strong>.During the year ended 30 June 2006, <strong>Council</strong> transacted business with Development Wainuiomata for $44,804 (2005: $46,325).<strong>Council</strong>lor Ray Wallace is the voluntary president of Development Wainuiomata. The amount payable as at 30 June 2006 was$1,969 (2005: $nil). These transactions related to the payment of a grant by <strong>Council</strong>.During the year ended 30 June 2006, <strong>Council</strong> transacted business on normal commercial terms with the <strong>Hutt</strong> Valley District HealthBoard for $64,755 (2005: $1,125). Mayor David Ogden and <strong>Council</strong>lor Ray Wallace are Board members of the <strong>Hutt</strong> Valley DistrictHealth Board. The amount payable as at 30 June 2006 was $nil (2005: $1,125). These transactions related to the provision of healthservices.During the year ended 30 June 2006, <strong>Council</strong> transacted business on normal commercial terms with The Open Polytechnic ofNew Zealand for $2,060 (2005: $565). Mayor David Ogden is a member of The Open Polytechnic of New Zealand <strong>Council</strong>.The amount payable as at 30 June 2006 was $nil (2005: $nil). These transactions related to the provision of training services.17. FINANCIAL INSTRUMENTS<strong>Council</strong> and the Group are risk averse and seek to minimise exposure arising from their treasury activities. <strong>Council</strong> has establisheda Treasury Policy specifying what transactions can be entered into. The policy does not allow any transactions which are speculativein nature.CREDIT RISKFinancial instruments which potentially subject <strong>Council</strong> and the Group to credit risk principally consist of cash and on call deposits,accounts receivable, sinking funds, other assets, financial guarantees and interest rate swaps and options.Credit risk is minimised as a result of several key controls:• maintaining maximum limits for each broad class of counterparty and individual counterparties• limiting investments to organisations with a long term Standard & Poor’s credit rating of A+ or better• controlling the level and spread of accounts receivable outstanding.As a result of these controls there are no significant concentrations of credit risk.The maximum exposure to credit risk as at balance date was:Actual<strong>Council</strong>30 June 2006$000ActualGroup30 June 2006$000Actual<strong>Council</strong>30 June 2005$000ActualGroup30 June 2005$000Cash and short term deposits 5,041 5,078 5,529 5,539Accounts receivable 8,952 8,936 7,759 8,201Sinking funds 233 233 216 216Other assets 373 373 359 359Financial guarantees 450 450 699 699Interest rate swaps and options 791 791 824 824The maximum exposures shown above are net of any recognised provisions for losses on these financial instruments. <strong>Council</strong> andthe Group hold security for certain amounts included in accounts receivable and other investments.Notes to the Financial Statements109
CURRENCY RISK<strong>Council</strong> and the Group had no exposure to currency risk at 30 June 2006 (2005: $nil).INTEREST RATE RISKThe following tables identify the periods in which interest rates are subject to review on financial instruments and provides theweighted average interest rate for each item. These tables are for <strong>Council</strong>. Group tables have not been produced because theinterest rate repricing analysis would not differ materially from that of <strong>Council</strong>.Effectiveinterest ratesLess than1 year30 June 2006$000Between1–2 years30 June 2006$000Between2–5 years30 June 2006$000Greater than5 years30 June 2006$000Total30 June 2006$000AssetsCash and short term deposits 7.25% 5,041 – – – 5,041Sinking funds 7.35% 142 91 – – 2335,183 91 – – 5,274LiabilitiesBank overdraft 7.25% (2,012) – – – (2,012)Public debt 7.03% (49,085) (70) (15,078) (10,222) (74,455)Off-balance sheetInterest rate swaps and options 6.54% 42,000 (5,000) (16,000) (21,000) –NET INTEREST RATE REPRICING (3,914) (4,979) (31,078) (31,222) (71,193)Effectiveinterest ratesLess than1 year30 June 2005$000Between1–2 years30 June 2005$000Between2–5 years30 June 2005$000Greater than5 years30 June 2005$000Total30 June 2005$000AssetsCash and short term deposits 6.75% 5,529 – – – 5,529Sinking funds 7.01% 132 – 84 – 2165,661 – 84 – 5,745LiabilitiesBank overdraft 6.75% (2,132) – – – (2,132)Public debt 6.72% (49,085) (70) (15,078) (10,222) (74,455)Off-balance sheetInterest rate swaps and options 6.85% 43,000 (16,000) (6,000) (21,000) –NET INTEREST RATE REPRICING (1,624) (16,000) (21,015) (31,304) (69,943)Notes to the Financial StatementsFAIR VALUE OF FINANCIAL INSTRUMENTSThe following fair value calculations are for <strong>Council</strong>. Group tables have not been produced because the fair value calculationswould not differ materially from that of <strong>Council</strong>. The following methods and assumptions were used to estimate the fair value ofeach class of instrument.Cash and short term deposits, accounts receivable, other assets, bank overdraft, accounts payable, deposits held andother liabilitiesThe book value of these items is equivalent to their fair value. As such, they have been excluded from the table below.Sinking funds and other assetsGenerally based on discounted cash flows using the investment rate management would expect to be available to <strong>Council</strong> and theGroup for investments of a similar maturity as at balance date. Fair values of unlisted shares are estimated by reviewing the netasset backing calculated from the latest available financial <strong>report</strong>s.110
Public debtBased on discounted cash flows using the borrowing rate management would expect to be available to <strong>Council</strong> and the Group fordebt of a similar maturity as at balance date.Interest rate swaps and optionsBased on valuations provided by <strong>Council</strong>’s bankers.Book value30 June 2006$000Fair value30 June 2006$000Book value30 June 2005$000Fair value30 June 2005$000AssetsSinking funds 233 233 216 216LiabilitiesPublic debt 74,455 73,650 73,556 73,137Off-balance sheetInterest rate swaps and options – (238) – (784)18. REMUNERATIONThe Chief Executive of the <strong>Hutt</strong> <strong>City</strong> <strong>Council</strong> received a salary (including bonus) of $246,118 for the year ended 30 June 2006(2005: $218,444). In terms of his contract the Chief Executive also received the following additional benefit:Motor Vehicle: $19,481 (2005: $24,151)For the year ended 30 June 2006, the total cost, including performance bonus, fringe benefit tax, of the remuneration packagereceived by the Chief Executive was $265,599 (2005: $242,595).Remuneration of Elected Representatives<strong>Council</strong>RemunerationDirectorFeesTotalRemuneration30 June 2006$TotalRemuneration30 June 2005$$$Mayor and <strong>Council</strong>lorsDK Ogden (Mayor) 95,077 – 95,077 69,129J Terris (Mayor)* – – – 29,236RW Styles (Deputy Mayor) 56,053 10,000 66,053 54,170WR Wallace (Deputy Mayor)* 48,443 10,000 58,443 64,267J Austad* – – – 15,211JMK Baird 48,103 – 48,103 43,699GD Barratt 48,613 – 48,613 43,699MJ Cousins 50,063 – 50,063 41,680S Dalziel* – – – 9,277J Engelbretsen 41,929 – 41,929 37,761A Finlayson 49,433 – 49,433 45,728D Hislop 41,829 – 41,829 29,879VR Jamieson 50,709 – 50,709 46,737C Milne 41,999 – 41,999 28,367TE Pollard 45,018 – 45,018 32,891JM Sylvester* – – – 19,485Total 617,269 20,000 637,269 611,216* To October 2004.Notes to the Financial Statements111
Severance PaymentsSeverance payments include any consideration (monetary or non-monetary) provided to any employee in respect of the employee’sagreement to the termination of their employment with <strong>Council</strong>.30 June 2006 30 June 2005Severance payments $nil $1,564Number of employees none one19. COMMITMENTS AND CONTINGENCIESCAPITAL COMMITMENTSCommitments for capital expenditure contracted, but not provided for:Actual<strong>Council</strong>30 June 2006$000ActualGroup30 June 2006$000Actual<strong>Council</strong>30 June 2005$000ActualGroup30 June 2005$000TOTAL CAPITAL COMMITMENTS 4,397 4,397 5,717 5,717OPERATING COMMITMENTSCommitments for non-cancellable operating leases and other operating commitments:Actual<strong>Council</strong>30 June 2006$000ActualGroup30 June 2006$000Actual<strong>Council</strong>30 June 2005$000ActualGroup30 June 2005$000Less than one year 1,888 1,888 1,844 1,844Between one and two years 1,692 1,692 1,759 1,759Between two and five years 2,948 2,948 2,967 2,967Greater than five years – – – –TOTAL OPERATING COMMITMENTS 6,528 6,528 6,570 6,570CONTINGENCIESThe <strong>Council</strong> has guaranteed the borrowings of certain sports and social clubs. The total of these guarantees as at 30 June 2006 was$449,924 (2005:$699,065).<strong>Council</strong> has entered into a cancellable contract for the operation of the wastewater treatment plant and associated facilities. Theremaining term of the contract is 15 years and payments are calculated based on volume. Minimum payments due under thecontract in the event of cancellation total $4.9 million (2005: $4.9 million).Notes to the Financial StatementsA number of legal actions are being taken against the <strong>Council</strong>. If successful, <strong>Council</strong>’s financial exposure is minimal (2005:minimal)as these actions are covered by <strong>Council</strong>’s insurers.112
20. MAJOR BUDGET VARIATIONSExplanations for major variations from <strong>Council</strong>’s budget figures in the 2005/2006 Community Plan are as follows:STATEMENT OF FINANCIAL PERFORMANCEThe net surplus after tax was $3.0 million above budget for the year ended 30 June 2006. The components of this favourable resultare explained below.Operating revenue was above budget by $4.0 million for the year ended 30 June 2006. The following major items contributed tothis variance:• Rates revenue was above budget by $0.6 million as a result of variations in the rating base• User charges were above budget by $0.8 million. Additional revenue was achieved from parking and landfill services• Subsidies received were below budget by $1.6 million as some planned capital expenditure was deferred to the 2007financial year• Regulatory revenue was above budget by $0.8 million as a result of increased activity in the <strong>City</strong>• Revenue from penalties was above budget by $0.2 million• Interest revenue was $0.1 million above budget• An unbudgeted profit on sale of property of $1.9 million was recognised• Miscellaneous revenue was above budget by $1.1 million. This includes assets vested in <strong>Council</strong> by developers valued at$0.6 million. There was no budget for vested assets.Operating expenditure was above budget by $1.0 million for the year ended 30 June 2006. The following major items contributedto this variance:• Interest expense was $0.5 million below budget and depreciation expense was $0.3 million below budget. Both variances weredue to capital project expenditure occurring later than planned• Personnel costs were above budget by $0.2 million and other expenses were above budget by $0.2 million• Unbudgeted asset write-offs mainly related to the cancelled Korohiwa development of $1.4 million.The net surplus after tax has been used to repay debt after adjusting for items not having a cash flow nature and items supportingcapital expenditure.STATEMENT OF MOVEMENTS IN EQUITYVariances in the net surplus after tax have been commented on under the Statement of Financial Performance above. There are noother major budget variations in the Statement of Movements in Equity.STATEMENT OF FINANCIAL POSITIONThe actual financial position at 30 June 2006 is very close to budget. The only significant variances are explained below.Assets under construction are $21 million above budget as several large projects were incomplete at 30 June 2006 and not yetcapitalised. Property, plant and equipment is below budget as a result.The current portion of public debt is below budget by approximately $11 million, with the term portion of public debt abovebudget by a corresponding amount. <strong>Council</strong> replaced $10 million of 90-day commercial paper with a ten-year note.STATEMENT OF CASH FLOWSThe budget variations explained above also contribute to budget variations in the Statement of Cash Flows, particularly cash flowsfrom operating activities.Cash provided from the sale of property, plant and equipment was below budget by $8 million as planned sales were not able to becompleted during the year.Cash applied to the purchase and construction of property, plant and equipment was below budget by $7 million as certainprojects were not able to be completed and have been carried over into the 2007 financial year.Notes to the Financial Statements113
Financial Summary ofMajor Capitaland Operating ProjectsFor the year ended 30 June 2006Projects with a budget over $100,000Actual30 June 2006$000Plan30 June 2006$000LibrariesCapital ProjectsLibrary stock replacement $605 $662MuseumsCapital ProjectsDowse upgrade ($1,348,000 carried over to 2006/07) (subsidised 67%) $2,800 $4,120Aquatics and RecreationCapital ProjectsHuia Pool ventilation and heating plant replacement ($170,000 carried over to 2006/07) $0 $170Naenae Pool bulkhead replacement $0 $150Parks and ReservesOperating ProjectsPines removal Ferry Road $183 $150Problem tree removal $251 $185Financial Summary of Major Capital and Operating ProjectsCapital Projects<strong>Hutt</strong> Park sports zone ($280,000 carried over to 2006/07) $22 $295<strong>Hutt</strong> Park village green ($348,000 carried over to 2006/07) $57 $405Korohiwa landscape development (works cancelled while options for the site are re-evaluated) $0 $500Memorial Park Grandstand upgrade $454 $455Percy Scenic Reserve SH2 development ($110,000 carried over to 2006/07) $40 $150Playground equipment replacement $111 $110Sportsground building maintenance $154 $150Walter Nash Stadium mortgage ($180,000 carried over to 2006/07) $0 $180Walter Nash Stadium stage 3 upgrade $527 $500Community SupportOperating ProjectsCommunity development contestable fund $201 $206Community houses fund $188 $188Marae funding $108 $100Phonic youth centre $117 $117Safety initiatives $299 $280Community PropertyCapital ProjectsTown Hall upgrade $285 $283114
For the year ended 30 June 2006Projects with a budget over $100,000Actual30 June 2006$000Plan30 June 2006$000Roading and TrafficCapital ProjectsArea wide pavement treatment (subsidised 46%) $384 $265Eastern bays walkway (generally subsidised 55%, plus unplanned subsidies of $363,000 from$761 $278the oil companies)Footpath resurfacing and replacement $394 $200Jackson Street improvements $234 $250Maintenance chip sealing (subsidised 45%) $4,235 $4,370Moores Valley Road bridge replacement ($538,400 carried over to 2006/07) (subsidised 73%) $87 $628Residential road lighting $168 $160Road smoothing (subsidised 55%) $304 $282Silverstream Bridge strengthening ($425,000 carried over to 2006/07) (subsidised 55%) $74 $500Sub-standard road upgrading Hill Road $258 $250Traffic safety improvements (subsidised 55%) $659 $672Traffic signal replacement (subsdised 45%) $107 $120Traffic signals Woburn Road (subsidised 54%) $115 $170Water SupplyCapital ProjectsGracefield reservoir structural upgrade ($400,000 carried over to 2006/07) $0 $400Mains renewals Chittick Street $111 $118Mains renewals Jackson Street $440 $375Mains renewals Konini Street $89 $102Mains renewals Thomas Street $265 $165WastewaterCapital ProjectsExcess flow management - Silverstream peak flow storage facility (subsidised 32%) $7,330 $7,290Minor works on local wastewater pipes $188 $142New sewer at Te Whiti Grove $97 $170Sewer pressure testing $402 $300Sewer renewal <strong>Hutt</strong> Road/Hume Street $135 $200Sewer renewal Jackson Street $405 $400Sewer renewal Peel Place to Gibbs Crescent $289 $320Sewer renewal Pukatea Street $100 $100Sewer renewal Whites Line East & Leighton Avenue $757 $770Te Marua pumping station rising main ($235,000 carried over to 2006/07) (subsidised 51%) $0 $235Trunk wastewater asset replacement (subsidised 29%) $600 $620Trunk wastewater network development ($1,200,000 carried over to 2006/07) (subsidised 29%) $190 $1,290Trunk wastewater pipeline replacement ($191,000 carried over to 2006/07) (subsidised 29%) $9 $200Trunk wastewater project management (subsidised 29%) $77 $130StormwaterCapital Projects<strong>Hutt</strong> River floodplain outlet upgrade $344 $350Mains renewal Marine Drive (Lowry Bay) $147 $150Mains upgrade Jackson Street $280 $280New pumping station for Opahu Stream ($900,000 carried over to 2006/07) $1,002 $1,500Pukatea Street improvements $206 $200Financial Summary of Major Capital and Operating Projects115
For the year ended 30 June 2006Projects with a budget over $100,000Actual30 June 2006$000Plan30 June 2006$000Wainuiomata Black Creek improvements $1,493 $1,500Solid WasteCapital ProjectsSilverstream Landfill, stage one closure $0 $100Silverstream Landfill, stage one resource consent work $0 $100Silverstream Landfill, stage two design and construction ($400,000 carried over to 2006/07) $3,847 $3,940Local Urban DesignOperating ProjectsRapid response anti-graffiti service $126 $150Capital ProjectsCBD development (‘Masterplan’) $1,131 $1,230Suburban shopping centres $247 $250Economic DevelopmentOperating ProjectsBusiness <strong>Hutt</strong> Valley $240 $240Economic Development Strategy $103 $150Events funding (additional external support was received offsetting this expenditure) $357 $245Positively Wellington Business (Regional Economic Developmnent Agency) $410 $410Regional Development Strategy $60 $100Capital ProjectsSeaview/Gracefield developments $0 $100Wingate industrial area development ($100,000 carried over to 2006/07) $220 $350Financial Summary of Major Capital and Operating ProjectsManaging ServicesOperating Projects<strong>Hutt</strong> <strong>City</strong> promotion $195 $200Capital ProjectsArchives storage $106 $100Core application replacement programme ($56,000 carried over to 2006/07) $150 $200Core business software enhancement ($22,000 carried over to 2006/07) $172 $140Electronic document management ($100,000 carried over to 2006/07) $81 $200Library software replacement ($760,000 carried over to 2006/07) $102 $1,000PC replacement programme $306 $327116
<strong>Council</strong>-ControlledOrganisationsSeaview Marina Limited 1EXTENT TO WHICH COUNCIL’S POLICIES AND OBJECTIVES IN REGARD TO OWNERSHIP AND CONTROL OF THEORGANISATION HAVE BEEN IMPLEMENTEDFrom 1 April 2003, this company assumed responsibility for and ownership of the Seaview Marina. This is the key role of thiscompany.Nature and scope of its activities<strong>Council</strong>’s expects this company to own and operate the Seaview Marina as a facility for the enjoyment of the <strong>Hutt</strong> <strong>City</strong> communitywithout compromising its commercial objectives and environmental responsibilities.The results shown against the key performance targets below indicate that the business has been managed successfully. Publicaccess to the Marina has been maintained throughout the year.Key Performance TargetsAchieve a rate of return on shareholders funds of 5% beforetaxationAchieve the following capital development programme targetsfor the marina complex before 30 June 2006:Level of Achievement2006: Achieved2006: Achieved• Complete the building of an ablution/administration block;• Investigate the development of enclosed maintenancefacilities.Ensure everything complies with financial, building, technicaland regulatory standardsEnsure property and asset maintenance is carried out inaccordance with asset management plans and to bestapplicable trade standards and practice.2006: Achieved2006: Achieved<strong>Hutt</strong> Holdings LimitedEXTENT TO WHICH COUNCIL’S POLICIES AND OBJECTIVES IN REGARD TO OWNERSHIP AND CONTROL OF THEORGANISATION HAVE BEEN IMPLEMENTED.This company managed the Centre <strong>City</strong> Plaza Building prior to the sale of those properties in July 2002. Now that the company’sinterests in the plaza are finalised, the company is being retained for future use not yet determined.Nature and scope of its activities• The company is essentially non-trading.Key Performance TargetsProvide <strong>report</strong>s to officers in accordance with performancemonitoring requirements under the Local Government Act2002.Level of Achievement2006: Achieved1For more information on these companies, see their statements of intent, which are available after 1 July each year.<strong>Council</strong>-Controlled Organisations117
Wellington Water Management Ltd (WWML) Trading as Capacity 1EXTENT TO WHICH COUNCILS POLICIES AND OBJECTIVES IN REGARD TO OWNERSHIP AND CONTROL OF THEORGANISATION HAVE BEEN IMPLEMENTED<strong>Council</strong>’s objective for this company is for it to manage the provision of water services to <strong>Hutt</strong> <strong>City</strong> <strong>Council</strong> and Wellington <strong>City</strong><strong>Council</strong>. The company has operated successfully in this capacity during the year.Nature and scope of its activities<strong>Council</strong> expects the company to manage, for the long term, the water, wastewater and stormwater assets of the shareholdingcouncils and to operate as a successful business, managed on a non-profit basis.The results shown against the key performance targets below indicate that the business has been managed successfully.Key Performance TargetsAchieve total overall savings of $4.175m to shareholdingcouncils after five years and $1.6m annually thereafter.Achieve targets within allocated budgets.Ensure business operation complies with financial, technicaland regulatory standards.Develop asset management plans as required that reflect bestpractice or meet specific requirements for approval by theappropriate organisation.Ensure infrastructure asset maintenance is carried outin accordance with asset management plans and to bestapplicable trade standards and practice.Meet the performance measures set by shareholders in servicecontracts or service level agreements, including managingemergencies.Level of AchievementUnder the service level agreement between Capacity, <strong>Hutt</strong> <strong>City</strong><strong>Council</strong> and Wellington <strong>City</strong> <strong>Council</strong>, a savings model has to beapproved by shareholders before savings can be <strong>report</strong>ed. Asavings model developed by Capacity is currently under reviewby the shareholders.Achieved – targets achieved within budgetAchieved – All standards have been complied with.The exception was during the August 2004 floods which causeddebris to block approx 200m of stormwater main in Lowry Bay.To mitigate future blockage a debris arrestoe/gabion wasinstalled in the stream under the ‘emergency works’ category.GWRC subsequently advised a resource consent was requiredand issued a ‘minor’ infringement notice.Achieved – Asset Management Plans for water, stormwater andwastewater are on target to be completed by August 2006.Achieved – Asset maintenance has been carried out inaccordance with asset management plans.Nine out of ten performance measures were achieved. Thecustomer satisfaction level for stormwater was not achieved.64% surveyed were satisfied or fairly satisfied against a peeraverage target of 70%. This is due to localised flooding in thecity during the year. This is an improvement on 2005 of 59%satisfaction.<strong>Council</strong>-Controlled Organisations1For more information on these companies, see their statements of intent, which are available after 1 July each year.118
Wellington Regional Economic Development Trust (operating name Positively WellingtonBusiness (‘PWB’) 1EXTENT TO WHICH COUNCILS Policies AND OBJECTIVES IN REGARD TO OWNERSHIP AND CONTROL OF THEORGANISATION HAVE BEEN IMPLEMENTEDThe <strong>Council</strong> has an economic development strategy that includes encouraging economic activity and co-operation on a “greaterWellington” or regional basis. PWB is a jointly held CCO (trading as Positively Wellington Business ‘PWB’) with Wellington, Poriruaand Upper <strong>Hutt</strong> <strong>City</strong> <strong>Council</strong>s, and Kapiti Coast District <strong>Council</strong>, which was established to ensure there is opportunity for co-operationwith Government, the private sector and Iwi, and with the ability for other territorial local authorities to participate in specificprogrammes and projects. It has mostly achieved its key performance targetsNature and scope of its activities<strong>Council</strong> expects the company to facilitate, promote and foster development of a dynamic and innovative economy in theWellington region for the benefit of the people of the Wellington region by:• Encouraging and assisting in the establishment, retention and development of sustainable, new and existing businesses• Promoting new investments• Developing viable employment opportunities• Marketing business opportunities• Working with local, regional and central government and other providers of services within the Wellington regionKey Performance TargetsWork within approved budget and Business Plan.Work within and <strong>report</strong> on the approved Strategic Plan andStatement of Intent.Growth in GDP.Growth in businesses and new investment.Level of AchievementAchieved: PWB has worked within its approved budget andBusiness Plan up to 31 March 2006. End of year accounts to besigned off by PWB Board 14 August 2006.Achieved: PWB has worked within its approved Strategic Planand Statement of Intent.Partly Achieved: GDP growth in the region was 5.5% comparedto national GDP growth of 4.2%. Of 5 targeted sectors all hadpositive growth but only Education and Manufacturing hadGDP growth higher than the national average.Partly Achieved: The number of new businesses in theregion grew by 2.4%. Three of 5 targeted sectors showedpositive growth in the number of businesses. $5.2m of directinvestment was attracted against a target of $18m.Job Creation.Development and improvement of comparative strengths.Number and value of collaborative international contract bidswon by cluster members.Partly Achieved: The number of jobs in the region grew by5.8%. PWB achieved 5 new jobs in the region through directtargeted investment against a target of 50 and 64 skilledmigrants were helped into employment against a target of 40.Three of 5 targeted sectors showed positive job growth.Partly Achieved: Of the 5 targeted sectors 4 sectors maintainemployment location quotients above the national averageof 1. For 2005 the location quotient for Education was 1.15,resulting in a 0.3% decrease in jobs on 2004. For ICT it was 1.74,a 6% increase in jobs on 2004, for Professional Engineeringit was 1.21, a 7.3% increase in jobs on 2004, for CreativeIndustries (incl. Film) it was 1.14, a 1.2% decrease in jobs andfor Manufacturing it was 0.53 a 2.1% increase in jobs.Partly Achieved: The Professional Services achieved exportcontracts valued at $2.24m against a target of $4.5m. The ICTsector earned $3.19m from collaborative contracts against atarget of $3m.1For more information on these companies, see their statements of intent, which are available after 1 July each year.<strong>Council</strong>-Controlled Organisations119
Statement of Intent MeasuresPerformance against three levels of indicators: Mega, Macro and Micro.MegaThese measures relate to the overall performance of the Wellington region’s economy. PWB’s ability to influence the economy at theMega level is limited.Area Measure 2005/06 Target 2005/06 ActualRegional Economic Growth– Gross Domestic ProductAbove national average National GDP growth: 4.2%Wellington regional GDPgrowth: 5.5%Year to March 2005Number of businesses in theregionPositive growth 2.4% Year to March 2005Number of jobs in the region Positive growth 5.8% Year to March 2005Source: Wellington Regional Outlook, Infometrics 2006MacroThese measures relate to the performance of sectors in the Wellington region targeted by PWB through its sector growthprogramme. PWB’s ability to influence at Macro level is greater than at Mega, but still limited.SectorIncrease in Sectors’Contribution to Regional GDPTarget: Above national averageNationalAverageWellingtonRegionGrowth inNumber ofBusinessesTarget:PositivegrowthGrowth inNumber ofJobsTarget:PositivegrowthEmploymentLocationQuotientsTarget:Abovenationalaverage of 1Education 13.0% 14.6% -0.5% -0.3% 1.15Information Communication Technology 9.0% 7.0% 2.2% 6.0% 1.74Professional Services/Engineering 13.0% 7.7% 3.1% 7.3% 1.21Creative and Film 6.5% 3.4% 2.7% -1.2% 1.14Manufacturing 2.4% 3.2% -0.5% 2.1% 0.53Source: Wellington Regional Sector Report 2005, Infometrics 2006MicroThese measures relate to specific programme goals in PWB’s business plan for 2005/2006.<strong>Council</strong>-Controlled OrganisationsArea Measure 2005/06 Target 2005/06 ActualMarketing Number of quality media mentions. 100 218Business DevelopmentBusiness DevelopmentBusiness DevelopmentNew business start-ups facilitatedby PWB.Number of people, starting their ownbusinesses, trained in basic businessprinciples through PWB courses andadvisory sessions.Value of research and developmentgrants sourced for businesses by PWB.100 175300 297$1.25 million $1.79 million1For more information on these companies, see their statements of intent, which are available after 1 July each year.120
Area Measure 2005/06 Target 2005/06 ActualBusiness DevelopmentBusiness IncubationBusiness IncubationEnhanced capability of sector-clustermembers through delivery of trainingprogrammes.Economic impact achieved throughincubator and resident activities.Number of high growth companiesresident in Creative HQ and Fashion HQ15 programmes 7 programmes$10 million $10.56 million20 minimum 22Business Incubation Increase in sponsorship revenue 10% 15.2%Business IncubationBusiness IncubationBusiness IncubationBusiness IncubationBusiness IncubationMigrant AttractionMigrant AttractionPercentage of Creative HQ residents’business plans on target at 18-monthreview.Percentage of incubator residentcompanies receiving a private equityinjection within 18 months of entry.Success rate for exiting companies,based on capital/turnover targets.An Angel Investment Networkestablished.Businesses exiting Fashion HQ, havingreached financial targets.Employers and recruitment agenciesassisted in obtaining skilled migrant/expatriate labour and/or assisted in theimmigration process.New immigrants and expatriatesregistered on PWB database.60% 60%50% 0%60% 60%2 040 64500 1763(excludes increasedinvestment by foundingshareholders)Established.Migrant Attraction Assist migrants into jobs. 60 migrants,witheconomic impact of$6 million113 migrants, witheconomic impact of$11.3 millionInvestment AttractionAs a result of investment attraction,grow the number of jobs.50 new jobs [tba]Investment Attraction Attract new investment. $18 million $5.2 millionInvestment AttractionSector Growth• EducationSector Growth• Professional ServicesSector Growth• Creative & FilmSector Growth• ICTAttract new business investmentmigrants.There is an economic impact frominternational student education.10 2$185 million $144.8 millionAchieve export contracts. $4.5 million $2.24 millionIncrease in creative sector employmentand GDP.ICT Cluster members’ earnings fromcollaborative projects.5% 3.4% increase incontribution to regionalGDP.• 1.2% movement injob numbers.$3 million $3.19 million1For more information on these companies, see their statements of intent, which are available after 1 July each year.<strong>Council</strong>-Controlled Organisations121
<strong>Hutt</strong> <strong>City</strong> Profile<strong>Hutt</strong> <strong>City</strong> (geographical name Lower <strong>Hutt</strong>) is located at the southern end of the North Island of New Zealand. It is the second largestcity in the Wellington Region and borders onto the capital city Wellington. <strong>Hutt</strong> <strong>City</strong> with a population of 95,478 (Source: StatisticsNZ) ranks 9th in size out of the 74 territorial authorities in New Zealand. The city has an area of around 38,000 hectares and over40 kilometres of coastline. <strong>Hutt</strong> <strong>City</strong> has a vitality and uniqueness that is enhanced by its beautiful natural setting – a combinationof hills, valleys, rivers and the sea. This setting offers residents the best of both worlds; the facilities and services provided by amajor urban centre, as well as a central location for residents to enjoy a variety of outdoor pursuits.<strong>Hutt</strong> <strong>City</strong> – A Summary ProfileLand area (hectares)37,998WARDS 2001 POPULATIONPercentage changefrom 1996Northern 14,802 1.1%Eastern 16,476 0.0%Western 11,913 2.3%Central 18,150 –0.3%Wainuiomata 17,058 –0.2%Harbour 17,070 –0.4%WARDS 2001 HOUSEHOLDSNorthern 5,097 2.3%Eastern 6,066 1.8%Western 4,200 4.5%Central 6,957 2.2%Wainuiomata 5,640 0.0%Harbour 6,702 1.7%<strong>Hutt</strong> <strong>City</strong> Assets<strong>Hutt</strong> <strong>City</strong> ProfileTotal council assets $844,120,000Area of parks and reserves5,000 hectaresNumber of swimming pools 6Number of libraries 8Length of roads475 kmLength of footpaths588 kmNumber of street lights 10,650Length of wastewater pipes657 kmLength of stormwater pipes500 kmLength of water pipes671 kmRating systemCapitalRateable properties 37,421Average rates per residential ratepayer $1,474Capital value of the city $11,767,348,000122
Age Breakdown 2001 CensusLower <strong>Hutt</strong>New ZealandUnder 15 24.0% 22.7%15 to 24 13.1% 13.5%25 to 44 31.0% 29.7%45 to 64 21.4% 22.1%65 and over 10.5% 12.0%Ethnic Breakdown 2001 CensusLower <strong>Hutt</strong>New ZealandEuropean 76.7% 80.1%New Zealand Maori 16.0% 14.7%Pacific Islands 9.4% 6.5%Asian 7.0% 6.6%Other 0.7% 0.7%Not specified 2.6% 4.0%Climate• temperature: mean daily maximum temperature of 21°C in January and 11°C in July• sunshine hours: 1,900 – 2,000 hours of sunshine per year• rainfall: 1,350 mm – 1,450 mm of rainfall per year• wind: predominant wind 50% of the time is from between the north and west –30% of the time it is frombetween the southeast and southwest.<strong>Hutt</strong> <strong>City</strong> Profile123
DefinitionsDefinitionsThese definitions are intended to define terms used in this <strong>Annual</strong> Report in plain English. For legal definitions see the LocalGovernment Act 2002.AssetSomething of value that <strong>Council</strong> owns on behalf of the people of <strong>Hutt</strong> <strong>City</strong>, such as roads, drains, parks and buildings.Asset Management PlanA long-term plan for managing an asset to ensure that its capacity to provide a service is kept up and costs over the life of the assetare kept to a minimum.Appropriation/AppropriatedMoney that has been set aside from, or brought into, an operating or revenue account.Capital ExpenditureExpenditure that will increase the value of <strong>Council</strong>’s assets.Capital ValueValue of land including any improvements.Community BoardsLocal elected bodies set up under the Local Government Act. Community Boards are consulted by <strong>Council</strong> and can representcommunity concerns to <strong>Council</strong> (see also Ward Committees). <strong>Hutt</strong> <strong>City</strong> <strong>Council</strong> has three Community Boards: Eastbourne, Petoneand Wainuiomata.Community OutcomeAn outcome for the community that is identified as a priority.<strong>Council</strong>-Controlled Organisations (cco's)Organisations which independently manage facilities and deliver services and undertake developments on behalf of the <strong>Hutt</strong> <strong>City</strong>community. Where necessary, <strong>Council</strong> funds the organisations.Employee CostsExpenditure on staff. This includes wages, salaries and related taxes, training and recruitment costs. Remuneration of elected andappointed representatives is also included under this heading.Financial Year<strong>Council</strong>’s Financial Year runs from 1 July to 30 June of the following year.Land ValueValue of land, excluding any improvements.Local Government Act 2002The key legislation that defines the powers and responsibilities of local authorities like <strong>Hutt</strong> <strong>City</strong>.Long Term <strong>Council</strong> Community Plan (LTCCP or Community Plan)A plan that describes the activities of the local authority, the Community Outcomes and long-term focus for the decisions andactivities of the local authority.Forecast Financial StatementThis is a 10-year plan for <strong>Council</strong>’s revenue and expenditure, cash flows, and borrowing programme.Maintenance CostsExpenditure in relation to repairs and maintenance of <strong>Council</strong>’s assets.AppendicesMana WhenuaPeople with the mana of the land.Operating ExpenditureExpenditure for the normal services of <strong>Council</strong>.124
Operating ProjectsSignificant projects that do not result in the creation of <strong>Council</strong> assets.Performance MeasureA measure that shows how well <strong>Council</strong> is doing in achieving the goals it has set for itself.RatesFunds collected by <strong>Council</strong> from levies on property. These are based on the capital value of the property but the term is often usedto include Uniform <strong>Annual</strong> General Charges and Targeted Rates also.Te Taura Here o te Te AwakairangiThe <strong>Hutt</strong> Valley branch of Runanganui o Taura Here ki te Whanganui a Tara which represents 23 tribal groups in the greaterWellington region.Runanganui o Taranaki Whanui ki te Upoko o te Ika a MauiA representative Maori <strong>Council</strong> made up from local tangata whenua and representing the eight Taranaki tribes within theWellington region.SignificanceDegree of importance of the issue, proposal, decision or matter as assessed by the local authority in terms of its likelyconsequences for the current and future social, economic, environmental, or cultural well-being of the community.Significant ActivitiesThe Community Plan lists 18 separate significant activities including Managing Services.Support CostsThe internal allocation of expenditure incorporated in significant activity 18, ‘Managing Services’.TaongaA highly prized resource.Te AtiawaLocal tangata whenua with inherited land ownership and kinship to northern Taranaki Te Atiawa.Targeted RatesAny rate levied other than the general rate, targeted at users of a service such as water supply, wastewater and the Jackson StreetProgramme.User ChargesIncome to <strong>Council</strong> through fees paid by those who use specific services provided by <strong>Council</strong>.Ward CommitteesLocal committees set up by <strong>Council</strong>. Ward Committees are consulted by <strong>Council</strong> and can represent community concerns to <strong>Council</strong>(see also Community Boards). <strong>Hutt</strong> <strong>City</strong> <strong>Council</strong> has four Ward Committees: Central, Eastern, Northern, and Western.Wellington Tenths Trust Te AtiawaLocal tangata whenua with inherited land ownership in Wellington and <strong>Hutt</strong> Valley and kinship to Northern Taranaki Te Atiawa.Appendices125
Source of Information for Level of Achievement<strong>Hutt</strong> <strong>City</strong> <strong>Council</strong>’s <strong>Annual</strong> Report indicates the source of information for each performance measure. This disclosure is designed toimprove accountability and transparency. A more detailed discussion of the main sources of information is provided below.NRB Communitrak SurveyThe National Research Bureau Limited undertakes these annual surveys for participating local authorities. The results alsoinclude national and peer group comparisons. <strong>Hutt</strong> <strong>City</strong> <strong>Council</strong> has commissioned these surveys since 1994. <strong>Hutt</strong> <strong>City</strong> <strong>Council</strong>’sCommunitrak survey utilises 500 telephone interviews, 100 more than the standard Communitrak survey, to ensure adequaterepresentation from each ward. Randomised sampling methods are used to access residents over the age of 18 and weightings areapplied to reflect the ward, gender and age proportions of the area. The maximum margin of error at the 95% level of confidencefor <strong>Hutt</strong> <strong>City</strong> <strong>Council</strong>’s survey is +/- 4.4% and the maximum level of significant difference at the 95% level of confidence is +/– 6.2%.These maximums for the margin of error and significant difference will occur when the sample is split 50/50 on an issue. Howeverwhen the split is less, for instance 80/20, the percentages for the margin of error and significant difference decrease. The level ofachievement in terms of measuring satisfaction levels is calculated after excluding the responses of those unable to comment onthe specific service being measured.Management ReportsManagement Reports encompass a range of documentation and records, such as <strong>report</strong>s from internal service providers to assetmanagers and <strong>report</strong>s from contractors to managers. Quality assurance in the level of performance of <strong>Council</strong> is very important.For infrastructural renewal and capital programmes, management <strong>report</strong>s include quality assurance procedures such as certificatesof completion verified by third parties. These certificates confirm that the appropriate technical standards and specifications havebeen met. For all regulatory services, ISO systems and procedures provide quality assurance in service delivery and achievement<strong>report</strong>ing. Internal and external audits also form part of <strong>Council</strong>’s quality assurance programmes.AC Nielsen SurveyAC Nielsen previously undertook an annual staff survey in which staff are asked to rate their satisfaction with <strong>Hutt</strong> <strong>City</strong> <strong>Council</strong>.A five-point rating scale (very good, good, satisfactory, poor, very poor) was used.The results were compared to the benchmark and differences noted.Best Places to Work Survey<strong>Council</strong> now participates in the annual Best Places to Work Survey by John Robertson Associates. This survey provides <strong>Council</strong> withimportant information on how staff view <strong>Council</strong>, and how this compares with other organisations.Appendices126
Political StructureHUTT CITYCOUNCILCommunity PlanCommitteeSpecial andJoint Committees– <strong>Hutt</strong> Valley Services– Civic Honours– Joint Wellington RegionalStrategy ForumCommunityBoardsEastbourne, Petone &WainuiomataWard CommitteesCentral, Eastern,Northern & WesternStrategy andPolicy CommitteeDistrict PlanCommitteeOperations andComplianceCommitteeHearingsCommitteeFinance andAudit CommitteeCommunityGrantsCommitteeBack row – Ray Wallace, Tracey Pollard, Angus Finlayson, Christopher Milne, Ross Jamieson, Julie Englebretsen, Margaret CousinsFront row – Deborah Hislop, Roger Styles, David Ogden, Joy Baird and Glenda BarrattAppendices127
Mayor and <strong>Council</strong>lors(I) Independent(CV) <strong>City</strong> Vision(H) <strong>Hutt</strong> 20/20(OCOF) Our <strong>City</strong>, Our FutureYou can contact the Mayor or any <strong>Council</strong>lor at:<strong>Hutt</strong> <strong>City</strong> <strong>Council</strong>30 Laings RoadPrivate Bag 31 912Lower <strong>Hutt</strong>Telephone: (04) 570 6666 or 0800 HUTT CITYFacsimile: (04) 569 4290Email: contact@huttcity.govt.nzMayor David Ogden (CA,JP) (OCOF)MayorTelephone: 570 6932 (business)Facsimile: 566 7027 (business)Email: david.ogden@huttcity.govt.nzCr R (Roger) Styles (OCOF)Deputy Mayor, Eastern WardTelephone: 934 3270 (private)Facsimile: 934 3271 (private)Mobile: 0274 800 072Email: roger.styles@huttcity.govt.nzCr D (Deborah) Hislop (CV)Central WardTelephone: 567 0567 (private)Facsimile: 567 0513 (private)Mobile: 027 457 0567Email: deborah.hislop@huttcity.govt.nzCr J (Julie) Englebretsen (H)Northern WardTelephone: 563 5179 (private)920 9824 (business)Facsimile: 920 9825 (business)Email: julie.englebretsen@huttcity.govt.nzCr JMK (Joy) Baird JP (I)Harbour WardTelephone: 568 3225 (private)918 7838 (business)Facsimile: 569 3350Email: joy.baird@huttcity.govt.nzCr A (Angus) Finlayson JP (CV)Northern WardTelephone: 566 5046 (private)Facsimile: 566 2082 (private)Mobile: 027 445 3035Email: angus.finlayson@huttcity.govt.nzCr G (Glenda) Barratt (CV)Eastern WardTelephone: 976 8500 (private)Facsimile: 976 8544 (private)Mobile: 021 128 9377Email: glenda.barratt@huttcity.govt.nzCr VR (Ross) Jamieson JP (I)Harbour WardTelephone: 562 7231 (private)Facsimile: 562 7231 (private)Mobile: 027 442 7319Email: ross.jamieson@huttcity.govt.nzCr WR (Ray) Wallace JP (I)Wainuiomata WardTelephone: 970 5337 (private)027 226 4046 (business)Facsimile 970 5337Mobile: 027 226 4046Email: ray.wallace@huttcity.govt.nzCr T (Tracy) Pollard (I)Wainuiomata WardTelephone: 564 3021 (private)Email: tracy.pollard@huttcity.govt.nzAppendicesCr MJ (Margaret) Cousins JP (I)Western WardTelephone: 586 2135 (private)Facsimile: 586 1046 (private)Email: margaret.cousins@huttcity.govt.nzCr C (Christopher) Milne (OCOF)Central WardTelephone: 586 3890 (business)Mobile: 027 442 2708Email: christopher.milne@huttcity.govt.nz128
Community Board and Ward Committee MembersEastbourne Community BoardMr Geoff Mann (Chair) 568 5573Mr Ian Young (Deputy Chair) 562 8622Mr Murray Gibbons 562 8567Mr Geoff Rashbrooke 568 4988Mr Derek Wilshere 562 7920Wainuiomata Community BoardJulie Sylvester (Chair) 564 3968Mr Randall Day (Deputy Chair) 972 9996Mr Darryl Angus 939 6550Mr Alec Gage 564 5802Mr Reg Moore 971 6872Mr Kevin Small 564 6841Petone Community BoardMr Richard Cole (Chair) 586 1113Miss Megan Casey (Deputy Chair) 569 6974Mr Gerald Davidson 938 3723Miss Vera Ellen 938 1946Mr Michael Lulich 568 7597Mr Neil Newman 939 1133Central Ward CommitteeBrian Moylan (Chair) 569 2499Evan Ng (Deputy Chair) 570 1898Sue Lafrentz 567 0856Desiree Mulligan 938 9525Eastern Ward CommitteeSally Fergus (Chair) 566 2902Gerry Pallo (Deputy Chair) 567 6919Mohammed Bah 569 8321Teri Puketapu 566 0809Northern Ward CommitteeSteve Ritchie (Chair) 938 7223Filomena Aukuso (Deputy Chair) 938 3550Stuart Duck 025 682 7042Leigh Sutton 563 5184Western Ward CommitteeJill Berridge (Chair) 566 8781Noeline Matthews (Deputy Chair) 569 2551John McLellan 565 0446Max Shierlaw 589 3669Appendices129
Management StructureChiefExecutiveRik HartGeneralCounselJoycelyn FooGeneral ManagerProject Office/Electoral OfficerGeneral Manager<strong>City</strong> ServicesDavid KellyGeneral ManagerDevelopment ServicesKim KellyGeneral ManagerBusiness ServicesTony StallingerAppendicesFront rowTony Stallinger, General Manager, Business ServicesDDI: 04 570 6781email: tony.stallinger@huttcity.govt.nzRik Hart, Chief ExecutiveDDI: 04 570 6773email: rik.hart@huttcity.govt.nzKim Kelly, General Manager, Development ServicesDDI: 04 570 6949email: kim.kelly@huttcity.govt.nzBack rowDavid Kelly, General Manager, <strong>City</strong> ServicesDDI: 04 570 6878email: dave.kelly@huttcity.govt.nzStuart Duncan, General Manager, Project Office/Electoral OfficerDDI: 04 570 6873email: stuart.duncan@huttcity.govt.nzJoycelyn Foo, General CounselDDI: 04 570 6736email: joycelyn.foo@huttcity.govt.nz130
<strong>Hutt</strong> <strong>City</strong> <strong>Council</strong>, 30 Laings Road, Private Bag 31 912, Lower <strong>Hutt</strong>, New ZealandTel: +64–4–570 6666, Fax:+64–4–569 4290, Website: www.huttcity.govt.nz