P:\P25065\H-# Literature\H-2082 - Haynes International, Inc.
P:\P25065\H-# Literature\H-2082 - Haynes International, Inc.
P:\P25065\H-# Literature\H-2082 - Haynes International, Inc.
- No tags were found...

Create successful ePaper yourself
Turn your PDF publications into a flip-book with our unique Google optimized e-Paper software.
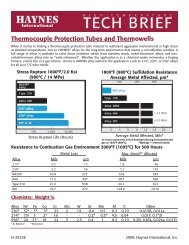
ISOCORROSION DIAGRAMS*The isocorrosion diagramsshown on this page wereplotted using data obtained inlaboratory tests in reagentgrade acids. These datashould be used only as aguide. It is recommended thatsamples be tested underactual plant conditions.Resistance to Hydrochloric AcidResistance to Nitric AcidBoiling Point CurveBOILING POINT CUR VE200100Boiling Point CurveBOILING POINT CUR VE5 mpy(0.13)100Temperature °F15075Temperature °CTemperature °F200150Temperature °C5020 mpy (0.51)501001005 mpy(0.13)0 1020 3040Concentration Weight Percent0 10 20 30 40 50 60 70Concentration Weight PercentResistance to Sulfuric AcidResistance to Phosphoric AcidBoiling BOILING POINT Point Curve CUR VE300150300150Temperature °F200100Temperature °CTemperature °F200Boiling BOILING Point POINT Curve CUR VE20 mpy (0.51)5 mpy(0.13) 100Temperature °C1005 mpy(0.13)20 mpy (0.51)50100500 20 40 60 80 100Concentration Weight Percent0 10 20 30 40 50 60 70Concentration Weight Percent80Corrosion rates in parentheses are in mm/year.* All test specimens were heat-treated at 2050°F (1121°C), water quenched and in the unwelded condition.9ULTIMET ® alloy