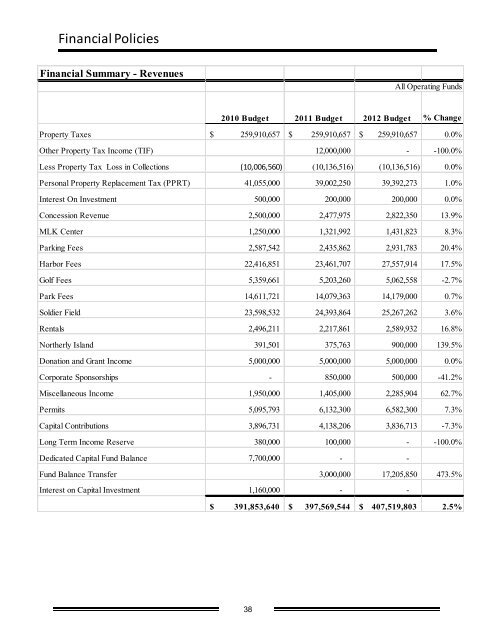
Financial PoliciesFinancial <strong>Summary</strong> - RevenuesAll Operating Funds2010 <strong>Budget</strong> 2011 <strong>Budget</strong> <strong>2012</strong> <strong>Budget</strong> % ChangeProperty Taxes $ 259,910,657 $ 259,910,657 $ 259,910,657 0.0%Other Property Tax Income (TIF) 12,000,000 - -100.0%Less Property Tax Loss in Collections (10,006,560) (10,136,516) (10,136,516) 0.0%Personal Property Replacement Tax (PPRT) 41,055,000 39,002,250 39,392,273 1.0%Interest On Investment 500,000 200,000 200,000 0.0%Concession Revenue 2,500,000 2,477,975 2,822,350 13.9%MLK Center 1,250,000 1,321,992 1,431,823 8.3%<strong>Park</strong>ing Fees 2,587,542 2,435,862 2,931,783 20.4%Harbor Fees 22,416,851 23,461,707 27,557,914 17.5%Golf Fees 5,359,661 5,203,260 5,062,558 -2.7%<strong>Park</strong> Fees 14,611,721 14,079,363 14,179,000 0.7%Soldier Field 23,598,532 24,393,864 25,267,262 3.6%Rentals 2,496,211 2,217,861 2,589,932 16.8%Northerly Island 391,501 375,763 900,000 139.5%Donation and Grant Income 5,000,000 5,000,000 5,000,000 0.0%Corporate Sponsorships - 850,000 500,000 -41.2%Miscellaneous Income 1,950,000 1,405,000 2,285,904 62.7%Permits 5,095,793 6,132,300 6,582,300 7.3%Capital Contributions 3,896,731 4,138,206 3,836,713 -7.3%Long Term Income Reserve 380,000 100,000 - -100.0%Dedicated Capital Fund Balance 7,700,000 - -Fund Balance Transfer 3,000,000 17,205,850 473.5%Interest on Capital Investment 1,160,000 - -$ 391,853,640 $ 397,569,544 $ 407,519,803 2.5%38
Financial PoliciesFinancial <strong>Summary</strong> - ExpenseAll Operating Funds2010 <strong>Budget</strong> 2011 <strong>Budget</strong> <strong>2012</strong> <strong>Budget</strong> % ChangePersonnel ServicesSalary & Wages $ 125,901,450 $ 128,414,965 $ 135,114,280 5.2%Health Benefits 15,757,532 16,454,555 15,839,444 -3.7%Employee Health Care Contribution (1,550,000) (1,588,750) (1,636,413) 3.0%Retiree Health Benefits 1,401,631 1,513,761 1,619,724 7.0%Prescription Drugs 2,067,269 2,180,705 2,239,232 2.7%Dental Benefits 339,992 336,310 338,870 0.8%Life Insurance 177,539 177,253 184,778 4.2%Medicare Tax 1,045,601 1,335,000 1,261,944 -5.5%Social Security 908,801 1,220,000 1,086,557 -10.9%Materials and Supplies 6,540,621 6,487,628 6,085,408 -6.2%Tools and Equipment 595,852 545,945 494,020 -9.5%Repair and Maintenance 1,290,205 1,460,666 1,871,970 28.2%General Contractual Services 14,724,383 15,320,862 15,275,005 -0.3%Facilities Rentals 980,000 1,019,200 1,044,680 2.5%Natural Gas Utility 5,750,363 5,750,363 5,797,874 0.8%Electric Utility Service 12,130,000 12,130,000 12,247,600 1.0%Water and Sewer Utility 6,220,128 5,320,128 6,716,661 26.2%Concessions Management 650,000 675,000 675,000 0.0%Harbor Management 8,117,123 8,920,023 10,140,039 13.7%Soldier Field 12,295,437 12,240,764 12,522,135 2.3%Golf Management Expenses 4,434,542 4,123,427 4,207,025 2.0%MLK Center Management 1,109,351 1,245,714 1,245,717 0.0%<strong>Park</strong>ing Management 1,117,228 1,148,541 1,181,334 2.9%Landscape Management 3,997,100 4,447,100 4,262,390 -4.2%Other Management Fee Expense 17,229,491 16,845,076 16,294,041 -3.3%Organizations 2,490,000 2,690,000 2,690,000 0.0%Expenditure of Grants 2,370,650 2,000,000 2,284,296 14.2%Special Program Expense 1,161,971 1,273,766 963,262 -24.4%Unemployment Obligations 1,270,280 1,587,850 1,675,969 5.5%Workers Compensation 4,200,000 4,000,000 3,500,000 -12.5%Insurance 3,250,000 2,975,000 2,987,462 0.4%Judgments 1,500,000 1,500,000 1,000,000 -33.3%Pension Expense 10,866,807 10,745,269 10,435,071 -2.9%Remittance To Zoo 5,600,000 5,690,000 5,690,000 0.0%Remittance To Aquarium & Museum 30,755,933 30,601,360 30,630,729 0.1%Debt Service 85,156,360 86,782,063 89,553,699 3.2%Total $ 391,853,640 $ 397,569,544 $ 407,519,803 2.5%39