Lesson Plan - NIH Office of Science Education
Lesson Plan - NIH Office of Science Education
Lesson Plan - NIH Office of Science Education
- No tags were found...

You also want an ePaper? Increase the reach of your titles
YUMPU automatically turns print PDFs into web optimized ePapers that Google loves.
Activity 3Cancer as a Multistep ProcessFocus: Students use random number tables and a CD-ROM-based simulationto test several hypotheses about the development <strong>of</strong> cancer.At a GlanceMajor Concepts: No single event is enough to turn a cell into a cancerous cell.Instead, it seems that the accumulation <strong>of</strong> damage to a number <strong>of</strong> genes (“multiple hits”) across time leads to cancer.Objectives: After completing this activity, students will• understand that cancer results from the accumulation <strong>of</strong> genetic damage tocells across time and• be able to explain the increase in cancer incidence that occurs with an increasein age in terms <strong>of</strong> a multiple hit (mutations in a number <strong>of</strong> genes) hypothesisfor cancer’s development.Prerequisite Knowledge: Students should be familiar with the concepts taughtin Activities 1 and 2. Students also should have a basic knowledge <strong>of</strong> probability. The annotation to Step 6 describes a short exercise you can do with studentsto remind them <strong>of</strong> the laws <strong>of</strong> probability.Basic <strong>Science</strong>-Public Health Connection: This activity highlights the contribution epidemiology has made to our understanding <strong>of</strong> cancer. Students discoverhow determining and analyzing the frequencies with which cancer occurs inlarge populations has provided compelling though indirect evidence thathuman cancer is a multistep process. Students then consider the implications <strong>of</strong>this understanding <strong>of</strong> cancer for personal and public health.The process by which a normal cell is transformed into a malignant cellinvolves many changes. Cancer cells display a host <strong>of</strong> striking differences fromtheir normal counterparts, such as shape changes, changes in their dependenceon growth factors, and a multitude <strong>of</strong> biochemical differences.IntroductionOne <strong>of</strong> the earliest questions scientists asked about these phenotypic differenceswas how they are generated. Another question was whether these differencesarise all at once, at a moment when the cell experiences a sudden, catastrophicshift from “normal” to “malignant,” or gradually, across time, as a result <strong>of</strong>many small events, each contributing yet another characteristic to a set that insum gives the cell a malignant phenotype.In this activity, students examine some <strong>of</strong> the epidemiologic data that suggestthat the development <strong>of</strong> cancer is a multistep process. Students study a graph<strong>of</strong> colon cancer incidence by age, answer an initial set <strong>of</strong> questions about therelative risk <strong>of</strong> developing colon cancer at various ages, and propose answers to53
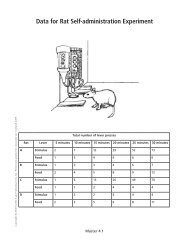
Student ActivitesWithout this context, students may complete this activity “by rote” andnever see how it relates to our growing understanding <strong>of</strong> the biologicalbasis <strong>of</strong> cancer.2. Distribute one copy <strong>of</strong> Master 3.1, Colon Cancer Incidence by Age, to eachstudent and ask the students to work in pairs to answer the questionsbelow the graph.Give students about 5 minutes to complete this task.3. Display a transparency made from Colon Cancer Incidence and invite thestudents to share their answers to the questions.Question 1 How likely is it that you will develop colon cancer thisyear?Students should answer that the risk is so low that they cannot read itfrom the graph. You may wish to ask whether children under 15 everdevelop colon cancer. In fact, those few children who do have geneticconditions that predispose them to the development <strong>of</strong> cancer.Question 2 How likely is it that someone who is 60 years old willdevelop colon cancer this year?The risk is significantly higher (approximately 70 per 100,000 persons).Question 3 How likely is it that someone who is 80 years old willdevelop colon cancer this year?This risk is even higher (about 350 per 100,000 persons).Question 4 How can we explain this change in the risk <strong>of</strong> a persondeveloping colon cancer?Answers will vary. Students may suggest that as people age, theybecome more susceptible to cancer. Some may also suggest that it takestime for the mutations involved in the development <strong>of</strong> cancer to accumulate. Accept all reasonable answers, explaining that in this activity,students will have a chance to test a possible answer to this question.4. Circle the last question on the transparency or write it on the board andpoint out that this question is the central issue in this activity. Explainthat many years ago epidemiologists recognized that this change in cancerrisk provided an important clue about the cause <strong>of</strong> cancer. This activitychallenges students to retrace the thinking <strong>of</strong> these scientists and discoverthis clue for themselves.If students are unfamiliar with the term “epidemiology,” explain that itis the study <strong>of</strong> the incidence <strong>of</strong> disease in a population.5. Remind students that one way scientists answer questions is by developingand testing hypotheses, or tentative explanations. For example, one explanationthat might be <strong>of</strong>fered for the development <strong>of</strong> cancer might be summarizedas “One mutation in a certain gene in a cell causes that cell to become55
Cell Biology and Cancercancerous” (the one-hit hypothesis). Another explanation might be summarizedas “Two mutations in separate genes <strong>of</strong> a cell are required before thecell becomes cancerous” (the two-hit hypothesis), and so on. Ask students ifthey can tell by looking at the colon cancer graph which <strong>of</strong> these two explanationsfor the development <strong>of</strong> cancer best explains the data.Students likely will answer that they cannot tell just by looking at thegraph.6. Explain further that scientists <strong>of</strong>ten use models to test their explanations.In this activity, students will use two simple models, one involving randomnumber tables and the other using a simulation on the CD-ROM, totest several alternate explanations for the development <strong>of</strong> cancer.If your students are not familiar with some <strong>of</strong> the basic concepts <strong>of</strong>probability, you may wish to conduct the following short exercise:Give each student a penny, a nickel, and a dime, and ask students to tosseach coin one time and leave the coins lying on their desks where theylanded. Ask the students to raise their hands if they got a “heads” ontheir penny. Count the number <strong>of</strong> students who raise their hands andpoint out that this represents about 50 percent <strong>of</strong> the class. Then, ask students to indicate how many got heads on both their penny and theirnickel. Again, count the number <strong>of</strong> students who raise their hands andpoint out that this value is close to 25 percent <strong>of</strong> the class. Finally, ask students to raise their hands only if they got a heads on all three <strong>of</strong> theircoins (the penny, the nickel, and the dime). This number should be aboutone-eighth <strong>of</strong> the class. Ask students what pattern they see in these data.Students should see that the probability <strong>of</strong> independent events happening together is lower than each event’s individual probability. Use yourjudgment to decide whether to explain to students how to calculate theprobability <strong>of</strong> such occurrences (for example, the probability <strong>of</strong> gettingheads on three coins tossed individually is 1 /2 × 1 /2 × 1 /2 = 1 /8).7. Distribute one data set from Master 3.2, Random Number Tables, to eachstudent and explain that students will use these data to understand theimplications <strong>of</strong> the following two hypotheses for the incidence <strong>of</strong> cancerin a population (the class):1. Cancer develops as a result <strong>of</strong> a single mutation (one-hit hypothesis).2. Cancer develops as a result <strong>of</strong> two independent mutations (two-hithypothesis).8. Explain that the data sets the students hold are called random numbertables and were made as a computer randomly chose numbers between 1and 25 to correspond with the students’ imagined life spans. Explain thatthe first column on the table represents the students’ ages, and that thesecond and third columns on the table represent the numbers the computerchose.56
Cell Biology and Cancer16. Convene a class discussion in which you invite students to share theiranswers to the questions on Using the Hit Simulator.• Investigate the Effect <strong>of</strong> Changing the Number <strong>of</strong> Hits RequiredThese questions focusstudents’ attention onthe activity’s major concepts. Encourage students to express theirunderstanding <strong>of</strong> cancerusing the language <strong>of</strong>cells and genes.Question 1 How does the incidence <strong>of</strong> cancer change as yourequire a greater number <strong>of</strong> hits for a cell to become cancerous?Students should see that the greater the number <strong>of</strong> hits required, thefewer the number <strong>of</strong> people who develop cancer and the later in lifethey tend to develop it. Students may note that with the number <strong>of</strong>hits set at 1 and the mutation rate set at 0.5 (50 percent), nearly everyonein the population gets cancer by age 25. As they increase thenumber <strong>of</strong> hits required, the curve shifts to the right (people get cancer later in life), though most people still develop it eventually.Question 2 Recall the graph <strong>of</strong> the incidence <strong>of</strong> colon cancer thatyou observed at the beginning <strong>of</strong> this activity. Did the incidence <strong>of</strong>cancer in any <strong>of</strong> the runs you just completed match the incidence<strong>of</strong> cancer recorded in that graph? Explain your answer.Students should recognize that none <strong>of</strong> the runs matched the actualincidence <strong>of</strong> colon cancer. You may wish to remind students that theylearned in Activity 1 that only about 1 in 3 people in the UnitedStates develops cancer sometime in his or her life.Question 3 What can you conclude from this observation?Students should see that because the curve shifted to the right(toward the development <strong>of</strong> cancer later in life) as more hits wererequired, the results suggest that more than 1 hit likely is involved inthe development <strong>of</strong> cancer. Astute students also may say that becausealmost everyone eventually developed cancer in these simulations,the mutation rate <strong>of</strong> 0.5 (50 percent) likely is too high.• Investigate the Effect <strong>of</strong> Changing the Mutation RateQuestion 4 How does the incidence <strong>of</strong> cancer change as the mutationrate increases?The incidence <strong>of</strong> cancer increases as the mutation rate increases.Students should see that with the simulator set at a mutation rate <strong>of</strong>0.1 (10 percent), a smaller proportion <strong>of</strong> the population develops cancer than when the simulator is set at 0.5 (50 percent). With the simulator set at a mutation rate <strong>of</strong> 1 (100 percent), everyone gets cancerbetween the ages <strong>of</strong> 0 and 5.Question 5 Recall the graph <strong>of</strong> the incidence <strong>of</strong> colon cancer thatyou observed at the beginning <strong>of</strong> this activity. Did the incidence <strong>of</strong>cancer in any <strong>of</strong> the runs you just completed match the incidence<strong>of</strong> cancer recorded in that graph? Explain your answer.60
Student ActivitesStudents should recognize that none <strong>of</strong> the runs matched the actualincidence <strong>of</strong> colon cancer. They should recognize, however, that thecurve(s) generated with the mutation rate set at 0.1 or lowerwas/were more in line with the observed incidence than the curvesgenerated with higher mutation rates.Question 6 What can you conclude from this observation?Students should recognize that these results suggest that the actualmutation rate is somewhat lower than 0.5 (50 percent), and maybeeven lower than 0.1 (10 percent).• Investigate the Effect <strong>of</strong> Changing Both the Number <strong>of</strong> HitsRequired and the Mutation RateQuestion 7 What can you conclude from your observations?Students should see that the curves generated by some <strong>of</strong> theseruns begin to resemble the incidence <strong>of</strong> colon cancer observed onthe graph they examined at the beginning <strong>of</strong> the activity. Encouragestudents to suggest combinations <strong>of</strong> numbers <strong>of</strong> hits and mutationrates that seem to give realistic results, but caution students not touse this simulator (which was designed for educational purposes*,not research) to try to make an absolute determination <strong>of</strong> number <strong>of</strong>hits and mutation rate.You may wish to point out that a mutation rate <strong>of</strong> 0.04 is the samerate that was used in the random number table exercise. Challengestudents to demonstrate this by comparing the graphs they made <strong>of</strong>the one-hit and two-hit hypotheses with the curves generated by thesimulator. Note that using the CD-ROM-based simulator allows themnow to test the predictions they made in Step 14.*Note that the graph <strong>of</strong> the incidence <strong>of</strong> colon cancer used in Step2 is actually the number <strong>of</strong> people in a population <strong>of</strong> 100,000 whowill be diagnosed with colon cancer at each age. The graphs students created in class and the graphs generated by the HitSimulator are somewhat different because they plot cumulativenumbers (the total number <strong>of</strong> people who will have developedcolon cancer at or before that age).• SummaryQuestion 8 What clue did the change in risk <strong>of</strong> colon cancer providescientists about the cause <strong>of</strong> cancer?Students should be able to explain that the increase with age in coloncancer incidence suggested to epidemiologists that more than onemutational event was involved in cancer’s development. Similargraphs <strong>of</strong> age-dependent cancer incidence, plotted for many other61
Cell Biology and Cancertypes <strong>of</strong> adult cancer, provided additional support for the hypothesis<strong>of</strong> multistep carcinogenesis. In fact, one <strong>of</strong> the goals <strong>of</strong> research todayis to identify each <strong>of</strong> the steps and genes involved in the long and complex succession <strong>of</strong> events that occurs to create the malignant growth <strong>of</strong>cancer cells.Whereas Activity 2 illustrates the contributionthat cell biologists andgeneticists have made tounderstanding cancer,Activity 3 illustrates thecontribution that epidemiologists have made.One <strong>of</strong> the most excitingaspects <strong>of</strong> cancerresearch in recent yearshas been the construction <strong>of</strong> an understanding<strong>of</strong> cancer that unifies thework <strong>of</strong> many types <strong>of</strong>scientists studying cancer for more than 100years.Note that this question returns students to the challenge they weregiven in Step 4.17. Challenge your students to evaluate the models they used to test the differenthypotheses for the development <strong>of</strong> cancer (that is, to think aboutthe ways in which the random number table exercise and the CD-ROMbasedsimulation do and do not match reality).Remind students that all models are inaccurate in some respects. Forexample, the mutational events within cells may not be completely random, as the models assume. The models also assume that the probability <strong>of</strong> each individual mutational event is the same, and this may notbe the case. There is some evidence, for example, that some mutationsincrease the probability that other mutations will occur. In addition, themodels do not consider that some mutations may be detected andrepaired. Nevertheless, the fact that the models the students used arenot perfect does not mean they are not useful tools for understandinghow disease processes work.18. Close the activity by distributing one copy <strong>of</strong> Master 3.6, Testing anExplanation by Looking at Additional Data. Ask students to use theirunderstanding <strong>of</strong> cancer as a multistep process to explain each <strong>of</strong> theobservations listed.Question 1 Cancer is a disease <strong>of</strong> aging.The questions on Testingan Explanation are challenging, but they represent an excellent opportunity for you toevaluate your students’understanding <strong>of</strong> theactivity’s major conceptsand their ability to applytheir understanding tonovel situations.Students should be able to explain it takes time for all <strong>of</strong> the mutations involved in the development <strong>of</strong> cancer to accumulate, and thatthis explains why the incidence <strong>of</strong> cancer increases with age (that is,why cancer is more likely to “strike” in the middle or later years thanin childhood, youth, or young adulthood.Question 2 You’ve come a long way, baby.Students should be able to explain that as these women began tosmoke, they began to accumulate cancer-causing mutations in theirlung cells. Because the accumulation <strong>of</strong> these mutations to the pointwhere a cell becomes cancerous takes time, the results <strong>of</strong> theincrease in the number <strong>of</strong> women smoking (in the form <strong>of</strong> anincrease in lung cancer among women) did not begin to appear for20 to 25 years.Question 3 Genes and increased susceptibility.Students should recognize that if a person is born with a cancercausingmutation already present in his or her cells, he or she has62
Student Activitesalready experienced the first step toward the development <strong>of</strong> cancerand, thus, has a higher risk <strong>of</strong> accumulating all <strong>of</strong> the mutationsrequired for the development <strong>of</strong> cancer than a person who does notcarry such a mutation.63