

Systematic review, meta-analysis and economic modelling of ...
Systematic review, meta-analysis and economic modelling of ...
Systematic review, meta-analysis and economic modelling of ...

Create successful ePaper yourself
Turn your PDF publications into a flip-book with our unique Google optimized e-Paper software.
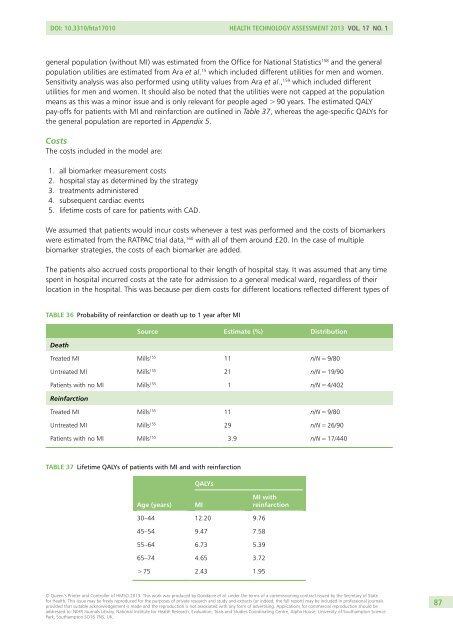
DOI: 10.3310/hta17010 Health Technology Assessment 2013 Vol. 17 No. 1general population (without MI) was estimated from the Office for National Statistics 158 <strong>and</strong> the generalpopulation utilities are estimated from Ara et al. 15 which included different utilities for men <strong>and</strong> women.Sensitivity <strong>analysis</strong> was also performed using utility values from Ara et al., 159 which included differentutilities for men <strong>and</strong> women. It should also be noted that the utilities were not capped at the populationmeans as this was a minor issue <strong>and</strong> is only relevant for people aged > 90 years. The estimated QALYpay-<strong>of</strong>fs for patients with MI <strong>and</strong> reinfarction are outlined in Table 37, whereas the age-specific QALYs forthe general population are reported in Appendix 5.CostsThe costs included in the model are:1. all biomarker measurement costs2. hospital stay as determined by the strategy3. treatments administered4. subsequent cardiac events5. lifetime costs <strong>of</strong> care for patients with CAD.We assumed that patients would incur costs whenever a test was performed <strong>and</strong> the costs <strong>of</strong> biomarkerswere estimated from the RATPAC trial data, 160 with all <strong>of</strong> them around £20. In the case <strong>of</strong> multiplebiomarker strategies, the costs <strong>of</strong> each biomarker are added.The patients also accrued costs proportional to their length <strong>of</strong> hospital stay. It was assumed that any timespent in hospital incurred costs at the rate for admission to a general medical ward, regardless <strong>of</strong> theirlocation in the hospital. This was because per diem costs for different locations reflected different types <strong>of</strong>TABLE 36 Probability <strong>of</strong> reinfarction or death up to 1 year after MISource Estimate (%) DistributionDeathTreated MI Mills 155 11 n/N = 9/80Untreated MI Mills 155 21 n/N = 19/90Patients with no MI Mills 155 1 n/N = 4/402ReinfarctionTreated MI Mills 155 11 n/N = 9/80Untreated MI Mills 155 29 n/N = 26/90Patients with no MI Mills 155 3.9 n/N = 17/440TABLE 37 Lifetime QALYs <strong>of</strong> patients with MI <strong>and</strong> with reinfarctionQALYsAge (years)MIMI withreinfarction30–44 12.20 9.7645–54 9.47 7.5855–64 6.73 5.3965–74 4.65 3.72> 75 2.43 1.95© Queen’s Printer <strong>and</strong> Controller <strong>of</strong> HMSO 2013. This work was produced by Goodacre et al. under the terms <strong>of</strong> a commissioning contract issued by the Secretary <strong>of</strong> Statefor Health. This issue may be freely reproduced for the purposes <strong>of</strong> private research <strong>and</strong> study <strong>and</strong> extracts (or indeed, the full report) may be included in pr<strong>of</strong>essional journalsprovided that suitable acknowledgement is made <strong>and</strong> the reproduction is not associated with any form <strong>of</strong> advertising. Applications for commercial reproduction should beaddressed to: NIHR Journals Library, National Institute for Health Research, Evaluation, Trials <strong>and</strong> Studies Coordinating Centre, Alpha House, University <strong>of</strong> Southampton SciencePark, Southampton SO16 7NS, UK.87


