Create successful ePaper yourself
Turn your PDF publications into a flip-book with our unique Google optimized e-Paper software.
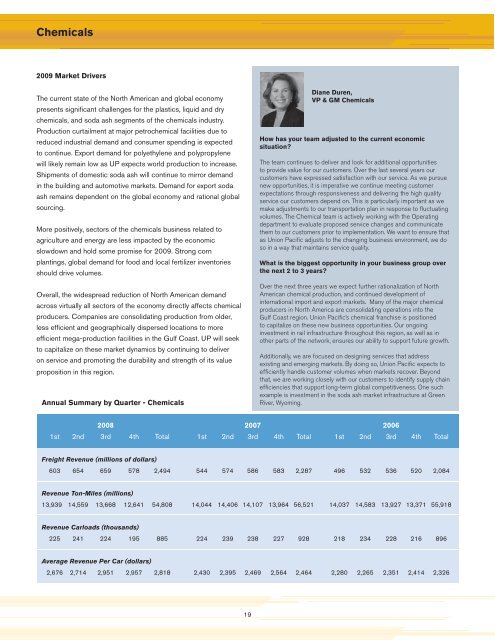
Chemicals2009 Market DriversThe current state of the North American and global economypresents signifi cant challenges for the plastics, liquid and drychemicals, and soda ash segments of the chemicals industry.Production curtailment at major petrochemical facilities due toreduced industrial demand and consumer spending is expectedto continue. Export demand for polyethylene and polypropylenewill likely remain low as UP expects world production to increase.Shipments of domestic soda ash will continue to mirror demandin the building and automotive markets. Demand for export sodaash remains dependent on the global economy and rational globalsourcing.More positively, sectors of the chemicals business related toagriculture and energy are less impacted by the economicslowdown and hold some promise for 2009. Strong cornplantings, global demand for food and local fertilizer inventoriesshould drive volumes.Overall, the widespread reduction of North American demandacross virtually all sectors of the economy directly affects chemicalproducers. Companies are consolidating production from older,less effi cient and geographically dispersed locations to moreeffi cient mega-production facilities in the Gulf Coast. UP will seekto capitalize on these market dynamics by continuing to deliveron service and promoting the durability and strength of its valueproposition in this region.Annual Summary by Quarter - ChemicalsDiane Duren,VP & GM ChemicalsHow has your team adjusted to the current economicsituation?The team continues to deliver and look for additional opportunitiesto provide value for our customers. Over the last several years ourcustomers have expressed satisfaction with our service. As we pursuenew opportunities, it is imperative we continue meeting customerexpectations through responsiveness and delivering the high qualityservice our customers depend on. This is particularly important as wemake adjustments to our transportation plan in response to fluctuatingvolumes. The Chemical team is actively working with the Operatingdepartment to evaluate proposed service changes and communicatethem to our customers prior to implementation. We want to ensure thatas <strong>Union</strong> <strong>Pacific</strong> adjusts to the changing business environment, we doso in a way that maintains service quality.What is the biggest opportunity in your business group overthe next 2 to 3 years?Over the next three years we expect further rationalization of NorthAmerican chemical production, and continued development ofinternational import and export markets. Many of the major chemicalproducers in North America are consolidating operations into theGulf Coast region. <strong>Union</strong> <strong>Pacific</strong>’s chemical franchise is positionedto capitalize on these new business opportunities. Our ongoinginvestment in rail infrastructure throughout this region, as well as inother parts of the network, ensures our ability to support future growth.Additionally, we are focused on designing services that addressexisting and emerging markets. By doing so, <strong>Union</strong> <strong>Pacific</strong> expects toefficiently handle customer volumes when markets recover. Beyondthat, we are working closely with our customers to identify supply chainefficiencies that support long-term global competitiveness. One suchexample is investment in the soda ash market infrastructure at GreenRiver, Wyoming.<strong>2008</strong> 2007 20061st 2nd 3rd 4th Total 1st 2nd 3rd 4th Total 1st 2nd 3rd 4th TotalFreight Revenue (millions of dollars)603 654 659 578 2,494 544 574 586 583 2,287 496 532 536 520 2,084Revenue Ton-Miles (millions)13,939 14,559 13,668 12,641 54,808 14,044 14,406 14,107 13,964 56,521 14,037 14,583 13,927 13,371 55,918Revenue Carloads (thousands)225 241 224 195 885 224 239 238 227 928 218 234 228 216 896Average Revenue Per Car (dollars)2,676 2,714 2,951 2,957 2,818 2,430 2,395 2,469 2,564 2,464 2,280 2,265 2,351 2,414 2,32619


