Create successful ePaper yourself
Turn your PDF publications into a flip-book with our unique Google optimized e-Paper software.
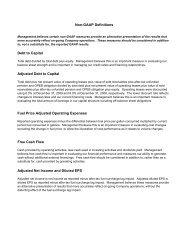
AgriculturalCommodity ProfileAgricultural transportation, including whole grains, commoditiesproduced from these grains, and food and beverage products,provided 18 percent of the Railroad’s <strong>2008</strong> freight revenue. Withaccess to most major grain markets, <strong>Union</strong> Pacifi c provides acritical link between the Midwest and western producing areasand export terminals in the PNW and Gulf Coast ports, as well asMexico. Unit shuttle trains transport a single commodity effi cientlybetween producers and export terminals or domestic markets.UP also serves signifi cant domestic markets, including grainprocessors, animal feeders and ethanol producers in the Midwest,West, South and Rocky Mountain states.<strong>2008</strong> CarloadsWhole Grains 45%Domestic Feed Grains 21%Export Feed Grains 11%Wheat & Food Grains 13%International 16%Mexico 14%Domestic 70%Grain Products 37%Meals & Oils 14%Feed Ingredients 9%Flour & Rice 5%Corn Refining & Ethanol 9%<strong>Union</strong> Pacifi c owns and operates the largest refrigerated boxcarfl eet in the industry, providing a competitive advantage thatleverages the Company’s unique franchise. Produce Railexpressand Express Lane are UP’s premium perishables service offerings.Produce Railexpress carries fresh produce from the West Coastto New York. Express Lane moves dairy products, canned goods,wine, frozen foods and some fresh produce from the WestCoast to destinations in the East and Southeast. California andWashington, the states directly served by these services, produceover 60 percent of the nation’s fresh fruits and vegetables.Additionally, the Railroad transports frozen meat and poultry fromthe Midwest and Mid-South to the West Coast for export.Through alliances with other railroads, UP considers Canada andMexico important extensions of its domestic markets. Southboundshipments of feed grains, wheat, soybean meal, DDGS and ricecomprise nearly 70 percent of Agricultural carloads to and fromAgricultural Line Density MapFood & Beverage 18%Brewers & Food 9%Frozen & Refrigerated 5%Malt, Barley & Sugar 4%Mexico. Shipments of beer account for most of the northboundtraffi c into the U.S.2009 Market DriversAgricultural Products reported record revenue in <strong>2008</strong>. Volumesare expected to be lower in 2009 due to weaker export demand,reduced animal feeding and less soybean processing.Weaker U.S. and world economies, and more abundant non-U.S.grain supplies softened the demand for food and bio-fuel basedgoods produced in the U.S. Livestock inventories for the fi rstquarter of 2009 were about 5 percent below the same period lastyear. This reduction translates into less animal feeding of corn andother protein-based feeds such as soybean meal.Through March 2009, export corn sales for the fi rst sevenmonths of the <strong>2008</strong>/2009 crop year came in 34 percent belowlast year’s levels. Export wheat sales for the fi rst ten months ofthe <strong>2008</strong>/2009 crop year declined 23 percent year-over-year.Although export soybeans for the fi rst seven months of the<strong>2008</strong>/2009 crop year were 10 percent higher than last year,soybean crushing for the fi rst six months of the <strong>2008</strong>/2009 cropyear was 10 percent below the same period last year. The USDAexpects soybean crush to fi nish the <strong>2008</strong>/2009 crop year down9 percent from last year. At the same time, the overall UDSAagricultural outlook calls for improved conditions in the last halfof 2009, and U.S. grain production is the key variable behind thisLane density based on carloadings. Line thickness depicts traffi c density.13