Create successful ePaper yourself
Turn your PDF publications into a flip-book with our unique Google optimized e-Paper software.
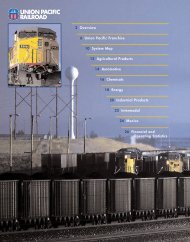
Company Overview<strong>Union</strong> Pacifi c Corporation owns one of America’s leadingtransportation companies, the <strong>Union</strong> Pacifi c Railroad Company(Company, UP or Railroad). The Railroad links 23 states in thewestern two-thirds of the country and serves the fastest-growingU.S. population centers. The Company maintains coordinatedschedules with other rail carriers to move freight to and from theAtlantic Coast, the Pacifi c Coast, the Southeast, the Southwest,Canada, and Mexico. The Railroad serves the East through majorgateways in Chicago, St. Louis, Memphis and New Orleans. Inaddition, UP is the only railroad serving all six major Mexicangateways and operates key north/south corridors for interchangetraffi c with the Canadian and Mexican rail systems. UP reachesnorth into Canada through the Eastport gateway in Idaho, aswell as through exchange points in Minnesota, Wisconsin andIllinois. That network, combined with a well-balanced and diversetraffi c mix, makes UP the premier rail franchise in North America,generating $17.1 billion in freight revenue in <strong>2008</strong>.<strong>Union</strong> Pacifi c’s freight traffi c consists of bulk, manifest andpremium business. Bulk traffi c is primarily the shipment of coal,grain, rock and soda ash in unit trains. Access to the SouthernPowder River Basin (SPRB) coal fi elds of northeastern Wyomingis a key franchise strength. UP also provides direct routes frommajor grain-producing areas in the Midwest to domestic markets,Mexico and ports in the Gulf Coast and Pacifi c Northwest (PNW)for export.Traffic Classification - <strong>2008</strong> CarloadsBridged 3%Forwarded21%UPDestination15%Local61%Local = UP Origin + UP DestinationForwarded = UP Origin + Other DestinationUP Destination = Other Origin + UP DestinationBridged = Other Origin + UP Intermediate + Other DestinationFreight Traffic - <strong>2008</strong> CarloadsPremium41%Bulk34%Manifest traffi c is individual carload or less-than-trainloadbusiness, including commodities such as lumber, steel, paper andfood, transported from thousands of locations on <strong>Union</strong> Pacifi c’svast network. <strong>Union</strong> Pacifi c also accesses the large chemicalproducingareas along the Gulf Coast.The Railroad’s premium business includes the transportationof fi nished vehicles, intermodal containers and truck trailers.UP’s extensive automotive network handles 75 percent of therail-shipped automotive traffi c west of the Mississippi River.The Railroad also serves the international import market with itscompetitive long-haul routes connecting the West Coast ports andeastern gateways, particularly along the Sunset Corridor from LosAngeles to El Paso.The strength of this diverse franchise and effi cient utilization of theRailroad’s capacity enables the Company to provide its customerswith excellent service, which generates solid fi nancial returns forour shareholders.Business Mix - <strong>2008</strong> Freight RevenueIntermodal18%IndustrialProducts19%Manifest25%Energy22%Agricultural18%Automotive8%Chemicals15%3
The Year in Review - OperationsImproving operational effi ciency is a critical goal for <strong>Union</strong> Pacifi c,especially in the current economic environment. The Company isfocused on simplifying and streamlining rail operations across itsvast, complex network. Using resources effi ciently is essential toimproving service and shareholder value.Process improvement, organizational effectiveness, technologyand capacity investment all improved network fl uidity andincreased customer satisfaction. Lower volumes also contributedto the effi ciency improvements. System velocity increased 8percent over 2007, and the Company’s service delivery index, acomposite metric of all customer commitments, set an all-timerecord for the year, up nearly 11 percent over 2007. More effi cientasset utilization reduced terminal dwell times by 1 percent andlowered overall car inventories by 3 percent.Workforce productivity is key at <strong>Union</strong> Pacifi c, and in <strong>2008</strong> theCompany correlated its staffi ng levels with volume. For the year,Gross Ton-Miles (GTMs) were 3 percent lower than 2007, andthe Company had 4 percent fewer employees. A high attrition ratedue to an aging workforce combined with increased effi ciency andtechnology made these necessary staffi ng reductions possible.The Company’s Unifi ed Plan streamlines segments of thetransportation plan. Enhancements to this ongoing programproduced more effi cient train processing at terminals during theyear. Additionally, targeted capital investments and continueduse of industrial engineering techniques increased capacity andcontributed to improved network fl uidity and asset utilization.AAR Train Speed(MPH)Service Delivery Index (SDI)*21.421.823.56976842006 2007 <strong>2008</strong>2006 2007 <strong>2008</strong>* Includes early deliveriesOperations Summary<strong>Union</strong> <strong>Pacific</strong> Corporation <strong>2008</strong> 2007 2006Revenue Carloads (thousands) 9,261 9,733 9,852Revenue Ton-Miles (billions) 563 562 565Gross Ton-Miles (billions) 1,020 1,052 1,073Average Train Speed (miles per hour) (a) 23.5 21.8 21.4Average System Dwell (hours) (a) 24.9 25.1 27.2Average Rail Car Inventory (a) 300,692 309,912 321,566Fuel Consumed (millions of gallons) 1,229 1,326 1,372GTMs per Employee (millions) 21.15 21.01 21.14(a) As reported to the Association of American Railroads.5
The Year in Review - OperationsThe Company modifi es its transportation plans to refl ect traffi cpatterns, customer demand and to take advantage of newopportunities to improve effi ciency. For example, manifest businesscarloads declined 7 percent over the past couple of years. Leftunchanged, this decrease would have meant running shorter trainswith little to no savings on crew expenses, fuel, or equipmentrents. Through the Unifi ed Plan’s evergreen process, averagemanifest train length increased by three cars in 2007 and by twocars in <strong>2008</strong> to leverage lower volumes into fewer train starts.Similarly, coal carloadings increased 2 percent over the past twoyears. Increasing the average coal train size by two cars in 2007and one car in <strong>2008</strong> resulted in train starts essentially remainingfl at.Technology enables the Company to continually focus oninventory management, using tools such as the CustomerInventory Management System (CIMS). CIMS is a car demandmanagement process that matches the fl ow of rail cars to andfrom customer locations with the track capacity at those locations.This proactive approach to inventory control means fewer cars inrail yards, which in turn decreases terminal dwell time, reducesswitching and congestion, and improves throughput. Technologyis also employed in the increased usage of distributed powerlocomotives, adding to the effi ciency of locomotive and crewresources and saving fuel.6
The Year in Review - MarketingDespite the challenge of a weakening economy that resulted in a 5percent decline in volume, <strong>Union</strong> Pacifi c’s freight revenue grew toa record $17.1 billion in <strong>2008</strong>. The Company continued to createcustomer value through strategic investments, operating initiatives,process improvements and innovation.The economic downturn hit the Automotive business particularlyhard in <strong>2008</strong>, as fi nished automobile volume dropped 23 percentand auto parts shipments declined 13 percent. <strong>Union</strong> Pacifi c isthe leading vehicle transporter in the West, and this signifi cantshortfall of demand drove the decreases. Weakness in housingand construction markets held Industrial Products volume 6percent below last year. Intermodal volumes declined 8 percent,as a portion of the international intermodal market is tied to theautomotive and housing industries. Chemicals shipments ran atlevels similar to 2007 through the fi rst eight months of <strong>2008</strong>,then fi nished the year down 5 percent. The two major Gulf Coasthurricanes that disrupted customers’ facilities in late September,followed by the sharp downturn in the economy in the fourthquarter, led to the decline.In <strong>2008</strong>, UP benefi ted from a strong service performance, makingit possible to capture growth opportunities. Combining servicewith innovation facilitates the launch of new products, such asadding a second California origin to the Produce Railexpressperishables service and pioneering vehicle co-loading in theautomotive marketplace. Additionally, a number of intermodalservice products were improved. Targeted capital investmentsover the past few years contributed to service improvement andincreased value for customers. In <strong>2008</strong>, UP reported record levelsof customer satisfaction.Pricing Opportunities(Percentage of revenue as of January 1, 2009)Repriced82%since 2004
Safety and the Environmentparticulate matter and other pollutants. With more than twothirdsof its road locomotives certifi ed under the existing EPAtier standards, UP owns the cleanest fl eet in the nation. Furtherimprovements are on the horizon as the Company works withmanufacturers to fi eld-test new, high-horsepower locomotives thatsurpass the EPA’s most stringent standards. UP is also retrofi ttingolder locomotives with new emission-reduction equipment.<strong>Union</strong> Pacifi c has a comprehensive waste reduction andrecycling program that touches nearly every part of the Company.Concerted efforts are made to address high-volume items suchas wooden track ties and used oil. When possible, wooden trackties are refurbished for use elsewhere on the UP system or sold tocontractors. UP is also installing more concrete ties, which requirelower maintenance and generate less waste than wooden ties.UP helped test and develop an ultra low-emissions switchlocomotive, the “Genset Switcher”. These units utilize “off-road”truck–style diesel engines that are projected to reduce emissionsof nitrogen oxide by 80 percent and particulate matter by 90percent. Additionally, these engines use as much as 37 percentless fuel compared to current older switching locomotives. UP’scommitment to, and operation of, the Genset resulted in thecompany earning the <strong>2008</strong> CALSTART Blue Sky Merit Award. Thisaward recognizes outstanding contributions to clean air, energyeffi ciency and a cleaner transportation industry overall. <strong>Union</strong>Pacifi c also partnered with the EPA on one-of-a-kind fi eld testingto reduce emissions on older road and switch locomotives.Did you know...?• Trains are almost four times more fueleffi cient than trucks on a ton-mile basis.• If just 10 percent of the freight moved byhighway were diverted to rail, the nationcould save as much as 1 billion gallons offuel annually.• Fuel effi ciency for U.S. railroads hasincreased by 86 percent since 1980.• One double-stack train can take up to300 trucks off congested highways.9
Investing in Our Future<strong>Union</strong> Pacifi c’s vast network requires large capital commitmentseach year in order to ensure and enhance operational safety,expand capacity to meet the transportation needs of current andfuture customers and improve operational effi ciency. Capitalinvestments include the replacement and improvement of trackand facilities, and the acquisition of new locomotives and freightcars. In <strong>2008</strong>, UP’s total capital investments were $3.1 billion,including cash spending of $2.8 billion. The Company’s capitalcan be broadly classifi ed into two categories: replacement capitaland growth capital. Replacement capital is spending required toimprove safety or replace current infrastructure, such as track,facilities and equipment. Growth capital is targeted at futureneeds of the Company and its customers, supporting both volumeexpansion and effi ciency. Equipment acquisitions are includedwithin both of these capital categories. New equipment is neededto add capacity to the network as well as to replace older, lesseffi cient assets.Replacement CapitalThe Company spent approximately $1.7 billion replacing trackand facilities under its engineering replacement program in <strong>2008</strong>.This program included the installation of nearly 4.1 million tiesand 694 track miles of rail, providing safe and fl uid operationsand increasing network effi ciency through capital investments.All together, UP spent approximately $2.2 billion in <strong>2008</strong> onreplacement capital.In 2009, <strong>Union</strong> Pacifi c expects to spend around $1.7 billion inengineering replacement, installing nearly 4.4 million ties andover 850 track miles of rail. Additionally, the Company plans toacquire 125 high-horsepower locomotives during the year. Thelocomotives represent the fi nal tranche of a three-year purchasingcontract, and will replace older units that are at the end of theiruseful life. Total replacement capital spending for 2009 shouldapproximate $2.1 billion.Capital Spending($ Billions)2.431%2.92.730% 25%3.1 3.12.629% 29% 19%2004 2005 2006 2007 <strong>2008</strong> 2009 EReplacement CapitalGrowth Capital<strong>2008</strong>, making it approximately 60 percent double tracked at yearend. Given the signifi cant decline in traffi c volume in late <strong>2008</strong>and early 2009, the Company scaled back the project spending.Only 11 miles are scheduled for completion in 2009. During <strong>2008</strong>,a new intermodal facility at San Antonio, TX opened, and theCompany acquired property for the construction of an intermodalfacility in Joliet, IL.An important part of <strong>Union</strong> Pacifi c’s franchise is its access tothe SPRB coal fi elds of northeastern Wyoming through a jointline, which UP owns with the BNSF (the Joint Line). In 2007 thefi nal sections of the Joint Line were triple tracked, and capacityexpansion continued in <strong>2008</strong> with 20 miles of quadruple trackadded. Ten miles of triple track were also added to UP’s line intothe SPRB during <strong>2008</strong>, and an additional 8 miles are scheduledfor 2009.The Company also spent approximately $105 million ontechnology to support growth during the year. Upgrades totelecommunications and mainframe software systems, a new crewdispatching system and advancement of positive train control werethe major technology spending initiatives in <strong>2008</strong>.Growth Capital<strong>Union</strong> Pacifi c spent approximately $900 million on growth capitalin <strong>2008</strong>. One of the Company’s key routes is the Sunset Corridor,which runs between Los Angeles, CA and El Paso, TX. This heavilytraveled corridor carries about 20 percent of all traffi c operated bythe Railroad. UP added 45 miles of double track to the corridor inIn 2009, <strong>Union</strong> Pacifi c expects to spend approximately $500million for growth capital. Capacity expansion on the OverlandRoute, which runs between Oakland, CA and Chicago, IL, and theSunset Corridor is expected to continue during the year. Furtherprogress is anticipated on the Joliet, IL intermodal facility, andtechnology spending is planned to upgrade information technologysystems and continue testing new operational technology such aspositive train control.10
Track and Terminal DensityLane density based on carloadingsLine thickness depicts traffi c density<strong>2008</strong> Terminal VolumesMajor Classification Yards Average Daily Volume/CarsNorth Platte, Nebraska 2,500North Little Rock, Arkansas 1,600Proviso (Chicago), Illinois 1,500Englewood (Houston), Texas 1,300Fort Worth, Texas 1,300Roseville, California 1,300Livonia, Louisiana 1,200West Colton, California 1,200Pine Bluff, Arkansas 1,200Neff (Kansas City), Missouri 1,000Major Intermodal TerminalsAnnual LiftsICTF (Los Angeles), California 619,000East Los Angeles, California 383,000Marion (Memphis), Tennessee 360,000Global 2 (Chicago), Illinois 299,000Dallas, Texas 294,000Global 1 (Chicago), Illinois 291,000Seattle, Washington 228,000Yard Center (Chicago), Illinois 227,000Oakland, California 222,000Englewood (Houston), Texas 207,00011
Expense InitiativesRailroads are very asset-intensive businesses, so economicdownturns and associated volume declines put effi ciency at theforefront.Cost StructureIn <strong>2008</strong>, <strong>Union</strong> Pacifi c’s operating expenses totaled $13.9 billion,with fuel and compensation comprising more than 60 percent ofthe total. Approximately 30 percent of the total costs are linked toquarterly volume changes. Expenses for train crews, locomotivefuel and some short-term equipment costs fl uctuate directlywith business levels. In addition, changes in fuel prices impactexpenses, especially since the Railroad does not recover 100percent of its annual fuel costs through surcharges and other costrecovery mechanisms.The Company’s costs that vary with volume increase toapproximately 50 percent of the total over a period of severalquarters. However, the key to expanding from 30 to 50 percent isvisibility with respect to future business levels. In an environmentof sustained lower volumes, the Railroad requires less mechanicaland engineering work, equipment and staff. Longer-term, over anumber of years, costs can be even more variable as the businessis sized to match volume levels.Resource ManagementUP’s resources must be adequate to meet volume demand. In2004, the Company experienced more demand than capacity.Today the other extreme is seen - excess capacity. Although thefi xed network is sized to handle roughly 200,000 weekly carloads,fi rst quarter 2009 demand levels resulted in approximately146,000 weekly carloads.As volumes remain soft, the Company is acting aggressively toalign its resources with current demand levels by furloughingemployees and storing locomotives and freight cars. These idleresources position <strong>Union</strong> Pacifi c to effi ciently handle the volumeswhen freight demand recovers.Management of train operations improved over the past severalyears through continued implementation of the Unifi ed Planto simplify the network. The management of train crews alsochanged. Limiting crew miles and staffi ng “cutback” engineersallows more trains to run with the existing crew base, and providesextra personnel trained as engineers to be available for immediateuse as volumes increase.Ongoing cost reduction action must be taken while still protectingservice commitments. Excellent service is the key to enteringnew, truck-competitive markets and increasing the value of railtransportation for customers.<strong>2008</strong> Operating ExpensesCompensation& Benefits32%Fuel 29%PurchasedServices& Material14%Equipment Rents9%Depreciation10%Other6%Short-Term Variable(30% of Expenses)- Train Crews- Locomotive Fuel- Equipment RentsLong-Term Variable(Increases to 50%)- Mechanical &Engineering Expense- Equipment Rents- Workforce LevelsProject Operating RatioProject Operating Ratio (Project OR) is part of <strong>Union</strong> Pacifi c’songoing effi ciency improvement efforts. This corporate-wideinitiative seeks to increase effi ciency, effectiveness and safety.Project OR is helping the Railroad manage through the currenteconomic challenges, while positioning it for the long term.<strong>Union</strong> Pacifi c employees use the principles of Project OR tofocus on driving higher returns. Employees are making changes toimprove overall effi ciency and effectiveness, and these changesare expected to yield benefi ts for the Company now and in thefuture.12
AgriculturalCommodity ProfileAgricultural transportation, including whole grains, commoditiesproduced from these grains, and food and beverage products,provided 18 percent of the Railroad’s <strong>2008</strong> freight revenue. Withaccess to most major grain markets, <strong>Union</strong> Pacifi c provides acritical link between the Midwest and western producing areasand export terminals in the PNW and Gulf Coast ports, as well asMexico. Unit shuttle trains transport a single commodity effi cientlybetween producers and export terminals or domestic markets.UP also serves signifi cant domestic markets, including grainprocessors, animal feeders and ethanol producers in the Midwest,West, South and Rocky Mountain states.<strong>2008</strong> CarloadsWhole Grains 45%Domestic Feed Grains 21%Export Feed Grains 11%Wheat & Food Grains 13%International 16%Mexico 14%Domestic 70%Grain Products 37%Meals & Oils 14%Feed Ingredients 9%Flour & Rice 5%Corn Refining & Ethanol 9%<strong>Union</strong> Pacifi c owns and operates the largest refrigerated boxcarfl eet in the industry, providing a competitive advantage thatleverages the Company’s unique franchise. Produce Railexpressand Express Lane are UP’s premium perishables service offerings.Produce Railexpress carries fresh produce from the West Coastto New York. Express Lane moves dairy products, canned goods,wine, frozen foods and some fresh produce from the WestCoast to destinations in the East and Southeast. California andWashington, the states directly served by these services, produceover 60 percent of the nation’s fresh fruits and vegetables.Additionally, the Railroad transports frozen meat and poultry fromthe Midwest and Mid-South to the West Coast for export.Through alliances with other railroads, UP considers Canada andMexico important extensions of its domestic markets. Southboundshipments of feed grains, wheat, soybean meal, DDGS and ricecomprise nearly 70 percent of Agricultural carloads to and fromAgricultural Line Density MapFood & Beverage 18%Brewers & Food 9%Frozen & Refrigerated 5%Malt, Barley & Sugar 4%Mexico. Shipments of beer account for most of the northboundtraffi c into the U.S.2009 Market DriversAgricultural Products reported record revenue in <strong>2008</strong>. Volumesare expected to be lower in 2009 due to weaker export demand,reduced animal feeding and less soybean processing.Weaker U.S. and world economies, and more abundant non-U.S.grain supplies softened the demand for food and bio-fuel basedgoods produced in the U.S. Livestock inventories for the fi rstquarter of 2009 were about 5 percent below the same period lastyear. This reduction translates into less animal feeding of corn andother protein-based feeds such as soybean meal.Through March 2009, export corn sales for the fi rst sevenmonths of the <strong>2008</strong>/2009 crop year came in 34 percent belowlast year’s levels. Export wheat sales for the fi rst ten months ofthe <strong>2008</strong>/2009 crop year declined 23 percent year-over-year.Although export soybeans for the fi rst seven months of the<strong>2008</strong>/2009 crop year were 10 percent higher than last year,soybean crushing for the fi rst six months of the <strong>2008</strong>/2009 cropyear was 10 percent below the same period last year. The USDAexpects soybean crush to fi nish the <strong>2008</strong>/2009 crop year down9 percent from last year. At the same time, the overall UDSAagricultural outlook calls for improved conditions in the last halfof 2009, and U.S. grain production is the key variable behind thisLane density based on carloadings. Line thickness depicts traffi c density.13
Agriculturalexpectation. While overall production levels in 2009 are projectedto be lower than <strong>2008</strong>, the results should depict a more normalyear for grain volumes.Paul Hammes,VP & GM AgriculturalEthanol is expected to deliver continued year-over-year volumegrowth for <strong>Union</strong> Pacifi c. However, as the market begins tomature, the annual growth rate should slow. As of March 2009, theannualized rate of ethanol blending was about 5 percent below themandated levels of The Energy Independence and Security Act of2007. As with grain markets, ethanol volumes are forecasted toincrease in the latter part of 2009.Amid some of the overall economic uncertainty, the refrigeratedmarkets show opportunity. The Produce Railexpress service shouldcontinue to grow in 2009, with a second California train starting.Additional opportunities to transport frozen meat for export as wellas domestic produce are also anticipated.How has your team adjusted to the current economicsituation?Agricultural demand in the first quarter of 2009 has been weak. Animalfeeding, grain exports, soybean processing and ethanol productionlevels are all below industry projections. However, demand for thesecommodities should begin to increase in the last half of 2009. The keyvariable for 2009 is the number of acres of corn, soybeans and wheatthat are planted, as well as the growing conditions. <strong>Union</strong> <strong>Pacific</strong> hasadjusted to these lower volumes with improved service and resourceavailability, allowing us to secure additional refrigerated business forboth meat exports and U.S. produce markets.What is the biggest opportunity in your business group overthe next 2 to 3 years?Future opportunities will include continued development of ourinfrastructure to support ethanol production and growth in our ProduceRailexpress Unit Train service. Corn-based ethanol demand shouldgrow another 4.5 billion gallons per year (up 42 percent) by 2015due to the government mandate. A good portion of the new demandwill come from California and Texas. In 2010, when California extendsits ethanol mandate from 5 to 10 percent, <strong>Union</strong> <strong>Pacific</strong> expects tosee additional opportunities to supply corn to existing forward ethanolplants. These plants produce ethanol closer to consumption areasand account for more than 300 million gallons of annual productioncapacity. The Produce Railexpress service continues to buildmomentum in the produce markets of Washington and California whileincreasing its demand base into the Northeast. This consistent andtruck-competitive service makes it a very viable product with stronggrowth potential.Annual Summary by Quarter - Agricultural<strong>2008</strong> 2007 20061st 2nd 3rd 4th Total 1st 2nd 3rd 4th Total 1st 2nd 3rd 4th TotalFreight Revenue (millions of dollars)756 778 848 792 3,174 611 605 670 719 2,605 558 562 595 670 2,385Revenue Ton-Miles (millions)22,485 22,111 22,431 21,560 88,588 19,249 18,935 20,613 21,735 80,532 20,085 19,756 19,793 21,378 81,012Revenue Carloads (thousands)240 236 243 228 947 219 212 232 239 902 234 225 227 237 923Average Revenue Per Car (dollars)3,151 3,301 3,486 3,472 3,352 2,793 2,855 2,888 3,006 2,888 2,386 2,494 2,626 2,825 2,58414
AutomotiveCommodity Profile<strong>2008</strong> CarloadsShipments of fi nished vehicles and automotive parts and materialsgenerated 8 percent of <strong>Union</strong> Pacifi c’s <strong>2008</strong> freight revenue.Finished vehicles accounted for 77 percent of this revenue,with the remaining 23 percent coming from the movement ofautomotive parts and materials.<strong>Union</strong> Pacifi c’s franchise provides excellent accessibility to allmajor markets west of the Mississippi River for delivery of fi nishedvehicles to the manufacturers’ dealer networks. UP continuesto be the largest automotive carrier in the western U.S., directlyserving six vehicle assembly plants. Service is also provided to38 automotive distribution facilities directly or through short linerailroads. Additionally, connections to six West Coast ports andthe Port of Houston accommodate both imported vehicles andvehicles moving to and from Hawaii and Alaska. <strong>Union</strong> Pacifi calso receives and delivers a signifi cant number of vehicles throughinterchange with railroads in Mexico, Canada and the U.S.U.S. new light vehicle sales declined to 13.2 million vehicles in<strong>2008</strong>, down 18 percent from 2007 levels. North American lightvehicle production for the year was down 16 percent to 13.0million units. UP’s fi nished vehicle shipment revenue declined11 percent while carloads were off nearly 23 percent in <strong>2008</strong>.Although auto parts and materials volume decreased 13 percentfrom 2007, pricing actions and increased fuel surchargesincreased revenue by 3 percent year-over-year.Automotive Line Density MapInternational 7%Mexico 44%Domestic 49%Assembled Autos 60%Automotive Materials 40%<strong>Union</strong> Pacifi c handled more than 75 percent of the automotivecarload business in the western U.S. in each of the last twoyears. Changing dynamics among manufacturers in the industry isexpected to affect fi nished vehicle shipments as the manufacturerswork to keep or gain market share. The Domestic Big Threeincurred a market share loss during <strong>2008</strong>. Collectively they holdabout 48 percent of the new light vehicle market share in the U.S.Toyota, Nissan and other non-Detroit manufacturers have domesticmanufacturing capabilities and import a signifi cant number ofvehicles via West Coast ports. <strong>Union</strong> Pacifi c faces competitionfrom trucks for the fi nished vehicles imported through the WestCoast and destined for western automotive dealerships.Nearly 44 percent of UP’s automotive shipments move either toor from Mexico. This amount includes fi nished vehicle carloads aswell as parts and materials moving in intermodal or boxcar service.<strong>Union</strong> Pacifi c handles more than 85 percent of all automotivetraffi c into and out of Mexico. During <strong>2008</strong>, Mexico parts andmaterials shipments decreased 10 percent while fi nished vehiclemoves decreased 8 percent.Lane density based on carloadings. Line thickness depicts traffi c density.UP launched new product offerings in <strong>2008</strong> with the new Unileveland AutoMax cars. The Unilevel railcars are designed to effi cientlyhandle oversize products, while the AutoMax can convert from atri-level to a bi-level confi guration. The AutoMax’s ability to handledifferent vehicle sizes positions <strong>Union</strong> Pacifi c to support futurevehicle market trends. Also, the Railroad introduced a long-termvehicle storage program to help alleviate customers’ accumulatinginventory issues in today’s challenging market.15
Automotive2009 Market DriversU.S. light vehicle sales are expected to decline in 2009, continuinga trend that began in 2005. Further, manufacturers’ extendedplant shutdowns and shift reductions are negatively impactingproduction volumes. UP is primarily a destination hauler of fi nishedvehicles and has a diverse customer base that includes importand transplant manufacturers, which helps mitigate the effects oflower Domestic Big Three vehicle sales. Additionally, the Railroadis engaged in monitoring the development of distribution plans forimports from China and India. The Company is implementing anactive sales strategy for China to handle the expected import partsand vehicle volume.Participation by Chrysler and General Motors in the TroubledAsset Relief Program (TARP) may have indirect consequencesfor UP. Failure under this program could result in bankruptcy orcorporate restructuring. However, success may allow for thecontinuation of current relationships and contracts, and, therefore,<strong>Union</strong> Pacifi c is closely monitoring these matters.Traffi c to and from Mexico is also expected to decline as thefi nancial turmoil impacts the global economy. Shipping fi rmscontinue to look for opportunities to improve asset utilization. UP isseeking to develop import business which would access rail fromWest Coast ports, bypassing the Panama Canal and subsequentEast Coast port originations.UP is making infrastructure improvements across its system tohandle profi table traffi c growth. Improvements at Portland, OR,Houston, TX, and Chicago, IL are directed at the automotivebusiness. Also, continued implementation of the vehicle inventorydwell system will help ensure a high level of inventory accuracyand effi cient asset utilization.The Railroad capitalizes on its strong interline carrier alliances tosecure opportunities for automotive parts and materials. Theseopportunities include boxcar direct and moves bundled with crossdock truck-to-rail and rail-to-truck shipments.Additional growth opportunities exist with the Railroadsubsidiaries: Insight Network Logistics, Insight Network Transportand <strong>Union</strong> Pacifi c Distribution Services (UPDS). These companiesJulie Krehbiel,VP & GM AutomotiveHow has your team adjusted to the current economicsituation?Although economic conditions are affecting automotive carloads, UPis well-positioned over the long term with a broad base of customers.With a significantly weakened economy, it is very important tostrengthen the automotive service network by improving transit times,ensuring consistency, and incorporating transportation efficienciesinto the delivered product. In <strong>2008</strong>, gateway changes were madeand product was shifted to more strategically placed auto ramps.The Railroad also leveraged its intermodal network to maintaincustomer service despite lower volumes. In addition, the first everinterline co-load capability was launched with the Norfolk Southern(NS) by loading Chrysler and Ford vehicles together on the samerailcars. This approach allows the original equipment manufacturersto reduce vehicle dwell time at the load and unload facilities. In fact,the Ford-Chrysler interline move is yielding a 20 percent reduction inorigin dwell time. These efforts improve the Company’s economics andbenefits customers as well.What is the biggest opportunity in your business group overthe next 2 to 3 years?Many of UP’s opportunities are for organic growth associated withthe existing traffic base. The Railroad holds a market share of morethan 75 percent of all vehicles moving in the western U.S by rail.Our unparalleled automotive ramp network, including facilities in sixof the top ten fastest growing U.S. states, is expected to facilitatemarket growth once the overall industry rebounds. Parts opportunitiescontinue as production parts convert from over-the-road to intermodaland boxcar rail service. <strong>Union</strong> <strong>Pacific</strong> is also looking at non-traditionalmarkets such as service parts, mini-cars and European manufacturers.We reallocated sales resources in late <strong>2008</strong> to focus on these areasas well as production parts, to offset the current vehicle marketweakness. The co-load capability launched in <strong>2008</strong> is expected tofacilitate expansion of our footprint in the used car arena through jointefforts with Insight Network Transportation, a UP subsidiary and usedcar transportation broker. For the long term, we also see significantopportunities associated with vehicles assembled in China and India.We are positioning our network accordingly by aligning with keysteamship lines, ports and transportation partners.offer supply chain logistic services for major automotivemanufacturers. Insight Network Transport is making inroads intothe used car remarketing area by providing management andcoordination services for vehicle auction companies and rental carfi rms. Marketed jointly with UP’s rail services, these subsidiariescan assist manufacturers in meeting customers’ changinginventory needs and provide continued growth opportunities. Infact, <strong>2008</strong> revenue in this area was up 20 percent from 2007, andthis growth trend is expected to continue in 2009 and beyond.16
Automotive Facilities and Assembly CentersKentTacomaSpokaneBarnesSt. John’sSilver BowSt. PaulJanesvilleBeniciaMilpitasFremontValleyRoperRollaCouncil BluffsMuncieFairfaxBelvidereCentrevilleWest ChicagoChicago HeightsPort HuenemeWilmingtonMira LomaCalexicoPhoenixNogalesSantaRosaDistribution Centers, <strong>Union</strong> <strong>Pacific</strong>-Owned/LeasedDistribution Centers/Ports, Privately-OwnedAssembly CentersGateways to MexicoEl PasoAmarilloEagle PassLaredoOklahoma CityMesquiteMidlothianSanAntonioArlingtonKirbyBrownsvilleShreveportReisorCandleridgeWestfieldPort of HoustonGavinPort AllenAnnual Summary by Quarter - Automotive<strong>2008</strong> 2007 20061st 2nd 3rd 4th Total 1st 2nd 3rd 4th Total 1st 2nd 3rd 4th TotalFreight Revenue (millions of dollars)363 352 324 305 1,344 354 387 348 369 1,458 358 390 325 354 1,427Revenue Ton-Miles (millions)3,890 3,646 3,278 3,169 13,983 4,330 4,685 4,250 4,217 17,482 4,661 4,994 4,143 4,521 18,319Revenue Carloads (thousands)188 176 153 150 667 201 221 201 203 826 210 225 191 208 834Average Revenue Per Car (dollars)1,930 2,005 2,114 2,040 2,017 1,759 1,754 1,729 1,823 1,766 1,705 1,737 1,697 1,698 1,71017
ChemicalsCommodity ProfileTransporting chemicals provided 15 percent of <strong>Union</strong> Pacifi c’sfreight revenue in <strong>2008</strong>. The Railroad’s franchise enables it toserve the large chemical megaplex along the Gulf Coast, asroughly two-thirds of the Company’s chemical business originates,terminates or travels through this area. UP’s chemical franchisealso accesses chemical producers in the Rocky Mountains and onthe West Coast. The Company classifi es chemical shipments intothree broad categories: Petrochemicals, Fertilizer and Soda Ash.Petrochemicals includes liquid and dry chemicals, plastics,petroleum and liquid petroleum products, making up two-thirdsof UP’s chemical business. These products move primarily to andfrom the Gulf Coast region. Barges, pipelines, and to a lesserextent trucks, provide transportation alternatives for some of thesecommodities.The liquid and dry market consists of several dozen segmentsof basic, intermediate and specialty chemicals produced by, andshipped to, large and small customers. Strong demand fromindustrial manufacturers is key to this market segment. Plasticsshipments support many vital sectors of the U.S. economy,including the automotive, housing, and durable and disposableconsumer goods markets. UP is an important link in the plasticssupply-chain through its ownership and operation of storagein-transit(SIT) facilities. Plastics customers utilize railroad SITyards for intermediate storage of their plastic resins, and UP’s SITcapacity exceeds that of any other railroad.Chemicals Line Density Map<strong>2008</strong> CarloadsInternational 21%Mexico 5%Domestic 74%Liquid & Dry 26%Plastics 24%Fertilizer 21%Petroleum & Other 16%Soda Ash 13%In <strong>2008</strong>, strong pricing and increased fuel surcharges drove UP’spetrochemicals’ average revenue per car up 14 percent, whilevolume declined 8 percent year-over-year. Weak market conditionsand business interruptions resulting from Hurricanes Gustav andIke contributed to lower shipments.Fertilizer movements originate in the Gulf Coast region, thewestern part of the U.S. and Canada. Shipments are bound formajor agricultural users in the Midwest, western U.S. and abroad.Fertilizer accounted for 21 percent of the Railroad’s chemicalbusiness in <strong>2008</strong>. In the fi rst three quarters of <strong>2008</strong>, export potashshipments through the Pacifi c Northwest and a robust plantingseason for corn drove strong demand. A late fall harvest andcollapsing commodity prices in the fourth quarter partially offsetthis strength. Volume for the year fi nished up 2 percent, whilestrong price and increased fuel surcharges resulted in averagerevenue per car growth of more than 15 percent year-over-year.Soda ash represented 13 percent of chemical business in <strong>2008</strong>.Shipments of this product originate in southwestern Wyomingand California for delivery to chemical and glass producingmarkets in North America and abroad. UP directly serves GreenRiver, Wyoming, the world’s largest natural soda ash reserveand producing region. During <strong>2008</strong>, strength in export soda ashdemand offset softness in the domestic automotive and housingproduction markets. In total, volume for the year was up a modest1 percent over 2007.Lane density based on carloadings. Line thickness depicts traffi c density.18
Chemicals2009 Market DriversThe current state of the North American and global economypresents signifi cant challenges for the plastics, liquid and drychemicals, and soda ash segments of the chemicals industry.Production curtailment at major petrochemical facilities due toreduced industrial demand and consumer spending is expectedto continue. Export demand for polyethylene and polypropylenewill likely remain low as UP expects world production to increase.Shipments of domestic soda ash will continue to mirror demandin the building and automotive markets. Demand for export sodaash remains dependent on the global economy and rational globalsourcing.More positively, sectors of the chemicals business related toagriculture and energy are less impacted by the economicslowdown and hold some promise for 2009. Strong cornplantings, global demand for food and local fertilizer inventoriesshould drive volumes.Overall, the widespread reduction of North American demandacross virtually all sectors of the economy directly affects chemicalproducers. Companies are consolidating production from older,less effi cient and geographically dispersed locations to moreeffi cient mega-production facilities in the Gulf Coast. UP will seekto capitalize on these market dynamics by continuing to deliveron service and promoting the durability and strength of its valueproposition in this region.Annual Summary by Quarter - ChemicalsDiane Duren,VP & GM ChemicalsHow has your team adjusted to the current economicsituation?The team continues to deliver and look for additional opportunitiesto provide value for our customers. Over the last several years ourcustomers have expressed satisfaction with our service. As we pursuenew opportunities, it is imperative we continue meeting customerexpectations through responsiveness and delivering the high qualityservice our customers depend on. This is particularly important as wemake adjustments to our transportation plan in response to fluctuatingvolumes. The Chemical team is actively working with the Operatingdepartment to evaluate proposed service changes and communicatethem to our customers prior to implementation. We want to ensure thatas <strong>Union</strong> <strong>Pacific</strong> adjusts to the changing business environment, we doso in a way that maintains service quality.What is the biggest opportunity in your business group overthe next 2 to 3 years?Over the next three years we expect further rationalization of NorthAmerican chemical production, and continued development ofinternational import and export markets. Many of the major chemicalproducers in North America are consolidating operations into theGulf Coast region. <strong>Union</strong> <strong>Pacific</strong>’s chemical franchise is positionedto capitalize on these new business opportunities. Our ongoinginvestment in rail infrastructure throughout this region, as well as inother parts of the network, ensures our ability to support future growth.Additionally, we are focused on designing services that addressexisting and emerging markets. By doing so, <strong>Union</strong> <strong>Pacific</strong> expects toefficiently handle customer volumes when markets recover. Beyondthat, we are working closely with our customers to identify supply chainefficiencies that support long-term global competitiveness. One suchexample is investment in the soda ash market infrastructure at GreenRiver, Wyoming.<strong>2008</strong> 2007 20061st 2nd 3rd 4th Total 1st 2nd 3rd 4th Total 1st 2nd 3rd 4th TotalFreight Revenue (millions of dollars)603 654 659 578 2,494 544 574 586 583 2,287 496 532 536 520 2,084Revenue Ton-Miles (millions)13,939 14,559 13,668 12,641 54,808 14,044 14,406 14,107 13,964 56,521 14,037 14,583 13,927 13,371 55,918Revenue Carloads (thousands)225 241 224 195 885 224 239 238 227 928 218 234 228 216 896Average Revenue Per Car (dollars)2,676 2,714 2,951 2,957 2,818 2,430 2,395 2,469 2,564 2,464 2,280 2,265 2,351 2,414 2,32619
EnergyCommodity ProfileCoal and petroleum coke transportation accounted for 22 percentof <strong>Union</strong> Pacifi c’s freight revenue in <strong>2008</strong>, the largest share ofrevenue among UP’s six business teams. The Railroad’s franchisesupports the transportation of coal and coke to utilities, industrialfacilities, interchange points and water terminals. The waterterminals support shipments to eastern utilities located on theMississippi and Ohio Rivers and the Great Lakes. <strong>Union</strong> Pacifi calso utilizes the same river network to support export coal toEurope, along with the West Coast ports to support export coal toAsia.SPRB coal is the largest segment in UP’s energy business. In<strong>2008</strong>, SPRB carloadings totaled 74 percent of UP-originatedcoal volumes. The Railroad also moves high-BTU (British ThermalUnits), low sulfur bituminous coal from Colorado and Utah todomestic utilities and industries. For <strong>2008</strong>, Colorado/Utah coaltraffi c represented 16 percent of total coal volumes. The remainingcoal loadings originated in southern Wyoming’s Hanna Basin andsouthern Illinois, and also included SPRB coal forwarded to UPfrom another carrier.Demand for coal held up throughout <strong>2008</strong>, as domestic strengthand continued conversion to western coal was supplemented byincreased international demand for western U.S. bituminous coal.Overall, coal carloadings were up 2 percent year-over-year. Theyear began with a robust 6 percent fi rst quarter volume increasefueled by strong demand and supply chain performance. Despiteheavy rain and SPRB mine fl ooding in May and widespreadEnergy Line Density Map<strong>2008</strong> CarloadsOrigin RegionsSouthern Powder River Basin 74%Colorado/Utah 16%Other 10%Destination RegionsIndustrial 5%West 9%East 19%North 27%South 40%Midwestern fl ooding in June, second quarter volume grew 2percent. Although lingering effects of the Midwest fl oodingcontinued into the third quarter, volume still rose 3 percent overthe prior year. Fourth quarter volume slipped 1 percent dueprimarily to Colorado/Utah production problems.With an emphasis on productivity initiatives, SPRB average trainsize increased more than 1 percent to a record 15,488 tons pertrain during <strong>2008</strong>. An increase in average tons per car, as wellas a one-car increase in train length, drove the improvement. Thetrain length improvement was aided by track expansions at selectutilities to accommodate longer trains and improved North Platteterminal operations in consistently fulfi lling train length targets.UP set numerous volume records out of the SPRB in <strong>2008</strong>.Most notably, an all-time train loading record was set in Augustwith 1,190 trains. Between July and December, more than 1,100coal trains were loaded each month. In addition to the train sizeincrease, SPRB annual records were established for trains(13,212), tons (204.6 million) and carloads (1.73 million).Colorado/Utah volume dipped 4 percent from 2007 levels duelargely to mine production and coal quality issues. These issuesincluded numerous longwall moves, high methane gas levels,signifi cant geological shifts, poor coal quality caused by excessiverock intrusions, and production delays caused by regulatorysafety concerns. However, in spite of these challenges, UP stillLane density based on carloadings. Line thickness depicts traffi c density.20
Energyestablished train size productivity records in <strong>2008</strong> for tons pertrain (10,989), tons per car (110.5), and cars per train (99.4).The largest volume of UP’s petroleum coke traffi c originates on theGulf Coast. Other key areas include Oklahoma, Kansas, Wyomingand California. Shipments are transported to destinations suchas Texas, California and Louisiana. Petroleum coke is a source ofhigh sulfur fuel for electricity generation, and is used by industrialcustomers in the production of aluminum, steel and cement. Thedecline in overall industrial production, particularly in the cementindustry, caused coke shipments to decrease 6 percent versus2007, while average revenue per car increased 17 percent.Powder River Basin (PRB) Economic AdvantageOn a cost per million BTU basis, the PRB consistently remains alow cost energy alternative in North America. Among the domesticcoal regions, PRB coal is about one-third as expensive as easternoptions and is equal to Rocky Mountain coal for the lowest sulfurcontent. PRB coal competes with natural gas prices as low as$3.25 per million BTU in most markets.2009 Market DriversReaching last year’s record-setting volume performance is notexpected in 2009. Strong supply chain performance in <strong>2008</strong>,along with greatly reduced electrical demand associated withthe recession, has contributed to above normal coal inventoriesentering 2009. Manufacturing plant closings in the automobileand aluminum industries lowered industrial electrical demand,while conservation and an increase in foreclosures and vacanthomes reduced residential electricity demand. Additionally, despitesuccess in legacy contract renegotiations in <strong>2008</strong>, some SPRBbusiness shifted away from UP.Doug Glass,VP & GM EnergyHow has your team adjusted to the current economicsituation?While the current economic environment has affected coal trafficlevels less than other commodity lines, most industry veterans viewthis recession as one of the worst in recent memory. Lower industrialactivity and some residential conservation reduced demand forelectrical power in the first quarter of 2009. However, <strong>Union</strong> <strong>Pacific</strong>still sees the long-term potential for conversion to western coal bypower plants east of the Mississippi River. Additionally, higher BTUColorado/Utah coal made inroads into the Central and Southeasternenergy markets in late <strong>2008</strong> as eastern coal was being exportedoverseas. UP will continue to serve these markets under multi-yearagreements even as changes in global demand reduced U.S. exportcoal business.Velocity improvements over the last year strengthened the coalsupply chain. Many utility customers added coal unloading capacityor increased trackage to accommodate larger trains and furtherimprove coal deliveries. Customers continue to modernize their coalfleets with all-aluminum railcars to increase carrying capacity andefficiency. Additionally, the Railroad is implementing new technology toprovide more precise train arrival and departure information to utilities.Incremental rail/barge capacity is also being built along the MississippiRiver, which will benefit interchange business with CSX and NS.Furthermore, this capacity will enable the Railroad to successfully meetthe strong demand anticipated for western coal when the economyrecovers.What is the biggest opportunity in your business group overthe next 2 to 3 years?Repricing expiring legacy contracts at levels that support reinvestmentin the railroad’s energy business represents the largest single financialopportunity over the next 2 to 3 years. Contracts for over 15 percent ofthe Railroad’s coal business will expire by the end of 2011.On the business development side, eight new coal plants are underconstruction in <strong>Union</strong> <strong>Pacific</strong>’s territory, with four new plants recentlycompleted and five plants under development. Some of the proposedplants would use advanced carbon capture technology and set newstandards for power plant construction. In fact, the CO2 environmentalfootprint of these plants is projected to be at, or better than, a naturalgas fired plant. The captured CO2 at these plants could be used insecondary oil recovery or eventually sequestered in safe, undergroundcaverns. Additionally, these new plants could yield businessopportunities beyond coal, such as the inbound transportation of thechemicals used to reduce NOX and SOX emissions, and the outboundmovement of the captured CO2.21
Coal-Fired Units Under ConstructionSouthern PowderRiver BasinUinta BasinCoal-Fired Units Under ConstructionServed by <strong>Union</strong> <strong>Pacific</strong>- 8 New Plants- 15 Million Tons- Completed by 12/31/13Annual Summary by Quarter - Energy<strong>2008</strong> 2007 20061st 2nd 3rd 4th Total 1st 2nd 3rd 4th Total 1st 2nd 3rd 4th TotalFreight Revenue (millions of dollars)857 919 1,051 983 3,810 731 761 824 818 3,134 697 729 766 757 2,949Revenue Ton-Miles (millions)63,334 61,748 67,887 65,393 258,362 60,005 60,657 65,133 65,613 251,408 60,075 62,426 62,982 63,669 249,152Revenue Carloads (thousands)582 561 615 590 2,348 551 551 600 597 2,299 550 575 584 587 2,296Average Revenue Per Car (dollars)1,473 1,639 1,709 1,664 1,622 1,326 1,381 1,374 1,368 1,363 1,266 1,268 1,312 1,291 1,28522
Industrial ProductsCommodity Profile<strong>2008</strong> CarloadsThe Railroad’s extensive network enables the Industrial Productsgroup to move numerous commodities between thousands ofshippers and customers throughout North America. In <strong>2008</strong>,Industrial Products provided 19 percent of <strong>Union</strong> Pacifi c’s totalfreight revenue.International 9%Mexico 8%Domestic 83%Lumber shipments originate primarily in the PNW and Canadafor destinations throughout the U.S. for new home constructionand repair and remodeling markets. Commercial and highwayconstruction drive shipments of steel and construction products,consisting of rock, cement and roofi ng. Shipments of paper andconsumer goods, including furniture and appliances, move tomajor metropolitan areas for consumers. Industrial manufacturingplants receive shipments of nonferrous metals and industrialminerals. In addition, the Railroad provides effi cient and safetransportation for government entities and waste companies.Demand is driven by macro-economic factors such as industrialproduction and housing starts. In <strong>2008</strong>, U.S. industrial productiondeclined 2 percent and housing starts fell 33 percent, contributingto a 6 percent decrease in carloads for the Industrial Productsgroup. Pricing actions and fuel surcharges increased averagerevenue per car growth by 13 percent for the year, more thanoffsetting volume declines. As a result, Industrial Products revenueincreased 6 percent in <strong>2008</strong>.Construction Products 34%Metals 22%Minerals/Consumer 13%Paper 12%Lumber 10%Government/Waste 9%Fewer housing starts, surplus production and general marketuncertainty drove weak lumber volumes in <strong>2008</strong>. Lumbercarloadings decreased by 26 percent and revenue fell by 15percent year-over-year.Steel and scrap steel carloadings increased 8 percent in <strong>2008</strong>versus 2007, due to domestic market strength. Specifi cally,international prices exceeded domestic, in part due to the weakU.S. dollar, and service centers restocked from low inventorylevels. Price increases and fuel surcharges drove a 22 percentrevenue increase year-over-year.Industrial Products Line Density MapSoft residential, commercial and highway construction reducedstone volume by 6 percent in <strong>2008</strong> versus 2007. However, priceincreases and fuel surcharges yielded a 4 percent increase in totalrevenue.Volumes of non-metallic minerals grew in <strong>2008</strong>. Increases innatural gas drilling activity presented business opportunities infracturing sand (frac sand) and barite, driving a 6 percent increasein non-metallic mineral volume. Price and fuel surcharges pushedaverage revenue per car up 15 percent, resulting in revenuegrowth of 21 percent.Lane density based on carloadings. Line thickness depicts traffi c density.23
Industrial Products2009 Market DriversWith housing starts expected to decline somewhat from alreadylow levels and reduced overall economic activity impacting many ofthe markets, Industrial Products faces an uphill battle. Weaknessin autos, housing, and residential, commercial, and highwayconstruction, as well as tight credit, reduced consumer spendingand the strengthening U.S. dollar are expected to adversely impactmarkets such as lumber, stone, cement, sheet and structural steel,ferrous scrap, aluminum and appliances.However, the Railroad recently began the short haul movement ofuranium tailings for the Department of Energy. The arrangementfalls under the Moab Uranium Mill Tailings Remedial Action(UMTRA) Project. The movement of 16 million tons of tailingsapproximately 30 miles to a permanent disposal site in southernUtah is expected to take several years to complete.<strong>Union</strong> Pacifi c is also working with customers, associations anda variety of state and federal agencies to identify and act uponany opportunities related to stimulus funding coming from theAmerican Recovery and Reinvestment Act of 2009.Eric Butler,VP & GM Industrial ProductsHow has your team adjusted to the current economicsituation?We are aggressively designing new products and prospectingwith non-traditional and even non-direct rail served customersusing our UPDS based network extension strategy. While there isclearly significant softness in our core businesses of lumber, steeland aggregates, we are seeing growth in our emerging marketsbusinesses, such as wind energy components.What is the biggest opportunity in your business group overthe next 2 to 3 years?It is difficult to see the end of the current economic downturn.However, we believe that in the next 2 to 3 years, all of our majormarkets will be operating at more normal volumes, indicative of typicaleconomic activity. Additionally, UP’s record-setting customer servicelevels and the favorable economics of rail are expected to yield growthopportunities in both new and existing markets.Annual Summary by Quarter - Industrial Products<strong>2008</strong> 2007 20061st 2nd 3rd 4th Total 1st 2nd 3rd 4th Total 1st 2nd 3rd 4th TotalFreight Revenue (millions of dollars)773 877 906 717 3,273 741 805 789 742 3,077 762 813 820 740 3,135Revenue Ton-Miles (millions)17,507 19,138 18,648 15,421 70,714 18,516 19,974 18,908 17,711 75,109 21,740 22,055 20,785 18,428 83,008Revenue Carloads (thousands)304 346 329 270 1,249 318 349 339 319 1,325 365 386 370 325 1,446Average Revenue Per Car (dollars)2,540 2,537 2,747 2,662 2,620 2,331 2,308 2,327 2,324 2,322 2,084 2,110 2,215 2,273 2,16724
IntermodalCommodity Profile<strong>2008</strong> UnitsUP’s Intermodal business represented 18 percent of freightrevenue in <strong>2008</strong>, and includes international and domesticshipments. International business consists of imported containertraffi c that arrives at West Coast ports via ocean carriers fordestinations throughout the United States. Domestic businessincludes domestic container and trailer traffi c for intermodalmarketing companies (primarily shipper agents and logisticscompanies), as well as truckload carriers. Less-than-truckload andpackage carriers with time-sensitive business requirements arealso an important part of domestic shipments.International imports and exports move in 20, 40 or 45 footshipping containers through ports on the West Coast. The majorityof domestic shipments move in 48 or 53 foot containers or trailersto and from points within the U.S., Canada and Mexico.<strong>Union</strong> Pacifi c’s key East/West intermodal lanes run between theWest Coast and Chicago, Texas, and interchange connections tothe eastern U.S. The Company’s key North/South intermodal lanesoperate between Los Angeles and the Pacifi c Northwest, as wellas Chicago and the upper Midwest and points south in Texas andMexico. UP accesses all six Mexican gateways and serves mostof the major metropolitan areas in the western two-thirds of theU.S. Nearly all routes are competitive with other railroads and arecomparable to shipping distances on the highway network.In <strong>2008</strong>, total Intermodal volumes declined 8 percent year-overyeardue to a faltering economy and the related impact on globalIntermodal Line Density MapInternational 63%Domestic 37%shipping. However, pricing actions and fuel surcharges increasedrevenue 3 percent. International intermodal revenue grew 4percent on 11 percent less volume. Domestic intermodal revenuealso grew 4 percent on a volume decline of 3 percent.Overall, Intermodal average revenue per box increased 13 percentin <strong>2008</strong>. Domestic average revenue per box improved 7 percentand international shipments increased 17 percent per box.Legacy contract repricing, ongoing contract escalations and fuelsurcharges drove these increases.<strong>Union</strong> Pacifi c continues to offer truck-competitive, priority railservice in key lanes to encourage the conversion of highwaybusiness to intermodal. During periods of volatile fuel costs,shippers increasingly look to rail as the cost-competitive alternativeto trucks.<strong>Union</strong> Pacifi c’s service continued to improve during <strong>2008</strong>,providing customers consistent and reliable transit. An importantproject for <strong>Union</strong> Pacifi c is the double tracking of the SunsetCorridor, which ended the year at 60 percent complete. Theadded network fl exibility provided by this project improves service,and the added capacity will support future growth.Lane density based on carloadings. Line thickness depicts traffi c density.25
Intermodal2009 Market DriversThe current economic situation is likely to present challenges in2009. Imports are projected to decrease from <strong>2008</strong>, and theRailroad expects international volume to struggle for most of theyear, with the potential for a slight increase during peak season inthe fourth quarter. On the domestic side, conversions from truckare expected to drive growth. In both markets UP anticipatescontinued pricing opportunities.The Company is moving forward with service initiatives and capitalexpenditures to both support current volumes and provide forfuture growth. Network service improvements, additional capacityprojects and close communication with ocean carriers, domesticshippers and interchange partners enable UP to operate effi cientlywith current volumes.John Kaiser,VP & GM IntermodalHow has your team adjusted to the current economicsituation?We increased our focus on growing the overall intermodal marketthrough truckload conversion. A down economy forces shippers tolower costs, and converting from truck to intermodal helps accomplishthis objective.<strong>Union</strong> <strong>Pacific</strong> Intermodal continues to add and expand serviceofferings that provide reliable, truck-competitive and environmentallyfriendly service. The capital investments made in our intermodalnetwork over the past few years are paying off with best-ever serviceand reliability metrics. We have recently enhanced our train schedulesto provide truck-competitive service between Los Angeles andChicago, Dallas, Memphis and Seattle. We’ve also added refrigeratedservice in several lanes.We are also expanding the number of locations served. We recentlyopened a new ramp in San Antonio, TX. This intermodal facilityenhances our ability to attract highway freight in target markets inTexas, along the Mexican/U.S. border and within the interior of Mexico.Further, we opened a ramp in Tacoma, WA, which positions us tocapture business for the large domestic warehouse market in thePNW.What is the biggest opportunity in your business group overthe next 2 to 3 years?The biggest opportunity over the next few years comes from movinglegacy contract volumes to market rates. This pricing opportunity willprovide <strong>Union</strong> <strong>Pacific</strong> with the returns required to continue expandingcapacity for future growth. Long-term investments to expand track andterminal capacity serving the Sunset Corridor are expected to allow<strong>Union</strong> <strong>Pacific</strong> to capitalize on the fast growing markets across theSunbelt and the Southeast. Continued expansion of trade with Asiaand conversion of highway freight are expected to drive long-termgrowth opportunities.26
Intermodal TerminalsSeattleTacomaPortlandSparksSalt Lake CityCouncil BluffsChicagoOaklandLathropDenverSt. LouisKansasCityLas VegasLos Angeles/Long BeachMemphisTucsonEl PasoDallasMajor Trailer/Container TerminalsSanAntonioHoustonNew OrleansLaredoAnnual Summary by Quarter - Intermodal<strong>2008</strong> 2007 20061st 2nd 3rd 4th Total 1st 2nd 3rd 4th Total 1st 2nd 3rd 4th TotalFreight Revenue (millions of dollars)707 769 842 705 3,023 674 721 773 757 2,925 643 695 747 726 2,811Revenue Ton-Miles (millions)19,552 19,737 19,875 17,014 76,178 18,994 20,543 21,024 20,232 80,793 18,689 19,630 20,014 19,469 77,802Revenue Carloads (thousands)796 811 834 724 3,165 821 861 912 859 3,453 816 865 909 867 3,457Average Revenue Per Car (dollars)889 947 1,010 974 955 821 838 846 883 847 789 803 821 838 81327
MexicoCommodity Profile<strong>Union</strong> Pacifi c’s franchise provides the most effi cient rail routebetween markets in Mexico, the U.S. and Canada, serving allsix major gateways to Mexico and connecting directly to thetwo largest Mexican railroads. UP exchanges approximately58 percent of shipments to and from Mexico with Kansas CitySouthern de Mexico (KCSM) and the remaining 42 percent withFerrocarril Mexicano (Ferromex or FXE). <strong>Union</strong> Pacifi c has a 26percent ownership interest in Ferromex. Trucks are the dominanttransportation mode in Mexico’s freight transportation market,which exceeds $7 billion annually.The Mexico market includes a broad range of commodities fromraw materials to fi nished goods. Historically, Automotive was thelargest commodity group by both revenue and volume. AlthoughAutomotive is still the largest group by volume, AgriculturalProducts generated the most revenue from Mexico traffi c in 2007and <strong>2008</strong>. <strong>Union</strong> Pacifi c works closely with both Mexican railroadsto capture opportunities created by the North American FreeTrade Agreement (NAFTA). The Mexican railroads continue makingsubstantial investments in track structure, equipment and facilitiesto improve service, equipment utilization, safety and damageprevention, which ultimately should enable them to capture moremarket share from trucks.In <strong>2008</strong>, revenue from shipments to and from Mexico increased 13percent over 2007 to a record $1.6 billion, refl ecting the impactof pricing improvements and fuel surcharges. At the same time,volume decreased 4 percent year-over-year. All business groupsMexico Line Density Map<strong>2008</strong> CarloadsAutomotive 40%Intermodal 22%Agricultural 18%Industrial Products 13%Chemicals 6%Energy 1%reported increased revenue versus 2007. Agricultural Productsrevenue grew 14 percent, despite a 2 percent volume decline.DDGS revenue increased 19 percent with a 2 percent volumeincrease. Corn and feed grains revenue increased 13 percentwhile volume decreased 1 percent year-over-year. Revenue forIndustrial Products grew 10 percent, driven by volume increases inmetallic minerals and steel, offsetting a 7 percent decline in overallvolume. Automotive revenue increased 7 percent over 2007,while volumes declined 9 percent. Chemicals revenue grew 10percent primarily from growth in plastics and liquid/dry chemicals.Chemicals volume, however, decreased 3 percent. Intermodalrevenue increased 13 percent with volume up 3 percent.Historically, a majority of UP’s business in this market involvedsouthbound shipments to Mexico. However, over the last threeyears northbound shipments grew due to increased manufacturinglocated in Mexico. Northbound shipments now make up about 47percent of revenue from Mexico operations. The largest volume ofcommodities shipped from Mexico in <strong>2008</strong> included assembledautos and auto parts, beer and food products, intermodal, steel,cement and consumer goods like appliances. These six commoditygroups represented approximately 94 percent of northboundrevenue. Southbound traffi c from the U.S. to Mexico is muchmore diversifi ed. Corn, dry feed ingredients, autos and auto parts,intermodal, meals and oils, steel and newsprint shipments makeup about 73 percent of southbound revenue with the remainderspread across the Company’s six commodity groups.2009 Market Drivers<strong>Union</strong> Pacifi c expects that 2009 will be a challenging yeareconomically both in the U.S. and Mexico. Consequently, volumesLane density based on carloadings. Line thickness depicts traffi c density.28
Mexicofor all commodities are expected to decline, especially those tiedto the auto industry. The slowdown in automotive productionis likely to have a negative impact on the chemical business,specifi cally plastics and similar products. Increased Mexicanconsumption of domestic crops and a lower count of animals onfeed should reduce agriculture exports to Mexico. Additionally,housing market conditions signifi cantly affect volumes of clay,sands, tile and other construction materials to and from Mexico.However, UP could experience some positive volume offset inconstruction materials later in 2009 due to demand resulting fromstimulus-funded infrastructure projects in the U.S. and Mexico.While existing economic conditions call for a conservative 2009outlook, UP remains optimistic about the longer term. Currentstrategies focus on new business development and core priceimprovement. These strategies, in conjunction with maintainingan effi cient and fl uid network, support an expectation of retainingcurrent business and potentially generating growth. Foreigninvestment in Mexico is forecast to continue throughout 2009and the current outlook suggests that markets such as the“maquiladora” industry, renewable energy, steel and coal shouldtrend upwards.Concern about the Mexican political climate is due primarily tothe government’s escalated efforts against drug-related crimes.Bernardo Ayala,VP Mexico MarketsHow has your team adjusted to the current economicsituation?Several aspects of UP’s unique franchise should help UP weather thecurrent economic situation. Among them are a strong and experiencedsales force strategically based in different areas of Mexico and theU.S., a fluid and efficient network and service-oriented processes thatdeliver high customer satisfaction levels. With these key elements inplace, the Company can successfully take on the current challenges,retain its existing customer base and continue growing the business.What is the biggest opportunity in your business group overthe next 2 to 3 years?Mexico is still a strong target for Foreign Direct Investment. Existingindustries are expanding capacity and building new facilities. Inaddition, the Mexican railroads continue to upgrade and add capacityto the current infrastructure to improve rail traffic handling. Therefore,as markets develop, UP can leverage its value proposition and serviceoffering to capture new business.However, rail operations across the border remain fl uid. It appearsthat the Mexican government will continue waging a strongcampaign against drugs. The U.S. government supports theseefforts, as demonstrated through plans such as the “MeridaInitiative”, which seeks to reduce growing drug traffi cking and othercriminal activities on the two countries’ mutual border.Percent of Carloads at Border CrossingsCalexico (2%)Nogales (12%) El Paso (7%)Eagle Pass (21%)Laredo (54%)Brownsville (4%)FXEFXE Trackage on KCSMKCSMKCSM Trackage on FXEFSRRCoahuila DurangoChiapas MayabShort Lines29
SELECTED FINANCIAL DATA<strong>Union</strong> <strong>Pacific</strong> CorporationMillions of dollars, except per share amounts, carloads, employee statistics and ratiosFor the year ended December 31, <strong>2008</strong> 2007 2006 2005 (a) 2004 (b)Operating revenues (c) $17,970 $16,283 $15,578 $13,578 $12,215Operating income 4,075 3,375 2,884 1,795 1,295Net income 2,338 1,855 1,606 1,026 604Earnings per share - basic (d): 4.58 3.49 2.98 1.95 1.17Earnings per share - diluted (d): 4.54 3.46 2.95 1.92 1.15Dividends declared per share (d) 0.98 0.745 0.60 0.60 0.60Cash provided by operating activities 4,070 3,277 2,880 2,595 2,257At December 31Total assets $39,722 $38,033 $36,515 $35,620 $34,596Debt due after one year 8,607 7,543 6,000 6,760 7,981Common shareholders’ equity 15,447 15,585 15,312 13,707 12,655Equity per common share (e) 30.70 29.87 28.34 25.70 24.29Additonal DataFreight revenues (c) $17,118 $15,486 $14,791 $12,856 $11,575Revenue carloads (000) 9,261 9,733 9,852 9,544 9,458Operating margin (%) (f) 22.7 20.7 18.5 13.2 10.6Operating ratio (%) (f) 77.3 79.3 81.5 86.8 89.4Employees (average 000) 48.2 50.1 50.7 49.7 48.3Operating revenues per employee (000) $372.8 $325.0 $307.2 $273.2 $252.9Financial Ratios (%)Debt to capital (g) 36.6 33.0 30.7 35.1 39.1Return on average common shareholders’ equity (h) 15.1 12.0 11.1 7.8 4.8(a) 2005 net income includes a $118 million tax expense reduction to reflect a reduction in the estimated deferred income tax liability.(b) 2004 operating income and net income includes a $247 million pre-tax ($154 million after-tax) charge for unasserted asbestos-related claims.(c) Includes fuel surcharge revenue which partially offsets increased operating expenses for fuel. 2007 and <strong>2008</strong> fuel surcharge revenue is not comparable to priorperiods due to implementation of new mileage-based fuel surcharge programs in each respective year. See <strong>2008</strong> SEC Form 10-K for more information.(d) Earnings per share and dividends have been restated to reflect the May 28, <strong>2008</strong> stock split.(e) Equity per common share is calculated as follows: common shareholders’ equity divided by common shares issued less treasury shares outstanding.Shares have been adjusted to reflect the May 28, <strong>2008</strong> stock split.(f) Operating margin is defined as operating income divided by operating revenues. Operating ratio is defined as operating expenses divided by operating revenues.(g) Debt to capital is determined as follows: total debt divided by total debt plus equity.(h) Return on average common shareholders’ equity is determined as follows: Net income divided by average common shareholders’ equity.30
CONSOLIDATED STATEMENTS OF INCOME<strong>Union</strong> <strong>Pacific</strong> CorporationIn millions (except per share), (unaudited), for the year ended December 31, <strong>2008</strong>1 2 3 4 Total YearOperating RevenuesFreight Revenues $4,059 $4,349 $4,630 $4,080 $17,118Operating Revenues 211 219 216 206 852Total Operating Revenues $4,270 $4,568 $4,846 $4,286 $17,970Operating ExpensesCompensation and Benefits 1,132 1,101 1,123 1,101 4,457Fuel 957 1,159 1,135 732 3,983Purchased Services and Materials 469 494 481 458 1,902Depreciation 340 346 348 353 1,387Equipment and Other Rents 342 338 326 320 1,326Other 242 199 218 181 840Total Operating Expenses 3,482 3,637 3,631 3,145 13,895Operating Income 788 931 1,215 1,141 4,075Other Income - Net 25 19 23 25 92Interest Expense (126) (128) (130) (127) (511)Income Before Income Taxes 687 822 1,108 1,039 3,656Income Tax Expense (244) (291) (405) (378) (1,318)Net Income $443 $531 $703 $661 $2,338Basic Earnings Per Share $0.86 $1.03 $1.39 $1.31 $4.58Diluted Earnings Per Share $0.85 $1.02 $1.38 $1.31 $4.54Weighted Average Number of Shares - Basic 518.4 514.3 506.6 503.2 510.6Weighted Average Number of Shares - Diluted 522.8 519.0 511.3 506.5 515.0Dividends Declared per Share $0.22 $0.22 $0.27 $0.27 $0.98Operating Ratio 81.5% 79.6% 74.9% 73.4% 77.3%Effective Tax Rate 35.5% 35.4% 36.6% 36.4% 36.1%In millions (except per share), (unaudited), for the year ended December 31, 20071 2 3 4 Total YearOperating RevenuesFreight Revenues $3,655 $3,853 $3,990 $3,988 $15,486Operating Revenues 194 193 201 209 797Total Operating Revenues $3,849 $4,046 $4,191 $4,197 $16,283Operating ExpensesCompensation and Benefits 1,165 1,145 1,095 1,121 4,526Fuel 662 753 786 903 3,104Purchased Services and Materials 443 478 479 456 1,856Depreciation 325 327 332 337 1,321Equipment and Other Rents 339 354 342 333 1,368Other 196 202 152 183 733Total Operating Expenses 3,130 3,259 3,186 3,333 12,908Operating Income 719 787 1,005 864 3,375Other Income - Net 15 36 25 40 116Interest Expense (113) (120) (124) (125) (482)Income Before Income Taxes 621 703 906 779 3,009Income Tax Expense (235) (257) (374) (288) (1,154)Net Income 386 446 532 491 1,855Basic Earnings Per Share (a) $0.71 $0.83 $1.01 $0.94 $3.49Diluted Earnings Per Share (a) $0.71 $0.82 $1.00 $0.93 $3.46Weighted Average Number of Shares - Basic (a) 541.1 536.4 523.5 523.5 531.9Weighted Average Number of Shares - Diluted (a) 545.6 541.5 531.4 528.6 536.8Dividends Declared per Share (a) $0.175 $0.175 $0.175 $0.22 $0.745Operating Ratio 81.3% 80.5% 76.0% 79.4% 79.3%Effective Tax Rate 37.8% 36.6% 41.3% 37.0% 38.4%Refer to the <strong>Union</strong> <strong>Pacific</strong> Corporation <strong>2008</strong> SEC Form 10-K for additional information, including audited financial statements and related footnotes.(a) Earnings per share and dividends have been restated to reflect the May 28, <strong>2008</strong> stock split. Shares have also been adjusted to reflect the split.31
CONSOLIDATED STATEMENTS OF FINANCIAL POSITION<strong>Union</strong> <strong>Pacific</strong> CorporationIn millions of dollars, as of December 31, <strong>2008</strong> 2007AssetsCurrent AssetsCash and Cash Equivalents ............................................................................................. $1,249 $878Accounts Receivable, Net ................................................................................................ 594 632Materials and Supplies .................................................................................................... 450 453Current Deferred Income Taxes ...................................................................................... 276 336Other Current Assets ....................................................................................................... 244 295Total Current Assets ............................................................................................................ 2,813 2,594Investments ............................................................................................................................. 974 923PropertiesLand.................................................................................................................................. 4,861 4,760Road ................................................................................................................................. 34,348 32,210Equipment ....................................................................................................................... 7,300 7,308Other ................................................................................................................................ 1,406 1,376Total Cost ......................................................................................................................... 47,915 45,654Accumulated Depreciation ............................................................................................. (12,214) (11,496)Net Properties ...................................................................................................................... 35,701 34,158Other Assets ......................................................................................................................... 234 358Total Assets ........................................................................................................................... $39,722 $38,033Liabilities and Common Shareholders’ EquityCurrent LiabilitiesAccounts Payable ............................................................................................................. $629 $732Accrued Wages and Vacation .......................................................................................... 367 394Accrued Casualty Costs ................................................................................................... 390 371Income and Other Taxes ................................................................................................. 207 343Dividends and Interest .................................................................................................... 328 284Debt Due Within One Year ............................................................................................. 320 139Equipment Rents Payable ................................................................................................ 93 103Other Current Liabilities ................................................................................................. 546 675Total Current Liabilities ...................................................................................................... 2,880 3,041Debt Due After One Year................................................................................................. 8,607 7,543Deferred Income Taxes .................................................................................................... 10,282 10,050Other Long-Term Liabilities ........................................................................................... 2,506 1,814Total Liabilities .................................................................................................................... 24,275 22,448Common Shareholders’ EquityCommon Shares, $2.50 par value, 800,000,000 and 500,000,000 authorized;552,775,812 and 276,162,141 issued;503,225,705 and 260,869,647 outstanding, respectively ........................................... 1,382 690Paid-in-surplus ................................................................................................................ 3,949 3,926Retained Earnings ............................................................................................................ 13,813 12,667Treasury Stock .................................................................................................................. (2,993) (1,624)Accumulated Other Comprehensive Loss ...................................................................... (704) (74)Common Shareholders’ Equity ....................................................................................... 15,447 15,585Total Liabilities and Common Shareholders’ Equity ................................................. $39,722 $38,033Refer to the <strong>2008</strong> <strong>Union</strong> <strong>Pacific</strong> Corporation SEC Form 10-K for additional information.32
CONSOLIDATED STATEMENTS OF CASH FLOW<strong>Union</strong> <strong>Pacific</strong> CorporationIn millions of dollars, for the years ended December 31, <strong>2008</strong> 2007Operating ActivitiesNet Income ...................................................................................................................... $2,338 $1,855Adjustments to Reconcile Net Income to Cash Provided by Operating Activities:Depreciation ................................................................................................................ 1,387 1,321Deferred Income Taxes and Unrecognized Tax Benefits........................................... 547 332Stock-based Compensation Expense ......................................................................... 65 44Net Gain from Asset Sales .......................................................................................... (41) (52)Other Operating Activities, Net ................................................................................. 24 (251)Changes in Current Assets and Liabilities, Net ......................................................... (250) 28Cash Provided by Operating Activities ....................................................................... 4,070 3,277Investing ActivitiesCapital Investments ......................................................................................................... (2,780) (2,496)Proceeds from Asset Sales ............................................................................................... 93 122Acquisition of Equipment Pending Financing ............................................................... (388) (621)Proceeds from Sale of Assets Financed ........................................................................... 388 621Other Investing Activities, Net ........................................................................................ (77) (52)Cash Used in Investing Activities ................................................................................ (2,764) (2,426)Financing ActivitiesDebt Issued ...................................................................................................................... 2,257 1,581Common Share Repurchases .......................................................................................... (1,609) (1,375)Debt Repaid ..................................................................................................................... (1,208) (792)Dividends Paid ................................................................................................................. (481) (364)Cash Received for Option Excercises .............................................................................. 83 132Treasury Shares Repurchased for Employee Payroll Taxes ............................................ (28) (61)Excess Tax Benefits from Equity Compensation Plans .................................................. 54 76Other Financing Activities, Net ...................................................................................... (3) 3Cash Used in Financing Activities ............................................................................... (935) (800)Net Change in Cash and Cash Equivalents ............................................................................ 371 51Cash and Cash Equivalents at Beginning of Year .................................................................. 878 827Cash and Cash Equivalents at End of Year ......................................................................... $1,249 $878Changes in Current Assets and LiabilitiesAccounts Receivable, Net ................................................................................................ $38 $47Materials and Supplies .................................................................................................... 3 (58)Other Current Assets ....................................................................................................... 51 (104)Accounts Payable and Other Current Liabilities ............................................................ (342) 143Changes In Current Assets and Liabilities .................................................................. $(250) $28Supplemental Cash Flow InformationNon-Cash Investing and Financing Activities:Capital Lease Financings ................................................................................................. 175 82Cash Dividends Declared but not yet Paid ..................................................................... 132 112Capital Investments Accrued but not yet Paid ............................................................... $93 $126Common Shares Repurchased but not yet Paid............................................................. - 82Cash Paid During the Year For:Interest, Net of Amounts Capitalized ........................................................................ (500) (467)Income Taxes, Net of Refunds .................................................................................... (699) (839)Refer to the <strong>Union</strong> <strong>Pacific</strong> Corporation <strong>2008</strong> SEC Form 10-K for more information.33
FINANCIAL AND OPERATING STATISTICS<strong>Union</strong> <strong>Pacific</strong> Corporation(unaudited), for periods ended December 31, <strong>2008</strong> 2007FullFullFinancial and Revenue Statistics 1 2 3 4 Year 1 2 3 4 YearOperating Revenues (millions) $4,270 $4,568 $4,846 $4,286 $17,970 $3,849 $4,046 $4,191 $4,197 $16,283Operating Expenses (millions) $3,482 $3,637 $3,631 $3,145 $13,895 $3,130 $3,259 $3,186 $3,333 $12,908Operating Ratio (%) 81.5 79.6 74.9 73.4 77.3 81.3 80.5 76.0 79.4 79.3Operating Margin (%) 18.5 20.4 25.1 26.6 22.7 18.7 19.5 24.0 20.6 20.7Compensation andBenefits (millions) $1,132 $1,101 $1,123 $1,101 $4,457 $1,165 $1,145 $1,095 $1,121 $4,526Compensation andBenefits/Op. Rev. (%) 26.5 24.1 23.2 25.7 24.8 30.3 28.3 26.1 26.7 27.8Freight Revenues/Employee (thousands) $82.7 $89.3 $95.8 $87.0 $354.8 $72.0 $75.9 $79.7 $81.8 $309.2Fuel Expense (millions) $957 $1,159 $1,135 $732 $3,983 $662 $753 $786 $903 $3,104Avg. Fuel Price Per Gallon (a) $2.84 $3.60 $3.70 $2.46 $3.15 $1.93 $2.20 $2.32 $2.62 $2.27Freight Revenues (millions) $4,059 $4,349 $4,630 $4,080 $17,118 $3,655 $3,853 $3,990 $3,988 $15,486Average Revenue Per Car $1,738 $1,835 $1,931 $1,891 $1,848 $1,566 $1,583 $1,582 $1,632 $1,591Freight Revenues/Revenue Ton-Mile (cents) 2.88 3.09 3.18 3.02 3.04 2.71 2.77 2.77 2.78 2.76Effective Tax Rate (%) 35.5 35.4 36.6 36.4 36.1 37.8 36.6 41.3 37.0 38.4Debt to Capital (%) (b) 36.6 33.0Adjusted Debt to Capital (%) (c) 47.4 44.1Operating StatisticsRevenue Carloads (thousands) 2,335 2,371 2,398 2,157 9,261 2,334 2,433 2,522 2,444 9,733Revenue Ton-Miles (billions) 141 141 146 135 563 135 139 144 143 562Gross Ton-Miles (billions) 257 257 262 244 1,020 255 261 270 267 1,052Average Train Speed (mph) (d) 22.2 22.8 23.7 25.1 23.5 21.7 21.6 21.5 22.3 21.8Average System Dwell (hours) (d) 25.2 24.5 24.4 25.3 24.9 25.3 24.7 25.2 25.4 25.1Average Rail Car Inventory (d) 306,342 303,129 300,391 292,856 300,692 309,579 310,663 311,791 307,682 309,912Fuel Consumed (millions of gallons) 330 313 297 289 1,229 332 332 329 333 1,326Employees (average) 49,073 48,693 48,324 46,877 48,242 50,771 50,755 50,060 48,770 50,089GTMs per Employee (millions) 5.24 5.28 5.43 5.20 21.15 5.02 5.14 5.39 5.48 21.01Refer to the <strong>Union</strong> <strong>Pacific</strong> Corporation <strong>2008</strong> SEC Form 10-K for additional information.(a) Including taxes and transportation costs(b) Debt to capital is computed as follows: total debt divided by total debt plus equity.(c) Lease adjusted debt to capital is computed as follows: total debt plus net present value of operating leases plus sale of receivables plus unfunded pension and OPEB dividedby total debt plus equity plus net present value of operating leases plus sale of receivables.(d) As reported to the Association of American Railroads.34
NON-GAAP DEFINITIONSManagement believes certain non-GAAP measures provide an alternative presentation of the results that more accurately reflecton-going Company operations. These measures should be considered in addition to, not a substitute for, the reported GAAPresults.Free Cash FlowCash provided by operating activities, less cash used in investing activities, less dividends paid. Management believes this isan important measure in evaluating our financial performance and measures our ability to generate cash without incurringadditional external financings.Return on Invested CapitalNet income plus interest expense, plus sale of receivables fees, plus interest on present value of leases, less taxes on interest dividedby average equity plus average debt plus average sale of receivables plus average present value of leases. Management believes thisis an important measure for evaluating the efficiency and effectiveness of the Corporation’s long term capital investments, andwe currently use ROIC as a performance criteria in determining certain elements of compensation for our executive officers andsenior management.Debt to CapitalTotal debt divided by total debt plus equity. Management believes this is an important measure in evaluating our balance sheetstrength and is important in managing our credit ratios and financing relationships.Adjusted Debt to CapitalTotal debt plus net present value of operating leases plus value of sold receivables plus after-tax unfunded pension and OPEBobligation divided by total debt plus net present value of operating leases plus value of sold receivables plus after-tax unfundedpension and OPEB obligation plus equity. Operating leases were discounted using 6.2% at March 31, 2009 and 8.0% at March 31,<strong>2008</strong>, respectively. The lower discount rate reflects changes to interest rates and our current financing costs. Management believesthis is an important measure in evaluating the total amount of leverage in our capital structure including off-balance sheetobligations.35
FREE CASH FLOW AND CONSOLIDATED STATEMENT OF CASH FLOWSReconciliation to GAAP(In millions of dollars, except for percentages) unaudited<strong>2008</strong> 2007 2006Cash Provided by Operating Activities $4,070 $3,227 $2,880Cash Used in Investing Activities (2,764) (2,426) (2,042)Dividends Paid (481) (364) (322)Free Cash Flow $825 $437 $516CONSOLIDATED STATEMENTS OF CASH FLOWOperating Activities: <strong>2008</strong> 2007 2006Net Income $2,338 $1,855 $1,606Depreciation 1,387 1,321 1,237Deferred Income Taxes 547 332 235Other - Net (202) (231) (198)Cash Provided by Operating Activities 4,070 3,277 2,880Investing Activities:Capital Investments (2,780) (2,496) (2,242)Other - Net 16 70 200Cash Used in Investing Activities (2,764) (2,426) (2,042)Financing Activities:Debt Issued 2,257 1,581 -Common Shares Repurchased (1,609) (1,375) -Debt Repaid (1,208) (792) (657)Dividends Paid (481) (364) (322)Other - Net 106 150 195Cash Used in Financing Activities (935) (800) (784)Net Change in Cash and Cash Equivalents $371 $51 $54RETURN ON INVESTED CAPITAL (ROIC)Net Income $2,338 $1,855 $1,606Add: Interest Expense 511 482 477Add: Sale of Receivables Fees 23 35 33Add: Interest on Present Value of Operating Leases 299 292 268Less: Taxes on Interest and Fees (301) (310) (283)Net Operating Profit After Tax as Adjusted (a) $2,870 $2,354 $2,101Average Equity $15,516 $15,448 $14,510Add: Average Debt 8,305 7,232 7,098Add: Average Value of Sold Receivables 592 600 600Add: Average Present Value of Operating Leases 3,737 3,648 3,349Average Invested Capital as Adjusted (b) $28,150 $26,928 $25,557Return on Invested Capital as Adjusted (a/b) 10.2% 8.7% 8.2%36
DEBT TO CAPITAL/ADJUSTED DEBT TO CAPITALReconciliation to GAAP(In millions of dollars except percentages)<strong>2008</strong> 2007 2006Debt (a) $8,927 $7,682 $6,780Equity 15,447 15,585 15,312Capital (b) $24,374 $23,267 $22,092Debt to Capital (a/b) 36.6% 33.0% 30.7%<strong>2008</strong> 2007 2006Debt $8,927 $7,682 $6,780Value of Sold Receivables 584 600 600Net Present Value of Operating Leases 3,690 3,783 3,513Unfunded Pension and OPEB 733 234 317Adjusted Debt (a) $13,934 $12,299 $11,210Equity 15,447 15,585 15,312Adjusted Capital (b) $29,381 $27,884 $26,522Adjusted Debt to Capital (a/b) 47.4% 44.1% 42.3%37
2005 INCOME TAX ADJUSTMENTReconciliation to GAAP(In millions of dollars except earnings per share)Management believes certain non-GAAP measures provide an alternative presentation of the results that moreaccurately reflect on-going Company operations. The full year 2005 net income of $908 million and earnings perdiluted share of $3.41, which excluded the income tax expense reduction item reported in the third quarter of 2005,are non-GAAP measures. Management believes these measures provide an alternative presentation of results thatmore accurately reflects on-going Company operations, without the distorting effects of the income tax expensereduction item. These measures should be considered in addition to, not a substitute for, the reported GAAP results.Full Year 2005 Results As Reported Income Tax AdjustmentOperating Revenue $13,578 $13,578Operating Expenses 11,783 11,783Operating Income 1,795 1,795Operating Margin 13.2% 13.2%Operating Ratio 86.8% 86.8%Other Income - Net 145 145Interest Expense (504) (504)Income Before Income Taxes 1,436 1,436Income Tax Expense (410) (528)(a)Net Income $1,026 $908Diluted Earnings Per Share $3.85 $3.41Diluted Earnings Per Share -Restated for May 28, <strong>2008</strong> Stock Split $1.92 $1.71Third Quarter 2005 Results As Reported Income Tax AdjustmentOperating Revenue $3,461 $3,461Operating Expenses 2,980 2,980Operating Income 481 481Operating Margin 13.9% 13.9%Operating Ratio 86.1% 86.1%Other Income - Net 42 42Interest Expense (124) (124)Income Before Income Taxes 399 399Income Tax Expense (30) (148)(a)Net Income $369 $251Diluted Earnings Per Share $1.38 $0.94Diluted Earnings Per Share -Restated for May 28, <strong>2008</strong> Stock Split $0.69 $0.47(a) Income tax expense reduction of $118 million after-tax taken in third quarter 2005Note: Totals may not foot due to rounding38
Cautionary InformationThe <strong>2008</strong> Analyst “<strong>Fact</strong> <strong>Book</strong>” provides additional explanatoryinformation regarding <strong>Union</strong> <strong>Pacific</strong> that may not beavailable, included or directly derived from information inthe Company’s Annual Report. The information provided issupplemental in nature and is not, and should not be construedas, better than that available in the Company’s publiclyavailable reports filed with the SEC. Additionally, some of theinformation in the <strong>Fact</strong> <strong>Book</strong> is derived from the Company’saudited financial statements, but the <strong>Fact</strong> <strong>Book</strong> and its contentshave not been, and should not be considered, audited.This <strong>Fact</strong> <strong>Book</strong> includes statements and information regardingfuture expectations or results of the Company that are nothistorical facts. These statements and information are, or willbe, forward looking as defined by the federal securities laws.Forward looking statements and information can be identifiedby use of forward looking terminology (and derivationsthereof), such as “believes”, “expects”, “may”, “should”, “will”,“would”, “intends”, “plans”, “estimates”, “anticipates”, “projects”and other words or phrases of similar intent. Forward lookingstatements and information generally include statementsand information included under sections of this <strong>Fact</strong> <strong>Book</strong>entitled “Safety and the Environment”, “Investing in OurFuture”, “Expense Initiatives” and “2009 Market Drivers”, andspecifically include statements and information regarding: theCompany’s expectations or forecasts with respect to generaleconomic conditions in the U.S. and the world; the Company’sfinancial and operational performance; increases of theCompany’s earnings; demand for the Company’s rail service;the continued ability of the Company to increase prices; plansor expectations regarding contract renegotiations; improvingcustomer service; enhancing profitability; volume and revenuegrowth; efficiency improvements and increasing returns;improving asset utilization; the effectiveness or growth ofnew and newer services; total amount of capital investments;completion and effectiveness of capacity expansion and othercapital investments, and other investments in upgrading oradding signals and facilities; returns on capital investments;improvements regarding safety of our operations andequipment; effectiveness of the Unified Plan and otherinitiatives, such as projects involving the Lean managementprocess and Project OR; the impact of adjusting to theeconomy; and business operations over the next 2 to 3 years.Forward-looking statements and information should not beread as a guarantee of future performance or results, and willnot necessarily be accurate indications of the times that, or bywhich, such performance or results will be achieved. Forwardlookingstatements and information are subject to risks anduncertainties that could cause actual performance or results todiffer materially from those expressed in the statements.Forward-looking statements and information reflect the goodfaith consideration by management of currently availableinformation, and may be based on underlying assumptionsbelieved to be reasonable under the circumstances. However,such information and assumptions (and, therefore, suchforward-looking statements and information) are or maybe subject to variables or unknown or unforeseeable eventsor circumstances over which management has little or noinfluence or control. The Risk <strong>Fact</strong>ors in Item 1A of theCompany’s Annual Report on Form 10-K, filed on February6, 2009, could affect our future results and could cause thoseresults or other outcomes to differ materially from thoseexpressed or implied in the forward-looking statements andinformation. This <strong>Fact</strong> <strong>Book</strong> should be read in considerationof these Risk <strong>Fact</strong>ors. To the extent circumstances require orthe Company deems it otherwise necessary, the Company willupdate or amend these Risk <strong>Fact</strong>ors in subsequent AnnualReports, periodic reports on Form 10-Q or current reports onForm 8-K.Forward-looking statements speak only as of the date thestatement was made. We assume no obligation to updateforward-looking information to reflect actual results, changesin assumptions or changes in other factors affecting forwardlookinginformation. If we do update one or more forwardlookingstatements, no inference should be drawn that we willmake additional updates with respect thereto or with respect toother forward-looking statements.39