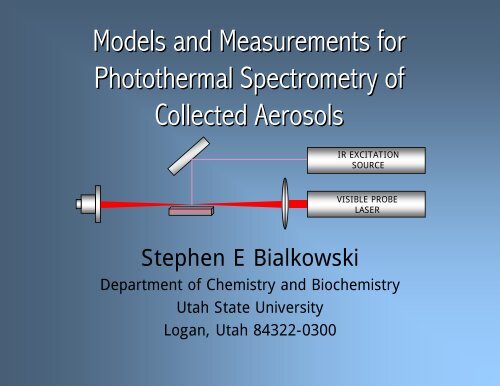
Photothermal Deflection Spectroscopy of Collected Aerosols
Photothermal Deflection Spectroscopy of Collected Aerosols
Photothermal Deflection Spectroscopy of Collected Aerosols
- No tags were found...

You also want an ePaper? Increase the reach of your titles
YUMPU automatically turns print PDFs into web optimized ePapers that Google loves.
Chemical Analysis Perspective <strong>of</strong><strong>Photothermal</strong> Spectrometry <strong>Spectroscopy</strong> measures light absorption in order toquantitatively identify substances <strong>of</strong> interest The photothermal effect heats a sample uponabsorption <strong>of</strong> electromagnetic radiation Refractive index change from the photothermaltemperature change produces an optical signals High irradiance sources produce large temperaturechanges, thus large signals Is an ultrasensitive technique used to measureoptical absorbance to 10 -7 AU in fluids
PrinciplesOptical energy absorbed and not lost through emission results in sampleheating. For pulsed excitationαHYHδ T =ρCThe temperature change alters the sample’s s refractive index.⎛ dn⎞δn= ⎜ ⎟ δT⎝dT⎠ PThe complex transmission produces a phase shift that is converted d to apower change by a variety <strong>of</strong> optical techniques.<strong>Photothermal</strong> detection techniques are all ultimately diffraction-based.P
Apparatuses to Detect<strong>Photothermal</strong> Heating<strong>Photothermal</strong> Reflection Lens(<strong>Photothermal</strong> Bump Detection)THERMAL LENSDETECTORHEATINGBEAMLENSVISIBLE PROBELASER<strong>Photothermal</strong> <strong>Deflection</strong>(Mirage Effect)SAMPLEVISIBLE PROBELASERPOSITIONSENSINGDETECTORLENS
<strong>Photothermal</strong> Detection:ApparatusesContinuous Excitation Homogeneous Sample– e.g. continuous-wave laserexcited photothermal lens Heterogeneous Sampleor Experiment Geometry– e.g. photothermal deflectionfrom arc-lamp excited surfacePulsed Excitation Homogeneous Sample– e.g. pulsed-laser laser excitedBrillion scattering (PT gratings) Heterogeneous Sampleor Experiment Geometry– e.g. pulsed-laser laser excitedcylindrical sample cell andsurface excitation
<strong>Photothermal</strong> Detection: ComparisonContinuous Excitation: Homogeneous Sample– Very sensitive non-aqueous– Convection & flow noise– Requires laser source– Signal loss with flow Solid Sample orHeterogeneous Geometry– Can use regular light sources– Good fluid heat transfer– May reduce convectionPulsed Excitation: Homogeneous Sample– Most sensitive for gases– Nonlinear effects common– Requires laser source– Best for flowing samples Solid Sample orHeterogeneous Geometry– Highest temperature change– Sample damage– Nonlinear effects– Use laser sources
Considerations for Chemical Analysis Trace analysis needs low detection limits Dynamic range is important for practical samples Precision is equally important in mixtures Analysis should be standardized Measurements and reports should be comparable between all laboratories Need for stable calibration methods and materials Suitable instrument calibration standards are needed for each phase andexperiment type Standard Reference Materials (SRM) seem to be lacking in the analyticalchemical community using photothermal spectroscopy
Further Considerations for Chemical Analysis Chemical analysis requires “well-behaved” techniques Measurements need to be reproducible and stable Reproducible light source, alignments, sample measurementdiagnostics. No changes in chemical state No thermal decomposition No optical bleaching and other nonlinear effects Minimize convective cooling turbulence flicker noise
Aerosol Air PollutionAgriculture WasteLogan, UtahVehicle EmissionsIndustrial EmissionsLand-Use Change
<strong>Photothermal</strong> Detection <strong>of</strong> Condensed <strong>Aerosols</strong>* Why aerosols?– Increasing awareness <strong>of</strong> health risks due to PM 2.5 or less– Increasing amounts with anthropogenic origin– Implications in public health and safety– Environmental regulations What aerosols?– Natural Smoke, Salts (NaCl(NaCl), Clay Minerals (dust, clay)– AnthropogenicAmmonium Nitrate, Pesticide Sprays, Exhaust Smoke, Smog Why photothermal?– Sensitivity– Complex matrix– Difficult analysis– In Situ analysis more accurate* Initial collaboration with James Amonette, Tom Autrey and Nancy y Foster-Mills, Pacific Northwest Laboratory
PM 2.5 – Effects PM 2.5 refers to “Particulate Matter” 2.5 μm m or less in diameter <strong>Aerosols</strong> are technically liquids though are <strong>of</strong>ten grouped as PM 2.5 A PM 2.5 weighs about 1 pg. The health effects associated with exposure to fine particles aresignificant. Scientific studies have shown significant associations between elevated efineparticle levels and premature mortality. Effects associated with fine particle exposure include aggravation <strong>of</strong>respiratory and cardiovascular disease, lung disease, decreased lungfunction, asthma attacks, and certain cardiovascular problems such as heartattacks and cardiac arrhythmia. It is estimated that 44,000 persons die prematurely each year in the USAdue to particulates
PM – Updated RulesUS EPA Fine Particle National Air Quality Standards policy was put pinto effectSeptember, 2006Larger Particulate Matter inhalable coarse particles (PM 10 50 μg/m3 Annual Mean (Annual arithmetic mean not to exceed) 150 μg/m3 24-hour (Not to be exceeded more than once per year)Smaller Particulate Matter fine particles (PM 15.0 μg/m3 Annual Mean35 μg/m3 24-hour (25 ppb w/w)(PM 2.5 )http://www.epa.gov/air/particlepollution/pdfs/20060921_factsheet.pdf.pdf10 )
Logan, Utah USA Elevation 4535 feet (1382 m) Population 42,670 (91,391 total valley) 80 miles from nearest population center- Salt Lake City ~ 250,000 popIndustry: AgricultureUp-wind: deserts- no industryAir Quality: Worst PM 2.5 in USA !– (Winter 2004/2005)Reason: Cars + Cows (NH 3 + HNO 3 → NH 4 NO 3 )– Some carbonaceous and sulfate aerosolsCurrent Analysis– Particle counting (laser scattering)– Particle collection and analysisUSA Today Posted 3/8/2005 4:04 PM“Northern Utah residents choke on bad air LOGAN, Utah (AP) — In thesummer, Cache Valley's verdant parks and riverside trails in theWasatch Range are a haven for outdoor enthusiasts who describe thisnorthern Utah mountain basin as a kind <strong>of</strong> Shangri-La.For about 40 days since November, at-risk residents like Koerner, 54— who make up 30% <strong>of</strong> the valley's population — have choked on anunrelenting pea soup <strong>of</strong> smoky haze, much <strong>of</strong> it belched by the engines<strong>of</strong> the area's estimated 75,000 automobiles. …”
Laboratory-Based Condensed PhaseAerosol Measurements Aerosol Generation and Collection– Ammonium nitrate and Malathion (pesticide)– Germanium collection plate (2.5 cm diameter)– Free aerosol generator, no particle sizing/reforming Average aerosol ~ 2.0 μm m each with mass ~ 1.0 pg Surface coverage under 25% <strong>Photothermal</strong> <strong>Deflection</strong> Measurement– Pulsed infrared laser excitation (carbon dioxide 9.56 μm)– Helium-Neon probe laser with bi-cell position sensing electronics
Aerosol Particle Generation and Sampling
Aerosol / Particle Generation Nebulizer mist generation Drying (3-stages) Maturation with time/distance in flow Filtering/Thermal conditioning (~4 m with dry air) Impinger depositionCarrierConditioningSolutione.g., NH 4 NO 3
<strong>Aerosols</strong> Generation and SamplingMethod51. Air source2. Valve 12363. Air filter144. Atomizer11125. Pressure gauge6. Drier77. Mixer(0.1524m X 4 m cylindrical tube)88. Slow Flow tube9. MOUDI10910. Vacuum11. Valve 212. Air filter
<strong>Aerosols</strong> Generation and SamplingAtomizerMOUDI*Impaction plate* MOUDI is Micro-Orifice Uniform-Deposit Impactor
Rotating and Stationary ImpactionDeposit pattern for nonrotatingimpaction plate250200Pixel Intensity1501005000 100 200 300 400 500 600Cross Section [um]Distribution for individualimpactor spot“Uniform deposit” patternfor rotating impactor plate
Size and Number Calibration <strong>Aerosols</strong> are collected at different MOUDI stages for different times t(MOUDI flow rate = 5 L/min) Plates are inspected with an optical microscope The average size and number surface density are measured The differential plate mass are measured with a microbalance Mass is used to calculate particle density and to scalephotothermal signals to mass loading20 seconds120 seconds100 μm100 μm
Simple IR Laser-Excited<strong>Photothermal</strong> <strong>Deflection</strong> ApparatusPositionSensingDetectorCO 2 LaserExcitationLensHe-Ne ProbeLaserGe SubstrateAmmoniun Nitrate AerosolExcitation Fluence = 12 J m -2Malathion Aerosol PDSExcitation Fluence = 45 J m -20.51.20.41.0Signal (V)0.30.20.10.0-0.10.000 0.002 0.004 0.006 0.008 0.010Signal (V)0.80.60.40.20.0-0.20 0.002 0.004 0.006 0.008 0.01Time (s)Time (s)
IR Laser-Excited <strong>Photothermal</strong> <strong>Deflection</strong>Apparatus for Aerosol Detection Aerosol samples collected onGe or ZnSe blanks. Pulsed 9.56 μm m CO 2 laser forexcitation HeNe or diode laser probe in“Mirage“ configuration. Bi-cell/operational dividerdeflection detection Adaptive matched filter signalanalysis
Summary <strong>of</strong> Aerosol Data Analysis No detected loss <strong>of</strong> signal with time No detected damage to sample at the relative low fluence Actively probed area ~ 10 -5 m 2 Number <strong>of</strong> aerosol “spots”– ~1000 for ammonium nitrate– ~ 100 for Malathion SNR indicates single aerosol detection possible withunimproved apparatus Substrate results in negligible signal
<strong>Aerosols</strong> Number Concentration1009080‣ Signal increases withnumber <strong>of</strong> particles andcoverage areaNumber <strong>of</strong> Particles70605040302010R 2 = 0.981500 20 40 60 80 100 120 140Loading Time [s]0.5‣ Linear calibrationwithin the loading timerange.<strong>Photothermal</strong> Signal0.450.40.350.30.250.20.150.10.05R 2 = 0.987500 20 40 60 80 100Predicted Counts
<strong>Photothermal</strong> Signal<strong>Photothermal</strong> Signal0.070.060.050.040.030.020.01<strong>Photothermal</strong> Signal0.80.70.60.50.40.30.20.100 5 10 15 20 25 30 35Collection Time [min.]00 0.01 0.02 0.03 0.04 0.05 0.06 0.07Average Mass <strong>of</strong> Individual Spot [μg]Detection limit from signal-mass curve is 7.31 ngAerosol mass concentration is calculated from MOUDIflow rate and collection time. A detection limit <strong>of</strong> 0.65μg/m 3 for 30 L/min flow rate and 30 min collectiontime.
So why are the detection limits so high forthese photothermal signals? The problem is not one <strong>of</strong> sensitivity but one <strong>of</strong> variability Single aerosols can be detected with this apparatus The problem appears to be the irreproducibility <strong>of</strong> thecollection stage or the aerosols themselves– The MOUDI produces heterogeneous spots– There is an intrinsic variance due to the probabilitydistribution. There may be “chemical” differences in the aerosols usedfor calibration. Laboratory-generated aerosols may not be at equilibrium– Water content may be a large variable
Potential Interpretation Problems The goal is to have more sensitive real-time detectionfor mass concentration but photothermal deflectionmeasures optical absorption. Particulate matter do not follow Beer’s s Law if they arestacked in layers. Data analysis should account for surfacecoverage. Particulate mass will not follow Beer’s s Law if they areoptically thick. Data analysis should account for varyingoptical extinction. As with most other types <strong>of</strong> photothermal spectrometry,signal may be a function <strong>of</strong> particulate heat capacity andthermal diffusivity
MOUDI Calibration CurveStage 6 (0.56 um)Stage 5 (1 um)Average Mass per Spot [ μ g]0.900.800.700.600.500.400.300.200.100.000 10 20 30 40 50 60Collection Time [min]Nonlinearity is due to surface “saturation”
Aerosol Loading EffectsEvolution aerosol deposition canfollow a Poisson function1009080P (n,λAt)) = ( (λAt) n exp(-λAt)/)/n!Where t is loading time, A issurface area, λ is deposition rateNumber <strong>of</strong> particles70605040302010Corrected countReal count"Probability that pile-up occurs isP o = 1 - exp(-ga)00 50 100 150Loading Time [s]Where g is a surface extinctioncoefficient, and a is the surfaceparticle density.0.120.10.08Corrected count is given asRSD0.060.04n = n 0 exp(-ga)0.02Where n is the real number and n 0the measured count.00 20 40 60 80 100 120 140Loading Time [s]
Finite Element Analysis Modeling Finite Element Analysis is a tool for numerical solutions to complex differentialequations Comsol Multiphysics v. 3.3 Steps Define sample geometry Specify materials, boundaryconditions, heat sources and sinks Solve problem with rough finiteelement definitions Obtain δT time series Calculate relative photothermalelement Comparison to standardapproximate results
Finite Element Analysis Calculations The experiments aremodeled as functions <strong>of</strong>– Aerosol size– Aerosol optical absorbance– Aerosol heat capacity andthermal conductivity– Arrangements <strong>of</strong> aerosolson surface– Substrate heat capacity andthermal conductivity
Particle “Crowding” Effect Does inter-particle contact affect the photothermal signal? Modeled as three 2 μm m diameter particles with variable distancebetween them The total time-dependent photothermal deflection signal is calculatedConclusion:inter-particle heat transferaffects signal magnitudeand shape<strong>Photothermal</strong> <strong>Deflection</strong>1.210.80.60.40.204um 2m 1um no interval0 0.5 1 1.5 2 2.5 3Time [μs]
Substrate Thermal Conductivity Effect How does substrate heat transport affect particulate signals? Modeled as three 2 μm m diameter (NH 4 NO 3 ) particles with high andlow optical absorption.Low Optical Absorption Coefficient ParticleSubstrate thermal conductivity : Air thermal conductivity ratio1.8<strong>Photothermal</strong> <strong>Deflection</strong>1.61.41.210.80.60.40.210000100010010510.50.100 5 10 15 20 25 30Time [μs]
Results for Substrate Thermal ConductivityLow Optical Absorption Coefficient ParticleSubstrate thermal conductivity : Air thermal conductivity ratio1.8Increasing substratethermal conductivitydecreases signal decaytimeFor the high absorbancecase, the decay timechanges in a complexfashion due to thecoupling between theparticle to surface throughthe air.<strong>Photothermal</strong> <strong>Deflection</strong><strong>Photothermal</strong> <strong>Deflection</strong>1.61.41.210.80.60.40.202.51.50.50 5 10 15 20 25 30Time [μs]321High Optical Absorbance ParticleSubstrate thermal conductivity : Air thermal conductivity ratio0.11101001000100000.111010010001000000 5 10 15 20 25 30Time [μs]
Substrate Heat Capacity Effect How does substrate heat capacity affect particulate signals? Modeled as three 2 μm m diameter (NH 4 NO 3 ) particles with high andlow optical absorption. No significant changes for high optical absorbance aerosols2.5Substrate heat capacity : Air heat capacity ratio10 5 3<strong>Photothermal</strong> <strong>Deflection</strong>21.510.500 5 10 15 20 25 30Time [μs]
Inference from Heat Transport and Signal Modeling Predicted signals show large changes with thermal conductivity, opticalabsorption coefficients, and proximity to other aerosols. Signals are relatively stable with respect to heat capacity, especially ecially for highabsorbance samples. As might be expected, predicted signals are dependent on probe beam bgeometry and aerosol layering (vertical stacking). The big problem with FEM is derivingworking numerical models forprocessing data.
Summary and ConclusionsSummary and Conclusions Aerosol photothermal deflection spectroscopy is a sensitivemethod that may be used to perform in situ atmosphericanalysis The detection limit from the signal-mass curve was 7.3 ng Aerosol mass concentration is calculated from theseexperiments demonstrated a detection limit <strong>of</strong> 0.65 μg/m 3for 30 L/min flow over a 30 min collection time This is much better than the current technology using“sample and weigh”. As with most aerosol analysis methods, knowledge <strong>of</strong> theparticle composition is needed to calculate μg/m 3 fromsignal.
Future Aerosol Work We need to us an in situ apparatus to measure aerosolconcentrations side-byby-side with “conventional” equipment. In terms <strong>of</strong> understanding the signals, we need to answer– How cooperative heat transfer effects in high-sample surface density– Can we use the time-dependent signals to determine aerosol thermaland absorbance properties? Finally, can we obtain multiple aerosol signals that are asprecise as the individual aerosol measurements?
Stephen Bialkowski’s s LaboratoryMatt JorgensonAgnes ChartierOluwatosin DadaStan Wellard
Acknowledgements Several persons worked on experiments and contributeddiscussions:– Oluwatosin Dada (graduate) obtained most aerosol and glassmeasurements– Matt Jorgensen (undergraduate) FEM finite element analysiscalculations– Dr. Agnès Chartier (Valspar)– Spiricon, Inc. (Logan UT) for pyroelectric camera and videointerfaces This research has been supported by the state <strong>of</strong> Utah, NASA,USDA, DARPA and National Institutes <strong>of</strong> Health. PNL for summer support (2003 and 2004) and use <strong>of</strong>Environmental <strong>Spectroscopy</strong> Laboratory equipment at EMSL