Imaging of Ultraweak Spontaneous Photon Emission ... - LifeWave
Imaging of Ultraweak Spontaneous Photon Emission ... - LifeWave
Imaging of Ultraweak Spontaneous Photon Emission ... - LifeWave

Create successful ePaper yourself
Turn your PDF publications into a flip-book with our unique Google optimized e-Paper software.
<strong>Imaging</strong> <strong>of</strong> <strong>Ultraweak</strong> <strong>Spontaneous</strong> <strong>Photon</strong> <strong>Emission</strong>from Human Body Displaying Diurnal RhythmMasaki Kobayashi 1 *, Daisuke Kikuchi 1 , Hitoshi Okamura 2,3 *1 Department <strong>of</strong> Electronics and Intelligent Systems, Tohoku Institute <strong>of</strong> Technology, Sendai, Japan, 2 Department <strong>of</strong> Systems Biology, Kyoto University Graduate School<strong>of</strong> Pharmaceutical Sciences, Kyoto, Japan, 3 Department <strong>of</strong> Brain Science, Kobe University Graduate School <strong>of</strong> Medicine, Kobe, JapanAbstractThe human body literally glimmers. The intensity <strong>of</strong> the light emitted by the body is 1000 times lower than the sensitivity <strong>of</strong>our naked eyes. <strong>Ultraweak</strong> photon emission is known as the energy released as light through the changes in energymetabolism. We successfully imaged the diurnal change <strong>of</strong> this ultraweak photon emission with an improved highlysensitive imaging system using cryogenic charge-coupled device (CCD) camera. We found that the human body directly andrhythmically emits light. The diurnal changes in photon emission might be linked to changes in energy metabolism.Citation: Kobayashi M, Kikuchi D, Okamura H (2009) <strong>Imaging</strong> <strong>of</strong> <strong>Ultraweak</strong> <strong>Spontaneous</strong> <strong>Photon</strong> <strong>Emission</strong> from Human Body Displaying Diurnal Rhythm. PLoSONE 4(7): e6256. doi:10.1371/journal.pone.0006256Editor: Joseph Najbauer, City <strong>of</strong> Hope Medical Center, United States <strong>of</strong> AmericaReceived March 4, 2009; Accepted June 11, 2009; Published July 16, 2009Copyright: ß 2009 Kobayashi et al. This is an open-access article distributed under the terms <strong>of</strong> the Creative Commons Attribution License, which permitsunrestricted use, distribution, and reproduction in any medium, provided the original author and source are credited.Funding: This work was supported in part by The Grants-in-Aid for Scientific Research (M.K) and The Special Promotion Funds (H.O) from Ministry <strong>of</strong> Education,Culture, Sports, Science and Technology <strong>of</strong> Japan. The funders had no role in study design, data collection and analysis, decision to publish, or preparation <strong>of</strong> themanuscript.Competing Interests: The authors have declared that no competing interests exist.* E-mail: masaki@tohtech.ac.jp (MK); okamurah@pharm.kyoto-u.ac.jp (HO)IntroductionBioluminescence, which is weak but visible, is sometimesproduced in living organisms, such as fireflies or jellyfish, as theresult <strong>of</strong> specialized enzymatic reactions that require adenosinetriphosphate. However, virtually all living organisms emitextremely weak light, spontaneously without external photoexcitation[1]. This biophoton emission is categorized in differentphenomena <strong>of</strong> light emission from bioluminescence, and isbelieved to be a by-product <strong>of</strong> biochemical reactions in whichexcited molecules are produced from bioenergetic processes thatinvolves active oxygen species [1,2]. Human body is glimmeringwith light <strong>of</strong> intensity weaker than 1/1000 times the sensitivity <strong>of</strong>naked eyes [3,4]. By using a sensitive charge-coupled-device(CCD) camera with the ability to detect light at the level <strong>of</strong> a singlephoton, we succeeded in imaging the spontaneous photonemission from human bodies [3].Previously, for obtaining an image, it took more than 1 hour <strong>of</strong>acquisition, which is practically impossible for the analysis <strong>of</strong>physiologically relevant biophoton emission. By improving theCCD camera and lens system, here we have succeeded inobtaining clear images using a short exposure time, comparablewith the analysis <strong>of</strong> physiological phenomena. Since metabolicrates are known to change in a circadian fashion [5,6], weinvestigated the temporal variations <strong>of</strong> biophoton emission acrossthe day from healthy human body.Results and DiscussionA cooled CCD camera operated at 2120uC with slow scanningmode read-out was used with a specially designed high-throughputlens system. The camera was placed in a light-tight room incomplete darkness (schematic illustration <strong>of</strong> the experimental setupis shown in Fig. 1A). Five healthy male volunteers, in their 209s,were subjected to normal light-dark conditions and allowed tosleep from 0:00–7:00. On the days <strong>of</strong> photon imaging, volunteerswere kept in a room (400 lux) adjacent to the dark room. Forimaging purposes, the body surface was wiped and the subject wasleft 15 minutes in the dark room for dark adaptation, after whichthe naked subject in sitting position was exposed for 20 minutes tothe CCD camera. Measurements were carried out in every3 hours from 10:00 to 22:00 and continued for 3 days. Just beforeand after the measurements, the surface body (thermography) andoral temperature were taken. Saliva was also collected after thephoton measurements for the analysis <strong>of</strong> cortisol level as abiomarker <strong>of</strong> endogenous circadian rhythms. Temporal variation<strong>of</strong> photon emission intensity was calculated from image data withextraction <strong>of</strong> the face and body intensity.The daily variation <strong>of</strong> photon emission is shown in Fig. 1B–G.In all images, photon emission intensity from the face was higherthan from the body. Moreover, photon emission intensity from theface was not homogeneous: the central area around the mouth andthe cheeks was higher than the lateral area and the orbits.Furthermore, the photon emission intensity on the face and upperbody appeared to display time-dependent changes. We plottedtotal photon emission intensity over the body and face againsttime, averaged across the 5 volunteers (Fig. 1H). <strong>Photon</strong> emissionwas weak in the morning, increased in the afternoon and peakedin the late afternoon (ca 16:00) (one way ANOVA, F 4,74 = 4.10,P,0.005). These data strongly suggest that there is a diurnalrhythm <strong>of</strong> photon emission from the human body. To furthersupport this conclusion, immediately following the end <strong>of</strong> theprevious experiment three volunteers were kept awake in a light(400 lux) environment and photon emission was measured at 1:00,4:00 and 7:00 AM (Supplementary Figure S1). <strong>Photon</strong> emissionformed a peak at late afternoon, then gradually decreased andstayed low at 1:00–7:00 AM in a constantly exposed lightPLoS ONE | www.plosone.org 1 July 2009 | Volume 4 | Issue 7 | e6256
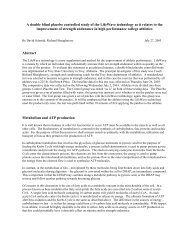
Glimmering Human BodyFigure 1. A. Schematic illustration <strong>of</strong> experimental setup. B–F. Images <strong>of</strong> ultraweak photon emission from human body. B. Image <strong>of</strong> the subjectunder light illumination. C. Image at 10:10. D. Image at 13:10. E. Image at 16:10. F. Image at 19:10. G. Image at 22:10 with a calibration bar whichindicates the estimated radiation intensity expressed by photon number per unit <strong>of</strong> time per unit <strong>of</strong> skin surface. H. Daily rhythm <strong>of</strong> photon emissionfrom face and body from 5 volunteers. Significant difference from the photon emission at 10:00 AM (n = 15, Mean6SD; **P,0.01, *P,0.05). I. Atypical thermographic image <strong>of</strong> the subject from Fig. 1B–G.doi:10.1371/journal.pone.0006256.g001PLoS ONE | www.plosone.org 2 July 2009 | Volume 4 | Issue 7 | e6256
Glimmering Human Bodycondition (400 lux), indicating the diurnal rhythm <strong>of</strong> photon mightbe caused by endogenous circadian mechanism.<strong>Ultraweak</strong> biophoton emission was completely different fromthermographic images showing surface temperature (Fig.1I). Highphoton emission were detected from the cheeks, followed by theupper neck and the forehead, while high temperature was detected inthe supraclavicular lateral neck region, from which photon emissionwas low. In cheek, the highest level <strong>of</strong> emission reaches to 3000photon/s?cm 2 at 16:00 which is about double to the value at 10:00.Next, we examined the correlation <strong>of</strong> photon emission to otherphysiological parameters known to show circadian variations. Inthe subject <strong>of</strong> Fig.1B–G, we found a temporal decrease <strong>of</strong> cortisolfrom morning to evening, in opposite to the increase <strong>of</strong> photonemission (Fig. 2A). Cortisol concentration shows a clear dailyrhythm, peaking in the morning and negatively correlated withphoton emission intensity (p,0.002; from 5 volunteers; Fig. 2B).Body temperature, another parameter showing daily rhythmspeaking at night, does not show significant correlation with photonemission (Supplementary Figure S2).The photon emission mechanism is thought to originate fromthe generation <strong>of</strong> free radicals in energy metabolic processes. Thespectra <strong>of</strong> photon emission detected from the palm skin span from500 to 700 nm, with primary and secondary emission peaks at630–670 nm and 520–580 nm, respectively [7]. Free radicalssubsequently react with lipid or protein, generating electronicallyexcited species as byproducts [1]. These excited molecules, such ascarbonyl group in excited triplet state from lipid peroxidation orproteins including excited tyrosine or tryptophan, can further reactwith fluorophores through energy transfer and lead to photonemission [8,9]. Higher level photon emission on facial skin mightbe caused by differences in the content <strong>of</strong> melanin fluorophores[10] between facial and thoracic skin.No significant correlation <strong>of</strong> daily photon intensity andtemperature was found, and the dissimilarity between photonemission and thermal image suggest that the diurnal rhythm <strong>of</strong>photon emission is not a consequence <strong>of</strong> a change <strong>of</strong> temperatureor microcirculation. Moreover, a clear negative correlation <strong>of</strong>temporal changes <strong>of</strong> photon emission and cortisol might suggestthat the diurnal rhythm <strong>of</strong> photon emission reflects the changes <strong>of</strong>cellular metabolic processes under the control <strong>of</strong> the circadianclock. Circadian rhythms are generated in most cells throughoutthe body, driven by clock genes interlocked in transcription/translation feedback loops [11,12]. Recent advances <strong>of</strong> chronobiologyhave revealed that the redox state <strong>of</strong> the cells regulatescircadian gene expression, indicating the importance <strong>of</strong> metaboliccues for clock oscillations [6,13,14]. Indeed, glucose utilization,accompanied by oxygen consumption, shows robust rhythms inthe main mammalian circadian center [5]. By the regulation <strong>of</strong>cellular respiratory chain producing reactive oxygen species, whichin turns react with molecules including proteins, lipids andfluorophores, whose excited states emit biophotons [1,8,9,10], thehuman body glitters to the rhythm <strong>of</strong> the circadian clock.Materials and MethodsCCD camera systemSpectral Instruments 600 series CCD camera system (SpectralInstruments, Inc., AZ, USA) was used. Mounted CCD42-40 (e2vtechnologies Ltd., Essex, UK), which is a back-illuminated, fullframeoperation CCD with a 204862048 pixel resolution and13.5613.5 mm pixel size. The camera system is equipped with acooling head to maintain the CCD at 2120uC using a closed-cyclemechanical cryogenic unit. Under these conditions, quantumefficiency is 75% at the peak wavelength. Dark current is 0.65electron/pixel/h and readout noise in the slow scanning mode isless than 4.5 electron rms. The CCD camera head has a speciallydesigned lens system, which is designed to maximize the lightcollection efficiency (numerical aperture (NA) <strong>of</strong> the lens system onthe detector side is 0.5 and the number <strong>of</strong> lenses is restricted 7pieces). Magnification <strong>of</strong> the lens system is 1/20 and the lightcollection efficiency to the surface <strong>of</strong> the subject is 1.0610 23 .Inthis experiment, the CCD was operated in the 868 binning mode,and the actual pixel number was 2566256. Taking into accountthe detection limit, which is determined by dark current andreadout noise <strong>of</strong> the CCD, as well as light collection efficiency, theminimum detectable number <strong>of</strong> photons on each pixel is estimatedca 100 photon/s/cm 2 on the surface <strong>of</strong> the subject under themeasurement condition.Figure 2. A. Comparison <strong>of</strong> temporal variation <strong>of</strong> biophoton emission intensity and cortisol concentration in saliva observed through 3 days. Shadedregions indicate sleeping time. The subject is the one <strong>of</strong> Fig. 1B–G. B. Daily change <strong>of</strong> cortisol secretion (left; n = 15, Mean6SD) and its correlationwith photon emission intensity (right). A negative correlation was found (r = 20.3074, P,0.002).doi:10.1371/journal.pone.0006256.g002PLoS ONE | www.plosone.org 3 July 2009 | Volume 4 | Issue 7 | e6256
Glimmering Human BodyMeasurement procedureAll study participants were healthy males in their 209s withoutany skin diseases or oral medications. The average time <strong>of</strong> sleeponset was 23:30 hours (range, 23:00 to 01:00 hours) and that forawakening was 06:15 hours (range, 06:00 to 07:00 hours). Noattempt was made to synchronize the sleeping habits <strong>of</strong> the studyparticipants before the study. From one week before theexperiments, subjects were under controlled conditions tomaintain regular sleeping hours. Subjects were not allowed touse cosmetics including aftershave lotion. Volunteers had lunch at12:30 hours and dinner at 18:30 hours. Snacks and cold drinkswere allowed between meals, at the study participant’s discretion.During body imaging, participants were naked from the waist up.After a slight wipe <strong>of</strong> the body with lukewarm water, one by onethe subjects were invited in the darkroom and where a relax chairwas provided. Before photon emission measurements, the subjectswere left 15 minutes in the darkroom for dark adaptation. Duringthe dark adaptation, a thermograph to check the surfacetemperature <strong>of</strong> the body and a picture <strong>of</strong> the subject under weaklight illumination for focusing are taken. Biophoton emissionmeasurements are taken continuously for 20 minutes by the CCDcamera. During measurements, comfortable music was providedfor relaxation but sleep was not allowed. At the end <strong>of</strong> themeasurements, thermograph and picture under weak illuminationare taken again, together with the oral temperature. <strong>Photon</strong>emission intensity from the face and upper body was calculatedfrom imaging data. Salivary cortisol levels were measured byradioimmunoassay. For statistical analysis, one-way ANOVAsfollowed by Bonferroni/Dunn’s multiple comparisons wereReferences1. Popp FA, et al. (1988) ‘Biophoton emission’ multi-author review. Experientia 44:543–600.2. Kobayashi M, et al. (1999) In vivo imaging <strong>of</strong> spontaneous ultraweak photonemission from a rat’s brain correlated with cerebral energy metabolism andoxidative stress. Neurosci Res 34: 103–113.3. Kobayashi M (2003) <strong>Spontaneous</strong> ultraweak photon emission <strong>of</strong> livingorganisms—biophotons—phenomena and detection techniques for extractingbiological information. Trends in Photohchem. Photobiol 10: 111–135.4. Sauermann G, Mei WP, Hoppe U, Stab F (1999) <strong>Ultraweak</strong> photon emission <strong>of</strong>human skin in vivo: influence <strong>of</strong> topically applied antioxidants on human skin.Methods Enzymol 300: 419–428.5. Schwartz WJ, Gainer H (1977) Suprachiasmatic nucleus: use <strong>of</strong> 14C-labeleddeoxyglucose uptake as a functional marker. Science 97: 89–91.6. Merrow M, Roenneberg T (2001) Circadian clocks: running on redox. Cell 106:141–143.7. Usa M (1991) Physiological state and biophoton emission <strong>of</strong> living body. In:Inaba H, ed. Final report on Inaba Biophoton Project: Res. Develop. Corp.Japan. pp 239–277. (in Japanese)applied. The above experiments are approved by the EthicalCommittee <strong>of</strong> Kobe University Graduate School <strong>of</strong> Medicine.Supporting InformationFigure S1 <strong>Photon</strong> emission in sleep deprived volunteers. Threevolunteers kept in constant light environment (400 lux) withoutsleep, and photon counts were measured at 25:00 (1:00AM), 28:00(4:00AM) and 31:00 (7:00AM) (red dots). Note the levels <strong>of</strong> photonemissions at these time points are much lower than evening value.The values from 10:00–22:00 are adopted from Figure 1H (n = 15,Mean6SD).Found at: doi:10.1371/journal.pone.0006256.s001 (5.65 MB TIF)Figure S2 Daily change <strong>of</strong> oral temperature (left; n = 15,Mean6SD) (a), and its correlation to photon emission intensity(b). There was no significant correlation between photon emissionand oral temperature (r = 0.1630, p = 0.1682).Found at: doi:10.1371/journal.pone.0006256.s002 (7.76 MB TIF)AcknowledgementsWe thank Drs. M. Fustin and M. Okawa for critical reading <strong>of</strong> themanuscript.Author ContributionsConceived and designed the experiments: MK HO. Performed theexperiments: MK DK HO. Analyzed the data: MK DK. Contributedreagents/materials/analysis tools: MK. Wrote the paper: MK HO.8. Cadenas E (1984) Biological Chemiluminescence. Photochem Photobiol 40:823–830.9. Nakano M (1989) Low-level chemiluminescence during lipid peroxidations andenzymatic reaction. J Biolum Chemilum 4: 231–240.10. Teuchner K, et al. (1999) Femtosecond two-photon excited fluorescence <strong>of</strong>melanin. Photochem Photobiol 70: 146–151.11. Okamura H (2004) Clock genes in cell clocks: roles, actions, and mysteries. J.Biol. Rhythms 19: 388–399.12. Yamaguchi S, Isejima H, Matsuo T, Okura R, Yagita K, et al. (2003)Synchronization <strong>of</strong> cellular clocks in the suprachiasmatic nucleus. Science 302:1408–1412.13. Schibler U, Rippeyger JA, Brown SA (2001) Circadian rhythms. Chronobiology–reducingtime. Science 293: 437–438.14. Reick M, Garcia JA, Dudley C, McKnight SL (2001) NPAS2: an analog <strong>of</strong> clockoperative in the mammalian forebrain. Science 293: 506–510.PLoS ONE | www.plosone.org 4 July 2009 | Volume 4 | Issue 7 | e6256