SKANDIA GLOBAL FUNDS PLC - Fidelity Investments
SKANDIA GLOBAL FUNDS PLC - Fidelity Investments
SKANDIA GLOBAL FUNDS PLC - Fidelity Investments

You also want an ePaper? Increase the reach of your titles
YUMPU automatically turns print PDFs into web optimized ePapers that Google loves.
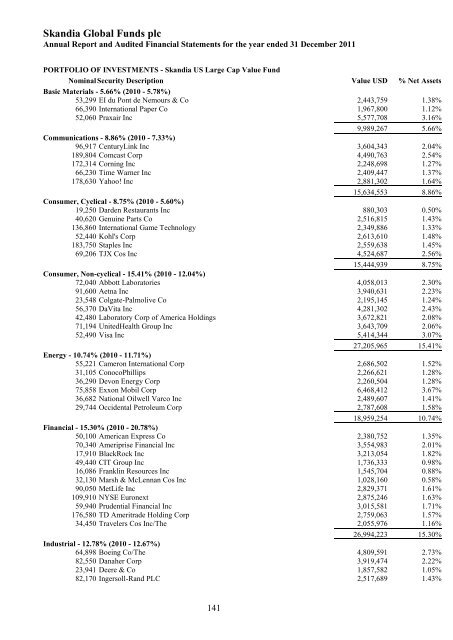
Skandia Global Funds plc<br />
Annual Report and Audited Financial Statements for the year ended 31 December 2011<br />
PORTFOLIO OF INVESTMENTS - Skandia US Large Cap Value Fund<br />
Nominal Security Description Value USD % Net Assets<br />
Basic Materials - 5.66% (2010 - 5.78%)<br />
53,299 EI du Pont de Nemours & Co 2,443,759 1.38%<br />
66,390 International Paper Co 1,967,800 1.12%<br />
52,060 Praxair Inc 5,577,708 3.16%<br />
9,989,267 5.66%<br />
Communications - 8.86% (2010 - 7.33%)<br />
96,917 CenturyLink Inc 3,604,343 2.04%<br />
189,804 Comcast Corp 4,490,763 2.54%<br />
172,314 Corning Inc 2,248,698 1.27%<br />
66,230 Time Warner Inc 2,409,447 1.37%<br />
178,630 Yahoo! Inc 2,881,302 1.64%<br />
15,634,553 8.86%<br />
Consumer, Cyclical - 8.75% (2010 - 5.60%)<br />
19,250 Darden Restaurants Inc 880,303 0.50%<br />
40,620 Genuine Parts Co 2,516,815 1.43%<br />
136,860 International Game Technology 2,349,886 1.33%<br />
52,440 Kohl's Corp 2,613,610 1.48%<br />
183,750 Staples Inc 2,559,638 1.45%<br />
69,206 TJX Cos Inc 4,524,687 2.56%<br />
15,444,939 8.75%<br />
Consumer, Non-cyclical - 15.41% (2010 - 12.04%)<br />
72,040 Abbott Laboratories 4,058,013 2.30%<br />
91,600 Aetna Inc 3,940,631 2.23%<br />
23,548 Colgate-Palmolive Co 2,195,145 1.24%<br />
56,370 DaVita Inc 4,281,302 2.43%<br />
42,480 Laboratory Corp of America Holdings 3,672,821 2.08%<br />
71,194 UnitedHealth Group Inc 3,643,709 2.06%<br />
52,490 Visa Inc 5,414,344 3.07%<br />
27,205,965 15.41%<br />
Energy - 10.74% (2010 - 11.71%)<br />
55,221 Cameron International Corp 2,686,502 1.52%<br />
31,105 ConocoPhillips 2,266,621 1.28%<br />
36,290 Devon Energy Corp 2,260,504 1.28%<br />
75,858 Exxon Mobil Corp 6,468,412 3.67%<br />
36,682 National Oilwell Varco Inc 2,489,607 1.41%<br />
29,744 Occidental Petroleum Corp 2,787,608 1.58%<br />
18,959,254 10.74%<br />
Financial - 15.30% (2010 - 20.78%)<br />
50,100 American Express Co 2,380,752 1.35%<br />
70,340 Ameriprise Financial Inc 3,554,983 2.01%<br />
17,910 BlackRock Inc 3,213,054 1.82%<br />
49,440 CIT Group Inc 1,736,333 0.98%<br />
16,086 Franklin Resources Inc 1,545,704 0.88%<br />
32,130 Marsh & McLennan Cos Inc 1,028,160 0.58%<br />
90,050 MetLife Inc 2,829,371 1.61%<br />
109,910 NYSE Euronext 2,875,246 1.63%<br />
59,940 Prudential Financial Inc 3,015,581 1.71%<br />
176,580 TD Ameritrade Holding Corp 2,759,063 1.57%<br />
34,450 Travelers Cos Inc/The 2,055,976 1.16%<br />
26,994,223 15.30%<br />
Industrial - 12.78% (2010 - 12.67%)<br />
64,898 Boeing Co/The 4,809,591 2.73%<br />
82,550 Danaher Corp 3,919,474 2.22%<br />
23,941 Deere & Co 1,857,582 1.05%<br />
82,170 Ingersoll-Rand <strong>PLC</strong> 2,517,689 1.43%<br />
141