The World Health Report - eFaber
The World Health Report - eFaber
The World Health Report - eFaber

You also want an ePaper? Increase the reach of your titles
YUMPU automatically turns print PDFs into web optimized ePapers that Google loves.
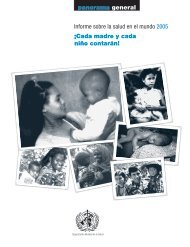
WORLD HEALTH ORGANIZATION2003<strong>The</strong> <strong>World</strong><strong>Health</strong> <strong>Report</strong>Shaping the Future
<strong>The</strong> <strong>World</strong><strong>Health</strong> <strong>Report</strong>2003Shaping the Future<strong>World</strong> <strong>Health</strong> Organization
ii <strong>The</strong> <strong>World</strong> <strong>Health</strong> <strong>Report</strong> 2003WHO Library Cataloguing-in-Publication Data<strong>World</strong> <strong>Health</strong> Organization.<strong>The</strong> <strong>World</strong> health report : 2003 : shaping the future.1.<strong>World</strong> health - trends 2.Delivery of health care - trends 3.Primary health care 4.Social justice 5.Acquired immunodeficiencysyndrome - therapy 6.Poliomyelitis - prevention and control 7.Severe acute respiratory syndrome -prevention and control 8.Cardiovascular diseases - prevention and control 9.Accidents, Traffic - trends10.Smoking - prevention and control I.Title II.Title: Shaping the future.ISBN 92 4 156243 9 (NLM Classification: WA 540.1)ISSN 1020-3311© <strong>World</strong> <strong>Health</strong> Organization 2003All rights reserved.Publications of the <strong>World</strong> <strong>Health</strong> Organization can be obtained from Marketing and Dissemination, <strong>World</strong> <strong>Health</strong>Organization, 20 Avenue Appia, 1211 Geneva 27, Switzerland (tel: +41 22 791 2476; fax: +41 22 791 4857; email:bookorders@who.int). Requests for permission to reproduce or translate WHO publications – whether for sale orfor noncommercial distribution – should be addressed to Publications, at the above address (fax: +41 22 791 4806;e-mail: permissions@who.int).<strong>The</strong> designations employed and the presentation of the material in this publication do not imply the expression of anyopinion whatsoever on the part of the <strong>World</strong> <strong>Health</strong> Organization concerning the legal status of any country, territory,city or area or of its authorities, or concerning the delimitation of its frontiers or boundaries. Dotted lines on mapsrepresent approximate border lines for which there may not yet be full agreement.<strong>The</strong> mention of specific companies or of certain manufacturers’ products does not imply that they are endorsed orrecommended by the <strong>World</strong> <strong>Health</strong> Organization in preference to others of a similar nature that are not mentioned.Errors and omissions excepted, the names of proprietary products are distinguished by initial capital letters.<strong>The</strong> <strong>World</strong> <strong>Health</strong> Organization does not warrant that the information contained in this publication is complete andcorrect and shall not be liable for any damages incurred as a result of its use.Information concerning this publication can be obtained from:<strong>World</strong> <strong>Health</strong> <strong>Report</strong><strong>World</strong> <strong>Health</strong> Organization1211 Geneva 27, SwitzerlandFax: (+41 22) 791 4870Copies of this publication can be ordered from: bookorders@who.intThis report was produced under the overall direction of Tim Evans (Assistant Director-General) and Robert Beaglehole (Editor-in-Chief). <strong>The</strong> principalauthors were Robert Beaglehole, Alec Irwin and Thomson Prentice.<strong>The</strong> other main contributors to chapters were: Chapter One: Colin Mathers, Kenji Shibuya and Claudia Stein. Chapter Two: Andrew Casselsand Michel Thieren. Chapter Three: Paul Farmer. Chapter Four: Bruce Aylward. Chapter Five: David Heymann and Mary Kay Kindhauser. Chapter Six:Ruth Bonita and Srinath Reddy (cardiovascular diseases section); Sarah Galbraith and Douglas Bettcher (tobacco control section); Margaret MacIntyre,Margaret Peden, Mark Rozenberg and Christie Vu (road traffic hazards section). Chapter Seven: Rafael Bengoa, Ties Boerma, Marie-Andrée Diouf,David Evans, William Savedoff, Alaka Singh, Barbara Stilwell, Wim Van Lerberghe and Eugenio Villar Montesinos.Other contributors to the report were: Prerna Banati, Michel Beusenberg, Sandro Colombo, Carlos Dora, Joan Dzenowagis, Helga Fogstad,Elangovan Gajraj, Gauden Galea, Claudio Garcia Moreno, Yusuf Hemed, Alan Hinman, Alex Kalache, Rania Kawar, Michele Levin, Alan Lopez,Abdelhay Mechbal, Lembit Rago, Shekhar Saxena, Philip Setel, Cyrus Shahpar, Hans Troedsson and Alice Yang.Contributors to statistical tables were: Dorjsure Bayarsaikha, Steve Begg, Christina Bernard, Dan Chisholm, Steve Ebener, Emmanuela Gakidou,Yaniss Guigoz, Patricia Hernández, Mollie Hogan, Kim Iburg, Chandika Indikadahena, Mie Inoue, Karsten Lunze, Doris Ma Fat, Takondwa Mwase,Fanny Naville, Jean-Pierre Poullier, Chalapati Rao, Darryl Rhoades, Hossein Salehi, Joshua Salomon, Angelica Sousa, Ruben M. Suarez-Berenguela,U Than Sein, Niels Tomijima, Nathalie Van de Maele, Sven Volkmuth, and Hongyi Xu.Valuable input was received from Assistant Directors-General, policy advisers to the Director-General at WHO headquarters, and many technicalstaff. Additional help and advice were kindly provided by Regional Directors and members of their staff.<strong>The</strong> report was edited by Barbara Campanini, assisted by Leo Vita-Finzi. Translation coordination and other administrative and productionsupport was provided by Shelagh Probst, assisted by Laura Pearson and Gary Walker. Proofreading was by Marie Fitzsimmons. <strong>The</strong> index wasprepared by Kathleen Lyle. Front cover photographs (top row, left to right): reproduced with permission of Ming Pao, China, Hong Kong SpecialAdministrative Region; WHO/P. Viros; PhotoDisc; (bottom row, left to right): WHO/P. Virot; PhotoDisc; Digital Stock/Corbis.Cover design: Marilyn LangfeldInterior design: Steve Ewart and Marilyn LangfeldLayout: Steve Ewart and Reda SadkiPrinted in France2003/15424 – Sadag – 20000
ContentsMessage from the Director-GeneralviiOverviewStronger health systems: the minimum requirementsCore values for a global health partnershipChapter summariesixxxixiiChapter 1Global <strong>Health</strong>: today’s challenges 1<strong>The</strong> global picture 3Life expectancy improves – but not for all 3Global mortality patterns 4Surviving the first five years of life 7Child mortality: global contrasts 8Child mortality: gender and socioeconomic differences 8Child survival: improvements for some 9Causes of death in children 11Adult health at risk: slowing gains and widening gaps 12Global patterns of premature mortality risk 15Adult mortality trends: 15–59 years of age 15Adult mortality: widening gaps 17HIV/AIDS: the leading health threat 17Mortality and disease among older adults 18<strong>The</strong> growing burden of noncommunicable diseases 18Injuries – a hidden epidemic among young men 19Non-fatal health outcomes 20Chapter 2Millennium <strong>Health</strong> Goals: paths to the future 23International commitments at the Millennium Summit 25A compact to end poverty 26New concepts of poverty and development 26<strong>The</strong> interaction of health and development 26Progress and prospects 27<strong>The</strong> other side of the compact: Goal 8 30Trade 31Development assistance 32Debt 32<strong>The</strong> Millennium Development Goals in practice 32Who owns the MDGs? 33How flexible is the approach? 33How pro-equity are the MDGs? 34Measuring progress 34Reproductive health 34<strong>Health</strong> systems strengthening 34<strong>The</strong> MDGs and WHO 35Defining the place of the MDGs in WHO 35Working with others 37Accelerating progress 37
iv <strong>The</strong> <strong>World</strong> <strong>Health</strong> <strong>Report</strong> 2003Chapter 3HIV/AIDS: confronting a killer 41<strong>The</strong> HIV/AIDS epidemic: a brief overview 44A new disease emerges 44<strong>The</strong> current situation 45<strong>The</strong> true toll of HIV/AIDS 46Responding to HIV/AIDS: lessons from the past 20 years 47Integrating HIV prevention and care 48Integrated prevention and care: success stories 49Setting a new agenda 50A human rights approach 50Dimensions of good HIV/AIDS control 51WHO’s work in the HIV/AIDS fight 52Investing in good HIV prevention and care 53An emergency response to a global emergency 53Chapter 4Polio Eradication: the final challenge 57A new kind of partnership 59Effectively engaging political leaders 60Finding the funds 63Finding the people 65Prospects for a polio-free future 66Scaling up the delivery of health services 67Chapter 5SARS: lessons from a new disease 71<strong>The</strong> first cases 73Origins and international spread 74Detection and response 75<strong>The</strong> impact of SARS 78Lessons learnt 78Chapter 6Neglected Global Epidemics: three growing threats 83Cardiovascular disease: the need to act 85<strong>The</strong> causes are known 87Policies are available 87Acting now and measuring progress 88Tobacco control: strengthening national efforts 91Guiding tobacco control 92National policies and programmes 93Building national capacity 93Integrating tobacco control into health systems 94Road traffic hazards: hidden epidemics 95Sharing responsibility for safety 97Mobilizing action 97Injury prevention, safety and treatment 98Integrating road safety with broader policies 99Chapter 7<strong>Health</strong> Systems: principled integrated care 103<strong>The</strong> core principles of primary health care 106Enduring principles in a changing environment 107Principles in a systems perspective 108
Contentsv<strong>The</strong> global health workforce crisis 110Size, composition and distribution of the health workforce 110Workforce training 111Migration of health workers 112Paying more and paying differently 113Improving quality: workers and systems 114Responding to the workforce crisis 115<strong>Health</strong> information: better but not good enough 116<strong>The</strong> evolution of health information 116An information system driven by primary health care 116Improving information systems 117<strong>The</strong> <strong>Health</strong> Metrics Network 119Financing health systems 119Developing sustainable financing 120Unblocking system bottlenecks 121Pro-equity health systems: government’s central role 122Patterns of inequitable access to care 123<strong>The</strong> goal: universal access 125Government stewardship, community involvement 125Building systems based on principles: WHO cooperation with countries 127Statistical Annex 133Explanatory notes 135Annex Table 1 Basic indicators for all Member States 146Annex Table 2 Deaths by cause, sex and mortality stratum in WHO regions,estimates for 2002 154Annex Table 3 Burden of disease in DALYs by cause, sex and mortality stratumin WHO regions, estimates for 2002 160Annex Table 4 <strong>Health</strong>y life expectancy (HALE) in all Member States, estimates for 2002 166Annex Table 5 Selected national health accounts indicators: measured levels of expenditureon health, 1997–2001 170Annex Table 6 Selected national health accounts indicators: measured levels of per capitaexpenditure on health, 1997–2001 178List of Member States by WHO region and mortality stratum 182Index 185TablesTable 1.1 Leading causes of death in children in developing countries, 2002 12Table 1.2 Leading causes of disease burden (DALYs) for males and females aged 15 yearsand over, worldwide, 2002 14Table 1.3 Leading causes of mortality and disease burden (DALYs) among adults,worldwide, 2002 17Table 2.1 <strong>Health</strong>-related Millennium Development Goals, targets and indicators 28Table 3.1 Coverage of adults in developing countries with antiretroviral therapy,by WHO region, December 2002 45Table 6.1 A stepwise approach for prevention and control of noncommunicable diseases 89Table 7.1 Availability of death registration data – number of countries with recent usable data 117FiguresFigure 1.1 Life expectancy at birth: developed and developing countries, 1955-2002 4Figure 1.2 Age distribution of global mortality: developed and developing countries, 2002 5Figure 1.3 Distribution of disease burden (DALYs) by age group and region, 2002 6
vi <strong>The</strong> <strong>World</strong> <strong>Health</strong> <strong>Report</strong> 2003Figure 1.4 Child mortality in the six WHO regions, 2002 8Figure 1.5 Differences in child mortality in three developing countries according tosocioeconomic status 9Figure 1.6 Changes in child mortality rates by WHO region, 1970–2002 10Figure 1.7 Countries with large absolute reductions in child mortality since 1970 11Figure 1.8 Disease burden (DALYs) among adults (aged 15 years and over) by broad cause,selected epidemiological subregions, 2002 14Figure 1.9 Adult mortality: probabilities of death between 15 and 60 years of age by cause,selected epidemiological subregions, 2002 15Figure 1.10 Trends of adult mortality by sex, selected epidemiological subregions, 1970–2002 16Figure 1.11 Age-standardized rate of years lived with disability (YLDs): developed anddeveloping countries, 2002 20Figure 3.1 Trends in age-adjusted rate of death from HIV infection, USA, 1987–2000 44Figure 3.2 HIV/AIDS: episodes in an evolving epidemic 46Figure 3.3 Trends in the cost of ARV drugs and the number of people in therapy,Uganda, 1997–2002 50Figure 4.1 Endemic polio in 1988 and mid-2003 61Figure 4.2 Global Polio Eradication Initiative: financial support 1988–2005 64Figure 4.3 Global action plan for the laboratory containment of wild polioviruses,February 2003 67Figure 5.1 Probable cases of SARS worldwide, 7 August 2003 75Figure 5.2 Probable cases of SARS worldwide, 1 November 2002–11 July 2003 79Figure 6.1 Deaths attributable to 16 leading causes in developing countries, 2001 86Figure 6.2 Projected mortality patterns: current course and with interventions 95Figure 7.1Relationship between births accompanied by skilled attendants and numberof health professionals, 33 developing and transition countries 111Figure 7.2 Inequality in health spending and incomes by region, 2001 119Figure 7.3 Distribution patterns of health care deprivation, Uzbekistan, Turkey and Niger 122BoxesBox 1.1 Sentinel vital registration in the United Republic of Tanzania 7Box 1.2 <strong>The</strong> African crisis of child mortality 13Box 1.3 Population ageing 18Box 1.4 <strong>The</strong> burden of mental ill-health 19Box 2.1 Progress towards the Millennium Development Goals – the case of Uganda 29Box 2.2 Child survival – turning knowledge into action 30Box 2.3 Fighting maternal mortality – making pregnancy safer 31Box 2.4 Millennium Development Goals in eastern Europe 33Box 2.5 Assuring quality of drugs for HIV/AIDS, tuberculosis and malaria 35Box 3.1 HIV/AIDS in the European Region 47Box 3.2 Accompagnateurs: an example of AIDS care in resource-poor settings 49Box 4.1 Progress towards polio eradication in the Eastern Mediterranean 62Box 4.2 Responding to the challenge of polio eradication in South-East Asia 63Box 4.3 A public–private partnership for polio eradication 65Box 5.1 <strong>The</strong> response to SARS in the Western Pacific Region 76Box 6.1 Measuring progress: integrated surveillance of noncommunicable disease risk factors 90Box 6.2 Examples of successful tobacco control strategies 94Box 6.3 Tobacco and the Western Pacific’s schoolchildren 96Box 6.4 A low-cost road safety strategy: speed bumps in Ghana 99Box 7.1 <strong>The</strong> European Observatory on <strong>Health</strong> Care Systems 106Box 7.2Primary care in a changing environment: the “health houses” of theIslamic Republic of Iran 107Box 7.3 Rebuilding Iraq’s health sector 109Box 7.4 Training assistant medical officers: the tecnicos of Mozambique 112Box 7.5 Creating a skilled workforce for tomorrow 114Box 7.6 <strong>The</strong> Observatory of Human Resources in <strong>Health</strong> Sector Reforms 115Box 7.7 Reliable and timely information for health 118Box 7.8 Community health reforms in the Tiwi Islands 123Box 7.9 Building partnerships for health in Sudan 126
viiMessage fromthe Director-GeneralToday’s global health situation raises urgent questions about justice. Insome parts of the world there is a continued expectation of longer andmore comfortable life, while in many others there is despair over the failureto control disease although the means to do so exist.This contrast is starkly evident in lack of access to HIV/AIDS treatment,which led me, earlier this year, to declare a global health emergency. WHOdecided to take this rare measure after evaluating the global situation andfinding that only 5% of those in the developing world who requireLEE Jong-wookantiretrovirals (ARVs) are getting them. In sub-Saharan Africa, only 50 000of the 4 million people in need have access to ARVs. This spells catastrophe, not only for thesocieties hardest hit but for the world as a whole. Our first step to respond to this crisis mustbe to reach “3 by 5” – 3 million people in developing countries on antiretrovirals by 2005.Major disparities also exist in areas such as child mortality. Of the more than 10 millionchildren under 5 years old who die every year, almost all are in developing countries.A world marked by such inequities is in very serious trouble. We have to find ways to uniteour strengths as a global community to shape a healthier future. This report on the world’shealth, my first since taking office, gives some initial indications of how to do it.A message that runs throughout these pages is that progress in health, including rapid andsustainable expansion of emergency treatments, depends on viable national and local healthsystems. Scaling up ARV therapy in resource-poor settings has to be done in such a way as tostrengthen health systems based on primary health care. In most countries, there will be onlysmall and short-lived advances towards acceptable standards of health without the developmentof health care systems which are strong enough to respond to current challenges.To lend impetus to this process WHO is now making results in countries its main objective.Effective action to improve population health is possible in every country but it takes localknowledge and strength to turn that possibility into reality. We have learnt this through successessuch as controlling the SARS epidemic and major advances in the polio eradicationcampaign, and we have learnt it through setbacks as well, such as the continuing rise of AIDS,TB and malaria. All of these lessons have prepared us for the task ahead.
viii <strong>The</strong> <strong>World</strong> <strong>Health</strong> <strong>Report</strong> 2003Twenty-five years ago, the Declaration of Alma-Ata challenged the world to embrace the principlesof primary health care as the way to overcome gross health inequalities between andwithin countries. “<strong>Health</strong> for all” became the slogan for a movement. It was not just an idealbut an organizing principle: everybody needs and is entitled to the highest possible standardof health. <strong>The</strong> principles defined at that time remain indispensable for a coherent vision ofglobal health. Turning that vision into reality calls for clarity both on the possibilities and onthe obstacles that have slowed and in some cases reversed progress towards meeting the healthneeds of all people. This entails working with countries – especially those most in need – notonly to confront health crises, but to construct sustainable and equitable health systems.I urge the global health community to set its sights on bold objectives. All countries of theworld have pledged to reach the Millennium Development Goals set at the United NationsSummit in 2000. <strong>The</strong>se include ambitious targets for nutrition, maternal and child health,infectious disease control, and access to essential medicines. With this support we have a realopportunity now to make progress that will mean longer, healthier lives for millions of people,turn despair into realistic hope, and lay the foundations for improved health for generationsto come.To reach our goals, increased resource commitments and intensified collaboration amongpartners will be required. <strong>The</strong> following report describes the challenges we face and pointsthe way for a united response from WHO and the global health community.LEE Jong-wookGenevaOctober 2003
ixOverviewGlobal health is a study in contrasts. While a baby girl born in Japan today can expect to livefor about 85 years, a girl born at the same moment in Sierra Leone has a life expectancy of 36years. <strong>The</strong> Japanese child will receive vaccinations, adequate nutrition and good schooling. Ifshe becomes a mother she will benefit from high-quality maternity care. Growing older, shemay eventually develop chronic diseases, but excellent treatment and rehabilitation serviceswill be available; she can expect to receive, on average, medications worth about US$ 550 peryear and much more if needed.Meanwhile, the girl in Sierra Leone has little chance of receiving immunizations and a highprobability of being underweight throughout childhood. She will probably marry in adolescenceand go on to give birth to six or more children without the assistance of a trained birthattendant. One or more of her babies will die in infancy, and she herself will be at high risk ofdeath in childbirth. If she falls ill, she can expect, on average, medicines worth about US$ 3per year. If she survives middle age she, too, will develop chronic diseases but, without accessto adequate treatment, she will die prematurely.<strong>The</strong>se contrasting stories reveal much about what medicine and public health can achieve,and about unmet needs in a world of vast and growing health inequalities. <strong>The</strong> <strong>World</strong> <strong>Health</strong><strong>Report</strong> 2003 affirms that the key task of the global health community is to close the gap betweensuch contrasting lives. Building on past experience and achievements, the report proposessolid strategies to shape a healthier, more equitable future.A key message of this report is that real progress in health depends vitally on stronger healthsystems based on primary health care. In most countries, there will be only limited advancestowards the United Nations Millennium Development Goals and other national health prioritieswithout the development of health care systems that respond to the complexity ofcurrent health challenges. Systems should integrate health promotion and disease preventionon the one hand and treatment for acute illness and chronic care on the other. This should bedone across all levels of the health care system, with the aim of delivering quality servicesequitably and efficiently to the whole population. <strong>The</strong> lessons from SARS and poliomyelitiseradication programmes shape strategies for an urgent health system response to HIV/AIDS;in turn, scaling up the attack on HIV/AIDS will do much to strengthen health care systems.
x <strong>The</strong> <strong>World</strong> <strong>Health</strong> <strong>Report</strong> 2003Stronger health systems:the minimum requirementsHow can the young girl in Sierra Leone be given the same chances for a healthy life as the girlborn in Japan? Many factors – such as poverty, armed conflict, institutional stability and thestate of basic infrastructure – lie beyond the direct control of the health system. Understandingthe importance of these factors, the <strong>World</strong> <strong>Health</strong> Organization (WHO) advocatesaggressively for improvements in the underlying determinants of health. But there is much awell-functioning health care system can do to narrow health outcome gaps, even as the workof reducing poverty and socioeconomic injustice continues.For every child born today to have a good chance of a long and healthy life, there are minimumrequirements which every health care system should meet equitably. <strong>The</strong>se are: accessto quality services for acute and chronic health needs; effective health promotion and diseaseprevention services; and appropriate responses to new threats as they emerge. New threatswill include emerging infectious diseases, but also long-term shifts such as the growing burdenof noncommunicable diseases and injuries and the health effects of global environmentalchanges. <strong>The</strong>se challenges must be met simultaneously, inclusively and sustainably at thesame time as underlying determinants of health are improved.This report argues that the key to success is health systems strengthening, centred on thestrategies and principles of primary health care, constructing responses that support integrated,long-term health systems development on behalf of the entire population. This requiresboth effective use of existing knowledge and technologies and innovation to createnew health tools, along with appropriate structures and strategies to apply them. Success willdemand new forms of cooperation between international health agencies, national healthleaders, health workers and communities, and other relevant sectors.<strong>The</strong> <strong>World</strong> <strong>Health</strong> <strong>Report</strong> 2003 consists of seven chapters. Key ideas and thematic connectionsamong the chapters are briefly described here. Detailed content is summarized at greaterlength in a subsequent section of this overview.<strong>The</strong> report opens with an update in Chapter One of the current state of world health. Itexamines both life expectancy and healthy life expectancy, and shows the global and regionalgaps between the two, highlighting differences between the poor and the better-off everywhere.Among leading communicable and noncommunicable causes of death and disability,HIV/AIDS emerges as the most urgent priority. This is first reflected in Chapter Two, on theslow progress so far towards the health-related Millennium Development Goals, includingaction on HIV/AIDS; Chapter Three is entirely devoted to the pandemic itself and shows whya bold HIV/AIDS control effort must drive the agenda for the global health community.Communicable diseases are one part of the double burden of ill-health. <strong>The</strong>y include bothold and new infectious threats. One of the great public health goals of the 20th century wasthe eradication of polio: Chapter Four looks at the final steps needed to achieve polio eradicationwithin the next few years. Meanwhile, new diseases have been emerging at the rate of oneper year for the last 20 years or more. <strong>The</strong> latest, which caused global alarm in 2003, is SARS,and the lessons learnt from the outbreaks are contained in Chapter Five.Confronting the double burden is the theme of Chapter Six. A deadly overlap between communicableand noncommunicable diseases and injuries is occurring throughout the developingworld, leading to a crisis of priorities for health systems already struggling withinadequate resources. This chapter is divided into three sections: the rapidly growing
Overviewxiepidemic of cardiovascular disease; the global tobacco epidemic; and the multiple hazards –direct and indirect – from the growth in road traffic.All of the topics introduced above demand stronger health systems. Chapter Seven tacklesthis issue in depth. It advocates strengthening health systems based on the principles andpractices of primary health care and examines key dimensions of scaling up, from the healthworkforce crisis to pro-equity stewardship of the health system.Core values for a global health partnershipAchieving national and global health objectives requires new resources and unprecedentedlevels of cooperation among multilateral agencies, national authorities, communities, theprivate sector and other stakeholders. Such a mobilization must be based on rigorous science,but also on a clear ethical vision.An ethical vision in global health draws inspiration from the Constitution of the <strong>World</strong> <strong>Health</strong>Organization, drafted in 1946. <strong>The</strong>n, as today, the world was deeply concerned with questionsof security. Indeed, “to maintain international peace and security” was the primarypurpose assigned to the United Nations. But the founders of WHO and the United Nationssystem saw clearly the relationship between security and justice. Neither of these two valuescan endure without the other. People who had lived through the Second <strong>World</strong> War, witnessingthe effects of nationalism, ethnic hatred, and the disregard of human dignity pushed totheir extremes, understood this interdependence. <strong>The</strong> preamble to its Charter makes clearthat the mission of the United Nations to protect security depends on the establishment of“conditions under which justice … can be maintained”.<strong>The</strong> founders of the international system more than half a century ago grasped the closeconnection between health – understood as “a state of complete physical, mental and socialwell-being” – and the core values of justice and security. <strong>The</strong> WHO Constitution identifiesthe “enjoyment of the highest attainable standard of health” as “one of the fundamental rightsof every human being without distinction”. A crucial part of justice in human relations ispromoting equitable access to health-enabling conditions.During the last decades of the 20th century, health and security were often separated fromeach other in national and international debates. Increasingly, however, the connections betweenthese two domains are re-emerging. <strong>The</strong> United Nations Security Council and nationalbodies acknowledge, for example, the growing security impact of HIV/AIDS. <strong>The</strong> threatof new infections demands new forms of cooperation between security and public health.As globalization accelerates, the interdependence of nations is perceived clearly. Treating othersjustly is now both a moral imperative and an aspect of wise security policy. This <strong>World</strong><strong>Health</strong> <strong>Report</strong> shows how SARS has brought interdependence and the need for internationalcooperation strongly to the fore. But the basic principle extends to many other areas of publichealth concern.Population health contributes crucially to economic and social development. This is reflected,for example, by the importance accorded to health issues in the United Nations MillenniumDevelopment Goals. <strong>The</strong>se goals are central to WHO’s agenda and to this report. <strong>Health</strong> isboth a goal in itself and a key development input towards other goals.This report is not comprehensive. It focuses on selected themes, mentioning many otherimportant subjects only tangentially. Mental health, tuberculosis, malaria, malnutrition andreproductive health will clearly remain crucial focus areas for WHO, although they receive
xii <strong>The</strong> <strong>World</strong> <strong>Health</strong> <strong>Report</strong> 2003limited attention here. Similarly, the human impact on the natural environment and the healthconsequences of environmental change for human populations are given little direct attention.However, these processes will significantly shape health patterns, and the demands onhealth care systems, in the years ahead.<strong>The</strong> purpose of this <strong>World</strong> <strong>Health</strong> <strong>Report</strong> is to encourage action for health improvement,especially for the poor and disadvantaged. This is no longer the time for academic debate: themoral imperative is for urgent action. Cooperation between governments, international institutions,the private sector and civil society spurred remarkable public health progress inthe 20th century. In an increasingly interdependent world, such collaboration across politicaland sectoral boundaries is more vital than ever. This report urges every reader, whether insideor outside public health institutions, to share in the task of shaping a healthy, equitableand sustainable future for all.Chapter summariesChapter One contains an assessment of the global health situation, with some important andunexpected findings. Over the last 50 years, average life expectancy at birth has increasedglobally by almost 20 years, from 46.5 years in 1950–1955 to 65.2 years in 2002. <strong>The</strong> large lifeexpectancy gap between developed and developing countries in the 1950s has changed to agap between the very poorest developing countries and all other countries.Of the 57 million deaths in 2002, 10.5 million were among children of less than five years ofage, and more than 98% of these were in developing countries. Globally, considerable progresshas been made since 1970 when over 17 million child deaths occurred. In 14 African countries,however, current levels of child mortality are higher than they were in 1990. Overall,35% of Africa’s children are at higher risk of death today than they were 10 years ago. <strong>The</strong>leading causes of death in children are perinatal conditions, lower respiratory tract infections,diarrhoeal diseases and malaria, with malnutrition contributing to them all. In sub-Saharan Africa, HIV/AIDS was responsible for an estimated 332 000 child deaths in 2002.Across the world, children are at higher risk of dying if they are poor and malnourished, andthe gaps in mortality between the haves and the have-nots are widening.<strong>The</strong> state of adult health at the beginning of the 21st century is characterized by two majortrends: slowing of gains and widening health gaps; and the increasing complexity of the burdenof disease. <strong>The</strong> most disturbing sign of deteriorating adult health is that advances inadult survival in Africa have been reversed so drastically that, in parts of sub-Saharan Africa,current adult mortality rates today exceed those of 30 years ago. <strong>The</strong> greatest impact has beenin Botswana, Lesotho, Swaziland and Zimbabwe, where HIV/AIDS has reduced life expectanciesof men and women by more than 20 years.<strong>The</strong> fragile state of adult health in the face of social, economic and political instability isapparent elsewhere. Male mortality in some countries in eastern Europe has increased substantially.Globally, most countries are already facing the double burden of communicableand noncommunicable diseases. Almost half of the disease burden in high-mortality regionsof the world is now attributable to noncommunicable diseases. Population ageing and changesin the distributions of risk factors have accelerated these epidemics in most developing countries.Injuries, both intentional and unintentional, are on the increase, primarily among youngadults.
OverviewxiiiChapter Two traces the origins of the Millennium Development Goals and charts the progressso far towards achieving them. <strong>The</strong>se goals represent commitments by governments worldwideto do more to reduce poverty and hunger and to tackle ill-health, gender inequality, lackof education, access to clean water and environmental degradation. Threeof the eight goals are directly health-related; all of the others have important indirect effectson health.<strong>The</strong> Millennium Development Goals place health at the heart of development. This chapterwarns that without significantly strengthened commitments from both wealthy and developingcountries, the goals will not be met globally, and outcomes in some of the poorest countrieswill remain far below the achievements hoped for.Chapter Three reviews major trends in the HIV epidemic and examines successes and failuresin the struggle against the world’s most devastating infectious disease, before discussinggoals for the coming years. <strong>The</strong>se include narrowing the AIDS outcome gap by providingthree million people in developing countries with combination antiretroviral (ARV) therapyby the end of 2005 (known as the “3 by 5” target). Although robust HIV prevention and careconstitute a complex health intervention, such interventions are not only feasible in resourcepoorsettings, but are precisely what is needed.<strong>The</strong> chapter shows the often stark division between AIDS prevention and care, which in thedeveloping world has meant that, for most people living with HIV, there is simply no decentmedical care available at all. But it also provides examples, such as Brazil, where preventionand care have been successfully integrated. <strong>The</strong> chapter acknowledges that there is still a greatdeal to be done if the target of three million people on ARV therapy by 2005 is to be met. Forthis reason, WHO has formally declared inadequate access to ARV therapy to be a globalhealth emergency, and has set in place a number of initiatives to respond accordingly and toprogress towards the ultimate goal of universal access to ARV therapy.Chapter Four is the encouraging story of how a major, ancient disease can be conquered. Asa result of the Global Polio Eradication Initiative, one of the largest public health efforts inhistory, the number of children paralysed by this devastating disease every year has fallenfrom over 350 000 in 1988 to about 1900 in 2003; the number of countries in which thedisease is endemic has fallen from over 125 to seven. This chapter records the expected lastdays of polio, one of the oldest known diseases, as the campaign to eradicate it nears its end.<strong>The</strong> vision of a polio-free world is within reach, although formidable obstacles remain.<strong>The</strong> successes to date are the result of a unique partnership forged between governments,international agencies, humanitarian organizations and the private sector. Through this partnership,over 10 million volunteers immunized 575 million children against polio in nearly100 of the lowest-income countries in the world in the year 2001 alone. <strong>The</strong> most visibleelement of the polio eradication initiative has been the National Immunization Days, whichrequire immunizing every child under five years of age (nearly 20% of a country’s population)over a period of 1–3 days, several times a year for a number of years in a row. In manycountries, the scale and logistic complexity of these activities were even greater than those ofcampaigns undertaken during the height of the smallpox eradication effort.To capitalize on progress so far, substantial effort is now required to interrupt the finalchains of polio transmission, certify that achievement, and minimize the risk of polio beingreintroduced in the future. <strong>The</strong> ultimate success of the eradication effort, however, is stillnot guaranteed; it now rests with a very small number of endemic areas, where all ofthe children must be immunized, and with donors who must close the chronic financing gapfor these activities.
xiv <strong>The</strong> <strong>World</strong> <strong>Health</strong> <strong>Report</strong> 2003Chapter Five, on SARS, is a tale of how a completely new disease can emerge with majorinternational implications for health, economy and trade. Its rapid containment is one of thesuccess stories of public health in recent years and represents a major victory for public healthcollaboration.SARS is a newly identified human infection caused by a coronavirus unlike any other knownhuman or animal virus in its family. Transmission occurs mainly from person to person duringface-to-face exposure to infected respiratory droplets expelled during coughing or sneezing.<strong>The</strong> overall case–fatality ratio, with the fate of most cases now known, approaches 11%but is much higher in the elderly. <strong>The</strong> international outbreak eventually caused more than8000 cases and 900 deaths in 30 countries.Seven key lessons emerge from the SARS epidemic and will help shape the future of infectiousdisease control. First and most compelling is the need to report, promptly and openly,cases of any disease with the potential for international spread. Second, timely global alertscan prevent imported cases from igniting big outbreaks in new areas, provided the publichealth infrastructure is in place and an appropriately rapid response occurs. Third, travelrecommendations, including screening measures at airports, help to contain the internationalspread of a rapidly emerging infection.Fourth, the world’s scientists, clinicians and public health experts, aided by electronic communications,can collaborate to generate rapidly the scientific basis for control measures.Fifth, weaknesses in health systems, especially in infection control practices, play a key role inpermitting emerging infections to spread. Sixth, an outbreak can be contained even withouta curative drug or a vaccine if existing interventions are tailored to the circumstances andbacked by political commitment. Finally, risk communication about new and emerging infectionsis a great challenge, and it is vital to ensure that the most accurate information issuccessfully and unambiguously communicated to the public.Chapter Six, in contrast, describes the impact on developing countries of the stealthy butrapidly evolving epidemics of noncommunicable diseases and injuries, particularly cardiovasculardisease (CVD), the global tobacco epidemic, and the “hidden epidemics” – directand indirect – resulting from the growth in road traffic.Today, the burden of deaths and disability in developing countries caused by noncommunicablediseases outweighs that imposed by long-standing communicable diseases.In examining the impact of the combination of these two categories, this chapter proposes a“double response” involving the integration of prevention and control of communicable andnoncommunicable diseases within a comprehensive health care system based on primaryhealth care.Ironically, rates of CVD are now in decline in the industrialized countries first associatedwith them, although not all population groups have benefited. But from that irony stemshope: the decline is largely a result of the successes of primary prevention and, to a lesserextent, treatment. What has worked in the richer nations can be just as effective in theirpoorer counterparts, although particular attention is needed to ensure that the benefits flowto the entire population. <strong>The</strong>re is now abundant evidence to initiate effective actions at nationaland global levels to promote and protect cardiovascular health through populationbasedmeasures that focus on the main risk factors shared by all noncommunicable diseases.<strong>The</strong> application of existing knowledge has the potential to make a major, rapid and costeffectivecontribution to the prevention and control of the epidemics of noncommunicablediseases.
Overviewxv<strong>The</strong> consumption of cigarettes and other tobacco products and exposure to tobacco smokeare the world’s leading preventable cause of death, responsible for about 5 million deaths in2003, mostly in poor countries and poor populations. <strong>The</strong> toll will double in 20 years unlessknown and effective interventions are urgently and widely adopted. <strong>The</strong> recognition thatglobalization of the tobacco epidemic can undermine even the best national control programmeled to the adoption by 192 Member States at the <strong>World</strong> <strong>Health</strong> Assembly in May2003 of the WHO Framework Convention on Tobacco Control (WHO FCTC).<strong>The</strong> opening of the Convention for signature and ratification provides an unprecedentedopportunity for countries to strengthen national tobacco control capacity. Success in controllingthe tobacco epidemic requires continuing political engagement and additional resourcesat both global and national levels. <strong>The</strong> resulting improvement in health, especially ofpoor populations, will be a major public health achievement.Chapter Six concludes with an assessment of the rising toll of road deaths and injuries andemphasizes the indirect, but equally important, effects of the growth in road traffic. Morethan 20 million people are severely injured or killed on the world’s roads each year. <strong>The</strong> socialand economic burden falls most heavily on developing countries and will grow significantlyheavier still in these countries because of the rapid increase in the number of vehicles ontheir roads. Existing knowledge must be converted into successful interventions for developingcountries, taking account of each country’s unique road safety circumstances. More generally,cross-sectoral collaboration can improve public health and make more efficient use ofthe resources of the health, environment and transport sectors.Chapter Seven emphasizes that health systems must be strengthened to meet the formidablechallenges described in earlier chapters. Without significant health systems strengthening,many countries will make little headway towards the Millennium Development Goals, the“3 by 5” target, and other health objectives. <strong>The</strong> chapter proposes an approach to scaling uphealth systems based on the core principles of primary health care formulated in the 1978Declaration of Alma-Ata: universal access and coverage on the basis of need; health equity aspart of development oriented to social justice; community participation in defining and implementinghealth agendas; and intersectoral approaches to health. While these principlesremain valid, they must be reinterpreted in the light of dramatic changes in the health fieldduring the past 25 years. <strong>The</strong> chapter clarifies the conceptual basis of the development ofhealth systems that are led by primary health care, then explores how health systems basedon primary health care principles can confront four major contemporary challenges: theglobal health workforce crisis; inadequate health information; lack of financial resources;and the stewardship challenge of implementing pro-equity health policies in a pluralisticenvironment.<strong>The</strong> <strong>World</strong> <strong>Health</strong> <strong>Report</strong> 2003 closes by showing that reinforced cooperation with countriesto scale up health systems is part of WHO’s new way of working. Strengthening the Organization’spresence and technical collaboration in countries is the best way for WHO to speedprogress towards the global health community’s most important goals: measurable healthimprovements for all, and aggressive strides to close equity gaps. <strong>Health</strong> inequalities scar thepresent and threaten the future. New forms of collaboration for comprehensive health systemsdevelopment are needed to shape a world in which all people can enjoy the conditionsof a healthy, dignified life. This report shows how WHO and its partners are drawing thelessons from recent achievements to press forward with this work.
xvi <strong>The</strong> <strong>World</strong> <strong>Health</strong> <strong>Report</strong> 2003
Global <strong>Health</strong>: today’s challenges 1Chapter OneGlobal <strong>Health</strong>:today’s challengesReviewing the latest global health trends, this chapter findsdisturbing evidence of widening gaps in health worldwide. In2002, while life expectancy at birth reached 78 years forwomen in developed countries, it fell back to less than 46years for men in sub-Saharan Africa, largely because of theHIV/AIDS epidemic. For millions of children today, particularlyin Africa, the biggest health challenge is to survive until theirfifth birthday, and their chances of doing so are less than theywere a decade ago. This is a result of the continuing impactof communicable diseases. However, a global increase innoncommunicable diseases is simultaneously occurring,adding to the daunting challenges already facing manydeveloping countries.
2 <strong>The</strong> <strong>World</strong> <strong>Health</strong> <strong>Report</strong> 2003
Global <strong>Health</strong>: today’s challenges 31Global <strong>Health</strong>:today’s challengesAlthough this report is global in scope, the findings irresistibly draw the main focus to theincreasingly fragile health of sub-Saharan Africa. It is here, where scores of millions of peoplescrape a living from the dust of poverty, that the price of being poor can be most starkly seen.Almost an entire continent is being left behind.Overall, 35% of Africa’s children are at higher risk of death than they were 10 years ago. Everyhour, more than 500 African mothers lose a small child. In 2002, more than four millionAfrican children died. Those who do make it past childhood are confronted with adult deathrates that exceed those of 30 years ago. Life expectancy, always shorter here than almostanywhere else, is shrinking. In some African countries, it has been cut by 20 years and lifeexpectancy for men is less than 46 years.Mostly, death comes in familiar garb. <strong>The</strong> main causes among children are depressingly recognizable:the perinatal conditions closely associated with poverty; diarrhoeal diseases; pneumoniaand other lower respiratory tract conditions; and malaria. Becoming more familiar bythe day, HIV/AIDS, now the world’s leading cause of death in adults aged 15–59 years, iskilling almost 5000 men and women in this age group, and almost 1000 of their children,every 24 hours in sub-Saharan Africa.<strong>The</strong> main components of Africa’s tragedy are shared by many of the poorest people everywhereand include the agonizingly slow progress towards the Millennium Development Goalsof reduced maternal and child mortality; the HIV/AIDS pandemic; and the double burden ofcommunicable diseases plus noncommunicable diseases, including the tobacco epidemic andthe avoidable deaths from road traffic crashes. Subsequent chapters of this report will examineeach of these components and show how they can and must be reshaped for a betterfuture.<strong>The</strong> global pictureLife expectancy improves – but not for allOver the past 50 years, average life expectancy at birth has increased globally by almost 20years, from 46.5 years in 1950–1955 to 65.2 years in 2002. This represents a global averageincrease in life expectancy of 4 months per year across this period. On average, the gain in lifeexpectancy was 9 years in developed countries (including Australia, European countries,Japan, New Zealand and North America), 17 years in the high-mortality developing countries(with high child and adult mortality levels), including most African countries and poorer
4 <strong>The</strong> <strong>World</strong> <strong>Health</strong> <strong>Report</strong> 2003countries in Asia, the Eastern Mediterranean Region and Latin America; and 26 years in thelow-mortality developing countries. As shown in Figure 1.1, the large life expectancy gapbetween the developed and developing countries in the 1950s has changed to a large gapbetween the high-mortality developing countries and others.Life expectancy at birth in 2002 ranged from 78 years for women in developed countries toless than 46 years for men in sub-Saharan Africa, a 1.7-fold difference in total life expectancy.Exceptions to the life expectancy increases in most regions of the world in the last 50 years areAfrica and countries of eastern Europe formerly in the Soviet Union. In the latter case, maleand female life expectancies at birth declined, by 2.9 years and 1 year, respectively, over theperiod 1990 to 2000. Estimated life expectancies for males and females for 2002 are given inAnnex Table 1 for all Member States of the <strong>World</strong> <strong>Health</strong> Organization (WHO).<strong>The</strong> increases in life expectancy that occurred in the first half of the 20th century in developedcountries were the result of rapid declines in mortality, particularly infant and maternalmortality, and that caused by infectious diseases in childhood and early adulthood. Access tobetter housing, sanitation and education, a trend to smaller families, growing incomes, andpublic health measures such as immunization against infectious diseases all contributed greatlyto this epidemiological transition. In many developed countries, this shift started approximately100 to 150 years ago. In a number of countries, such as Japan, the transition startedlater but proceeded much more quickly. In many developing countries, the transition startedeven later and has not yet been completed. In developed countries, improvements in lifeexpectancy now come mainly from reductions in death rates among adults.Global mortality patternsAlmost 57 million people died in 2002, 10.5 million (or nearly 20%) of whom were childrenof less than 5 years of age (see Figure 1.2). Of these child deaths, 98% occurred in developingFigure 1.1 Life expectancy at birth: developed and developing countries, 1955–20028070Life expectancy at birth (years)605040302010DevelopedDeveloping – low mortalityDeveloping – high mortality01940 1960 1980 2000 2020YearNote: <strong>The</strong> term developed countries includes Australia, Canada, European countries, former Soviet countries, Japan, New Zealand and theUSA. High-mortality developing countries include those in sub-Saharan Africa, and countries with high child and adult mortality in Asia,Central and South America and the Eastern Mediterranean. Other developing countries are referred to as “developing – low mortality”.
Global <strong>Health</strong>: today’s challenges 5Figure 1.2 Age distribution of global mortality: developed and developingcountries, 200260 000Number of deaths (000)50 00040 00030 00020 00010 00060+15–595–140–40DevelopedLow-mortalitydevelopingHigh-mortalitydeveloping<strong>World</strong>countries. Over 60% of deaths in developed countries occur beyond age 70, compared withabout 30% in developing countries. A key point is the comparatively high number of deathsin developing countries at younger adult ages (15–59 years). Just over 30% of all deaths indeveloping countries occur at these ages, compared with 20% in richer regions. This vastpremature adult mortality in developing countries is a major public health concern.Developing countries themselves are a very heterogeneous group in terms of mortality (Figure1.1). A contrast between low-mortality developing countries such as China (with morethan one-sixth of the world’s population) and high-mortality countries in Africa (with onetenthof the global population) illustrates the extreme diversity in health conditions amongdeveloping countries. Less than 10% of deaths in China occur below 5 years of age comparedwith 40% in Africa. Conversely, 48% of deaths in China occur beyond age 70, compared withonly 10% in Africa. 1Although risk of death is the simplest comparable measure of health status for populations,there has been increasing interest in describing, measuring and comparing health states ofpopulations. Mortality statistics, in particular, substantially underestimate the burden fromnoncommunicable adult disease because they exclude non-fatal health outcomes such as depressionand visual impairment. A useful method of formulating a composite summary ofdisease burden is to calculate disability-adjusted life years (DALYs), which combine years oflife lost (YLLs) through premature death with years lived with disability (YLDs) (1). OneDALY can be thought of as one lost year of “healthy” life and the measured disease burden isthe gap between a population’s health status and that of a normative global reference populationwith high life expectancy lived in full health. In terms of DALYs, 36% of total lost yearsof healthy life for the world in 2002 were a result of disease and injury in children aged lessthan 15 years, and almost 50% as a result of disease and injury in adults aged 15–59 years (seeFigure 1.3). 21 Estimated deaths by cause, age group and sex for 2002 are available on the WHO web site for the six WHOregions and for the 14 epidemiological subregions (www.who.int/evidence/bod).2 Estimated DALYs by cause, age group and sex for 2002 are available on the WHO web site for the six WHOregions and for the 14 epidemiological subregions (www.who.int/evidence/bod).
6 <strong>The</strong> <strong>World</strong> <strong>Health</strong> <strong>Report</strong> 2003Figure 1.3 Distribution of disease burden (DALYs) by age group and region, 200260+15%<strong>World</strong>0–429%60+33%Developed regions0–46% 5–144%15–5949%5–147%15–5957%Low-mortality developing regionsHigh-mortality developing regions60+19%0–418%60+8%5–146%0–440%15–5957%15–5943%5–149%As Figure 1.3 illustrates, child survival continues to be a major focus of the internationalhealth agenda for developing countries (2). Because nearly 90% of global deaths under age 15occur before the age of 5, the following sections focus on child deaths under 5 years. In contrast,the international effort to understand the magnitude of challenges to adult health indeveloping countries is still in its early stages. Even at present, there remains a perception thatadult health is of great concern only in wealthy countries, where premature mortality amongchildren has been substantially reduced. However, Figures 1.2 and 1.3 also illustrate the highproportion of burden of disease and injury suffered by adults in developing countries, a growingburden that requires urgent action by the global public health community. This chaptertherefore first examines trends and issues in child health, focusing on ages 0–4, then amongadults aged 15–59 years and among adults aged 60 years and over.Unfortunately, complete cause-specific death registration data are routinely available for onlya minority of the world’s countries (see Chapter 7 and the Explanatory Notes in the StatisticalAnnex). However, complete or incomplete vital registration data (see Box 1.1) together
Global <strong>Health</strong>: today’s challenges 7Box 1.1 Sentinel vital registration in the United Republic of TanzaniaAccurate statistics on basic demographic events are an important foundationof rational health and public policy. Unfortunately, reliable vitalregistration is lacking for the vast majority of the world’s poorest countries.Some new approaches to meeting the need for mortality and morbiditydata have been pioneered in the United Republic of Tanzania. In1992, the Ministry of <strong>Health</strong> established the Adult Morbidity and MortalityProject (AMMP) in partnership with the University of Newcastleupon Tyne, England, and with funding from the United Kingdom Departmentfor International Development.AMMP developed a demographic surveillance system and verbalautopsy tools for measuring levels and causes of death, and a validatedtool for estimating household consumption expenditure to monitor incomepoverty. One of the initial project aims was to establish baselinelevels of adult mortality by cause in three selected districts (3–5). In1997, the Ministry of <strong>Health</strong> elected to expand data collection to a largersample of districts and to establish a national sentinel system for healthand poverty monitoring. In addition, the contributions of other demographicsurveillance sites were coordinated to produce annual healthstatistics abstracts and public health sector performance profiles.In 2002, sentinel vital registration, cause of death, and povertymonitoring figures flowing from five sites managed by the Ministry of<strong>Health</strong> and local councils and three sites managed by health developmentand research bodies began to provide essential indicators to theNational Poverty Monitoring Master Plan. In the context of all informationsystems in the United Republic of Tanzania that produce demographic,health and poverty indicators, sentinel demographic surveillancegenerates a large number of indicators from a sample of over 500 000people, at a per capita recurrent cost of US$ 0.02 per year. <strong>The</strong>se costsare considerably less than for many other systems.At the local level, AMMP has helped districts to feed sentinel surveillanceinformation about the prevailing burden of disease back tocommunity members who have, in turn, actively participated in settingpriorities for district health. One local council was prompted by data onhealth-seeking for children dying at home from acute febrile illness toincrease the resources allocated to fight malaria and to promote the useof treated bednets. At the national level, these same data provided anevidence base for a policy change in first-line malaria drug use, and theoverall cause-specific mortality burden measured in years of life lostwas a key input to the design of the first national package of essentialhealth interventions. Drawing on the poverty data from sentinel sites, ithas also been possible to provide government with solid evidence abouthow health intervention priorities among the poorest citizens differ fromthose of others.with sample registration systems now capture one-third of deaths globally and provide informationon 74% of global mortality, and these have been used to analyse adult mortalitypatterns and trends here.Surviving the first five years of lifeAlthough approximately 10.5 million children under 5 years of age still die every year in theworld, progress has been made since 1970, when the figure was more than 17 million. <strong>The</strong>sereductions did not take place uniformly across time and regions, but the success stories indeveloping countries demonstrate clearly that low mortality levels are attainable in thosesettings. <strong>The</strong> effects of such achievements are not to be underestimated. If the whole worldwere able to share the current child mortality experience of Iceland (the lowest in the worldin 2002), over 10 million child deaths could be prevented each year.Today nearly all child deaths occur in developing countries, almost half of them in Africa.While some African countries have made considerable strides in reducing child mortality,the majority of African children live in countries where the survival gains of the past havebeen wiped out, largely as a result of the HIV/AIDS epidemic.Across the world, children are at higher risk of dying if they are poor. <strong>The</strong> most impressivedeclines in child mortality have occurred in developed countries, and in low-mortality developingcountries whose economic situation has improved. In contrast, the declines observedin countries with higher mortality have occurred at a slower rate, stagnated or even reversed.Owing to the overall gains in developing regions, the mortality gap between the developingand developed world has narrowed since 1970. However, because the better-off countries indeveloping regions are improving at a fast rate, and many of the poorer populations are losingground, the disparity between the different developing regions is widening.
8 <strong>The</strong> <strong>World</strong> <strong>Health</strong> <strong>Report</strong> 2003Figure 1.4 Child mortality in the six WHO regions, 2002Deaths per 1000 live births180160140120100806040200Africa Americas South-East Europe EasternAsiaMediterraneanWesternPacific<strong>World</strong>Child mortality: global contrastsRegional child mortality levels are indicated in Figure 1.4. Of the 20 countries in the worldwith the highest child mortality (probability of death under 5 years of age), 19 are in Africa,the exception being Afghanistan.A baby born in Sierra Leone is three and a half times more likely to die before its fifth birthdaythan a child born in India, and more than a hundred times more likely to die than a childborn in Iceland or Singapore. Fifteen countries, mainly European but including Japan andSingapore, had child mortality rates in 2002 of less than 5 per 1000 live births. Estimatedchild mortality rates for 2002 are given for all WHO Member States in Annex Table 1.Child mortality: gender and socioeconomic differencesThroughout the world, child mortality is higher in males than in females, with only a fewexceptions. In China, India, Nepal and Pakistan, mortality in girls exceeds that of boys. Thisdisparity is particularly noticeable in China, where girls have a 33% higher risk of dying thantheir male counterparts. <strong>The</strong>se inequities are thought to arise from the preferential treatmentof boys in family health care-seeking behaviour and in nutrition.<strong>The</strong>re is considerable variability in child mortality across different income groups withincountries. Data collected by 106 demographic and health surveys in more than 60 countriesshow that children from poor households have a significantly higher risk of dying before theage of 5 years than the children of richer households. This is illustrated in Figure 1.5, usingthe results for three countries from different regions. <strong>The</strong> vertical axis represents the probabilityof dying in childhood (on a zero to one scale). <strong>The</strong> horizontal axis shows the informationby “poor” and “non-poor”. 1 <strong>The</strong> identification of poor and non-poor populations uses aglobal scale based on an estimate of permanent income constructed from information onownership of assets, availability of services and household characteristics. This approach hasthe advantage of allowing comparison of socioeconomic levels across countries. It impliesthat the individuals defined as poor in Bangladesh have the same economic status as thepopulation defined as poor in Bolivia or Niger.1 <strong>The</strong> “poor” are individuals from the lowest quintile of income, while the “non-poor” are the remainder.
Global <strong>Health</strong>: today’s challenges 9Figure 1.5 Differences in child mortality in three developing countriesaccording to socioeconomic statusProbability of dying before 5 years of age0.400.350.300.250.200.150.100.050.00Poor Non-poor Poor Non-poor Poor Non-poorNigerBangladeshBolivia<strong>The</strong>re are significant differences in child mortality risks by poverty status in all countries,although the size of the gap varies; the risk of dying in childhood is approximately 13 percentagepoints higher for the poor than for the non-poor in Niger but less than 3 percentagepoints higher in Bangladesh.Child mortality rates among the poor are much higher in Africa than in any other regiondespite the same level of income used to define poverty. <strong>The</strong> probability of poor children inAfrica dying is almost twice that of poor children in the Americas. Likewise, better-off childrenin Africa have double the probability of dying than their counterparts in the Americas.Moreover, better-off children in Africa have a higher mortality risk (16%) than poor childrenin the Americas, whose risk of death is 14%.Child survival: improvements for some<strong>The</strong> last three decades have witnessed considerable gains in child survival worldwide (shownby WHO region in Figure 1.6). Global child mortality decreased from 147 per 1000 live birthsin 1970 to about 80 per 1000 live births in 2002. <strong>The</strong> reduction in child mortality has beenparticularly compelling in certain countries of the Eastern Mediterranean and South-EastAsia Regions and Latin America, while that of African countries was more modest. Gains inchild survival have also occurred in rich industrialized nations, where levels of mortalitywere already low.Although child mortality has fallen in most regions of the world, the gains were not consistentacross time and regions. <strong>The</strong> greatest reductions in child mortality across the world occurred20–30 years ago, though not in the African or the Western Pacific Regions, where thedecline slowed down during the 1980s, nor in some eastern European countries, where mortalityactually increased in the 1970s. Over the past decade, only countries of the South-EastAsia Region and the higher mortality countries in Latin America have further acceleratedtheir reduction in child mortality.
10 <strong>The</strong> <strong>World</strong> <strong>Health</strong> <strong>Report</strong> 2003Figure 1.6 Changes in child mortality rates by WHO region, 1970–20020-10% change in child mortality-20-30-40-50-60-70-80Africa Americas South-East Europe EasternAsiaMediterraneanWesternPacific<strong>World</strong><strong>The</strong> most impressive gains in child survival over the past 30 years occurred in developingcountries where child mortality was already relatively low, whereas countries with the highestrates had a less pronounced decline. Despite an overall decline in global child mortality overthe past three decades, the gap between and within developing regions has widened.Although the chances of child survival among less developed regions of the world are becomingincreasingly disparate, the gaps in child mortality among affluent nations have been closingover the past 30 years, largely as a result of medico-technological advances, particularly inthe area of neonatal survival.In 16 countries (14 of which are in Africa) current levels of under-5 mortality are higherthan those observed in 1990. In nine countries (eight of which are in Africa) current levelsexceed even those observed over two decades ago. HIV/AIDS has played a large part in thesereversals.Analyses from the demographic and health surveys show that, while child mortality has increasedin many of the African countries surveyed, the gap between poor and non-poorpopulations has remained constant over time in this setting. In contrast, there has been awidening of the mortality gap between poor and better-off groups in the Americas, whereoverall child mortality rates have fallen. This indicates that survival gains in many regionshave benefited the better-off. <strong>The</strong> reduction in child mortality has been much slower in ruralareas, where poor people are concentrated, than in urban areas (6). <strong>The</strong>se analyses suggestthat health interventions implemented in the past decade have not been effective in reachingpoor people.Losses in child survival in the countries described above are at odds with impressive gains insome African countries. Despite the ravages of the HIV/AIDS epidemic in Africa, eight countriesin the region have reduced child mortality by more than 50% since 1970. Among theseare Gabon, the Gambia and Ghana.Overall, at least 169 countries, 112 of them developing countries, have shown a decline inchild mortality since 1970. Some of these are presented in Figure 1.7. Oman has had the most
Global <strong>Health</strong>: today’s challenges 11Figure 1.7 Countries with large absolute reductions in child mortality since 1970350Under-5 mortality per 1000 live births300250200150100500GambiaBangladeshBoliviaOman1970 1980 1990 2000Yearstriking reduction, from 242 per 1000 live births in 1970 to its current rate of 15 per 1000 livebirths, which is lower than that of many countries in Europe. Overall, the lower mortalitycountries of the Eastern Mediterranean Region experienced an impressive decline in childmortality, which has been accompanied by a reduction in the gap between countries’ childmortality levels since 1970.Child mortality has also declined substantially in the Americas. <strong>The</strong> most striking proportionalreductions in mortality have been seen in Chile, Costa Rica and Cuba, where childmortality has decreased by over 80% since 1970. <strong>The</strong>re have also been large absolute reductionsin child mortality in Bolivia, Nicaragua and Peru. In contrast, Haitian child mortalityrates are still 133 per 1000: almost double the mortality rate of Bolivia, the next highest countryin the Americas.An interesting pattern of child mortality trends has been observed in several eastern Europeancountries. Here, child mortality initially increased or remained constant during the 1970s,only to decline after 1980 (7). This may to some extent be attributed to a more completeregistration of child and infant deaths during that period. Interestingly, while adult mortalitylevels increased in the early 1990s, child mortality continued to decline. <strong>The</strong>re is no otherregion where this particular pattern of mortality has occurred in such a systematic manner,and the reasons for the trend remain poorly understood.Causes of death in childrenInfectious and parasitic diseases remain the major killers of children in the developing world,partly as a result of the HIV/AIDS epidemic. Although notable success has been achieved incertain areas (for example, polio), communicable diseases still represent seven out of the top10 causes of child deaths, and account for about 60% of all child deaths. Overall, the 10leading causes represent 86% of all child deaths (see Table 1.1).Many countries of the Eastern Mediterranean Region and in Latin America and Asia havepartly shifted towards the cause-of-death pattern observed in developed countries. Here,conditions arising in the perinatal period, including birth asphyxia, birth trauma and lowbirth weight, have replaced infectious diseases as the leading cause of death and are now
12 <strong>The</strong> <strong>World</strong> <strong>Health</strong> <strong>Report</strong> 2003Table 1.1 Leading causes of death in children in developingcountries, 2002Rank Cause Numbers (000) % of all deaths1 Perinatal conditions 2 375 23.12 Lower respiratory infections 1 856 18.13 Diarrhoeal diseases 1 566 15.24 Malaria 1 098 10.75 Measles 551 5.46 Congenital anomalies 386 3.87 HIV/AIDS 370 3.68 Pertussis 301 2.99 Tetanus 185 1.810 Protein-energy malnutrition 138 1.3Other causes 1 437 14.0responsible for one-fifth to one-third ofdeaths. Such a shift in the cause-of-death patternhas not occurred in sub-Saharan Africa,where perinatal conditions rank in fourthplace. Here, undernutrition, malaria, lowerrespiratory tract infections and diarrhoealdiseases continue to be among the leadingcauses of death in children, accounting for45% of all deaths.About 90% of all HIV/AIDS and malariadeaths in children in developing countriesoccur in sub-Saharan Africa, where 23% ofthe world’s births and 42% of the world’s childdeaths are observed (see Box 1.2). <strong>The</strong> immensesurge of HIV/AIDS mortality in childrenin recent years means that HIV/AIDS isnow responsible for 332 000 child deaths in sub-Saharan Africa, nearly 8% of all child deathsin the region.Total 10 263 100000000Some progress has been observed in the areas of diarrhoeal diseases and measles. While incidenceis thought to have remained stable, mortality from diarrhoeal diseases has fallen from2.5 million deaths in 1990 to about 1.6 million deaths in 2002, now accounting for 15% of allchild deaths. <strong>The</strong>re has also been a modest decline in deaths from measles, although morethan half a million children under 5 years of age still succumb to the disease every year (8).Malaria causes around a million child deaths per year, of which 90% are children under 5years of age. In this age group the disease accounts for nearly 11% of all deaths (see Table 1.1).<strong>The</strong> overall number of child deaths in India has fallen from approximately 3.5 million in1990 to approximately 2.3 million in 2002. This impressive decline is a result of a reductionin overall child mortality rates of about 30%, and a decline in total fertility rates of around10%. <strong>The</strong> cause-of-death pattern has remained fairly stable, with the exception of perinatalconditions whose proportion has notably increased. <strong>The</strong>re were some declines in the proportionof deaths from diarrhoeal diseases, measles and tetanus, which may be the result ofincreased use of oral rehydration therapy and improved coverage of routine vaccination, aswell as intensive immunization campaigns.A similar picture is emerging in China, where the number of child deaths has decreased by30% since 1990, owing to a reduction in child mortality of 18% and a 6% decline in totalfertility. As in India, the most notable change in the cause-of-death pattern in China over thepast decade is an increase in the proportion of perinatal deaths.<strong>The</strong> challenge of reducing child mortality is widely recognized and effective interventions areavailable. <strong>The</strong> issue now is urgent implementation. <strong>The</strong> adult mortality challenges are morecomplex, as described in the next section.Adult health at risk: slowing gains andwidening gapsAdult mortality rates have been declining in recent decades in most regions of the world. Lifeexpectancy at age 15 has increased by between 2 and 3 years for most regions over the last 20years. <strong>The</strong> notable exceptions are the high-mortality countries in Africa, where life expect-
Global <strong>Health</strong>: today’s challenges 13Box 1.2 <strong>The</strong> African crisis of child mortality<strong>The</strong>re are 14 countries inWHO’s African Region inwhich child mortality has risensince reaching its lowest levelin 1990. About 34% of thepopulation under five years ofage in sub-Saharan Africa isnow exposed to this disturbingtrend. Only two countriesoutside Africa observed similarsetbacks in the sameperiod – countries that experiencedarmed conflict or economicsanctions. Eight of the14 countries are in southernAfrica, which boasted some ofthe most notable gains in childsurvival during the 1970s and1980s. Those promising gainshave been wiped out in a meredecade.Causes of child deaths in Botswana, 2002Whooping coughMeaslesMalariaInjuriesRespiratoryinfectionsDiarrhoealdiseasesPerinatalconditionsCongenital anomaliesTuberculosisOtherHIV/AIDS<strong>The</strong> surge of HIV/AIDS isdirectly responsible for up to60% of child deaths in Africa,as illustrated by the causes ofchild deaths in Botswanashown in the figure.<strong>The</strong> indirect effects ofHIV/AIDS in adults contributeto the tragedy. Children wholose their mothers to HIV/AIDS are more likely to diethan children with livingmothers, irrespective of theirown HIV status. <strong>The</strong> diversionof already stretched healthresources away from childhealth programmes into careof people living with AIDS furthercompounds the situation,in the presence of increasingmalaria mortality, civil unrestor social anarchy.ancy at age 15 decreased by nearly 7 years between 1980 and 2002, and the high-mortalitycountries, mainly those of the former Soviet Union, in eastern Europe, where life expectancyat age 15 decreased over the same period by 4.2 years for males and 1.6 years for females.Of the 45 million deaths among adults aged 15 years and over in 2002, 32 million, or almostthree-quarters, were caused by noncommunicable diseases, which killed almost four times asmany people as communicable diseases and maternal, perinatal and nutritional conditionscombined (8.2 million, or 18% of all causes). Injuries killed a further 4.5 million adults in2002, 1 in 10 of the total adult deaths. More than 3 million of these injury deaths – almost70% of them – concern males, whose higher risk is most pronounced for road traffic injuries(three times higher) and for violence and war (more than four times higher).<strong>The</strong> relative importance of these causes varies markedly across regions. Thus in Africa, onlyabout 1 in 3 adult deaths is caused by noncommunicable diseases, compared with nearly 9out of 10 in developed countries. It is of concern that 3 in 4 adult deaths in Latin America andin the developing countries of Asia and the Western Pacific Region are caused bynoncommunicable disease, reflecting the relatively advanced stage of the epidemiologicaltransition achieved in these populations and the emergence of the double burden of disease.Estimated total deaths by cause in 2002 are given for each of the epidemiological subregionsand the world in Annex Table 2. More detailed tables showing deaths by cause, age and sex ineach of the regions are available on the WHO web site (http://www.who.int/evidence/bod).Figure 1.8 highlights the marked contrast in patterns of health transition among adults (aged15 years and over) in different parts of the world. In developed countries, communicablediseases and maternal, perinatal and nutritional conditions contribute only 5% to the totalburden of disease, while in high-mortality developing regions this figure rises to 40%. InAfrican regions where the HIV/AIDS epidemic has confounded the pattern of health transitionduring the past decade, these conditions can contribute as much as 50–60% of the over-
14 <strong>The</strong> <strong>World</strong> <strong>Health</strong> <strong>Report</strong> 2003Figure 1.8 Disease burden (DALYs) among adults (aged 15 years and over)by broad cause, selected epidemiological subregions, 2002High-mortalitydeveloping regionsLow-mortalitydeveloping regionsDeveloped regions<strong>World</strong>Afr-EAfr-DAmr-DSear-DEmr-DSear-BAmr-BWpr-BEmr-BEur-CEur-BWpr-AAmr-AEur-A0 20 40 60 80 100PercentageCommunicable diseases, maternal, Noncommunicable diseases Injuriesperinatal and nutritional conditionsSee List of Member States for an explanation of subregions.all disease burden. Estimated total DALYs by cause in 2002 are given for each of the epidemiologicalsubregions and the world in Annex Table 3.<strong>The</strong> 10 leading causes of disease burden among men and women aged 15 years and over areshown in Table 1.2. Ischaemic heart disease and stroke (cerebrovascular disease) are two ofthe three leading causes of burden of disease in adult males globally. HIV/AIDS is the leadingcause for males and the second leading cause for females, accounting for around 6% of theglobal burden of disease. Unipolar depressive disorders are the leading cause of burden forfemales, reflecting their higher prevalence in women. Though the individual maternal conditionsof haemorrhage, sepsis and obstructed labour do not appear in Table 1.2, as a groupthey remain one of the leading causes of the burden of disease for women globally, reflectingthe continuing high levels of maternal mortality in many developing countries, and also thehigh levels of disability resulting from these conditions.Table 1.2 Leading causes of disease burden (DALYs) for males and femalesaged 15 years and older, worldwide, 2002Males %DALYs Females %DALYs1 HIV/AIDS 7.4 1 Unipolar depressive disorders 8.42 Ischaemic heart disease 6.8 2 HIV/AIDS 7.23 Cerebrovascular disease 5.0 3 Ischaemic heart disease 5.34 Unipolar depressive disorders 4.8 4 Cerebrovascular disease 5.25 Road traffic injuries 4.3 5 Cataracts 3.16 Tuberculosis 4.2 6 Hearing loss, adult onset 2.87 Alcohol use disorders 3.4 7 Chronic obstructive pulmonary disease 2.78 Violence 3.3 8 Tuberculosis 2.69 Chronic obstructive pulmonary disease 3.1 9 Osteoarthritis 2.010 Hearing loss, adult onset 2.7 10 Diabetes mellitus 1.9
Global <strong>Health</strong>: today’s challenges 15<strong>The</strong> following section summarizes the risk of premature adult death in terms of the probabilityof death between 15 and 60 years of age – the proportion of 15-year-olds who will diebefore their 60th birthday – and examines global patterns of cause of death in the age range15–59 years. <strong>The</strong> health of adults aged 60 years and older is then examined.Global patterns of premature mortality risk<strong>The</strong> probability of premature adult death varies widely between regions, as shown in Figure1.9. For example, the probability of premature adult death in some parts of sub-SaharanAfrica is much higher – nearly four times higher – than that observed in low-mortality countriesof the Western Pacific Region. Even within developed regions there are wide variations.Men in some eastern European countries are three to four times more likely to die prematurelythan men in other developed regions. Furthermore, male adult mortality in easternEurope is much greater than in developing countries of the Americas, Asia and the EasternMediterranean Region. In all regions, male mortality is higher than female, and the discrepancybetween the two sexes in mortality risk is much larger than that seen among children.<strong>The</strong> variation in the proportion of women dying prematurely is much less dramatic.Adult mortality trends: 15–59 years of age<strong>The</strong>re have been impressive gains in the health status of adults worldwide in the past fivedecades. <strong>The</strong> risk of death between ages 15 and 60 has declined substantially from a globalaverage of 354 per 1000 in 1955 to 207 per 1000 in 2002. <strong>The</strong> recent slowdown in the rate ofdecline is a clear warning that continued reductions in adult mortality, particularly in developingcountries, will not be easily achieved.Figure 1.9 Adult mortality: probabilities of death between 15 and 60 years of age by cause,selected epidemiological subregions, 2002<strong>World</strong>Africavery high adult mortalityAmericaslow adult mortalitySouth-East Asialow adult mortalityEuropehigh adult mortalityEuropevery low adult mortalityWestern Pacificlow adult mortalityHIV/AIDSOther communicable diseasesNoncommunicable diseasesInjuriesSee List of Member States for an explanation of subregions.0100 200 300 400 500 600Probability of death between 15 and 60 years of age per 1000 population
16 <strong>The</strong> <strong>World</strong> <strong>Health</strong> <strong>Report</strong> 2003<strong>The</strong>re is substantial variation in the pace and magnitude of declining trends in prematureadult mortality across both sexes and global regions (see Figure 1.10). <strong>The</strong> global slowdownof the pace is primarily a result of a shift in trends in adult mortality in a few regions. Amongthe signs of deteriorating adult health, the most disturbing is the fact that adult mortality inAfrica has reversed, shifting in 1990 from a state of steady decline into a situation characterizedby rapidly increasing mortality. <strong>The</strong> reversal in parts of sub-Saharan Africa has been sodrastic that current adult mortality rates today exceed the levels of three decades ago. InZimbabwe, upturns in reported adult deaths were significantly greater in 1991–1995 than in1986–1990. Older childhood and older adult mortality have changed little (9). Without HIV/AIDS, life expectancy at birth in the African Region would have been almost 6.1 years higherin 2002. <strong>The</strong> reduction in life expectancy varies significantly across the African Region. <strong>The</strong>greatest impact has been in Botswana, Lesotho, Swaziland and Zimbabwe, where HIV/AIDShas reduced male and female life expectancies by more than 20 years.<strong>The</strong> fragile state of adult health in the face of social, economic and political instability is alsoapparent in regions outside Africa. Male mortality in some countries in eastern Europehas increased substantially and is approaching the level of adult mortality in some AfricanFigure 1.10 Trends of adult mortality by sex, selected epidemiological subregions, 1970–2002600FemalesAfrica – very high adult mortalityPossibility of death between 15 and 60 years of age per 1000 population400200019706004002001980YearMales19902000Africa – high adult mortalitySouth-East Asia – low adult mortality<strong>World</strong>Europe – high adult mortalityWestern Pacific – low adult mortalityAfrica – very high adult mortalityAfrica – high adult mortalityEurope – high adult mortalitySouth-East Asia – low adult mortality<strong>World</strong>Western Pacific – low adult mortality019701980Year19902000See List of Member States for an explanation of subregions.
Global <strong>Health</strong>: today’s challenges 17countries. As a result, for the European Region as a whole, average adult mortality risk formen between 15 and 60 years is 230 per 1000, which is similar to the rate observed in the1980s. This contrasts with the continuously declining trend for women in this region as awhole. <strong>The</strong>ir risk has declined from 130 in 1970 to 98 in 2002. Figure 1.8 illustrates thefact that the probability of death from injury among adults aged 15–59 years in the highmortalitycountries of eastern Europe is nearly six times higher than in neighbouring westernEuropean countries.Adult mortality: widening gapsContinuously declining adult mortality in low-mortality regions, combined with trend reversalsin high-mortality areas, have resulted in widening gaps in adult mortality worldwide.<strong>The</strong> gap between the lowest and highest regional adult mortality risk between ages 15 and 60has now increased to a level of 340 per 1000 in 2002. Regional aggregation of adult mortalityalso hides enormous and sobering disparities between countries. For example, within theEastern Mediterranean Region, adult mortality risk between ages 15 and 60 among womenin Djibouti was seven times higher than that of women in Kuwait in 2002. Overall, there is analmost 12-fold difference between the world’s lowest and highest adult mortality at countrylevel (see Annex Table 1).HIV/AIDS: the leading health threatTable 1.3 shows the leading causes of deaths and DALYs among adults worldwide for 2002.Despite global trends of declining communicable disease burden in adults, HIV/AIDS hasbecome the leading cause of mortality and the single most important contributor to theburden of disease among adults aged 15–59 years (see Chapter 3).Table 1.3 Leading causes of mortality and disease burden (DALYs) among adults, worldwide, 2002Mortality – adults aged 15–59Rank Cause Deaths (000)1 HIV/AIDS 22792 Ischaemic heart disease 13323 Tuberculosis 10364 Road traffic injuries 8145 Cerebrovascular disease 7836 Self-inflicted injuries 6727 Violence 4738 Cirrhosis of the liver 3829 Lower respiratory infections 35210 Chronic obstructive pulmonary disease 343Disease burden – adults aged 15–59Rank Cause DALYs (000)1 HIV/AIDS 68 6612 Unipolar depressive disorders 57 8433 Tuberculosis 28 3804 Road traffic injuries 27 2645 Ischaemic heart disease 26 1556 Alcohol use disorders 19 5677 Hearing loss, adult onset 19 4868 Violence 18 9629 Cerebrovascular disease 18 74910 Self-inflicted injuries 18 522Mortality – adults aged 60+Rank Cause Deaths (000)1 Ischaemic heart disease 58252 Cerebrovascular disease 46893 Chronic obstructive pulmonary disease 23994 Lower respiratory infections 13965 Trachea, bronchus, lung cancers 9286 Diabetes mellitus 7547 Hypertensive heart disease 7358 Stomach cancer 6059 Tuberculosis 49510 Colon and rectum cancers 477Disease burden – adults aged 60+Rank Cause DALYs (000)1 Ischaemic heart disease 31 4812 Cerebrovascular disease 29 5953 Chronic obstructive pulmonary disease 14 3804 Alzheimer and other dementias 8 5695 Cataracts 7 3846 Lower respiratory infections 6 5977 Hearing loss, adult onset 6 5488 Trachea, bronchus, lung cancers 5 9529 Diabetes mellitus 5 88210 Vision disorders, age-related and other 4 766
18 <strong>The</strong> <strong>World</strong> <strong>Health</strong> <strong>Report</strong> 2003Box 1.3 Population ageingNearly 80% of the almost 3 million global deaths from HIV/AIDS in 2002 occurred in sub-Saharan Africa. As stated earlier, HIV/AIDS is the leading cause of death in this region. Itcauses more than 6000 deaths every day and accounts for one in two deaths of adults aged15–59 years. It has reversed mortality trends among adults in this region and turned previousgains in life expectancy into a continuous decline in life expectancy since 1990.Mortality and disease among older adultsIn developing countries, 42% of adult deaths occur after 60 years of age, compared with 78%in developed countries. Globally, 60-year-olds have a 55% chance of dying before their 80thbirthday. Regional variations in risk of death at older ages are smaller, ranging from around40% in the developed countries of western Europe to 60% in most developing regions and70% in Africa. Historical data from countries such as Australia and Sweden show that lifeexpectancy at age 60 changed slowly during the first six to seven decades of the 20th centurybut, since around 1970, has started to increase substantially. Life expectancy at age 60 hasnow reached 25 years in Japan. From 1990 onwards, eastern European countries such as Hungaryand Poland have started to experience similar improvements in mortality for older people,but others, such as the Russian Federation, have not, and are experiencing worseningtrends. <strong>The</strong> leading causes of mortality and burden of disease in older people have not changedgreatly over the past decade.<strong>The</strong> growing burden of noncommunicable diseases<strong>The</strong> burden of noncommunicable diseases is increasing, accounting for nearly half of theglobal burden of disease (all ages), a 10% increase from estimated levels in 1990. While theproportion of burden from noncommunicable diseases in developed countries remains stableat over 80% in adults aged 15 years and over, the proportion in middle-income countrieshas already exceeded 70%. Surprisingly, almost 50% of the adult disease burden in the highmortalityregions of the world is now attributable to noncommunicable diseases. Populationageing (see Box 1.3) and changes in the distribution of risk factors have accelerated the epidemicof noncommunicable diseases in many developing countries (10).A demographic revolution is under way throughout the world. Today,there are around 600 million people in the world aged 60 years andover. This total will double by 2025 and by 2050 will reach two billion,the vast majority of whom will be in the developing world. Such acceleratedglobal population ageing will increase economic and social demandson all countries.While the consequences of population ageing in the areas of healthand income security are already at the centre of discussions by policymakersand planners in the developed world, the speed and impact ofpopulation ageing in the less developed regions are yet to be fully appreciated.By 2025, in countries such as Brazil, China and Thailand, theproportion of older people will be above 15% of the population, whilein Colombia, Indonesia and Kenya the absolute numbers will increaseby up to 400% over the next 25 years – up to eight times higher thanthe increases in already aged societies in western Europe where populationageing occurred over a much longer period of time (11).Population ageing is driven by two factors: a decline in the proportionof children, reflecting declines in fertility rates in the overallpopulation, and an increase in the proportion of adults 60 years of ageand over as mortality rates decline. This demographic transition will bringwith it a number of major challenges for health and social policy planners.As populations age, the burden of noncommunicable diseases increases.Evidence from developed countries, however, shows that theprevalence of chronic diseases and the levels of disability in older peoplecan be reduced with appropriate health promotion and strategies toprevent noncommunicable diseases. It is of great concern that the prevalenceof risk factors for chronic diseases is on the increase in developingcountries. Opportunities missed by health systems to deal with or manageage-related noncommunicable diseases will lead to increases in theincidence, prevalence and complications of these diseases and may takeresources away from other priorities, such as child and maternal health.Improving health systems and their responses to population ageingmakes economic sense. With old-age dependency ratios increasingin virtually all countries of the world, the economic contributions andproductive roles of older people will assume greater importance. Supportingpeople to remain healthy and ensure a good quality of life intheir later years is one of the greatest challenges for the health sector inboth developed and developing countries (12).
Global <strong>Health</strong>: today’s challenges 19Cardiovascular diseases account for 13% of the disease burden among adults over 15 years ofage. Ischaemic heart disease and cerebrovascular disease (stroke) are the two leading causesof mortality and disease burden among older adults (over age 60). In developed countries,ischaemic heart disease and cerebrovascular disease are together responsible for 36% ofdeaths, and death rates are higher for men than women. <strong>The</strong> increase in cardiovascular mortalityin eastern European countries has been offset by continuing declines in many otherdeveloped countries. In contrast, the mortality and burden resulting from cardiovasculardiseases are rapidly increasing in developing regions (see Chapter 6).Of the 7.1 million cancer deaths estimated to have occurred in 2002, 17% were attributable tolung cancer alone and of these, three-quarters occurred among men (13). <strong>The</strong>re were anestimated 1.2 million lung cancer deaths in 2000, an increase of nearly 30% in the 10 yearsfrom 1990, reflecting the emergence of the tobacco epidemic in low-income and middleincomecountries.Stomach cancer, which until recently was the leading cause of cancer mortality worldwide,has been declining in all parts of the world where trends can be reliably assessed, and nowcauses 850 000 deaths each year, or about two-thirds as many as lung cancer. Liver and colon/rectum cancers are the third and fourth leading causes. More than half of all liver cancerdeaths are estimated to occur in the Western Pacific Region. Among women, the leadingcause of cancer deaths is breast cancer. During the past decade, breast cancer survival rateshave been improving, though the chance of survival varies according to factors such as coverageand access to secondary prevention. Globally, neuropsychiatric conditions account for19% of disease burden among adults (see Box 1.4), almost all of this resulting from non-fatalhealth outcomes.Injuries – a hidden epidemic among young menInjuries, both unintentional and intentional, primarily affect young adults, often resulting insevere disabling consequences. Overall, injuries accounted for over 14% of adult disease burdenin the world in 2002. In parts of the Americas, eastern Europe and the Eastern MediterraneanRegion, more than 30% of the entire disease burden among male adults aged 15–44years is attributable to injuries.Box 1.4 <strong>The</strong> burden of mental ill-healthMental, neurological and substance use disorders cause a large burdenof disease and disability: globally, 13% of overall disability-adjusted lifeyears (DALYs) and 33% of overall years lived with disability (YLDs). Behindthese stark figures lies human suffering: more than 150 millionpeople suffer from depression at any point in time; nearly 1 million commitsuicide every year; and about 25 million suffer from schizophrenia,38 million from epilepsy, and more than 90 million from an alcohol ordrug use disorder.A large proportion of individuals do not receive any health carefor their condition, firstly because the mental health infrastructure andservices in most countries are grossly insufficient for the large and growingneeds (14) and, secondly, because widely prevalent stigma and discriminationprevent them from seeking help. A policy for mental healthcare is lacking in 40% of countries, and 25% of those with a policyassign no budget to implement it. Even where a budget exists, it is verysmall: 36% of countries devote less than 1% of their total health resourcesto mental health care. Though community-based services arerecognized to be the most effective, 65% of all psychiatric beds are stillin mental hospitals – cutting into the already meagre budgets whileproviding largely custodial care in an environment that may infringepatients’ basic human rights.Cost-effective health care interventions are available. Recent researchclearly demonstrates that disorders such as depression, schizophrenia,alcohol problems and epilepsy can be treated within primaryhealth care. Such treatment is well within the reach of even low-incomecountries and will reduce substantially the overall burden of these disorders.Interventions rely on inexpensive medicines that are commonlyavailable and, for the most part, free of patent restrictions, and basictraining of health professionals (15).Mental health also has an impact on health care systems in otherways. A large proportion of people with chronic physical diseases suchas diabetes and hypertension, malignancies and HIV/AIDS suffer fromconcurrent depression, which significantly interferes with their adherenceto health care regimens. Behavioural and lifestyle factors are alsoresponsible for many communicable and noncommunicable diseases (10).Though these links have been recognized, most countries are not adequatelyusing this information to enhance the effectiveness of theirhealth care systems.
20 <strong>The</strong> <strong>World</strong> <strong>Health</strong> <strong>Report</strong> 2003Figure 1.11 Age-standardized rate of years lived with disability (YLDs): developedand developing countries, 2002200Age-standardized YLDs rateper 1000 population150100500DevelopedLow-mortalitydevelopingHigh-mortalitydeveloping<strong>World</strong>Among men, road traffic injuries, violence and self-inflicted injuries are all among the top 10leading causes of disease burden in the 15–44-year-old age group. Globally, road traffic injuriesare the third leading cause of burden in that age and sex group, preceded only by HIV/AIDS and unipolar depression. <strong>The</strong> burden of road traffic injuries is increasing, especially inthe developing countries of sub-Saharan Africa and South-East Asia, and particularly affectsmales (see Chapter 6).Intentional injuries, a group that includes self-inflicted injuries and suicide, violence andwar, account for an increasing share of the burden, especially among economically productiveyoung adults. In developed countries, suicides account for the largest share of intentionalinjury burden whereas, in developing regions, violence and war are the major causes. Countriesof the former Soviet Union and other high-mortality countries of eastern Europe haverates of injury death and disability among males that are similar to those in sub-SaharanAfrica.Non-fatal health outcomes<strong>The</strong> overall burden of non-fatal disabling conditions is dominated by a relatively short list ofcauses. In all regions, neuropsychiatric conditions, largely depression, are the most importantcauses of disability, accounting for over 35% of YLDs among adults (aged 15 and over).<strong>The</strong>ir disabling burden is almost the same for men and women, but the major contributingcauses are different. <strong>The</strong> burden of depression is 50% higher for women than for men, andwomen also have higher burden from anxiety disorders, migraine and senile dementias. Incontrast, the burden for alcohol and drug use disorders is nearly six times higher in men thanin women, and accounts for one-quarter of the male neuropsychiatric burden.In high-mortality developing regions, visual impairment, hearing loss and HIV/AIDS are theother major contributors to YLDs. In developed and low-mortality developing regions, visualimpairment, hearing loss, musculoskeletal disease, chronic obstructive pulmonary disease,and other noncommunicable diseases, particularly stroke, account for the majority of adultdisability. 11 Estimated YLDs by cause, age group and sex for 2002 are available on the WHO web site for the six WHOregions and for the 14 epidemiological subregions (www.who.int/evidence/bod).
Global <strong>Health</strong>: today’s challenges 21Surprisingly, more than 80% of global YLDs are in developing countries and nearly halfoccur in high-mortality developing countries. Figure 1.11 shows higher rates of YLDs per1000 (age-standardized to the world population in 2002) in developing regions, indicating ahigher incidence of disabling conditions as well as increased levels of severity of these conditions.Although the prevalence of disabling conditions, such as dementia and musculoskeletaldisease, is higher in countries with long life expectancies, this is offset by lower disabilityfrom conditions such as cardiovascular disease, chronic respiratory diseases and long-termsequelae of communicable diseases and nutritional deficiencies. In other words, people livingin developing countries not only face lower life expectancies (higher risk of prematuredeath) than those in developed countries, but also live a higher proportion of their lives inpoor health.<strong>Health</strong>y life expectancy varies across regions of the world even more than total life expectancy,ranging from a low of 41 years for sub-Saharan Africa to 71.4 years for western Europe,with a global average of 57.7 years in 2002. <strong>Health</strong>y life expectancy converts total life expectancyinto equivalent years of “full health” by taking into account years lived in less than fullhealth as a result of diseases and injuries. <strong>The</strong> gap between total life expectancy and healthylife expectancy represents the equivalent lost healthy years resulting from states of less thanfull health in the population, and ranges from 9% in the European Region and the WesternPacific Region to 15% in Africa. Annex Table 4 contains estimates of healthy life expectancyfor all WHO Member States in 2002.To sum up, this chapter is a reminder that children are among the most vulnerable membersof societies around the world. Despite considerable achievements, much still needs to bedone, urgently, to avert child deaths from preventable causes. <strong>The</strong> success stories in manypoor countries in all regions demonstrate clearly that much progress can be made with limitedresources. Tragically, many other countries, particularly in Africa, have lost the groundgained in previous decades. <strong>The</strong> gaps in mortality between rich and poor populations arewidening, leaving 7% of the world’s children and 35% of Africa’s children at higher risk ofdeath today than they were 10 years ago.In the last five decades there have been impressive gains in adult health status worldwide. <strong>The</strong>average figures, however, mask disparities in population health. Of great concern are the reversalsin adult mortality in the 1990s in sub-Saharan Africa caused by HIV/AIDS and inparts of eastern Europe attributable to a number of noncommunicable diseases (particularlycardiovascular and alcohol-related diseases) and injuries.Demographic trends and health transitions, along with changes in the distribution of riskfactors, have accelerated the epidemic of noncommunicable disease in many developing countries.Infectious diseases such as HIV/AIDS and tuberculosis have serious socioeconomic consequencesin both the developed and the developing worlds. Thus, the majority of developingcountries are facing a double burden from both communicable and noncommunicablediseases. In addition, contrary to common perceptions, disabilities tend to be more prevalentin developing regions, as the disease burden is often skewed towards highly vulnerable subpopulations.<strong>The</strong> global public health community is now faced with a more complex anddiverse pattern of adult disease than previously expected. It has been estimated that 47% ofpremature deaths and 39% of the total disease burden result from 20 leading risk factors forchildhood and adult diseases and injuries and that removal of these risks would increaseglobal healthy life expectancy by 9.3 years, ranging from 4.4 years in industrialized countriesof the Western Pacific Region to 16.1 years in parts of sub-Saharan Africa (16).
22 <strong>The</strong> <strong>World</strong> <strong>Health</strong> <strong>Report</strong> 2003Historically unprecedented increases in life expectancy at older ages in developed countrieshave already exceeded earlier predictions of maximum population life expectancy. With suchincreases, the non-fatal burden of disease plays an increasingly important role, and it will bea major goal of health policy worldwide to ensure that longer life is accompanied by greaterhealth and less disability.This chapter has described many of the facts of life and death across the world and the underlyingtrends that influence them. Much of what has been reviewed here relates closely to thehealth-related Millennium Development Goals. Understanding the goals, and why the progresstowards them is so important and at the same time so difficult, is the subject of the nextchapter.References1. Murray CJL, Lopez AD, eds. <strong>The</strong> global burden of disease: a comprehensive assessment of mortality anddisability from diseases, injuries and risk factors in 1990 and projected to 2020. Cambridge, MA, HarvardSchool of Public <strong>Health</strong> on behalf of the <strong>World</strong> <strong>Health</strong> Organization and the <strong>World</strong> Bank, 1996 (GlobalBurden of Disease and Injury Series, Vol. I).2. Lee JW. Child survival: a global health challenge. Lancet, 2003, 362:262.3. Mswia R et al. and the AMMP Team. Dar es Salaam demographic surveillance system. In: <strong>The</strong> INDEPTHNetwork. Population and health in developing countries. Vol. 1: Population, health and survival at INDEPTHsites. Ottawa, International Development Research Centre, 2002:143–150.4. Mswia R et al. and the AMMP Team. Hai demographic surveillance system. In: <strong>The</strong> INDEPTH Network.Population and health in developing countries. Vol. 1: Population, health and survival at INDEPTH sites.Ottawa, International Development Research Centre, 2002:151–158.5. Mswia R et al. and the AMMP Team. Morogoro demographic surveillance system. In: <strong>The</strong> INDEPTHNetwork. Population and health in developing countries. Vol. 1: Population, health and survival at INDEPTHsites. Ottawa, International Development Research Centre, 2002:167–172.6. Wang L. Determinants of child mortality in LDCs: empirical findings from demographic and health surveys.<strong>Health</strong> Policy, 2003, 65:277–299.7. Lock K et al. What targets for international development policies are appropriate for improving health inRussia? <strong>Health</strong> Policy and Planning, 2002, 17:257–263.8. Stein CE et al. <strong>The</strong> global burden of measles in the year 2000 – a model using country specific indicators.Journal of Infectious Disease, 2003, 187(S1):8–14.9. Gregson S et al. Recent upturn in mortality in rural Zimbabwe: evidence for an early demographic impactof HIV-1 infection? AIDS, 1997, 11:1269–1280.10. <strong>The</strong> world health report 2002 – Reducing risks, promoting healthy life. Geneva, <strong>World</strong> <strong>Health</strong> Organization,2002.11. <strong>World</strong> population prospects – the 2002 revision. New York, NY, United Nations, Population Division, 2002.12. Active ageing – a policy framework. Geneva, <strong>World</strong> <strong>Health</strong> Organization, 2002 (WHO/NMH/02.8).13. Shibuya K et al. Global and regional estimates of cancer mortality and incidence by site: II. Results for theGlobal Burden of Disease 2000. BMC Cancer, 2002, 2:37.14. Atlas: country profiles on mental health resources 2001. Geneva, <strong>World</strong> <strong>Health</strong> Organization, 2001(WHO/NMH/MSD/MDP/01.3).15. <strong>The</strong> world health report 2001 – Mental health: new understanding, new hope. Geneva, <strong>World</strong> <strong>Health</strong>Organization, 2001.16. Ezzati M et al. Estimates of global and regional potential health gains from reducing multiple major riskfactors. Lancet, 2003, 362:271–280.
Millennium <strong>Health</strong> Goals: paths to the future 23Chapter TwoMillennium <strong>Health</strong> Goals:paths to the future<strong>The</strong> Millennium Development Goals (MDGs) place health atthe heart of development and represent commitments by governmentsthroughout the world to do more to reduce povertyand hunger and to tackle ill-health, gender inequality, lack ofeducation, access to clean water and environmental degradation.Three of the eight goals are directly health-related; allof the others have important indirect effects on health. Thischapter traces the origins of the MDGs and tracks the progressso far towards achieving them. It warns that without significantlystrengthened commitments from both wealthy and developingcountries, the goals will not be met globally.
24 <strong>The</strong> <strong>World</strong> <strong>Health</strong> <strong>Report</strong> 2003
Millennium <strong>Health</strong> Goals: paths to the future 252Millennium <strong>Health</strong> Goals:paths to the future<strong>The</strong> Millennium Development Goals (MDGs) adopted by the United Nations in 2000 providean opportunity for concerted action to improve global health. <strong>The</strong>y place health at theheart of development and establish a novel global compact, linking developed and developingcountries through clear, reciprocal obligations.Seizing the opportunity offered by the MDGs will not be easy. Wealthy countries have so farfailed to live up to all of their responsibilities under the compact, which include establishingfairer international trade policies, increasing official development assistance, delivering debtrelief and accelerating technology transfer. Despite progress in some cases, many developingcountries are not currently on track to achieve their health-related MDG objectives. Withoutsignificantly strengthened commitments from both developed and developing countries, theMDGs will not be met globally, and outcomes in some of the poorest countries will remainfar below the hoped-for achievements. WHO and international health partners must intensifytheir cooperation with Member States to speed up progress towards the MDGs and ensurethat gains are made by those most in need.International commitments atthe Millennium SummitIn September 2000, representatives from 189 countries, including 147 heads of state, met atthe Millennium Summit in New York to adopt the United Nations Millennium Declaration(1). <strong>The</strong> declaration set out the principles and values that should govern international relationsin the 21st century. National leaders made specific commitments in seven areas: peace,security and disarmament; development and poverty eradication; protecting our commonenvironment; human rights, democracy and good governance; protecting the vulnerable;meeting the special needs of Africa; and strengthening the United Nations.<strong>The</strong> Road Map (2) prepared following the Summit established goals and targets to be reachedby 2015 in each of these seven areas. <strong>The</strong> goals in the area of development and poverty eradicationare now widely referred to as the Millennium Development Goals. <strong>The</strong>y representcommitments by governments worldwide to do more to reduce poverty and hunger and totackle ill-health, gender inequality, lack of education, lack of access to clean water, and environmentaldegradation. <strong>The</strong>y also include commitments to reduce debt, increase technologytransfers and build development partnerships.
26 <strong>The</strong> <strong>World</strong> <strong>Health</strong> <strong>Report</strong> 2003A compact to end poverty<strong>The</strong> idea of the MDGs as a compact, in which both rich and poor countries have responsibilities,was further developed in early 2002 at the International Conference on Financing forDevelopment, in Monterrey, Mexico. <strong>The</strong> resultant Monterrey Consensus (3) reaffirms theimportance of the MDGs and provides a framework for building the partnerships that willbe needed to achieve them. A few months later, in September 2002, the <strong>World</strong> Summit onSustainable Development, held in Johannesburg, South Africa, took the process a step furtherby recognizing that poverty reduction and the achievement of the MDGs were central tothe overall sustainable development agenda (4). Both the <strong>World</strong> development report 2003 andthe Human development report 2003 have further developed the concept of a compact, with aview to informing policy.<strong>The</strong> MDGs summarize some of the key commitments made at the major United Nationsconferences of the 1990s. <strong>The</strong>y also build on the international development targets preparedby the Organisation for Economic Co-operation and Development (OECD) in 1996 (5).However, it is the two-way nature of the compact that sets the MDGs apart from theirpredecessors. Developing countries are committed to achieving Goals 1–7. Goal 8 concernsdeveloped countries and the actions that they can take in order to create a more enablingenvironment in the areas of trade, development assistance, debt, essential medicines and technologytransfer. Without progress on Goal 8, it is unlikely that the poorest countries will beable to tackle the structural constraints that keep them in poverty, or sustain the levels ofinvestment required to achieve the other goals.New concepts of poverty and developmentSince the early 1990s, the concepts of poverty and development have evolved away from anexclusive emphasis on income towards a fuller notion of human well-being, as found in theUnited Nations Development Programme’s Human Development Index (HDI) and othermultifactorial indices, which provide alternatives to per capita gross national income (GNI)as a measure of development (6).In this new understanding, poverty means not just low income but the undermining of awhole range of key human capabilities, including health. <strong>The</strong> term human poverty refers todeprivation of the means to achieve capabilities (for example, physical access to health care)and of basic “conversion” factors that facilitate this achievement (such as social access tohealth care) (7). Human development refers to processes that enlarge people’s choices to enablethem to achieve capabilities (for example, the freedom to choose a healthy lifestyle) (8).<strong>The</strong> interaction of health and developmentThis more complex concept of poverty and development takes account of the interactiveprocesses that are crucial to the social dynamics of health improvement. For example,economic capabilities affect health, as low income constrains access to health care and healthpromotingopportunities. Equally significantly, ill-health limits people’s ability to earn higherincomes, and contributes to poverty.<strong>The</strong> two-way causal relationship between economic development and health has been highlightedby the Commission on Macroeconomics and <strong>Health</strong>, in order to underline the crucialrole of health in economic growth (9). <strong>The</strong> importance of health within a multidimensionalmodel of sustainable human development is also a key message of the MDGs.
Millennium <strong>Health</strong> Goals: paths to the future 27Improvements in health are important in their own right, but better health is also a prerequisiteand a major contributor to economic growth and social cohesion. Conversely, improvementin people’s access to health technology is a good indicator of the success of otherdevelopment processes. All of these relationships are evident in the MDGs. Thus, three of theeight goals, eight of the 18 targets required to achieve them, and 18 of the 48 indicators ofprogress are health-related (see Table 2.1).<strong>The</strong> MDGs are interrelated and interdependent. In many countries, it will be impossible toachieve a 50% reduction in income poverty (Goal 1, Target 1) without taking steps to ensurea healthier population. Similarly, eliminating gender disparities (Goal 3) and increasing enrolmentrates for primary education (Goal 2) are prerequisites for success in improving healthoutcomes. Population health can no longer be considered in isolation from questions of thestewardship of natural resources and environmental sustainability (Goal 7). It is thereforeimportant that the health-related MDGs are not seen in isolation – as discrete programmes –but as the result, or desired outcome, of a development agenda with several parts workingtogether.One of the most challenging goals, to achieve a two-thirds reduction in child mortality (Goal4, Target 5), requires technical interventions that tackle the major causes of child deaths, suchas malnutrition, infections and parasitic diseases. But the effectiveness of these interventionswill be mediated through a network of public and private delivery systems, and will dependon adequate levels of financing. <strong>The</strong>ir effect will be reinforced by actions such as those thatensure greater food security and access to education, essential medicines and clean water, andby improved public expenditure management. <strong>The</strong> ability of governments to finance theseefforts will be influenced by both the domestic and international policy and trade environments,and, in poorer countries, by the availability of external financial assistance. <strong>The</strong> MDGsare consequently a way of assessing and tracking progress in development on a number ofcritical fronts. <strong>The</strong>y are a shorthand for the ends, or outcomes, that governments have committedthemselves to achieving, rather than a prescription for the means by which those endsare to be achieved.Progress and prospectsDespite political consensus and the avowed commitment of countries throughout the world,the MDGs will not be achieved at current rates of progress.<strong>The</strong> Human development report 2003 notes that “if global progress continues at the same paceas in the 1990s, only the Millennium Development Goals of halving income poverty andhalving the proportion of people without access to safe water stand a realistic chance of beingmet, thanks mainly to China and India. Sub-Saharan Africa would not reach the goals forpoverty until the year 2147 and for child mortality until 2165. And for HIV/AIDS and hunger,trends in the region are worsening”. <strong>The</strong>re are some areas where optimism is justified, butthe general outlook, in particular for sub-Saharan Africa, is bleak. Even in countries that aremaking overall progress, gaps in health status between rich and poor may be widening (seeBox 2.1).It is generally agreed that reducing child mortality by two-thirds before 2015 is the furthestof all the health-related goals from being realized. Infant and child mortality is the mostcomplex development indicator, as it is considered to include systemic as well as socioeconomicand cultural factors (see Box 2.2). Overall, the Caribbean, central Asia, Europe, LatinAmerica, some countries of the Eastern Mediterranean Region and northern Africa may be
28 <strong>The</strong> <strong>World</strong> <strong>Health</strong> <strong>Report</strong> 2003Table 2.1 <strong>Health</strong>-related Millennium Development Goals, targets and indicatorsGoal: 1. Eradicate extreme poverty and hungerTarget: 2. Halve, between 1990 and 2015, the proportion of people who suffer from hungerIndicator: 4. Prevalence of underweight children under five years of age5. Proportion of population below minimum level of dietary energyconsumption aGoal: 4. Reduce child mortalityTarget: 5. Reduce by two-thirds, between 1990 and 2015, the under-five mortality rateIndicator: 13. Under-five mortality rate14. Infant mortality rate15. Proportion of 1-year-old children immunized against measlesGoal: 5. Improve maternal healthTarget: 6. Reduce by three-quarters, between 1990 and 2015, the maternal mortality ratioIndicator: 16. Maternal mortality ratio17. Proportion of births attended by skilled health personnelGoal: 6. Combat HIV/AIDS, malaria and other diseasesTarget: 7. Have halted by 2015 and begun to reverse the spread of HIV/AIDSIndicator: 18. HIV prevalence among young people aged 15 to 24 years b19. Condom use rate of the contraceptive prevalence rate20. Number of children orphaned by HIV/AIDSTarget: 8. Have halted by 2015 and begun to reverse the incidence of malaria andother major diseasesIndicator: 21. Prevalence and death rates associated with malaria22. Proportion of population in malaria-risk areas using effectivemalaria prevention and treatment measures23. Prevalence and death rates associated with tuberculosis24. Proportion of tuberculosis cases detected and cured underDirectly Observed Treatment, Short-course (DOTS)Goal: 7. Ensure environmental sustainabilityTarget: 9. Integrate the principles of sustainable development into country policies andprogrammes and reverse the loss of environmental resourcesIndicator: 29. Proportion of population using solid fuelTarget: 10. Halve by 2015 the proportion of people without sustainable access to safedrinking-waterIndicator: 30. Proportion of population with sustainable access to an improvedwater source, urban and ruralTarget: 11. By 2020 to have achieved a significant improvement in the lives of at least100 million slum dwellersIndicator: 31. Proportion of urban population with access to improved sanitationGoal: 8. Develop a global partnership for developmentTarget: 17. In cooperation with pharmaceutical companies, provide access to affordableessential drugs in developing countriesIndicator: 46. Proportion of population with access to affordable essential drugson a sustainable basisa <strong>Health</strong>-related indicator reported by FAO only.b Indicators from the MDG list reformulated by WHO and United Nations General Assembly Special Session on HIV/AIDS.
Millennium <strong>Health</strong> Goals: paths to the future 29more or less on track, but several countries in each region are not. Some countries of theSouth-East Asia Region are behind schedule and sub-Saharan Africa, as noted above, is notlikely to reach the target until the second half of the next century. If overall trends continue,under-five mortality worldwide will be reduced by approximately one-quarter over the period1990–2015, which is very far from the goal of a two-thirds reduction. Lack of progresscan be attributed to mother-to-child HIV transmission in some parts of Africa, but for mostcountries the problem is long-standing underinvestment. This applies to efforts both to reducemalnutrition and to achieve full coverage of interventions to reduce mortality fromdiarrhoea, pneumonia, vaccine-preventable diseases, malaria and perinatal causes.<strong>The</strong> maternal mortality picture shows a similar divide between, on one side, southern Asiaand sub-Saharan Africa, and on the other, the rest of the world. <strong>The</strong>re is a hundred-folddifference in lifetime risk of dying in pregnancy between the world’s poorest and richestcountries. One of the indicators of progress, the proportion of births attended by skilledpersonnel, is rising slowly from a very low base in parts of the South-East Asia Region, andstagnating in sub-Saharan Africa. Only a dramatic improvement in the quality and coverageof health services is likely to have a significant influence on progress in relation to this goal(see Box 2.3).<strong>The</strong> global HIV/AIDS pandemic continues to worsen, with over 70% of all infections occurringin sub-Saharan Africa. Around 40 million people are now living with AIDS, over5 million new infections occur each year and, in 2002, almost 3 million people died as a resultof the disease. Progress is currently measured (for the purposes of tracking Goal 6) byBox 2.1 Progress towards the Millennium Development Goals – the case of UgandaMany sub-Saharan African countries are struggling to makeprogress towards the Millennium Development Goals (MDGs). Nevertheless,some countries in WHO’s African Region have registeredimpressive gains (10, 11).Uganda, for example, cut poverty sharply in the 1990s and willachieve the MDG poverty reduction target if present trends continue.Specifically pro-poor economic policies may be needed, however, in orderto distribute the fruits of economic growth more evenlybetween rich and poor, especially in rural areas. Furthermore, growthitself needs to be revived through economic diversification. In controllingthe spread of HIV, Uganda’s progress has actually been more rapidFigure A Current and projected progress towardsMDG HIV prevalence target, Ugandathan that required to reach the MDG target (Figure A).Progress in reducing mortality in children under five years of agehas also been substantial. However, it is important to disaggregate theunder-5 mortality data in order to understand the impact on differentsocioeconomic groups. As Figure B indicates, the gap between the richestand poorest sections of the population widened in the mid-1990s.While the richest made gains in line with the MDGs, much less progresswas observed for the poorest households. Since the poor make up overa third of Uganda’s population, instituting a “bottom-up” approach thatfocuses on the needs of the lowest quintiles first could achieve the MDGunder-5 mortality target ahead of time.Figure B Rich and poor – unequal progress towardsMDG under-5 mortality targets, UgandaHIV prevalence rate, adults aged 15–49201816141210864201990 2000 2006YearTargetUnder-5 mortality rate250200150100500Poorest quintileRichest quintile1988 1995 2015YearTarget
30 <strong>The</strong> <strong>World</strong> <strong>Health</strong> <strong>Report</strong> 2003Box 2.2 Child survival – turning knowledge into actionDespite progress in recent decades, globally more than 10 million childrenstill die every year. <strong>The</strong> number of children and adolescents whodied in 2002 was twice the total of adult deaths from AIDS, tuberculosisand malaria combined. All but about 1% of these child deaths occur indeveloping countries, and more than half are caused by malnutrition,pneumonia, diarrhoea, measles, malaria, and HIV/AIDS. Effective lowcostinterventions are available that could prevent at least two-thirds ofthese deaths. Some interventions are preventive, for examplebreastfeeding, insecticide-treated materials, complementary feeding, zinc,vitamin A supplements, improved delivery procedures and immunization.Others involve treatment, such as oral rehydration therapy, antibioticsfor sepsis and pneumonia, antimalarials and newborn resuscitation.<strong>The</strong> challenge is to deliver these life-saving interventions to the childrenwho need them most.Scaling up effective child health interventions will require increasedattention to newborn health and the application of an integrated, comprehensiveapproach to child health at country level.Although significant progress has been achieved during the past10 years in reducing mortality in childhood, there has been little progressin reducing deaths among newborns. Almost 4 million infants every yeardo not survive their first month of life. Most newborn deaths are a consequenceof poor health and nutritional status in the mother, absent orlow-quality care during pregnancy and delivery, and inadequate basiccare of the healthy baby and management of the sickinfant. Action to improve the health and survival of newborns and theirmothers is urgently needed. High-quality maternity services, includingskilled attendants at delivery, can save both newborns and their mothers.Early and exclusive breastfeeding protects newborn lives. A recentmeta-analysis has shown that children in Brazil, Pakistan and the Philippineswho were not breastfed were 5.8 times more likely to die by theage of one month than children who received at least some breast milk(12). <strong>The</strong>re should be a skilled attendant at every birth, infection controlfor the newborn, support for exclusive breastfeeding, and identificationof complications. If necessary, the infant should be referred urgently tohigher levels of health care.Child health programmes need to move beyond tackling singlediseases and instead deal with the child’s overall health and well-being.Based on the experiences of Integrated Management of ChildhoodIllness (IMCI), WHO, together with partners, is developing a simple butcomprehensive framework that will guide countries on implementationand scaling-up of effective child health interventions. <strong>The</strong> frameworkhas five components:• A situation analysis to assess variables specific to country or contextsuch as burden of child diseases, socioeconomic status, infrastructure,health system capacity, available resources, political stability andpredictability for investments.• Development and formulation of a concise national child health policywith outcome-oriented strategic directions.• Identification of a set of proven cost-effective child health interventions.• Scaling-up of interventions through a two-pronged approach: increasinghealth system efficiency to serve more children, and engaging familiesand communities more closely in disease prevention and care forsick children.• Ongoing monitoring designed to inform decision-making at operationallevel and support countries and partners in measuring progress.reductions in HIV prevalence among pregnant women aged 15–24 years (where in someAfrican cities it is beginning to decline), by the number of HIV/AIDS orphans (which isforecast to double by 2010), and by increases in condom use in the 15–24-year age group.Some countries could reach the target of reversing the spread of AIDS by 2015, but again, notwithout an unprecedented increase in the level of effort in the worst affected regions.Similar prospects overshadow the other health-related targets and indicators – those relatedto tuberculosis and malaria, improved water sources, improved sanitation, and solid fuel asan indicator of indoor air pollution. While limited progress has been made in some countries,major differences in achievement exist between and within regions and countries. <strong>The</strong>reare major variations in the provision of essential medicines: WHO estimates that 15% of theworld’s population consumes 91% of the world’s production of pharmaceuticals (by value).Overall progress depends on what happens in the world’s largest countries, such as Chinaand India. Above all, success in achieving the health-related MDGs requires much more commitmentand effort between now and 2015 than has been evident since the countdown startedin 1990.<strong>The</strong> other side of the compact: Goal 8Most discussion of the MDGs focuses on Goals 1–7. However, a comprehensive assessmentof progress requires an examination of both sides of the compact. Defining indicators forGoal 8 has been difficult. Indeed, there has been a reluctance on the part of some developed
Millennium <strong>Health</strong> Goals: paths to the future 31Box 2.3 Fighting maternal mortality – making pregnancy saferFor more than 30 million women each year, pregnancy and childbirthmean unnecessary suffering, ill-health or death. More than half a millionwomen die annually of pregnancy-related complications, 99% ofthem in developing countries. Yet most maternal deaths and disabilitiescould be avoided through better-quality health services and good maternalnutrition.Of all health statistics, those for maternal mortality represent someof the greatest disparities between developing and developed countries.<strong>The</strong> lifetime risk of dying from maternal causes in sub-SaharanAfrica is 1 in 16, compared with 1 in 160 in Latin America and 1 in 4000in western Europe. In poor countries, as many as 30% of deaths amongwomen of reproductive age (15–49 years) may be caused by pregnancyrelatedcauses, compared with a rate of less than 1% in Australia,Europe, Japan, New Zealand and North America.Each maternal death is a tragedy. Every year, millions of childrenare left motherless and an estimated one million children die as a resultof the death of their mother. Babies who survive their mother’s deathseldom reach their first birthday. <strong>The</strong> risk of death for children under fiveyears of age is doubled if their mother dies in childbirth.Although the causes of high maternal and perinatal morbidity andways of preventing and treating them are well known, progress in manycountries remains slow. However, some countries – including very poorones – have been successful in reducing maternal mortality. Maternaland newborn deaths can be significantly reduced by the use of evidencebasedmaternal health interventions that are reliable, cost-effective andfeasible, even in poor settings.Through its Making Pregnancy Safer initiative, WHO works withcountries to achieve their Safe Motherhood goals. <strong>The</strong> fundamental ideaof the initiative is to increase the proportion of pregnancies and birthsattended by skilled health personnel. For national policy-makers, themost important issues for improving maternal health are:• Promoting legal reform and community mobilization to enable womento have access to proper care during pregnancy, childbirth and thepostpartum period.• Developing and implementing plans to train and deploy sufficient numbersof skilled health workers, providing them with essential suppliesand equipment, and ensuring that they are present in poor and ruralcommunities.• Ensuring that all women and their newborn babies have access toquality skilled care, including antenatal care; birth care; obstetric emergencycare; postpartum care; newborn care; management of abortioncomplications and post-abortion care; family planning services;adolescent reproductive health education and services; and also safeabortion care, where abortion is legal.• Ensuring that the coverage and use of maternal health services aremonitored, and the findings used to strengthen future activities andimprove the quality of care.• Strengthening research networks and dissemination of critical findingsto improve planning and decision-making regarding critical interventions.countries to endorse the MDGs because of the very existence of Goal 8. Moreover, thecommitment by OECD countries to transfer to low-income countries 0.7% of their annualGNP as a contribution to development assistance (agreed since the early 1970s) has been metby only a very few. <strong>The</strong> average development assistance transfer for OECD countries, as apercentage of GNP, is still extremely low.Three aspects of the partnership for development are seen by most countries as beingparticularly important and offering the chance of progress: the <strong>World</strong> Trade Organization(WTO) round of trade talks at Doha, Qatar, in 2001 (although the September 2003 ministerialconference discussions in Cancun, Mexico, must also be considered), the Monterrey Consensuson development financing, and the Highly Indebted Poor Country (HIPC) Initiativeon debt relief. <strong>The</strong>ir importance has both substantive and symbolic elements: substantivebecause of the influence of trade, debt and development assistance on national economies;and symbolic because of the need to build trust in an increasingly polarized debate betweendeveloped and developing countries around roles and responsibilities for development.TradeFive issues continue to dominate the trade and development agenda: the Trade-Related Aspectsof Intellectual Property Rights (TRIPS) agreement and public health; trade in healthservices; tariffs and subsidies for agriculture and market access for non-agricultural products;aligning special and differential treatment with national development priorities; andcapacity strengthening in least developed countries. <strong>The</strong> first two issues have an obvious anddirect impact on health. <strong>The</strong> others are equally important, in the light of their impact on theeconomies of the developing world.
32 <strong>The</strong> <strong>World</strong> <strong>Health</strong> <strong>Report</strong> 2003Following the ground-breaking Doha Declaration on the TRIPS Agreement and Public <strong>Health</strong>in 2001, WTO members reached consensus in August 2003 on implementation of the issue ofaccess to medicines by countries with little or insufficient capacity for pharmaceutical production.<strong>The</strong> full impact of the agreement will depend on how effectively it can be implementedin countries.Development assistanceAchievement of the MDGs is unlikely in the absence of a significant increase in developmentassistance. <strong>The</strong> most commonly quoted overall figure is an annual increase of US$ 50 billion,roughly double current levels (3). <strong>The</strong> Commission on Macroeconomics and <strong>Health</strong> estimateof the requirements for investments, primarily in the health sector, was a total annualfigure for development aid of US$ 27 billion – implying at least a four-fold increase in currentdonor spending on health. Given these estimates, the response has generally been modest,and only a few donor countries have made significant progress towards the 0.7% GNPtarget. Despite overall trends, however, spending on health and combatting AIDS has increased.Another significant trend is the move towards innovative financing mechanisms,such as the United States Millennium Challenge Account; the Global Fund to Fight AIDS,Tuberculosis and Malaria; and the International Financial Facility proposed by the Governmentof the United Kingdom.DebtMore than six years after its launch, it is clear that the HIPC Initiative has had only limitedresults. By March 2003 only seven countries had reached their completion point, grantingthem a 90% reduction in the net present value of their debt service from official creditors. Insome HIPC countries, even the modest gains from debt relief have been offset by falls inexport earnings owing to deteriorating terms of trade. While the arguments continue aboutthe advantages and disadvantages of the various approaches to debt relief, it is evident that alarge and ongoing debt burden acts as a significant counterweight to development assistance,and is a major constraint to increases in domestic funding for human development. Moreover,out of 82 countries eligible for the Poverty Reduction and Growth Facility/HIPC/PovertyReduction Strategy Paper process, only seven have been through the entire process duringthe last seven years, which may jeopardize the effectiveness of the debt relief initiative toreduce poverty rapidly.In summary, an overview of progress towards Goal 8 – even in the absence of robust indicators– presents a picture similar to that for Goals 1–7. Much greater efforts are required if theglobal commitments are to be met. Monitoring issues and progress in relation to Goal 8 needto be placed high on the MDG agenda.<strong>The</strong> Millennium Development Goals in practiceWhile there is little doubt that the MDGs represent an important opportunity for promotingimproved health outcomes for poor people, they are the product of a political process and arean imperfect instrument. Several questions and issues have arisen from the practical experienceof using the MDGs. Some represent areas in which improvements should be made inthe future.
Millennium <strong>Health</strong> Goals: paths to the future 33Who owns the MDGs?National ownership is an important issue. <strong>The</strong> power and purpose of the MDGs is that theyrepresent a means by which people can hold authorities accountable (for this reason, accessiblereports in local languages are a key part of the United Nations strategy). <strong>The</strong>re is a risk,however, that the MDGs are seen by some developing countries as being of primary concernto donors; they may be perceived to be a new form of conditionality and too restrictive intheir scope to cover the multifaceted nature of development. <strong>The</strong> second concern also encompassesthe fear that an exclusive focus on the MDGs indicates a rejection of the goals ofother United Nations conferences (see the discussion on reproductive health below).Maintaining a genuine political consensus in the face of these fears is a critically importantchallenge.How flexible is the approach?Many countries argue that the targets should be adapted more closely to their level of development,questioning the point of striving towards a goal that has little chance of being achieved.Other countries recognize the value of targets, but want to make them more ambitious orbroaden their scope (sometimes referred to as MDG Plus). Some countries argue that it isinappropriate in many parts of the world to concentrate on communicable diseases, giventhe rapid increases in the effects of noncommunicable diseases, tobacco-caused illness andinjuries on the health of poor populations (see Box 2.4). <strong>The</strong> current health-related goals,targets and indicators of the MDGs only partially reflect the rapid transition of the diseaseburden in developing countries. <strong>The</strong>re is an increasing call for a set of regional and globalgoals with timed targets for noncommunicable diseases and their risk factors, neuropsychiatricdisorders and injuries.Clearly there is a need to strike a balance between the need for comparability between countriesand the need to ensure relevance (and ownership). If standardized indicators are used,there is no reason, in principle, why countries should not be able to report on their own aswell as international targets; as with the MDGs, timed noncommunicable disease targets andpractical policies would require focus and commitment by the international health community.WHO will push for a more ambitious and more complete set of global health goalsand targets.Box 2.4 Millennium Development Goals in eastern EuropeEastern Europe is not usually the main focus of the debate about developmentin general and the Millennium Development Goals (MDGs) inparticular, although a number of eastern European countries now haveper capita incomes comparable to those in developing countries inthe African and South-East Asia Regions. Much of today’s low level ofeconomic development is the result of the substantial drop in outputduring the decade following the transition to market economies.Strong national and international commitment is required if easternEurope is to reach the poverty reduction goal by 2015. Whether thiscan be achieved depends, among other things, on the degree to whichprogress towards the other MDGs is achieved and on whether theselected indicators for the other goals match the priority areas for EasternEurope. <strong>The</strong>re is some evidence to suggest that the latter may not bethe case in regard to health-related indicators (13).In the developing countries of sub-Saharan Africa and the South-East Asia Region the key health problems revolve around issues of childand maternal health as well as infectious diseases, but this is not thecase in most eastern European countries, where relatively high adultmortality and noncommunicable diseases account for the largestburden of disease. In the special case of eastern Europe, the use ofadditional health indicators (such as life expectancy) would thereforebe useful.
34 <strong>The</strong> <strong>World</strong> <strong>Health</strong> <strong>Report</strong> 2003How pro-equity are the MDGs?<strong>The</strong> most serious criticism is that the health-related goals, unlike many of the other MDGs,are expressed in terms of national averages rather than gains among poor or disadvantagedgroups. Significant progress in non-poor groups can result in the achievement of goals withonly minor improvements in the health status of the poorest (14). <strong>The</strong> questions then arise:how pro-equity is any progress towards the MDGs? How do lower income groups benefitrelative to higher income groups? Different policy choices within the MDG agenda can producevery different social distributions of health benefits. Efforts to reduce under-five mortalityin Latin America in the 1990s, for example, distributed gains very differently to thepoorest and richest population quintiles in various countries. Guatemala’s pro-equity policiesled to the greatest decreases in child mortality occurring among the country’s poorestpeople. Other countries, however, saw the under-five mortality situation of the poorest familiesworsen relative to outcomes among the richest, even as aggregate national averages improved(11). Thus the capacity to disaggregate health data by criteria such as income levelbecomes crucial to informed policy-making. This requirement must be taken into account inthe design of health information systems at country level.Measuring progressAlthough the MDGs and targets were agreed during the political process that forged theMillennium Declaration, the associated indicators were decided on after the event. Manypeople regard the indicators for the health targets as unsatisfactory. Some indicators includemore than one entity to be measured; some are not disaggregated for the population affectedby, or vulnerable to, the targeted disease; some are costly to collect; and others have poorlydefined numerators or denominators. Some improvement has been made possible by theinclusion of additional indicators, for example on overall healthy life expectancy, to complementdisease-specific mortality, but these additions still have only the status of footnotes.<strong>The</strong>re is a reluctance to open up the process to change – at least until a fundamental reviewhas taken place in 2005.Reproductive health<strong>The</strong> International Development Goals that preceded the MDGs made explicit reference tothe provision of reproductive health services, based on goals and targets agreed at the InternationalConference on Population and Development, held in Cairo, Egypt, in 1994 (15).<strong>The</strong>se are not included in the MDGs. <strong>The</strong>ir absence concerns many who fear that the gainsachieved in Cairo and at the five-year follow-up (ICPD+5) may be lost. In practice, severalkey dimensions of reproductive health feature in the MDGs – such as maternal health, childhealth (including health of the newborn) and HIV/AIDS. Within WHO, in response to aresolution of the <strong>World</strong> <strong>Health</strong> Assembly (16), a strategy for accelerating progress towardsthe attainment of international development goals and targets related to reproductive healthis currently being prepared.<strong>Health</strong> systems strengthening<strong>The</strong> MDGs do not specifically deal with health systems strengthening, and this fact has drawncriticism. It is clear that in many low-income and middle-income countries the health-relatedMDG targets will not be attained – or, more importantly, sustained – in the absence ofsignificant strengthening of their health systems. Yet the goals highlight core, long-term health
Millennium <strong>Health</strong> Goals: paths to the future 35issues for countries, and some of the indicators, on maternal mortality for example, can serveas proxy markers for the efficacy of the health care system as a whole. <strong>The</strong> MDG conceptrequires simultaneous progress on a broad front. <strong>The</strong>re is clearly little chance of makingsimultaneous significant gains in child and maternal health, HIV/AIDS, tuberculosis andmalaria, and better access to the right drugs, without adequate investment in health systems.A concerted effort to tackle health systems constraints on a scale commensurate with theextent of the problem is central to achieving the MDGs and other health goals. <strong>The</strong> key issuesto be confronted are discussed in Chapter 7.Concurrently, cross-cutting issues that are not directly connected to health care reform aresignificant for health-related outcomes. <strong>The</strong>se issues include water and sanitation, transport,and the relationship between several of the MDGs and human rights. This relationship –particularly in respect of the poor – has recently received attention from the United NationsSpecial Rapporteur on the Right to <strong>Health</strong> (17).<strong>The</strong> MDGs and WHODefining the place of the MDGs in WHO<strong>The</strong> MDGs are assuming increasing strategic importance for many international organizations.For governments and development agencies they provide a focus and a way of bothreorienting work and defining parameters for accountability. WHO places great emphasis onsupport to countries and development partners in their efforts to achieve the health-relatedMDGs. Some progress has been made, for example, in improving access to essential medicinesin countries in each of the six WHO regions (see Box 2.5).However, this focus on the MDGs does not preclude work on topics or in countries that donot have a direct link to the goals, nor is work on the MDGs confined to those activities of theOrganization (such as child health or HIV/AIDS) that are specifically mentioned in one ormore goal or target. In this sense, much of the remainder of this report relates to the MDGs.<strong>The</strong> concept of MDGs represents outcomes, achieved through a wide variety of healthactions. But, as has been said about policy development: if it is everything, then it risksbeing nothing.Box 2.5 Assuring quality of drugs for HIV/AIDS, tuberculosis and malariaBefore 2001, the United Nations and other procurement agencies lackeda coordinated quality assessment system for HIV/AIDS drugs. As effortsaccelerate to scale up access to treatment for people living with HIV/AIDS, and as less expensive generic medicines for low-income countriesbecome more easily available, an agreed process for ensuring that thesemedicines are of acceptable quality will become the basis for increasingprocurement volumes (18).A pilot system was started by WHO in collaboration with otherUnited Nations organizations (UNICEF, UNFPA and UNAIDS) in March2001 to assess the compliance of HIV/AIDS drugs with internationalstandards, and thus their suitability for procurement by United Nationsagencies. <strong>The</strong> process involved:• evaluating product information supplied by manufacturers;• inspecting manufacturing sites;• conducting random follow-up quality checks of previously assessedproducts.More than 250 product dossiers from different innovator andgeneric manufacturers have been assessed: an increasing number nowmeet the norms and standards required by WHO. <strong>The</strong>se changes arereflected in the most recent edition of the list of prequalified productsand manufacturers, published and regularly updated on the WHO website (http://www.who.int/medicines/organization/qsm/activities/pilotproc/pilotprocmain.shtml). This list now includes 50 antiretrovirals (including22 generics), comprising 44 monocomponent products, 5 double combinationsand 1 triple combination. <strong>The</strong> initiative has also started onprequalification of malaria and tuberculosis medicines and is makingconsiderable progress.
36 <strong>The</strong> <strong>World</strong> <strong>Health</strong> <strong>Report</strong> 2003Three principles will guide WHO’s work in relation to the MDGs. First, WHO will work withcountries to help them develop and work towards a more complete set of health goals that arerelevant to their particular circumstances. Second, WHO will give special priority to helpingcountries develop goals and plans to ensure that deprived groups share fully in progress towardsthe health-related MDGs (by, for example, ensuring that the percentage improvementin conditions among people below a country’s poverty line is at least as large as the percentageimprovement in the national average). Third, at the global level, WHO will vigorouslyadvocate that developed countries live up to their part of the compact, especially by acting onthose elements of Goal 8 that are of central importance to the MDGs.In practical terms, WHO will carry out this work as follows:■ Normative and technical work. WHO supports national efforts to achieve the MDGsthrough an extensive body of normative and technical work in the areas of maternal health,child health, HIV/AIDS, tuberculosis, malaria, water and sanitation, access to medicines,health systems, and environmental health, as well as work on health-related developmentalissues such as trade, debt, development assistance and human rights. While all of theseareas are important, the challenge of making more rapid progress in child and maternalhealth means that these objectives demand increasing attention.■■Tracking progress and measuring achievements. WHO has worked closely with other organizationsof the United Nations system to identify indicators associated with each healthrelatedMDG and target. <strong>The</strong>re has also been significant progress in establishingcomplementary and coherent reporting procedures. <strong>The</strong> United Nations DevelopmentProgramme, the United Nations Population Division and the <strong>World</strong> Bank are using thedatabases of UNAIDS, the United Nations Children’s Fund and WHO as their main sourcesof health information in relation to the goals. WHO’s work on MDG reporting complementsother efforts to improve the quality of country health data. It also aims to buildcapacity in countries to collect, analyse and, most critically, act on information collected.A framework to improve the quality of health statistics has been developed on the basis offive criteria: validity, reliability, cross-population comparability, data audit traceability,and consultation with national authorities. <strong>The</strong> sources, methods and full developmentcycle of any published figures have been made more transparent, and explicit data audittrails are now publicly available and open to peer review.WHO will report on 17 of the health-related MDG indicators. WHO also monitors corehealth indicators, as well as indicators for other areas of public health that help explainprogress (or lack of it) in the achievement of specific goals at country level. <strong>The</strong>se includeimmunization coverage for new antigens, prevalence of risk factors for noncommunicablediseases, effectiveness of interventions against these diseases, and impoverishment of householdsthrough health payments. WHO is working with partners to develop the <strong>Health</strong>Metrics Network, which will help strengthen health information systems and thus supportthe monitoring of MDG indicators (see Chapter 7).Strengthening technical collaboration. Support in this area will come from all parts ofWHO and will be articulated in individual country cooperation strategies. StrengtheningWHO’s presence in countries is a major priority for the years ahead, and collaborationwith countries on meeting MDG targets will be a central thrust of WHO’s commitment tohelp bring measurable health improvements on the ground.
Millennium <strong>Health</strong> Goals: paths to the future 37Working with othersWHO is an active supporter of the United Nations core strategy for achieving the MDGs.This strategy has four components: the independent Millennium Project, operational supportby the United Nations country teams at country level, millennium reporting, and theMillennium Campaign.<strong>The</strong> Millennium Project conducts research on, and analysis of, the strategies needed to achievethe MDGs. Over a period of three years, its 10 task forces will work on the operational priorities,organizational means of implementation, and financing necessary to reach the goals.Preliminary work produced by the project has been used in preparing the Human developmentreport 2003. A key role of the Millennium Project, as for the Commission on Macroeconomicsand <strong>Health</strong>, will be generating a clear set of messages and making them available to apolitical audience which may otherwise be unfamiliar with development issues. Recent interactionwith project managers suggests that an additional task force should focus on healthsystems development issues.Operational support for achieving the MDGs is provided by United Nations country teams.<strong>The</strong> MDGs have now become an integral part of the instruments – notably the CommonCountry Assessment and the United Nations Development Assistance Framework – used byUnited Nations agencies for planning and programming their work. In addition, WHO contributesto the preparation of national MDG reports and will work with national authoritiesto act on their recommendations. Intended for a general audience, the public and local media,the reports focus on progress and constraints and are seen as a means of increasing governmentaccountability. More than 40 have been published so far.<strong>The</strong> Millennium Campaign aims to raise public awareness of, and political commitment to,the MDGs in both developed and developing countries.Recognizing the need to keep the health-related MDGs high on the political agenda, the creationof the High-Level Forum on <strong>Health</strong>, Nutrition and Population Related MDGs has beenproposed. <strong>The</strong> Forum will act as an umbrella body, taking an interest in a wide range ofactivities that contribute to the achievement of the MDGs. It will provide a structured opportunityfor senior officials from donor agencies and national governments to review progressover the whole range of health-related MDGs (but will not itself have any responsibility formonitoring). It will promote lesson learning across countries and regions; it will seek to createlinks and interaction – particularly between global health partnerships and national povertyreduction strategies; and it will identify opportunities and make recommendations foractions to be taken by others.Accelerating progress<strong>The</strong> MDGs represent a worldwide commitment to reduce poverty and hunger and to tackleill-health, gender inequality, lack of education, access to clean water and essential medicines,and environmental degradation. Improvements in health are important in their own right asdevelopment goals, and are also seen as major contributors to economic growth and povertyreduction.<strong>The</strong> MDGs stand apart from previous sets of international development policy objectives.First, they are explicitly interdependent and interrelated: success in achieving one is dependenton efforts to achieve the others. Second, the targets set out under the first seven goals are
38 <strong>The</strong> <strong>World</strong> <strong>Health</strong> <strong>Report</strong> 2003one side of a development partnership. Achievements by developing countries depend onenabling actions by the developed world – in trade, development assistance, debt relief andtechnology transfer – to complete the other half of the compact. <strong>The</strong>se actions are includedin Goal 8.Despite political consensus and commitment, many of the MDGs will not be achieved unlessthere is a major increase in effort by all stakeholders. Halfway between the base year of 1990and the target date of 2015, current rates of progress suggest that in sub-Saharan Africa thegoal of reducing childhood mortality by two-thirds, for example, will not be reached thiscentury, let alone in the next 12 years. Moreover, even among countries making substantialprogress toward the MDGs, aggregate national gains can be deceptive. It is increasingly evidentthat significant progress in non-poor groups can result in the achievement of goals withonly minor changes in the health status of the poorest.<strong>The</strong> MDGs are a means by which people can hold authorities accountable. This will be possible,however, only if the goals are accepted as legitimate, and are owned, by all concerned.Developed countries must fulfil their side of the MDG compact, showing that the MDGs arenot a control mechanism imposed by donors, but the start of a new international collaborationto foster, more equitably, essential human capabilities.This chapter and subsequent parts of this report show that there is much that can be done toaccelerate progress. It is possible to scale up efforts to confront the AIDS pandemic, to reducethe risk of death in childbirth, to ensure the survival of children and to strengthen the healthinfrastructure needed for gains toward the MDGs and other health objectives.Chapter 1 confirmed HIV/AIDS as the leading cause of death among young adults. Thischapter has shown how important a part it plays in the MDGs. <strong>The</strong> next chapter describeshow HIV/AIDS has changed the world – sub-Saharan Africa in particular – during the last 20years, why it now represents a global health emergency, and how it can be brought undercontrol.
Millennium <strong>Health</strong> Goals: paths to the future 39References1. United Nations Millennium Declaration. New York, NY, United Nations, 2000 (United Nations GeneralAssembly resolution 55/2; http://www.un.org/millennium/declaration/ares552e.pdf, accessed 22 September2003).2. Road map towards the implementation of the United Nations Millennium Declaration. New York, NY, UnitedNations, 2002 (United Nations General Assembly document A56/326).3. <strong>Report</strong> of the International Conference on Financing for Development, Monterrey, Mexico, 18–22 March 2002.New York, NY, United Nations, 2002.4. <strong>Report</strong> of the <strong>World</strong> Summit on Sustainable Development, Johannesburg, South Africa, 26 August–4 September2002. New York, NY, United Nations, 2002.5. Development Assistance Committee of the Organisation for Economic Co-operation and Development.Shaping the 21st century: the contribution of development co-operation. Paris, Organisation for Economic Cooperationand Development, 1996.6. Human development report 1990: concept and measurement of human development. New York, NY, OxfordUniversity Press for the United Nations Development Programme, 1990.7. What is human development? New York, NY, United Nations Development Programme (http://hdr.undp.org/hd/default.cfm, accessed 23 September 2003).8. Sen A. Development as freedom. Oxford, Oxford University Press, 2001.9. Commission on Macroeconomics and <strong>Health</strong>. Macroeconomics and health: investing in health for economicdevelopment. Geneva, <strong>World</strong> <strong>Health</strong> Organization, 2001.10. United Nations Development Group. Financing the development goals: an analysis of Tanzania, Cameroon,Malawi, Uganda and Philippines. Summary <strong>Report</strong> prepared by United Nations Development Programme,2002 (http://www.undg.org, accessed 24 September 2003).11. Minujin A, Delamonica E. Mind the gap! Child mortality differentials by income group. In: Cornia GA, ed.Harnessing globalisation for children: a report to UNICEF. Florence, UNICEF Innocenti Research Centre,2002.12. WHO Collaborative Study Team on the Role of Breastfeeding on the Prevention of Infant Mortality. Effectof breastfeeding on infant and child mortality due to infectious diseases in less developed countries: apooled analysis. Lancet, 2000, 355:451–455.13. Rechel B, Shapo L, McKee M. Appropriate health related Millennium Development Goals for the Europe andCentral Asia Region: impacts and policy implications. Washington, DC, <strong>World</strong> Bank (in press).14. Gwatkin D. Who would gain most from efforts to reach the Millennium Development Goals for health? Aninquiry into the possibility of progress that fails to reach the poor. Washington, DC, <strong>World</strong> Bank, 2002 (HNPDiscussion Paper).15. <strong>Report</strong> of the International Conference on Population and Development, Cairo, 5–13 September 1994(http://www.iisd.ca/linkages/cairo.html, accessed 23 September 2003).16. WHO’s contribution to achievement of the development goals of the United Nations Millennium Declaration.Geneva, <strong>World</strong> <strong>Health</strong> Organization, 2002 (<strong>World</strong> <strong>Health</strong> Assembly resolution WHA55.19; http://www.who.int/gb/EB_WHA/PDF/WHA55/ewha5519.pdf, accessed 23 September 2003).17. Economic, social and cultural rights: the right of everyone to the enjoyment of the highest attainable standard ofphysical and mental health. Geneva, United Nations Commission on Human Rights, 2003 (documentE/CN.4/2003/58; http://www.unhchr.ch/Huridocda/Huridoca.nsf/0/9854302995c2c86fc1256cec005a18d7/$FILE/G0310979.pdf, accessed 23 September 2003).18. Prequalification of HIV drugs: access to generic antiretrovirals. WHO Drug Information, 2003, 17:160–164.
40 <strong>The</strong> <strong>World</strong> <strong>Health</strong> <strong>Report</strong> 2003
HIV/AIDS: confronting a killer 41Chapter ThreeHIV/AIDS:confronting a killerToday HIV/AIDS is a major global health emergency, affectingall regions of the world, causing millions of deaths and sufferingto millions more. But access to effective prevention andtreatment varies widely. This chapter examines what can andmust be done to narrow this gap, and to combat the diseasein even the poorest countries. It suggests an aggressive strategyfor global action against the HIV/AIDS pandemic thatunites the efforts of WHO and its partners from many sectorsand effectively combines prevention and care.
42 <strong>The</strong> <strong>World</strong> <strong>Health</strong> <strong>Report</strong> 2003
HIV/AIDS: confronting a killer 433HIV/AIDS:confronting a killerAcquired immunodeficiency syndrome (AIDS) is the leading infectious cause of adult deathin the world. Untreated disease caused by the human immunodeficiency virus (HIV) has acase fatality rate that approaches 100%. Not since the bubonic plague of the 14th century hasa single pathogen wreaked such havoc. AIDS has torn apart families and caused untold sufferingin the most heavily burdened regions. In hard-hit areas, including some of the poorestparts of the world, HIV has reversed gains in life expectancy registered in the last three decadesof the 20th century. HIV/AIDS is a major global health emergency.HIV infection also fuels other epidemics of global concern – most notably tuberculosis, whichhas become a leading cause of death not only among people living with HIV, but also amongtheir HIV-negative family members and contacts. But AIDS is not the same everywhere. Accessto effective prevention and treatment, and consequently the fates suffered by individualsinfected with HIV, vary widely. People living with HIV but benefiting from the latest medicaldevelopments can hope to lead normal lives in many respects: the use of combination chemotherapywith antiretroviral agents (ARVs) renders AIDS a chronic and treatable disease morelike diabetes than other serious viral diseases for which there are no effective therapies (seeFigure 3.1). In Australia, Europe, Japan and the United States of America, many people withadvanced AIDS have resumed their normal lives. In poorer countries, however, and amongthe poor living in wealthy societies, HIV remains a death sentence. Over the past decade, the“outcome gap” – the different fates of rich and poor – has widened considerably (1).Why has there been a failure to contain HIV/AIDS? Why have the fruits of modern medicine,including ARVs, not been delivered to those most in need? <strong>The</strong> answer to these two questionsis essentially the same: AIDS is a disease whose impact is much greater where there is povertyand social inequality, including gender inequality. It is not easily managed in settings in whichweakened health systems fail to perform, especially for minorities and those living in poverty.HIV/AIDS thus raises urgent human rights issues, especially concerning the right to healthcare (see Table 3.1).For all these reasons, HIV/AIDS serves as a report card on current global health status: risingincidence and a growing death toll are rebukes to optimism. It is vital that the global healthcommunity makes a bold effort against HIV/AIDS, guided by a commitment to equity inprevention and care.This chapter reviews important trends in the HIV epidemic and the ways in which effectivepartnerships can attack both the pandemic and its root causes. It examines successesand failures in the struggle against the world’s most devastating infectious disease, before
44 <strong>The</strong> <strong>World</strong> <strong>Health</strong> <strong>Report</strong> 2003Figure 3.1 Trends in age-adjusted a rate of death from HIV infection, USA, 1987–2000Deaths per 100 000 population1816141210864201987 1988 1989 1990 1991 1992 1993 1994 1995 1996 1997 1998 1999 2000 bYeara Using the year 2000 US standard population.b Preliminary mortality data for 2000.Source: Centers for Disease Control and Prevention.discussing goals for the coming years. <strong>The</strong>se include narrowing the AIDS outcome gap byproviding three million people in developing countries with combination ARV therapy bythe end of 2005 (known as the “3 by 5” target). Throughout this discussion, HIV/AIDS care isunderstood to include treatment with ARVs. Although robust HIV prevention and care constitutea complex health intervention, such interventions are not only feasible in resourcepoorsettings, but are precisely what is needed.<strong>The</strong> HIV/AIDS epidemic: a brief overviewA new disease emergesAIDS was first described in 1981, when previously healthy young adults – mainly men livingin urban areas of the United States – began falling ill with opportunistic infections previouslyunknown among this age group. Similar infections were soon described in Africa, the Caribbeanand Europe; AIDS was clearly an epidemic disease. Most of these young people died,and a host of discrepant hypotheses emerged, but a bloodborne viral pathogen was suspectedearly on. In 1983, this suspicion was confirmed when Professor Luc Montagnier and othersdiscovered a novel pathogen: a retrovirus tropic for the CD4 cells that orchestrate cell-mediatedimmunity and protect humans from a broad range of viral, mycobacterial, and fungalpathogens.Where effective screening was available, transfusion-associated transmission was eliminated,but HIV was not easily stopped. Condoms were shown to be effective in preventing sexualtransmission of HIV, but it was not long before those who studied AIDS concluded that malecondoms alone would not be enough in settings in which poverty and gender inequalityrendered poor women especially vulnerable to HIV infection (2). Women in turn transmittedHIV to their unborn children or to breastfeeding infants. Injecting drug use introducedHIV to previously untouched regions of the former Soviet Union and to parts of Asia. Poorqualityhealth care – including the reuse of syringes, needles, and other medical paraphernalia– also contributed to the entrenchment of this new epidemic.
HIV/AIDS: confronting a killer 45<strong>The</strong> current situationHow well has the international communitycoped with this new threat to global health?In spite of remarkable scientific achievements– the development of inexpensivediagnostics by the mid-1980s, thesequencing of the entire HIV genome lessthan 15 years later, and the developmentof effective antiretroviral therapy by 1995– the virus has continued to spread (seeFigure 3.2). It is estimated that during thecourse of 2002 some 5 million people becameinfected with HIV, and almost 3 million people died of AIDS.Table 3.1 Coverage of adults in developing countries withantiretroviral therapy, by WHO region, December 2002Region Number of Estimated Coveragepeople needAfrica 50 000 4 100 000 1%Americas 196 000 370 000 53%Europe 7 000 80 000 9%Eastern Mediterranean 3 000 9 000 29%South-East Asiaand Western Pacific 43 000 1 000 000 4%All WHO regions 300 000 5 500 000 5%Everywhere in the world, HIV is transmitted through a fairly limited number of mechanisms.HIV is a bloodborne retrovirus and is transmitted through sexual contact, contaminatedblood transfusions, injecting drug use, failure to observe what are now termed in medicalcircles “universal precautions”, and from mother to infant during pregnancy, delivery andbreastfeeding.<strong>The</strong> most heavily burdened continent is Africa, where the spread of the pandemic has beenaccelerated by a variety of factors, including widespread poverty, gender inequality, and healthsystems weakened by pressures such as the large external debt loads of states. Africa is hometo more than 70% of those currently infected with HIV. Of all AIDS deaths worldwide – 28million at the end of 2002 – the majority have also occurred on this continent (3). HIV infectionhas fanned epidemics of TB in some African countries, increasing the risks to the wholepopulation, regardless of serostatus. Across sub-Saharan Africa, rates of TB have more thantrebled, and many conclude that the disease cannot be controlled without aggressive treatmentof AIDS (4).Debates about the relative importance of different modes of HIV transmission in sub-SaharanAfrica persist, but the evidence indicates that HIV in this region is primarily a sexuallytransmitted pathogen (5). Nonetheless, the difficulties involved in following universal precautionsin overburdened and under-resourced health care facilities may lie at the root ofmany AIDS deaths in Africa (6). In many regions, unsafe blood transfusions continue, underscoringthe importance of blood safety as a component of effective HIV/AIDS control.<strong>The</strong> immensity and rapidity of the spread of HIV have reversed gains in life expectancy inmany African countries (see Chapter 1). But the worst may be yet to come. <strong>The</strong> poorer regionsof Asia, including densely populated southern Asia, are the latest areas to be affected bythe emerging AIDS epidemic. <strong>The</strong>re has been an alarming rise in HIV/AIDS cases in Asiaover the past two decades; the burden of disease and death in the region will be enormous ifcurrent epidemiological trends are not slowed or reversed.Developed countries are also afflicted. <strong>The</strong> Russian Federation and Ukraine, along with othercountries in eastern Europe and countries in central Asia, have the most rapidly expandingHIV epidemics. Here the disease is more closely tied to injecting drug use, which itself islinked to a rapid rise in indices of social inequality (3). Although the absolute number ofAIDS cases in the former Soviet Union remains relatively small, the epidemic is expandingrapidly in the Russian Federation and other countries in the region (see Box 3.1). Prisonseatedepidemics of TB, including drug-resistant strains, will be further fanned by therapid rise in HIV incidence already documented among Russian prisoners. Only aggressive
46 <strong>The</strong> <strong>World</strong> <strong>Health</strong> <strong>Report</strong> 2003harm-reduction efforts and improved therapy for TB can stem what is a peculiarly modernepidemic of two linked diseases that are now colliding within countries reaching from westernEurope to the Pacific Ocean (7).<strong>The</strong> true toll of HIV/AIDS<strong>The</strong> epidemiology of HIV, including the dynamics of risk, is instructive. But epidemiologytells only part of the story. A disease that has so adversely affected life expectancy will alsotake a great toll on the social fabric of heavily burdened societies, above and beyond itsterrible cost in immediate human suffering. To take two examples, AIDS has orphaned anestimated 14 million African children and will decimate the corps of teachers, health careworkers and civil servants in the hardest-hit countries (8).<strong>The</strong>se social disruptions are manifest in direct economic effects. A recent <strong>World</strong> Bank studypredicts that South Africa will face “complete economic collapse … within three generations”if the country does not take effective measures to combat AIDS (9). But there is much moreto the story than can be measured by economists. Other social scientists are broadening theanalysis to look at the impact of the disease on an array of events and processes. What, forexample, are the social consequences of having millions of AIDS orphans? How does thedisappearance of so many parents contribute to the spread of armed conflict and the socialpathologies that accompany urban migration and attendant unemployment? What is thecost of the “burnout” registered among health professionals across Africa and in other settingswhere AIDS therapy is not available to those who need it most (10)? Science is onlybeginning to understand the social and economic toll of HIV/AIDS, which is heaviest inprecisely those settings least prepared for a new threat to health and well-being.Figure 3.2 HIV/AIDS: episodes in an evolving epidemicNumber of people living with HIV/AIDS (millions)454035302520151050First cases of unusualimmune deficiency identifiedamong gay men in USAAcquired ImmunodeficiencySyndrome (AIDS) first definedHuman ImmunodeficiencyVirus (HIV) identified ascause of AIDSAfrican heterosexualAIDS epidemic revealedFirst HIV antibody test approved in USA.HIV screening of blood donations startsCases of HIV/AIDS nowreported in all world regionsWHO launches SpecialProgramme on AIDSAzidothymidine (AZT)approved for use in USABrazil provides antiretroviral therapythrough its public health systemUNAIDS createdHighly Active Antiretroviral<strong>The</strong>rapy (HAART) first discussedOutbreak in eastern Europe detectedamong injecting drug usersFirst treatment developed to reducemother-to-child transmissionFirst decline in HIVprevalence begins amongpregnant women in UgandaFirst efficacy trial of a potentialHIV vaccine starts in ThailandUN Security Council holds itsfirst discussion of HIV/AIDSUN Secretary-General Kofi Annancalls for creation of a global fundon AIDS and healthUN General Assembly adoptsHIV/AIDS Declaration of CommitmentLaunch of Global Fund to fight AIDS,Tuberculosis and Malaria (GFATM)WHO backs "3 by 5" targetof ARV treatment for3 million people by 2005WHO declares ARV treatmentgap a global health emergency1980 1981 1982 1983 1984 1985 1986 1987 1988 1989 1990 1991 1992 1993 1994 1995 1996 1997 1998 1999 2000 2001 2002 2003YearSource: WHO/UNAIDS
HIV/AIDS: confronting a killer 47Responding to HIV/AIDS:lessons from the past 20 years<strong>The</strong> first two decades of HIV have disclosed a great deal about how best to prevent and attenuateHIV-related suffering. <strong>The</strong>re are large and small successes to report, but also welldocumenteddefeats with important lessons. <strong>The</strong>re are emerging trends. <strong>The</strong>re are importantlocal variations which render broad generalizations about the global AIDS pandemic extremelyhazardous. What can be documented now are a series of interconnected“subepidemics”. Each calls for a different set of interventions. Fortunately, the experiencegained over the past 20 years offers guidance for those seeking to reverse the trends.One of the most important lessons of recent years is the need for integrated AIDS preventionand care. Equity in AIDS prevention requires that correct and culturally appropriate informationbe imparted, along with existing prevention tools, to those most at risk of HIV infection,wherever they live. WHO considers inclusive and equitable prevention a fundamentalpart of its AIDS work. While there are studies emphasizing the need for constant efforts topromote safer sex and good medical practice, there are no data to support the claim thatincreased access to AIDS care hampers prevention efforts in the resource-poor settings inwhich HIV takes its greatest toll. On the contrary, emerging evidence from ARV programmesin resource-poor settings such as central Haiti and Khayelitsha, South Africa, suggests thatimproving care will serve directly to strengthen prevention in a number of ways. <strong>The</strong>se include:increasing demand for voluntary counselling and testing; reducing stigma and promotinggreater openness in discussions of HIV/AIDS in the community; and helping to keepfamilies intact and economically stable, thus slowing the growth of at-risk populations suchas orphans and sex workers (11–15).What accounts for the often stark division between AIDS prevention and care, which in thedeveloping world has meant that, for most people living with HIV, there is simply no decentmedical care available at all? That it took 15 years to develop effective antiretroviral therapyfor AIDS is regarded as a success by some; for the tens of millions who have died of AIDS, anyvictory has come too late. But the fact that much was known about HIV and its modes oftransmission well before effective therapy became available contributed, in both rich andpoor countries, to a separation of HIV prevention and care. In Australia, Europe andthe United States, HIV prevention and care are different enterprises conducted by differentgroups of people (16). HIV prevention does not usually take place in AIDS clinics in wealthyBox 3.1 HIV/AIDS in the European Region<strong>The</strong> European Region is experiencing the fastest growing HIV epidemicin the world, and significant further growth is likely. Between 1995 and2003, the number of newly reported HIV infections in western Europedoubled to almost 170 000, and in central and eastern Europe grewfrom 27 000 to 320 000. It is now estimated that at least 1.7 millionpeople in Europe are already infected with HIV.An epidemic of injecting drug use is fuelling the HIV epidemic. Inthe former Soviet Union, where two-thirds of all Europeans infectedwith HIV live, 84% of all HIV cases with a known transmission route areattributable to injecting drug use. In western Europe, sexual transmissionis the dominant route, with the largest number of infections amongmen who have sex with men and among immigrant populations fromhigh prevalence countries.<strong>The</strong> HIV/AIDS epidemic has changed dramatically since its onset inthe 1980s. Sustainable, long-term, comprehensive and massive responsein western Europe, with extensive funding and political support for prevention,treatment and care limited the spread of the epidemic. Widespreadprevention measures contributed to stabilizing and decreasingtransmission rates, while antiretroviral treatment was also made widelyavailable. In spite of such measures, the HIV/AIDS epidemic remains aserious and ongoing challenge in western Europe. In eastern Europe,limited political commitment and funding, low coverage by preventionservices, severely limited access to treatment and care and high levels ofstigmatization of groups at risk are the main reasons for a continuouslyworsening HIV epidemic.
48 <strong>The</strong> <strong>World</strong> <strong>Health</strong> <strong>Report</strong> 2003countries. In many poor countries, however, HIV prevention does take place in clinics, althoughHIV care often does not take place at all.<strong>The</strong> results of this separation have been adverse. Although there have been some significantvictories, their benefits have been unevenly distributed. Despite striking declines in mortalityrates adjusted for age among some people living with AIDS, affluent countries still face ongoingor growing subepidemics. As elsewhere, rates of HIV transmission vary by social standing.In the southern United States, for example, HIV continues disproportionately to affectethnic minorities in urban conglomerations. Increasingly, poor black people living in ruralareas connected by major routes of commerce are also affected. Research conducted in ruralNorth Carolina suggests that the incidence of sexually transmitted infections (STIs) is closelylinked to the presence of an interstate highway (17). Similar patterns have also been documentedin rural parts of Africa and Asia. Even when local epidemiology differs, social inequalitiesremain part of the equation for both risk of infection and access to care. In urbanareas of the Russian Federation and Ukraine, in contrast to rural southern areas of the UnitedStates, a rapidly emerging epidemic is attributable to injecting drug use; among those mostaffected are the unemployed and, again, members of ethnic minorities.Integrating HIV prevention and carePrevention activities need to be designed with the local epidemiology of the disease in mind.In settings in which HIV is largely sexually transmitted, information and education campaignscan save lives. In Thailand, for example, it is estimated that aggressive condom promotiontargeting military personnel and sex workers has resulted in significantly fewer newinfections than had been predicted (18). In settings in which HIV transmission is linkedmore closely to injecting drug use, harm-reduction strategies (for example, the provision ofclean injecting equipment as well as adequate therapy for drug dependence) have proved tobe effective (19). But in every setting studied, the distinction between prevention and care –most marked in the poorest countries, where few of those in need of HIV care ever receive it– has crippled effective response to the disease and also heightened social stigma.<strong>The</strong> integration of HIV prevention and care is a recurrent and unifying theme of WHO efforts,in spite of the great diversity of subepidemics. In settings where HIV/AIDS is seen notas a private problem but as a public one, good public policy can prevent new infections, aswell as avert death among those already living with HIV. Of course, there is far too muchwork at hand for there to be no division of labour in prevention and care. Clinicians mustensure that their distinctive skills are used optimally to benefit patients. Activists and communitymembers will make their most important contributions to prevention, support, educationand advocacy.It is difficult categorically to class on-the-ground activities as contributing either to “prevention”or “care” exclusively. For example, most people would class the prevention of motherto-childtransmission (pMTCT) of HIV as a prevention activity. But implementing suchprogrammes has often called for improved prenatal care: “MTCT-Plus” initiatives follow upthe initial preventive intervention with ARV treatment for HIV-positive mothers, when clinicallyindicated, allowing women not only to give birth to healthy babies but also to live toraise them (20). Similarly, improving HIV care helps to destigmatize AIDS. Decreased stigmais associated with increased interest in voluntary counselling and testing, which is a cornerstoneof effective HIV prevention and care (13). Some recent studies have begun to cataloguethe mechanisms by which increased access to quality HIV care can strengthen preventionefforts (15).
HIV/AIDS: confronting a killer 49Integrated prevention and care: success storiesOnly a few countries have introduced legislation to protect the rights of those living withHIV, including the right to effective therapy. Brazil is one country that has done so successfully.Although social inequalities exist in Brazil, it became one of the first countries in theworld to mandate universal and free access to HIV care. In this way, AIDS was transformedfrom a private problem, one affecting individuals and their families, to a public one. By introducinginnovative legislation, Brazil was able to build up Latin America’s largest and bestfunctioningAIDS programme. Widespread access to ARVs may have helped to destigmatizethe disease in Brazil and thereby improve demand for voluntary counselling and testing.Although causality is hard to prove, projections made over a decade ago, when it was predictedthat Brazil would have a rapidly expanding epidemic, have not come to pass. HIVincidence has declined in recent years now that ARVs are widely available: only 7361 newcases of HIV infection were registered in the first nine months of 2001, compared with 17 504cases registered in 2000 (21). <strong>The</strong> Ministry of <strong>Health</strong> of Brazil estimates that cost savings forreduced hospital admissions and treatment of opportunistic infections between 1997 and2001 were close to US$ 2.1 billion. <strong>The</strong> Brazilian experience is not unique. In 2003, Mexicopassed legislation similar to Brazil’s and may reasonably hope for similar successes (22). Policycan therefore have an indisputable therapeutic effect on HIV/AIDS.Countries far poorer than Brazil or Mexico have been forced to focus their efforts elsewhere,but can still achieve positive results. In Haiti, the most impoverished country in the Americas,a public–private partnership has introduced culturally appropriate HIV prevention andstate-of-the-art HIV care to a population living in dire poverty. One project in Haiti’s CentralPlateau is a small but mature integrated prevention and care project that first incorporatedcommunity-based ARV use in 1998. Because rural Haiti is a setting in which there are veryfew physicians or nurses, the “HIV Equity Initiative” relies on community health workerscalled accompagnateurs who pay daily visits to patients in their home villages. <strong>The</strong>accompagnateurs (some of whom are themselves living with HIV) are not so much providingdirectly observed therapy as taking care of their neighbours (see Box 3.2).<strong>The</strong> Haiti project has been notable for its clinical and social success – lowered mortality anddecreased stigma – but also for its low costs. With the advent of generic ARVs, the HIV EquityInitiative is now being scaled up throughout the forbidding terrain of central Haiti, which iswithout electricity or paved roads (23). Seroprevalence studies suggest that the Haitian HIVBox 3.2 Accompagnateurs: an example of AIDS care in resource-poor settings<strong>The</strong> existence of effective therapy for AIDS has dramatically altered theoutcome of HIV infection in certain parts of the world, but such advancesare rarely used in precisely those settings most heavily burdenedwith AIDS. Most HIV-related deaths in the developing world today occuramong those who have never received combination chemotherapy withantiretrovirals (ARVs). Reasons offered for this failure have been many,but two are usually given: the high cost of ARVs and the lack of infrastructurerequired for their use. <strong>The</strong> first of these objections is underreview as generic ARVs become available and as the price of brandedpharmaceuticals drops.<strong>The</strong> question of missing infrastructure remains. Experience in Haitiand elsewhere suggests that this may be largely a question of personnelrather than laboratory or medical infrastructure. In settings with fewphysicians and nurses there often exists a large number of underutilizedcommunity health workers. In some settings, a number of people, includingtraditional healers, have expressed an interest in being trainedto “accompany” their neighbours living with AIDS. <strong>The</strong> involvement ofthese and other community-based workers as accompagnateurs will becritical if even modest treatment goals are to be met in the comingyears. <strong>The</strong>re is an important precedent in the community-based managementof a chronic infectious disease. Tuberculosis programmes reportingthe highest cure rates are often those relying on accompagnateursor other community-based providers. <strong>The</strong> amount of training required isminimal; supervision of accompagnateurs may be offered by clinic-basednurses and physicians. If the accompagnateur model is adopted widely,patients afflicted with other chronic diseases may hope for high-qualitymedical care even where there is no doctor (23).
50 <strong>The</strong> <strong>World</strong> <strong>Health</strong> <strong>Report</strong> 2003epidemic is contracting rather than growing (24), although the precise impact of HIV/AIDSprogrammes on the spread of the disease remains to be measured.Uganda is another extremely poor country that has known declining HIV infection rates.Some have claimed that declining prevalence is the result of an aggressive government campaignto advance prevention messages. <strong>The</strong> “ABC campaign” is a social marketing effort topromote abstinence, monogamy (“be faithful” is the B in the acronym) and condom use (25).However, declining HIV prevalence in Uganda involves far more than high-level political willand forceful condom promotion, important as these factors are. Developments in Ugandareflect a complex biosocial pattern that includes war, death, migration, and many other eventsand processes (including, in Kampala and beyond, increased access to ARVs) not necessarilyincluded under the rubric “ABC campaign” (see Figure 3.3). <strong>The</strong> empowerment of womenappears to have been a key factor in enabling safer patterns of sexual behaviour. Civil societygroups such as <strong>The</strong> AIDS Service Organization (TASO) have played a major role. It is alsoimportant to note that post-war Uganda, with help from the European Community and otherfunders, has made significant investments in rebuilding its health care infrastructure (26).Setting a new agendaOn the basis of the rationale for integrating prevention and care, outlined above, this reportsuggests an aggressive strategy for global action against the HIV/AIDS pandemic. This agendawill unite the efforts of partners from many sectors.A human rights approachAlthough some people may have become wary of expressions such as “adopting a humanrights approach to HIV/AIDS”, highly pragmatic steps can be taken to do just that, and theseinterventions will have a salutary effect on AIDS prevention and care. Social and economicrights, including the right to health care, are central to a future in which HIV will play a lessFigure 3.3 Trends in the cost of ARV drugs and the number of people on treatment,Uganda, 1997–200212 00010 0008 0006 0004 0002 00001997 1998 1999 2000 2001 2002YearPrice of first-line regimen in US$ per yearNumber of people on treatment
HIV/AIDS: confronting a killer 51destructive role in people’s lives. Governments should take the lead in promoting a humanrights model of AIDS prevention and care.Promotion of the human rights approach to AIDS cannot remain solely the charge of thenation-state, however, especially as poor and beleaguered governments are exhorted to domore and more with less and less.Civil society organizations, including groups of people living with HIV/AIDS, will continueto play a crucial role in advancing a human-rights-based HIV/AIDS agenda at global, nationaland local levels. Such groups have been at the forefront of HIV/AIDS prevention, education,and advocacy – not only in wealthy countries, but also in Brazil, Haiti, South Africa,Thailand, Uganda and elsewhere. It is important to ensure that some of the new funding nowflowing to HIV/AIDS work through mechanisms such as the Global Fund to Fight AIDS,Tuberculosis and Malaria (GFATM) and bilateral initiatives is channelled to civil society groups,especially community-based organizations run by and for people living with HIV/AIDS.Dimensions of good HIV/AIDS controlAlthough equity is the only acceptable end goal, it is nevertheless true that setting priorities isa key step in the crafting of sound policy. It is possible to identify a number of highly importantconsiderations in implementing projects and national AIDS programmes in resourcepoorsettings.Haiti, one of the world’s poorest countries, again provides insights. Spiralling, entwined epidemicsof TB and HIV and the worst poverty in the Americas did not stop Haiti from puttingtogether a successful application to the GFATM. <strong>The</strong> proposal submitted to the GFATM calledfor expanding integrated HIV prevention and care and was linked to the existing nationalAIDS control plan (27). <strong>The</strong> Haitian model proposes a stepwise implementation, beginningwith improved voluntary counselling and testing and prevention of mother-to-child transmissionand then unfolding progressively in several dimensions. <strong>The</strong> first dimension includesa complete range of prevention services and practices to reduce HIV transmission in all settings.Prevention activities are integrated with improved HIV care for people already infected.Prevention measures include culturally appropriate, community-based HIV education, condomdistribution, and voluntary counselling and testing. This component also embraces bloodsafety and the observance of universal precautions, including safe injection practices.<strong>The</strong> second dimension is improved women’s health, including access to family planning andsafe childbirth. Prevention of HIV transmission from mother to infant will have, as a “windfallbenefit”, the improvement of women’s health in a broader sense. Indeed, it will be easierto meet Millennium Development Goals related to maternal mortality by improving capacityto scale up pilot programmes for the prevention of mother-to-child transmission.<strong>The</strong> third dimension of integrated HIV prevention and care is improved TB case-finding andcare. This is important in communities heavily burdened by both diseases, since in thesesettings – most of southern Africa is a case in point – TB is the leading serious opportunisticinfection among people living with HIV. Finally, the fourth component of this model is thediagnosis and treatment, preferably through algorithms reflecting local epidemiology, of allSTIs. Numerous studies have shown that improving care for STIs will diminish the risk ofacquiring HIV (28–30).Local variation has always been a central factor in the HIV/AIDS story, so the relevance ofany pilot projects should be scrutinized. Can such programmes be scaled up district-wide ornationally? Can they be replicated in other heavily burdened and resource-constrained areas?
52 <strong>The</strong> <strong>World</strong> <strong>Health</strong> <strong>Report</strong> 2003For example, where injecting drug use is the primary mode of transmission, harm reductionwill be central to prevention efforts. <strong>The</strong>re is also a need for greater focus on nutrition as afundamental component of any approach to caring for people living with HIV/AIDS. ButARVs are, without question, required in all settings. <strong>The</strong>re is very little evidence that differentclades of HIV respond differently to combination chemotherapy with ARVs. Preliminaryevidence from small pilot projects across Africa, the Americas and Asia suggest that patientswith advanced HIV infection will respond well to ARVs, regardless of whether clinical orlaboratory criteria are used to assess efficacy.WHO’s work in the HIV/AIDS fightAttacking inequalities of both risk and access to care is central to WHO’s agenda in the HIV/AIDS domain. WHO’s expanded role is far larger than that of merely setting standards foreffective HIV prevention and care. WHO is working actively with countries and partnerstowards meeting bold goals in prevention equity and equitable access to care. WHO is uniqueamong these partners in being charged with ensuring equitable access to treatment, and on22 September 2003, WHO formally declared inadequate access to ARV therapy to be a globalhealth emergency.Currently, WHO, UNAIDS and their key partners – governments of affected countries, otherUnited Nations agencies, the GFATM, nongovernmental organizations, the private sector andpeople living with HIV/AIDS – are mobilizing to respond to this treatment emergency. Together,these groups are pledged to deliver antiretroviral treatment to three million peopleliving with HIV/AIDS in developing countries by the end of 2005.This ambitious “3 by 5” target, first proposed in 2001 (31), will present numerous challenges,but with united action it can be achieved. WHO’s HIV/AIDS team, in consultation with otherexperts, has crafted a global strategy to meet the objective. In declaring lack of access to ARVtreatment to be a global health emergency, WHO is fully committed to providing accelerated,intensified support to countries to tackle critical barriers to scale-up. Consistent with theemergency response approach, WHO’s HIV/AIDS action agenda includes the following:■■■■Emergency response teams will be provided, if governments request them, to countrieswith a high burden of HIV/AIDS where the treatment gap most urgently needs to befilled. <strong>The</strong>se teams, with the support and involvement of partners in the United Nationssystem and nongovernmental organizations, will work with treatment implementers andwill conduct a rapid assessment of the barriers and opportunities to achieving the “3 by 5”target.An AIDS drugs and diagnostics facility will be established to expand patients’ access tohigh-quality, low-cost drugs and commodities. It will assist countries and implementersto navigate drug purchasing and financing while considering best prices and quality. Thiswill help overcome one of the most significant barriers faced by countries and should savetime and effort.Simplified treatment guidelines, published in December 2003, are aimed at making ARVseasier to administer. Achieving the “3 by 5” target requires global standard first-line andsecond-line treatment regimens.Uniform standards and simplified tools will be published at the same time to track theprogress and full impact of ARV treatment programmes, including surveillance of drugresistance.
HIV/AIDS: confronting a killer 53■■Emergency expansion of training and capacity development for health professionals willbegin. <strong>Health</strong> professionals will learn how to deliver simplified, standardized ARV treatment.WHO will support those partners already involved in training, and work with countriesto help build a critical mass of highly competent and skilled trainers to expand nationalcapacity for ARV delivery.Advocacy for funding will involve WHO working with UNAIDS and other partners. Achievingthe “3 by 5” target requires not only funding for drugs but a massive investment intraining and for strengthening health services in countries. <strong>Health</strong> systems strengtheningwill benefit both ARV delivery and the delivery of other health services.Investing in good HIV prevention and careIn many settings in which HIV/AIDS takes its greatest toll, already lean public programmeshave become severely weakened. WHO will provide leadership for the shaping of a very differentfuture, in which social standing is not the chief determinant of access to high-qualityAIDS prevention and care. By linking AIDS treatment and prevention, and by linking HIV/AIDS efforts with those designed to deal with other chronic and complex health problems,WHO hopes to document a “multiplier effect”: the investments required to implement andscale up integrated AIDS prevention and care will prove to have a salutary impact on manyother endeavours in public health and even education. Proper scale-up of pilot treatmentefforts will reduce deficits and make up for decades of neglect and, at the same time, strengthenhealth systems. This windfall benefit of embracing integrated HIV prevention and care willserve the global health community well as it takes on old problems, including the neglecteddiseases of the poor, and confronts new ones.An emergency response to a global emergency<strong>The</strong> persistence of eradicable diseases, from polio to measles, is a reminder that the globalcommunity has failed to bring existing tools to bear on remediable problems. New diseasesand challenges, from AIDS and SARS to drug-resistant malaria and TB, show that neglectingpublic health infrastructure puts all countries and communities at risk. Each of these diseasesneeds to be reframed as a public problem, in which tackling the causes of individual sufferingwill generate wider collective benefits.Simply reconceptualizing AIDS prevention and care will not solve the crisis. Current rates ofprogress are not adequate to meet objectives such as the “3 by 5” target. Unless the globalhealth community responds now to the need for AIDS treatment in the same way it respondsto other emergencies, with exceptional action, the fight against this most powerful enemywill not be won. WHO has committed itself to confronting this global health emergency withurgent measures. <strong>The</strong> days of a “business as usual” approach to AIDS are over.Significantly increased resources are needed to tackle pressing public health problems, includingHIV/AIDS. Confronting AIDS more boldly will enable a strengthening of primaryhealth care, based on the principles laid out at Alma-Ata in 1978. But achieving this objectivewill demand greater investment in health from international donors and from countries themselves.Sufficient knowledge and resources exist to prevent the majority of new HIV infectionsand deaths now occurring. Through better use of existing resources and by bringingnew resources to bear on a novel and growing problem, WHO will work in emergency modein support of countries to redress inequalities of access to proven therapies.
54 <strong>The</strong> <strong>World</strong> <strong>Health</strong> <strong>Report</strong> 2003If conducted properly, this emergency response can generate sustained advances. Investing inprevention equity and improved access to care will bring multiple benefits, including a narrowingof the inequalities, both social and medical, that threaten the fragile peace and stabilityof the global community.Chapter 3 has shown that although it may be too soon to have a vision of an AIDS-free world,it is not to soon to work towards that future, nor to seek inspiration from the bold initiativesof the past. Fifty years ago, who could have imagined a polio-free world? Yet that reality nowseems to be only a few years away. <strong>The</strong> Global Polio Eradication Initiative is the subject ofChapter 4.References1. Farmer P, Walton DA, Furin JJ. <strong>The</strong> changing face of AIDS: implications for policy and practice. In: Mayer K,Pizer H, eds. <strong>The</strong> emergence of AIDS: the impact on immunology, microbiology, and public health. Washington,DC, American Public <strong>Health</strong> Association, 2000.2. Workshop summary: scientific evidence on condom effectiveness for sexually transmitted disease (STD)prevention, 20 July 2001, Herndon, VA, USA. Atlanta, GA, US National Institutes of <strong>Health</strong> and the Centersfor Disease Control and Prevention, 2001 (http://www.niaid.nih.gov/dmid/stds/condomreport.pdf, accessed25 September 2003).3. AIDS epidemic update: December 2002. Geneva, UNAIDS/<strong>World</strong> <strong>Health</strong> Organization, 2002.4. Williams BG, Dye C. Antiretroviral drugs for tuberculosis control in the era of HIV/AIDS. Science [online],14 August 2003 (http://aidscience.org/Science/Williams_and_Dye_10_1126–science_1086845.htm, accessed25 September 2003).5. Expert group stresses that unsafe sex is primary mode of transmission of HIV in Africa. WHO and UNAIDSExpert Group Statement, 14 March 2003. Geneva, <strong>World</strong> <strong>Health</strong> Organization, 2003 (http://www.who.int/mediacentre/statements/2003/statement5/en/, accessed 26 September 2003).6. Brewer D et al. Mounting anomalies in the epidemiology of HIV in Africa: cry the beloved paradigm.International Journal of STD and AIDS, 2003, 14:144–147.7. Program in Infectious Disease and Social Change. <strong>The</strong> global impact of drug-resistant tuberculosis. Boston,MA, Harvard Medical School and the Open Society Institute, 1999.8. <strong>Report</strong> on the global HIV/AIDS epidemic 2002. Geneva, UNAIDS/<strong>World</strong> <strong>Health</strong> Organization, 2002.9. Bell C, Devarajan S, Gersbach H. <strong>The</strong> long-run economic costs of AIDS: theory and an application to SouthAfrica. Washington, DC, <strong>World</strong> Bank, 2003 (http://www1.worldbank.org/hiv_aids/docs/BeDeGe_BP_total2.pdf, accessed 26 September 2003).10. Raviola G et al. HIV, disease plague, demoralization, and “burnout”: resident experience of the medicalprofession in Nairobi, Kenya. Culture, Medicine and Psychiatry, 2002, 26:55–86.11. Médecins Sans Frontières South Africa, Department of Public <strong>Health</strong> at the University of Cape Town, theProvincial Administration of the Western Cape, South Africa. Antiretroviral therapy in primary health care:experience of the Khayelitsha programme in South Africa. Geneva, <strong>World</strong> <strong>Health</strong> Organization, 2003.12. Farmer P et al. Community-based treatment of advanced HIV disease: introducing DOT-HAART (directlyobserved therapy with highly active antiretroviral therapy). Bulletin of the <strong>World</strong> <strong>Health</strong> Organization, 2001,79:1145–1151.13. Farmer P et al. Community-based approaches to HIV treatment in resource-poor settings. Lancet, 2001,358:404–409.14. Egger M et al. Promotion of condom use in a high-risk setting in Nicaragua: a randomised controlled trial.Lancet, 2000, 355:2101–2105.15. Blower S, Farmer P. Predicting the public health impact of antiretrovirals: preventing HIV in developingcountries. AIDScience [online], 2003, 3 (http://aidscience.org/Articles/AIDScience033.asp, accessed 25September 2003).16. Katz MH et al. Impact of highly active antiretroviral treatment on HIV seroincidence among men who havesex with men: San Francisco. American Journal of Public <strong>Health</strong>, 2002, 92:388–394.17. Cook RL et al. What’s driving an epidemic? <strong>The</strong> spread of syphilis along an interstate highway in rural NorthCarolina. American Journal of Public <strong>Health</strong>, 1999, 89:369–373.
HIV/AIDS: confronting a killer 5518. Ainsworth M et al. AIDS and public policy: the lessons and challenges of “success” in Thailand. <strong>Health</strong>Policy, 2003, 64:13–37.19. Harm reduction approaches to injecting drug use. Geneva, <strong>World</strong> <strong>Health</strong> Organization (http://www.who.int/hiv/topics/harm/reduction/en/, accessed 25 September 2003).20. MTCT plus: expanding HIV/AIDS care in resource-limited settings. Mailman School of Public <strong>Health</strong>,Columbia University (http://www.mtctplus.org/, accessed 25 September 2003).21. Boletim Epidemiológico – AIDS . Ministry of <strong>Health</strong>, Government of Brazil, 2001 (http://www.aids.gov.br/final/biblioteca/bol_set_2001/tab1.htm, accessed 25 September 2003).22. Mexico: Fox vows AIDS patient subsidies. AIDScience [online], 6 August 2003 (http://aidscience.org/Newsarticle.asp?Article=3101, accessed 29 September 2003).23. Mukherjee J et al. Access to treatment and care: Haiti experience. Geneva, <strong>World</strong> <strong>Health</strong> Organization, 2003.24. Epidemiological fact sheets on HIV/AIDS and sexually transmitted infections: Haiti. 2002 update. Geneva,UNAIDS/<strong>World</strong> <strong>Health</strong> Organization (http://www.unaids.org, accessed 25 September 2003).25. Green T. ABC or A through Z? AIDSLink [online] 81, 1 September 2003 (http://www.globalhealth.org/publications/article.php3?id=1032, accessed 25 September 2003).26. Hogle J et al. What happened in Uganda? Declining HIV prevalence, behavior change, and the nationalresponse. Washington, DC, Center for Population, <strong>Health</strong> and Nutrition, USAID Bureau for GlobalPrograms, Field Support and Research, 2002 (http://www.eldis.org/static/DOC10759.htm, accessed25 September 2003).27. <strong>The</strong> Global Fund to Fight AIDS, Tuberculosis and Malaria: fact sheet. Geneva, Global Fund to Fight AIDS,Tuberculosis and Malaria (http://www.globalfundatm.org/proposals/round1/fsheets/haiti.html, accessed25 September 2003).28. Behets FM, Desormeaux J, Joseph D. Control of sexually transmitted diseases in Haiti: results andimplications of a baseline study among pregnant women living in Cité Soleil shantytowns. Journal ofInfectious Diseases, 1995, 72:764–771.29. Smith-Fawzi MC et al. Prevalence and risk factors of STDs in rural Haiti: implications for policy andprogramming in resource-poor settings. International Journal of STDs and AIDS, 2003 (in press).30. Grosskurth H et al. Impact of improved treatment of sexually transmitted diseases on HIV infection inrural Tanzania: randomised controlled trial. Lancet, 1995, 346:530–536.31. Schwartlander B et al. Resource needs for HIV/AIDS. Science, 2001, 292:2434–2436.
56 <strong>The</strong> <strong>World</strong> <strong>Health</strong> <strong>Report</strong> 2003
Polio Eradication: the final challenge 57Chapter FourPolio Eradication:the final challengeAs a result of the Global Polio Eradication Initiative, one ofthe largest public health efforts in history, the number of childrenparalysed by this devastating disease every year has fallenfrom over 350 000 in 1988 to as few as 1900 in 2003; thenumber of endemic countries has fallen from over 125 toseven. This chapter records the final phase of the campaignto eradicate one of the oldest known diseases. <strong>The</strong> vision of apolio-free world is now within reach.
58 <strong>The</strong> <strong>World</strong> <strong>Health</strong> <strong>Report</strong> 2003
Polio Eradication: the final challenge 594Polio Eradication:the final challengeIn 1962, just 12 months after Albert Sabin’s widely hailed oral polio vaccine (OPV) was licensedin most industrialized countries, Cuba began using the vaccine in a series of nationwidepolio campaigns. Shortly thereafter, indigenous wild poliovirus transmission had beeninterrupted. In other words, no Cuban child would ever again suffer this devastating diseaseas the result of a Cuban poliovirus. Seldom, if ever, had a new health technology been fullyexploited so successfully and so early in its lifespan, to the benefit of so many people. Fewcountries were to experience such early successes, however, as polio continued to paralysepermanently half a million people every year – even by the 1990s between 10 and 20 millionpeople who had survived the acute illness were living with its debilitating and often painfulconsequences. For Sabin, however, Cuba’s experience with mass campaigns had reaffirmedhis conviction that polioviruses could be eradicated so completely that future generationswould know polio paralysis only through history books. Sabin’s way of shaping that futurewithout polio was to donate his vaccine to the <strong>World</strong> <strong>Health</strong> Organization so that it might bemade available to all peoples, everywhere.Forty years later, the world is on the verge of realizing Sabin’s global vision of a future withoutpolio. Through an extraordinary 15-year international effort, indigenous polioviruseshave now been eliminated from all but seven countries, down from over 125 when the initiativebegan (1) (see Figure 4.1). This progress is the result of a unique partnership forgedbetween governments, international agencies, humanitarian organizations and the privatesector to take up three key challenges to reaching all children, everywhere: effective engagementof political leaders, adequate financing, and sufficient human resources. Through thispartnership, over 10 million volunteers immunized 575 million children against polio in 93of the lowest-income countries in the world in the year 2001 alone. This experience, and theprospects for the completion of polio eradication, provide insights for scaling up access toother health interventions, a process that will be essential to achieving ambitious nationaland international health targets such as those adopted in the Millennium Development Goals (2).A new kind of partnershipAs international interest in a global effort to eradicate polio began to build up 20 years ago,there was limited experience with large-scale international health initiatives and with partnerships.In the mid-1980s, however, as an increasing number of countries in South America– most notably, Brazil – successfully applied the Cuban model of mass campaigns and heightenedsurveillance to control polio, a new kind of partnership began to emerge with thiscommon purpose.
60 <strong>The</strong> <strong>World</strong> <strong>Health</strong> <strong>Report</strong> 2003By 1988, the year in which the <strong>World</strong> <strong>Health</strong> Assembly voted to launch a global initiative toeradicate polio (3), four agencies had begun to form the core of the “polio partnership”: the<strong>World</strong> <strong>Health</strong> Organization, Rotary International, the United Nations Children’s Fund(UNICEF) and the United States Centers for Disease Control and Prevention (CDC). Overthe following 15 years, the polio partnership has grown to become an extensive network ofnational governments, international agencies, private corporations, foundations, bilateral donors,humanitarian organizations, nongovernmental organizations and development banks.<strong>The</strong> work of the partnership continues to be governed by a common, multiyear strategic planand overseen by international technical committees at the country, regional and global levels.<strong>The</strong> close relationship between national health authorities and this international partnershipwas critical to the extremely rapid scaling-up of eradication activities in the mid-1990s, as theinitiative began building on the early momentum in the Americas and the Western PacificRegion and extended its activities to all countries of all regions. By the end of the decade, over500 million children were regularly being reached with OPV through the efforts of 10 millionvolunteers in every low-income and middle-income country in the world.From the outset, this partnership sought to bring a new efficiency to international supportfor national health efforts. It relied heavily on strategies and management processes that hadbeen established by the Pan American <strong>Health</strong> Organization (PAHO) in its work to achieveregional elimination of polio. This goal was realized in 1991, when a young Peruvian boynamed Luis Fermin Tenorio became the last child ever to be paralysed by a wild poliovirus inthe Region of the Americas. <strong>The</strong> global partnership adopted PAHO’s proven four-prongedstrategy: high coverage with routine OPV immunization, national polio immunization days,surveillance and laboratory investigation of acute flaccid paralysis (AFP) cases, and massivehouse-to-house “mop-up” campaigns (4). PAHO’s Interagency Coordinating Committee(ICC) mechanism brought together partner inputs at the country level to ensure sufficientresources, while promoting transparent budgeting and efficiencies. <strong>The</strong> ICCs, convened regularlyby national ministries of health, ensured that national authorities were always at thecentre of key decisions on strategy implementation. <strong>The</strong> global partnership also emphasizesengagement at the highest political levels in both donor and endemic countries.Effectively engaging political leaders<strong>The</strong> most visible element of the polio eradication initiative has been the National ImmunizationDays (NIDs), as they require the immunization of every child under 5 years of age (nearly20% of a country’s population) over a period of 1–3 days, several times a year for a number ofyears in a row. In many countries, the scale and logistic complexity of these activities wereeven greater than those of campaigns undertaken during the height of the smallpox eradicationeffort. Consequently, the commitment of political leaders has been central to their success.This support has been generated by actively and continuously advocating for such leadersto play a role in three key areas: oversight, access to non-health resources, and accountability.<strong>The</strong> oversight of polio activities by political leaders has often begun with their personal participationin highly visible events such as the launching of NIDs and, ideally, has continuedwith their monitoring of progress. Following the example of South America, most countrieshave had their NIDs launched by the head of state or other prominent political figure. Forexample, in China, President Jiang Zemin immunized the first child in the national poliocampaign in 1993. In the same year, King Sihanouk played a similar role in Cambodia. In1996, President Nelson Mandela of South Africa launched the “Kick Polio Out of Africa”campaign at the Organization of African Unity (OAU) meeting in Yaoundé, Cameroon, andcommitted the OAU to regularly monitoring progress (5). Among donor countries, polio has
Polio Eradication: the final challenge 61Figure 4.1 Endemic polio in 1988 and mid-20031988> 125 countriesEndemicNon-endemic20037 countriesEndemicNon-endemic
62 <strong>The</strong> <strong>World</strong> <strong>Health</strong> <strong>Report</strong> 2003received similar support – most noticeably when the G8 Heads of Government discussedtheir role in closing the funding gap for eradication activities during their meetings of 2002 and2003 (6).This high-level visibility has been critical to achieving the second, and perhaps most importantgoal of political advocacy: access to government and nongovernmental resources whichlie outside the health sector. Because of the huge numbers of people and vehicles that arerequired to implement NIDs, such activities are beyond the logistic and communicationcapacity of the health sector in many countries. Consequently, countries have drawn heavilyon ministries of information, transport, defence and others to help solve the challenge ofrapidly reaching all children, in all corners of a country. Countries have also engaged theprivate sector, often on an extraordinary scale. In the Philippines, for example, more than 140private companies have regularly donated personnel, vehicles, facilities and financial support.<strong>The</strong> effective mobilization of such support has been possible only when the highestpolitical leadership, at both national and subnational levels, endorsed the initiative publiclyand took the necessary steps to put these resources at the disposal of health authorities. Thus,the delivery of this health service became a government and societal responsibility, withthe responsibility of the health sector moving from implementation to management andmonitoring.This personal engagement of political leaders in the oversight and implementation of activitiesleads naturally to the third goal of political advocacy: heightened accountability, bothBox 4.1 Progress towards polio eradication in the Eastern MediterraneanAll countries of the Eastern Mediterranean Region are rapidly progressingtowards the eradication of poliomyelitis. <strong>The</strong> number of cases hasdecreased relatively regularly, as shown by the well-developed and efficientsurveillance system. By the end of 2002, poliovirus transmissionhad been interrupted in 18 countries of the region for more than threeyears; in addition, Sudan has not reported a single polio case since April2001. During 2002, 110 confirmed cases of polio were reported fromonly four countries (Pakistan: 90; Afghanistan: 10; Egypt: 7; and Somalia:3). During the first eight months of 2003, 61 cases were reported(Pakistan: 57; Afghanistan: 2; and Egypt: 1); a further case, in Lebanon,proved to be imported and genetically linked to the virus strains fromIndia.Intensified national immunization days (NIDs) are continuing in2003, with technical support from WHO, both in endemic countries(Afghanistan, Egypt, Pakistan and Somalia) and in Sudan which wasrecently declared polio-free. All these countries conduct more than twoNIDs and one or more rounds of sub-national immunization days (SNIDs)in high-risk districts each year, reaching all children through house-tohouseimmunization. Acute flaccid paralysis (AFP) surveillance continuedto improve throughout the region. <strong>The</strong> non-polio AFP rate has furtherincreased in 2003 to reach 2.39 per 100 000 children under 15 years ofage, while stool specimen collection has reached 90%.As the polio eradication initiative moves into its final phase, technicaladvisory groups for the priority countries regularly review the epidemiologicalsituation and national plans and provide technical advice.In addition, a regional technical advisory group was established to provideleadership for eradication activities in the remaining polio-endemiccountries and to advise Member States on other technical issues. Increasingattention is being given to the laboratory containment of wildpoliovirus, the certification of polio eradication and the development ofpost-certification immunization policy.National containment coordinators have been nominated in 19 ofthe 23 countries of the region, 16 of which have also established nationalcontainment committees. By the end of 2002, 18 countries hadprepared a national containment plan; three of the remaining five countriesstill have ongoing virus transmission. <strong>The</strong> first containment phasehas been successfully completed in seven countries and is currently beingimplemented in another 11.All countries of the region except Somalia have established NationalCertification Committees (NCCs) with appropriate membership.Eighteen countries with no viral circulation have submitted reports andnational documentation to the Regional Certification Committee (RCC),which has already reviewed 15 of these reports and provided appropriatefeedback. <strong>The</strong> RCC is also reviewing annual updates provided bycountries whose initial reports were satisfactory. <strong>The</strong>se annual updateswill be submitted annually until regional certification is achieved.Despite the significant achievements in remaining endemic areas,the eradication programme still faces a number of challenges and constraintsthat must be overcome to reach the final goal. <strong>The</strong> main focusnow is Pakistan, where several outbreaks occurred during 2002–2003.It seems that the youngest children in tribal and conservative populationsare likely to be missed if the vaccination team does not include a woman.In order to overcome these difficulties, the emphasis is on enlisting federal,provincial and local political leaders and expanding the SNIDs totarget all transmission zones. New international staff are being mobilizedin districts with no previously assigned consultants, to help providethe needed technical support to ensure high-quality performance in surveillancein all areas.
Polio Eradication: the final challenge 63within and outside the health sector. Only the highest-level political leadership has the necessaryauthority to ensure this accountability, particularly in the non-health ministries whosepersonnel and resources are so important in ensuring that all children are reached with OPV.Such high-level engagement of political leaders has brought additional, often extraordinary,benefits. Recognizing that poliovirus knew no borders, in April 1995 leaders of 18 countriesof Asia, Europe and the Eastern Mediterranean began coordinating the OPV immunizationof 56 million children. Similar activities followed in Africa, where the conflict-affected countriesof Angola, the Democratic Republic of the Congo, Gabon, and the Republic of the Congosynchronized three rounds of NIDs from July 2001, reaching 15 million children. Throughoutthe past 15 years, in countries such as Afghanistan, Angola, Sierra Leone and Sri Lanka,warring parties have laid down their weapons to participate in “days of tranquility” so thattheir children might be immunized against polio (7). Progress towards eradication in countriesof the Eastern Mediterranean and South-East Asia Regions is detailed in Boxes 4.1 and 4.2.Finding the fundsSabin’s vision of a world without polio required reaching all children with multiple doses ofOPV, which in turn required substantial financial resources and in-kind contributions fromnational and international sources. To mobilize and manage resources on this scale, the poliopartnership established a mix of strategies and mechanisms. <strong>The</strong> success of this approach isreflected in the mobilization of more than US$ 5 billion in funding and in-kind contributionsfor polio eradication activities, over a 20-year period (8). While the majority of thesefunds went to time-limited eradication activities, a substantial proportion was directed to thestrengthening of routine immunization and surveillance services.In any given country, the proportion of costs covered by national and international sourceshas correlated most closely with income level and health system capacity. China, for example,has estimated that over 95% of its costs were borne by the country itself. Even in the poorestcountries with virtually non-existent formal health services, such as Somalia, the communityabsorbs 25–50% of the real costs of implementing polio NIDs through in-kind contributions.Because of the diversity of the communities, governments and partners that haveBox 4.2 Responding to the challenge of polio eradication in South-East AsiaIn 2002, the global goal of polio eradication was jeopardized as Indiasuffered the largest outbreak in recent history: 1600 cases were reportedthat year, a fivefold increase over 2001. As the epidemic spread intoIndian states which had finally become polio-free in recent years, thenumber of infected districts more than doubled from 63 in 2001 to 159.Because of India’s long borders with Bangladesh and Nepal, the epidemicalso threatened these polio-free countries. By the end of 2002,the South-East Asia Region accounted for 84% of the global polio burden.Since then, however, a massive national and international responsehas again brought polio to the brink of elimination in the most populousWHO region.By the end of 2000, 9 of the 10 WHO Member States in the South-East Asia Region and 35 of India’s 37 states had interrupted wild poliovirustransmission as part of the global eradication effort. In addition toBangladesh and Nepal, Myanmar has been polio-free since 2000; Bhutan,the Democratic People’s Republic of Korea, Indonesia, Maldives, SriLanka and Thailand all stopped indigenous transmission prior to 1999.This progress is the result of a regionally coordinated, data-driven programmethat began in the early 1990s and through which National ImmunizationDays have reached over 200 million children, oftensynchronized across Member States and supported by regional bodiessuch as the South Asian Association for Regional Cooperation. Strongpolio surveillance and a regional network of 17 high-quality laboratorieshave guided the effort and confirmed these achievements.Investigations into the 2002 epidemic demonstrated that a combinationof low routine immunization coverage and an insufficient scale,number and quality of polio campaigns had led to a rapid accumulationof susceptible children, especially in the state of Uttar Pradesh. In response,political oversight of the programme was markedly increased,the number of polio campaigns was raised to six per year, and additionalefforts were made to reach children in minority populations. Consequently,by the end of September 2003, polio was at its lowest level inhistory (132 cases) and there was again the real possibility of forevereliminating this devastating disease from South-East Asia by 2005.
64 <strong>The</strong> <strong>World</strong> <strong>Health</strong> <strong>Report</strong> 2003contributed to the implementation of polio activities, it is impossible to quantify accuratelythe value of all financial and in-kind expenditures. Of the over US$ 5 billion that will havebeen spent on the initiative, however, a conservative estimate based on the time of volunteersand health workers during NIDs – the most labour-intensive of the strategies – suggests thatpolio-endemic countries will have contributed at least US$ 2.35 billion in volunteer timealone between 1988 and 2005 (8). Additional public and private sector resources from thenational, state, province, district and local community levels paid for petrol, social mobilization,training and other costs.External sources will have provided at least US$ 3 billion to help endemic countries coverpolio eradication costs. Of the more than 100 external donors to date, 26 will have contributedmore than US$ 1 million over the lifespan of the initiative and 12 at least US$ 25 million(see Figure 4.2). A particular strength of the polio initiative has been its strong partnershipwith a number of non-traditional donors of development aid, most notably Rotary International(see Box 4.3). <strong>The</strong> country-level budgeting and resource management processes, combinedwith centralized tracking of resource requirements and funding flows, have allowedthe programme to accommodate the needs of donors and recipient countries while improvingthe efficient use of available financing. Despite their limited infrastructure, many lowincomeand lower-middle-income countries have clearly demonstrated a tremendousabsorptive capacity for health resources, which can rapidly achieve real health outcomes.Although the coordinated international advocacy and resource management of this initiativehave been very successful, the most striking aspect of the financing for polio eradication hasbeen the substantial contribution of endemic countries and communities themselves to ensuringthat their children share fully in the global vision of a world without polio.Figure 4.2 Global Polio Eradication Initiative: financial support 1988–2005● Germany ● Denmark● Netherlands● USA (CDC*)● United Kingdom▲ EuropeanCommission● USAID▲ <strong>World</strong> Bank■ UN Foundation■ Gates Foundation■ Rotary International● Public sector – 65%■ Private sector – 25%▲ Multilateral sector – 10%* Centers for Disease Control and Prevention.● Japan● CanadaOthers2003–2005 funding gapUS$ 210 million
Polio Eradication: the final challenge 65Finding the peopleWhile strong political engagement and substantial financial and in-kind resources are essentialto the success of the polio initiative, they are not sufficient. <strong>The</strong>se two elements have hadto be complemented with sufficient people to implement the eradication strategies in everycorner of the world. Although high-income and higher-middle-income countries could usuallyrely on strong health services to implement the eradication strategies, a massive gap inthe critical area of human resources for health, particularly in low-income and lower-middle-incomecountries with the greatest polio burden, threatened the success of the entireglobal effort.<strong>The</strong> number, mix and distribution of people required to eliminate polio from countries differed,depending on the strategy. <strong>The</strong> most labour-intensive strategies were the massive, timelimited,supplementary immunization activities such as NIDs and “mop-up” campaigns. <strong>The</strong>most skill-intensive strategy was that involving continuous disease surveillance and laboratoryactivities. In general, the very different human resource requirements of the two types ofstrategy were met through different approaches.<strong>The</strong> number of people required to implement NIDs is tremendous. As noted above, an estimated10 million volunteers and health workers immunized 575 million children duringsuch polio eradication activities in 2001. Two key aspects of NIDs were critical to resolvingthe gap between existing, trained vaccinators in a country and the number needed for NIDs.First, because NIDs only require administering 2 OPV drops to a child and then recordingthe number immunized, with 1–2 hours of training community volunteers could safely deliverthe service. Second, the time-limited nature of NIDs meant that volunteers were willingto participate and that other government ministries, nongovernmental organizations andprivate sector partners could bear the opportunity costs incurred by having their staff participate.Consequently, the major challenge for national and subnational health authoritiesand the polio partnership became the mobilization, training, equipping and management ofthese human resources. Given the scale of this mass mobilization, a substantial effort wasmade to include other interventions in NIDs where feasible and safe: it has been estimatedthat the inclusion of vitamin A supplementation in polio NIDs averted 1.25 million childhooddeaths (9).<strong>The</strong> high-quality surveillance required for guiding supplementary immunization activitiesand monitoring their impact called for a different human resources response. Far fewer peoplewere required than for NIDs, but with a much higher level of skills to identify, notify,Box 4.3 A public–private partnership for polio eradicationRotary International is one of the four spearheading partners of theGlobal Polio Eradication Initiative, having endorsed the concept of aglobal effort even before the <strong>World</strong> <strong>Health</strong> Assembly resolution of 1988.In 1985, Rotary pledged its commitment to the international health goalof a “polio-free world” by the time of its centenary in 2005.In endemic areas, Rotarians – from more than 160 countries –have volunteered their time to help ministries of health with every aspectof the programme, including polio vaccine delivery, health workertransport, provision of critical equipment, and community mobilization.In polio-free countries, Rotarians have continuously raised the profileand importance of polio eradication through advocacy and public informationcampaigns.Rotary International has provided financial support to polio eradicationon an unprecedented scale. By 2005, Rotary’s direct financingwill have reached over US$ 500 million since 1988, 20% of the totalexternal financing for the entire initiative. In addition, Rotary has beenat the centre of the multi-agency advocacy effort that has mobilizedUS$ 2.4 million in further external funding from donor governments,foundations, development banks and the private sector.Rotary International has campaigned with key political leaders ofboth endemic and polio-free countries to ensure their active participationin the programme. This regular, high-level advocacy by a privatesector partner has kept polio eradication high on the global agenda,despite many competing priorities
66 <strong>The</strong> <strong>World</strong> <strong>Health</strong> <strong>Report</strong> 2003investigate and respond to cases of AFP (4). Furthermore, they had to be available on anongoing basis. Consequently, the polio partnership focused on working with national authoritiesto expand and strengthen the existing national surveillance infrastructure whereverpossible. Where this infrastructure was functionally non-existent, partners worked with nationalauthorities to establish AFP surveillance. In any particular country, the strategy pursuedto close this human resources gap depended on the broader national strategy forstrengthening health services. In some countries, surveillance personnel received governmentsalaries with operating costs, including vehicles and equipment, covered by internationalsources. In other countries, national salaries were supplemented by partners as part of a governmentstrategy to retain highly qualified staff. In still others, WHO and governments establishedand operated a joint surveillance programme. In addition, WHO hired and deployednearly 1500 national and international staff to provide technical assistance and even conductsurveillance activities in those areas with the weakest capacity.Through this mix of strategies and approaches to the gap in human resources for health, ithas been possible to reach almost every child in the world with OPV and other interventions(such as Vitamin A supplementation), irrespective of socioeconomic status, religion, minoritystatus, geography or even war. In addition, a truly global surveillance and laboratory capacitynow exists to identify and respond rapidly to polio, as well as to many other diseases ofpublic health importance such as measles, neonatal tetanus, meningitis, cholera and yellowfever, depending on the country (10). In the Western Pacific Region, this capacity contributedto the international response to the SARS outbreaks of 2002–2003.Prospects for a polio-free futureAs the result of an aggressive, deliberate and internationally coordinated effort, polio haschanged from being a devastating disease with a global distribution to one that is now geographicallyrestricted to seven countries. To capitalize on this progress, substantial effort isnow required to interrupt the final chains of polio transmission, certify that achievement,and minimize the risk of polio being reintroduced in the future. <strong>The</strong> polio partnership’sPolio Eradication Strategic Plan 2004–2008 summarizes these challenges in its majorobjectives.First, the final chains of poliovirus transmission must be interrupted in the remaining sevencountries. Particular effort will be required in India, Nigeria and Pakistan, which now accountfor 99% of the world’s polio burden and remain a source of importation to polio-freeareas. Within these countries, five of the 76 states or provinces are the key to global eradication;with sustained high-level political engagement, oversight and accountability in eachone, high-quality NIDs could rapidly reach all children and halt polio transmission within 12months.Second, the global interruption of wild poliovirus transmission must be verified by the GlobalCommission for the Certification of Poliomyelitis Eradication. Certification requires thatall countries provide documentation demonstrating the absence of wild poliovirus circulationfor at least three years, in the presence of high-quality surveillance, as well as the “containment”of all stocks of wild poliovirus. Containment requires that within one year of theinterruption of wild poliovirus transmission globally, countries will have identified all stocksof wild poliovirus and ensured their storage and handling under appropriate biosafety conditions(see Figure 4.3).
Polio Eradication: the final challenge 67Third, appropriate policies will need to be developed, and internationally agreed, for thepost-certification era. <strong>The</strong>se policies must be designed to both minimize the risk of reintroductionof wild poliovirus and ensure the global capacity to manage such an event should itoccur. Consequently, policies will be needed in four areas: polio detection and notification,long-term biocontainment of all poliovirus strains (that is, wild and vaccine strains), poliovaccine stockpiles, and routine immunization (11). <strong>The</strong> development of these policies will beeven more complex than it was for smallpox, for a number of reasons. For example, the verylow risk of vaccine-derived polioviruses regaining the capacity to cause outbreaks is now welldocumented. Furthermore, the risks of international terrorism have substantially affectedthe willingness of some policy-makers to plan for the discontinuation of routine polio immunizationin the near future, regardless of the economic benefits. Because of the complexityof these issues, ongoing research in this area will be complemented by broad consultationwith governments and stakeholders through the <strong>World</strong> <strong>Health</strong> Assembly and other forumsfrom 2004 onwards (11).Scaling up the delivery of health services<strong>The</strong> greatest success of the polio eradication initiative to date has been its capacity to reachvirtually every population in the world with a basic health service, regardless of geography,religion, conflict or even the strength of the health system. This experience in scaling up toimplement fully the eradication strategies is now one of the most valuable assets of the programme.Perhaps the most frequent, if unfair, criticism of the highly regarded smallpox eradicationeffort was that it left little infrastructure behind to tackle other diseases. Indeed, theultimate legacy of the polio eradication initiative will depend largely on the extent to whichthe experience and lessons learnt are used in scaling up the delivery of other health services.Figure 4.3 Global action plan for laboratory containment of wild polioviruses, February 2003Surveys not startedSurveys under waySurveys completed, inventories submitted
68 <strong>The</strong> <strong>World</strong> <strong>Health</strong> <strong>Report</strong> 2003Although political engagement, partnership management and financing were essential componentsof the scale-up, these approaches alone were not sufficient in areas with particularlyweak health systems. In such areas it was only possible to achieve scale-up after other fundamentalgaps in the health system had been tackled. At the central level, joint national andinternational technical advisory bodies, established at either the regional or national level,helped strengthen and support policy-making functions. Substantial international technicalassistance then helped build national capacity to translate these policies into local guidelinesand procedures, while assisting national bureaucracies to “jump start” their implementation.At the sub-national level, national staff were trained or hired to perform these functions. Ingeneral, a very pragmatic approach was taken to ensure appropriate remuneration for thework that was conducted. Great emphasis was placed on establishing national capacity tomonitor and evaluate strategy implementation effectively at each level, using standard androbust performance indicators for every aspect of the programme, from the collection ofstool specimens from suspect cases to the cost per child immunized.At the level of service delivery, the major challenges related to creating and then meetingdemand for immunization with OPV. Demand creation was usually a major issue only inurban areas; in rural settings, the simple availability of the service was often sufficient tocreate the necessary demand, and this is likely to be the case for other pressing needs such asHIV treatment. Consequently, social mobilization was the principal service delivery challengein the urban setting while logistics were far more important in rural areas. Mobilizingcommunities in urban areas required a heavy reliance on radio and television, with carefullytested messages delivered by appropriate spokespeople. In the rural setting, the systematicidentification and engagement of traditional and community leaders was the essential foundationfor the person-to-person communications that were needed. <strong>The</strong> logistic demands ofactually delivering OPV in urban areas could frequently be met through the formal healthservices, supplemented by paramedical personnel or students. In the rural setting, gaps in theformal health service required community volunteers for every element of the programmefrom the collection of vaccine from depots through to immunization, tallying and reporting.While the importance of all of these elements is widely and well recognized, the strength ofthe eradication initiative has been in its ability to deal sufficiently with these matters at theinternational, national and peripheral levels at the same time. This was only possible, however,by deploying substantial numbers of technical and support staff in areas where the formalhealth systems were weakest; the number of these staff reached nearly 3000 by the year2001, with 80% in just 15 countries.Many of the newer international disease control initiatives, such as those targeting other vaccine-preventablediseases, AIDS, tuberculosis and malaria, must deliver more complex interventionsthan OPV. Nonetheless, the lessons learnt through polio eradication in filling gapsin the health system are also applicable to scaling up the delivery of such services. For example,the success of these newer initiatives will also require the active participation of communitieson a massive scale to close the gap caused by insufficient numbers or distribution oftrained health workers. Optimizing the engagement of volunteers – whether to deliver bednets,conduct HIV education, or distribute drugs and ensure their consumption – will also requiresupply lines that can provide every community with the necessary tools on a predictable, ifintermittent, basis.Optimizing the potential benefits of the polio eradication infrastructure, experience and lessonswill require strengthening linkages with newer programmes to scale up access to theseimportant health interventions. WHO is firmly committed to strengthening these links for
Polio Eradication: the final challenge 69the benefit of all peoples everywhere and being as bold with the new interventions as Cubawas in rapidly scaling up the use of OPV.Progress in eradicating this debilitating disease clearly demonstrates that national governments,backed by strong international partnerships, can generate and manage the politicalleadership, financing, and human resources needed to reach all populations with health interventions.<strong>The</strong> ultimate success of the polio eradication effort, however, is still not guaranteed;it now rests with the leaders of a very small number of endemic areas, who must ensurethat all of their children are immunized, and the leaders of wealthy countries, who must acton their verbal pledges to close the chronic financing gap for these activities. In meeting thesechallenges, the world will create a global public good for health whose benefits will accrue toall children, potentially for ever.This chapter has chronicled the long and difficult war against one of the world’s oldest diseases.Chapter 5 is the story of the brief but deadly encounter with one of the world’s newestthreats, SARS – how a vital victory was achieved, and the lessons it offers for the future.References1. <strong>World</strong> <strong>Health</strong> Organization. Progress towards global eradication of poliomyelitis, 2002. WeeklyEpidemiological Record, 2003, 78:138–144.2. <strong>Report</strong> of the United Nations Secretary-General. Road map towards the implementation of the United NationsMillennium Declaration. New York, NY, United Nations, 2001 (United Nations General Assembly documentA/56/326).3. Global eradication of poliomyelitis by the year 2000. Geneva, <strong>World</strong> <strong>Health</strong> Organization, 1988 (<strong>World</strong> <strong>Health</strong>Assembly resolution WHA41.28).4. de Quadros CA et al. Eradication of poliomyelitis: progress in the Americas. Pediatric Infectious DiseaseJournal, 1991, 10:222–229.5. Yaoundé Declaration on Polio Eradication in Africa. Yaoundé, Cameroon, Organization of African Unity, 1996(Assembly of Heads of States and Government resolution AHG/Decl.1 (XXXII)).6. G8 Action Plan. Ottawa, Government of Canada, 2002 (http://www.g8.gc.ca/2002Kananaskis/afractionen.asp,accessed 18 August 2003).7. Bush K. Polio, war and peace. Bulletin of the <strong>World</strong> <strong>Health</strong> Organization, 2000, 78:281–282.8. Aylward RB et al. Producing a global public good: polio eradication. In: Smith R et al., eds. Global publicgoods for health. Oxford, Oxford University Press, 2003:33–53.9. Ching P et al. <strong>The</strong> impact of vitamin A supplements delivered with immunization campaigns. AmericanJournal of Public <strong>Health</strong>, 2000, 90:1526–1529.10. Nsubuga P et al. Polio eradication initiative in Africa: influence on other infectious disease surveillancedevelopment. BMC Public <strong>Health</strong>, 2002, 2:27.11. <strong>Report</strong> of the eighth meeting of the Technical Consultative Group (TCG) on the Global Eradication ofPoliomyelitis, Geneva, 24–25 April 2003. Geneva, <strong>World</strong> <strong>Health</strong> Organization, 2003 (WHO/V&B/03.13;http://www.who.int/vaccines-documents/DocsPDF03/www754.pdf, accessed 7 October 2003).
70 <strong>The</strong> <strong>World</strong> <strong>Health</strong> <strong>Report</strong> 2003
SARS: lessons from a new disease 71Chapter FiveSARS:lessons from a new diseaseNew diseases have been emerging at the unprecedented rateof one a year for the last two decades, and this trend is certainto continue. <strong>The</strong> sudden and deadly arrival of SARS onthe global health stage early in 2003 was in some ways perhapsthe most dramatic of all. Its rapid containment is one ofthe biggest success stories in public health in recent years.But how much of that success was a result of good fortune aswell as good science? How narrow was the escape from aninternational health disaster? What tipped the scales? <strong>The</strong>international response to SARS will shape future strategiesagainst infectious epidemics.
72 <strong>The</strong> <strong>World</strong> <strong>Health</strong> <strong>Report</strong> 2003
SARS: lessons from a new disease 735SARS:lessons from a new disease<strong>The</strong> day-by-day struggle to control the outbreak of severe acute respiratory syndrome (SARS)represents a major victory for public health collaboration. Key lessons emerge that will beinvaluable in shaping the future of infectious disease control – and being ready for the daywhen the next new disease arrives without warning. First and most important is the need toreport, promptly and openly, cases of any disease with the potential for international spreadin a closely interconnected and highly mobile world. Second, timely global alerts can preventimported cases from igniting big outbreaks in new areas. Third, travel recommendations,including screening measures at airports, help to contain the international spread of an emerginginfection. Fourth, the world’s best scientists, clinicians and public health experts, aided byelectronic communications, can collaborate to generate rapidly the scientific basis for controlmeasures. Fifth, weaknesses in health systems play a key role in permitting emerginginfections to spread. Sixth, an outbreak can be contained even without a curative drug or avaccine if existing interventions are tailored to the circumstances and backed by politicalcommitment. Finally, risk communication about new and emerging infections is a greatchallenge, and it is vital to ensure that the most accurate information is successfully andunambiguously communicated to the public. WHO is applying these lessons across theOrganization as it scales up its response to the HIV/AIDS emergency.<strong>The</strong> first casesOn 12 March 2003, WHO alerted the world to the appearance of a severe respiratory illnessof undetermined cause that was rapidly spreading among hospital staff in Hong Kong SpecialAdministrative Region (China) and Viet Nam. Within two days, it was clear that theillness was also spreading internationally along major airline routes when hospitals in Singaporeand Toronto, Canada, reported seeing patients with similar signs and symptoms. <strong>The</strong>potential for further international spread by air travel was vividly illustrated on 15 March. Inthe early hours of the morning, the head of WHO’s outbreak alert and response operationswas woken by a call from health authorities in Singapore. A doctor who had treated the firstcases of atypical pneumonia there had reported having similar symptoms shortly before boardingan international flight returning to Singapore from New York. Asked to intervene, WHOalerted the airline and health authorities in Germany, where the flight was scheduled for astopover. <strong>The</strong> doctor and his wife disembarked in Frankfurt and were immediately hospitalizedin isolation, becoming the first two cases in Europe. Because of these events, WHO issueda second, stronger alert later in the day. It set out a case definition, provided advice to
74 <strong>The</strong> <strong>World</strong> <strong>Health</strong> <strong>Report</strong> 2003international travellers should they develop similar symptoms, and gave the new disease itsname: severe acute respiratory syndrome (SARS). <strong>The</strong> global outbreak of SARS became thefocus of intense international concern, and it remained so for almost four months.Origins and international spreadSARS is a newly identified human infection caused by a coronavirus unlike any other knownhuman or animal virus in its family. Analysis of epidemiological information from the variousoutbreak sites is still under way, but the overall case fatality ratio, with the fate of mostcases now known, approaches 11%, but with much higher rates among elderly people. Transmissionoccurs mainly from person to person during face-to-face exposure to infected respiratorydroplets expelled during coughing or sneezing, or following contact with body fluidsduring certain medical interventions. Contamination of the environment, arising from faecalshedding of the virus, is thought to play a small role in disease transmission, illustrated bythe almost simultaneous infection in late March of more than 300 residents of a housingestate in Hong Kong where faulty sewage disposal was identified. At present, the disease hasno vaccine, no curative treatment, and no reliable point-of-care diagnostic test, though antibodytests have been developed that can reliably confirm previous infection using acute andconvalescent sera. Management of SARS is supportive, and control strategies rely on standardepidemiological interventions: identification of those fitting the case definition, isolation,infection control, contact tracing, active surveillance of contacts, and evidence-basedrecommendations for international travellers. Though demanding and socially disruptive,particularly when large numbers of people were placed in quarantine, these standard interventions,supported by high-level political commitment, proved sufficiently powerful to containthe global outbreak less than four months after the initial alert.<strong>The</strong> earliest cases of SARS are now thought to have emerged in mid-November 2002 in thesouthern Chinese province of Guangdong. Retrospective analysis of patient records, to dateincomplete, has identified small clusters of cases, each traced to a different initial case, thatoccurred independently in at least seven municipalities, with the first case recorded on 16November 2002 in Foshan City and the largest number of cases concentrated in GuangzhouCity. Analysis has uncovered no links among the various initial cases in the clusters. Somecases with no previous known history of exposure also occurred (1, 2). Early collaborativestudies conducted in Guangdong have detected a virus almost identical to the SARScoronavirus in domesticated game animals – the masked palm civet cat and the raccoon dog– sold in Guangdong live markets, suggesting that these animals might play a role in transmissionof the virus to humans.<strong>The</strong> initial phase of the Guangdong outbreak, characterized by small, independent clustersand sporadic cases, was subsequently followed by a sharp rise in cases during the first week ofFebruary 2003, thought to result from amplification during care in hospitals. Cases graduallydeclined thereafter. Altogether, some 1512 clinically confirmed cases occurred in theGuangdong outbreak, with health care workers in urban hospitals accounting for up to 27%of cases (1–3). This pattern – occurrence in urban areas, with most cases concentrated inhospitals, and amplification during care – was repeated as the disease began to spread outsideGuangdong Province to other areas in China and then internationally.<strong>The</strong> first recorded case of SARS outside China occurred on 21 February 2003, when a medicaldoctor who had treated patients in Guangzhou City and was himself suffering from respiratorysymptoms spent a single night in a hotel in Hong Kong. Through presumed contact, themechanism of which is not fully understood, he transmitted SARS to at least 16 other guests
SARS: lessons from a new disease 75and visitors, all linked to the same hotel floor. <strong>The</strong>y carried the virus with them as they enteredlocal hospitals or travelled on to Singapore, Toronto and Viet Nam. An internationaloutbreak that eventually spread to 30 countries had thus been seeded. Figure 5.1 maps thedistribution of 8422 cases and 916 deaths that had occurred by 7 August 2003.Detection and responseOn 15 March 2003, when the second alert was made, the cause of SARS had not yet beenidentified. Cases were concentrated in hospital workers and did not respond to medicinesknown to be effective against a number of different lung infections. Many patients were rapidlyprogressing to severe pneumonia. <strong>The</strong> situation was alarming: no patients, includingyoung and previously healthy health workers, had recovered. Many of the patients were in acritical condition, several required mechanical ventilatory support, and two had died. <strong>The</strong>spread to major cities around the world meant that any city with an international airport wasat potential risk of imported cases. From the outset, WHO’s objective was clear: to halt furtherinternational spread and interrupt human-to-human transmission through a global containmenteffort, and by so doing to minimize opportunities for the disease to establishendemicity (see Box 5.1).<strong>The</strong> global response to SARS was in reality the roll out of a way of detecting and respondingto outbreaks that had been developed over the preceding seven years by WHO and its partners,partly as a result of major weaknesses that came to light during the 1995 Ebola outbreakin the Democratic Republic of the Congo and during previous outbreaks of plague in Indiaand cholera in Latin America. <strong>The</strong> SARS response depended on collaboration of the world’stop public health and laboratory experts, and took advantage of up-to-date communicationtechnologies, including the Internet and video and telephone conferencing.Figure 5.1 Probable cases of SARS worldwide, 7 August 2003Canada (251)Europe:11 countries (33)Russian Federation (1)Mongolia (9)Republic of Korea (3)USA (33)China (5327)Taiwan, China (665)India (3)China, Hong Kong SAR (1755)China, Macao SAR (1)Kuwait (1)Philippines (14)Colombia (1)Viet Nam (63)Thailand (9)Malaysia (5)Brazil (1)Singapore (238)Indonesia (2)South Africa (1)Australia (6)OutbreaksImported casesNew Zealand (1)
76 <strong>The</strong> <strong>World</strong> <strong>Health</strong> <strong>Report</strong> 2003Two principal partners of the WHO Global Outbreak Alert and Response Network (GOARN),an electronically interconnected network of experts and institutes formally set up in early2000, contributed to the detection of the SARS outbreak. One was the Canadian Global Public<strong>Health</strong> Intelligence Network (GPHIN), a worldwide web-crawling computer application,used by WHO since 1997, that systematically searches for keywords in seven different languagesto identify reports of what could be disease outbreaks. Throughout the outbreak,GPHIN provided the raw intelligence that helped WHO maintain up-to-date and high-qualityinformation on indications that the disease might be spreading to new areas. <strong>The</strong> secondpartner was the WHO Influenza Laboratory Network of 110 laboratories in 84 countries thatconstantly keeps the world in general and vaccine manufacturers in particular informed ofwhich strains of influenza are circulating, so that an effective influenza vaccine can be producedeach year.On 10 February 2003, GPHIN and other partners of GOARN identified reports of an outbreakassociated with health worker mortality and the closing of hospitals in Guangdong.One day later the Chinese government officially reported to WHO an outbreak of respiratoryillness, beginning in mid-November, involving 300 cases and five deaths in Guangdong Province.Just over a week later, on 19 February, an outbreak of avian influenza was reported tothe WHO Influenza Laboratory Network by the collaborating laboratory in Hong Kong. Thisoutbreak first came to light when a 33-year-old man died of an unknown cause after returningfrom a family trip to Fujian Province, China. His 8-year-old daughter had died of a similardisease while in Fujian Province and his 9-year-old son was hospitalized in Hong Kongwith the same symptoms. It was from this son that avian influenza virus was isolated andreported to the Influenza Laboratory Network. <strong>The</strong> same influenza virus had been identifiedin Hong Kong in 1997. Control efforts at that time required the slaughter and incinerationof all chickens in the many live markets there; human-to-human transmission was neverestablished.Box 5.1 <strong>The</strong> response to SARS in the Western Pacific RegionMore than 95% of SARS cases occurred in the Western Pacific Region.As an immediate response, a SARS outbreak response and preparednessteam – including international experts – was established in theRegional Office. <strong>The</strong> main objectives were to:• contain and control the outbreaks;• support the health care infrastructure in affected countries;• provide guidance and assistance to enable vulnerable countries toprepare for the possible arrival of the virus;• provide the most up-to-date information to health officials andrespond to public concerns.Teams of epidemiologists and infection control experts were immediatelysent to China, including Hong Kong Special AdministrativeRegion, as well as to the Philippines, Singapore and Viet Nam and acrossthe southern Pacific, training health care workers in infection controlprocedures and preparing them for the possible arrival of the disease.Practical infection control and preparedness guidelines and training toolswere developed, and the first version of preparedness guidelines wasissued at the beginning of April. Logistic support and supplies (personalprotective equipment, including masks, collection materials for bloodand respiratory samples, and internationally approved containers for shipmentof samples) were sent to both affected and unaffected countries,supported by a US$ 3 million grant from the Government of Japan.Countries were classified according to three levels of risk and threelevels of capability to respond to SARS cases, in order for WHO to prioritizeits support to countries. WHO worked closely with countries to ensurethat enhanced surveillance was put in place to enable early detection ofcases and contact tracing. Guidelines were drawn up on enhanced surveillance,hospital and community infection control, international travel,laboratory procedures and public awareness. To improve public awareness,close contact was established with national media focal points,and the web site of the Western Pacific Regional Office was regularlyupdated.A regional laboratory network was established to ensure thatnecessary testing for SARS could be done for countries with limited laboratorycapacities. National and regional reference laboratories were identifiedand shipping of specimens was arranged between the laboratories.WHO’s efforts were paralleled by the contribution of Member States.Viet Nam was the first to interrupt local transmission of the virus. Othercountries introduced a wide range of measures, including isolation, homequarantine and comprehensive contact tracing. <strong>The</strong> willingness of governmentsin the Western Pacific Region to put public health considerationsahead of economic concerns about the impact of SARS was crucialto the success of the collaborative effort.
SARS: lessons from a new disease 77This heightened level of alert led to the identification of an early SARS case in Viet Nam on28 February 2003. At the same time as GOARN collected information about this outbreak inreal time, it sent an international team of partners to work with the Viet Nam authorities tobetter understand the disease, and by 12 March GOARN had accumulated the initial informationnecessary to issue the first global alert. It was through the continued instant sharingof information by governments, public health experts, clinicians and laboratory scientiststhat evidence-based decisions could progressively be made, culminating in the successfulcontainment of SARS.Under GOARN, a virtual collaborative network of 11 leading laboratories, linked by a secureweb site and daily teleconferences, identified the SARS causative agent and developed earlydiagnostic tests. <strong>The</strong> network, in turn, served as a model for similar electronically linkedgroups of clinical and epidemiological experts who pooled clinical knowledge and compiledthe epidemiological data needed to chart the outbreak’s evolution and assess the effectivenessof control interventions.WHO issued daily updates about the outbreaks on its web site to keep the general public –especially travellers – informed and, as far as possible, to counter rumours with reliableinformation. Equally important, the web site was used to issue a range of evidence-basedtechnical and practical guidelines for control as knowledge and information about the diseaseprogressed and became available through the virtual groups of experts.As more and more evidence accumulated through real time collaboration of public healthexperts, a range of additional evidence-based control measures became possible. It was soonevident, for example, that people with SARS continued to travel internationally by air after15 March, and that some of them had infected passengers sitting nearby. At the same time itwas also apparent that contacts of SARS patients likewise continued to travel, becoming illonce they arrived at their destination. Recommendations were therefore made that countrieswith major outbreaks should screen departing passengers to make sure that they did not havefever and other signs of SARS, or known contact with SARS patients.As the outbreak continued in Hong Kong, contact tracing there further demonstrated thattransmission of SARS was occurring outside the confined environment of the health caresetting, and later suggested that it was also occurring following exposure to some factor inthe environment, thus creating further opportunities for exposure in the general population.Additional evidence-based guidance was therefore made for sites where contact tracing couldnot link all cases to a chain of transmission, on the understanding that if the disease werespreading in the wider community it would greatly increase the risk to travellers and thelikelihood that cases would be exported to other countries. This guidance was aimed at internationaltravellers, and recommended that they postpone all but essential travel to designatedareas in order to minimize their risk of becoming infected. Such guidance was alsoneeded in view of the confusion created by several different national recommendations, manyof which were based on criteria other than epidemiological data.Authorities in areas where outbreaks were occurring responded to SARS with mass publiceducation campaigns and encouraged populations to conduct daily fever checks. Hotlinesand web sites answered questions. Screening measures were set up at international airportsand border crossings, and procedures of infection control were reinforced in hospitals. Singaporedrew on its military forces to conduct contact tracing, while Hong Kong adapted atracing system that had been developed for use in criminal investigations and electronicallymapped the location of all residences of cases. Chinese authorities opened hundreds of feverclinics throughout the country where suspected SARS cases were triaged. Heads of state and
78 <strong>The</strong> <strong>World</strong> <strong>Health</strong> <strong>Report</strong> 2003ministers of health of of countries of the Association of Southeast Asian Nations (ASEAN)and the Asia–Pacific Economic Cooperation (APEC) met and resolved to establish closercollaborative mechanisms for disease surveillance and response. <strong>Health</strong> staff everywhereworked with dedication, and many, including WHO staff member Dr Carlo Urbani, lost theirlives.On 5 July 2003, WHO announced that Taiwan, China, where the last known probable case ofSARS had been isolated 20 days earlier, had broken the chains of human-to-human transmission.A recurrence of SARS cannot, however, be ruled out. Further research on manyunresolved questions is needed. In the meantime, systems are now in place to detect are-emergence should it occur (4).<strong>The</strong> impact of SARS<strong>The</strong> economic impact of the SARS outbreak has been considerable and illustrates the importancethat a severe new disease can assume in a closely interdependent and highly mobileworld. Apart from the direct costs of intensive medical care and control interventions, SARScaused widespread social disruption and economic losses. Schools, hospitals, and some borderswere closed and thousands of people were placed in quarantine. International travel toaffected areas fell sharply by 50–70%. Hotel occupancy dropped by more than 60%. Businesses,particularly in tourism-related areas, failed, while some large production facilitieswere forced to suspend operations when cases appeared among workers.A second impact is more positive: SARS stimulated an emergency response – and a level ofmedia attention – on a scale that has very likely changed public and political perceptions ofthe risks associated with emerging and epidemic-prone diseases. It also raised the profile ofpublic health to new heights by demonstrating the severity of adverse effects that a healthproblem can also have on economies and social stability. <strong>The</strong> resulting high level of politicalcommitment was decisive in the containment of SARS and has much to say about the abilityof nations to achieve public health results even when drugs and vaccines are not available tocure or prevent the infection.Lessons learntAlthough much about SARS – including its potential to reoccur – remains to be learnt throughsystematic analysis of existing data, and focused research activities in China, several importantlessons are already apparent. WHO is applying these lessons across the entire Organizationas it responds to the HIV/AIDS emergency.<strong>The</strong> first and most compelling lesson concerns the need to report, promptly and openly, casesof any disease with the potential for international spread. Attempts to conceal cases of aninfectious disease, for fear of social and economic consequences, must be recognized as ashort-term stop-gap measure that carries a very high price: the potential for high levels ofhuman suffering and death, loss of credibility in the eyes of the international community,escalating negative domestic economic impact, damage to the health and economies of neighbouringcountries, and a very real risk that outbreaks within the country’s own territory willspiral out of control. Following the adoption during the <strong>World</strong> <strong>Health</strong> Assembly in May 2003of a resolution on the International <strong>Health</strong> Regulations, WHO has been confirmed in itsresponsibility to take on a strong coordinating role in leading the fight against any infectiousdisease that threatens international public health (5). In a second resolution specific to SARS,
SARS: lessons from a new disease 79all countries are urged to report cases promptly and transparently, and to provide informationrequested by WHO that could help prevent international spread. It was explicitlyacknowledged that across-the-board strengthening of systems for outbreak alert and responsewas the only rational way to defend public health security against not only SARS but alsoagainst all future infectious disease threats, including those that might be deliberately caused (6).<strong>The</strong> second lesson is closely related: timely global alerts, especially when widely supported bya responsible press and amplified by electronic communications, worked well to raise awarenessand vigilance to levels that can prevent imported cases of an emerging and transmissibleinfection from causing significant outbreaks. <strong>The</strong> global alerts issued by WHO on 12 and 15March provide a clear line of demarcation between areas with severe SARS outbreaks andthose with none or only a few secondary cases. Following the SARS alerts, all areas experiencingimported cases, with the exception of Taiwan, China, either prevented any further transmissionor kept the number of locally transmitted cases very low. Figure 5.2 shows the weeklyonset of 5910 cases. A climate of increased awareness also helps to explain the speed withwhich developing countries readied their health services with preparedness plans and launchedSARS campaigns, often with WHO support, to guard against imported cases.<strong>The</strong> third lesson is that travel recommendations, including screening measures at airports,appear to be effective in helping to contain the international spread of an emerging infection.Initial analysis of data on in-flight transmission of SARS has implicated four flights in theexposure of 27 probable cases, of which 22 occurred on a single flight from Hong Kong toBeijing, China, on 15 March. Some of these cases may also have been exposed elsewherebecause of being in the same tour group. Following the recommendation of airport screeningmeasures on 27 March, no cases associated with in-flight exposure were reported; and initialinformation reveals that two probable SARS cases were identified by airport screening proceduresin Hong Kong and immediately hospitalized. Travel recommendations based on theFigure 5.2 Probable cases of SARS worldwide, a 1 November 2002–11 July 2003160140120Number of cases1008060402001 Nov 02 22 Nov 02 13 Dec 02 3 Jan 03 24 Jan 03 14 Feb 03 7 Mar 03 28 Mar 03 18 Apr 03 9 May 03 30 May 03 20 Jun 03 11 Jul 03Date of onseta This graph does not include 2527 probable cases of SARS (2521 from Beijing, China), for whom no dates of onset are currently available.
80 <strong>The</strong> <strong>World</strong> <strong>Health</strong> <strong>Report</strong> 2003epidemiological evidence also gave areas where outbreaks were occurring a benchmark forquickly containing SARS, and then regaining world confidence that the area was safe fromthe risk of SARS transmission. In fact, passenger movement figures provided by Hong KongInternational Airport show a rapid rebound from the lowest number of passengers, 14 670(recorded just before 23 May when the travel recommendations were removed) to 54 195 on12 July, a little over a month later.<strong>The</strong> fourth lesson concerns international collaboration: the world’s scientists, clinicians andpublic health experts are willing to set aside academic competition and work together for thepublic health good when the situation so requires. International collaboration greatly advancedunderstanding of the science of SARS. One month after the laboratory network wasestablished, participating scientists collectively announced conclusive identification of theSARS virus; complete sequencing of its RNA followed shortly afterwards. <strong>The</strong> network ofclinical experts provided a platform for comparison of patient management strategies to indicateto the world which treatments and strategies were effective. In addition, the epidemiologynetwork confirmed the modes of transmission of SARS and began the long-termcollaboration needed to understand clearly the clinical spectrum of disease, including its casefatality ratio, while also providing the information needed to regularly reassess and adjust thecase definition.Lesson five is that weaknesses in health systems can permit emerging infections to amplifyand spread, and can compromise patient care. <strong>The</strong> strengthening of health systems thus deserveshigh priority. <strong>The</strong> people at greatest risk for SARS were health workers who eitherbecame infected by close face-to-face contact with patients or by procedures that broughtthem into contact with respiratory secretions. Women predominate among the lower ranksof health personnel in many countries; available data reveal that infected health care workerswere 2.7 times more likely to be women than men, while infection was roughly equal betweenthe sexes in the general population. <strong>The</strong> surge of SARS patients placed an enormous burdenon health services, requiring facilities for isolation, long periods of intensive and expensivecare, and the use of demanding and socially disruptive measures such as mass screening,contact tracing, active surveillance of contacts and – at some outbreak sites – enforced quarantine.Even in areas with highly developed social services, the burden of coping with SARS,including the large number of hospitals with patients and the high number of health workerswho became infected, often required closing some hospitals and sections of others. As a resultof SARS outbreaks, many long-standing and seemingly intractable problems that havetraditionally weakened health systems are being corrected in fundamental and often permanentways. New surveillance and reporting systems, methods of data management, mechanismsfor collaborative research, hospital policies, procedures for infection control, andchannels for informing and educating the public are part of the initial positive legacy ofSARS that will shape the capacity to respond to future outbreaks of new or re-emerginginfections.Lesson six is that in the absence of a curative drug and a preventive vaccine, existing interventions,tailored to the epidemiological data and supported by political commitment and publicconcern, can be effectively used to contain an outbreak. <strong>The</strong> virtual laboratory, and clinicaland epidemiological collaborating networks regularly provided information that was usedby WHO and its partners to update guidance for containment. Initial guidance was providedfor containing outbreaks nationally – as additional evidence was obtained, guidance to limitinternational spread was also provided. Areas where outbreaks were occurring, and countrieswhich considered themselves at risk of imported cases from these areas, adapted WHO guidancefor their use. Some countries introduced active surveillance of suspected contacts using
SARS: lessons from a new disease 81surveillance cameras or military personnel. Others relied on self-surveillance by contacts whovoluntarily isolated themselves in their homes and regularly checked for fever. Measures introducedat airports ranged from passive screening of passengers, involving optional completionof questionnaires, to the use of interviews conducted by health workers andsophisticated infrared equipment to screen all passengers for fever and indications of possibleexposure. In addition to maximizing the impact of surveillance and screening, these measureswere also considered by governments to be reassuring for national citizens as well asinternational travellers.<strong>The</strong> seventh lesson highlights one of the major difficulties faced during the containmentactivities for SARS: risk communication about new and emerging infectious diseases is agreat challenge. Work along these lines is currently under way in conjunction with the riskthat a biological agent might be used in an act of terrorism.SARS will not be the last new disease to take advantage of modern global conditions. In thelast two decades of the 20th century, new diseases emerged at the rate of one per year, and thistrend is certain to continue (7). Not all of these emerging infections will transmit easily fromperson to person as does SARS. Some will emerge, cause illness in humans and then disappear,perhaps to recur at some time in the future. Others will emerge, cause human illnessand transmit for a few generations, become attenuated, and likewise disappear. And still otherswill emerge, become endemic, and remain important parts of our human infectious diseaseecology.<strong>The</strong> rapid containment of SARS is a success in public health, but also a warning. It is proof ofthe power of international collaboration supported at the highest political level. It is alsoproof of the effectiveness of GOARN in detecting and responding to emerging infections ofinternational public health importance. At the same time, containment of SARS was aided bygood fortune. <strong>The</strong> most severely affected areas in the SARS outbreak had well-developedhealth care systems. Had SARS established a foothold in countries where health systems areless well developed cases might still be occurring, with global containment much more difficult,if not impossible.Although control measures were effective, they were extremely disruptive and consumed enormousresources – resources that might not have been sustainable over time. If SARS reoccursduring an influenza season, health systems worldwide will be put under extreme pressure asthey seek to isolate all those who fit the clinical case definition until diagnosis can be ascertained.Continued vigilance is vital.This chapter has illustrated how quickly a new disease can threaten global health. Thankfully,not all diseases move at such speed; but some are more stealthy and more lethal. Chapter 6looks at three epidemics that are advancing at different rates in developing countries today:the spread of cardiovascular and other noncommunicable diseases; the tobacco epidemic;and the rising toll of deaths and injuries from road traffic hazards.Note: <strong>The</strong> evolution of the global SARS outbreak has been chronicled in daily situation updates, archived on theSARS pages at the WHO web site: http://www.who.int/csr/sars/en/index.html.
82 <strong>The</strong> <strong>World</strong> <strong>Health</strong> <strong>Report</strong> 2003References1. Visit of WHO expert team to review the outbreak of atypical pneumonia in Guangdong Province, 24 March–9 April 2003. Final report, 30 April 2003. Geneva, <strong>World</strong> <strong>Health</strong> Organization, 2003 (unpublisheddocument).2. Breiman RF et al. Role of China in the quest to define and control severe acute respiratory syndrome.Emerging Infectious Diseases, 2003, 9:1037–1041.3. Overview of epidemics and responses to the severe acute respiratory syndrome (SARS) in the People’s Republic ofChina. Beijing, Chinese Centre for Disease Control and Prevention, 2003 (unpublished document).4. Alert, verification and public health management of SARS in the post-outbreak period. Geneva, <strong>World</strong> <strong>Health</strong>Organization, 2003 (http://www.who.int/csr/sars/postoutbreak/en/, accessed 18 August 2003).5. Revision of the International <strong>Health</strong> Regulations. Geneva, <strong>World</strong> <strong>Health</strong> Organization, 2003 (<strong>World</strong> <strong>Health</strong>Assembly resolution WHA56.28; http://www.who.int/gb/EB_WHA/PDF/WHA56/ea56r28.pdf, accessed 18August 2003).6. Severe acute respiratory syndrome. Geneva, <strong>World</strong> <strong>Health</strong> Organization, 2003 (<strong>World</strong> <strong>Health</strong> Assemblyresolution WHA56.29; http://www.who.int/gb/EB_WHA/PDF/WHA56/ea56r29.pdf, accessed 18 August2003).7. Woolhouse MEJ, Dye C, eds. Population biology of emerging and re-emerging pathogens. PhilosophicalTransactions of the Royal Society for Biological Sciences, 2001, 356:981–982.
Neglected Global Epidemics: three growing threats 83Chapter SixNeglected Global Epidemics:three growing threatsToday, the burden of deaths and disability in developingcountries caused by noncommunicable diseases, particularlycardiovascular conditions, outweighs that imposed by longstandingcommunicable diseases. To tackle this wellrecognized"double burden", this chapter proposes a "doubleresponse" which integrates prevention and control of bothcommunicable diseases and noncommunicable diseaseswithin a comprehensive health care system.<strong>The</strong> chapter also examines the stealthy but rapid evolution oftwo other epidemics, and ways to respond to them. <strong>The</strong>globalization of tobacco-related diseases can be counteredthrough the WHO Framework Convention on Tobacco Control.Simultaneously, the "hidden epidemic" of road trafficcasualties and traffic-related environmental hazards can bereduced if developing countries adapt successful road safetyand other improvements from elsewhere to meet their ownneeds.
84 <strong>The</strong> <strong>World</strong> <strong>Health</strong> <strong>Report</strong> 2003
Neglected Global Epidemics: three growing threats 856Neglected Global Epidemics:three growing threatsCardiovascular diseases: the need to actTwenty-five years ago, when the delegates at the international Alma-Ata conference drew upa list of eight essential elements for primary health care, there was no mention of the treatmentor prevention of conditions such as heart disease and stroke. <strong>The</strong> priority was to deliveradequate nutrition, safe water and basic sanitation, maternal and child health care, immunizationagainst the major infectious diseases, the prevention and control of local endemicdiseases, and the provision of essential drugs to the poorer countries of the world.Cardiovascular diseases (CVDs) – heart disease and stroke – and other noncommunicablediseases were considered diseases of the industrialized countries – so-called “Western diseases”– brought about by ways of life utterly different from those in most of Africa, Asia andmany other parts of the developing world. It is noteworthy, however, that as early as 1954 thedelegate of India to the <strong>World</strong> <strong>Health</strong> Assembly called for steps to be taken towards the preventionof CVDs in developing countries.<strong>The</strong> global health agenda is still dominated by the notion that communicable diseases needto be prevented and treated before CVDs receive attention. <strong>The</strong>re is a lingering view thatCVDs are mostly confined to wealthy people and are caused by natural ageing and degenerativeprocesses. <strong>The</strong>re persists a widespread belief that they are “lifestyle diseases”, fully underthe control of individual decisions.<strong>The</strong> reality is quite different. CVDs have not only emerged in all but the very poorest countries,but are already well advanced; this growing burden has real potential to hinder socialand economic development. Risk factors are indicators of future health status, and five of thetop 10 risks worldwide are specific to noncommunicable diseases (1). <strong>The</strong>se include raisedblood pressure, tobacco use, alcohol consumption, cholesterol, and obesity or overweight.This is part of the well-documented epidemiological transition called the “double burden”that sees the arrival of the whole group of noncommunicable diseases with their shared riskfactors on top of the persisting threat of communicable diseases. As a consequence, healthsystems are now required that can deal comprehensively with all common diseases, irrespectiveof their origin.As highlighted in Chapter 1, in today’s world most deaths are attributable to noncommunicablediseases (32 million) and just over half of these (16.7 million) are the result of CVD; morethan one-third of these deaths occur in middle-aged adults. In developed countries, heartdisease and stroke are the first and second leading causes of death for adult men and women.
86 <strong>The</strong> <strong>World</strong> <strong>Health</strong> <strong>Report</strong> 2003<strong>The</strong>se facts are familiar and hardly surprising. What is surprising, however, is that in somedeveloping countries, CVDs have also become the first and second leading causes, responsiblefor one-third of all deaths (see Figure 6.1).In fact, twice as many deaths from CVD now occur in developing countries as in developedcountries. Overall, in developing countries, CVD ranks third in disease burden (after injuriesand neuropsychiatric disorders). Even in high-mortality developing countries, CVD is rankedvery high.A particular cause of concern is the relatively early age of CVD deaths in developing countriescompared with those in the developed regions (2). One in two of the CVD-related deathsin India occur below the age of 70 years, compared with one in five in economically welldevelopednations. In both rural and urban areas of the United Republic of Tanzania, strokemortality rates are three times higher than those in England and Wales. What is not oftenrecognized is that, globally, CVDs account for as many deaths in young and middle-agedadults as HIV/AIDS.This does not mean that communicable diseases have quietly gone away, require less funding,or are now safely under control. <strong>The</strong> advent of HIV/AIDS shattered that hope (see Chapter3). Malaria and tuberculosis are among other enormous threats that remain and are growing.In addition, as pointed out in Chapter 5, new infectious diseases have been emerging at therate of one a year for the last 20 years or more: SARS is the latest. So it is legitimate that publichealth communities remain vigilant towards infectious diseases, and that this vigilance beginswith primary health care, in accordance with the Declaration of Alma-Ata. However, theworld cannot afford to lose sight of the growing social and economic threats posed by CVDand other noncommunicable diseases.Ironically, CVDs are now in decline in the industrialized countries first associated with them.But from that irony stems hope: the decline is largely a result of the successes of primaryprevention and, to a lesser extent, treatment. What has worked in the richer nations – andFigure 6.1 Deaths attributable to 16 leading causes in developing countries, 2001Cardiovascular diseasesMalignant neoplasmsInjuriesRespiratory infectionsChronic respiratory diseasesHIV/AIDSPerinatal conditionsDiarrhoeal diseasesTuberculosisDigestive diseasesChildhood diseasesMalariaDiabetes mellitusDiseases of the genitourinary systemNeuropsychiatric disordersMaternal conditionsLow-mortality developing countriesHigh-mortality developing countries0 2000 4000 6000 8000 10 000 12 000Deaths (000)
Neglected Global Epidemics: three growing threats 87especially for the most advantaged members of these societies – can be just as effective intheir poorer counterparts.<strong>The</strong>re is now abundant evidence to initiate effective actions at national and global levels topromote and protect cardiovascular health through population-based measures that focuson the main risk factors shared by all noncommunicable diseases. <strong>The</strong> population-wide applicationof existing knowledge has the potential to make a major, rapid and cost-effectivecontribution to their prevention and control and to benefit all segments of the population (3).<strong>The</strong> main issue for policy-makers, at all levels of public health in developing countries, is howto deal with the growing burden of epidemics of noncommunicable diseases in the presenceof persisting communicable disease epidemics. Furthermore, this challenge must be facedeven where health system resources are already inadequate. Although considerable policygains can be made very cheaply, especially intersectorally, extra provision must be found.This requires a greater share of national resources for health care, better use of existing resources,and new sources of funding. A special tax on tobacco products for disease preventionprogrammes is a readily available source of new funds for most countries.<strong>The</strong> causes are known<strong>The</strong> good news is that an impressive body of research has identified the causes of the CVDepidemics within populations (1). Global trade and marketing developments continue todrive the nutrition transition towards diets with a high proportion of saturated fat, sugar andsalt. At the same time, protective elements like fibre and phytochemicals in fresh fruit andvegetables are being progressively depleted in diets. When combined with tobacco use andlow levels of physical activity, this diet leads to population-wide atherosclerosis and the widespreaddistribution of CVDs. Variations in these same major risk factors explain much of themajor difference in rates of CVDs between countries.In summary, the major CVD risk factors of tobacco use, inappropriate diet and physical inactivity(primarily expressed through unfavourable lipid concentrations, high body-mass index,and raised blood pressure) explain at least 75–85% of new cases of coronary heart disease(4). In the absence of elevations of these risk factors, coronary heart disease is a rare cause ofdeath. Unfortunately, the vast majority of the populations in almost all countries are at riskof developing CVD because of higher than optimal levels of the main risk factors. Only about5% of adult men and women in wealthy countries are at low risk with optimal risk factorlevels. <strong>The</strong>re are only a few very poor countries in which these factors have not yet emerged asmajor public health problems.Policies are availableOne of the most exciting possibilities to emerge in public health in recent years is the integrationof communicable disease and CVD prevention and control into comprehensive healthsystems led by primary care. Bringing this to fruition will mean reshaping the future of primaryhealth care in response to a changing world. It would see all patients being offered –across their lifespan – prevention, treatment and long-term management of both sides of thedouble burden.Achieving such integration will not be easy. Apart from other considerations, it will requirecooperation between professional rivals, who each regard their side of the double burden tobe more important than the other, and who compete for their share of limited resources.Such competitiveness has long been entrenched across the battlefields of public health. And
88 <strong>The</strong> <strong>World</strong> <strong>Health</strong> <strong>Report</strong> 2003yet, as the chapter of this report on SARS has shown, cross-disciplinary collaboration is notonly possible but can be enormously rewarding to all concerned. In the case of this newepidemic, the world’s best scientists, clinicians and public health experts were willing to setaside academic competition and work together for the public good – because the circumstancesso clearly required it. Paradoxically, a matching policy response to tackle public healthchallenges of even greater magnitude is lacking: the mounting menace of the global CVDepidemic is evolving rapidly.Another critical policy issue, especially for poor countries, concerns the appropriate balancebetween primary and secondary prevention and between the population and high-risk approachesto primary prevention. If the goal is to increase the proportion of the population atlow risk and to ensure that all groups benefit, the strategy with the greatest potential is theone directed at the whole population, not just people with high levels of risk factors or establisheddisease (5). All other strategies will, at best, only blunt the epidemics and likely increaseinequalities; they will not prevent the epidemics. Even so, with ageing populations,health systems will continue to face the unrelenting demands of costly care, both acute andchronic (see Box 1.3 in Chapter 1).<strong>The</strong> ultimate public health policy goal is the reduction of population risk, and since most ofthe population in most countries is not at the optimal risk level, it follows that the majority ofprevention and control resources should be directed towards this goal in the entire population.Evidence is available in support of the cost-effective policies required for the task ofmaking the small – but powerful and surprisingly rapid – shifts in risk distributions in entirepopulations in a favourable direction (1). Similarly, management decisions based on measuresof overall risk are more cost-effective than those based on single risk factors.Untold lives lost are lost unnecessarily because of inadequate acute and long-term managementof CVD. Relatively cheap interventions for CVD are available (6), and single combinationpills including aspirin and drugs for blood pressure and cholesterol lowering for possibleuse in chronic care are under development. Even in wealthy countries, however, the potentialof these and other interventions for secondary prevention is far from fully utilized. <strong>The</strong> situationin poorer countries is even less satisfactory. <strong>The</strong>re are many opportunities for coordinatedCVD risk reduction, care and long-term management. Smoking cessation and theidentification and management of diabetes, for example, are just two priorities. Cost-effectiveinterventions, such as the use of aspirin in people with symptoms of chest pain, wouldprevent a quarter of the deaths associated with heart attacks and are much more cost-effectivethan more radical interventions such as revascularization procedures, which are inevitablyrestricted to a minority of patients with CVD.Acting now and measuring progress<strong>The</strong>re have been striking and rapid reductions in CVD death rates in wealthy countries –especially benefiting the wealthiest and most educated – because of comprehensive approachesincluding both improved prevention and the management of high-risk people. Policy interventionsin developed and developing countries can lead to a surprisingly rapid response. InMauritius, government action to encourage consumption of healthy oils resulted in a rapiddecrease in population levels of blood cholesterol. In Finland, government agricultural subsidieswere used to reduce dairy farming and increase berry production. And in Poland, increasedconsumption of fresh fruit and vegetables, consequent to changes in the policyenvironment, were associated with a sharp decline in CVD death rates. A WHO/FAO expertconsultation report on diet, nutrition and the prevention of chronic diseases reviewed the
Neglected Global Epidemics: three growing threats 89evidence and provided recommendations for nutrient intake goals for the prevention of CVDand other noncommunicable diseases (7).A coherent policy framework, encompassing legislation, regulation and mass education iscritical for CVD prevention and control, since individual behaviour change is difficult in theabsence of conducive environmental alterations. A suggested stepwise framework for a comprehensiveresponse to CVD prevention and control is outlined in Table 6.1 and can be modifiedaccording to national needs, goals and targets.Table 6.1 A stepwise approach for prevention and control of noncommunicable diseasesResource levelNational levelPopulation approachesCommunity levelIndividual high-risk approachStep 1:CoreWHO Framework Convention onTobacco Control (FCTC) is ratified in thecountry.Tobacco control legislation consistentwith the elements of the FCTC isenacted and enforced.A national nutrition and physical activitypolicy consistent with the GlobalStrategy is developed and endorsed atCabinet level; sustained multisectoralaction is evident to reduce fat intake,reduce salt (with attention to iodizedsalt where appropriate), and promotefruit and vegetable consumption.<strong>Health</strong> impact assessment of publicpolicy is carried out (for example:transport, urban planning, taxation, andpollution).Local infrastructure plans include theprovision and maintenance of accessibleand safe sites for physical activity (suchas parks and pedestrian-only areas).<strong>Health</strong>-promoting community projectsinclude participatory actions to copewith the environmental factors thatpredispose to risk of noncommunicablediseases: inactivity, unhealthy diet,tobacco use, alcohol use, etc.Active health promotion programmesfocusing on noncommunicable diseasesare implemented in different settings:villages, schools and workplaces.Context-specific management guidelinesfor noncommunicable diseaseshave been adopted and are used at allhealth care levels.A sustainable, accessible and affordablesupply of appropriate medication isassured for priority noncommunicablediseases.A system exists for the consistent, highqualityapplication of clinical guidelinesand for the clinical audit of servicesoffered.A system for recall of patients withdiabetes and hypertension is inoperation.Step 2:ExpandedTobacco legislation provides forincremental increases in tax on tobacco,and a proportion of the revenue isearmarked for health promotion.Food standards legislation is enactedand enforced; it includes nutritionlabelling.Sustained, well-designed, nationalprogrammes (counter-advertising) arein place to promote non-smokinglifestyles.Sustained, well-designed programmesare in place to promote:• tobacco-free lifestyles, e.g. smokefreepublic places, smoke-free sports;• healthy diets, e.g. low-cost, low-fatfoods, fresh fruit and vegetables;• physical activity, e.g. “movement” indifferent domains (occupational andleisure).Systems are in place for selective andtargeted prevention aimed at high-riskpopulations, based on absolute levelsof risk.Step 3:OptimalCountry standards are established thatregulate marketing of unhealthy foodto children.Capacity for health research is builtwithin countries by encouraging studieson noncommunicable diseases.Recreational and fitness centres areavailable for community use.Opportunistic screening, case-findingand management programmes areimplemented.Support groups are fostered for tobaccocessation and overweight reduction.Appropriate diagnostic and therapeuticinterventions are implemented.Adapted from: (8).
90 <strong>The</strong> <strong>World</strong> <strong>Health</strong> <strong>Report</strong> 2003Unfortunately, in most countries the response to CVD prevention and control is still basedon the infectious disease paradigm. Consequently, the global and national capacity to respondto CVD epidemics is woefully inadequate. Few countries have implemented comprehensiveprevention and control policies (9) and development of capacity, especially for policyresearch, has not kept pace with the epidemiological transition. <strong>The</strong> gaps between the needsfor CVD prevention and control and the capacity to meet them will grow even wider unlessurgent steps are taken.Global norms are needed to balance the otherwise unrestrained influences of powerful actors.To promulgate such norms, public health professionals need to learn how to influencethe deliberations of bodies such as the <strong>World</strong> Trade Organization – where health issues areincreasingly considered – and to develop stronger ways of dealing with products with healthimpacts. A combination of multistakeholder and intergovernmental codes and other nonbindingmeasures may be required. <strong>The</strong> Framework Convention on Tobacco Control, describedin the following section, is one example of a legally binding global norm.WHO and governments cannot confront the challenges of CVD prevention and control alone.As with tobacco control, partnerships and interactions with international consumer groupsand global commercial multinationals are essential. WHO is developing a Global Strategy onDiet, Physical Activity and <strong>Health</strong> as a strategic framework within which WHO and MemberStates can work together across sectors in preventing CVD and other noncommunicable diseases.This population-wide prevention strategy is based on extensive consultations withstakeholders: Member States, the United Nations and intergovernmental organizations, civilsociety and the private sector.Globally, there is still only limited advocacy for the CVD prevention and control agenda.What there is tends to be fragmented. <strong>The</strong> lack of unified advocacy for health promotionBox 6.1 Measuring progress: integrated surveillance of noncommunicable disease risk factors<strong>The</strong> goal of surveillance is to monitor emerging patterns and trends inmajor cardiovascular disease (CVD) and other noncommunicable disease(NCD) risk factors and to measure the effectiveness of preventioninterventions in countries. Two tools havebeen developed for this purpose: the WHOSTEPwise approach to Surveillance (STEPS) ofnoncommunicable disease risk factors (10)and the WHO Global NCD InfoBase (11).STEPS is a sequential process, startingwith gathering information on key health behavioursby the use of questionnaires (Step1), then moving to simple physical measurements(Step 2), and only then recommendingthe collection of blood samples for biochemicalassessment (Step 3). This framework buildsa common approach to defining core variablesfor surveys, surveillance and monitoring systems.<strong>The</strong> goal is to achieve data comparabilityover time and between countries. <strong>The</strong>Option 3Option 2Option 1QuestionnairesExpandedmethodology has been developed in close collaboration with WHO regionaloffices and is easily adaptable to the needs of Member States. Itoffers an entry point for low-income and middle-income countries toget started in surveillance and prevention activities for noncommunicablediseases. By increasing local capacity, STEPS aims to achieve data comparabilityover time and between countries. Many Member States havenow been trained in the STEPS methodology.<strong>The</strong> approach is designed to build on existingBiochemical measurementsPhysical measurementsCoreStep1Step2Step3surveillance activities, but can also be introducedas a new methodology to countrieswhere there are no surveillance systems currentlyin place. Data collected using theSTEPwise approach is fed into the WHO GlobalNCD InfoBase.<strong>The</strong> WHO Global NCD InfoBase is a databasedesigned to hold existing country-leveldata on risk factors of noncommunicable diseases.Its strength is that the data can be displayedand used to derive a single bestprevalence estimate for any given country. Thisapproach allows transparency in the use ofcountry data sources. It is a major improvementon previous WHO estimates, which, in the absence of such a relationaldatabase, relied on selected studies which may have excludedmany available sources and lacked transparency.
Neglected Global Epidemics: three growing threats 91compares poorly with the growing dominance of commercial and consumer groups whohave placed treatment at the centre of health policy debates and funding priorities. Broaderalliances of major health professional bodies, consumer groups and others are needed topromote the prevention of major risk factors for CVD and to track progress to agreed nationaland global goals – perhaps modelled on the Millennium Development Goals (see Box6.1). Since the determinants of CVD are multisectoral, advocacy and action, too, must extendwell beyond the health sector. <strong>The</strong> involvement of nongovernmental organizations in articulatingthe demand for speedy implementation of policies and programmes relevant to CVDcontrol is critical for catalysing policy change and for mobilizing communities to ensure thatthe benefits flow to the entire population.While the pace of globalization of the major risks for CVDs is increasing, progress towardsCVD prevention and control is slow. Sustained progress will occur only when governments,international agencies, nongovernmental organizations and civil society acknowledge thatthe scope of public health activities must be rapidly broadened to include CVDs and theirrisk factors.<strong>The</strong> challenge is to work towards the integration of prevention and control of both communicablediseases and CVDs, while acknowledging the different time scales of these epidemicsand the competition for limited resources. A place must be found for the prevention andcontrol of CVD on the agenda of health systems led by primary care. At Alma-Ata 25 yearsago it was deemed unnecessary. Today, it is indispensable.Tobacco control: strengthening national efforts<strong>The</strong> consumption of cigarettes and other tobacco products and exposure to tobacco smokeare the world’s leading preventable cause of death, responsible for about 5 million deaths ayear, mostly in poor countries and poor populations. Latest estimates reveal that, of the nearly4 million men and 1 million women who died, over 2 million men and 380 000 women werein developing countries (12). <strong>The</strong> toll will double in 20 years unless available and effectiveinterventions are urgently and widely adopted.Globalization of the tobacco epidemic can undermine even the best national control programme.<strong>The</strong> epidemic is being spread and reinforced worldwide by a complex mix of factorswith cross-border effects, including trade liberalization, foreign direct investment, and otherfactors such as global marketing, transnational tobacco advertising, promotion and sponsorship,and the international movement of contraband and counterfeit cigarettes. Recognitionof this situation led to the adoption by 192 Member States at the <strong>World</strong> <strong>Health</strong> Assembly inMay 2003 of the WHO Framework Convention on Tobacco Control (WHO FCTC). This, thefirst treaty negotiated under the auspices of WHO, constitutes a major turning point in tacklinga major global killer: it signals a new era in global and national tobacco control activities.<strong>The</strong> FCTC is an evidence-based treaty that reaffirms the right of all people to the higheststandard of health. It represents a paradigm shift in developing a regulatory strategy for addictivesubstances: in contrast to previous drug control treaties, the FCTC asserts the importanceof demand reduction strategies as well as supply issues.Major challenges lie ahead as WHO works with Member States to implement the agreementin countries. <strong>The</strong> process of the FCTC’s creation also reveals the price paid for delay betweenvision and action. It has taken almost 10 years to bring the idea of such an instrument tofruition. During that time, more than 30 million people have died of tobacco-related illnesses,70% of them in low-income and middle-income countries and half before the age of 70.
92 <strong>The</strong> <strong>World</strong> <strong>Health</strong> <strong>Report</strong> 2003Those who died before 70 years of age lost, on average, 28 years of life (13). As entry into forceof the Convention draws nearer, strengthening national capacity in tobacco control becomesan important public health priority in all countries.This section looks forward to the timely ratification, entry into force, and implementation ofthe FCTC and the opportunities thus presented for further progress in national tobacco control.It also examines the challenges of building and strengthening national political, managerialand technical tobacco control capacity.Guiding tobacco controlTotal tobacco consumption is on the rise. <strong>The</strong> number of smokers in the world, estimated at1.3 billion today, is expected to rise to 1.7 billion by 2025 if the global prevalence of tobaccouse remains unchanged (14). Every second smoker will die of a tobacco-caused disease. Untilrecently, the global response to this major public health challenge had been inadequate.In May 2003 the <strong>World</strong> <strong>Health</strong> Assembly adopted by consensus the WHO Framework Conventionon Tobacco Control (FCTC). Negotiated among WHO Member States over four years,this international legal instrument is designed to limit the harm to health caused by tobaccoproducts. It comprises many diverse aspects of tobacco control, including: advertising, promotionand sponsorship; packaging and labelling; price and tax measures; sales to and byyoung persons; passive smoking and smoke-free environments; and treatment of tobaccodependence. <strong>The</strong> Convention represents a global minimum standard, and the future Partiesto the Convention are encouraged by provisions in the treaty to go further and implementstricter measures. Furthermore, the negotiation of future protocols to the Convention by theConference of the Parties will result in a treaty regime that will continue to evolve and toprovide for more specific obligations on certain topics. <strong>The</strong> FCTC is a delicately balancedinstrument adopted after vigorous negotiations, which took into account relevant scientific,economic, social and political considerations.<strong>The</strong> FCTC’s adoption by the <strong>World</strong> <strong>Health</strong> Assembly opens the treaty for signature and ratificationby individual Member States. <strong>The</strong> Convention is available for signature from 16 June2003 until 29 June 2004, and from 30 June 2004 for ratification.<strong>The</strong> signing of the Convention indicates a Member State’s intention to ratify the treaty butdoes not carry substantial obligations other than agreeing not to undermine the objective ofthe Convention; it provides, however, an important political commitment by a country tomove towards ratification. Ratification provides the consent of a country to become legallybound by the treaty and commits it to implement the provisions of the treaty in good faithonce the treaty enters into force. <strong>The</strong> Convention will come into force of law 90 days after thetreaty has been ratified by 40 Member States. At that time, countries that have ratified it willbe legally bound by its provisions. Countries that do not ratify the treaty are not obliged toimplement its provisions.Not all treaties provide for funding and technical assistance for the implementation of theinstrument. <strong>The</strong> FCTC, however, belongs to the unique family of international agreementsthat undertakes to provide for such resources. <strong>The</strong> Convention commits Parties to providefunding for their national tobacco control measures, encourages the use of innovative national,regional and international funding mechanisms to provide additional resources fortobacco control, and leaves the question of the possible establishment of a voluntary globalfund or other appropriate financial mechanisms to be determined in the future by the Conferenceof the Parties. As evidence of the power of the FCTC process, the issue of tobaccocontrol has been placed firmly on the agenda of development funding as a priority.
Neglected Global Epidemics: three growing threats 93As in the negotiation of the FCTC, tobacco control activists in health professions, concernednongovernmental organizations and grass-roots groups have an important role on the internationalstage during the ratification process. <strong>The</strong>y can continue to promote the ratificationand implementation of the FCTC and the introduction of effective national legislation insupport of the Convention.National policies and programmesA comprehensive public health approach to tobacco control effectively prevents the beginningof tobacco use and promotes its cessation, through a range of measures including taxand price policy, restrictions on tobacco advertising, promotion and sponsorship, packagingand labelling requirements, educational campaigns, restrictions on smoking in public placesand cessation support services. A comprehensive approach must include young people andwomen and reach the entire population.National policies must also confront fresh challenges such as regulatory frameworks for newtobacco products that are just beginning to appear on the market. Moreover, with the adoptionof the FCTC, the definition of a comprehensive tobacco control strategy has now beenredefined to include the transnational components of tobacco control, as a complement tonational and local measures.Few countries have implemented the comprehensive measures needed to create a significantdecline in tobacco use. <strong>The</strong> policy measures known to have the biggest impact on individuallevels of consumption, cessation rates and initiation rates require sustained political will andengagement, and above all effective and well-enforced legislation.<strong>The</strong> capacity for effective tobacco control is lacking in most countries. Most do not have thenecessary infrastructure or human resources to sustain a basic tobacco control programme.As an example, few national governments have people working full-time on tobacco control.In many countries, civil society has not yet been mobilized around the issue, so even whengovernments have adequate political will to propose tobacco control measures, tobacco companiescan easily oppose and weaken policies. Even where the ministry of health is supportiveof action it may be unable to make its case successfully above the voices of other more influentialministries.Building national capacity<strong>The</strong> success of the Convention largely depends on countries ratifying the treaty and implementingeffective tobacco control measures. Building and strengthening national capacity inpolitical, managerial and technical aspects of tobacco control is the key to a systematicmultisectoral approach. Only this approach will ensure sustainable community and governmentalaction for comprehensive tobacco control efforts at the local, national and globallevels.Many countries have not yet developed national plans of action for tobacco control, largelybecause of lack of consensus and political commitment. Where such plans exist, policy instrumentsmay remain ineffective because of weak enforcement. Governments and civil societyneed to be convinced that investing resources to prepare for tobacco control will reapbenefits in the medium and longer term. Continuous monitoring of tobacco industry activitiesand strategies will be required to counteract the industry’s manoeuvres to underminetobacco control efforts. Strong political commitment and engagement are essential.
94 <strong>The</strong> <strong>World</strong> <strong>Health</strong> <strong>Report</strong> 2003While the health sector is in large measure supportive of tobacco control, it cannot on its ownbring the resources, expertise and political will needed to advance change. This requires supportand commitment from all the relevant sectors in the national government. Tobaccocontrol efforts are more likely to be sustained when incorporated into existing national, stateand district-level health structures.<strong>The</strong> expected outcome of building national capacity is a comprehensive, effective and sustainablestrategy for multisectoral national tobacco control programmes and policies. Here,the role of WHO is to coordinate global expertise, enhance leadership, facilitate assistance tofront-line efforts, and promote partnerships with governments and civil society to foster theimplementation of more effective tobacco control strategies. Many success stories are availableto guide countries; two are summarized in Box 6.2.Integrating tobacco control into health systemsTreatment of tobacco dependence is another possible policy measure in low-income and middle-incomecountries (17). As the projections in Figure 6.2 demonstrate, a mix of effectiveprevention and treatment measures will avert significantly more tobacco-caused deaths withinthe coming decades compared with prevention alone (18). Cessation programmes for adultsmokers are essential for rapid population health improvements over the next 20–30 years,since the benefits of preventing young people from taking up smoking will become apparentonly after several decades. <strong>The</strong> Global Youth Tobacco Survey showed that most young smokersin the Western Pacific Region wished to stop smoking (see Box 6.3).<strong>The</strong> delivery of cost-effective treatment of tobacco dependence in most countries is hamperedby many factors, including: the lack of integration of tobacco dependence treatmentinto health care systems; lack of skills of health care providers; high price of nicotine replacementtherapy products and cessation services; and the strict regulation of such products.Support and greater access to treatment provided through the health care systems will helpthe poor populations who are most likely to smoke (19). All health providers must be involved,including oral health professionals who, in many countries, reach a large proportionof the healthy population. A supportive environment is essential to support smoking cessationprogrammes and this requires strong government action, for example, in the promotionof smoke-free environments and communication and awareness measures to reduce the socialacceptability of tobacco use (20).Box 6.2 Examples of successful tobacco control strategiesTobacco excise taxation in South Africa<strong>The</strong> past 10 years have witnessed a major shift in government policy ontobacco control in South Africa, which rests on two important pillars:legislation and excise tax increases. <strong>The</strong> government elected in 1994announced an increase in tax on tobacco products to 50% of the retailprice (at that point, excise taxes amounted to 21% of the retail priceand the total tax burden was 32% of the retail price). In 1997, theMinister of Finance announced that the 50% target had been achieved.Subsequent tax increases were aimed at keeping the tax percentage atthe same level. Over the past decade the real retail price has more thandoubled: cigarettes, compared with a basket of other goods and services,have become very expensive. Along with other tobacco controlinterventions, tax increases have contributed to a 33% reductionin tobacco consumption. In addition, real government revenue from tobaccotaxes has more than doubled (15).<strong>Health</strong> warnings in Thailand<strong>The</strong> first health warnings on cigarette packets in Thailand were introducedin 1974. Since 1989, many changes have been made to the messages,as an important component of a comprehensive control policy.<strong>The</strong> health warnings were improved in stages, with a greater variety oftexts and stronger language. <strong>The</strong> number of rotating warnings has increasedfrom one to twelve. <strong>The</strong> size of the warning area on cigarettepackages and cartons has increased to one-third of the principal surfaces.A new set of pictorial health messages, occupying half of the frontand back display areas, was prepared and submitted to the Ministry of<strong>Health</strong> in 2003 and is currently awaiting the approval of the Governmentof Thailand. Per capita cigarette consumption has been decreasingsince the mid-1990s as a result of Thailand’s comprehensive controlpolicies (16).
Neglected Global Epidemics: three growing threats 95One of the most advanced mixes of population-level smoking cessation initiatives is in NewZealand, where 50% of the indigenous population are smokers (21). Services include a nationalQuitline, subsidized nicotine replacement therapy, Maori-focused services includingquitting support and therapy for Maori women and their families, and a hospital-based quittingservice. Key factors in establishing programmes including cessation activities are mediacampaigns, an active tobacco control lobby, proactive policy analysts and a supportive government;tax increases also create incentives to help people to stop smoking.<strong>The</strong> FCTC is a global response to the pandemic of tobacco-induced death and disease. <strong>The</strong>opening of the Convention for signature and ratification provides an unprecedented opportunityfor countries to strengthen national tobacco control capacity. Success in controllingthe tobacco epidemic requires continuing political engagement and additional resources atboth global and national levels. <strong>The</strong> resulting improvement in health, especially of poorpopulations, will be a major public health achievement.Road traffic hazards: hidden epidemicsMore than 20 million people are severely injured or killed on the world’s roads each year. <strong>The</strong>burden falls most heavily on developing countries, where it will grow heavier still because ofthe rapid increase in the number of vehicles.In addition to the direct costs of road injuries and deaths, the increase in the number ofvehicles and reliance on certain transport policies have other serious health implications aswell as wider social, economic and environmental impacts (22). In some countries, air pollutionfrom road transport causes even more deaths than those resulting from traffic accidents(23). Besides the direct impacts on respiratory and heart disease, motorized transport producesaround a quarter of the anthropogenic emissions of gases leading to climate change(24). <strong>The</strong>se “hidden epidemics” receive relatively little national or international attentioncompared with the focus on major communicable and noncommunicable diseases.To a large extent, road injuries are preventable. <strong>The</strong>re are many available and affordable interventionsthat can prevent injuries and save lives: to date, most of the evaluation of theseFigure 6.2 Projected tobacco-related mortality patterns20Cumulative deaths (millions)18161412108642Current courseEffective preventionIncreased treatmentand tobacco control02000 2005 2010 2015 2020 2025 2030 2035 2040 2045 2050Source: (18).Year
96 <strong>The</strong> <strong>World</strong> <strong>Health</strong> <strong>Report</strong> 2003interventions has been carried out in developed countries, and more research is needed ontheir effectiveness in developing countries. Renewed efforts are under way to increase worldwideawareness of the problem and its solutions and to encourage the introduction of roadsafety policies and practices. Several countries are using integrated strategies to deal withtraffic risks and enhance the benefits of transport and land use policies to promote physicalactivity and cohesive projects for community development (25).<strong>The</strong> epidemic of road traffic injuries in developing countries is still in its early stages, but itthreatens to grow exponentially unless there is swift action to counter it (26). Low-incomeand middle-income countries already bear the brunt of 90% of the disability-adjusted lifeyears (DALYs) lost to road traffic injuries and deaths. While fatality rates in high-incomecountries are declining, they are rapidly accelerating in the developing world, especially inAsia (27). <strong>The</strong> problem is so severe that, by 2020, road crash injuries are likely to represent thethird leading cause worldwide of DALYs lost (28). By then, road traffic deaths are expected toincrease by 92% in China and 147% in India, with an average increase of 80% in many otherdeveloping countries (29).In addition to the unacceptable human toll, the global economic cost of road crashes hasbeen estimated at about US$ 518 billion annually, of which the developing country share isabout US$ 65 billion (27). Countries struggling for economic development clearly cannotafford such losses, which have a significant impact on national health care systems. Injuriesaccount for approximately one-third of the acute patient load in many hospitals in lowincomeand middle-income countries, and between 30% and 86% of all trauma admissions(30); road traffic injuries constitute the majority of such admissions.Although more than 3000 people are killed each day, full recognition of the scale of the problemis obscured because road crashes usually cause only a few deaths at a time and generatelittle press coverage, contributing to the hidden nature of the epidemic of road traffic injuries.In contrast to some other epidemics, road traffic injuries are largely influenced by decisionsand choices at both policy and individual levels, which means that the problem is amenableto control. Vehicles in developing countries are known to have a far more lethal impact thanthose in highly motorized countries – by as much as 200-fold in some cases (27). As thenumber of cars increases rapidly in developing countries, the roads are becoming significantlymore dangerous; in the same way that the increased vehicle usage can be forecast, socan the expected deaths and injuries for vulnerable road users. A global commitment to bringBox 6.3 Tobacco and schoolchildren in the Western Pacific RegionAlarmingly high rates of tobacco use and exposure to second-hand smokeamong schoolchildren aged 13–15 years in the Western Pacific Regionare revealed by data from the first group of countries within the Regionto complete the Global Youth Tobacco Survey. Many of these childrenstarted smoking before the age of 10, and an overwhelming majoritywant to quit but are unable to do so because of nicotine addiction.<strong>The</strong> survey involved China, Fiji, the Northern Mariana Islands, Palau,the Philippines and Singapore. It found that in some parts of China,between 20% and 40% of children started smoking before they were10 years old, compared with 14% in the Philippines, about 22% in Fijiand Singapore, and 31–32 % in Northern Mariana Islands and Palau.Overall, between 35% and 65% had been exposed to others’ smoke athome.<strong>The</strong> desire to stop smoking was expressed by up to 87% of childsmokers in China and 85% in the Philippines, and not less than 62% ofall the children in the survey. <strong>The</strong>se figures indicate an urgent need forinterventions that target children and adolescents, to empower them toreject tobacco. For those already addicted, cessation strategies appropriateto this age group are imperative. In addition, there is a clear andpressing need for effective measures to ensure that children and youngpeople are protected from the effects of second-hand smoke exposure.To protect children properly, WHO urges governments to establish comprehensivetobacco control programmes that adhere to the principlesoutlined in the Framework Convention on Tobacco Control.
Neglected Global Epidemics: three growing threats 97this epidemic under control can succeed, but it will need intersectoral collaboration, targetedpolicies and national action plans. With an estimated 1.3 million fatalities each year fromroad traffic injuries, the opportunity of saving so many lives must be grasped.Sharing responsibility for safetyEvidence from developed countries shows that crashes are preventable and interventions havealready saved hundreds of thousands of lives. <strong>The</strong> existing data highlight the need for anapproach to road safety which recognizes that the driver, the vehicle, and the built environmentmake up three components of a dynamic system within which safety is a shared responsibility.This approach seeks to identify all sources of error or design weakness that contributeto road traffic injuries and then tries to mitigate the consequences (31).In many developed countries, the past few decades have witnessed many improvements insafety measures for vehicles, roadways and drivers. Innovations in cars include impactabsorbingfront ends, collapsible steering columns, seat belts, integral head-rests, airbags andchild seats. Roadway designs have been improved to place barriers between traffic moving inopposite directions and to eliminate highway intersections. Pedestrians have been separatedfrom vehicles by roadside barriers, street lighting has been improved, and speed bumps havebeen created to slow the traffic. <strong>The</strong> wearing of seat belts for drivers and passengers andhelmets for motorcyclists has been made obligatory, and strict laws for speeding and drinkdrivinghave been introduced and enforced. Hundreds of thousands of lives have been savedas a result of these measures. For example, death rates related to motor vehicles dropped inthe United States by more than 40% between 1966 and 1997.Proven cost-effective interventions in developed countries can be effective for low-incomecountries too. For maximum impact, all prevention strategies should be used in conjunctionwith effective law enforcement (32).While the data on safety interventions are compelling, existing knowledge needs to be adaptedso as to underpin successful interventions in developing countries. <strong>The</strong> unique road safetycircumstances of each country and region are important subjects for research. Lifestyle andother factors behind the contrasting patterns in road casualties between poor and rich countriesalso need to be better understood. For example, in wealthier countries, most peopleinjured in a crash are inside the vehicle. In poorer countries, however, the majority of victimsare the most vulnerable road users: pedestrians, cyclists, and passengers on public transport (33).In many countries, bicycles and motorcycles are the cheapest and most dangerous form oftransport (34), sharing the road with cars, buses and trucks. Cyclists, motorcyclists and theirpassengers are very vulnerable to speed and poor visibility, and those without safety helmetsor other protection are particularly at risk. Brain injuries are a common cause of death inroad crashes involving two-wheeled vehicles. <strong>The</strong> use of lights during the daytime showspromising results, as they make the cyclists and motorcylists more conspicuous.Mobilizing actionMany political leaders are not fully aware of the magnitude and severity of road traffic injuries.Long-term awareness and advocacy campaigns are required to generate immediate andsustained action to promote global and national road safety. WHO has been increasinglyinvolved in road traffic injury prevention in recent years. In 2001 it developed a five-yearstrategy for road traffic injury prevention to provide guidance to researchers, practitionersand policy-makers and to raise public awareness of road traffic injury prevention (35). This
98 <strong>The</strong> <strong>World</strong> <strong>Health</strong> <strong>Report</strong> 2003strategy, which emphasizes epidemiology, prevention and advocacy, is currently being implementedwith active WHO participation in a number of countries, including Cambodia, Ethiopia,Mexico, Poland and Viet Nam.<strong>World</strong> <strong>Health</strong> Day, which is celebrated around the world on 7 April each year, will focus in2004 on road safety and will be marked by the launch of the <strong>World</strong> <strong>Report</strong> on Road TrafficInjury Prevention, to be published by WHO in collaboration with the <strong>World</strong> Bank. This reportwill document comprehensively the determinants and magnitude of road traffic injuriesand will propose science-based evidence and solutions. In May 2003, the United NationsGeneral Assembly recognized road injuries as a global epidemic, and a special session of theUnited Nations General Assembly in April 2004 is planned in conjunction with <strong>World</strong> <strong>Health</strong>Day to promote road safety and encourage countries to develop national plans. UNICEF, theUnited Nations Development Programme, the United Nations Department for Economicand Social Affairs, and other organizations, are also helping to raise awareness.Country leaders and civil society should be encouraged to recognize the burden of deathsand injuries on their roads and to commit themselves to reducing it. National programmes toimprove road safety will require not just participation of the public health and transportsectors, but also support from decision-makers in justice, law enforcement, health care, educationand urban design sectors. In addition, governmental efforts will need support fromnongovernmental organizations and professional societies.A comprehensive assessment of each country’s road safety system will identify the details ofthe current burden (who is injured or killed; where, when, and how the incident took place),the options for reducing that burden, the spectrum of players from different sectors that canbe involved and trained, and the unique challenges within the country. <strong>The</strong> types of trainedpeople needed to prevent and treat road traffic injuries will depend on the country’s currentcapacity and its success in attracting additional resources.Public health has traditionally been strong in disease surveillance: gathering and using informationabout the patterns, risk factors and effectiveness of interventions to prevent and mitigatea disease. Surveillance and research skills can be applied to road traffic injuries, andtraditional public health assessments can be expanded to include other critical parts of thecountry’s systems. After completing and analysing the assessment, all sectors can collaborateto develop and implement a plan to change roads, laws, vehicle designs and behaviour thatwill save lives. Poor countries will need outside support to build the capacity to implementroad safety measures.Injury prevention, safety and treatmentPrevention, safety and treatment are the three primary aspects of a national plan to reduceroad injuries. All three components need both short-term and long-term planning and surveillanceto track progress and successes. Legislation and enforcement will be essential.<strong>The</strong> first and most important objective is to prevent a crash from happening. Some countrieshave already made progress in prevention by separating pedestrians from cars and trucks,creating barriers and fences, building guard-rails, widening shoulders, and eliminating “blackspots” where road crashes are most likely to happen. Additional successful efforts includespeed control measures such as installing rumble strips and speed bumps (see Box 6.4),enforcing speed limits and severe laws on drinking and driving (32).Second, in the event of a crash, injuries can be minimized if drivers have taken safety precautionssuch as wearing helmets and seat belts. Crash-resistant vehicles can be built or
Neglected Global Epidemics: three growing threats 99imported with improved safety features such as rollover protection. Third, countries needeffective trauma response systems in order to transport and treat victims without delay andto rehabilitate them. Rapid, efficient, emergency response systems can reduce morbidity andmortality. Quality rehabilitation care should be incorporated as part of a comprehensive planto care for the injured (36).Improving road safety requires strong commitment by governments to establish, finance andsustain road safety programmes. Collaboration with other stakeholders – global, nationaland local – will accelerate progress and contribute to the development of more sustainableforms of public and private transport. Countries can begin with a commitment to gathermore assessment data and build a comprehensive database to monitor and evaluate nationalplans. As the knowledge base on road traffic injuries expands, there is greater scope for collaborationbetween countries and across disciplines and agencies. This collaboration will bea key element in shaping a rapid response to the epidemic, especially in poorer countries, andin ensuring a reduced impact on the global environment.Because the burden of such injuries and deaths falls disproportionately on poor countries, itis important to pursue the goal of global safety equity, in which all persons have equal accessto the means of assuring safety. To achieve this, these countries will need to build infrastructureand human resource capacity, and will look to developed countries for assistance. Governmentscan be encouraged to view road safety and protection from injury as an importantcontributor to sustainable economic, social and environmental development and to mobilizethe necessary forces for effective prevention of an epidemic that, while largely hidden today,will become increasingly visible unless action is taken to control it.Integrating road safety with broader policiesIn most countries, the most insidious impact of road transport is air pollution, which causespublic concern in both rich and poor countries. Estimates of the impact of air pollution onhealth indicate that this concern is justified. In Austria, France and Switzerland the numberof deaths related to air pollution from traffic is twice the number of deaths from traffic accidents(23). In addition, gases that cause climate change – a quarter of which come fromtransport (24) – are expected to contribute to extreme weather events including floods anddroughts, and changes in the habitat of disease vectors such as mosquitoes, with major healthconsequences (37).Current transport patterns have many other consequences to health (22), including pervasiveannoyance induced by traffic noise; adverse effects on rates of cardiovascular disease,diabetes, obesity and some cancers by discouraging the use of safe cycling and walking fortransport (38); and constraints on the development of neighbourhood support networks.Box 6.4 A low-cost road safety strategy: speed bumps in GhanaRoad traffic crashes are a serious problem in Ghana, where the fatalityrate per 10 000 vehicles is about 30–40 times higher than that in highincomecountries. As excessive speed on interurban highways and inbuilt-up areas has been identified as one of the key factors contributingto crashes, speed bumps have been installed at some crash-pronelocations on the highways, in order to lower the speed of vehicles andimprove the traffic environment for other road users such as pedestriansand cyclists. Low-cost rumble strips have been installed on the mainAccra-Kumasi highway at a collision hot spot. Lower vehicle speedsreduce kinetic energy (which causes injuries and deaths on impact) aswell as increasing the time to collision, thereby preventing crashes.<strong>The</strong> use of speed bumps and rumble strips has been effective onGhanaian roads. During the 16-month period between January 2000and April 2001, traffic crashes were reduced by 35%, fatalities by 55%and serious injuries by 76%. <strong>The</strong>se speed-reducing measures alsosucceeded in eliminating certain kinds of crashes and improving pedestriansafety.
100 <strong>The</strong> <strong>World</strong> <strong>Health</strong> <strong>Report</strong> 2003<strong>The</strong>se consequences have a disproportionally adverse effect on the urban poor, because urbanareas have higher levels of pollution and often provide fewer options for physical activity (39).Traffic injuries are also higher among the urban poor, as they tend to live in areas of highertraffic volume – with a greater proportion of vehicles exceeding speed limits (40, 41). Inaddition, there is a clear relationship between degree of social and economic deprivation andrisk of injury in children (42, 43). Reasons for these differences include the need for childrenof families without a car to cross a greater number of roads than children whose families owna car (44). <strong>The</strong>se intra-urban inequalities provide a focus for policy action: reducing healthrisks among the poor is a powerful tool for poverty reduction (45).Policies adopted to reduce traffic-related air pollution do not usually consider the other healthimpacts of traffic such as traffic crashes and injuries, and vice versa (46). <strong>Health</strong> systems havean important role to play in the development of integrated transport strategies that takeaccount of all relevant health impacts (25). <strong>Health</strong> impact assessment tools 1 can be used tohelp visualize the expected health implications of transport policies and make suggestions onhow they can be modified to maximize overall health benefits and minimize health inequalities(47).All of the subjects of the previous chapters in this report have one point in common: theyrepresent major issues that cannot be successfully resolved without the benefit of a stronghealth system. <strong>The</strong> fate of the child with malaria in Africa, the middle-aged man with diabetesin Latin America, and the mother infected with HIV in Asia may all depend on the strengthof their national health system. Chapter 7 finds that many such systems are sadly inadequateto cope with the challenges they face, and suggests initiatives to make them fit for the future.1 See web site http:\\www.who.int/hia.
Neglected Global Epidemics: three growing threats 101References1. <strong>The</strong> world health report 2002 – Reducing risks, promoting healthy life. Geneva, <strong>World</strong> <strong>Health</strong> Organization,2002.2. Yusuf S et al. Global burden of cardiovascular diseases. Part I: General considerations, the epidemiologictransition, risk factors and impact of urbanization. Circulation, 2001, 104:2746–2753.3. Beaglehole R. Global cardiovascular disease prevention: time to get serious. Lancet, 2001, 358:661–663.4. Magnus P, Beaglehole R. <strong>The</strong> real contribution of the major risk factors to the coronary epidemics: time toend the “Only-50%” myth. Archives of Internal Medicine, 2001, 161:2657–2660.5. Rose G. <strong>The</strong> strategy of preventive medicine. Oxford, Oxford University Press, 1992.6. Yusuf S. Two decades of progress in preventing vascular disease. Lancet, 2002, 360:2–3.7. Diet, nutrition and the prevention of chronic disease. <strong>Report</strong> of a Joint WHO/FAO Expert Consultation. Geneva,<strong>World</strong> <strong>Health</strong> Organization, 2003 (WHO Technical <strong>Report</strong> Series, No. 916).8. Tonga commitment to promote healthy lifestyles and supportive environment. Manila, <strong>World</strong> <strong>Health</strong>Organization Regional Office for the Western Pacific, 2003.9. Alwan A, MacLean D, Mandil A. Assessment of national capacity for noncommunicable disease prevention andcontrol. Geneva, <strong>World</strong> <strong>Health</strong> Organization, 2001.10. Armstrong T, Bonita R. Capacity building for an integrated noncommunicable disease risk factorsurveillance system in developing countries. Ethnicity and Disease, 2003, 13(Suppl 2):S2–13;S2–18.11. Strong K, Bonita R. <strong>The</strong> SuRF report. 1. Surveillance of risk factors related to noncommunicable diseases:current status of global data. Geneva, <strong>World</strong> <strong>Health</strong> Organization, 2003.12. Ezzati M, Lopez AD. Estimates of global mortality attributable to smoking in 2000. Lancet, 2003,362:847–852.13. Peto R et al. Mortality from smoking in developed countries 1950-2000, 2nd ed. Oxford, Oxford UniversityClinical Trial Service Unit (http://www.ctsu.ox.ac.uk/~tobacco/, accessed 2 September 2003).14. Guindon GE, Boisclair D. Past, current and future trends in tobacco use. Washington, DC, <strong>World</strong> Bank, 2003(HNP Discussion Paper No. 6, Economics of Tobacco Control Paper No. 6).15. Van Walbeek C. Tobacco excise taxation in South Africa. Geneva, <strong>World</strong> <strong>Health</strong> Organization, 2003 (WHO/NMH/TFI/FTC/03.4).16. Chitanondh H. Thailand country report on tobacco advertising and promotional bans. Geneva, <strong>World</strong> <strong>Health</strong>Organization, 2003 (WHO/NMH/TFI/FTC/03.9).17. Curbing the epidemic: governments and the economics of tobacco control. Washington, DC, <strong>World</strong> Bank, 1999.18. Henningfield JE, Slade J. Tobacco-dependence medications: public health and regulatory issues. Food, Drugand Law Journal, 1988, 53(Suppl):75–114.19. Friend K, Levy D. Smoking treatment interventions and policies to promote their use: critical review.Nicotine and Tobacco Research, 2001, 3:299–310.20. Policy recommendations for smoking cessation and treatment of tobacco dependence. Geneva, <strong>World</strong> <strong>Health</strong>Organization, 2003.21. Price L, Allen M. Effective access to tobacco dependence treatment, New Zealand. Geneva, <strong>World</strong> <strong>Health</strong>Organization, 2003 (WHO/NMH/TFI/FTC/03.8).22. Dora C, Phillips M. Transport, environment and health. Copenhagen, <strong>World</strong> <strong>Health</strong> Organization RegionalOffice for Europe, 2000 (WHO Regional Publications, European Series, No. 89; http://www.euro.who.int/transport/publications/20021008_1, accessed 23 September 2003).23. Kunzli N et al. Public health impacts of outdoor and traffic-related air pollution: a European assessment.Lancet, 2000, 356:795–801 (http://www.euro.who.int/transport/HIA/20021107_3, accessed 23 September2003).24. Metz B et al., eds. Climate change 2001. Mitigation. Cambridge, Cambridge University Press for theIntergovernmental Panel on Climate Change (IPCC), 2001.25. Dora C, Racioppi F. Including health in transport policy agendas: the role of health impact assessmentanalyses and procedures in the European experience. Bulletin of the <strong>World</strong> <strong>Health</strong> Organization, 2003,81:399–403.26. Rosenberg ML, Rogmans W. <strong>The</strong> global challenge of road traffic injuries. Foreword. Injury Control andSafety Promotion, 2003, 10:1.27. Jacobs G, Aaron-Thomas A, Astrop A. Estimating global road fatalities. London, Transport ResearchLaboratory, 2000 (TRL <strong>Report</strong> No. 445).28. Murray CJL, Lopez A, eds. <strong>The</strong> global burden of disease: a comprehensive assessment of mortality and disabilityfrom diseases, injuries and risk factors in 1990 and projected to 2020. Cambridge, MA, Harvard School ofPublic <strong>Health</strong> on behalf of the <strong>World</strong> <strong>Health</strong> Organization and the <strong>World</strong> Bank, 1999 (Global Burden ofDisease and Injury Series, Vol. I).
102 <strong>The</strong> <strong>World</strong> <strong>Health</strong> <strong>Report</strong> 200329. Kopits E, Cropper M. Traffic fatalities and economic growth. Washington, DC, <strong>World</strong> Bank, 2003 (PolicyResearch Working Paper No. 3035).30. Odero W, Garner P, Zwi A. Road traffic injuries in developing countries: a comprehensive review ofepidemiological studies. Tropical Medicine and International <strong>Health</strong> 1997; 2:445–460.31. Ward D. <strong>The</strong> UN can make a special contribution to road safety. New York, NY, United Nations, 29 May 2003.32. Forjuoh S. Traffic-related injury prevention interventions for low-income countries. Injury Control andSafety Promotion, 2003, 10:109–118.33. Nantulya VM, Reich MR. Equity dimensions of road traffic injuries in low- and middle-income countries.Injury Control and Safety Promotion, 2003, 10:13–20.34. McCormac D. Traffic in Vietnam. Fulbright Economics Teaching Program case study(http://www.fetp.edu.vn/Research_casestudy/display.cfm?fileid=43, accessed 23 September 2003).35. A 5-year WHO strategy for road traffic injury prevention. Geneva, <strong>World</strong> <strong>Health</strong> Organization, 2001 (WHO/NMH/VIP/01.03).36. Mock C, Arriola-Risa C, Quansah R. Strengthening care for injured persons in less developed countries: acase study of Ghana and Mexico. Injury Control and Safety Promotion, 2003, 10:45–51.37. McMichael AJ et al., eds. Climate change and human health: risks and responses. Geneva, <strong>World</strong> <strong>Health</strong>Organization, 2003.38. Racioppi F et al. A physical active life through everyday transport: with a special focus on children and olderpeople. Copenhagen, <strong>World</strong> <strong>Health</strong> Organization Regional Office for Europe, 2002(http://www.euro.who.int/document/e75662.pdf, accessed 15 September 2003).39. Road transport and health. London, British Medical Association, 1997.40. Mueller B et al. Environmental factors and risks for childhood pedestrian-motor vehicle collisionoccurrence. American Journal of Epidemiology, 1990, 132:550–560.41. Stevenson M et al. A case control study of traffic risk factors and child pedestrian injury. InternationalJournal of Epidemiology, 1995, 24:957–964.42. Safety of vulnerable road users. Paris, Organisation for Economic Co-operation and Development, 1999.43. Joly M et al. Geographical and socio-ecological variations of traffic accidents among children. Social Scienceand Medicine, 1991, 33:765–769.44. DiGiuseppi C et al. Influence of changing travel patterns on child death rates from injuries: trend analysis.British Medical Journal, 1977, 314:710–713.45. Macroeconomics and health: investing in health for economic development. <strong>Report</strong> of the Commission onMacroeconomics and <strong>Health</strong>. Geneva, <strong>World</strong> <strong>Health</strong> Organization, 2001.46. Tiwari G. Transport and land-use policies in Delhi. Bulletin of the <strong>World</strong> <strong>Health</strong> Organization, 2003,81:444–450.47. Berensson K, Millar S. Focusing on health – HIA. How can the health impact of policy decisions be assessed?(http://www.who.int/hia/tools/toolkit/whohia038/en/, accessed 23 September 2003).
<strong>Health</strong> Systems: principled integrated care 103Chapter Seven<strong>Health</strong> Systems:principled integrated careTo meet the formidable challenges described earlier, this chaptercalls for the reinforcement of health systems to be basedon the core principles of primary health care as outlined atAlma-Ata in 1978: universal access and coverage on the basisof need; health equity as part of development oriented tosocial justice; community participation in defining and implementinghealth agendas; and intersectoral approaches tohealth. <strong>The</strong>se principles remain valid, but must be reinterpretedin light of the dramatic changes in the health field during thepast 25 years. Four important issues that health systems mustconfront are examined: the global health workforce crisis, inadequatehealth information, lack of financial resources, andthe stewardship challenge of implementing pro-equity healthpolicies in a pluralistic environment.
104 <strong>The</strong> <strong>World</strong> <strong>Health</strong> <strong>Report</strong> 2003
<strong>Health</strong> Systems: principled integrated care 1057<strong>Health</strong> Systems:principled integrated careConfronting the global health challenges examined in the previous chapters requires healthsystems to be strengthened. Without this, the health goals described in this report will remainbeyond reach. <strong>The</strong> lessons learnt from past successes, including the skills and strategiesdeveloped from the experiences of tackling polio and SARS, must be applied in combatingthe HIV/AIDS treatment emergency and in working towards the Millennium DevelopmentGoals (MDGs). Progress towards these and other objectives will not be sustainable unlessspecific health targets – including the “3 by 5” target of reaching three million people indeveloping countries with combination antiretroviral therapy for HIV/AIDS by the end of2005 – support a broad horizontal build-up of the capacities of health systems.Despite the health reforms of recent decades, inadequate progress has been made in buildinghealth systems that promote collective health improvement. Now, however, fresh opportunitiesare emerging. <strong>Health</strong> stands high on the international development agenda, and newfunds are becoming available for health work in poor countries. Extending health-enablingconditions and quality care to all is the major imperative for health systems.This chapter explores how the values and practices of primary health care, adapted to therealities of today’s complex health landscape, might provide a basis for the improvement ofhealth systems. It reviews basic ideas about primary health care and clarifies the concept ofthe development of health systems that are based on primary health care. It then examinesfour major challenges facing health systems: the global health workforce crisis; the lack ofappropriate, timely evidence; the lack of financial resources; and the stewardship challenge ofimplementing pro-equity health policies in a pluralistic environment. <strong>The</strong> final section looksat how WHO is working with countries to clarify health systems goals and to strengthensystems in line with primary health care principles.<strong>The</strong> health system comprises all organizations, institutions and resources that produce actionswhose primary purpose is to improve health (1). <strong>The</strong> health care system refers to theinstitutions, people and resources involved in delivering health care to individuals. This chapteris mostly concerned with health care systems. Nevertheless, health care providers are ofteninvolved in promoting health-enabling conditions in the community. Indeed, this relationshipbetween patient care and public health functions is one of the defining characteristics ofthe primary health care approach.<strong>The</strong> health systems performance assessment framework developed by WHO in the late 1990swas an attempt to put into effect the primary health care concern for equity and populationhealth outcomes, by providing analytical tools to translate these concerns into relevant
106 <strong>The</strong> <strong>World</strong> <strong>Health</strong> <strong>Report</strong> 2003evidence. <strong>The</strong> framework drew the attention of policy-makers to issues such as the catastrophichealth expenditure in a number of countries. Although this report does not directlyapply the framework, it assumes that policy-makers will use this and other relevant tools tomeasure the success of an approach to health systems scale-up based on primary health care.Valuable knowledge has been gained in recent years about how health systems work and whythey fail. Initiatives such as the European Observatory on <strong>Health</strong> Care Systems are producingimportant insights (see Box 7.1), though fundamental questions remain unresolved. Thisreport does not propose a complete model of the development of health systems based onprimary health care, which would be impossible given the current state of evidence. <strong>The</strong> aimis to open lines of enquiry that will be of use to countries and international health partners asthey weigh options and take action to strengthen systems, making them responsive to theneeds and demands of all, especially the poor.<strong>The</strong> core principles of primary health carePrimary health care became a core policy for WHO in 1978, with the adoption of the Declarationof Alma-Ata and the strategy of “<strong>Health</strong> for all by the year 2000”. Twenty-five yearslater, international support for the values of primary health care remains strong. Preliminaryresults of a major review suggest that many in the global health community consider a primaryhealth care orientation to be crucial for equitable progress in health (2).No uniform, universally applicable definition of primary health care exists. Ambiguities werepresent in the Alma-Ata document, in which the concept was discussed as both a level of careand an overall approach to health policy and service provision. In high-income and middleincomecountries, primary health care is mainly understood to be the first level of care. Inlow-income countries where significant challenges in access to health care persist, it is seenmore as a system-wide strategy.Box 7.1 <strong>The</strong> European Observatory on <strong>Health</strong> Care SystemsCountries in the European Region – diverse in terms of language, historyand wealth – have an array of approaches to the organization ofhealth systems. <strong>The</strong> European Observatory on <strong>Health</strong> Care Systems andpolicies seeks to disseminate information on more than a decade ofchange, analysing the reforms and generating evidence on what worksin different contexts and why. It ensures that Europe’s national policymakerscan set their own experiences in the European context and makecomparisons across borders, draw on thematic and comparative analysisof the key challenges they face, and have access to clear, practicalevidence.<strong>The</strong> Observatory is a partnership that brings together the WHORegional Office for Europe, governments (Greece, Norway and Spain),international and nongovernmental agencies (the European InvestmentBank, the Open Society Institute, and the <strong>World</strong> Bank) and academia(the London School of Economics and Political Science and the LondonSchool of Hygiene and Tropical Medicine). All the Observatory’s materialsare available on its web site. 1Information and monitoring. <strong>The</strong> <strong>Health</strong> System in Transitionseries of 70 country profiles provides analytical answers to a standardset of questions and uses clear definitions to create a baseline of information,drawing attention to what is distinct about a particular country.<strong>The</strong> Observatory covers the whole European Region and some additionalOECD countries, to allow systematic comparisons and the reviewof reforms over time.Analysis. <strong>The</strong> Observatory produces comprehensive studies on keyhealth system and policy areas, including hospitals, funding, regulation,European enlargement, social health insurance, purchasing, primary care,pharmaceuticals, mental health, human resources, and targets. It usessecondary or meta-analytical research, bringing together experts fromacross Europe to synthesize existing findings, to work country experiencesinto a conceptual framework and to draw out practical lessonsand options.Dissemination. Engaging with policy-makers and their advisershelps ensure they can use the information and analyses generated. <strong>The</strong>Observatory runs seminars and workshops for small groups of high levelpolicy-makers, often in partnership with agencies supporting health systemand policy reform, on matters such as funding options, the implicationsof EU accession for new Member States, or equity.1 www.observatory.dk.
<strong>Health</strong> Systems: principled integrated care 107It is useful to understand primary health care as involving both core principles and a variableset of basic activities. For the purposes of this discussion, it is the principles that are mostsignificant (3), including:– universal access to care and coverage on the basis of need;– commitment to health equity as part of development oriented to social justice;– community participation in defining and implementing health agendas;– intersectoral approaches to health.Enduring principles in a changing environment<strong>The</strong> global, national and local environments in which primary health care values must betranslated into action have changed fundamentally in the past 25 years. Key demographicand epidemiological shifts include ageing populations, the explosion of HIV/AIDS, and theexpanding double burden of diseases in low-income and middle-income countries (see theexample in Box 7.2). Advances in health technology have transformed many aspects of medicalpractice and raised expectations concerning the types of functions and services that healthsystems should provide.<strong>The</strong> institutional context of health policy-making and health care delivery has also changed.Government responsibilities and objectives in the health sector have been redefined, withprivate sector entities, both for-profit and not-for-profit, playing an increasingly visible rolein health care provision. <strong>The</strong> reasons for collaborative patterns vary, but chronic underfundingof publicly financed health services is often an important factor. Processes of decentralizationand health sector reform have had mixed effects on health care system performance (4).<strong>The</strong> ideas and activities associated with primary health care have themselves undergonechanges. In the 1980s, the approach termed “selective primary health care” gained favour. Byfocusing on the technical challenges of delivering limited basic interventions in poor areas,this strategy encouraged “vertical” programme structures. <strong>The</strong>se programmes producedBox 7.2 Primary care in a changing environment: the “health houses” of the Islamic Republic of Iran<strong>The</strong> Government of the Islamic Republic of Iran has invested strongly intraining health care providers. Primary health care facilities, popularlyknown as “health houses”, provide an active network staffed by communityhealth workers, or behvarzes, who are trained and regularly supervisedby staff from district health centres. <strong>The</strong> behvarzes provide basiccare and advice on many aspects of maternal and child health and commoncommunicable diseases. <strong>The</strong>y also record local health informationthrough the “vital horoscope” data system, which includes informationcollected during annual household visits. This system provides valuableinformation for planning services both locally and nationally. <strong>The</strong>re arehigh levels of community involvement in the delivery of community-basedhealth care; 90% of the population belongs to a health insurance scheme,and some schemes are explicitly designed to protect the poor.Today, the Islamic Republic of Iran faces several challenges to maintainingthese achievements in a changing environment. <strong>The</strong> country’sepidemiological profile has changed, partly as a consequence of thesuccess of the strategy led by primary care. <strong>The</strong> major burden of diseaseis attributable to noncommunicable diseases and injuries, though thereare some differences between richer and poorer provinces. Urbanizationis increasing, with an associated change in lifestyle. <strong>The</strong> privatehealth sector is increasing. Clinical case management is often not asevidence-based as it could be. A recent study on health financing demonstratedthat the financing system is not as equitable as had beenthought: out-of-pocket payments are high, and the poor are less wellprotected from catastrophic health expenditures than they were previously.<strong>The</strong> government is moving to respond to these new challenges. Itis already beginning to reorient the primary health care activities deliveredin health houses. Technical guidelines for interventions and trainingfor different cadres of health worker are being reviewed as part ofan effort to improve quality of care. <strong>The</strong>re are discussions about a commonbenefit package, what it should include and by whom it should beprovided; specifically, how to involve private providers more effectivelyin the delivery of critical interventions, both preventive and curative, forexample through contracting. <strong>The</strong> different insurance schemes arebeing reviewed within a broader analysis of overall health systemfinancing, and there are debates about what sort of organizationalarrangements within the public sector would enhance the quality andefficiency of public providers.
108 <strong>The</strong> <strong>World</strong> <strong>Health</strong> <strong>Report</strong> 2003important gains, for example in immunization coverage and child mortality reduction, butwere at odds with the comprehensive vision of primary health care developed at Alma-Ata,notably its emphasis on tackling the socioeconomic determinants of ill-health. In the 1990s,the <strong>World</strong> Bank recommended a set of core public health interventions and a package ofessential clinical services influenced by primary health care models, though critics questionedwhether these strategies responded adequately to the messages of equity and communityparticipation delivered at Alma-Ata (5).Originally, primary health care and the health-for-all movement represented an effort to changepractices and structures in the health sector based on population health criteria. Subsequenthealth sector reform efforts have often been steered by criteria largely extrinsic to health (forexample, broad commitments to decentralization or civil service reform, or the need to reducegovernment spending). Reaffirmation of primary health care principles by global healthstakeholders signals a recognition of the need to return to population health criteria as thebasis for decisions affecting how health care services are organized, paid for and delivered.Principles in a systems perspectiveThis report reinforces an important conceptual shift towards the model of health systemsbased on primary health care. In a systems perspective, the potential conflict between primaryhealth care as a discrete level of care and as an overall approach to responsive, equitablehealth service provision can be reconciled. This shift emphasizes that primary health care isintegrated into a larger whole, and its principles will inform and guide the functioning of theoverall system.A health system based on primary health care will:– build on the Alma-Ata principles of equity, universal access, community participation,and intersectoral approaches;– take account of broader population health issues, reflecting and reinforcing public healthfunctions;– create the conditions for effective provision of services to poor and excluded groups;– organize integrated and seamless care, linking prevention, acute care and chronic careacross all components of the health system;– continuously evaluate and strive to improve performance.Intervention across the disease continuum is needed to achieve the comprehensive care envisagedby such a system. To deal with the increasing burden of chronic diseases, bothnoncommunicable and communicable, requires upstream health promotion and disease preventionin the community as well as downstream disease management within health careservices. Two integrated health care models, the chronic care model and its extension – WHO’sinnovative care for chronic conditions framework – promote primary health care concepts:intersectoral partnerships, community participation and seamless population-based care.Evidence supports the use of these integrated models as a means of implementing primaryhealth care principles, with demonstrated reduction in health care costs, lower use of healthcare services, and improved health status (6–9).Linking expanded HIV/AIDS treatment and health care systems development is a crucialchallenge. No blueprint exists, but valuable examples are emerging. Since May 2001, MédecinsSans Frontières has provided antiretroviral therapy for HIV/AIDS through primary healthcare centres in the township of Khayelitsha, South Africa (10). <strong>The</strong> delivery of HIV/AIDStreatment in a primary health care setting underscores the potential for integration of differenttypes of care and begins to show how scaling up treatment could fit into – and help drive
<strong>Health</strong> Systems: principled integrated care 109– an overall strengthening of health care systems based on primary health care principles.<strong>The</strong> Khayelitsha antiretroviral programme uses a nurse-based service model and relies onstrong community mobilization for peer support. It has shown that HIV/AIDS treatmentcan be rolled out most effectively if:– the entire health system is mobilized and HIV/AIDS treatment activities are integratedinto the basic package of care;– treatment services are decentralized to ensure coverage and community involvement;– treatment and care are part of a “continuum of care” supported by a facility-linked homebasedcare system and a referral system.<strong>The</strong> additional resources that must flow into countries’ health sectors to support HIV/AIDScontrol efforts, including “3 by 5”, can be used in ways that will strengthen health systemshorizontally. Developing context-specific strategies to achieve this will be part of WHO’stechnical collaboration with countries. Similarly, if the recommendations of the Commissionon Macroeconomics and <strong>Health</strong> for large increases in global investment in health arefollowed by the international community, the coming years will offer a crucial opportunityfor development of health systems that are led by primary health care.Enormous obstacles to the scale-up of health systems based on primary health care persist. Insome countries, violent conflicts and other emergencies have seriously damaged health systems(see Box 7.3). Multiple forms of inefficiency undermine systems, such as governmenthealth expenditure disproportionately devoted to tertiary care and programmes that do notfocus on a significant burden of disease (11). Lack of financial resources remains a fundamentalproblem. Total health expenditure is still less than US$ 15 per capita in almost 20% ofBox 7.3 Rebuilding Iraq’s health sector<strong>The</strong> Gulf War of 1991 and the economic sanctions marked the start ofthe decline of a health care delivery system that had been a model forthe region during the 1980s. <strong>Health</strong> indicators dropped to levels comparableto some of the least developed countries: in 1996, infant, child,and maternal mortality rates were estimated at 100/1000, 120/1000,and 300/100 000 live births, respectively, a twofold increase over 1990levels. <strong>The</strong> Oil for Food programme brought a relative improvement ofthe health of Iraqi people, although still far from pre-1990 levels. <strong>Health</strong>outcomes are now among the poorest in the region.Iraq is below the regional average in terms of physicians to population(5.3 doctors per 10 000 population in 2002); there are too manyspecialists but too few primary health doctors and nurses. Following the2003 war, the health infrastructure, which had suffered from years ofdisrepair, was further weakened by the widespread looting, inadequateelectricity and water supply, and institutional instability.<strong>The</strong> pre-2003 war health system was hospital-based and drivenby curative care, and did not respond adequately to health needs. <strong>The</strong>challenge for Iraqi policy-makers and the donor community is tore-establish basic services in the short term while transforming theinefficient and inadequate health services to a system based on primarycare, prevention, and evidence-based policy. <strong>The</strong> new system shouldtackle the disease burden faced by Iraq’s people and be affordable withinthe available envelope of public finance.Major challenges face the health sector: limited capacity ofthe Ministry of <strong>Health</strong> (and health directorates in governorates) toundertake essential public health functions; lack of a package of healthservices that includes catastrophic care in the event of emergency anddiagnostic and laboratory facilities; external brain drain of human resources;lack of an information system for informed decisions at thepolicy and implementation levels; inadequate financial resources andunclear mechanisms for smooth flow of funds to meet the investmentand operational costs of the system; and the need for improved coordinationamong all stakeholders in health to optimize donated resources.Senior staff from the Ministry of <strong>Health</strong>, officials from the CoalitionProvisional Authority, and representatives of organizations of theUnited Nations system, nongovernmental organizations and donors metin Baghdad in August 2003 to determine immediate and medium-termpriorities to enable the health sector to provide health services that areaccessible, equitable, affordable and of adequate quality.Re-establishing the functioning of the health sector to pre-warlevels requires funds for salaries and other priority recurrent expenditure.It is estimated that Iraq’s financial requirements for health servicesin 2004 – from government and donor sources – will be in the order ofUS$ 0.8–1.6 billion (or US$ 33–66 per capita). Assuming a sustainedand increasing income, the projections for the period 2004–2007 are inthe range of US$ 3.7–7.8 billion, which at the end of the period translateinto a per capita public expenditure of US$ 40–84. Forecastingeconomic performance, fiscal capacity and donors’ willingness to sustainIraq for the period 2004–2007, however, is an exercise fraughtwith difficulties.
110 <strong>The</strong> <strong>World</strong> <strong>Health</strong> <strong>Report</strong> 2003WHO Member States. In many countries, especially the poorest, people in need of treatmentfor themselves or their families still pay for the bulk of health services out of pocket.All efforts to improve health care systems in developing countries must confront several mainchallenges: workforce development and retention; health information management; financing;and government stewardship within a pluralistic health landscape. <strong>The</strong> remaining sectionsof this chapter consider these topics. Systems face difficulties in numerous other areasas well, but all four of these problems demand urgent action in order to scale up the system tomeet health targets. If constraints in these areas are not overcome, little progress will be madein improving access to care among the poorest.<strong>The</strong> global health workforce crisis<strong>The</strong> most critical issue facing health care systems is the shortage of the people who makethem work. Although this crisis is greatest in developing countries, particularly in sub-SaharanAfrica, it affects all nations. It severely constrains the response to the AIDS treatmentemergency and the development of health systems driven by primary health care, even asAIDS reduces the available workforce. Botswana’s commitment to provide free antiretroviraltherapy to all eligible citizens is frustrated, not by financing, but by the severe lack of healthpersonnel (12).Unfortunately, workforce issues are still considered to be relatively unimportant by bothnational governments and international agencies. Rapid and substantial strengtheningof the workforce is urgently required to capitalize on the funds and pharmaceuticals that arenow available.<strong>The</strong> health workforce crisis has to be confronted in an economic and policy environmentvery different from that of 25 years ago. Traditional models in which the government directlyrecruits, trains, hires and deploys health professionals no longer reflect the reality of mostdeveloping countries. Most countries have undergone decentralization and reforms of thecivil service and the health sector. <strong>The</strong>re has been a great expansion in the health care roles ofnongovernmental organizations and private providers. Furthermore, all countries are nowpart of the global marketplace for health professionals, and the effects of the demand–supplyimbalance will only increase as trade in health services increases (13). Accordingly, new modelsfor health workforce strengthening must be developed and evaluated (14).Size, composition and distribution of the health workforce<strong>The</strong> number of health workers in a country is a key indicator of its capacity to scale up deliveryof interventions. This crisis is nowhere greater than in sub-Saharan Africa, where limitationson staffing are now recognized as a major constraint to achieving national health goalsand the MDGs (15). In Chad and the United Republic of Tanzania, for example, the currentworkforce is grossly insufficient for the extensive delivery of priority interventions (16). Countriesfacing such extreme personnel shortages urgently need a rapid increase in the numbersof health workers to perform key tasks, particularly the delivery of services at communitylevel in underserved areas.<strong>The</strong> number of health workers in a country is not the only determinant of access to primaryhealth care. Figure 7.1 shows that the number of births at which skilled attendants are presentis only partially related to the number of health professionals in a country. 1 Guinea, Indone-1 <strong>The</strong> term “health professionals” is defined for the WHO database as including physicians, nurses, midwives,dentists and pharmacists.
<strong>Health</strong> Systems: principled integrated care 111sia and Paraguay have similar workforce numbers but wide differences in the level of coverage.This is caused by several factors, including the skill mix of health workers, their geographicaland functional distribution, and their productivity. <strong>The</strong>se data indicate theimportance of using the existing workforce more effectively.Gender discrimination in the health professions has many serious implications for the longtermstrength of the health care system and especially for the delivery of services to poor anddisadvantaged populations. A specific issue concerns the under-representation of womenamong those who manage and direct services, even though most health care workers arewomen. For example, in South Africa, men represent only 29% of personnel in administrationoverall, but they occupy 65% of all senior management posts (17). Without proper representationat the managerial and leadership levels, women’s needs as employees within thehealth system will continue to be neglected. More generally, workforce policy and planningmust consider gender and life-cycle issues, not only out of concern for equity, but also toenable efficient and effective development of a health care system that responds to and meetsthe particular needs of women.Workforce trainingMeeting urgent health challenges while laying stronger foundations for health systems requiresthat health planners consider the composition of the health workforce in terms oftraining levels and skill categories. In developed countries, experimentation with new categoriesof health worker is a response to cost-containment and quality of care concerns. Indeveloping countries such experimentation is a direct response to limited supply.To achieve the goals associated with health care systems driven by primary health care, newoptions for the education and in-service training of health care workers are required so as toFigure 7.1 Relationship between births accompanied by skilled attendants andnumber of health professionals, a 33 developing and transition countriesPercentage of deliveries assistedby skilled birth attendant1009080706050403020BrazilParaguayIndonesiaGuineaPakistanNamibiaTurkeyEgypt10Nepal00 100 200 300 400 500 600Density of physicians, nurses and midwives (per 100 000 population)a WHO/UNICEF latest estimates.
112 <strong>The</strong> <strong>World</strong> <strong>Health</strong> <strong>Report</strong> 2003ensure a workforce more closely attuned to country needs. Training of students from developingcountries at high-prestige institutions in developed countries is useful only when thereis no local or regional alternative. Although there are about twice as many nursing schools asmedical schools worldwide, in the African Region there are 38 nursing schools and 64 medicalschools. This suggests that too many expensive health workers are produced in places thatmight have a greater need for new types of providers with an education more focused onprimary health care. <strong>The</strong> public health workforce also needs strengthening, based on a newapproach to in-country or regional training that emphasizes the management of health problemsat the district level (18).<strong>The</strong> workforce of doctors is often complemented by training nurse practitioners, “assistantmedical officers” and mid-level professionals. <strong>The</strong>se categories are health professionals whocan assume many of the responsibilities previously reserved for those with a full medicaldegree (see Box 7.4). For example, many studies in developed countries show that nurse practitionerscan reduce the costs of care without harming, and sometimes actually improving,health outcomes (21, 22). In the Pacific Islands, mid-level practitioners, with various titlessuch as medex, health assistant, or health officer, play an important role in meeting curativeand preventive needs, especially in remote or rural areas (23). In other countries, communityhealth workers are trained in very specific and high-priority activities, making it possible toserve populations that are out of the reach of formal health care services.In the past, primary health care strategies based on community health workers or other alternativehealth care providers have been difficult to sustain (24). However, evidence suggeststhat such strategies can be effective, given appropriate training (25, 26). To be successful, thecreation of new types of health worker requires that they be valued for their distinctive contribution,rather than treated as second-class providers. This means offering them careerdevelopment prospects, rotation to and from rural and underserved areas, good workingconditions, the chance to work as a team with other professionals, and an adequate salary.New cadres can be seen not only as a pragmatic response to current shortages, but as a cohortwhose skills can be continually upgraded through in-service training, leading in the longerterm to their incorporation in the more highly qualified professional categories. Evidence isgrowing that community members can carry out a wide range of health care tasks, includingtreatment of more complex conditions (10, 25–28).Migration of health workersPolicy-makers in all countries are concerned about “brain drain” of the health workforcewithin and between countries, although relevant research is still in its infancy (29). <strong>The</strong> movementof health professionals closely follows the migration pattern of all professionals. WhileBox 7.4 Training assistant medical officers: the técnicos of MozambiqueIn 1984, a three-year programme was initiated to create assistant medicalofficers (técnicos de cirurgia) to perform fairly advanced surgical proceduresin remote areas where consultants were not available (19). <strong>The</strong>programme trains middle-level health workers in skills required for threebroad priority areas: pregnancy-related complications, trauma-relatedcomplications and emergency inflammatory conditions. Two years of lecturesand practical sessions in the Maputo Central hospital are followedby a one-year internship at a provincial hospital, under the direct supervisionof a surgeon.Forty-six assistant medical officers were trained between 1984 and1999, and the evaluation of their influence on quality of care is promising.For example, a comparison of 1000 consecutive caesarean sectionsconducted by técnicos de cirurgia with the same number conducted byobstetricians or gynaecologists indicated that there were no differencesin the outcomes of this type of delivery or in the associated surgicalinterventions (20). Many countries have now started or are consideringsimilar programmes, based on their claimed cost-effectiveness. <strong>The</strong>potential impact of this type of health worker on both quality andefficiency of health care must continue to be evaluated.
<strong>Health</strong> Systems: principled integrated care 113doctors and nurses make up only a small proportion of professional migrants, their loss weakenshealth systems.<strong>The</strong> internal movement of the workforce to urban areas is common to all countries. Within aregion, there is also movement from poorer to richer countries, for example from Zambia toSouth Africa or from the United Republic of Tanzania to Botswana. <strong>The</strong> most controversial“brain drain” is international professional migration from poorer to wealthier countries (30).While the departure of doctors receives the most attention, it is the departure of nurses andother health professionals that can easily cripple a health system. Nurses are in high demandin developed countries, partly because of population ageing. Some efforts have been made topromote ethical practices in international recruitment, but results have yet to be assessed (31).Workforce mobility creates additional imbalances just when increased financial resources arebeginning to flow to some developing countries. This requires better workforce planning indeveloped countries, attention to issues of pay and other rewards in developing countries,and improved management of the workforce in all countries.Paying more and paying differentlyRaising wages may increase the number of health workers and their productivity and maysucceed in countries where health workers are paid less than comparable professions. It maybe less successful, however, in countries where health sector wages are higher than those ofcomparable professions. Wages take the single largest share of health expenditure, so increaseshave to be carefully evaluated for their impact both on the availability and productivity ofhealth workers and on aggregate budgets. <strong>The</strong> role of public sector unions in negotiatingwith governments for pay increases is an additional complexity.As well as raising salaries, other strategies to improve productivity include non-financial benefitssuch as housing, electricity and telephones, on-the-job training with professional supervision,and opportunities for rotation and promotion. In rural Senegal, providing nurseswith motorcycles not only made it possible to increase immunization coverage but also improvedtheir access to technical support and reduced their isolation (32).Both financial and non-financial incentives can also reduce geographical imbalances in thedistribution of health workers. For example, in Indonesia, a bonus of as much as 100% of thenormal salary attracted medical graduates from Jakarta to the outer islands (33). Recruitmentand training of people from remote areas, who are committed to their region of origin,have also been proposed.Finally, nongovernmental organizations concerned with health and private providers are alarge and increasing presence in most countries. Governments could consider partnershipsin which the public sector provides financial support and the nongovernmental organizationsmanage and provide the direct services. Often, private health workers are available inplaces that the public sector finds difficult to reach. In such situations, establishing formalprogrammes either to contract private providers or to reimburse the services they providemay be the most pragmatic response. In the mid-1990s, the Government of Guatemala wasobliged to expand health care services to unserved populations as part of the negotiated peaceagreements that took place at the time. It contracted more than 100 nongovernmental organizationsto provide basic health care services to some 3 million of the country’s citizens,predominantly indigenous and rural people, who previously had no access to services (34).Recently, Cambodia has successfully experimented with contracting nongovernmental organizationsand private providers to deliver basic services to underserved groups (35).
114 <strong>The</strong> <strong>World</strong> <strong>Health</strong> <strong>Report</strong> 2003Improving quality: workers and systemsAll health systems need to create an environment for effective team learning for quality improvement.While the quality of care depends to some extent on the individual characteristicsof health care workers, levels of performance are determined to a far greater extent by theorganization of the health care system in which they work. Many health care organizationsare moving from a practice of blaming individual health care workers for deficiencies to aculture of team learning and shared quality improvement.Recognizing that the quality of health care is fundamentally a system issue is the first steptowards making improvements in processes and outcomes of care. System-level quality improvementsrequire a clear definition of optimal care and a framework for changing the system.Essential components of optimal care include decision support tools for health careworkers, with written care guidelines and diagnostic and treatment algorithms; and necessarysupplies, medical equipment, laboratory access and medications. Also needed are clinicalinformation systems (which can be computerized or paper-based), guidelines for plannedvisits and active follow-up, and systematic support to patients for self-management of theirconditions and referral to community resources. Evidence suggests that health systems withstrong, integrated primary care are associated with better outcomes, probably because theyprovide for more comprehensive, longitudinal and coordinated care (36).<strong>The</strong>re is also a requirement for a method that will enable health care workers to make improvements(37). <strong>Health</strong> care teams should be able to develop and test changes in their localsettings, which will enable them systematically to make improvements in processes of healthcare. One such method is the model for improvement (38), which enables rapid testing andevaluation by health care teams of potential improvements in their work. Working togetherin groups of teams helps communication and spreads innovations to larger groups (39, 40).Box 7.5 Creating a skilled workforce for tomorrow<strong>The</strong> process of building a motivated workforce with the relevant skillscan begin immediately, using existing budgets and staff. <strong>The</strong>se activitiesalso require continuous investments of time and leadership, and theinvolvement of health workers and communities in planning andmanaging their own futures.Immediate actions that should be taken include: mobilizingcommunities and community workers; engaging traditional healers andenlisting volunteers; raising productivity among current health workersthrough improved supervision and support; and assessing and obtainingfeedback on quality of practice.Reorienting managerial staff to new functions takes time and planning.This process includes:• developing and implementing on-the-job training to upgrade skills;• contracting with the private sector and nongovernmental organizations;• introducing flexible new contract opportunities for part-time work;improving working conditions with better drug distribution and supplyof other essential medical supplies;• strengthening collaboration among health workers, traditional healers,volunteers and community members.Preparing for changes to institutions, policies and legislationrequires undertaking studies and analyses that need to be started immediately.Design, approval and implementation of the changes, however,need time and will have an impact in the medium term. Someactions in this category include:• developing pay and non-pay incentive packages to improve staffrecruitment and retention;• developing a plan to improve training capacity and managementpractices;• coordinating donor contributions to workforce development; designingand implementing safety guidelines, clinical protocols, and antidiscriminationpolicies to improve working conditions;• building extensive partnerships with civil society.Urgent problems require urgent action. Governments must not losesight, however, of the long-term requirements of the health system. Whiletackling more urgent activities, governments can lay the foundationsfor effective workforce policies, by:• analysing the labour market, relative wages and supply trends so asto be able to design appropriate recruitment, retention, and wage policies;• developing long-term plans for achieving appropriate mixes of skillsand geographical distribution of health care professionals;• expanding opportunities for management training and for theimprovement of management practices;• developing strategies for strengthening the relationship between publicand private providers and financing.
<strong>Health</strong> Systems: principled integrated care 115Responding to the workforce crisisTaking action to meet the workforce crisis is not easy and requires paying attention to allareas of workforce needs, from training to morale, and from local to global determinants.WHO has a major advocacy role in building and sustaining awareness of the extent of the crisis.Some actions can be taken immediately, others require more time and planning (see Box7.5). In the most urgent circumstances, for example scaling up HIV/AIDS treatment, countriescan mobilize community resources, volunteers and traditional healers to collaborate inexpanding access to primary health care (see Box 3.2 in Chapter 3). <strong>Health</strong> care workers’productivity can be improved through better supervision, support and morale-building. Inthe short term, governments can initiate programmes that mobilize nongovernmental andprivate sector resources by contracting the delivery of services, upgrading staff skills, andmaking sure that workers have the drugs and medical supplies they need to do their job.In the medium term, governments can bring in changes requiring more planning, reorientationof administrative staff, and changes in budgeting such as pay policies, non-pay incentives,and expanded training capacities. New guidelines and policies can be adopted. Collaborationwith communities and local governments can be deepened. Important lessons can be learntfrom country experiences, whether very successful or less so (14). Policy-makers may suggestthat any proposed new project or policy include a formal “human resources impact assessment”during its preparation; international agencies and donors could also be brought intothis process (41).Finally, governments should keep sight of the conditions necessary to motivate and sustaingood health service delivery. This means taking the dynamic nature of labour markets seriously,and recognizing the long-term limits and expectations of health care workers. It alsomeans establishing more clearly the expected roles of public and private providers in a futuresystem of universal coverage. WHO is actively working with countries to develop long-termand short-term solutions. An example from the Region of the Americas is provided in Box 7.6.Box 7.6 <strong>The</strong> Observatory of Human Resources in <strong>Health</strong> Sector Reforms<strong>The</strong> Observatory is a cooperative initiative promoted by the Pan American<strong>Health</strong> Organization/WHO Regional Office for the Americas. Its goalsare to produce and share knowledge among the countries of the regionto support human resources policy decisions and improve workforcedevelopment in the health services sector.<strong>The</strong> initiative supports the creation of national inter-institutionalgroups (for example, ministries of health, universities, and professionalassociations) to collect information on the stock of human resources forhealth and to analyse imbalances and trends, to prioritize an agenda ofissues to be tackled, and to advise on long-term and medium-term policydevelopment. Nineteen countries participate in the initiative, with differentemphases and priorities, according to national concerns. <strong>The</strong> networkingefforts are geared to making the country experiences applicablein other contexts, through construction of databases and disseminationof lessons learnt. <strong>The</strong> main lessons to date are as follows:• <strong>The</strong> Observatory is a way to improve the stewardship role of ministriesof health in human resources.• <strong>The</strong> inter-institutional Observatory groups can help to maintain thehuman resources agenda during the transition between administrations.• <strong>The</strong>re is a need to integrate key stakeholders: universities, ministriesof health, and professional associations, even though there may besubstantial conflicts between them.• Evidence needs to be developed from more reliable and stable statisticalsources (for example, the International Labour Organization andhousehold surveys).• New approaches should be found to use the information in shapingpolicies (for example, to improve geographical distribution and to correctpublic–private imbalances).General information about the network, its meetings and usefullinks can be found at http://observatorio_rh.tripod.com/.
116 <strong>The</strong> <strong>World</strong> <strong>Health</strong> <strong>Report</strong> 2003<strong>Health</strong> information: better but not good enough<strong>The</strong> evolution of health informationShortages of adequate health information, as well as shortages of personnel, contribute to thepotential collapse of some health care systems and threaten the long-term viability of others.<strong>Health</strong> care systems oriented to primary health care principles need robust health informationcomponents in order that the health needs of populations, especially those that are poorand marginalized, can be understood; to ensure that programmes are reaching those most inneed; to measure the effects of interventions; and to assess and improve performance. Asnoted above, tools and structures for obtaining, organizing and sharing information are vitalfor improving the work of individual health care providers and raising the quality of carethroughout the system.<strong>The</strong> amount of information available to health policy-makers and planners at the time of theDeclaration of Alma-Ata on primary health care was limited. <strong>The</strong> main sources of population-basedhealth information were vital registration, censuses, national surveys, and researchstudies. Information was generated through routine reporting at facility level. However, datawere rarely collated and used at national level, and feedback mechanisms from central tolocal levels were missing.Substantial progress has been made since then in the field of health information. An increasingvolume of data has become available on health status, health services utilization, anddeterminants of health through population-based health interview surveys. Many countriesnow have good data, disaggregated by sex, on levels and trends in child mortality, coverage ofselected health interventions, and incidence and prevalence of certain diseases. <strong>The</strong>y oftenhave some limited information on equity in health. However, many critical gaps remain. Levelsof adult mortality are poorly measured in most populations and accurate cause-of-deathdata are not generally available. Morbidity is inadequately measured for most conditions.Coverage and costs of many interventions are not monitored properly and insufficient informationis available to monitor equity satisfactorily. <strong>The</strong> quality of health information is oftenhighly variable and poorly documented. <strong>The</strong>re is little standardization across definitions andmethodologies.Critically, the use of health information for the management of health services at the locallevel and for health policy-making and planning at the national level remains limited. Veryfew countries have developed effective and efficient health information systems that take intoaccount the needs of different levels of users, from local to national and global levels. Muchof the information collection and analysis is driven by vertical health programmes, often inthe context of international initiatives, and integration is lacking.An information system driven by primary health careIn the context of health systems driven by primary health care, a health information systemcan be defined as an integrated effort to collect, process, report and use health informationand knowledge to influence policy-making, programme action, and research.<strong>Health</strong> information systems use a range of data collection and analysis tools and methods.Accurate and continuous statistics on basic demographic events are a foundation of rationalhealth and public policy. National vital registration systems (considered the “gold standard”)currently cover less than one-third of the world’s estimated mortality. Significant regionaldisparity exists, ranging from over 90% of all mortality coverage in the European Region to
<strong>Health</strong> Systems: principled integrated care 117less than 10% coverage in the South-East Asia and African Regions (42, 43) (see Table 7.1).Trends in coverage are slowly improving. Considerable effort has been devoted to developingless expensive and more accurate alternatives to national routine death certification, such assample registration systems and survey-based or census-based questions on sibling deaths ordeaths in the household. When used alone or with accompanying vital registration systems,sampling can improve coverage of events where resources are limited. <strong>The</strong>se systems havebeen introduced in China and India, to take two examples, and are applicable to other resource-poorsettings (see Box 1.1 in Chapter 1).Population-based household surveys have become the major source of health information.Much of the information generated by surveys is based on self-reporting, raising issues ofreliability, validity and cross-population comparability. In the field of morbidity and evaluationof interventions, there is an urgent need to consider a much larger and broader investmentin biological and clinical data collection in surveys (44). In most countries, equityconsiderations are still not fully integrated into health information systems.<strong>Health</strong> information can be used for at least four distinct but related purposes: strategic decision-making,programme implementation or management, monitoring of outcomes orachievements, and evaluation of what works and what does not. Strategic decision-makingby health policy-makers should be based on the best available evidence. Data from vital registrationsystems, epidemiological studies, household surveys, censuses, and health serviceproviders often give highly uncertain information about the true population value of a healthindicator. Assessments of any health indicator should be based on the integration of all relevantinformation and the use of criteria such as internal consistency and prior knowledge ofdisease history to improve estimates from uncertain or inconsistent data.In addition to the routine use of models to estimate life tables in areas where vital registrationsystems do not attain high rates of coverage, estimates of the incidence, prevalence and mortalityof diseases increasingly use explicit models to derive best estimates from uncertain,incomplete or contradictory population data. <strong>The</strong> focus has been on the national, regionaland global levels, although estimates for local areas, including districts, are increasingly becomingavailable.<strong>The</strong> problems and weaknesses of routine health service statistics are well known (45). Severalcountries have now made progress in developing routine health information systems, includingthe use of better technology, mapping, and focusing more extensively on local user needs.<strong>The</strong> introduction of new technology in a well-designed system allows better surveillance ofkey diseases and also more accurate and timely programme monitoring.Improving information systemsIn recent years, significant attempts havebeen made to reform health systems as awhole, with increasing attention given tothe decentralization of resources and decision-makingto district level. Such reformsentail the need for better healthinformation systems at local level. At thesame time it has been increasingly understoodthat local individuals and familieshave to be involved in the generation,dissemination and use of health informa-Table 7.1 Availability of death registration data –number of countries by WHO regionRegion Usable Complete Totaldata coverage countriesAfrica 4 1 46Americas 32 14 35South-East Asia 4 0 11Europe 48 39 51Eastern Mediterranean 7 4 22Western Pacific 22 8 27Total 117 66 192
118 <strong>The</strong> <strong>World</strong> <strong>Health</strong> <strong>Report</strong> 2003tion. Involving people in the planning and implementation of health care was a fundamentalprinciple of Alma-Ata and still has important implications for the way that health informationsystems operate.Equity in health is another of the key principles of primary health care. This requires theability to measure inequalities in access to and use of health services, risk factors, and keyhealth outcomes. It also means identifying which groups of people are the most disadvantaged– often poor people, ethnic groups or women. This type of information imposes aconsiderable additional burden on health information systems and is not routinely availablein many countries. Surveys are currently the most important method of collecting informationon the equity dimension of health, but much more work is needed to integrate equitymonitoring into health information systems, both with surveys and with other methods ofdata collection and analysis. <strong>The</strong> aim of the <strong>World</strong> <strong>Health</strong> Survey, launched by WHO in 2001,is to provide valid, reliable and comparable data on population health and health systemperformance, through a household survey. <strong>The</strong> programme emphasizes monitoring the MDGsand critical outcomes among poor populations.Improvement in health information systems is needed at local, national and internationallevels, and more integration between these levels is required to deal with global health threatsand the growth of knowledge (see Box 7.7). Countries will benefit greatly if health informationsystems are based on a national plan with a framework, indicators, and data collection,analysis and dissemination strategies. <strong>The</strong> strategic plan should also be specific about howthe different tools and methods will be applied and complement each other, how health informationneeds are met at the subnational, national and global levels, and what kind ofinvestments are needed. <strong>The</strong> latter include human resources, infrastructure (technology,laboratories, etc.), and operational budgets for health data collection efforts. National bodiesBox 7.7 Reliable and timely information for health<strong>The</strong> <strong>Health</strong> InterNetwork (HIN), led by WHO, is an initiative of the UnitedNations Millennium Action Plan to meet the information needs of healthprofessionals, researchers and policy-makers in developing countries. 1Since it began in September 2000, HIN has improved health by usingthe Internet to enhance the flow of health information, focusing on content,Internet connectivity, and capacity building.HIN provides a vast online health library to personnel in governmentdepartments, teaching and research institutions, and other nonprofitorganizations. International agencies, national organizations andthe academic and private sectors are contributing content, and HIN isworking with local partners to publish local health information. <strong>The</strong> fivepriority content areas are: scientific and biomedical journals, educationand training resources, information for health policy and practice,statistical data, and public health software for public health and clinicalmanagement.During its first year, HIN achieved a major breakthrough in theprovision of health content. Through an agreement reached by WHOwith the world’s major biomedical publishers, over 2200 medical andscientific publications are now available online to public and non-profitinstitutions in 113 developing countries. HIN’s Access to ResearchInitiative (HINARI) is making the journals available online free of chargeor at greatly reduced rates, based on a country’s ability to pay.1 Web site: www.healthinternetwork.net.HIN’s second phase is providing the up-to-date information neededto educate and upgrade the skills of the health workforce. It includesonline courses and references covering public health, medicine and nursing,as well as specialized topics for developing country practitioners.<strong>Health</strong> personnel need easy, reliable and affordable access to theInternet if they are to use it in their work. Infrastructure and cost areimportant obstacles, and Internet use is limited outside many capitalswhere power sources are unreliable and service providers are rare. HINIndia was developed to test the logistics, cost and partnership modelsfor improving the flow of information with remote areas. It has establishedInternet access sites in hospitals, clinics, research andeducational institutes and public health facilities in two states. Localpartners played a key role by supplying, installing and maintaining computerhardware and software, and in establishing Internet connections.Capacity building is essential, and HIN provides training materials thatinstitutions use to ensure that health workers, policy-makers and researchershave the skills needed to find, use and share public healthinformation online.Well-documented, successful strategies to bridge the digital dividein health information remain the exception rather than the norm. In thewords of a tuberculosis programme coordinator in the field in India:“without computers and the Internet, we are fighting 21st-century healthproblems with 19th-century tools”.
<strong>Health</strong> Systems: principled integrated care 119with participation of stakeholders of different levels of users and technical experts need toguide and oversee the implementation of the national plans.<strong>The</strong> <strong>Health</strong> Metrics Network<strong>The</strong> strengthening of these systems requires a collaborative effort. <strong>The</strong> <strong>Health</strong> Metrics Network,to be launched in 2004, will focus on improvements to the availability and utilizationof reliable health information for policy-making and planning, programme monitoring andevaluation, monitoring of international goals, and measuring equity in health. Through thecollaboration of many partners, and with careful planning and establishment of clear targets,the Network aims to strengthen the capacity of health information systems to provide highquality, timely information in a form that is useful for public health work at the national,subnational and global levels. It is a broad partnership that includes WHO, other internationalorganizations, bilateral agencies, foundations, ministries of health, statistical organizations,academic institutions, and organizations representing civil society. This kind ofnetwork is necessary to enhance the efficiency and effectiveness of the assistance provided byinvestors in health information. <strong>The</strong> <strong>Health</strong> Metrics Network partnership should also be ableto accelerate development and scaling-up of innovations in monitoring and evaluation ofhealth status and health programmes. Standardization and enhancement of methods to assessquality of health information will greatly assist the measurement of progress towardsachieving global goals such as the MDGs.Financing health systemsMany of the functions of health care systems depend on adequate financing. If sustainablefinancing mechanisms are not put in place, innovative ideas for strengthening the primaryhealth care base of health care systems will not yield results.Globally, health spending has grown substantially over the last 25 years, driven largely byrapid changes in technology and increasingly complex institutions for financing and deliveringcare. Yet in the world’s poorest countries, health spending has grown slowly, if at all.Consequently, there is great inequality in global health spending today (see Figure 7.2). Countriesof the Organisation for Economic Co-operation and Development accounted for lessFigure 7.2 Inequality in health spending and incomes by region, 200180Percentage of global totals70605040302010PopulationGross domestic productTotal health expenditure0Africa Americas a EasternMediterranean EuropeaSouth-EastAsiaWesternPacific aOECDa Regions from which the OECD countries have been subtracted.
120 <strong>The</strong> <strong>World</strong> <strong>Health</strong> <strong>Report</strong> 2003than 20% of the world’s population in the year 2000 but were responsible for almost 90% ofthe world’s health spending. <strong>The</strong> African Region accounts for about 25% of the global burdenof disease but only about 2% of global health spending (see Annex Tables 4 and 5).While spending levels have changed, the options for financing health systems have not. In1978, WHO discussed the same financing sources that are being debated today, namely generaltaxation, earmarked taxes, social security, community-based financing, fees, and externalassistance (46). Applied policy studies are still lacking, however. For example, a recentreview of 127 studies on community health insurance schemes found that only two of themhad sufficient internal validity to enable conclusions to be drawn regarding the impact onutilization and financial protection (47). Without reliable information, health financing policiescontinue to be dominated by opinions rather than evidence.Developing sustainable financingPolicy decisions about financing mechanisms have multiple effects. <strong>The</strong>y influence how muchmoney can be mobilized, how equitably those resources are raised and applied, and the efficiencyof the resulting services or interventions. <strong>The</strong> context within which health financingoperates will significantly alter its effects. However, the principles for improving health financingare essentially the same everywhere: reduce the extent to which people have to makelarge out-of-pocket payments at the point of service; increase the accountability of institutionsresponsible for managing insurance and health care provision; improve the pooling ofhealth fund contributions across rich and poor, healthy and ill; and raise money throughadministratively efficient means. <strong>The</strong> key policy questions relating to health financing arevery different, however, in rich and poor countries. Thus, the following discussion will considerhigh-income, middle-income, and low-income countries separately.In high-income countries, with per capita incomes above US$ 8000, resources for health arerelatively plentiful though not necessarily equitably distributed. An average of 8% of nationalincome is spent on health. Among these countries, annual health spending ranges fromUS$ 1000 to more than US$ 4000 per capita. <strong>The</strong> issues that dominate discussions of healthfinancing relate largely to the effectiveness of spending, cost containment and equity.In middle-income countries, with per capita incomes between US$ 1000 and US$ 8000, resourcesare more constrained and health services are less widely accessible. Countries in thiscategory spend between 3% and 7% of national income on health, representing an annualexpenditure of between US$ 75 and US$ 550 per capita. In these countries, the health financingsystem is often a critical obstacle to making health interventions accessible to all. Frequentlythe population is segmented between those in government or formal sectoremployment who benefit from relatively well-financed health insurance schemes, and thosewho rely on more poorly funded ministry-run services or pay out of pocket for private care.Many of these countries, notably in Asia, mobilize very little through the public sector.In low-income countries, with annual per capita income of less than US$ 1000, health financingdiscussions are dominated by the fundamental constraint of too few resources. Inmost of these countries, only 1–3% of gross domestic product is spent on health and, becausetheir per capita income is so low, this translates into health spending per capita of betweenUS$ 2 and US$ 50. Even if these countries spent 10% of their income on health services, theinvestment, if spread equitably across the population, would suffice only for very rudimentaryhealth care.Public policy should not allow fees at point of service to become an obstacle for obtainingnecessary care, or become a catastrophic financial burden on households. In practice,
<strong>Health</strong> Systems: principled integrated care 121policies on fees depend on the population’s capacity to pay, its impact on utilization, thekinds of services being provided, and the impact of fees on the quality and availability ofservices. In cases where service quality can be maintained or improved, eliminating fees mayincrease access. This appears to be the recent experience in Uganda, where user fees wereeliminated because the government simultaneously increased its financial and managerialsupport. In cases where service quality cannot be maintained or improved by other means,fees can provide critical incentives and resources to keep services available. This appears tohave been the experience with the Bamako Initiative when the retention of fees helped toensure the availability of drugs even if other programmes were ineffective (48). <strong>The</strong>refore,public policy toward fees must be pragmatic, based on full consideration of the context andthe net impact on the population’s access to good-quality health services.Sustaining the health system without relying heavily on fees requires the mobilization ofother sources, including general and earmarked taxes, social insurance contributions, privateinsurance premiums, or community insurance prepayment. In practice, the use of particularsources will depend on the population’s capacity to pay, administrative capacities to collect,the kinds and quality of services that are made available, and the effectiveness of existinginstitutions and forms of financing.In low-income countries, general taxation is a very attractive way to build a strong public rolein health service delivery, because it is administratively easier to manage than more complexinsurance or regulatory arrangements. Nevertheless, general taxation only works if the taxbase is broad, tax administration is effective, and funds are allocated to health services andused well. If any one of these factors is missing, the more effective alternative may be toestablish an independent social insurance administrator or encourage the formation of communityinsurance programmes. Pragmatism is a useful guiding principle in finding ways tomobilize and apply resources to improve health.Unblocking system bottlenecksMuch progress has been made in rationalizing the choice of priority interventions since thetime of the standard “minimum package” of the early 1990s. New tools are now available. Forexample, the WHO-CHOICE project is a database on the health impact and costs of a largenumber of health interventions – preventive, promotive, curative and rehabilitative (49).Prioritizing cost-effective interventions is all the more important as new funds become availableto the health sector. Care must be taken to ensure that external funding is additional to,and not a substitute for, domestic financing, but also that financing which flows from outsidesources does not lead to (further) fragmentation of the national health system.New funds remove only one of the obstacles to equitable, universal health care provision.Institutions receiving increased funds, whether governmental or nongovernmental, mustimprove programme implementation. Trained staff, information systems, audit mechanisms,and financial controls must be strengthened to handle the increased financial flow.Thus, while resource mobilization remains a challenge, the results-driven allocation of resourcesalso requires new strategies. Effective management of the new funds now becomingavailable to the health sector, particularly in sub-Saharan African countries, requires innovativeapproaches to medium-term budgeting. Solutions must be found to loosen the systembottlenecks – in human resources and other areas – that make it difficult to translate moremoney into better health outcomes. One promising approach is Marginal Budgeting for Bottlenecks,based on work in a number of west African countries. As ministries of health developtheir medium-term expenditure plans, system bottlenecks need to be clearly identified
122 <strong>The</strong> <strong>World</strong> <strong>Health</strong> <strong>Report</strong> 2003and strategies for unblocking them costed. <strong>The</strong> approach has produced encouraging resultsin Mali and Mauritania and is now set to be implemented in several Indian states (50).Pro-equity health systems: government’scentral roleIf a key responsibility of the health system is to narrow health equity gaps – a fundamentalprinciple of primary health care – then a criterion for evaluating strategies in workforce development,health information, financing strategies and other areas must be the degree towhich these strategies are pro-equity.<strong>The</strong> mutual reinforcement of poverty and ill-health is increasingly well understood, and thereis growing evidence of how unequally and inequitably resources, efforts and outcomes aredistributed. Benefit incidence studies consistently show that people living in poverty receiveless than a proportional share of public funding for health, relative to the better-off (51–55).Income is not the only relevant factor. Poverty is fundamentally a condition in which individualslack the capacities required to satisfy their needs, fulfil their aspirations and participatefully in society (56). Hence, the lack of political empowerment and education are factorsin the exclusion of people from health care. Gender, racial and ethnic discrimination contributesignificantly to inequities in health and in access to health care services.Policies that improve a country’s aggregate health indicators are not necessarily fair or proequity.Where countries have succeeded in improving health outcomes and reducing inequity,health system development policies have had to “swim against the tide”, explicitlycountering the bias to serve the better-off first (57–60). Whatever the specific configurationof a country’s health sector, effective stewardship of the whole health sector by the government– including supervision, monitoring and enforcement of health policies – is vital, ifpro-equity outcomes are to be achieved (61).Figure 7.3. Distribution patterns of health care deprivation, Uzbekistan, Turkeyand NigerPercentage of births occuringin health facilities1009080706050403020100PoorestExclusion – UzbekistanQueuing – TurkeyMass deprivation – NigerRichestPopulation quintiles by wealth
<strong>Health</strong> Systems: principled integrated care 123Patterns of inequitable access to carePro-equity health care strategies will vary by context. <strong>The</strong> key difference concerns the patternof inequitable access to care, which takes three distinct forms. In the poorest countries, thepattern can be characterized as mass deprivation – the majority of the population has equivalentbut deficient access to health care services while a small privileged class finds ways toobtain the care it needs. In somewhat better-off countries, such inequities can be described asqueuing – general access to health services is better, but middle-income and upper-incomegroups benefit most, while poorer groups must wait for a “trickle down” effect. In some countries,inequities take the form of exclusion whereby the majority of the population has reasonableaccess to services, but a poor minority of the population is deprived. <strong>The</strong>se patternscan be visualized by considering the percentage of births that occur in a health facility (as aproxy for general access to health services) by income quintile (see Figure 7.3).<strong>The</strong> manner in which systems based on primary health care develop will vary across thesediffering contexts. In some cases, programmes targeted at specific population groups are urgentlyneeded to achieve pro-equity outcomes. In other instances, broad strengthening of thewhole system is the priority. <strong>The</strong>se two approaches can also be combined.In countries characterized by exclusion, targeting will probably be needed to combat socialinequality and inequality in access to health services. Such a strategy might apply to middleincomeand low-income countries such as Chile and Uzbekistan, but it is also appropriate inwealthier countries in which marginal populations remain excluded from otherwise universalservices because of discrimination by race, ethnicity or gender, income poverty, or socialstigmatization. Progress will not take place without government action, either through theprovision or payment of services, or the design of appropriate incentives to thenongovernmental sector. Examples of targeting include recent efforts in Chile and New Zealandto make health services more culturally appropriate and accessible to indigenouspopulations (62), as well as an Australian programme to strengthen primary health care amongthe indigenous people of the Tiwi Islands (see Box 7.8).Three types of targeting strategies have been commonly used: direct, characteristic and selftargeting.<strong>The</strong>y are not mutually exclusive and are, in fact, often employed in combination.Direct targeting seeks to provide benefits only to the poor. One approach is to waive the costBox 7.8 Community health reforms in the Tiwi Islands<strong>The</strong> remote Tiwi Islands are located 60 km north of the Australian coastin the Arafura Sea, with a population of over 2000 consisting mainly ofindigenous people. Unemployment is high and housing conditions aregenerally of low quality. Very high rates of chronic conditions have beenrecorded, especially diabetes and renal and respiratory tract conditions.In 1997, the Australian Commonwealth and Territory governments negotiatedwith the community-based Tiwi Council to reform existing primaryhealth care services, through a Coordinated Care Trial with fourbroad objectives:• to achieve Tiwi community control of health services, through the establishmentof an area health board to administer pooled health sectorfunds;• to improve the effectiveness of preventive measures based on localparticipation in community programmes;• to improve the quality and effectiveness of health services, throughthe use of increased resources for a mix of primary coordinated careand population-based health services;• to improve the standard of care according to best practice guidelinesand protocols.<strong>The</strong> trial ran for three years. <strong>Health</strong> outcomes could not be measured inthis short phase, but process measures of success were achieved (63),including:• community control, by the establishment of the Tiwi <strong>Health</strong> Board,which now determines health policy and expenditures;• increased community awareness of health issues among Tiwi islanders,and greater community input into service delivery;• improved prevention services, especially those tackling urgent localproblems;• increased number and improved quality of primary health services;• reduction in avoidable hospitalization.
124 <strong>The</strong> <strong>World</strong> <strong>Health</strong> <strong>Report</strong> 2003of care for individuals who cannot afford to pay. Implementing this strategy requires meanstesting (assessment of the patient’s financial capability). Waivers reliant on means testingdemand substantial administrative capacity. Governments can also make direct conditionalcash transfers to poor families to reward household behaviour change, such as bringing childrento health centres for regular check-ups. Again, this requires considerable institutionalcapacity. In parts of Latin America, such approaches have increased participation in preventivehealth care (64).Characteristic targeting attempts to benefit particular groups of poor people based on specificattributes that cause further deprivation. Criteria can include geographical location,gender, ethnicity, particular diseases (for example, HIV/AIDS), or other factors. Self-targetingrelies on the better-off to opt out of services perceived to be of low quality. Such servicesmay involve greater waiting time or a poorer service environment.Countries and areas characterized by the queuing pattern of inequitable health care accessinclude Turkey and the wealthier states and provinces of China and India. In such settings,pro-equity policies have to find the right balance between efforts to build on and expand theexisting institutions of health care, effectively reducing the barriers that lead to queuing, whileidentifying and targeting those groups that would otherwise be excluded without special attention.Again, active government participation is required.In 2001, Thailand began a programme to extend universal health insurance coverage to thosewithout access to health services. Under the new programme, dubbed the “30 baht healthplan”, people register as patients with local health care providers and can then obtain allneeded medical care for a co-payment of 30 baht (about US$ 0.35). <strong>The</strong> system is financedjointly from taxes and contributions by workers and employers, while health care providersare reimbursed on a capitation basis. <strong>The</strong> programme is not without its problems, but stillrepresents a bold effort to confront health inequities (65). Another successful attempt to expandcoverage to the poor was the health insurance reform in Colombia in the mid-1990s.Between 1995 and 2001 the number of contributors to the mandatory health insurancesystem was expanded from 9.2 to 18.2 million people. At the same time, the system wasreformed so as to explicitly cross-subsidize the poor and unemployed. In 1995, 3 millionpeople benefited from these cross-subsidies; by 2001 their number had grown to 11 million.Thus, millions of non-contributing individuals gained access to roughly the same package ofbenefits as those who made the contributions, in the public or private facility of their choice,and in the same way as those more affluent citizens who regularly contribute (66, 67).Countries with mass deprivation represent the greatest challenge of all. In such countries,most of the population is deprived of health care, with only the richest able to buy it. To speakof “targeting” in such circumstances is not useful. <strong>The</strong> main effort is best characterized as“scaling up”, meaning overall extension and strengthening of the health system. Countries inthis category need rapid expansion of outreach and extension of primary care facilities andhospitals, along with increased investments in other sectors such as education, water andsanitation. Redressing geographical and rural–urban imbalances can often go a long waytowards accelerating progress in these countries. But the limited scale of public resources alsorequires innovations that build on and support local and community participation and theactivity of the nongovernmental sector, as implied by the principles of primary health care.Some innovative approaches have succeeded in extending health care to poor people despiteresource, infrastructure and workforce constraints. In its Expanded Programme on Immunization,Bangladesh for example, used outreach programmes in rural areas and enlisted theactive nongovernmental sector for service provision in urban areas to effectively bridge both
<strong>Health</strong> Systems: principled integrated care 125the infrastructure and human resource gap (68). Scaling up was combined with prioritizingservice delivery to rural areas and the poor and, as a result, considerable advance was made inreducing infant mortality rates. However, this intervention could not be accompanied by acomplementary increase in attended births as this requires a very different approach to servicedelivery – infrastructure requirements are greater as are the required facility staff skills.Both of these necessitate substantial additional resources as well as the capacity to use themeffectively. This underscores the point that, while responsible government stewardship is vitalto pro-equity health improvement, major gains cannot be achieved in countries confrontingmass deprivation without substantially increased international support.<strong>The</strong> goal: universal accessAn approach to the development of health care systems driven by primary health care mustaim at universal access to quality health care services. Speeding the historical movement towardsuniversal coverage will ensure that general health systems improvement does not mask– or contribute to – widening health inequalities.<strong>The</strong>re are many obstacles to this goal, including limitations in financial resources, educationand skilled personnel. But strong stewardship plays a significant role in dealing with theseconstraints. How rapidly countries advance towards universal coverage depends on whethergovernments accept a situation in which health benefits gradually trickle down from the richto the poor, or whether they accelerate actions to ensure a fair distribution of health careresources and benefits to all social groups.Government stewardship, community involvementResponsible health sector oversight and pro-equity commitments by the state are essential tobuilding and maintaining health systems based on primary health care. However, governmentsmust engage with and respond to communities in a two-way relationship if they are toperform their stewardship role effectively. Community involvement – including the dimensionsof participation, ownership and empowerment – is a key demand-side component ofthe health system, necessary to promote accountability and effectiveness.<strong>The</strong> Declaration of Alma-Ata acknowledged the importance of community involvement indefining health objectives and implementing strategies. <strong>The</strong> declaration affirmed that “peoplehave the right and duty to participate individually and collectively in the planning andimplementation of their health care” (3). However, the concept of community participationwas not easy to put into practice. In some cases, such participation emerged as a crucial factorin improving the performance of health systems. At community-owned health centres inMali, for example, the fact that communities paid the salaries of health centre staff led todramatic changes in the way nurses related to their clients (69). In a Sudanese village, a community-drivenproject has generated income and strengthened social capital – with positiveimplications for health (see Box 7.9). However, all too often “community participation” hasbeen limited to setting up health committees that acted as vehicles for cost recovery. Indeed,in some countries in west Africa, the term “community participation”, applied in the healthfield, became synonymous with “co-payment”.Recent years have seen a move away from narrow definitions of community and communityparticipation (through health committees, for example) to a wider view based on the involvementof civil society organizations. Such organizations are highly diverse. <strong>The</strong>y maymanage or co-manage health facilities (as the Federation of Community <strong>Health</strong> Associationsdoes in Mali), promote self-help and self-reliance, act as champions of forgotten or excluded
126 <strong>The</strong> <strong>World</strong> <strong>Health</strong> <strong>Report</strong> 2003groups (as in the case of organizations of people living with HIV/AIDS), or practise consumerprotection (like Thailand’s Consumer Foundation).One of the key roles of civil society organizations is to hold health care providers as well asgovernments accountable for what they do and how they do it. Where civil society is active,organizations can monitor government policy choices and practise advocacy. As stewards ofthe health system, ministries of health are responsible for protecting citizens’ health and ensuringthat quality health care is delivered to all who need it. This requires making the bestchoices given the available evidence, and systematically privileging the public interest overother competing priorities. This responsibility ultimately rests with governments, even in acontext of decentralization where lines of accountability may be blurred. Yet without mechanismsenabling people to hold officials accountable, stewardship may falter. To enable effectivepressure for accountability, accurate information about health and health systemsperformance is required throughout civil society. Government should make such informationpublic and accessible. <strong>The</strong> Mexican Secretariat of <strong>Health</strong>, for example, has published acomprehensive, user-friendly overview of the country’s state of health and of the performanceof the health system (70). Civil society groups themselves, in their watchdog function,also generate and share information for accountability. This has been the case with Thailand’sNational Forums for <strong>Health</strong> Care Reform (71).When the right structures are in place, effective governance and vigorous communityinvolvement support each other. Participatory budgeting in Porto Alegre, Brazil, offers anexample of consensus building with the community in what is usually a mainstream governmentactivity. Initiated in 1988, the process is now substantially consumer driven, with theimplementing agency accountable to its clients. Matching expenditure allocations to needsexpressed by the community has produced measurable improvements in access to socialservices (72).Box 7.9 Building partnerships for health in Sudan<strong>The</strong> Sudanese Basic Development Needs (BDN) programme was introducedin 1998 in Kosha, a remote village in Northern State with a populationof around 2500. A needs assessment survey undertaken thereshowed multiple social, economic and health problems. A great majorityof households had no latrines and 99% of the population used waterdirectly from the river. Many pregnant women suffered miscarriagesperhaps because of the strain of carrying water. Poor sanitation andhygiene resulted in many health problems, especially diarrhoeal diseases,malnutrition and eye infections. Vaccination coverage for children andmothers was very low and there was little practice of family planningmethods, although the fertility rate was among the highest in the country.Most of the people were extremely poor and unemployment wasvery high.Shortly after the introduction of the BDN programme, significantchanges were recorded in the lives of this population. <strong>The</strong> communityitself has rehabilitated the health centre, financially supported the medicalassistant, and adopted self-financed community health insurance throughthe community development fund. All households now have access tosafe water indoors, and over 60% of houses have sanitary latrines. Thishas resulted in a marked improvement of health indicators and a reductionin common diseases (diarrhoea, acute respiratory infections,malaria and dysentery), increased coverage of vaccination and antenatalcare, and a reduction in the malnutrition rate to less than 1%.<strong>The</strong> participation of local people in these matters has producedother positive changes: the enrolment of girls and boys in school hasincreased and adults have also participated in informal literacy classes;a nursery school has been established; and the youth social club hasbeen renovated. Moreover, a women’s committee has been formed toinitiate and support activities related to development of women’s status.<strong>The</strong> income of a majority of families has greatly increased throughthe cultivation of vegetables and fruit trees, with the assistance of smallloans from the village development committee. <strong>The</strong> village now has electricity,enabling the community to acquire television and satellite forevening entertainment. In addition to WHO, the community has managedto build strong partnerships with UNICEF, UNFPA, the Governmentof the Netherlands, the Canadian International Development Agency,local government and many nongovernmental organizations.<strong>The</strong> success of Kosha village has inspired five neighbouringvillages to organize themselves, without any intervention from thenational programme. Two of these villages have already completed thebaseline survey and the training of community organizations using theirown resources. <strong>The</strong> population of Kosha village itself is confident that itcan continue to make improvements in health and quality of life throughsustained self-help and self-reliant interventions.
<strong>Health</strong> Systems: principled integrated care 127Realizing genuine community involvement requires overcoming numerous obstacles. Twoissues are particularly constraining. First, communities, especially poor rural ones, may beunaware of the mechanisms for involvement. Second, relatively wealthy and more influentialsocial groups can often dominate political processes at community level, again particularly inrural areas. When the better-off are allowed to “represent” the whole community in planningand implementation discussions, relatively affluent groups can absorb benefits at the expenseof poor groups. Both these patterns restrict the capacity of poor people to participate fully inprocesses designed to foster community involvement in the health system. Implementingpolicies to overcome these obstacles is a key aspect of government stewardship in health.Building systems based on principles:WHO cooperation with countries<strong>The</strong> health goals described in this report will not be met without significant strengthening ofhealth systems in low-income and middle-income countries. This applies to achieving theMDGs, scaling up HIV/AIDS prevention and treatment, managing the double burden, andthe other key health objectives.<strong>The</strong>re are numerous ways in which health systems strengthening could be undertaken andsystems development priorities set. This chapter has proposed that countries’ efforts to buildup their health systems in the coming years should be guided by the values of primary healthcare. It has argued that, despite sweeping changes in the global health policy environmentover the past quarter-century, the core principles of primary health care remain valid.Even greater challenges lie in the future for health systems. In the years ahead, environmentalchange will affect population health in ways not yet understood. <strong>Health</strong> systems are alreadygrappling with the effects of economic globalization, including migration and the impact oftrade patterns and practices on population health. As issues such as intellectual propertyrights and trade in services continue to be debated in international forums, health systemswill face new pressures. In this context, resolute commitment to the primary health care valuesof equity, universal access to care, community involvement and intersectoral action willbe more important than ever.This chapter has begun to investigate how a health systems effort based on primary healthcare might confront key challenges in workforce development and retention, informationmanagement, health financing, and pro-equity stewardship. Clearly, however, this investigationmust be carried further. Much remains to be understood about how health systems function,why they fail or respond slowly to some crises, and about how primary health careprinciples can be translated into practical policies that will yield health improvements forcommunities. Intensified research and information sharing on health systems must be highon the agenda of the global health community.Promoting health systems research is an element of WHO’s programme for more effectivecooperative work with countries. WHO will also work closely with countries to exploit fullycurrent health systems knowledge and the results of ongoing research. <strong>The</strong> priorities for thiswork include:■■strengthening the quality of policy research and improving international access to currentevidence about the effectiveness of primary health care models and interventions;building new networks to facilitate the sharing of best practices and experience;
128 <strong>The</strong> <strong>World</strong> <strong>Health</strong> <strong>Report</strong> 2003■■■developing a coherent “programme of work” for primary health care that effectively integratesall levels of WHO;improving communication and collaboration with other international agencies to avoidsending contradictory messages on health systems development;developing an evaluative framework and a review process that will help Member States toreview existing primary health care policies and plan any necessary changes (2).Above all, WHO’s commitment with respect to health care systems based on primary healthcare is to move the Organization’s focus as rapidly as possible from advocating principles tosupporting practical application through technical cooperation with Member States. Currentglobal consultations on primary health care will provide opportunities for sharing evidenceand comparing country experiences. <strong>The</strong> urgency of global health challenges demandsthat this knowledge be turned speedily into action for health systems improvement based onprimary health care.<strong>The</strong> commitment to cooperation with countries on health systems development is part of abroader change in WHO’s way of working. At a time when new challenges need to be metwith new responses, WHO is altering its approach and redirecting its resources. <strong>The</strong> Organizationis reinforcing its technical collaboration and support for people in governments, theprivate sector and civil society who are engaged in health work. This support will come fromall levels of WHO and will be displayed in specific country cooperation strategies. StrengtheningWHO’s presence in countries and intensifying country-level collaboration is the bestway for the Organization to accelerate progress towards the goals that unite the global healthcommunity: measurable health improvements for all, and vigorous strides to close equitygaps.This report began by describing the contrasts that characterize global health. An approachbased on primary health care recognizes the need to attack the roots of health disparitiesintersectorally. Hence the importance of the MDGs, and the global compact on which thegoals are founded. <strong>The</strong> health sector can make the most effective contribution to the attainmentof the MDGs, HIV/AIDS treatment targets and other objectives by strengthening healthcare systems. Working together to build effective, responsive, pro-equity health care systems,WHO, Member States and their partners will shape a more just, more secure and healthierfuture for all.
<strong>Health</strong> Systems: principled integrated care 129References1. <strong>The</strong> world health report 2000 – <strong>Health</strong> systems: improving performance. Geneva, <strong>World</strong> <strong>Health</strong> Organization,2000.2. Primary health care: a framework for future strategic directions. Geneva, <strong>World</strong> <strong>Health</strong> Organization, 2003(WHO/MNC/OSD/03.01).3. Declaration of Alma-Ata. In: International Conference on Primary <strong>Health</strong> Care, Alma-Ata, USSR, 6–12September 1978. Geneva, <strong>World</strong> <strong>Health</strong> Organization, 1978 (<strong>Health</strong>-for-All Series, No. 1; http://www.who.int/hpr/archive/docs/almaata.html, accessed 3 October 2003).4. Altenstetter C, Bjorkman JW, eds. <strong>Health</strong> policy reform: national variations and globalization. New York, NY,St Martin’s, 1997.5. <strong>World</strong> development report 1993: investing in health. Washington, DC, <strong>World</strong> Bank, 1993.6. Innovative care for chronic conditions: building blocks for action. Geneva, <strong>World</strong> <strong>Health</strong> Organization, 2002.7. Bodenheimer T et al. Improving primary care for patients with chronic illness – the chronic care model,part 2. JAMA, 2002, 288:1909–1914.8. Coleman R et al. Noncommunicable disease management in resource-poor settings: a primary care modelfrom rural South Africa. Bulletin of the <strong>World</strong> <strong>Health</strong> Organization, 1998, 76:633–640.9. Unwin N et al. Tackling the emerging pandemic of non-communicable diseases in Sub-Saharan Africa: theessential NCD health intervention project. Public <strong>Health</strong>, 1999, 113:141–146.10. Antiretroviral therapy in primary health care: South African experience. Geneva, <strong>World</strong> <strong>Health</strong> Organization,2003 (WHO/HIV/2003.04).11. Hunter D. Public health policy. Cambridge, Polity Press, 2003.12. Situation assessment. Gabarone, African Comprehensive HIV/AIDS Partnership, 2001.13. Ranson MK et al. <strong>The</strong> public health implications of multilateral trade agreements. In: Lee K, Buse K,Fustukian S, eds. <strong>Health</strong> policy in a globalising world. Cambridge, Cambridge University Press, 2002:18–40.14. Narasimhan V et al. <strong>The</strong> next frontier: responding to the global human resources crisis. Lancet (in press).15. <strong>The</strong> health sector human resources crisis in Africa: an issues paper. Washington, DC, USAID, 2003.16. Kurowski C et al. Human resources for health: requirements and availability in the context of scaling up priorityinterventions. Case studies from Tanzania and Chad. 2002 (<strong>Report</strong> to United Kingdom Department forInternational Development).17. Van Rensburg D, Van Rensburg N. South African health review 1999 briefing summary: distribution of humanresources. Durban, <strong>Health</strong> Systems Trust, 1999 (http://www.hst.org.za/sahr/99/summary/bshuman.htm,accessed 3 October 2003).18. Beaglehole R, Dal Poz MR. Public health workforce: challenges and policy issues. Human Resources for<strong>Health</strong>, 2003, 1:4.19. Vaz F et al. Training medical assistants for surgery. Bulletin of the <strong>World</strong> <strong>Health</strong> Organization, 1999, 77:688–691.20. Pereira C et al. A comparative study of caesarean deliveries by assistant medical officers and obstetricians inMozambique. British Journal of Obstetrics and Gynaecology, 1996, 193:508–512.21. Buchan J, Ball J, O’May F. If changing skill mix is the answer, what is the question? Journal of <strong>Health</strong> ServicesResearch and Policy, 2001, 6:233–238.22. Horrocks S, Anderson E, Salisbury C. Systematic review of whether nurse practitioners working in primarycare can provide equivalent care to doctors. BMJ, 2002, 324:819–823.23. Mid-level and nurse practitioners in the Pacific: models and issues. Manila, <strong>World</strong> <strong>Health</strong> OrganizationRegional Office for the Western Pacific, 2001.24. Better health in Africa: experience and lessons learned. Washington, DC, <strong>World</strong> Bank, 1993.25. Farmer P et al. Community-based approaches to HIV treatment in resource-poor settings. Lancet, 2001,358:404–409.26. Maher D. <strong>The</strong> role of the community in the control of tuberculosis. Tuberculosis, 2003, 83:177–182.27. Farmer P et al. Community-based treatment of advanced HIV disease: introducing DOT-HAART (directlyobserved therapy with highly active antiretroviral therapy). Bulletin of the <strong>World</strong> <strong>Health</strong> Organization, 2001,79:1145–1151.28. Nsutebu EF. Scaling-up HIV/AIDS and TB home-based care: lessons from Zambia. <strong>Health</strong> Policy andPlanning, 2001, 16:240–247.29. Dovlo D, Nyonator F. Migration of graduates of the University of Ghana Medical School: a preliminaryrapid appraisal. Human Resources for <strong>Health</strong> Development Journal, 1999, 3:34–37.30. Bundred PE, Levitt C. Medical migration: who are the real losers? Lancet, 2000, 356:245–246.31. Commonwealth code of practice for international recruitment of health workers. London, CommonwealthSecretariat, 2002 (www.commedas.org/files/COP/COP.pdf, accessed 3 October 2003).
130 <strong>The</strong> <strong>World</strong> <strong>Health</strong> <strong>Report</strong> 200332. Issakha D, Abdoulaye L, Cheikhou S. Motorcycles for nurses in rural health posts of Senegal. <strong>World</strong> <strong>Health</strong>Forum, 1995, 16:249–251.33. Chomitz K. What do doctors want? Developing incentives for doctors to serve in Indonesia’s rural and remoteareas. Washington, DC, <strong>World</strong> Bank, 1998 (Policy Research Working Paper No. 1888).34. Nieves I, La Forgia G, Ribera J. Large-scale government contracting of NGOs to extend basic health servicesto poor populations in Guatemala. In: Rosenmöller M, ed. Challenges of health reform: reaching the poor.Barcelona, Estudios y Ediciones IESE, 2000:117–132 (http://www.worldbank.org/lachealth, accessed3 October 2003).35. Loevinsohn B. Contracting for the delivery of primary health care in Cambodia: design and initial experience ofa large pilot test. Washington, DC, <strong>World</strong> Bank, 2001.36. Starfield B. Primary care and health: an international comparison. Journal of the American MedicalAssociation, 1991, 266:2268–2271.37. <strong>The</strong> National Coalition on <strong>Health</strong> Care and <strong>The</strong> Institute for <strong>Health</strong>care Improvement. Curing the system:stories of change in chronic illness care. Accelerating Change Today, May 2002 (http://www.qualityhealthcare.org/qhc/uploads/ACT3finalChronic.pdf, accessed 3 October 2003).38. Langley G et al. <strong>The</strong> improvement guide: a practical approach to enhancing organizational performance. SanFrancisco, CA, Jossey-Bass, 1996.39. Berwick DM. Disseminating innovations in health care. JAMA, 2003, 289:1969–1975.40. Wagner EH et al. Improving chronic illness care: translating evidence into action. <strong>Health</strong> Affairs, 2001:64–78.41. Van Lerberghe W, Adams O, Ferrinho P. Human resources impact assessment. Bulletin of the <strong>World</strong> <strong>Health</strong>Organization, 2002, 80:525.42. Mathers CD et al. <strong>The</strong> global burden of disease in 2002: data sources, methods and results. Geneva, <strong>World</strong><strong>Health</strong> Organization, 2003 (GPE Discussion Paper No. 54; http://www.who.int/evidence, accessed3 October 2003).43. Lopez AD et al. <strong>World</strong> mortality in 2000: life tables for 191 countries. Geneva, <strong>World</strong> <strong>Health</strong> Organization(http://www3.who.int/whosis/life/life_tables/life_tables.cfm?path=evidence,life,life_tables&language=english, accessed 3 October 2003).44. Boerma JT, Holt E, Black RE. Biological and clinical data collection in surveys in less developed countries.Population and Development Review, 2001, 27:303–314.45. Lippeveld T, Sauerborn R, Bodart C. Design and implementation of health information systems. Geneva,<strong>World</strong> <strong>Health</strong> Organization, 2000.46. Financing of health services. <strong>Report</strong> of a WHO study group. Geneva, <strong>World</strong> <strong>Health</strong> Organization, 1978 (WHOTechnical <strong>Report</strong> Series, No. 625).47. ILO-Universitas Programme. Extending social protection through community based health organizations:evidence and challenges. Geneva, International Labour Organization, 2002.48. Uzochukwu BS, Onwujekwe OE, Akpala CO. Effect of the Bamako-Initiative drug revolving fund onavailability and rational use of essential drugs in primary health care facilities in south-east Nigeria. <strong>Health</strong>Policy and Planning, 2002, 17:378–383.49. Hutubessy RC et al. Generalized cost-effectiveness analysis: an aid to decision making in health. Applied<strong>Health</strong> Economics and <strong>Health</strong> Policy, 2002, 1:39–46.50. Soucat A, Van Lerberghe W, Knippenberg R. Buying results, budgeting for bottlenecks: the new performancefrontier. Washington, DC, <strong>World</strong> Bank, 2002 (draft background paper, <strong>World</strong> Bank Policy and SectorAnalysis Support Team-Africa Region Human Development (AFTHD)).51. Gwatkin D. Who would gain most from efforts to reach the Millennium Development Goals for health? Aninquiry into the possibility of progress that fails to reach the poor. Washington, DC, <strong>World</strong> Bank, 2002 (HNPDiscussion Paper).52. Filmer D, Hammer J, Pritchett L. Weak links in the chain II: a prescription for health policy in poorcountries. <strong>World</strong> Bank Research Observer, 2002, 17:47–66.53. <strong>The</strong> world health report 2002 – Reducing risks, promoting healthy life. Geneva, <strong>World</strong> <strong>Health</strong> Organization, 2002.54. Castro-Leal F et al. Public spending on health care in Africa: do the poor benefit? Bulletin of the <strong>World</strong><strong>Health</strong> Organization, 2000, 78:66–74.55. Victora CG et al. <strong>The</strong> impact of health interventions on inequalities: infant and child health in Brazil. In:Leon D, Walt G, eds. Poverty , inequality and health: an international perspective. Oxford, Oxford UniversityPress, 2001:125–136.56. Kunst AE, Houweling T. A global picture of poor-rich differences in the utilisation of delivery care. In: deBrouwere V, Van Lerberghe W, eds. Safe motherhood strategies: a review of the evidence. Studies in <strong>Health</strong>Services Organisation and Policy, 2001, 17:297–317.57. Sen A. Capability and well-being. In: Nussbaum M, Sen A, eds. <strong>The</strong> quality of life. Oxford, Oxford UniversityPress, 1993:330–353.
<strong>Health</strong> Systems: principled integrated care 13158. Birdsall N, Hecht R. Swimming against the tide: strategies for improving equity in health. In: Colclough C,ed. Marketising education and health in developing countries: miracle or mirage? Oxford, Oxford UniversityPress, 1997.59. Delamonica E, Minujin A, Vandemoortele J. Economic growth, poverty and children. Environment andUrbanization, 2002, 14:23–43.60. Victora CG et al. Applying an equity lens to child health and mortality: more of the same is not enough.Lancet, 2003, 362:233–241.61. DAC guidelines and reference series: poverty and health. Paris, Organisation for Economic Co-Operation andDevelopment/<strong>World</strong> <strong>Health</strong> Organization, 2003:31.62. Durie M. Providing health services to indigenous peoples. BMJ, 2003, 327:408–409.63. Primary health care review project: region specific report. Manila, <strong>World</strong> <strong>Health</strong> Organization Regional Officefor the Western Pacific, 2002.64. Rawlings L, Rubio G. Evaluating the impact of conditional cash transfer programs: lessons from Latin America.Washington, DC, <strong>World</strong> Bank, 2003 (<strong>World</strong> Bank Policy Research Working Paper 3119).65. Jongudomsuk P, Thammatuch-aree J, Chittinanda P. Pro-equity health financing schemes in Thailand: areview of country experience. Bangkok, Ministry of <strong>Health</strong> (in press).66. Sánchez F, Núñez J. La ley 100/93 sí llegó a las personas de menores ingresos [Act N° 100/93 did affectpeople on low incomes]. Revista Vía Salud, 1999, 9:6-12 (http://www.cgh.org.co/revista/, accessed6 October 2003).67. Indicadores de Coyuntura Macroeconómica [Macroeconomic situation indicators]. Departamento dePlaneación Nacional, República de Colombia (http://www.dnp.gov.co, accessed 6 October 2003).68. Khan MM, Yoder RA. Expanded programme on immunization in Bangladesh: cost, cost-effectiveness. Bethesda,MD, Partnerships for <strong>Health</strong> Reform, 1998 (http://www.childrensvaccine.org/files/Abt-PNACH278.pdf,accessed 6 October 2003).69. Maiga Z, Traoré Nafo F, El Abassi A. La réforme du secteur santé au Mali 1989-1996 [Reform of the healthsector in Mali, 1989-1996]. Antwerp, ITGPress, 1999 (Studies in <strong>Health</strong> Services Organisation and Policy,No.12).70. Salud México 2002: Información para la rendición de cuentas [<strong>Health</strong> in Mexico 2002: data for accountability].México, DF, Secretaría de Salud, 2002.71. Forum on <strong>Health</strong> Care Reform. Bangkok, Moh-Chao Ban Publishing House, 2000.72. United Nations Development Programme. Human development report 2003. Oxford, Oxford UniversityPress, 2003 (http://www.undp.org/hdr2003/, accessed 3 october 2003).
Statistical Annex 133Statistical Annex<strong>The</strong> six tables in this technical annex present updatedinformation on summary measures of population health,mortality and the burden of disease in WHO Member Statesand regions, and selected national health accounts aggregatesfor 1997–2001. Life expectancy and healthy life expectancyestimates and the national health accounts aggregates havebeen revised to take new data into account and, for manyMember States, are not directly comparable with thosepublished in <strong>The</strong> <strong>World</strong> <strong>Health</strong> <strong>Report</strong> 2002. <strong>The</strong> work leadingto these annex tables was undertaken mostly by the WHOGlobal Programme on Evidence for <strong>Health</strong> Policy in collaborationwith counterparts from WHO regional offices andrepresentatives of WHO in Member States. Where data arepresented by country, initial WHO estimates and technicalexplanations were sent to Member States for comment. <strong>The</strong>estimates reported here should, however, still be interpretedas being the best estimates of WHO rather than the officialviewpoints of Member States.
134 <strong>The</strong> <strong>World</strong> <strong>Health</strong> <strong>Report</strong> 2003
Statistical Annex 135Statistical AnnexExplanatory notes<strong>The</strong> tables in this technical annex present updated information on summary measures ofpopulation health, mortality and the burden of disease in WHO Member States and regions,and selected national health accounts aggregates for 1997–2001. Life expectancy and healthylife expectancy estimates and the national health accounts aggregates have been revised totake new data into account and, for many Member States, are not directly comparable withthose published in <strong>The</strong> <strong>World</strong> <strong>Health</strong> <strong>Report</strong> 2002. <strong>The</strong> work leading to these annex tables wasundertaken mostly by the WHO Global Programme on Evidence for <strong>Health</strong> Policy in collaborationwith counterparts from WHO regional offices and representatives of WHO inMember States. <strong>The</strong>se notes provide an overview of concepts, methods and data sources togetherwith references to more detailed documentation.It is hoped that careful scrutiny and use of the results will lead to progressive improvementsin the measurement of health attainment and health system financing in future editions of<strong>The</strong> <strong>World</strong> <strong>Health</strong> <strong>Report</strong>. <strong>The</strong> main results in the health attainment tables are reported withuncertainty intervals in order to communicate to the user the plausible range of estimates foreach country on each measure. Where data are presented by country, initial WHO estimatesand technical explanations were sent to Member States for comment. Comments or dataprovided in response were discussed with the Member State and incorporated where possible.<strong>The</strong> estimates reported here should, however, still be interpreted as being the best estimatesof WHO rather than the official viewpoints of Member StatesAnnex Table 1To assess overall levels of health achievement, it is crucial to develop the best possible assessmentof the life table for each country. New life tables have been developed for all 192 MemberStates starting with a systematic review of all available evidence from surveys, censuses,sample registration systems, population laboratories and vital registration on levels and trendsin child mortality and adult mortality (1). This review benefited greatly from a collaborativeassessment of child mortality levels for 2001 by WHO and UNICEF and from analyses ofgeneral mortality by the United States Census Bureau (2) and the United Nations PopulationDivision (3).All estimates of population size and structure for 2002 are based on the 2002 demographicassessments prepared by the United Nations Population Division (3). <strong>The</strong>se estimates refer tothe de facto population and not the de jure population in each Member State. To aid in
136 <strong>The</strong> <strong>World</strong> <strong>Health</strong> <strong>Report</strong> 2003demographic, cause-of-death and burden-of-disease analyses, the 192 Member States havebeen divided into five mortality strata on the basis of their level of child and adult malemortality. <strong>The</strong> matrix defined by the six WHO regions and the five mortality strata leads to14 subregions, since not every mortality stratum is represented in every region. <strong>The</strong>sesubregions are defined on pages 184–185 and used in Tables 2 and 3 for presentation ofresults.Because of increasing heterogeneity of patterns of adult and child mortality, WHO has developeda model life table system of two-parameter logit life tables using a global standard, andwith additional age-specific parameters to correct for systematic biases in the application ofa two-parameter system (4). This system of model life tables has been used extensively in thedevelopment of life tables for those Member States without adequate vital registration and inprojecting life tables to 2002 when the most recent data available are from earlier years.Demographic techniques (Preston–Coale method, Brass Growth–Balance method, GeneralizedGrowth–Balance method and Bennett–Horiuchi method) have been applied, as appropriate,to assess the level of completeness of recorded mortality data for Member States withvital registration systems. For Member States without national vital registration systems,all available survey, census and vital registration data were assessed, adjusted and averagedto estimate the probable trend in child mortality over the past few decades. This trend wasprojected to estimate child mortality levels in 2002. In addition, adult sibling survival datafrom available population surveys were analysed to obtain additional information on adultmortality.WHO uses a standard method to estimate and project life tables for all Member States withcomparable data. This may lead to minor differences compared with official life tables preparedby Member States. Life expectancies for the year 2002 for many Member States havebeen revised from those published for 2000 and 2001 in <strong>The</strong> <strong>World</strong> <strong>Health</strong> <strong>Report</strong> 2002 to takeinto account more recently available mortality data.To capture the uncertainty resulting from sampling, indirect estimation technique or projectionto 2002, a total of 1000 life tables have been developed for each Member State. Uncertaintybounds are reported in Annex Table 1 by giving key life table values at the 2.5th percentileand the 97.5th percentile. This uncertainty analysis was facilitated by the development ofnew methods and software tools (5). In countries with a substantial HIV/AIDS epidemic,recent estimates of the level and uncertainty range of the magnitude of the epidemic havebeen incorporated into the life table uncertainty analysis.Annex Tables 2 and 3Causes of death in the 14 subregions and the world have been estimated based on data from112 national vital registration systems that capture about 18.6 million deaths annually, representingone-third of all deaths occurring in the world. In addition, information from sampleregistration systems, population laboratories and epidemiological analyses of specific conditionshas been used to improve estimates of the cause-of-death patterns (6–16). <strong>The</strong>se dataare used to estimate death rates by age and sex for underlying causes of death as defined bythe International Statistical Classification of Diseases and Related <strong>Health</strong> Problems (ICD)classification rules.Cause-of-death data have been carefully analysed to take into account incomplete coverageof vital registration in countries and the likely differences in cause-of-death patternsthat would be expected in uncovered and often poorer sub-populations. Techniques to
Statistical Annex 137undertake this analysis have been developed based on the global burden of disease study (17)and further refined using a much more extensive database and more robust modelling techniques(18).Special attention has been paid to problems of misattribution or miscoding of causes of deathin cardiovascular diseases, cancer, injuries and in general ill-defined categories. A correctionalgorithm for reclassifying ill-defined cardiovascular codes has been developed (19). Cancermortality by site has been evaluated using both vital registration data and population-basedcancer incidence registries. <strong>The</strong> latter have been analysed using a complete age, period cohortmodel of cancer survival in each region (15).Annex Table 3 provides estimates of the burden of disease for the 14 epidemiological subregionsusing disability-adjusted life years (DALYs). One DALY can be thought of as one lost year of“healthy” life and the burden of disease as a measurement of the gap between the currenthealth of a population and an ideal situation in which everyone in the population lives intoold age in full health (20, 21). DALYs for a disease or health condition are calculated as thesum of the years of life lost (YLL) through premature mortality in the population and theyears lost through disability (YLD) for incident cases of the health condition. DALYs for 2002have been estimated using cause-of-death information for each subregion and regional orcountry-level assessments of the epidemiology of major disabling conditions. For this report,burden-of-disease estimates have been updated for many of the cause categories included inthe Global Burden of Disease 2000 study, based on the wealth of data on major diseases andinjuries available to WHO technical programmes and through collaboration with scientistsworldwide (16). <strong>The</strong>se data, together with new and revised estimates of deaths by cause, ageand sex, for all Member States, have been used to develop internally consistent estimates ofincidence, prevalence, duration and DALYs for over 130 major causes, for 14 subregions ofthe world. WHO programme participation in the development of these estimates and consultationwith Member States ensures that estimates reflect all information and knowledgeavailable to WHO. Estimates of incidence and point prevalence for selected major causes bysubregion are also available on the WHO web site at www.who.int/evidence/bod.Annex Table 4Annex Table 4 reports the average level of population health for WHO Member States interms of health-adjusted life expectancy (HALE). HALE is based on life expectancy at birth(Annex Table 1) but includes an adjustment for time spent in poor health. It is most easilyunderstood as the equivalent number of years in full health that a newborn can expect to livebased on current rates of ill-health and mortality (22, 23).<strong>The</strong> methods used by WHO to calculate HALE have been developed to maximize comparabilityacross populations. WHO analyses of more than 50 existing national health surveys forthe calculation of healthy life expectancy identified severe limitations in the comparability ofself-reported health status data from different populations, even when identical survey instrumentsand methods were used (24). <strong>The</strong>se comparability problems are a result ofunmeasured differences in expectations and norms for health, so that the meaning differentpopulations attach to the labels used for response categories in self-reported questions (suchas mild, moderate or severe) can vary greatly (25). To resolve these problems, WHO undertooka Multi-Country Survey Study (MCSS) in 2000–2001 in collaboration with MemberStates, using a standardized health status survey instrument together with new statisticalmethods for adjusting biases in self-reported health (25, 26).
138 <strong>The</strong> <strong>World</strong> <strong>Health</strong> <strong>Report</strong> 2003<strong>The</strong> MCSS carried out 71 representative household surveys in 61 Member States in 2000 and2001 using a new health status instrument based on the International Classification of Functioning,Disability and <strong>Health</strong> (27), which seeks information from a representative sample ofrespondents on their current states of health according to seven core domains. To overcomethe problem of comparability of self-report health data, the WHO survey instrument usedperformance tests and vignettes to calibrate self-reported health in each of the core domains(26). <strong>The</strong> calibrated responses are used to estimate the prevalence of different states of healthby age and sex. Building on the findings from the MCSS, WHO is now carrying out the <strong>World</strong><strong>Health</strong> Survey, in collaboration with Member States (further details are available from theWHO web site at www.who.int/evidence/whs). During the first half of 2003, 73 MemberStates conducted the <strong>World</strong> <strong>Health</strong> Survey, and its results will contribute to future analysis ofhealthy life expectancy.<strong>The</strong> measurement of time spent in poor health is based on combining condition-specificestimates from the Global Burden of Disease 2000 study with estimates of the prevalence ofdifferent health states by age and sex derived from the MCSS, and weighted using health statevaluations (28). Data from the Global Burden of Disease 2000 study were used to estimateseverity-adjusted prevalences for health conditions by age and sex for all 192 WHO MemberStates for 2002. Data from 62 surveys in the MCSS were used to make independent estimatesof severity-adjusted prevalences by age and sex. Finally, posterior prevalences for all MemberStates for 2002 were calculated using prevalences based on the Global Burden of Disease 2000and the survey prevalences.Household surveys including a valuation module were conducted in 14 countries: China,Colombia, Egypt, Georgia, India, Indonesia, the Islamic Republic of Iran, Lebanon, Mexico,Nigeria, Singapore, Slovakia, the Syrian Arab Republic and Turkey. Data on nearly 500 000health state valuations from over 46 000 respondents were used to develop average globalhealth state valuations for the calculation of HALE (29).<strong>The</strong> methods used by WHO to calculate healthy life expectancy were peer-reviewed during2001 and 2002 by the Scientific Peer Review Group (SPRG) established by the Director-Generalin response to a request by the WHO Executive Board. <strong>The</strong> SPRG’s final report to theDirector-General (30) stated that the methodology for the measurement of HALE was welladvanced, and made a number of technical recommendations which have been followed withregard to the calculations reported in Annex Table 4. In particular, steps have been taken toinclude residents in health institutions, and dependent comorbidity. <strong>The</strong> MCSS survey samplesdid not include older people resident in nursing homes or other health institutions.Because these people generally have worse health than those resident in households, an adjustmentwas made based on the estimated proportion of the population aged 60 years andover who were resident in health institutions.Summation of condition-specific prevalences across all causes in the Global Burden of Disease2000 would result in overestimation of health state prevalences because of comorbiditybetween conditions. In previous editions of <strong>The</strong> <strong>World</strong> <strong>Health</strong> <strong>Report</strong>, adjustments have beenmade for independent comorbidity (22). Following the scientific peer review, further workwas undertaken to take dependent comorbidity properly into account. Data from five largenational health surveys were analysed by age and sex to estimate the degree of dependentcomorbidity for pairs of conditions. <strong>The</strong>re was surprising consistency across the five surveysand the results were used for all Member States to adjust for dependent comorbidity in summationof condition-specific prevalences (16).
Statistical Annex 139Annex Table 4 reports for all Member States for 2002 the following: average HALE at birth,HALE at age 60, expected lost healthy years (LHE) at birth, percentage of total life expectancy(LE) lost, and 95% uncertainty intervals. LHE is calculated as LE – HALE and is the expectedequivalent number of years of full health lost through living in health states other than fullhealth. LHE expressed as a percentage of total LE represents the proportion of total life expectancythat is lost through living in health states of less than full health. <strong>Health</strong>y life expectanciesfor 2002 are not comparable with those published for 2001 in <strong>The</strong> <strong>World</strong> <strong>Health</strong> <strong>Report</strong>2002 for many Member States, as they incorporate new epidemiological information, newdata from health surveys, and new information on mortality rates, as well as the improvementsin methods described above. In particular, the implementation of improved methodsfor dealing with comorbidity has resulted in a reduction in estimated proportion of healthyyears of life lost at older ages compared to estimates published in previous years.Annex Table 5National health accounts (NHA) are a synthesis of the financing and spending flows recordedin the operation of a health system, with a potential to monitor all transactions from fundingsources to the distribution of benefits across geographical, demographic, socioeconomic andepidemiological dimensions. NHA are related to the macroeconomic and macrosocial accountswhose methodology they borrow.Annex Table 5 provides estimates for each of the 192 Member States. Although more andmore countries collect health expenditure data, only a limited number have produced fullnational health accounts. Nationally and internationally available information that has beenidentified and obtained has been compiled for each country. Standard accounting estimationand extrapolation techniques have been applied to provide adequate time series. A policyrelevantbreakdown of the data (for example, public/private expenditure) is also provided.Each year draft templates are sent to ministers of health for their comments and their assistancein obtaining additional information should that be necessary. <strong>The</strong> constructive responsesfrom ministries have provided valuable information for the NHA estimates reported here.An important methodological contribution to producing national health accounts is nowavailable in the Guide to producing national health accounts with special applications for lowincomeand middle-income countries (31). This guide is based on the Organisation for EconomicCo-operation and Development (OECD) System of health accounts (32). Both reportsare built on the principles of the United Nations System of national accounts (commonlyreferred to as SNA93) (33).<strong>The</strong> principal international references used to produce the tables are the International MonetaryFund (IMF) Government finance statistics yearbook, 2002 (34), International financialstatistics yearbook, 2003 (35) and International Financial Statistics (September 2003) (36); theAsian Development Bank Key indicators 2002 (37); OECD health data 2003 (38) and Internationaldevelopment statistics (39); and the United Nations National accounts statistics: mainaggregates and detailed tables, 2000 (40). <strong>The</strong> organizations charged with producing thesereports facilitated the supply of advanced copies for WHO and gave additional related information,and their contributions are acknowledged with gratitude here.National sources include: national health accounts reports, public expenditure reports, statisticalyearbooks and other periodicals, budgetary documents, national accounts reports,statistical data on official web sites, nongovernmental organization reports, academic
140 <strong>The</strong> <strong>World</strong> <strong>Health</strong> <strong>Report</strong> 2003studies, and reports and data provided by central statistical offices, ministries of health, ministriesof finance and economic development, planning offices, and professional and tradeassociations.Annex Table 5 provides both updated and revised figures for 1997–2000 and new data for2001. Figures have been updated when new information that changes the original estimateshas become available. This category includes benchmarking revisions, whereby an occasionalwholesale revision is made by a country owing to a change in methodology, when a moreextensive NHA effort is undertaken, or when shifting the denominator from SNA68 to SNA93.Colombia is a case in point.Total expenditure on health has been defined as the sum of general government expenditureon health (GGHE or public expenditure on health), and private expenditure on health (PvtHE).All estimates are calculated in millions of national currency units (million NCU). <strong>The</strong> estimatesare presented as ratios to gross domestic product (GDP), to total health expenditure(THE), to total general government expenditure (GGE), or to total private expenditure onhealth (PvtHE).GDP is the value of all goods and services provided in a country by residents and non-residentswithout regard to their allocation among domestic and foreign claims. This (with smalladjustments) corresponds to the total sum of expenditure (consumption and investment) ofthe private and government agents of the economy during the reference year. <strong>The</strong> UnitedNations National accounts statistics: main aggregates and detailed tables, 2000 (40), table 1.1,was the main source of GDP estimates. For the 30 Member countries of the OECD, the macroeconomicaccounts have been imported from the National accounts of OECD countries 1990/2001, 2003 edition, volume II (41), table 1. Collaborative arrangements between WHO andthe United Nations Statistics Division and the Economic Commission for Europe of the UnitedNations have permitted the receipt of advance information on 2001.When United Nations data were unavailable, GDP data reported by the IMF (InternationalFinancial Statistics, September 2003) have been used. In the few cases where none of thepreceding institutions reported updated GDP information, WHO has used data from otherinstitutions or national series. National series were used for Andorra, the Federated States ofMicronesia, Nicaragua, Niue, Palau, Samoa, Solomon Islands and Tonga. Figures for Kiribatiwere obtained from the Asian Development Bank. <strong>The</strong> estimates for Afghanistan, the DemocraticPeople’s Republic of Korea, Iraq, Somalia and Timor-Leste originate from policy reports,as no standard statistical sources had any information on these countries.<strong>The</strong> data for China exclude estimates for Hong Kong Special Administrative Region and MacaoSpecial Administrative Region. <strong>The</strong> health expenditure data for Jordan exclude the contributionsfrom United Nations Relief and Works Agency for Palestine Refugees in the Near East(UNRWA), which provided basic health services support to Palestinian refugees residing onJordanian territories, but include UNRWA expenditures to UNRWA clinics. <strong>The</strong> 1997 and1998 health expenditure data for Serbia and Montenegro included the provinces of Kosovoand Metohia, but for 1999 and 2000 the data excluded Kosovo and Metohia, since these territorieshave been placed under the administration of the United Nations. <strong>The</strong> estimate for2001 was also extrapolated without Kosovo and Metohia.General government expenditure (GGE) includes consolidated direct outlays and indirectoutlays (for example, subsidies to producers, transfers to households), including capital of alllevels of government (central/federal, provincial/regional/state/district, and municipal/localauthorities), social security institutions, autonomous bodies, and other extrabudgetary funds.
Statistical Annex 141National accounts of OECD countries: detailed tables 1990/2001, 2003 edition, volume II, table12, row 51, supplies the information for 27 member countries. <strong>The</strong> IMF Government financestatistics yearbook supplies an aggregate figure for 133 central/federal governments with complementsfor 23 regional and 45 local/municipal governments (as well as some social securitypayments for health data received from the IMF). It reports central government disbursementfigures in its International Financial Statistics, row 82. Several other public finance audits,executed budgets, budget plans, statistical yearbooks, web sites, <strong>World</strong> Bank and RegionalDevelopment Bank reports, and academic studies have been consulted to verify total governmentexpenditure. Extrapolations were made on incomplete time series using, inter alia, thedifferential between current disbursement plus savings in the United Nations National accountsup to 1995 and the IMF central government disbursement level. Several national authoritieshave also confirmed the GGE series during the consultative process.GGHE comprises the outlays earmarked for the enhancement of the health status of populationsegments and/or the distribution of medical care goods and services among populationsegments by:■■■central/federal, state/provincial/regional, and local/municipal authorities;extrabudgetary agencies, principally social security schemes, which operate in severalcountries;external resources (mainly grants and credits with high grant components to governments).<strong>The</strong> figures for social security and extrabudgetary expenditure on health include purchasesof health goods and services by schemes that are compulsory, under governmental control,and covering a sizeable segment of the population. A major hurdle has been the need to verifythat no double counting occurs and that no cash benefits for sickness and/or loss of employmentare included in the estimates, as these are classified as income maintenance expenditure.All expenditures are to be accounted for, including final consumption, subsidies to producers,transfers to households (chiefly reimbursements for medical and pharmaceutical bills),investment and investment grants (also referred to as capital transfers). <strong>The</strong> classification ofthe functions of government, promoted by the United Nations, IMF, OECD and other institutions,sets the boundaries. In many instances, the data contained in the publications arelimited to those supplied by ministries of health. Expenditures on health, however, shouldinclude expenditures where the primary intent is for health regardless of the implementingentity. An effort has been made to obtain data on health expenditures by other ministries, thearmed forces, prisons, schools, universities and others, to ensure that all resources accountingfor health expenditures are included. Information on external resources was receivedcourtesy of the Development Action Committee of the OECD (DAC/OECD). A quarter ofMember States explicitly monitor the external resources entering their health system, informationthat has been used to validate or amend the order of magnitude derived from theDAC entries.OECD health data 2003 supplies GGHE entries for its member countries, with some gaps forthe year 2001. In addition, the data for the year 2001 for Austria, Belgium, Iceland, Japan,Luxembourg, Republic of Korea and Turkey have been largely developed by WHO as theywere not yet available through the OECD. Those have been projected by WHO. NHA studieswere available for 54 non-OECD countries for one or more years. <strong>The</strong> detailed informationin these reports permitted a more reliable basis for estimation than in other years. <strong>The</strong> IMFGovernment finance statistics reports central government expenditure on health for 122 countries,regional government outlays for health for 23 countries, and local government outlayson health for 45 countries. <strong>The</strong> GFS entries are not continuous time series for all countries,
142 <strong>The</strong> <strong>World</strong> <strong>Health</strong> <strong>Report</strong> 2003but the document serves as an indicator that a reporting system exists in the 122 countries. Athorough search was conducted for the relevant national publications in those countries. Insome cases it was observed that expenditures reported under the government finance classificationof the GFS were limited to those of the ministry of health rather than all expenditureson health regardless of ministry. In such cases, other series were used to supplementthat source. Government finance data, together with external resources data, statistical yearbooks,public finance reports, and analyses reporting on the implementation of health policies,have led to GGHE estimates for most WHO Member States. Information on BruneiDarussalam, for example, was accessed from national sources, but also from an InternationalMedical Foundation of Japan data compendium (42). This source provided a means for doublechecking health budget data for seven countries.Several processes have been used to judge the validity of the data. For example, the aggregateexpenditure obtained has been compared against in-patient care expenditure, pharmaceuticalexpenditure data and other records (including programme administration and other costsentering the System of health accounts classifications) to cross-validate the information, inorder to ensure that: the outlays for which details have been assembled constitute the bulk ofthe government expenditure on health; intra-government transfers are consolidated; and theestimates obtained are judged plausible in terms of systems’ descriptions. <strong>The</strong> aggregate governmentalhealth expenditure data have also been compared with total GGE, providing anadditional source of verification. Sometimes the GGHE and, therefore, the figures for totalhealth expenditure, may be an underestimate if it is not possible to estimate for local government,nongovernmental organizations and insurance. For example THE for India may notinclude some agents that could result in an underestimate of between 0.3% and 0.6% of GDP.Information for Afghanistan and Iraq was received from the Regional Office for the EasternMediterranean, and for Cambodia from the country office.Private expenditure on health has been defined as the sum of expenditures by the followingentities:■■■■Prepaid plans and risk-pooling arrangements: the outlays of private and private social(with no government control over payment rates and participating providers but withbroad guidelines from government) insurance schemes, commercial and non-profit (mutual)insurance schemes, health maintenance organizations, and other agents managingprepaid medical and paramedical benefits (including the operating costs of these schemes).Firms’ expenditure on health: outlays by public and private enterprises for medical careand health-enhancing benefits other than payment to social security.Non-profit institutions serving mainly households: resources used to purchase health goodsand services by entities whose status does not permit them to be a source of income, profitor other financial gain for the units that establish, control or finance them. This includesfunding from internal and external sources.Household out-of-pocket spending: the direct outlays of households, including gratuitiesand in-kind payments made to health practitioners and suppliers of pharmaceuticals, therapeuticappliances, and other goods and services, whose primary intent is to contribute tothe restoration or to the enhancement of the health status of individuals or populationgroups. This includes household payments to public services, non-profit institutions ornongovernmental organizations and non-reimbursable cost sharing, deductibles, co-paymentsand fee-for-service. It excludes payments made by enterprises which deliver medicaland paramedical benefits, mandated by law or not, to their employees and paymentsfor overseas treatment.
Statistical Annex 143Most of the information on private health expenditures comes from national health accountsreports, statistical yearbooks and other periodicals, statistical data on official web sites, reportsof nongovernmental organizations, household expenditure surveys, academic studies,and relevant reports of and data provided by central statistical offices, ministries of health,professional and trade associations. For the 30 OECD member countries they are obtainedfrom OECD health data. Standard extrapolation and estimation techniques were used to obtainthe figures for missing years.Annex Table 6Annex Table 6 presents total expenditure on health and general government expenditure onhealth in per capita terms. <strong>The</strong> methodology and sources to derive THE and GGHE havebeen discussed in the notes to Annex Table 5. Ratios are represented in per capita terms bydividing the expenditure figures by population figures. <strong>The</strong>se per capita figures are expressedfirst in US dollars at an average exchange rate, which is the observed annual average numberof units at which a currency is traded in the banking system. It is then also presented ininternational dollar estimates, derived by dividing local currency units by an estimate of theirpurchasing power parity (PPP) compared to US dollars, i.e. a rate or measure that minimizesthe consequences of differences in price levels existing between countries.OECD health data 2003 is the major source for population estimates for the 30 OECD membercountries, just as it is for other health expenditure and macroeconomic variables. Allestimates of population size and structure, other than for OECD countries, are based ondemographic assessments prepared by the United Nations Population Division (3). Thisreport uses the estimates referred to as the de facto population, and not the de jure populationin each Member State. An exception was made for Serbia and Montenegro for 2001,as expenditure figures excluded the provinces of Kosovo and Metohia, which became territoriesunder the administration of the United Nations. Estimates for Serbia and Montenegro,excluding the populations of Kosovo and Metohia, were obtained from the Statistical yearbookof Yugoslavia 2002, thus ensuring that the basis for the numerator and denominator areconsistent.Three-quarters of the exchange rates (average for the year) have been obtained from the IMFInternational Financial Statistics, September 2003, row rf. Where information was lacking,available data from the United Nations, the <strong>World</strong> Bank and ad hoc donor reports (in thecase of Afghanistan, for example) were used. <strong>The</strong> euro:US dollar rate has been applied forAndorra, Monaco and San Marino. <strong>The</strong> New Zealand dollar:US dollar rate has been appliedfor Niue. <strong>The</strong> Australian dollar rate has been applied for Nauru and Palau. Ecuador dollarizedits economy in 2000, but the entire dataset has been recalculated in dollar terms for the fiveyearperiod reported.For OECD member countries, the OECD PPP has been used to calculate international dollars.For countries that are part of the UNECE but are not members of OECD, the UNECEPPPs were calculated on the same basis as the OECD PPP. <strong>The</strong> remaining calculations forinternational dollars have been estimated by WHO using methods similar to those used bythe <strong>World</strong> Bank.
144 <strong>The</strong> <strong>World</strong> <strong>Health</strong> <strong>Report</strong> 2003References1. Lopez AD et al. <strong>World</strong> mortality in 2000: life tables for 191 countries. Geneva, <strong>World</strong> <strong>Health</strong> Organization, 2002.2. International database. Washington, DC, United States Census Bureau (http://www.census.gov/ipc/www/idbnew.html, accessed 9 October 2003).3. <strong>World</strong> population prospects – the 2002 revision. New York, NY, United Nations Population Division, 2003.4. Murray CJL et al. Modified logit life table system: principles, empirical validation and application.Population Studies, 2003, 57:1–18.5. Salomon JA et al. Methods for life expectancy and healthy life expectancy uncertainty analysis. Geneva, <strong>World</strong><strong>Health</strong> Organization, 2002 (GPE Discussion Paper No. 10; http://www.who.int/evidence, accessed 9 October2003).6. Dye C et al. Global burden of tuberculosis: estimated incidence, prevalence and mortality by country. JAMA,2002, 282:677–686.7. Salomon JA, Murray CJL. Modelling HIV/AIDS epidemics in sub-Saharan Africa using seroprevalence datafrom antenatal clinics. Bulletin of the <strong>World</strong> <strong>Health</strong> Organization, 2001, 79:596–607.8. UNAIDS Reference Group on Estimates Modelling and Projections. Improved methods and assumptions forestimation and projection of HIV/AIDS epidemics. AIDS, 2002, 16:1–16.9. Boschi-Pinto C et al. Diarrhoea mortality in under-fives in the developing world. Geneva, <strong>World</strong> <strong>Health</strong>Organization (in press).10. Stein C et al. <strong>The</strong> global burden of measles in the year 2000 – a model using country-specific indicators.Journal of Infectious Diseases (in press).11. Crowcroft NS et al. How to best estimate the global burden of pertussis? Lancet Infectious Diseases, 2003,3:413–418.12. Williams BG et al. Estimates of world-wide distribution of child deaths from acute respiratory infections.Lancet, 2002, 2:25–32.13. Snow RW et al. Estimating mortality, morbidity and disability due to malaria among Africa’s non-pregnantpopulation. Bulletin of the <strong>World</strong> <strong>Health</strong> Organization, 1999, 77:624–640.14. WHO/UNICEF/UNFPA. Maternal mortality in 2000: estimates developed by WHO, UNICEF and UNFPA.Geneva, <strong>World</strong> <strong>Health</strong> Organization (in press).15. Mathers CD et al. Global and regional estimates of cancer mortality and incidence by site: I. Application ofregional cancer survival model to estimate cancer mortality distribution by site. BMC Cancer, 2002, 2:36.16. Mathers CD et al. <strong>The</strong> global burden of disease in 2002: data sources, methods and results. Geneva, <strong>World</strong><strong>Health</strong> Organization, 2003 (GPE Discussion Paper No. 54; http://www.who.int/evidence, accessed 10October 2003).17. Murray CJL, Lopez AD, eds. <strong>The</strong> global burden of disease: a comprehensive assessment of mortality anddisability from diseases, injuries and risk factors in 1990 and projected to 2020. Cambridge, MA, HarvardSchool of Public <strong>Health</strong> on behalf of the <strong>World</strong> <strong>Health</strong> Organization and the <strong>World</strong> Bank, 1996 (GlobalBurden of Disease and Injury Series, Vol. 1).18. Salomon JA, Murray CJL. <strong>The</strong> epidemiologic transition revisited: compositional models for causes of deathby age and sex. Population and Development Review, 2002, 28:205–228.19. Lozano R et al. Miscoding and misclassification of ischaemic heart disease mortality. Geneva, <strong>World</strong> <strong>Health</strong>Organization, 2001 (GPE Discussion Paper No. 12).20. Murray CJL, Salomon JA, Mathers CD. A critical examination of summary measures of population health.Bulletin of the <strong>World</strong> <strong>Health</strong> Organization, 2000, 78:981–994.21. Murray CJL et al. <strong>Health</strong> gaps: an overview and critical appraisal. In: Murray CJL et al, eds. Summarymeasures of population health: concepts, ethics, measurement and applications. Geneva, <strong>World</strong> <strong>Health</strong>Organization, 2002 (http://www.who.int/pub/smph/en/index.html, accessed 10 October 2003).22. Mathers CD et al. <strong>Health</strong>y life expectancy in 191 countries, 1999. Lancet, 2001, 357:1685–1691.23. Mathers CD et al. <strong>Health</strong>y life expectancy: comparison of OECD countries in 2001. Australian and NewZealand Journal of Public <strong>Health</strong>, 2003, 27:5–11.24. Sadana R et al. Comparative analysis of more than 50 household surveys of health status. In: Murray CJL etal., eds. Summary measures of population health: concepts, ethics, measurement and applications. Geneva,<strong>World</strong> <strong>Health</strong> Organization, 2002 (http://www.who.int/pub/smph/en/index.html, accessed 10 October 2003).25. King G et al. Enhancing the validity and cross-cultural comparability of survey research. American PoliticalScience Review, 2003 (in press).26. Ustün TB et al. WHO multi-country survey study on health and responsiveness, 2000–2001. In: Murray CJL,Evans D, eds. <strong>Health</strong> systems performance assessment: debate, new methods, new empiricism, and futuredirections. Geneva, <strong>World</strong> <strong>Health</strong> Organization, 2003 (http://www.who.int/health-systems-performance,accessed 10 October 2003).
Statistical Annex 14527. International classification of functioning, disability and health (ICF). Geneva, <strong>World</strong> <strong>Health</strong> Organization, 2001.28. Mathers CD, Murray CJL, Salomon JA. Methods for measuring healthy life expectancy. In: Murray CJL,Evans D, eds. <strong>Health</strong> systems performance assessment: debate, new methods, new empiricism, and futuredirections. Geneva, <strong>World</strong> <strong>Health</strong> Organization, 2003 (http://www.who.int/health-systems-performance,accessed 10 October 2003).29. Salomon JA et al. <strong>Health</strong> state valuations in summary measures of population health. In: Murray CJL, EvansD, eds. <strong>Health</strong> systems performance assessment: debate, new methods, new empiricism, and future directions.Geneva, <strong>World</strong> <strong>Health</strong> Organization, 2003 (http://www.who.int/health-systems-performance, accessed 10October 2003).30. Anand S et al. <strong>Report</strong> on the Scientific Peer Review Group on <strong>Health</strong> Systems Performance Assessment. In:Murray CJL, Evans D, eds. <strong>Health</strong> systems performance assessment: debate, new methods, new empiricism, andfuture directions. Geneva, <strong>World</strong> <strong>Health</strong> Organization, 2003 (http://www.who.int/health-systemsperformance,accessed 10 October 2003).31. WHO/<strong>World</strong> Bank/United States Agency for International Development. Guide to producing national healthaccounts with special applications for low-income and middle-income countries. Geneva, <strong>World</strong> <strong>Health</strong>Organization, 2003 (http://whqlibdoc.who.int/publications/2003/9241546077.pdf, accessed 13 October2003).32. A system of health accounts. Paris, Organisation for Economic Co-operation and Development, 2000 (http://www.oecd.org/dataoecd/41/4/1841456.pdf, accessed 13 October 2003).33. Organisation for Economic Co-operation and Development/International Monetary Fund/<strong>World</strong> Bank/United Nations/Eurostat. System of national accounts 1993. New York, NY, United Nations, 1994.34. Government finance statistics yearbook, 2002. Washington, DC, International Monetary Fund, 2002.35. International financial statistics yearbook, 2003. Washington, DC, International Monetary Fund, 2003.36. International Financial Statistics, 2003, September.37. Key indicators 2002. Manila, Asian Development Bank, 2002.38. OECD health data 2003. Paris, Organisation for Economic Co-operation and Development 2003.39. International development statistics. Organisation for Economic Co-operation and Development,Development Assistance Committee (http://www1.oecd.org/dac/htm/online.htm, accessed15 October 2003).40. National accounts statistics: main aggregates and detailed tables, 2000. New York, NY, United Nations, 2002.41. National accounts of OECD countries: detailed tables 1990/2001, 2003 edition, volume II. Paris, Organisationfor Economic Co-operation and Development, 2003.42. Southeast Asian Medical Information Center health statistics 2002. Tokyo, <strong>The</strong> International MedicalFoundation of Japan, 2003.
146 <strong>The</strong> <strong>World</strong> <strong>Health</strong> <strong>Report</strong> 2003Annex Table 1 Basic indicators for all Member StatesFigures computed by WHO to assure comparability; a they are not necessarily the official statistics of Member States, which may use alternative rigorous methods.POPULATION ESTIMATESLIFE EXPECTANCYMember State Total Annual Dependency Percentage Total AT BIRTH (YEARS)population growth ratio of population fertility Both(000) rate (%) (per 100) aged 60+ years rate sexes2002 1992–2002 1992 2002 1992 2002 1992 2002 20021 Afghanistan 22 930 3.8 88 86 4.7 4.7 7.0 6.8 42.62 Albania 3 141 -0.4 60 53 7.9 9.5 2.9 2.3 70.43 Algeria 31 266 1.8 82 60 5.7 6.1 4.2 2.8 69.44 Andorra 69 1.8 48 46 20.0 21.6 1.4 1.3 80.35 Angola 13 184 2.9 97 101 4.6 4.4 7.2 7.2 39.96 Antigua and Barbuda 73 1.2 63 56 9.2 10.5 1.8 1.6 71.47 Argentina 37 981 1.3 64 59 13.0 13.5 2.8 2.5 74.48 Armenia 3 072 -1.3 57 44 10.5 13.1 2.2 1.2 70.09 Australia 19 544 1.2 50 48 15.6 16.7 1.9 1.7 80.410 Austria 8 111 0.3 48 47 19.9 21.3 1.5 1.3 79.411 Azerbaijan 8 297 1.1 63 57 7.6 9.2 2.8 2.1 65.812 Bahamas 310 1.5 58 53 6.8 8.5 2.6 2.3 72.113 Bahrain 709 3.0 51 47 3.7 4.0 3.5 2.7 73.214 Bangladesh 143 809 2.3 81 71 4.8 5.1 4.4 3.5 62.615 Barbados 269 0.4 55 43 15.0 13.1 1.6 1.5 74.316 Belarus 9 940 -0.4 52 46 17.4 19.3 1.7 1.2 68.317 Belgium 10 296 0.3 50 53 20.9 22.2 1.6 1.7 78.418 Belize 251 2.5 91 73 6.0 5.9 4.4 3.2 69.719 Benin 6 558 2.8 105 93 4.6 4.1 6.5 5.7 51.220 Bhutan 2 190 2.3 88 86 6.1 6.5 5.8 5.1 61.321 Bolivia 8 645 2.2 81 77 6.1 6.6 4.8 3.9 63.222 Bosnia and Herzegovina 4 126 0.4 43 40 11.1 15.3 1.6 1.3 72.823 Botswana 1 770 2.1 89 74 3.7 4.4 4.5 3.7 40.424 Brazil 176 257 1.4 63 51 6.8 8.1 2.6 2.2 68.925 Brunei Darussalam 350 2.6 57 51 4.1 4.5 3.1 2.5 76.126 Bulgaria 7 965 -0.8 50 45 19.9 21.7 1.5 1.1 71.927 Burkina Faso 12 624 2.9 108 106 4.5 4.0 7.1 6.7 41.728 Burundi 6 602 1.3 97 99 4.6 4.4 6.8 6.8 40.829 Cambodia 13 810 2.8 98 81 4.4 4.6 5.5 4.8 54.630 Cameroon 15 729 2.4 94 86 5.5 5.6 5.7 4.7 48.131 Canada 31 271 1.0 47 45 15.8 17.1 1.7 1.5 79.832 Cape Verde 454 2.2 103 80 6.6 6.3 4.8 3.4 70.133 Central African Republic 3 819 2.1 89 89 6.1 6.1 5.6 5.0 42.934 Chad 8 348 3.1 96 99 5.2 4.9 6.7 6.7 47.735 Chile 15 613 1.4 57 54 9.2 10.7 2.5 2.4 76.736 China 1 302 307 0.9 49 44 8.6 10.0 2.0 1.8 71.137 Colombia 43 526 1.8 66 59 6.4 7.1 3.0 2.6 71.838 Comoros 747 3.0 95 82 4.0 4.2 5.9 4.9 63.339 Congo 3 633 3.2 96 99 4.8 4.6 6.3 6.3 53.140 Cook Islands 18 -0.2 71 65 6.2 7.2 4.0 3.2 71.641 Costa Rica 4 094 2.4 68 56 7.1 7.9 3.0 2.3 77.142 Côte d'Ivoire 16 365 2.1 94 82 4.4 5.2 6.1 4.8 45.343 Croatia 4 439 -0.6 46 49 18.3 21.7 1.6 1.6 74.844 Cuba 11 271 0.4 45 44 11.9 14.5 1.6 1.6 77.145 Cyprus 796 1.2 58 51 14.8 16.1 2.3 1.9 77.346 Czech Republic 10 246 -0.1 50 42 17.8 18.8 1.7 1.2 75.847 Democratic People'sRepublic of Korea 22 541 0.9 47 48 8.0 10.6 2.3 2.0 65.848 Democratic Republicof the Congo 51 201 2.4 100 98 4.4 4.2 6.7 6.7 43.549 Denmark 5 351 0.3 48 50 20.2 20.4 1.7 1.8 77.250 Djibouti 693 2.3 85 86 4.6 5.1 6.3 5.7 49.651 Dominica 78 0.7 63 56 9.2 10.5 2.0 1.8 73.352 Dominican Republic 8 616 1.7 70 59 5.6 6.9 3.2 2.7 68.053 Ecuador 12 810 1.8 73 62 6.3 7.3 3.6 2.8 70.654 Egypt 70 507 1.9 80 66 6.3 6.9 4.1 3.3 67.1
Statistical Annex 147LIFE EXPECTANCY AT BIRTH (YEARS) PROBABILITY OF DYING (PER 1000)Under age 5 yearsBetween ages 15 and 60 yearsMales Females Males Females Males Females2002 Uncertainty 2002 Uncertainty 2002 Uncertainty 2002 Uncertainty 2002 Uncertainty 2002 Uncertainty1 41.9 32.0 - 49.5 43.4 31.3 - 53.2 258 208 - 310 256 205 - 306 494 335 - 731 413 192 - 7052 67.3 65.9 - 68.7 74.1 73.0 - 75.0 27 13 - 41 23 11 - 34 167 137 - 199 94 79 - 1113 67.5 66.2 - 69.1 71.2 69.8 - 72.5 54 43 - 64 43 35 - 52 170 152 - 187 128 112 - 1464 76.8 76.0 - 77.8 83.7 83.0 - 84.3 5 5 - 6 4 4 - 5 113 101 - 125 43 39 - 485 37.9 29.5 - 44.1 42.0 32.8 - 50.6 279 248 - 312 247 219 - 275 594 425 - 824 481 255 - 7266 69.0 67.5 - 70.5 73.9 72.3 - 75.4 22 11 - 33 18 9 - 28 195 173 - 216 125 111 - 1417 70.8 70.4 - 71.2 78.1 77.9 - 78.3 20 18 - 21 16 15 - 17 177 170 - 184 90 88 - 938 67.0 66.2 - 67.9 73.0 72.1 - 73.8 39 22 - 56 35 19 - 46 204 184 - 225 98 85 - 1159 77.9 77.6 - 78.1 83.0 82.7 - 83.2 6 6 - 7 5 5 - 6 91 89 - 94 52 50 - 5410 76.4 76.1 - 76.7 82.2 81.8 - 82.4 6 5 - 7 4 4 - 5 117 113 - 121 59 56 - 6311 63.0 61.7 - 64.2 68.6 67.5 - 69.8 80 64 - 98 70 56 - 83 231 199 - 261 122 103 - 14412 69.0 67.9 - 70.0 75.2 74.3 - 76.2 13 10 - 17 11 8 - 15 248 225 - 275 153 142 - 16313 72.1 70.7 - 73.6 74.5 73.2 - 75.8 13 8 - 22 10 6 - 15 113 96 - 130 82 68 - 9814 62.6 61.3 - 63.9 62.6 61.4 - 63.7 71 68 - 75 73 70 - 77 251 223 - 282 258 232 - 28415 70.5 69.6 - 71.4 77.9 76.8 - 79.0 17 13 - 22 15 9 - 23 189 171 - 206 103 91 - 11516 62.6 62.0 - 63.2 74.3 73.7 - 74.9 14 11 - 16 10 8 - 13 371 347 - 397 134 120 - 14817 75.2 74.9 - 75.5 81.5 81.3 - 81.8 6 5 - 7 5 4 - 6 126 122 - 130 67 64 - 6918 67.4 66.0 - 68.7 72.4 71.4 - 73.4 44 33 - 56 34 25 - 42 189 172 - 211 123 117 - 12919 50.1 42.9 - 56.5 52.4 43.0 - 60.1 166 163 - 170 158 155 - 161 424 253 - 634 360 176 - 61120 60.2 52.3 - 67.6 62.4 53.5 - 69.0 93 74 - 111 92 73 - 111 272 111 - 474 226 102 - 42821 61.8 54.6 - 69.3 64.7 56.2 - 70.9 78 74 - 82 73 70 - 77 260 101 - 445 209 91 - 40222 69.3 67.9 - 71.0 76.4 75.2 - 77.6 20 15 - 25 15 11 - 19 192 162 - 220 90 76 - 10523 40.2 37.3 - 43.3 40.6 37.7 - 44.1 104 89 - 121 102 86 - 118 786 718 - 842 745 676 - 80124 65.7 65.2 - 66.2 72.3 71.8 - 72.7 42 36 - 49 34 29 - 40 246 235 - 257 136 128 - 14525 74.8 73.5 - 76.3 77.4 76.6 - 78.2 14 12 - 16 12 11 - 14 112 94 - 128 85 73 - 9826 68.7 68.1 - 69.3 75.3 74.7 - 75.9 18 16 - 21 16 13 - 18 219 205 - 234 97 88 - 10627 40.6 34.3 - 46.6 42.6 34.7 - 49.8 232 211 - 251 217 197 - 235 597 417 - 793 522 334 - 73628 38.7 33.0 - 44.5 43.0 36.0 - 50.2 189 152 - 224 177 142 - 216 692 541 - 834 563 393 - 75029 51.9 44.8 - 57.4 57.1 49.1 - 63.4 149 138 - 159 124 115 - 132 400 261 - 604 298 165 - 48730 47.2 41.1 - 53.9 49.0 41.4 - 56.7 162 151 - 174 158 147 - 169 519 344 - 697 454 273 - 65831 77.2 77.0 - 77.4 82.3 82.1 - 82.4 6 6 - 6 5 5 - 5 95 93 - 97 58 57 - 6032 66.6 62.4 - 71.0 72.9 69.6 - 75.8 42 33 - 50 30 24 - 36 210 125 - 312 120 76 - 17833 42.1 36.2 - 48.4 43.7 36.7 - 50.2 187 156 - 219 173 142 - 201 620 474 - 780 566 418 - 74034 46.1 38.3 - 53.1 49.3 40.9 - 57.6 202 168 - 235 180 149 - 210 477 305 - 684 402 203 - 61835 73.4 72.7 - 74.0 80.0 79.7 - 80.3 16 14 - 18 13 12 - 14 134 124 - 144 67 64 - 7036 69.6 69.0 - 70.3 72.7 72.0 - 73.5 31 29 - 33 41 38 - 44 165 154 - 175 104 93 - 11237 67.5 66.8 - 68.2 76.3 75.4 - 77.1 27 24 - 29 19 17 - 21 236 220 - 251 99 87 - 11338 61.6 53.7 - 68.9 64.9 56.4 - 71.3 80 64 - 96 72 57 - 86 260 100 - 464 207 91 - 40539 51.6 44.6 - 58.9 54.5 46.7 - 61.6 109 82 - 135 101 75 - 125 474 309 - 651 410 263 - 61140 69.2 68.2 - 70.3 74.2 73.4 - 75.0 21 10 - 31 19 10 - 27 173 150 - 193 109 98 - 12341 74.8 74.5 - 75.0 79.5 79.3 - 79.8 12 11 - 13 10 9 - 11 127 122 - 131 74 70 - 7842 43.1 36.4 - 50.1 48.0 40.8 - 54.7 192 154 - 232 143 114 - 169 577 400 - 757 502 353 - 69443 71.0 70.6 - 71.4 78.6 78.1 - 79.0 8 7 - 10 7 7 - 8 178 169 - 187 72 67 - 7744 75.0 74.6 - 75.4 79.3 79.1 - 79.5 8 7 - 10 7 6 - 7 138 132 - 145 89 86 - 9145 75.5 74.8 - 76.2 79.1 77.2 - 80.9 7 6 - 9 7 6 - 9 102 93 - 111 48 38 - 6346 72.4 72.1 - 72.8 79.0 78.7 - 79.3 5 4 - 6 4 4 - 5 163 157 - 170 72 69 - 7647 64.4 56.5 - 72.3 67.1 57.9 - 75.2 56 29 - 83 54 30 - 80 236 83 - 416 191 70 - 38648 41.0 34.7 - 47.1 46.1 38.0 - 52.8 221 190 - 252 198 169 - 225 585 432 - 749 449 298 - 65549 74.8 74.6 - 75.0 79.5 79.4 - 79.7 6 5 - 7 5 4 - 6 123 120 - 127 76 73 - 7850 48.6 42.4 - 56.1 50.7 43.0 - 58.2 156 132 - 179 144 121 - 166 481 290 - 657 431 259 - 63951 71.0 69.7 - 72.2 75.8 74.2 - 77.2 13 11 - 15 14 10 - 18 206 182 - 235 120 94 - 15552 64.9 63.9 - 65.9 71.5 70.5 - 72.4 37 32 - 41 30 26 - 35 256 231 - 279 150 132 - 17153 67.9 67.3 - 68.5 73.5 72.9 - 74.2 34 28 - 39 30 25 - 34 216 204 - 229 132 120 - 14354 65.3 65.0 - 65.6 69.0 68.7 - 69.3 38 34 - 42 39 35 - 43 240 231 - 248 157 151 - 164
148 <strong>The</strong> <strong>World</strong> <strong>Health</strong> <strong>Report</strong> 2003Annex Table 1 Basic indicators for all Member StatesFigures computed by WHO to assure comparability; a they are not necessarily the official statistics of Member States, which may use alternative rigorous methods.POPULATION ESTIMATESLIFE EXPECTANCYMember State Total Annual Dependency Percentage Total AT BIRTH (YEARS)population growth ratio of population fertility Both(000) rate (%) (per 100) aged 60+ years rate sexes2002 1992–2002 1992 2002 1992 2002 1992 2002 200255 El Salvador 6 415 1.9 78 68 6.6 7.5 3.6 2.9 69.756 Equatorial Guinea 481 2.6 87 91 6.4 5.9 5.9 5.9 53.457 Eritrea 3 991 2.4 93 91 3.6 3.6 6.2 5.5 57.658 Estonia 1 338 -1.4 51 48 17.8 21.5 1.7 1.2 71.159 Ethiopia 68 961 2.8 94 94 4.4 4.6 6.8 6.2 48.060 Fiji 831 1.2 67 57 5.0 6.0 3.4 2.9 67.361 Finland 5 197 0.3 49 49 18.7 20.3 1.8 1.7 78.262 France 59 850 0.4 52 53 19.5 20.5 1.7 1.9 79.763 Gabon 1 306 2.6 92 83 7.4 6.2 5.2 4.0 59.264 Gambia 1 388 3.3 84 80 5.1 5.8 5.7 4.8 57.165 Georgia 5 177 -0.5 52 49 15.6 18.9 1.9 1.4 71.766 Germany 82 414 0.2 46 48 20.5 24.0 1.3 1.3 78.767 Ghana 20 471 2.4 92 77 4.6 5.2 5.4 4.2 57.668 Greece 10 970 0.7 48 49 20.7 23.8 1.4 1.3 78.469 Grenada 80 -0.5 63 56 9.2 10.5 4.0 3.5 67.470 Guatemala 12 036 2.7 96 87 5.2 5.3 5.4 4.5 65.971 Guinea 8 359 2.4 93 88 4.4 4.5 6.4 5.9 52.372 Guinea-Bissau 1 449 3.0 95 101 5.4 4.9 7.1 7.1 47.273 Guyana 764 0.4 67 54 6.8 7.0 2.6 2.3 64.374 Haiti 8 218 1.4 91 76 5.7 5.9 4.9 4.0 50.175 Honduras 6 781 2.8 91 80 4.6 5.4 5.0 3.8 67.276 Hungary 9 923 -0.4 49 45 19.2 20.0 1.7 1.2 72.677 Iceland 287 1.0 55 53 14.8 15.3 2.2 2.0 80.178 India 1 049 549 1.8 68 62 6.9 7.7 3.8 3.1 61.079 Indonesia 217 131 1.4 64 54 6.4 7.9 3.1 2.4 66.480 Iran, Islamic Republic of 68 070 1.4 93 59 5.9 6.4 4.5 2.4 68.981 Iraq 24 510 2.9 88 79 4.4 4.6 5.7 4.8 61.082 Ireland 3 911 1.0 60 47 15.3 15.3 2.0 1.9 77.183 Israel 6 304 2.7 66 61 12.6 13.1 2.9 2.7 79.484 Italy 57 482 0.1 45 49 21.7 24.5 1.3 1.2 79.785 Jamaica 2 627 0.9 73 61 9.9 9.6 2.8 2.4 72.886 Japan 127 478 0.2 43 48 18.6 24.4 1.5 1.3 81.987 Jordan 5 329 3.9 91 69 4.4 4.8 5.0 3.6 70.888 Kazakhstan 15 469 -0.9 59 51 9.4 11.5 2.5 2.0 63.689 Kenya 31 540 2.3 104 82 4.1 4.2 5.5 4.1 50.990 Kiribati 87 1.5 70 68 6.2 7.0 4.7 4.1 64.191 Kuwait 2 443 2.1 56 38 2.1 2.7 3.3 2.7 76.292 Kyrgyzstan 5 067 1.3 75 64 8.4 8.7 3.5 2.7 64.593 Lao People'sDemocratic Republic 5 529 2.4 91 84 5.9 5.5 5.9 4.8 55.194 Latvia 2 329 -1.3 51 48 18.4 21.8 1.7 1.1 70.395 Lebanon 3 596 2.3 65 56 8.3 8.6 2.9 2.2 69.896 Lesotho 1 800 1.1 94 81 6.7 6.9 4.8 3.9 35.797 Liberia 3 239 4.6 97 96 3.9 3.7 6.9 6.8 41.898 Libyan Arab Jamahiriya 5 445 2.0 81 54 4.5 6.0 4.3 3.1 72.699 Lithuania 3 465 -0.6 51 51 16.9 19.7 1.8 1.3 71.9100 Luxembourg 447 1.5 44 49 18.1 18.3 1.6 1.7 78.8101 Madagascar 16 916 2.9 92 91 4.8 4.7 6.2 5.7 56.3102 Malawi 11 871 1.9 94 99 4.8 5.2 6.8 6.1 40.2103 Malaysia 23 965 2.4 67 60 5.8 6.7 3.7 2.9 72.0104 Maldives 309 3.0 99 86 5.4 5.2 6.2 5.4 66.1105 Mali 12 623 2.8 103 107 3.9 3.8 7.0 7.0 44.8106 Malta 393 0.7 51 47 15.1 17.5 2.0 1.8 78.1107 Marshall Islands 52 1.3 70 68 6.2 7.0 6.3 5.5 62.7108 Mauritania 2 807 2.8 89 87 5.3 5.3 6.1 5.8 52.1109 Mauritius 1 210 1.1 52 46 8.4 9.0 2.3 2.0 71.9
Statistical Annex 149LIFE EXPECTANCY AT BIRTH (YEARS) PROBABILITY OF DYING (PER 1000)Under age 5 yearsBetween ages 15 and 60 yearsMales Females Males Females Males Females2002 Uncertainty 2002 Uncertainty 2002 Uncertainty 2002 Uncertainty 2002 Uncertainty 2002 Uncertainty55 66.5 65.4 - 67.8 72.8 72.1 - 73.5 36 31 - 42 34 28 - 39 257 227 - 289 142 129 - 15556 51.9 44.4 - 58.8 54.8 46.0 - 61.7 157 132 - 181 144 125 - 166 383 217 - 596 318 152 - 54857 55.8 47.2 - 65.8 59.3 51.0 - 66.8 117 107 - 127 102 93 - 111 350 176 - 496 286 137 - 48458 65.1 64.8 - 65.5 77.1 76.8 - 77.4 10 7 - 12 6 4 - 7 322 313 - 331 112 105 - 11859 46.8 39.3 - 54.0 49.4 41.3 - 57.2 185 148 - 220 168 138 - 196 487 316 - 693 422 244 - 62860 64.6 63.7 - 65.7 70.3 69.3 - 71.4 30 27 - 33 27 24 - 29 281 260 - 301 176 159 - 19361 74.8 74.5 - 75.0 81.5 81.2 - 81.8 4 4 - 5 3 3 - 3 135 131 - 140 60 56 - 6462 75.9 75.5 - 76.2 83.5 83.2 - 83.7 5 5 - 6 4 4 - 5 133 128 - 138 60 58 - 6263 57.3 49.9 - 64.6 61.4 52.9 - 68.9 100 91 - 108 79 72 - 86 342 171 - 557 281 133 - 49964 55.4 47.5 - 62.3 58.9 50.2 - 66.7 132 112 - 152 117 99 - 135 330 159 - 552 265 110 - 46765 68.4 67.2 - 69.6 75.0 73.1 - 76.7 26 23 - 28 20 18 - 22 207 181 - 237 86 67 - 10966 75.6 75.2 - 75.9 81.6 81.4 - 81.7 5 5 - 6 4 4 - 4 118 114 - 123 60 59 - 6267 56.3 49.0 - 64.4 58.8 50.1 - 66.0 106 92 - 123 99 87 - 112 354 171 - 557 303 153 - 52968 75.8 75.6 - 76.0 81.1 80.7 - 81.5 7 6 - 7 5 4 - 6 118 115 - 120 48 45 - 5169 65.9 64.8 - 67.1 68.8 67.8 - 70.0 25 18 - 30 21 15 - 27 261 238 - 283 222 204 - 23970 63.1 61.9 - 64.3 69.0 67.7 - 70.1 57 52 - 63 50 45 - 55 283 247 - 324 162 131 - 19971 50.9 44.0 - 57.5 53.7 45.0 - 61.0 163 148 - 179 153 138 - 168 401 232 - 596 332 159 - 55972 45.7 37.9 - 51.6 48.7 39.8 - 56.8 215 194 - 237 198 179 - 217 462 311 - 681 383 186 - 61573 61.5 58.9 - 64.5 66.9 63.8 - 70.0 61 30 - 90 50 26 - 76 299 268 - 328 202 170 - 23374 49.1 42.8 - 55.5 51.1 43.6 - 57.3 138 119 - 157 128 111 - 145 493 345 - 660 438 309 - 61575 64.2 60.3 - 67.8 70.4 67.2 - 73.2 44 42 - 46 42 40 - 44 269 195 - 362 150 102 - 21476 68.4 67.9 - 68.9 76.8 76.3 - 77.2 10 9 - 11 8 7 - 9 256 241 - 272 112 104 - 11977 78.4 77.8 - 79.0 81.8 81.4 - 82.2 4 4 - 5 3 3 - 3 85 79 - 92 55 51 - 6078 60.1 59.4 - 60.8 62.0 61.1 - 62.8 87 81 - 92 95 86 - 106 291 268 - 314 220 197 - 24379 64.9 64.1 - 65.8 67.9 67.1 - 68.8 45 40 - 50 36 33 - 40 244 226 - 261 208 194 - 22480 66.5 65.4 - 67.8 71.7 70.5 - 72.8 42 33 - 50 36 29 - 43 213 194 - 230 132 121 - 14581 59.1 57.1 - 60.9 63.1 61.3 - 64.9 119 101 - 139 110 94 - 127 252 228 - 278 176 155 - 19782 74.4 73.8 - 75.0 79.8 79.3 - 80.1 8 7 - 9 6 5 - 7 113 105 - 121 66 62 - 7183 77.3 77.1 - 77.5 81.4 81.2 - 81.5 7 6 - 8 6 6 - 7 98 95 - 101 53 50 - 5684 76.8 76.4 - 77.1 82.5 82.2 - 82.8 5 5 - 6 5 4 - 5 96 92 - 100 49 46 - 5185 71.1 69.9 - 72.5 74.6 73.6 - 75.6 16 13 - 19 14 11 - 17 162 137 - 184 121 107 - 13486 78.4 78.4 - 78.4 85.3 85.2 - 85.3 4 4 - 4 4 4 - 4 95 95 - 96 46 45 - 4687 68.6 67.7 - 69.8 73.3 72.6 - 74.0 28 23 - 32 26 22 - 30 191 171 - 210 121 113 - 13088 58.7 58.0 - 59.4 68.9 68.1 - 69.7 38 29 - 48 28 21 - 36 426 385 - 462 195 177 - 21389 49.8 43.8 - 57.4 51.9 44.8 - 59.3 119 108 - 129 113 104 - 122 509 328 - 684 448 285 - 64290 61.8 60.8 - 62.8 66.7 65.6 - 67.6 80 74 - 88 69 60 - 79 293 260 - 327 190 167 - 21591 75.8 74.7 - 77.1 76.9 74.8 - 79.0 14 10 - 19 11 8 - 15 81 72 - 91 63 48 - 8092 60.4 59.5 - 61.4 68.9 68.1 - 69.8 63 50 - 76 55 44 - 66 345 314 - 371 163 146 - 18093 54.1 51.4 - 56.7 56.2 53.5 - 58.8 146 120 - 174 131 106 - 158 338 303 - 373 306 278 - 33394 64.6 64.3 - 64.9 75.8 75.6 - 76.1 15 12 - 17 12 10 - 14 327 320 - 334 118 113 - 12295 67.6 66.4 - 68.8 72.0 71.1 - 73.1 35 31 - 39 29 26 - 32 201 177 - 225 139 123 - 15496 32.9 29.3 - 38.5 38.2 33.0 - 44.9 166 133 - 201 160 128 - 191 902 791 - 965 742 599 - 85397 40.1 32.2 - 47.0 43.7 34.8 - 51.7 242 197 - 293 222 178 - 262 582 435 - 773 471 283 - 69098 70.4 66.3 - 73.8 75.5 73.0 - 77.8 19 16 - 21 17 15 - 20 173 110 - 263 99 65 - 14299 66.2 65.2 - 67.0 77.6 77.0 - 78.2 11 9 - 13 9 7 - 11 303 272 - 341 103 94 - 112100 75.7 75.3 - 76.2 81.7 81.1 - 82.3 5 4 - 7 5 4 - 6 119 113 - 125 64 58 - 70101 54.4 46.8 - 61.0 58.4 49.5 - 65.0 145 126 - 164 125 110 - 141 333 177 - 543 262 123 - 474102 39.8 35.0 - 45.2 40.6 35.0 - 47.1 197 183 - 210 190 178 - 203 657 509 - 803 610 449 - 769103 69.6 69.1 - 70.1 74.7 74.4 - 75.1 10 8 - 11 8 7 - 10 192 181 - 202 106 100 - 111104 66.5 65.7 - 67.4 65.6 64.9 - 66.5 38 33 - 42 43 38 - 49 205 179 - 231 202 174 - 229105 43.9 35.8 - 49.7 45.7 36.8 - 54.0 233 211 - 256 224 200 - 244 487 328 - 718 417 210 - 662106 75.9 75.2 - 76.5 80.3 79.3 - 81.2 7 6 - 9 6 4 - 8 87 82 - 94 51 44 - 59107 61.1 59.5 - 62.9 64.6 63.2 - 66.2 46 34 - 57 36 27 - 45 340 310 - 368 286 264 - 307108 49.8 41.7 - 56.1 54.5 44.7 - 61.3 186 158 - 214 155 132 - 178 393 245 - 603 304 156 - 536109 68.4 67.6 - 69.2 75.5 75.0 - 76.0 20 16 - 25 14 11 - 19 222 202 - 243 116 109 - 123
150 <strong>The</strong> <strong>World</strong> <strong>Health</strong> <strong>Report</strong> 2003Annex Table 1 Basic indicators for all Member StatesFigures computed by WHO to assure comparability; a they are not necessarily the official statistics of Member States, which may use alternative rigorous methods.POPULATION ESTIMATESLIFE EXPECTANCYMember State Total Annual Dependency Percentage Total AT BIRTH (YEARS)population growth ratio of population fertility Both(000) rate (%) (per 100) aged 60+ years rate sexes2002 1992–2002 1992 2002 1992 2002 1992 2002 2002110 Mexico 101 965 1.7 71 61 6.0 7.2 3.2 2.5 74.4111 Micronesia,Federated States of 108 0.7 92 74 5.5 5.1 4.8 3.8 66.5112 Monaco 34 1.1 52 53 19.5 20.5 1.7 1.8 81.2113 Mongolia 2 559 1.1 81 59 5.9 5.6 3.5 2.4 62.9114 Morocco 30 072 1.7 73 57 6.0 6.6 3.6 2.8 70.8115 Mozambique 18 537 2.6 96 89 5.2 5.1 6.2 5.7 42.6116 Myanmar 48 852 1.5 69 59 6.8 6.9 3.8 2.9 58.9117 Namibia 1 961 2.7 87 88 5.4 5.6 5.6 4.6 49.3118 Nauru 13 2.5 70 68 6.2 7.0 4.5 3.9 62.7119 Nepal 24 609 2.3 81 78 5.6 5.8 5.0 4.3 60.1120 Netherlands 16 067 0.6 45 48 17.5 18.5 1.6 1.7 78.6121 New Zealand 3 846 1.1 53 53 15.3 15.9 2.1 2.0 78.9122 Nicaragua 5 335 2.8 95 82 4.4 4.7 4.8 3.8 70.1123 Niger 11 544 3.5 108 108 3.6 3.3 8.0 8.0 42.6124 Nigeria 120 911 2.8 96 91 4.7 4.8 6.4 5.5 48.8125 Niue 2 -1.2 71 65 6.2 7.2 3.6 2.9 70.3126 Norway 4 514 0.5 55 54 20.6 19.6 1.9 1.8 79.1127 Oman 2 768 3.3 82 65 3.0 3.5 6.5 5.0 73.1128 Pakistan 149 911 2.5 86 82 5.5 5.7 5.9 5.1 61.4129 Palau 20 2.3 70 68 6.2 7.0 2.8 2.4 68.5130 Panama 3 064 2.0 65 59 7.3 8.3 2.9 2.7 75.4131 Papua New Guinea 5 586 2.6 79 77 4.2 4.0 5.1 4.1 59.8132 Paraguay 5 740 2.5 84 74 5.3 5.5 4.6 3.9 71.7133 Peru 26 767 1.7 71 63 6.2 7.4 3.7 2.9 69.7134 Philippines 78 580 2.1 77 67 5.0 5.7 4.2 3.2 68.3135 Poland 38 622 0.1 54 44 15.2 16.6 1.9 1.3 74.7136 Portugal 10 049 0.2 49 48 19.5 21.1 1.5 1.5 77.1137 Qatar 601 2.0 39 39 2.1 3.1 4.2 3.3 74.3138 Republic of Korea 47 430 0.8 43 39 8.2 11.8 1.7 1.4 75.5139 Republic of Moldova 4 270 -0.2 57 45 12.9 13.8 2.2 1.4 67.8140 Romania 22 387 -0.3 50 45 16.3 18.9 1.6 1.3 71.4141 Russian Federation 144 082 -0.3 50 42 16.3 18.3 1.6 1.2 64.8142 Rwanda 8 272 3.2 98 91 3.8 4.0 6.7 5.8 44.4143 Saint Kitts and Nevis 42 0.0 63 56 9.2 10.5 2.7 2.4 70.4144 Saint Lucia 148 0.9 75 57 8.6 7.8 3.2 2.3 72.2145 Saint Vincent andthe Grenadines 119 0.6 79 61 8.7 9.2 2.9 2.2 69.8146 Samoa 176 0.8 81 81 6.3 6.5 4.7 4.2 68.2147 San Marino 27 1.4 45 49 21.7 24.5 1.3 1.2 80.6148 Sao Tome and Principe 157 2.6 104 83 6.6 6.4 5.0 4.0 62.7149 Saudi Arabia 23 520 3.0 80 72 3.4 4.3 5.8 4.6 70.8150 Senegal 9 855 2.4 95 85 4.1 4.0 6.1 5.0 55.8151 Serbia and Montenegro 10 535 0.2 50 49 16.0 18.4 2.0 1.7 72.3152 Seychelles 80 1.0 52 46 8.4 9.0 2.1 1.8 71.5153 Sierra Leone 4 764 1.5 87 89 5.0 4.7 6.5 6.5 34.0154 Singapore 4 183 2.8 38 40 8.7 11.1 1.8 1.4 79.6155 Slovakia 5 398 0.2 54 43 15.0 15.5 1.9 1.3 74.0156 Slovenia 1 986 0.2 44 42 17.4 19.8 1.4 1.2 76.7157 Solomon Islands 463 3.2 93 84 4.4 4.4 5.6 4.5 65.4158 Somalia 9 480 2.8 102 101 4.2 3.8 7.3 7.3 44.3159 South Africa 44 759 1.5 70 59 5.2 6.1 3.4 2.6 50.7160 Spain 40 977 0.4 48 46 20.0 21.6 1.3 1.2 79.6161 Sri Lanka 18 910 0.9 58 47 8.8 10.2 2.4 2.0 70.3162 Sudan 32 878 2.3 81 76 5.1 5.6 5.3 4.4 57.1163 Suriname 432 0.7 66 58 7.1 8.0 2.5 2.5 67.6
Statistical Annex 151LIFE EXPECTANCY AT BIRTH (YEARS) PROBABILITY OF DYING (PER 1000)Under age 5 yearsBetween ages 15 and 60 yearsMales Females Males Females Males Females2002 Uncertainty 2002 Uncertainty 2002 Uncertainty 2002 Uncertainty 2002 Uncertainty 2002 Uncertainty110 71.7 71.0 - 72.3 77.0 76.5 - 77.4 30 26 - 34 24 21 - 27 170 160 - 183 97 92 - 103111 64.9 63.0 - 67.1 68.1 66.1 - 70.2 63 44 - 81 51 35 - 67 211 184 - 236 176 151 - 202112 77.8 77.6 - 77.9 84.5 84.0 - 85.0 5 4 - 5 3 3 - 4 109 108 - 111 47 44 - 50113 60.1 59.8 - 60.5 65.9 65.5 - 66.3 75 73 - 78 66 64 - 68 319 310 - 327 219 210 - 227114 68.8 67.4 - 70.3 72.8 71.6 - 74.1 43 36 - 49 41 35 - 47 160 138 - 185 104 88 - 120115 41.2 35.3 - 47.5 43.9 36.8 - 51.3 212 185 - 240 201 176 - 226 613 479 - 741 519 375 - 665116 56.2 48.4 - 64.0 61.8 52.6 - 69.6 118 88 - 151 94 66 - 122 335 175 - 539 236 107 - 444117 48.1 43.3 - 54.3 50.5 44.0 - 56.8 97 86 - 107 93 83 - 103 605 479 - 733 529 404 - 691118 59.7 55.6 - 64.0 66.5 63.1 - 70.3 18 14 - 21 12 10 - 15 448 326 - 564 303 211 - 389119 59.9 58.9 - 61.0 60.2 59.2 - 61.1 81 77 - 85 87 83 - 91 301 277 - 325 290 271 - 310120 76.0 75.7 - 76.3 81.1 80.8 - 81.3 6 6 - 7 5 5 - 6 94 91 - 97 65 63 - 68121 76.6 76.2 - 77.1 81.2 80.8 - 81.6 7 6 - 8 6 4 - 7 98 94 - 104 63 59 - 67122 67.9 67.2 - 68.6 72.4 71.6 - 73.2 38 31 - 45 32 27 - 38 213 199 - 226 143 126 - 163123 42.6 31.9 - 50.6 42.7 30.9 - 51.6 249 199 - 299 256 206 - 307 497 327 - 755 443 232 - 744124 48.0 41.2 - 54.6 49.6 40.7 - 57.1 183 162 - 205 181 159 - 202 453 287 - 632 392 217 - 612125 67.6 63.9 - 70.8 73.3 70.4 - 76.1 38 14 - 91 24 12 - 48 191 124 - 261 132 89 - 182126 76.4 75.8 - 76.9 81.7 81.4 - 81.9 5 4 - 6 4 4 - 4 100 93 - 106 60 57 - 63127 71.0 67.1 - 74.5 76.3 73.8 - 78.7 15 13 - 18 14 12 - 16 165 105 - 249 93 60 - 136128 61.1 59.3 - 62.9 61.6 59.7 - 63.7 105 89 - 120 115 98 - 134 227 201 - 254 201 176 - 225129 66.4 65.9 - 66.9 70.9 70.0 - 71.9 24 17 - 30 22 16 - 27 236 224 - 246 202 184 - 223130 72.8 72.0 - 73.8 78.2 77.4 - 78.9 25 23 - 28 21 19 - 23 146 132 - 159 84 76 - 94131 58.4 56.5 - 60.4 61.5 59.7 - 63.4 98 78 - 117 92 73 - 108 311 284 - 337 249 227 - 272132 68.7 67.9 - 69.7 74.7 74.0 - 75.4 37 31 - 42 26 22 - 31 171 155 - 189 120 109 - 132133 67.5 66.4 - 68.5 72.0 71.1 - 72.9 38 33 - 44 34 29 - 39 205 182 - 229 144 127 - 163134 65.1 64.3 - 65.8 71.7 70.9 - 72.5 39 33 - 45 33 28 - 38 258 238 - 279 133 118 - 151135 70.6 70.2 - 71.0 78.7 78.4 - 79.0 9 8 - 10 8 7 - 9 204 194 - 215 82 78 - 86136 73.6 73.1 - 74.0 80.5 80.3 - 80.8 7 6 - 7 5 5 - 6 154 147 - 163 65 62 - 68137 74.8 73.9 - 75.8 73.8 71.8 - 75.5 14 11 - 18 12 10 - 14 93 84 - 101 77 61 - 98138 71.8 71.3 - 72.3 79.4 79.2 - 79.6 8 7 - 9 7 7 - 8 166 156 - 176 61 59 - 63139 64.0 63.3 - 64.8 71.6 71.1 - 72.2 31 23 - 39 23 17 - 29 294 274 - 316 144 132 - 156140 68.0 67.2 - 68.9 75.0 74.2 - 75.7 22 21 - 24 19 17 - 20 235 212 - 259 108 96 - 121141 58.4 58.2 - 61.5 72.1 71.4 - 72.6 21 20 - 22 16 15 - 17 464 413 - 510 168 150 - 187142 41.9 36.5 - 48.1 46.8 39.7 - 53.9 186 170 - 203 170 157 - 184 605 431 - 774 474 283 - 695143 68.7 67.8 - 69.5 72.2 71.0 - 73.3 20 17 - 23 24 18 - 30 206 188 - 225 148 123 - 175144 69.8 68.7 - 70.9 74.4 73.0 - 75.7 14 11 - 17 15 12 - 20 211 185 - 238 145 114 - 177145 67.8 66.5 - 69.1 71.9 70.6 - 73.2 25 21 - 30 20 13 - 30 238 207 - 272 184 160 - 207146 66.8 66.0 - 67.7 69.7 68.6 - 70.8 27 22 - 31 21 16 - 26 235 219 - 251 203 186 - 221147 77.2 75.8 - 78.6 84.0 82.5 - 85.7 5 4 - 9 3 3 - 3 85 72 - 99 31 25 - 37148 61.7 54.2 - 68.8 63.6 54.5 - 70.6 80 62 - 98 82 60 - 104 259 108 - 454 217 95 - 414149 68.4 64.0 - 72.3 73.9 70.9 - 76.5 30 23 - 37 25 19 - 31 192 120 - 298 112 74 - 163150 54.3 46.7 - 60.6 57.3 48.3 - 64.5 139 122 - 157 129 112 - 145 349 187 - 560 284 131 - 512151 69.7 69.3 - 70.1 74.9 74.5 - 75.2 17 16 - 19 13 12 - 15 186 177 - 195 98 93 - 103152 67.0 66.1 - 67.9 77.2 76.1 - 78.3 15 11 - 18 10 8 - 13 243 219 - 268 113 91 - 138153 32.4 22.7 - 39.9 35.7 25.0 - 45.4 332 286 - 380 303 255 - 351 682 497 - 898 569 323 - 836154 77.4 76.4 - 78.4 81.7 81.3 - 82.1 4 4 - 4 3 3 - 3 90 80 - 101 53 49 - 56155 69.8 69.2 - 70.3 78.3 77.9 - 78.7 9 8 - 11 7 6 - 9 206 195 - 219 79 73 - 84156 72.8 72.3 - 73.2 80.5 80.2 - 80.8 5 4 - 6 4 4 - 5 163 154 - 172 71 67 - 76157 63.6 61.5 - 66.2 67.4 65.7 - 69.0 86 73 - 99 75 64 - 86 199 160 - 238 147 127 - 168158 43.0 35.9 - 48.5 45.7 35.3 - 53.0 218 198 - 239 223 199 - 245 534 388 - 738 418 232 - 676159 48.8 45.5 - 52.0 52.6 50.0 - 55.0 86 61 - 108 81 55 - 105 598 404 - 818 482 321 - 653160 76.1 75.6 - 76.7 83.0 82.8 - 83.3 5 5 - 6 5 4 - 5 120 111 - 128 47 45 - 49161 67.2 65.1 - 69.6 74.3 73.3 - 75.4 20 17 - 23 16 14 - 19 238 186 - 286 121 106 - 136162 54.9 48.3 - 62.5 59.3 50.6 - 65.6 111 104 - 120 106 97 - 113 379 202 - 559 278 148 - 495163 64.4 63.0 - 65.9 70.8 69.6 - 72.3 33 29 - 37 28 24 - 31 281 247 - 313 164 137 - 187
152 <strong>The</strong> <strong>World</strong> <strong>Health</strong> <strong>Report</strong> 2003Annex Table 1 Basic indicators for all Member StatesFigures computed by WHO to assure comparability; a they are not necessarily the official statistics of Member States, which may use alternative rigorous methods.POPULATION ESTIMATESLIFE EXPECTANCYMember State Total Annual Dependency Percentage Total AT BIRTH (YEARS)population growth ratio of population fertility Both(000) rate (%) (per 100) aged 60+ years rate sexes2002 1992–2002 1992 2002 1992 2002 1992 2002 2002164 Swaziland 1 069 1.9 97 89 4.5 5.1 5.7 4.6 38.8165 Sweden 8 867 0.2 56 55 22.4 22.9 2.0 1.6 80.4166 Switzerland 7 171 0.3 46 49 19.4 22.1 1.5 1.4 80.6167 Syrian Arab Republic 17 381 2.6 98 70 4.2 4.6 4.8 3.4 71.2168 Tajikistan 6 195 1.2 89 73 6.3 6.7 4.5 3.1 63.7169 Thailand 62 193 1.1 53 46 6.7 8.8 2.1 1.9 69.3170 <strong>The</strong> former YugoslavRepublic of Macedonia 2 046 0.6 50 48 12.2 14.7 1.8 1.9 72.0171 Timor-Leste 739 -0.7 77 73 3.6 5.2 4.8 3.9 57.5172 Togo 4 801 2.9 94 89 4.8 4.9 6.2 5.4 51.7173 Tonga 103 0.3 78 74 7.4 8.2 4.5 3.8 70.7174 Trinidad and Tobago 1 298 0.5 64 43 8.8 10.0 2.2 1.6 69.9175 Tunisia 9 728 1.3 71 52 7.4 8.4 3.2 2.0 71.6176 Turkey 70 318 1.6 67 57 7.2 8.2 3.2 2.5 70.0177 Turkmenistan 4 794 2.1 79 64 6.2 6.5 4.1 2.7 62.7178 Tuvalu 10 1.4 71 65 6.2 7.2 3.5 2.9 60.6179 Uganda 25 004 3.0 105 111 4.1 3.9 7.1 7.1 49.3180 Ukraine 48 902 -0.6 51 45 18.5 20.8 1.7 1.2 67.2181 United Arab Emirates 2 937 2.8 42 37 1.8 2.4 3.9 2.9 72.5182 United Kingdom 59 068 0.3 54 53 21.1 20.8 1.8 1.6 78.2183 United Republic of Tanzania 36 276 2.6 96 91 3.7 3.9 6.1 5.2 46.5184 United States of America 291 038 1.1 52 51 16.4 16.2 2.0 2.1 77.3185 Uruguay 3 391 0.7 60 61 16.7 17.3 2.5 2.3 75.2186 Uzbekistan 25 705 1.8 81 65 6.5 7.0 3.7 2.5 68.2187 Vanuatu 207 2.7 90 80 5.3 4.9 4.9 4.2 67.7188 Venezuela,Bolivarian Republic of 25 226 2.1 70 60 5.9 6.9 3.3 2.7 73.9189 Viet Nam 80 278 1.5 76 59 7.3 7.4 3.4 2.3 69.6190 Yemen 19 315 3.9 114 104 3.5 3.6 7.9 7.0 60.4191 Zambia 10 698 2.1 94 98 4.4 4.7 6.3 5.7 39.7192 Zimbabwe 12 835 1.5 96 87 4.5 5.1 5.2 4.0 37.9a See explanatory notes for sources and methods.
Statistical Annex 153LIFE EXPECTANCY AT BIRTH (YEARS) PROBABILITY OF DYING (PER 1000)Under age 5 yearsBetween ages 15 and 60 yearsMales Females Males Females Males Females2002 Uncertainty 2002 Uncertainty 2002 Uncertainty 2002 Uncertainty 2002 Uncertainty 2002 Uncertainty164 36.9 34.2 - 40.7 40.4 35.8 - 44.5 150 132 - 169 142 124 - 159 818 743 - 877 707 627 - 804165 78.0 77.7 - 78.3 82.6 82.4 - 82.9 4 4 - 5 3 3 - 3 83 80 - 85 53 51 - 55166 77.7 77.2 - 78.2 83.3 83.1 - 83.6 6 5 - 7 5 4 - 6 92 87 - 98 51 49 - 53167 68.8 68.0 - 69.7 73.6 73.0 - 74.3 26 24 - 29 20 18 - 22 190 175 - 205 127 117 - 137168 61.0 59.2 - 62.7 66.5 64.8 - 68.0 68 47 - 90 57 40 - 72 283 231 - 339 172 137 - 216169 66.0 64.8 - 67.1 72.7 71.7 - 73.8 32 28 - 37 26 22 - 30 279 250 - 311 153 131 - 178170 69.0 68.3 - 69.7 75.1 74.4 - 75.8 17 16 - 19 15 13 - 16 195 180 - 212 89 81 - 99171 54.8 46.4 - 62.1 60.5 50.5 - 67.7 142 108 - 178 108 81 - 134 326 162 - 533 242 111 - 463172 50.0 43.4 - 55.7 53.3 46.0 - 59.8 149 131 - 166 127 110 - 143 459 316 - 636 394 265 - 569173 70.0 69.5 - 70.5 71.4 70.8 - 72.0 23 20 - 27 15 12 - 18 171 166 - 177 181 174 - 188174 67.1 66.1 - 68.1 72.8 72.2 - 73.4 24 20 - 28 18 15 - 21 246 221 - 272 153 138 - 169175 69.5 68.7 - 70.3 73.9 73.0 - 74.7 31 28 - 34 24 21 - 26 167 154 - 180 115 102 - 128176 67.9 67.1 - 68.8 72.2 71.1 - 73.4 44 40 - 48 42 38 - 46 177 162 - 192 112 94 - 130177 58.8 58.3 - 59.3 66.9 66.1 - 67.7 63 56 - 69 47 42 - 52 369 349 - 385 193 172 - 215178 60.0 58.4 - 61.8 61.4 59.7 - 62.9 72 54 - 91 56 43 - 69 298 247 - 345 280 234 - 342179 47.9 42.3 - 53.2 50.8 43.6 - 56.5 148 142 - 154 136 130 - 142 505 370 - 661 431 306 - 606180 61.7 61.0 - 62.4 72.9 72.0 - 73.8 22 19 - 24 16 15 - 18 378 343 - 417 139 120 - 161181 71.3 71.0 - 71.5 75.1 74.9 - 75.3 10 9 - 11 10 9 - 10 169 165 - 174 122 120 - 125182 75.8 75.3 - 76.3 80.5 79.9 - 81.0 7 6 - 8 6 5 - 6 107 101 - 113 67 61 - 72183 45.5 44.3 - 46.9 47.5 46.2 - 49.0 163 149 - 177 144 132 - 156 561 534 - 585 512 484 - 536184 74.6 74.2 - 75.1 79.8 79.7 - 80.0 9 8 - 9 7 7 - 7 140 134 - 148 83 81 - 84185 71.0 70.5 - 71.6 79.3 79.0 - 79.7 18 15 - 21 13 12 - 14 182 172 - 192 88 84 - 92186 65.6 64.8 - 66.3 70.8 70.1 - 71.6 37 36 - 39 26 25 - 28 243 224 - 263 152 136 - 169187 66.4 64.7 - 68.5 69.1 67.4 - 70.9 40 30 - 51 40 30 - 50 217 185 - 245 175 150 - 200188 71.0 70.2 - 71.8 76.8 76.5 - 77.2 23 21 - 26 19 17 - 21 182 168 - 197 97 92 - 103189 67.1 66.3 - 68.1 72.2 71.4 - 73.1 41 36 - 46 33 28 - 37 200 184 - 215 129 117 - 140190 58.7 51.1 - 65.5 62.2 53.8 - 68.7 106 93 - 119 94 82 - 106 286 130 - 498 228 103 - 421191 39.1 34.5 - 43.6 40.2 35.2 - 45.4 191 170 - 214 176 155 - 195 700 590 - 810 654 546 - 768192 37.7 35.7 - 40.2 38.0 35.8 - 40.8 115 104 - 125 107 97 - 116 821 776 - 856 789 739 - 828
154 <strong>The</strong> <strong>World</strong> <strong>Health</strong> <strong>Report</strong> 2003Annex Table 2 Deaths by cause, sex and mortality stratum in WHO regions, a estimates for 2002Figures computed by WHO to assure comparability; b they are not necessarily the official statistics of Member States, which may use alternative rigorous methods.SEX c AFRICA THE AMERICASCause d Mortality stratum Mortality stratumBoth sexes Males Females High child, High child, Very low child, Low child, High child,high adult very high adult very low adult low adult high adultPopulation (000) 6 224 985 3 131 052 3 093 933 311 273 360 965 333 580 445 161 73 810(000) % total (000) % total (000) % total (000) (000) (000) (000) (000)TOTAL Deaths 57 027 100 29 949 100 27 078 100 4 634 6 144 2 720 2 691 547I. Communicable diseases, maternaland perinatal conditions andnutritional deficiencies 18 416 32.3 9 477 31.6 8 938 33.0 3 222 4 557 167 475 233Infectious and parasitic diseases 11 122 19.5 5 968 19.9 5 154 19.0 2 238 3 549 69 188 137Tuberculosis 1 605 2.8 1 055 3.5 550 2.0 121 182 1 25 18STIs excluding HIV 180 0.3 91 0.3 89 0.3 41 52 0 1 1Syphilis 157 0.3 84 0.3 72 0.3 39 50 0 1 0Chlamydia 9 0.0 0 0.0 9 0.0 1 0 0 0 0Gonorrhoea 1 0.0 0 0.0 1 0.0 0 0 0 0 0HIV/AIDS 2 821 4.9 1 532 5.1 1 290 4.8 456 1 747 14 46 43Diarrhoeal diseases 1 767 3.1 924 3.1 844 3.1 341 354 2 33 20Childhood diseases 1 360 2.4 679 2.3 681 2.5 426 295 0 1 6Pertussis 301 0.5 151 0.5 151 0.6 101 71 0 0 6Poliomyelitis 1 0.0 0 0.0 0 0.0 0 0 0 0 0Diphtheria 5 0.0 3 0.0 3 0.0 1 1 0 0 0Measles 760 1.3 379 1.3 382 1.4 261 178 0 0 0Tetanus 292 0.5 147 0.5 146 0.5 64 45 0 0 0Meningitis 173 0.3 90 0.3 83 0.3 8 12 1 8 9Hepatitis B e 103 0.2 71 0.2 32 0.1 10 10 1 3 2Hepatitis C e 53 0.1 35 0.1 18 0.1 4 4 5 2 0Malaria 1 222 2.1 585 2.0 637 2.4 538 549 0 1 0Tropical diseases 130 0.2 79 0.3 50 0.2 28 28 0 12 4Trypanosomiasis 48 0.1 31 0.1 17 0.1 24 23 0 0 0Chagas disease 14 0.0 8 0.0 7 0.0 0 0 0 11 4Schistosomiasis 15 0.0 10 0.0 5 0.0 1 1 0 1 0Leishmaniasis 51 0.1 30 0.1 21 0.1 4 4 0 0 0Lymphatic filariasis 0 0.0 0 0.0 0 0.0 0 0 0 0 0Onchocerciasis 0 0.0 0 0.0 0 0.0 0 0 0 0 0Leprosy 6 0.0 4 0.0 2 0.0 0 0 0 1 0Dengue 19 0.0 8 0.0 10 0.0 0 0 0 1 1Japanese encephalitis 14 0.0 7 0.0 7 0.0 0 0 0 0 0Trachoma 0 0.0 0 0.0 0 0.0 0 0 0 0 0Intestinal nematode infections 12 0.0 6 0.0 6 0.0 1 2 0 0 1Ascariasis 3 0.0 1 0.0 2 0.0 0 1 0 0 0Trichuriasis 3 0.0 2 0.0 1 0.0 0 0 0 0 0Hookworm disease 3 0.0 2 0.0 1 0.0 1 1 0 0 0Respiratory infections 3 845 6.7 1 931 6.4 1 914 7.1 533 538 72 107 49Lower respiratory infections 3 766 6.6 1 890 6.3 1 875 6.9 525 531 72 105 47Upper respiratory infections 75 0.1 38 0.1 37 0.1 7 6 0 1 2Otitis media 4 0.0 3 0.0 1 0.0 1 1 0 0 0Maternal conditions 510 0.9 … … 510 1.9 102 129 1 9 7Perinatal conditions 2 464 4.3 1 368 4.6 1 096 4.0 284 270 17 132 26Nutritional deficiencies 475 0.8 210 0.7 264 1.0 65 72 8 38 14Protein-energy malnutrition 250 0.4 125 0.4 125 0.5 48 50 5 29 8Iodine deficiency 7 0.0 3 0.0 3 0.0 0 2 0 0 0Vitamin A deficiency 23 0.0 11 0.0 12 0.0 10 7 0 0 0Iron-deficiency anaemia 137 0.2 47 0.2 90 0.3 6 11 3 7 5
Statistical Annex 155EASTERN MEDITERRANEAN EUROPE SOUTH-EAST ASIA WESTERN PACIFICCause d Mortality stratum Mortality stratum Mortality stratum Mortality stratumLow child, High child, Very low child, Low child, Low child, Low child, High child, Very low child, Low child,low adult high adult very low adult low adult high adult low adult high adult very low adult low adultPopulation (000) 142 528 360 296 415 323 222 846 239 717 298 234 1 292 598 155 400 1 562 136(000) (000) (000) (000) (000) (000) (000) (000) (000)TOTAL Deaths 706 3 462 3 926 1 866 3 689 2 191 12 428 1 146 10 786I. Communicable diseases, maternaland perinatal conditions andnutritional deficiencies 92 1 654 242 166 159 625 5 105 136 1 565Infectious and parasitic diseases 38 921 50 62 100 398 2 570 24 770Tuberculosis 7 124 5 19 50 157 533 5 355STIs excluding HIV 0 23 0 0 0 3 55 0 2Syphilis 0 21 0 0 0 1 42 0 1Chlamydia 0 1 0 0 0 1 7 0 0Gonorrhoea 0 0 0 0 0 0 0 0 0HIV/AIDS 1 49 6 1 36 59 315 0 46Diarrhoeal diseases 14 236 2 13 2 41 559 1 148Childhood diseases 0 204 0 7 0 38 328 0 53Pertussis 0 61 0 0 0 1 60 0 2Poliomyelitis 0 0 0 0 0 0 0 0 0Diphtheria 0 0 0 0 0 0 3 0 0Measles 0 84 0 7 0 31 167 0 32Tetanus 0 59 0 0 0 6 98 0 19Meningitis 2 23 2 10 4 9 64 0 20Hepatitis B e 1 9 2 2 1 7 30 1 25Hepatitis C e 1 4 3 1 0 3 11 4 10Malaria 2 55 0 0 0 12 53 0 11Tropical diseases 0 15 0 0 0 0 36 0 5Trypanosomiasis 0 1 0 0 0 0 0 0 0Chagas disease 0 0 0 0 0 0 0 0 0Schistosomiasis 0 9 0 0 0 0 0 0 4Leishmaniasis 0 5 0 0 0 0 36 0 2Lymphatic filariasis 0 0 0 0 0 0 0 0 0Onchocerciasis 0 0 0 0 0 0 0 0 0Leprosy 0 1 0 0 0 1 2 0 1Dengue 0 1 0 0 0 3 9 0 4Japanese encephalitis 0 2 0 0 0 0 8 0 3Trachoma 0 0 0 0 0 0 0 0 0Intestinal nematode infections 0 1 0 0 0 1 4 0 1Ascariasis 0 0 0 0 0 0 1 0 1Trichuriasis 0 0 0 0 0 0 2 0 0Hookworm disease 0 0 0 0 0 1 0 0 0Respiratory infections 20 345 174 60 39 108 1 285 108 403Lower respiratory infections 19 339 171 59 37 105 1 267 107 377Upper respiratory infections 0 6 3 2 2 3 17 1 26Otitis media 0 0 0 0 0 0 1 0 0Maternal conditions 3 65 0 2 1 11 160 0 21Perinatal conditions 28 275 10 39 17 82 930 2 348Nutritional deficiencies 4 48 7 3 2 26 161 2 24Protein-energy malnutrition 2 22 3 1 1 10 56 1 13Iodine deficiency 0 2 0 0 0 0 1 0 0Vitamin A deficiency 0 3 0 0 0 0 2 0 0Iron-deficiency anaemia 1 9 3 2 1 13 67 1 8
156 <strong>The</strong> <strong>World</strong> <strong>Health</strong> <strong>Report</strong> 2003Annex Table 2 Deaths by cause, sex and mortality stratum in WHO regions, a estimates for 2002Figures computed by WHO to assure comparability; b they are not necessarily the official statistics of Member States, which may use alternative rigorous methods.SEX c AFRICA THE AMERICASCause d Mortality stratum Mortality stratumBoth sexes Males Females High child, High child, Very low child, Low child, High child,high adult very high adult very low adult low adult high adultPopulation (000) 6 224 985 3 131 052 3 093 933 311 273 360 965 333 580 445 161 73 810(000) % total (000) % total (000) % total (000) (000) (000) (000) (000)II. Noncommunicable conditions 33 424 58.6 16 992 56.7 16 432 60.7 1 068 1 184 2 380 1 895 268Malignant neoplasms 7 106 12.5 3 963 13.2 3 144 11.6 194 216 641 408 66Mouth and oropharynx cancers 317 0.6 220 0.7 97 0.4 8 10 10 12 2Oesophagus cancer 446 0.8 284 0.9 161 0.6 5 17 16 15 1Stomach cancer 849 1.5 523 1.7 326 1.2 16 18 17 44 13Colon/rectum cancer 620 1.1 321 1.1 299 1.1 10 10 74 31 4Liver cancer 619 1.1 428 1.4 191 0.7 22 23 17 17 3Pancreas cancer 229 0.4 121 0.4 109 0.4 3 5 33 17 2Trachea/bronchus/lung cancers 1 239 2.2 886 3.0 353 1.3 7 10 179 49 3Melanoma and other skin cancers 66 0.1 35 0.1 31 0.1 4 4 12 6 1Breast cancer 477 0.8 3 0.0 474 1.8 21 14 52 33 4Cervix uteri cancer 239 0.4 … … 239 0.9 15 23 5 19 7Corpus uteri cancer 71 0.1 … … 71 0.3 1 1 9 10 1Ovary cancer 134 0.2 … … 134 0.5 3 5 16 7 1Prostate cancer 268 0.5 268 0.9 … … 24 17 42 31 5Bladder cancer 178 0.3 125 0.4 53 0.2 6 5 16 8 1Lymphomas, multiple myeloma 334 0.6 168 0.6 165 0.6 17 16 45 18 5Leukaemia 264 0.5 146 0.5 117 0.4 7 6 27 18 3Other neoplasms 148 0.3 74 0.2 74 0.3 4 5 17 11 1Diabetes mellitus 987 1.7 440 1.5 547 2.0 35 45 86 151 16Nutritional/endocrine disorders 243 0.4 108 0.4 135 0.5 12 14 33 25 4Neuropsychiatric disorders 1 105 1.9 570 1.9 535 2.0 43 47 174 56 10Unipolar depressive disorders 13 0.0 6 0.0 7 0.0 0 0 1 0 0Bipolar affective disorder 1 0.0 0 0.0 1 0.0 0 0 0 0 0Schizophrenia 23 0.0 11 0.0 12 0.0 0 0 1 0 0Epilepsy 125 0.2 70 0.2 55 0.2 18 20 2 6 2Alcohol use disorders 86 0.2 73 0.2 13 0.0 3 4 8 14 2Alzheimer and other dementias 395 0.7 146 0.5 249 0.9 3 4 106 11 1Parkinson disease 98 0.2 50 0.2 48 0.2 2 3 19 4 1Multiple sclerosis 16 0.0 6 0.0 10 0.0 0 0 4 1 0Drug use disorders 88 0.2 72 0.2 16 0.1 2 0 5 2 0Post-traumatic stress disorder 0 0.0 0 0.0 0 0.0 0 0 0 0 0Obsessive-compulsive disorder 0 0.0 0 0.0 0 0.0 0 0 0 0 0Panic disorder 0 0.0 0 0.0 0 0.0 0 0 0 0 0Insomnia (primary) 0 0.0 0 0.0 0 0.0 0 0 0 0 0Migraine 0 0.0 0 0.0 0 0.0 0 0 0 0 0Sense organ disorders 3 0.0 2 0.0 2 0.0 0 0 0 0 0Glaucoma 0 0.0 0 0.0 0 0.0 0 0 0 0 0Cataracts 0 0.0 0 0.0 0 0.0 0 0 0 0 0Vision loss, age-related and other 0 0.0 0 0.0 0 0.0 0 0 0 0 0Hearing loss, adult onset 0 0.0 0 0.0 0 0.0 0 0 0 0 0Cardiovascular diseases 16 655 29.2 8 074 27.0 8 581 31.7 496 540 1 031 803 93Rheumatic heart disease 328 0.6 138 0.5 190 0.7 12 8 4 6 0Hypertensive heart disease 907 1.6 418 1.4 489 1.8 27 33 47 73 15Ischaemic heart disease 7 168 12.6 3 779 12.6 3 389 12.5 160 172 574 318 28Cerebrovascular disease 5 494 9.6 2 540 8.5 2 954 10.9 172 187 187 239 26Inflammatory heart disease 402 0.7 209 0.7 192 0.7 20 22 35 31 1
Statistical Annex 157EASTERN MEDITERRANEAN EUROPE SOUTH-EAST ASIA WESTERN PACIFICCause d Mortality stratum Mortality stratum Mortality stratum Mortality stratumLow child, High child, Very low child, Low child, Low child, Low child, High child, Very low child, Low child,low adult high adult very low adult low adult high adult low adult high adult very low adult low adultPopulation (000) 142 528 360 296 415 323 222 846 239 717 298 234 1 292 598 155 400 1 562 136(000) (000) (000) (000) (000) (000) (000) (000) (000)II. Noncommunicable conditions 501 1 529 3 495 1 590 3 027 1 341 6 082 924 8 076Malignant neoplasms 76 196 1 040 291 491 267 893 354 1 961Mouth and oropharynx cancers 2 18 24 9 17 16 133 7 50Oesophagus cancer 4 12 28 7 13 4 78 12 233Stomach cancer 12 9 61 28 67 12 51 54 447Colon/rectum cancer 5 10 138 30 60 28 35 46 139Liver cancer 6 9 40 12 15 31 30 36 358Pancreas cancer 2 3 53 12 22 6 13 22 35Trachea/bronchus/lung cancers 10 17 207 61 94 43 131 65 361Melanoma and other skin cancers 1 1 15 4 6 1 2 3 4Breast cancer 4 23 89 21 40 25 68 14 68Cervix uteri cancer 1 6 8 7 12 14 87 3 31Corpus uteri cancer 1 1 15 5 11 3 3 3 6Ovary cancer 1 5 25 7 13 8 19 5 17Prostate cancer 3 5 69 11 13 8 19 12 9Bladder cancer 2 17 37 10 13 6 27 6 24Lymphomas, multiple myeloma 5 15 54 11 10 17 79 15 26Leukaemia 7 13 36 11 14 13 33 9 65Other neoplasms 9 15 30 4 4 3 16 10 18Diabetes mellitus 15 40 92 29 20 72 191 17 174Nutritional/endocrine disorders 5 24 28 3 3 16 23 9 43Neuropsychiatric disorders 22 67 185 25 40 53 214 22 143Unipolar depressive disorders 0 1 2 0 0 1 8 0 0Bipolar affective disorder 0 0 0 0 0 0 0 0 0Schizophrenia 0 1 1 0 1 1 13 0 4Epilepsy 2 8 6 4 4 5 29 1 18Alcohol use disorders 2 2 13 4 6 3 12 1 11Alzheimer and other dementias 2 9 96 3 5 9 79 10 56Parkinson disease 2 2 22 2 1 1 9 4 26Multiple sclerosis 0 0 4 1 2 0 1 0 1Drug use disorders 7 24 7 2 11 3 20 1 3Post-traumatic stress disorder 0 0 0 0 0 0 0 0 0Obsessive-compulsive disorder 0 0 0 0 0 0 0 0 0Panic disorder 0 0 0 0 0 0 0 0 0Insomnia (primary) 0 0 0 0 0 0 0 0 0Migraine 0 0 0 0 0 0 0 0 0Sense organ disorders 0 1 0 0 0 0 1 0 0Glaucoma 0 0 0 0 0 0 0 0 0Cataracts 0 0 0 0 0 0 0 0 0Vision loss, age-related and other 0 0 0 0 0 0 0 0 0Hearing loss, adult onset 0 0 0 0 0 0 0 0 0Cardiovascular diseases 284 796 1 614 1 051 2 192 600 3 311 369 3 448Rheumatic heart disease 4 20 10 7 14 12 121 3 107Hypertensive heart disease 30 67 67 68 40 56 96 8 276Ischaemic heart disease 143 396 673 464 1 201 265 1 774 126 864Cerebrovascular disease 54 172 414 283 734 162 897 151 1 807Inflammatory heart disease 11 26 28 30 41 10 66 7 73
158 <strong>The</strong> <strong>World</strong> <strong>Health</strong> <strong>Report</strong> 2003Annex Table 2 Deaths by cause, sex and mortality stratum in WHO regions, a estimates for 2002Figures computed by WHO to assure comparability; b they are not necessarily the official statistics of Member States, which may use alternative rigorous methods.SEX c AFRICA THE AMERICASCause d Mortality stratum Mortality stratumBoth sexes Males Females High child, High child, Very low child, Low child, High child,high adult very high adult very low adult low adult high adultPopulation (000) 6 224 985 3 131 052 3 093 933 311 273 360 965 333 580 445 161 73 810(000) % total (000) % total (000) % total (000) (000) (000) (000) (000)Respiratory diseases 3 696 6.5 1 909 6.4 1 788 6.6 124 133 199 175 23Chronic obstructive pulmonary disease 2 746 4.8 1 411 4.7 1 334 4.9 52 65 141 90 10Asthma 239 0.4 121 0.4 118 0.4 12 14 6 10 2Digestive diseases 1 963 3.4 1 091 3.6 872 3.2 75 82 99 153 31Peptic ulcer disease 265 0.5 155 0.5 110 0.4 7 8 6 11 3Cirrhosis of the liver 783 1.4 501 1.7 282 1.0 26 28 31 61 13Appendicitis 21 0.0 12 0.0 10 0.0 1 1 1 2 1Diseases of the genitourinary system 847 1.5 442 1.5 405 1.5 51 55 66 55 15Nephritis/nephrosis 677 1.2 345 1.2 332 1.2 47 52 47 43 12Benign prostatic hypertrophy 31 0.1 31 0.1 … … 1 1 1 2 0Skin diseases 69 0.1 26 0.1 43 0.2 10 9 5 6 2Musculoskeletal diseases 106 0.2 38 0.1 69 0.3 4 3 17 10 2Rheumatoid arthritis 25 0.0 7 0.0 18 0.1 1 0 3 2 1Osteoarthritis 5 0.0 2 0.0 3 0.0 0 0 1 1 0Congenital abnormalities 493 0.9 255 0.9 238 0.9 21 35 13 40 5Oral diseases 2 0.0 1 0.0 1 0.0 0 0 0 0 0Dental caries 0 0.0 0 0.0 0 0.0 0 0 0 0 0Periodontal disease 0 0.0 0 0.0 0 0.0 0 0 0 0 0Edentulism 0 0.0 0 0.0 0 0.0 0 0 0 0 0III. Injuries 5 188 9.1 3 480 11.6 1 708 6.3 344 403 173 321 46Unintentional 3 562 6.2 2 317 7.7 1 245 4.6 258 230 120 167 33Road traffic injuries 1 192 2.1 869 2.9 323 1.2 96 99 49 76 10Poisoning 355 0.6 229 0.8 126 0.5 21 18 14 2 1Falls 393 0.7 237 0.8 156 0.6 11 9 18 12 1Fires 311 0.5 120 0.4 191 0.7 24 20 4 3 1Drowning 385 0.7 264 0.9 121 0.4 36 29 4 15 3Other unintentional injuries 928 1.6 599 2.0 329 1.2 71 56 30 58 18Intentional 1 626 2.9 1 164 3.9 462 1.7 86 173 53 154 13Self-inflicted 877 1.5 549 1.8 328 1.2 15 19 35 26 2Violence 559 1.0 444 1.5 114 0.4 57 77 17 119 10War 178 0.3 161 0.5 18 0.1 14 77 0 8 0a See list of Member States by WHO region and mortality stratum.b See explanatory notes for sources and methods.c <strong>World</strong> totals include residual populations living in overseas territories and areas, or outside any WHO Member State.d Estimates for specific causes may not sum to broader cause groupings owing to omission of residual categories.e Does not include liver cancer and cirrhosis deaths resulting from chronic hepatitis virus infection.… Data not available or not applicable.
Statistical Annex 159EASTERN MEDITERRANEAN EUROPE SOUTH-EAST ASIA WESTERN PACIFICCause d Mortality stratum Mortality stratum Mortality stratum Mortality stratumLow child, High child, Very low child, Low child, Low child, Low child, High child, Very low child, Low child,low adult high adult very low adult low adult high adult low adult high adult very low adult low adultPopulation (000) 142 528 360 296 415 323 222 846 239 717 298 234 1 292 598 155 400 1 562 136(000) (000) (000) (000) (000) (000) (000) (000) (000)Respiratory diseases 27 128 220 72 106 153 721 59 1 550Chronic obstructive pulmonary disease 15 80 140 45 72 100 556 22 1 354Asthma 2 14 12 9 20 20 77 6 37Digestive diseases 22 130 182 77 126 87 415 44 435Peptic ulcer disease 2 10 17 9 14 15 84 5 75Cirrhosis of the liver 8 59 65 39 63 34 170 14 171Appendicitis 0 1 1 0 1 1 7 0 5Diseases of the genitourinary system 21 62 63 25 24 57 149 27 175Nephritis/nephrosis 9 56 42 20 14 45 124 24 141Benign prostatic hypertrophy 1 2 1 1 2 2 11 0 6Skin diseases 1 4 9 0 3 5 10 1 3Musculoskeletal diseases 1 2 20 2 4 7 10 6 20Rheumatoid arthritis 0 0 4 1 1 1 3 2 5Osteoarthritis 0 0 1 0 0 0 0 0 0Congenital abnormalities 19 64 11 13 14 20 129 4 104Oral diseases 0 0 0 0 0 0 0 0 0Dental caries 0 0 0 0 0 0 0 0 0Periodontal disease 0 0 0 0 0 0 0 0 0Edentulism 0 0 0 0 0 0 0 0 0III. Injuries 112 279 190 110 503 225 1 242 86 1 145Unintentional 98 196 137 77 334 149 931 48 779Road traffic injuries 57 75 46 22 60 72 224 14 290Poisoning 3 12 6 6 103 8 87 1 74Falls 6 17 47 9 25 15 106 8 108Fires 7 24 3 3 17 14 170 2 18Drowning 5 21 4 6 30 14 84 6 126Other unintentional injuries 19 47 32 30 99 26 261 17 162Intentional 15 83 53 33 170 76 310 38 366Self-inflicted 9 25 48 23 93 37 209 37 296Violence 5 22 4 8 60 28 85 1 65War 0 35 0 2 17 10 11 0 3
160 <strong>The</strong> <strong>World</strong> <strong>Health</strong> <strong>Report</strong> 2003Annex Table 3 Burden of disease in DALYs by cause, sex and mortality stratum in WHO regions, a estimates for 2002Figures computed by WHO to assure comparability; b they are not necessarily the official statistics of Member States, which may use alternative rigorous methods.SEX c AFRICA THE AMERICASCause d Mortality stratum Mortality stratumBoth sexes Males Females High child, High child, Very low child, Low child, High child,high adult very high adult very low adult low adult high adultPopulation (000) 6 224 985 3 131 052 3 093 933 311 273 360 965 333 580 445 161 73 810(000) % total (000) % total (000) % total (000) (000) (000) (000) (000)TOTAL DALYs 1 491 416 100 775 331 100 716 085 100 159 496 204 605 46 868 81 429 17 323I. Communicable diseases, maternaland perinatal conditions andnutritional deficiencies 612 194 41.0 299 497 38.6 312 696 43.7 114 397 153 843 3 106 16 167 7 404Infectious and parasitic diseases 356 824 23.9 184 338 23.8 172 486 24.1 77 530 115 544 1 228 6 549 4 074Tuberculosis 35 361 2.4 22 274 2.9 13 087 1.8 3 277 4 953 12 502 388STIs excluding HIV 11 348 0.8 3 855 0.5 7 493 1.0 1 930 2 444 75 487 69Syphilis 4 200 0.3 1 970 0.3 2 230 0.3 1 028 1 417 2 56 20Chlamydia 3 571 0.2 302 0.0 3 269 0.5 364 428 55 241 15Gonorrhoea 3 365 0.2 1 473 0.2 1 892 0.3 520 573 16 183 31HIV/AIDS 86 072 5.8 45 249 5.8 40 824 5.7 13 966 52 806 454 1 472 1 294Diarrhoeal diseases 61 095 4.1 31 943 4.1 29 152 4.1 11 270 11 722 106 1 481 706Childhood diseases 49 844 3.3 24 817 3.2 25 027 3.5 15 315 10 663 54 180 255Pertussis 13 052 0.9 6 500 0.8 6 552 0.9 3 948 2 841 52 165 237Poliomyelitis 152 0.0 77 0.0 75 0.0 11 4 3 6 1Diphtheria 184 0.0 96 0.0 88 0.0 24 24 0 2 7Measles 27 058 1.8 13 450 1.7 13 607 1.9 9 250 6 317 0 0 0Tetanus 9 398 0.6 4 694 0.6 4 704 0.7 2 081 1 477 0 8 10Meningitis 6 195 0.4 3 087 0.4 3 108 0.4 394 497 43 356 280Hepatitis B e 2 177 0.1 1 465 0.2 712 0.1 302 280 20 55 38Hepatitis C e 1 001 0.1 668 0.1 333 0.0 120 122 77 29 1Malaria 44 716 3.0 21 499 2.8 23 217 3.2 19 429 19 736 0 86 24Tropical diseases 12 255 0.8 8 278 1.1 3 978 0.6 2 939 2 752 9 604 178Trypanosomiasis 1 535 0.1 971 0.1 563 0.1 744 750 0 0 0Chagas disease 667 0.0 343 0.0 324 0.0 0 0 8 483 171Schistosomiasis 1 702 0.1 1 021 0.1 681 0.1 621 713 0 74 0Leishmaniasis 2 090 0.1 1 249 0.2 840 0.1 208 175 1 38 5Lymphatic filariasis 5 777 0.4 4 413 0.6 1 364 0.2 976 1 035 0 9 1Onchocerciasis 484 0.0 280 0.0 204 0.0 390 80 0 1 1Leprosy 199 0.0 117 0.0 82 0.0 12 11 0 18 0Dengue 616 0.0 279 0.0 337 0.0 1 4 0 31 38Japanese encephalitis 709 0.0 338 0.0 371 0.1 0 0 0 0 0Trachoma 2 329 0.2 597 0.1 1 732 0.2 486 726 0 162 2Intestinal nematode infections 2 951 0.2 1 490 0.2 1 461 0.2 809 329 1 66 101Ascariasis 1 817 0.1 910 0.1 907 0.1 714 144 0 23 39Trichuriasis 1 006 0.1 519 0.1 488 0.1 78 155 1 42 29Hookworm disease 59 0.0 31 0.0 27 0.0 17 29 0 0 0Respiratory infections 90 252 6.1 45 945 5.9 44 306 6.2 16 569 16 134 390 1 872 1 120Lower respiratory infections 87 022 5.8 44 316 5.7 42 707 6.0 16 218 15 802 337 1 717 1 055Upper respiratory infections 1 795 0.1 875 0.1 920 0.1 229 191 14 43 41Otitis media 1 434 0.1 755 0.1 680 0.1 122 141 38 112 24Maternal conditions 33 625 2.3 … … 33 625 4.7 5 200 6 549 215 1 153 544Perinatal conditions 97 423 6.5 53 265 6.9 44 158 6.2 10 869 10 485 781 5 537 1 098Nutritional deficiencies 34 070 2.3 15 949 2.1 18 121 2.5 4 229 5 131 493 1 054 569Protein-energy malnutrition 16 565 1.1 8 430 1.1 8 135 1.1 2 629 2 906 36 649 258Iodine deficiency 3 519 0.2 1 759 0.2 1 760 0.2 261 868 7 97 33Vitamin A deficiency 793 0.1 364 0.0 428 0.1 347 248 0 0 1Iron-deficiency anaemia 12 224 0.8 4 998 0.6 7 226 1.0 975 1 089 446 274 268
Statistical Annex 161EASTERN MEDITERRANEAN EUROPE SOUTH-EAST ASIA WESTERN PACIFICCause d Mortality stratum Mortality stratum Mortality stratum Mortality stratumLow child, High child, Very low child, Low child, Low child, Low child, High child, Very low child, Low child,low adult high adult very low adult low adult high adult low adult high adult very low adult low adult142 528 360 296 415 323 222 846 239 717 298 234 1 292 598 155 400 1 562 136(000) (000) (000) (000) (000) (000) (000) (000) (000)TOTAL DALYs 24 079 115 449 51 734 37 701 60 340 62 451 363 035 16 343 248 256I. Communicable diseases, maternaland perinatal conditions andnutritional deficiencies 4 444 60 373 2 551 6 177 5 442 18 521 165 042 1 011 53 118Infectious and parasitic diseases 1 523 31 197 891 2 106 3 142 10 915 78 252 322 23 258Tuberculosis 140 2 736 47 444 1 162 3 530 12 199 41 5 907STIs excluding HIV 144 1 327 79 149 125 479 3 475 34 515Syphilis 3 706 3 6 5 35 860 1 54Chlamydia 100 309 61 95 79 262 1 251 25 281Gonorrhoea 39 296 15 43 39 164 1 261 7 172HIV/AIDS 43 1 557 201 40 1 379 1 502 9 332 8 1 957Diarrhoeal diseases 564 7 800 110 485 108 1 481 18 695 44 6 481Childhood diseases 58 7 330 66 320 29 1 464 11 821 34 2 224Pertussis 39 2 420 64 61 25 155 2 572 33 429Poliomyelitis 4 13 1 3 0 9 56 0 43Diphtheria 0 16 0 1 1 7 96 0 6Measles 9 2 979 1 254 2 1 102 5 958 1 1 169Tetanus 5 1 903 0 1 1 191 3 138 0 577Meningitis 84 1 134 67 326 89 219 1 906 11 781Hepatitis B e 24 166 17 54 24 143 576 18 459Hepatitis C e 12 69 36 19 11 67 212 34 189Malaria 92 2 112 1 18 0 502 2 253 0 433Tropical diseases 45 601 0 7 0 251 4 334 0 516Trypanosomiasis 0 39 0 0 0 0 0 0 0Chagas disease 0 0 0 0 0 0 0 0 0Schistosomiasis 30 197 0 1 0 3 4 0 55Leishmaniasis 16 232 0 6 0 6 1 352 0 50Lymphatic filariasis 0 122 0 1 0 242 2 977 0 411Onchocerciasis 0 10 0 0 0 0 0 0 0Leprosy 0 25 0 0 0 13 105 0 13Dengue 10 20 0 0 0 89 292 0 131Japanese encephalitis 0 83 0 0 0 29 277 0 320Trachoma 91 283 0 0 0 0 168 0 400Intestinal nematode infections 1 225 0 1 0 135 669 2 611Ascariasis 0 158 0 0 0 63 346 1 325Trichuriasis 0 60 0 0 0 63 305 1 272Hookworm disease 0 2 0 0 0 8 1 0 1Respiratory infections 559 10 458 690 1 437 625 1 499 30 286 372 8 165Lower respiratory infections 511 10 140 626 1 340 534 1 382 29 635 350 7 302Upper respiratory infections 10 202 27 62 66 45 301 9 552Otitis media 38 116 37 35 24 72 350 13 310Maternal conditions 412 4 104 167 371 265 1 004 10 390 67 3 146Perinatal conditions 1 319 10 817 499 1 592 681 3 414 35 733 123 14 321Nutritional deficiencies 631 3 798 304 671 730 1 688 10 381 128 4 229Protein-energy malnutrition 174 1 807 24 109 55 698 5 338 18 1 846Iodine deficiency 121 623 3 241 449 81 571 0 163Vitamin A deficiency 0 90 0 1 0 1 100 0 5Iron-deficiency anaemia 334 928 271 297 200 891 3 959 106 2 171
162 <strong>The</strong> <strong>World</strong> <strong>Health</strong> <strong>Report</strong> 2003Annex Table 3 Burden of disease in DALYs by cause, sex and mortality stratum in WHO regions, a estimates for 2002Figures computed by WHO to assure comparability; b they are not necessarily the official statistics of Member States, which may use alternative rigorous methods.SEX c AFRICA THE AMERICASCause d Mortality stratum Mortality stratumBoth sexes Males Females High child, High child, Very low child, Low child, High child,high adult very high adult very low adult low adult high adultPopulation (000) 6 224 985 3 131 052 3 093 933 311 273 360 965 333 580 445 161 73 810(000) % total (000) % total (000) % total (000) (000) (000) (000) (000)II. Noncommunicable conditions 696 632 46.7 355 416 45.8 341 216 47.7 30 124 34 727 39 217 51 833 8 030Malignant neoplasms 75 407 5.1 40 432 5.2 34 975 4.9 2 238 2 517 5 830 4 554 749Mouth and oropharynx cancers 3 560 0.2 2 563 0.3 997 0.1 83 111 97 135 16Esophagus cancer 4 247 0.3 2 762 0.4 1 486 0.2 52 178 136 140 9Stomach cancer 8 087 0.5 5 037 0.6 3 050 0.4 174 196 132 403 123Colon/rectum cancer 5 802 0.4 3 111 0.4 2 691 0.4 118 102 654 295 40Liver cancer 7 146 0.5 5 046 0.7 2 100 0.3 301 305 141 164 32Pancreas cancer 1 962 0.1 1 104 0.1 858 0.1 34 56 247 149 17Trachea/bronchus/lung cancers 11 189 0.8 7 915 1.0 3 274 0.5 71 112 1 398 453 28Melanoma and other skin cancers 688 0.0 380 0.0 308 0.0 34 44 135 66 7Breast cancer 6 165 0.4 23 0.0 6 142 0.9 258 164 687 439 55Cervix uteri cancer 3 284 0.2 … … 3 284 0.5 185 282 102 299 101Corpus uteri cancer 1 121 0.1 … … 1 121 0.2 12 16 161 178 16Ovary cancer 1 632 0.1 … … 1 632 0.2 44 68 156 102 18Prostate cancer 1 621 0.1 1 621 0.2 … … 147 109 281 167 27Bladder cancer 1 473 0.1 996 0.1 476 0.1 55 41 135 56 7Lymphomas, multiple myeloma 4 303 0.3 2 295 0.3 2 008 0.3 291 262 368 246 68Leukaemia 4 680 0.3 2 650 0.3 2 030 0.3 104 109 251 361 76Other neoplasms 1 746 0.1 910 0.1 835 0.1 74 86 114 139 20Diabetes mellitus 16 191 1.1 7 605 1.0 8 586 1.2 529 586 1 455 1 836 224Nutritional/endocrine disorders 7 966 0.5 3 560 0.5 4 406 0.6 570 720 854 1 160 224Neuropsychiatric disorders 193 136 12.9 94 119 12.1 99 017 13.8 8 242 9 655 13 888 18 966 2 934Unipolar depressive disorders 67 295 4.5 26 743 3.4 40 551 5.7 2 011 2 316 5 237 5 863 898Bipolar affective disorder 13 952 0.9 7 049 0.9 6 903 1.0 795 936 531 1 063 177Schizophrenia 16 144 1.1 8 232 1.1 7 912 1.1 777 899 537 1 268 210Epilepsy 7 327 0.5 3 883 0.5 3 443 0.5 701 880 175 745 143Alcohol use disorders 20 247 1.4 17 168 2.2 3 079 0.4 241 672 2 502 3 514 333Alzheimer and other dementias 10 383 0.7 3 983 0.5 6 400 0.9 166 175 1 300 658 76Parkinson disease 1 554 0.1 772 0.1 783 0.1 35 40 252 53 7Multiple sclerosis 1 475 0.1 637 0.1 838 0.1 56 45 120 105 16Drug use disorders 7 413 0.5 5 807 0.7 1 606 0.2 660 656 787 839 232Post-traumatic stress disorder 3 335 0.2 923 0.1 2 412 0.3 149 173 184 209 32Obsessive-compulsive disorder 4 923 0.3 2 116 0.3 2 808 0.4 393 459 227 558 87Panic disorder 6 758 0.5 2 292 0.3 4 466 0.6 360 427 278 512 85Insomnia (primary) 3 477 0.2 1 494 0.2 1 983 0.3 141 161 269 326 49Migraine 7 666 0.5 2 078 0.3 5 588 0.8 193 254 508 754 150Sense organ disorders 69 380 4.7 32 452 4.2 36 928 5.2 4 289 4 649 1 950 3 638 528Glaucoma 3 866 0.3 1 716 0.2 2 150 0.3 451 481 35 219 11Cataracts 25 251 1.7 11 051 1.4 14 200 2.0 2 483 2 670 123 1 156 248Vision loss, age-related and other 14 191 1.0 6 303 0.8 7 889 1.1 437 440 414 1 116 119Hearing loss, adult onset 26 034 1.7 13 364 1.7 12 669 1.8 918 1 058 1 377 1 144 148Cardiovascular diseases 147 541 9.9 79 427 10.2 68 114 9.5 5 187 5 724 6 847 7 427 901Rheumatic heart disease 5 872 0.4 2 560 0.3 3 313 0.5 300 207 40 107 11Hypertensive heart disease 7 622 0.5 3 846 0.5 3 776 0.5 260 327 322 581 126Ischaemic heart disease 58 334 3.9 34 138 4.4 24 196 3.4 1 461 1 564 3 304 2 685 230Cerebrovascular disease 49 118 3.3 25 347 3.3 23 770 3.3 1 757 1 911 1 654 2 534 288Inflammatory heart disease 5 818 0.4 3 410 0.4 2 408 0.3 400 467 382 437 27
Statistical Annex 163EASTERN MEDITERRANEAN EUROPE SOUTH-EAST ASIA WESTERN PACIFICCause d Mortality stratum Mortality stratum Mortality stratum Mortality stratumLow child, High child, Very low child, Low child, Low child, Low child, High child, Very low child, Low child,low adult high adult very low adult low adult high adult low adult high adult very low adult low adult142 528 360 296 415 323 222 846 239 717 298 234 1 292 598 155 400 1 562 136(000) (000) (000) (000) (000) (000) (000) (000) (000)II. Noncommunicable conditions 14 872 42 361 45 110 27 461 41 718 35 713 150 663 13 675 159 791Malignant neoplasms 983 2 835 8 557 3 295 5 173 3 231 10 511 2 782 22 035Mouth and oropharynx cancers 24 226 264 109 204 198 1 407 59 624Esophagus cancer 34 133 234 72 121 34 764 95 2 242Stomach cancer 117 124 422 283 633 114 516 373 4 469Colon/rectum cancer 58 138 1 029 287 533 295 365 390 1 488Liver cancer 63 113 282 115 146 347 431 265 4 432Pancreas cancer 17 32 378 111 205 65 131 152 365Trachea/bronchus/lung cancers 98 183 1 670 619 920 419 1 324 429 3 452Melanoma and other skin cancers 10 21 147 47 70 12 28 24 40Breast cancer 76 348 939 278 479 367 835 197 1 029Cervix uteri cancer 20 97 111 112 167 226 1 171 43 364Corpus uteri cancer 13 21 206 91 155 44 32 63 111Ovary cancer 16 75 238 90 160 129 225 58 250Prostate cancer 25 37 370 70 95 49 116 70 56Bladder cancer 19 178 243 81 109 50 277 40 178Lymphomas, multiple myeloma 76 326 428 168 131 236 1 161 117 416Leukaemia 147 328 316 196 193 257 791 94 1 450Other neoplasms 128 240 185 36 62 49 281 67 261Diabetes mellitus 412 843 1 106 566 516 1 245 3 562 386 2 873Nutritional/endocrine disorders 209 633 631 174 173 449 637 218 1 278Neuropsychiatric disorders 4 342 10 680 13 733 7 058 8 431 8 340 39 974 3 795 42 722Unipolar depressive disorders 1 259 3 754 4 117 2 626 2 598 2 897 17 671 1 007 14 926Bipolar affective disorder 380 869 618 479 449 704 2 994 237 3 697Schizophrenia 471 1 037 593 577 437 1 047 3 683 231 4 348Epilepsy 123 502 245 191 186 367 1 883 65 1 105Alcohol use disorders 55 44 2 227 636 1 715 325 1 623 488 5 836Alzheimer and other dementias 101 242 1 989 399 535 369 1 213 764 2 374Parkinson disease 40 59 289 71 84 36 211 108 268Multiple sclerosis 35 75 157 63 86 63 276 29 347Drug use disorders 562 812 774 192 515 159 827 57 322Post-traumatic stress disorder 84 192 208 127 130 181 719 81 860Obsessive-compulsive disorder 191 349 257 275 277 172 837 62 765Panic disorder 186 428 322 248 239 363 1 494 124 1 680Insomnia (primary) 35 161 348 119 158 118 861 130 595Migraine 136 421 742 258 236 340 1 727 151 1 781Sense organ disorders 2 108 5 016 2 465 1 589 2 166 6 151 16 217 809 17 655Glaucoma 216 512 107 91 102 209 195 16 1 207Cataracts 570 1 873 112 149 167 3 479 7 562 29 4 581Vision loss, age-related and other 757 1 127 390 588 633 813 1 418 141 5 755Hearing loss, adult onset 564 1 497 1 855 760 1 261 1 648 7 029 623 6 109Cardiovascular diseases 2 952 9 115 8 847 8 172 16 815 6 576 36 411 2 472 29 868Rheumatic heart disease 101 476 71 123 202 242 2 376 18 1 594Hypertensive heart disease 254 642 307 522 358 518 1 138 37 2 209Ischaemic heart disease 1 376 3 956 3 572 3 380 8 511 2 804 17 930 737 6 732Cerebrovascular disease 576 1 954 2 656 2 518 5 540 1 681 8 714 1 225 16 048Inflammatory heart disease 133 423 265 360 651 173 1 338 72 678
164 <strong>The</strong> <strong>World</strong> <strong>Health</strong> <strong>Report</strong> 2003Annex Table 3 Burden of disease in DALYs by cause, sex and mortality stratum in WHO regions, a estimates for 2002Figures computed by WHO to assure comparability; b they are not necessarily the official statistics of Member States, which may use alternative rigorous methods.SEX c AFRICA THE AMERICASCause d Mortality stratum Mortality stratumBoth sexes Males Females High child, High child, Very low child, Low child, High child,high adult very high adult very low adult low adult high adultPopulation (000) 6 224 985 3 131 052 3 093 933 311 273 360 965 333 580 445 161 73 810(000) % total (000) % total (000) % total (000) (000) (000) (000) (000)Respiratory diseases 55 060 3.7 30 198 3.9 24 862 3.5 2 505 2 978 3 239 4 062 668Chronic obstructive pulmonary disease 27 708 1.9 15 275 2.0 12 433 1.7 514 668 1 743 1 420 195Asthma 15 325 1.0 8 233 1.1 7 092 1.0 952 1 260 792 1 576 278Digestive diseases 46 300 3.1 25 279 3.3 21 022 2.9 2 377 2 727 1 589 3 313 645Peptic ulcer disease 4 644 0.3 2 938 0.4 1 706 0.2 151 176 52 136 37Cirrhosis of the liver 13 909 0.9 8 587 1.1 5 322 0.7 447 510 485 1 099 206Appendicitis 393 0.0 227 0.0 166 0.0 23 26 15 39 16Diseases of the genitourinary system 15 214 1.0 8 577 1.1 6 637 0.9 986 1 101 631 1 091 244Nephritis/nephrosis 8 390 0.6 4 441 0.6 3 948 0.6 620 681 265 496 148Benign prostatic hypertrophy 2 460 0.2 2 460 0.3 … … 113 126 88 210 29Skin diseases 3 749 0.3 1 854 0.2 1 895 0.3 395 452 79 323 68Musculoskeletal diseases 30 168 2.0 13 242 1.7 16 926 2.4 1 080 1 151 1 751 2 223 311Rheumatoid arthritis 4 867 0.3 1 385 0.2 3 482 0.5 133 143 332 550 86Osteoarthritis 14 861 1.0 5 797 0.7 9 065 1.3 595 641 860 857 102Congenital abnormalities 27 402 1.8 14 142 1.8 13 260 1.9 1 384 2 072 682 2 277 364Oral diseases 7 372 0.5 3 618 0.5 3 754 0.5 269 311 308 824 150Dental caries 4 769 0.3 2 414 0.3 2 355 0.3 186 216 183 715 132Periodontal disease 302 0.0 152 0.0 150 0.0 15 17 13 21 3Edentulism 2 185 0.1 1 015 0.1 1 170 0.2 64 72 109 80 13III. Injuries 182 591 12.2 120 418 15.5 62 172 8.7 14 974 16 034 4 545 13 429 1 889Unintentional 133 468 8.9 84 434 10.9 49 033 6.8 11 621 9 918 3 133 6 810 1 451Road traffic injuries 38 660 2.6 27 218 3.5 11 441 1.6 3 654 3 537 1 368 2 579 348Poisoning 7 519 0.5 4 928 0.6 2 591 0.4 577 490 333 64 16Falls 16 232 1.1 9 956 1.3 6 276 0.9 612 456 371 645 131Fires 11 481 0.8 4 609 0.6 6 872 1.0 1 090 897 100 132 37Drowning 10 893 0.7 7 502 1.0 3 391 0.5 1 065 853 116 455 81Other unintentional injuries 48 682 3.3 30 221 3.9 18 461 2.6 4 623 3 686 844 2 936 838Intentional 49 123 3.3 35 984 4.6 13 139 1.8 3 353 6 116 1 412 6 619 437Self-inflicted 20 836 1.4 12 403 1.6 8 432 1.2 391 505 772 652 77Violence 21 427 1.4 17 499 2.3 3 928 0.5 2 343 2 952 629 5 659 358War 6 505 0.4 5 792 0.7 713 0.1 619 2 659 1 283 2a See list of Member States by WHO region and mortality stratum.b See explanatory notes for sources and methods.c <strong>World</strong> totals include residual populations living in overseas territories and areas, or outside any WHO Member State.d Estimates for specific causes may not sum to broader cause groupings owing to omission of residual categories.e Does not include liver cancer and cirrhosis deaths resulting from chronic hepatitis virus infection.… Data not available or not applicable.
Statistical Annex 165EASTERN MEDITERRANEAN EUROPE SOUTH-EAST ASIA WESTERN PACIFICCause d Mortality stratum Mortality stratum Mortality stratum Mortality stratumLow child, High child, Very low child, Low child, Low child, Low child, High child, Very low child, Low child,low adult high adult very low adult low adult high adult low adult high adult very low adult low adult142 528 360 296 415 323 222 846 239 717 298 234 1 292 598 155 400 1 562 136(000) (000) (000) (000) (000) (000) (000) (000) (000)Respiratory diseases 840 2 877 3 407 1 552 1 718 2 620 13 010 1 034 14 469Chronic obstructive pulmonary disease 346 989 1 745 674 1 001 1 420 6 740 403 9 820Asthma 280 1 006 700 358 288 614 3 821 365 3 007Digestive diseases 687 3 353 2 415 1 903 2 905 2 534 11 671 650 9 448Peptic ulcer disease 34 230 129 149 227 229 1 809 33 1 249Cirrhosis of the liver 124 1 021 909 651 1 108 666 3 676 174 2 814Appendicitis 6 16 16 10 20 18 94 5 89Diseases of the genitourinary system 375 1 175 547 540 638 905 3 180 220 3 529Nephritis/nephrosis 112 785 197 261 205 549 1 984 95 1 978Benign prostatic hypertrophy 59 138 123 65 75 125 539 51 714Skin diseases 67 270 90 67 174 332 745 21 659Musculoskeletal diseases 518 1 278 2 197 1 513 1 925 1 593 5 334 877 8 359Rheumatoid arthritis 101 228 427 277 345 122 880 142 1 090Osteoarthritis 216 548 1 187 828 1 073 893 2 302 526 4 208Congenital abnormalities 942 3 464 553 686 707 1 170 7 540 204 5 294Oral diseases 312 583 378 311 315 517 1 590 142 1 341Dental caries 197 382 201 194 163 253 1 088 75 771Periodontal disease 5 19 17 11 13 15 100 6 47Edentulism 106 174 157 105 138 239 376 59 488III. Injuries 4 763 12 714 4 073 4 062 13 180 8 217 47 330 1 656 35 347Unintentional 4 214 9 768 3 036 3 127 8 716 5 866 37 872 947 26 732Road traffic injuries 1 836 2 732 1 227 643 1 747 2 415 7 601 302 8 595Poisoning 74 266 126 126 2 004 156 1 668 36 1 572Falls 509 1 212 615 482 971 669 5 037 176 4 316Fires 292 1 091 57 153 439 459 6 095 25 603Drowning 154 651 73 167 706 397 2 343 63 3 751Other unintentional injuries 1 350 3 815 937 1 558 2 848 1 770 15 128 345 7 895Intentional 549 2 946 1 037 935 4 464 2 351 9 459 709 8 614Self-inflicted 261 749 889 533 1 981 961 6 230 668 6 152Violence 244 1 031 134 256 1 876 936 2 644 38 2 260War 26 1 115 14 130 605 437 437 2 139
166 <strong>The</strong> <strong>World</strong> <strong>Health</strong> <strong>Report</strong> 2003Annex Table 4 <strong>Health</strong>y life expectancy (HALE) in all Member States, estimates for 2002Figures computed by WHO to assure comparability; a they are not necessarily the official statistics of Member States, which may use alternative rigorous methods.<strong>Health</strong>y life expectancy (HALE)Expectation of Percentage(years) lost healthy of total lifeTotalpopulation Males Femalesyears at birth(years)expectancylostMember State At birth At birth Uncertainty At age 60 Uncertainty At birth Uncertainty At age 60 Uncertainty Males Females Males Femalesinterval interval interval interval1 Afghanistan 35.5 35.3 26.7 - 40.4 8.6 8.0 - 9.1 35.8 26.3 - 43.5 9.5 9.0 - 10.2 6.6 7.7 15.8 17.72 Albania 61.4 59.5 58.0 - 60.8 10.5 9.6 - 11.2 63.3 61.7 - 63.9 13.9 13.1 - 14.6 7.8 10.8 11.6 14.63 Algeria 60.6 59.7 58.2 - 61.1 12.5 12.2 - 12.8 61.6 60.4 - 63.2 13.3 12.9 - 13.6 7.9 9.6 11.7 13.54 Andorra 72.2 69.8 68.5 - 70.7 16.6 15.9 - 16.9 74.6 73.7 - 75.5 19.9 19.4 - 20.3 7.0 9.1 9.2 10.85 Angola 33.4 31.6 25.0 - 36.4 8.1 7.6 - 8.7 35.1 28.1 - 42.1 9.6 9.2 - 10.6 6.3 6.9 16.6 16.46 Antigua and Barbuda 61.9 60.1 58.6 - 61.7 11.6 11.3 - 12.0 63.6 62.4 - 65.3 13.8 13.4 - 14.3 8.9 10.3 12.8 13.97 Argentina 65.3 62.5 61.8 - 63.2 13.0 12.8 - 13.2 68.1 67.5 - 68.8 16.5 16.3 - 16.7 8.3 10.0 11.7 12.88 Armenia 61.0 59.4 58.3 - 60.5 10.9 10.5 - 11.3 62.6 61.1 - 63.1 13.3 12.3 - 13.8 7.6 10.4 11.3 14.29 Australia 72.6 70.9 70.2 - 71.4 16.9 16.6 - 17.1 74.3 73.7 - 75.1 19.5 19.2 - 19.8 7.0 8.7 9.0 10.410 Austria 71.4 69.3 68.6 - 70.0 16.2 16.0 - 16.5 73.5 72.9 - 74.3 19.3 19.0 - 19.6 7.1 8.6 9.3 10.511 Azerbaijan 57.2 55.8 54.5 - 57.2 10.6 10.3 - 10.9 58.7 57.0 - 59.4 12.4 11.8 - 12.9 7.2 10.0 11.4 14.612 Bahamas 63.3 60.9 59.6 - 62.0 13.3 13.0 - 13.7 65.7 64.6 - 66.9 15.6 15.0 - 16.3 8.1 9.5 11.7 12.613 Bahrain 64.3 64.2 63.2 - 65.5 11.5 10.6 - 12.7 64.4 63.6 - 65.8 11.6 11.1 - 12.6 7.9 10.1 10.9 13.614 Bangladesh 54.3 55.3 54.0 - 56.7 11.1 10.8 - 11.5 53.3 52.2 - 54.7 11.1 10.8 - 11.4 7.3 9.3 11.7 14.815 Barbados 65.6 62.9 61.9 - 64.1 13.1 12.8 - 13.5 68.2 67.0 - 69.5 16.6 16.1 - 17.2 7.6 9.8 10.7 12.516 Belarus 60.7 56.6 55.7 - 57.5 10.5 10.1 - 10.9 64.9 63.6 - 65.5 14.6 14.3 - 14.9 6.1 9.4 9.7 12.617 Belgium 71.1 68.9 68.3 - 69.5 15.7 15.4 - 15.9 73.3 72.8 - 74.1 19.1 18.9 - 19.4 6.3 8.2 8.3 10.118 Belize 60.3 58.4 57.0 - 59.8 11.5 11.2 - 11.8 62.2 61.2 - 63.4 13.3 13.0 - 13.6 9.0 10.2 13.3 14.119 Benin 44.0 43.4 37.6 - 48.5 9.7 8.8 - 10.8 44.5 37.4 - 50.9 10.4 9.5 - 11.6 6.6 7.9 13.3 15.020 Bhutan 52.9 52.9 46.3 - 58.8 10.8 9.6 - 12.6 52.9 45.5 - 57.5 11.3 10.0 - 12.3 7.3 9.5 12.1 15.221 Bolivia 54.4 53.6 47.5 - 59.2 10.9 9.5 - 12.6 55.2 47.8 - 59.6 12.1 10.6 - 13.3 8.2 9.4 13.2 14.622 Bosnia and Herzegovina 64.3 62.3 60.8 - 63.9 12.4 12.0 - 13.0 66.4 64.7 - 67.2 15.4 15.0 - 16.0 7.0 10.0 10.2 13.123 Botswana 35.7 36.0 34.4 - 40.0 10.9 10.7 - 13.0 35.4 33.9 - 39.5 11.9 11.7 - 13.5 4.2 5.2 10.4 12.924 Brazil 59.8 57.2 56.3 - 58.0 11.6 11.4 - 11.8 62.4 61.7 - 63.3 13.7 13.4 - 13.9 8.5 9.8 13.0 13.625 Brunei Darussalam 65.3 65.1 63.8 - 66.4 13.1 12.5 - 13.8 65.5 64.7 - 66.6 13.3 13.0 - 13.7 9.7 11.9 13.0 15.426 Bulgaria 64.6 62.5 61.6 - 63.3 12.4 12.1 - 12.7 66.8 66.0 - 67.7 14.9 14.6 - 15.3 6.2 8.5 9.1 11.327 Burkina Faso 35.6 34.9 30.3 - 40.3 8.6 8.1 - 9.7 36.3 30.2 - 42.4 9.7 9.2 - 10.8 5.6 6.3 13.9 14.828 Burundi 35.1 33.4 29.3 - 38.8 8.6 7.9 - 10.0 36.8 32.0 - 43.9 10.4 9.5 - 12.0 5.3 6.2 13.7 14.429 Cambodia 47.5 45.6 39.5 - 49.9 9.7 8.7 - 10.7 49.5 42.5 - 54.0 11.0 10.0 - 12.0 6.3 7.6 12.1 13.330 Cameroon 41.5 41.1 36.8 - 47.2 9.7 8.9 - 11.6 41.8 36.3 - 48.4 10.4 9.6 - 12.0 6.0 7.3 12.8 14.831 Canada 72.0 70.1 69.5 - 70.7 16.1 15.8 - 16.3 74.0 73.4 - 74.6 19.3 19.0 - 19.5 7.1 8.3 9.2 10.032 Cape Verde 60.8 58.8 55.1 - 62.6 11.8 10.7 - 13.1 62.9 60.5 - 65.5 13.4 12.5 - 14.3 7.9 10.0 11.8 13.733 Central African Republic 37.4 37.0 32.5 - 42.9 9.6 8.9 - 11.2 37.7 32.5 - 43.6 10.4 9.7 - 11.9 5.1 6.1 12.0 13.834 Chad 40.7 39.7 33.2 - 45.2 9.2 8.5 - 10.2 41.7 35.1 - 48.5 10.0 9.3 - 11.2 6.4 7.6 13.9 15.535 Chile 67.3 64.9 64.2 - 65.7 13.9 13.5 - 14.3 69.7 69.2 - 70.5 16.8 16.6 - 17.1 8.5 10.3 11.5 12.936 China 64.1 63.1 62.2 - 63.9 13.1 12.9 - 13.4 65.2 64.3 - 66.2 14.7 14.4 - 15.0 6.5 7.6 9.3 10.437 Colombia 62.0 57.8 57.7 - 59.1 12.6 12.4 - 12.8 66.3 65.6 - 67.4 15.4 15.0 - 15.8 9.7 10.0 14.4 13.138 Comoros 54.6 53.9 47.3 - 59.4 10.8 9.4 - 12.6 55.3 48.2 - 60.0 11.5 10.1 - 12.6 7.8 9.6 12.6 14.839 Congo 46.3 45.3 39.9 - 51.7 10.4 9.3 - 12.6 47.3 41.4 - 53.7 11.5 10.4 - 13.6 6.3 7.2 12.2 13.240 Cook Islands 61.6 60.6 58.9 - 61.2 11.5 11.0 - 12.0 62.7 61.7 - 63.8 12.6 12.1 - 12.7 8.6 11.5 12.5 15.541 Costa Rica 67.2 65.2 64.4 - 66.0 14.4 13.7 - 15.1 69.3 68.6 - 70.0 16.7 16.1 - 17.3 9.5 10.3 12.8 12.942 Côte d'Ivoire 39.5 37.6 32.6 - 44.2 9.5 8.8 - 11.1 41.3 36.2 - 47.7 10.7 9.9 - 12.4 5.4 6.7 12.6 13.943 Croatia 66.6 63.8 63.2 - 64.6 12.5 12.4 - 12.9 69.3 68.4 - 70.0 16.1 15.5 - 16.2 7.2 9.3 10.1 11.844 Cuba 68.3 67.1 66.1 - 67.9 15.2 14.8 - 15.4 69.5 68.8 - 70.3 16.7 16.4 - 16.9 7.9 9.8 10.5 12.445 Cyprus 67.6 66.7 65.9 - 67.5 14.2 13.8 - 14.6 68.5 67.1 - 70.0 15.0 14.1 - 16.0 8.8 10.6 11.7 13.446 Czech Republic 68.4 65.9 65.2 - 66.5 13.5 13.3 - 13.7 70.9 70.2 - 71.7 16.8 16.5 - 17.1 6.6 8.1 9.1 10.347 Democratic People'sRepublic of Korea 58.8 58.0 50.9 - 64.2 12.1 10.5 - 14.4 59.7 51.6 - 65.7 13.2 11.4 - 14.9 6.4 7.4 10.0 11.048 Democratic Republicof the Congo 37.1 35.0 29.6 - 39.5 8.6 7.9 - 9.4 39.1 32.6 - 44.4 10.2 9.5 - 11.1 6.0 7.0 14.7 15.149 Denmark 69.8 68.6 68.0 - 69.1 15.2 15.0 - 15.4 71.1 70.6 - 71.8 17.2 16.9 - 17.4 6.3 8.4 8.4 10.550 Djibouti 42.9 42.5 37.8 - 48.9 9.8 9.0 - 11.7 43.2 37.7 - 49.7 10.6 9.6 - 12.2 6.1 7.4 12.6 14.7
Statistical Annex 167<strong>Health</strong>y life expectancy (HALE)Expectation of Percentage(years) lost healthy of total lifeTotalpopulation Males Femalesyears at birth(years)expectancylostMember State At birth At birth Uncertainty At age 60 Uncertainty At birth Uncertainty At age 60 Uncertainty Males Females Males Femalesinterval interval interval interval51 Dominica 63.7 61.9 60.5 - 63.1 13.8 13.4 - 14.1 65.6 64.3 - 67.2 15.3 14.9 - 15.7 9.1 10.2 12.9 13.552 Dominican Republic 59.6 57.2 54.7 - 59.7 11.3 11.1 - 11.6 61.9 60.9 - 63.1 13.7 13.4 - 13.9 7.7 9.6 11.9 13.453 Ecuador 61.9 59.8 58.9 - 60.6 13.2 13.0 - 13.5 64.1 63.3 - 65.1 15.2 14.9 - 15.4 8.1 9.4 11.9 12.854 Egypt 59.0 57.8 57.0 - 58.2 9.9 9.7 - 10.1 60.2 59.6 - 60.9 11.3 11.0 - 11.4 7.4 8.8 11.4 12.855 El Salvador 59.7 57.2 55.9 - 58.5 12.6 12.4 - 12.9 62.3 61.5 - 63.3 14.1 13.8 - 14.3 9.3 10.4 14.0 14.356 Equatorial Guinea 45.5 44.7 38.7 - 50.3 9.7 8.8 - 10.9 46.3 39.7 - 52.2 10.5 9.7 - 11.7 7.2 8.5 13.9 15.557 Eritrea 50.0 49.3 39.0 - 53.3 10.6 8.9 - 12.0 50.8 43.7 - 56.4 11.3 9.9 - 12.7 6.5 8.6 11.7 14.558 Estonia 64.1 59.2 58.6 - 59.8 11.9 11.4 - 12.2 69.0 67.5 - 70.5 16.5 16.3 - 16.9 6.0 8.1 9.2 10.559 Ethiopia 41.2 40.7 34.6 - 46.7 9.7 8.9 - 11.0 41.7 35.6 - 48.2 10.2 9.5 - 11.6 6.1 7.7 13.0 15.660 Fiji 58.8 56.9 56.4 - 58.6 10.4 10.1 - 10.7 60.6 60.1 - 62.4 11.9 11.5 - 12.4 7.7 9.7 12.0 13.861 Finland 71.1 68.7 68.0 - 69.3 15.7 15.4 - 15.9 73.5 72.7 - 74.1 18.9 18.5 - 19.1 6.1 8.0 8.1 9.962 France 72.0 69.3 68.6 - 70.0 16.5 16.2 - 16.8 74.7 74.0 - 75.4 20.3 20.0 - 20.6 6.6 8.8 8.7 10.663 Gabon 51.4 50.2 44.5 - 56.4 10.6 9.4 - 12.7 52.6 45.9 - 58.6 11.6 10.2 - 13.5 7.1 8.8 12.4 14.364 Gambia 49.5 48.5 42.0 - 54.1 10.4 9.3 - 11.7 50.5 43.1 - 56.2 11.2 10.1 - 12.4 6.9 8.4 12.5 14.265 Georgia 64.4 62.2 61.1 - 63.3 12.6 12.3 - 13.0 66.6 64.8 - 67.7 14.6 13.3 - 15.1 6.2 8.4 9.1 11.266 Germany 71.8 69.6 68.9 - 70.4 15.9 15.6 - 16.2 74.0 73.4 - 74.8 19.0 18.8 - 19.3 5.9 7.6 7.8 9.367 Ghana 49.8 49.2 43.3 - 55.8 10.5 9.3 - 12.4 50.3 43.8 - 56.3 11.2 10.0 - 12.8 7.2 8.5 12.7 14.468 Greece 71.0 69.1 68.4 - 69.7 16.0 15.8 - 16.3 72.9 72.3 - 73.8 18.1 17.7 - 18.4 6.7 8.1 8.9 10.069 Grenada 59.2 58.4 57.0 - 59.7 11.1 10.8 - 11.5 60.0 58.8 - 61.3 12.6 12.3 - 12.9 7.5 8.9 11.4 12.970 Guatemala 57.4 54.9 53.6 - 56.2 12.3 11.9 - 12.7 59.9 58.6 - 61.4 13.3 13.0 - 13.6 8.2 9.1 13.0 13.271 Guinea 44.8 43.9 38.2 - 49.0 9.6 8.7 - 10.7 45.6 38.9 - 51.7 10.5 9.6 - 11.6 7.0 8.2 13.7 15.272 Guinea-Bissau 40.5 39.6 33.1 - 44.1 9.2 8.5 - 10.0 41.5 34.3 - 48.0 10.1 9.4 - 11.0 6.1 7.2 13.4 14.773 Guyana 55.2 53.1 50.6 - 55.9 10.2 9.9 - 10.6 57.2 54.6 - 59.9 12.2 11.8 - 12.7 8.4 9.7 13.6 14.574 Haiti 43.8 43.5 38.1 - 48.7 10.3 9.2 - 11.9 44.1 37.9 - 49.1 11.7 10.5 - 12.9 5.6 6.9 11.4 13.675 Honduras 58.4 56.3 53.1 - 59.2 11.4 10.4 - 12.6 60.5 58.1 - 62.9 13.1 12.3 - 14.0 7.9 9.9 12.4 14.076 Hungary 64.9 61.5 60.9 - 62.2 12.2 12.0 - 12.3 68.2 67.6 - 69.0 15.9 15.7 - 16.2 6.9 8.6 10.0 11.277 Iceland 72.8 72.1 71.2 - 72.9 17.5 17.1 - 17.9 73.6 72.7 - 74.2 18.7 18.2 - 18.9 6.3 8.2 8.1 10.078 India 53.5 53.3 52.5 - 54.1 10.8 10.6 - 11.0 53.6 52.7 - 54.6 11.4 11.0 - 11.8 6.8 8.4 11.3 13.679 Indonesia 58.1 57.4 56.6 - 58.4 10.7 10.5 - 11.0 58.9 58.1 - 59.9 11.5 11.3 - 11.8 7.5 9.1 11.5 13.480 Iran, Islamic Republic of 57.6 56.1 54.9 - 57.3 10.4 10.2 - 10.7 59.1 58.2 - 60.5 11.9 11.6 - 12.2 10.4 12.5 15.7 17.581 Iraq 50.1 48.8 47.0 - 50.4 9.2 8.9 - 9.5 51.5 50.1 - 53.4 10.6 10.3 - 10.9 10.3 11.6 17.5 18.482 Ireland 69.8 68.1 67.3 - 68.9 14.8 14.4 - 15.2 71.5 70.8 - 72.3 17.5 17.2 - 17.8 6.3 8.2 8.5 10.383 Israel 71.4 70.5 69.4 - 71.2 16.8 16.4 - 17.2 72.3 71.6 - 73.1 18.2 17.6 - 18.8 6.9 9.0 8.9 11.184 Italy 72.7 70.7 70.0 - 71.5 16.4 16.0 - 16.7 74.7 74.0 - 75.5 19.4 19.1 - 19.8 6.0 7.8 7.8 9.585 Jamaica 65.1 64.2 62.8 - 65.6 13.0 12.6 - 13.5 65.9 64.9 - 67.2 14.5 14.1 - 14.9 6.9 8.6 9.7 11.586 Japan 75.0 72.3 71.5 - 73.1 17.5 17.2 - 17.8 77.7 76.9 - 78.1 21.7 21.4 - 22.0 6.1 7.5 7.8 8.887 Jordan 61.0 59.7 58.2 - 60.3 11.1 10.8 - 11.4 62.3 61.4 - 63.0 12.9 12.5 - 13.1 9.0 10.9 13.1 14.988 Kazakhstan 55.9 52.6 51.6 - 53.7 9.7 8.1 - 12.0 59.3 58.0 - 60.0 12.5 12.2 - 12.8 6.1 9.6 10.4 13.989 Kenya 44.4 44.1 39.8 - 51.2 10.7 9.5 - 13.2 44.8 39.9 - 51.6 11.5 10.3 - 13.5 5.7 7.1 11.5 13.790 Kiribati 54.0 52.3 51.1 - 53.4 11.5 11.2 - 11.9 55.6 54.7 - 57.0 11.6 11.3 - 11.9 9.5 11.0 15.4 16.591 Kuwait 67.0 67.4 66.3 - 68.7 14.2 13.3 - 15.1 66.6 65.0 - 68.4 13.6 12.3 - 14.8 8.4 10.2 11.1 13.392 Kyrgyzstan 55.3 52.2 51.2 - 53.3 9.8 9.4 - 10.2 58.4 56.9 - 59.1 12.6 12.3 - 12.9 8.2 10.6 13.5 15.393 Lao People'sDemocratic Republic 47.0 47.1 44.8 - 49.6 9.6 9.4 - 9.9 47.0 44.7 - 49.5 10.1 9.8 - 10.4 7.0 9.2 12.9 16.494 Latvia 62.8 58.0 57.2 - 59.2 11.3 10.9 - 11.7 67.5 66.7 - 68.5 15.7 15.5 - 16.1 6.6 8.3 10.2 10.995 Lebanon 60.4 59.2 57.9 - 60.4 11.3 10.9 - 11.6 61.6 60.7 - 62.9 12.6 12.3 - 13.0 8.4 10.4 12.5 14.596 Lesotho 31.4 29.6 27.1 - 35.2 9.9 9.3 - 12.9 33.2 29.9 - 40.0 11.0 10.1 - 13.4 3.3 5.0 10.1 13.197 Liberia 35.3 33.6 27.4 - 38.7 7.9 7.3 - 8.6 37.0 29.8 - 43.2 9.7 9.2 - 10.7 6.5 6.7 16.1 15.498 Libyan Arab Jamahiriya 63.7 62.3 59.1 - 65.2 12.0 10.9 - 13.3 65.0 63.2 - 67.2 13.8 13.0 - 14.7 8.1 10.5 11.5 13.999 Lithuania 63.3 58.9 58.1 - 60.1 12.0 11.8 - 12.3 67.7 67.0 - 68.6 16.2 15.9 - 16.5 7.2 9.9 10.9 12.8100 Luxembourg 71.5 69.3 68.6 - 69.9 16.0 15.7 - 16.3 73.7 73.1 - 74.7 19.2 18.9 - 19.6 6.4 8.0 8.4 9.8
168 <strong>The</strong> <strong>World</strong> <strong>Health</strong> <strong>Report</strong> 2003Annex Table 4 <strong>Health</strong>y life expectancy (HALE) in all Member States, estimates for 2002Figures computed by WHO to assure comparability; a they are not necessarily the official statistics of Member States, which may use alternative rigorous methods.<strong>Health</strong>y life expectancy (HALE)Expectation of Percentage(years) lost healthy of total lifeTotalpopulation Males Femalesyears at birth(years)expectancylostMember State At birth At birth Uncertainty At age 60 Uncertainty At birth Uncertainty At age 60 Uncertainty Males Females Males Femalesinterval interval interval interval101 Madagascar 48.6 47.3 40.8 - 52.3 10.1 9.1 - 11.1 49.9 42.5 - 54.8 11.1 10.0 - 12.0 7.2 8.4 13.1 14.4102 Malawi 34.9 35.0 31.6 - 40.5 9.7 9.0 - 11.4 34.8 30.8 - 40.7 10.4 9.7 - 11.9 4.8 5.8 12.1 14.3103 Malaysia 63.2 61.6 60.8 - 62.5 10.9 10.7 - 11.1 64.8 64.1 - 65.6 12.0 11.8 - 12.3 8.0 10.0 11.4 13.3104 Maldives 57.8 59.0 58.1 - 60.5 10.5 10.3 - 10.7 56.6 55.7 - 57.7 9.4 9.2 - 9.6 7.5 9.0 11.3 13.8105 Mali 37.9 37.5 31.0 - 42.0 8.8 8.2 - 9.4 38.3 31.4 - 44.7 9.5 8.9 - 10.3 6.4 7.4 14.6 16.1106 Malta 71.0 69.7 68.9 - 70.5 15.3 14.8 - 15.7 72.3 71.4 - 73.4 17.6 17.0 - 18.3 6.2 8.0 8.1 10.0107 Marshall Islands 54.8 53.9 52.3 - 55.7 9.8 9.6 - 10.1 55.7 54.4 - 57.3 10.7 10.4 - 10.9 7.2 8.9 11.7 13.8108 Mauritania 44.5 42.8 36.0 - 47.5 9.5 8.6 - 10.2 46.3 38.4 - 51.4 10.5 9.7 - 11.4 6.9 8.2 14.0 15.1109 Mauritius 62.4 60.3 59.2 - 61.3 11.7 11.4 - 12.0 64.6 63.8 - 65.6 13.8 13.6 - 14.1 8.1 10.9 11.9 14.5110 Mexico 65.5 63.4 62.6 - 64.1 14.5 14.2 - 14.8 67.6 67.0 - 68.4 16.3 16.0 - 16.5 8.4 9.3 11.6 12.1111 Micronesia,Federated States of 57.7 57.0 55.2 - 59.0 10.9 10.6 - 11.3 58.4 56.6 - 60.4 11.5 11.2 - 11.9 7.9 9.6 12.2 14.2112 Monaco 72.9 70.7 70.0 - 71.4 17.3 17.1 - 17.6 75.2 74.4 - 76.0 20.5 20.1 - 20.9 7.1 9.3 9.1 11.0113 Mongolia 55.6 53.3 52.4 - 54.4 10.2 10.0 - 10.4 58.0 57.1 - 58.9 12.4 12.2 - 12.6 6.8 8.0 11.3 12.1114 Morocco 60.2 59.5 58.2 - 60.7 11.4 11.0 - 11.8 60.9 59.9 - 62.2 12.7 12.3 - 13.1 9.4 11.9 13.6 16.4115 Mozambique 36.9 36.3 29.5 - 39.2 9.8 9.0 - 11.1 37.5 30.1 - 41.3 10.4 9.7 - 11.7 4.9 6.4 11.9 14.5116 Myanmar 51.7 49.9 43.2 - 55.9 10.1 9.1 - 11.6 53.5 45.5 - 58.8 11.3 10.0 - 12.5 6.3 8.4 11.2 13.5117 Namibia 43.3 42.9 39.8 - 49.1 11.2 9.9 - 14.8 43.8 39.2 - 49.7 12.1 10.6 - 14.8 5.2 6.7 10.8 13.3118 Nauru 55.1 52.7 49.6 - 56.2 8.7 8.1 - 9.6 57.5 55.0 - 60.5 10.5 10.0 - 11.4 6.9 9.0 11.6 13.5119 Nepal 51.8 52.5 51.3 - 53.6 10.5 10.3 - 10.8 51.1 50.2 - 52.3 10.8 10.5 - 11.0 7.4 9.1 12.4 15.1120 Netherlands 71.2 69.7 69.1 - 70.4 15.5 15.2 - 15.8 72.6 72.0 - 73.4 18.4 18.1 - 18.7 6.3 8.5 8.3 10.4121 New Zealand 70.8 69.5 68.8 - 70.2 16.0 15.7 - 16.3 72.2 71.5 - 73.0 18.2 17.8 - 18.5 7.2 9.0 9.3 11.1122 Nicaragua 61.4 59.7 58.4 - 60.3 13.0 12.8 - 13.3 63.1 61.9 - 64.0 14.5 14.3 - 14.9 8.2 9.3 12.0 12.9123 Niger 35.5 35.8 26.8 - 41.3 8.5 7.9 - 9.2 35.2 26.2 - 42.5 9.3 8.9 - 10.0 6.8 7.5 15.9 17.5124 Nigeria 41.5 41.3 35.2 - 45.6 9.3 8.5 - 10.4 41.8 34.9 - 47.7 10.0 9.3 - 11.2 6.8 7.8 14.1 15.6125 Niue 60.4 58.9 55.7 - 61.4 11.6 10.5 - 12.7 62.0 59.9 - 64.3 12.8 12.0 - 13.6 8.6 11.3 12.8 15.5126 Norway 72.0 70.4 69.5 - 71.3 16.2 15.7 - 16.6 73.6 72.8 - 74.4 18.9 18.5 - 19.1 5.9 8.1 7.8 9.9127 Oman 64.0 62.7 59.9 - 65.3 11.9 10.7 - 13.1 65.3 63.4 - 67.1 13.7 12.9 - 14.6 8.3 11.1 11.8 14.5128 Pakistan 53.3 54.2 52.5 - 56.0 11.4 11.0 - 11.7 52.3 50.7 - 54.4 11.4 11.1 - 11.7 6.9 9.3 11.3 15.0129 Palau 59.6 58.7 57.9 - 59.7 10.2 10.0 - 10.4 60.5 59.6 - 61.7 12.0 11.8 - 12.4 7.7 10.4 11.5 14.7130 Panama 66.2 64.3 63.2 - 65.4 14.9 14.5 - 15.4 68.0 67.2 - 69.2 16.8 16.4 - 17.2 8.5 10.2 11.7 13.0131 Papua New Guinea 51.9 51.4 49.7 - 53.6 10.1 9.8 - 10.3 52.4 50.9 - 54.4 10.6 10.3 - 10.9 7.0 9.1 12.0 14.8132 Paraguay 61.9 59.6 58.5 - 60.6 11.7 11.2 - 12.0 64.2 63.3 - 65.1 14.6 14.1 - 14.7 9.1 10.5 13.2 14.0133 Peru 61.0 59.6 58.4 - 60.7 12.7 12.4 - 13.1 62.4 61.4 - 63.6 14.4 14.1 - 14.7 7.9 9.6 11.7 13.3134 Philippines 59.3 57.1 56.2 - 58.1 10.6 10.4 - 10.8 61.5 60.6 - 62.6 12.1 11.9 - 12.4 8.0 10.2 12.4 14.3135 Poland 65.8 63.1 62.4 - 63.8 12.8 12.6 - 13.0 68.5 67.9 - 69.2 16.1 15.8 - 16.3 7.5 10.2 10.6 13.0136 Portugal 69.2 66.7 66.0 - 67.4 14.9 14.7 - 15.2 71.7 71.1 - 72.5 17.7 17.4 - 17.9 6.9 8.8 9.4 10.9137 Qatar 65.2 66.7 65.6 - 67.6 13.7 13.1 - 14.4 63.8 62.4 - 65.4 11.2 10.2 - 12.3 8.2 10.0 10.9 13.6138 Republic of Korea 67.8 64.8 64.1 - 65.6 13.2 13.0 - 13.5 70.8 70.1 - 71.6 17.1 16.8 - 17.3 6.9 8.6 9.7 10.8139 Republic of Moldova 59.8 57.2 56.2 - 58.2 11.0 10.8 - 11.1 62.4 61.2 - 62.9 13.2 12.9 - 13.4 6.8 9.2 10.6 12.9140 Romania 63.1 61.0 59.9 - 62.1 12.3 12.1 - 12.6 65.2 64.3 - 66.3 14.6 14.2 - 15.0 7.0 9.7 10.3 13.0141 Russian Federation 58.6 52.8 51.9 - 54.0 10.1 7.0 - 13.2 64.3 63.6 - 65.4 14.2 13.9 - 14.4 5.6 7.8 9.6 10.8142 Rwanda 38.3 36.4 33.0 - 42.5 9.0 8.3 - 10.4 40.2 35.6 - 47.4 10.5 9.7 - 11.8 5.6 6.6 13.3 14.1143 Saint Kitts and Nevis 61.5 59.9 59.0 - 61.0 11.9 11.6 - 12.2 63.1 61.9 - 64.3 13.5 13.2 - 13.8 8.7 9.1 12.7 12.7144 Saint Lucia 62.7 61.2 60.0 - 62.5 12.5 12.2 - 12.8 64.2 63.0 - 65.7 14.4 14.1 - 14.8 8.6 10.2 12.3 13.7145 Saint Vincentand the Grenadines 61.0 59.9 58.6 - 61.3 12.6 12.4 - 12.9 62.2 61.0 - 63.6 14.2 13.6 - 14.8 7.9 9.8 11.7 13.6146 Samoa 59.7 59.2 58.1 - 60.3 10.9 10.7 - 11.2 60.3 59.3 - 61.6 11.6 11.3 - 11.9 7.6 9.4 11.3 13.5147 San Marino 73.4 70.9 69.4 - 72.3 16.2 15.3 - 17.1 75.9 75.0 - 78.0 19.9 19.5 - 21.6 6.3 8.1 8.2 9.6148 Sao Tome and Principe 54.4 54.2 47.7 - 59.7 11.0 9.6 - 12.7 54.7 46.7 - 59.5 11.4 10.1 - 12.6 7.5 9.0 12.2 14.1149 Saudi Arabia 61.4 59.8 56.5 - 63.1 11.2 10.2 - 12.5 62.9 60.7 - 65.2 13.0 12.2 - 13.9 8.6 11.0 12.6 14.9150 Senegal 48.0 47.1 41.0 - 52.1 9.9 8.9 - 11.1 48.9 41.9 - 54.4 10.7 9.8 - 11.9 7.3 8.4 13.4 14.7
Statistical Annex 169<strong>Health</strong>y life expectancy (HALE)Expectation of Percentage(years) lost healthy of total lifeTotalpopulation Males Femalesyears at birth(years)expectancylostMember State At birth At birth Uncertainty At age 60 Uncertainty At birth Uncertainty At age 60 Uncertainty Males Females Males Femalesinterval interval interval interval151 Serbia and Montenegro 63.8 62.7 62.0 - 63.5 12.1 11.8 - 12.4 64.9 63.7 - 65.3 13.9 13.7 - 14.2 7.0 10.0 10.1 13.3152 Seychelles 61.2 57.4 56.4 - 58.4 9.9 9.6 - 10.1 64.9 63.8 - 66.2 14.0 13.6 - 14.5 9.6 12.3 14.3 15.9153 Sierra Leone 28.6 27.2 19.4 - 32.6 7.8 7.4 - 8.3 29.9 21.7 - 37.7 9.2 8.9 - 10.0 5.1 5.8 15.9 16.2154 Singapore 70.1 68.8 67.7 - 70.0 14.5 14.0 - 15.1 71.3 70.6 - 72.1 16.3 15.9 - 16.5 8.6 10.4 11.1 12.7155 Slovakia 66.2 63.0 62.3 - 63.8 12.3 12.1 - 12.5 69.4 68.7 - 70.2 16.1 15.9 - 16.4 6.7 8.9 9.6 11.4156 Slovenia 69.5 66.6 65.8 - 67.4 14.3 14.0 - 14.5 72.3 71.6 - 73.1 18.1 17.8 - 18.3 6.1 8.2 8.4 10.2157 Solomon Islands 56.2 55.4 53.4 - 57.6 10.9 10.5 - 11.4 57.1 55.7 - 58.8 11.6 11.2 - 11.9 8.3 10.3 13.0 15.3158 Somalia 36.8 36.1 30.5 - 40.4 8.3 7.6 - 9.0 37.5 29.6 - 43.3 9.4 8.9 - 10.2 6.9 8.1 16.1 17.7159 South Africa 44.3 43.3 39.8 - 46.8 10.6 10.0 - 12.0 45.3 39.8 - 50.8 12.1 11.5 - 13.1 5.5 7.3 11.3 13.8160 Spain 72.6 69.9 69.1 - 70.7 16.4 16.1 - 16.8 75.3 74.6 - 76.1 19.9 19.6 - 20.2 6.2 7.7 8.2 9.3161 Sri Lanka 61.6 59.2 57.3 - 61.0 10.5 9.9 - 11.1 64.0 63.0 - 65.1 12.7 12.3 - 13.0 8.0 10.3 11.8 13.9162 Sudan 48.5 47.2 41.8 - 52.7 9.8 8.7 - 11.5 49.9 43.0 - 54.6 10.7 9.5 - 11.8 7.8 9.4 14.1 15.9163 Suriname 58.8 56.7 55.3 - 58.3 10.6 10.2 - 11.0 60.8 59.7 - 62.4 12.8 12.3 - 13.2 7.6 10.0 11.8 14.1164 Swaziland 34.2 33.2 30.9 - 36.5 10.2 9.1 - 12.1 35.2 31.5 - 38.9 10.9 9.7 - 12.5 3.7 5.2 10.1 12.9165 Sweden 73.3 71.9 71.2 - 72.5 17.1 16.8 - 17.4 74.8 74.0 - 75.5 19.6 19.3 - 19.9 6.2 7.9 7.9 9.5166 Switzerland 73.2 71.1 70.3 - 71.8 17.1 16.7 - 17.5 75.3 74.5 - 76.0 20.4 20.1 - 20.7 6.6 8.1 8.5 9.7167 Syrian Arab Republic 61.7 60.4 59.3 - 61.5 11.3 11.0 - 11.6 63.1 62.3 - 64.1 12.9 12.6 - 13.2 8.5 10.5 12.3 14.2168 Tajikistan 54.7 53.1 51.7 - 55.0 9.5 9.3 - 9.7 56.4 54.5 - 57.6 11.0 10.7 - 11.2 7.9 10.1 13.0 15.2169 Thailand 60.1 57.7 56.5 - 58.9 12.7 12.4 - 13.0 62.4 61.5 - 63.5 13.2 13.0 - 13.5 8.4 10.2 12.7 14.1170 <strong>The</strong> former YugoslavRepublic of Macedonia 63.4 61.9 61.0 - 62.8 12.2 11.9 - 12.7 65.0 63.7 - 65.6 14.0 13.6 - 14.5 7.2 10.2 10.4 13.5171 Timor-Leste 49.8 47.9 40.8 - 53.6 10.0 9.0 - 11.2 51.8 43.5 - 56.9 11.1 10.0 - 12.2 6.9 8.7 12.7 14.4172 Togo 44.6 43.5 38.0 - 48.1 9.8 8.8 - 11.0 45.7 39.6 - 50.6 10.7 9.7 - 11.9 6.5 7.7 12.9 14.3173 Tonga 61.8 61.9 61.0 - 62.7 11.9 11.7 - 12.1 61.8 61.0 - 62.7 12.0 11.8 - 12.2 8.2 9.6 11.7 13.5174 Trinidad and Tobago 62.0 59.8 58.8 - 60.8 11.9 11.6 - 12.1 64.2 63.4 - 65.1 14.1 13.9 - 14.4 7.3 8.6 10.8 11.9175 Tunisia 62.5 61.3 60.4 - 62.4 12.0 11.7 - 12.3 63.6 62.7 - 64.8 13.3 13.0 - 13.7 8.2 10.3 11.8 13.9176 Turkey 62.0 61.2 60.3 - 62.2 12.8 12.5 - 13.0 62.8 61.7 - 64.0 14.2 13.8 - 14.6 6.7 9.3 9.8 12.9177 Turkmenistan 54.4 51.6 50.8 - 52.5 9.2 8.9 - 9.5 57.2 55.9 - 57.8 11.5 11.4 - 11.8 7.1 9.7 12.2 14.5178 Tuvalu 53.0 53.0 51.3 - 54.7 9.7 9.5 - 9.8 53.1 51.1 - 54.9 10.3 9.4 - 11.8 7.0 8.3 11.7 13.6179 Uganda 42.7 41.7 37.1 - 46.1 9.8 8.9 - 11.1 43.7 37.5 - 48.0 10.9 9.8 - 11.9 6.2 7.2 12.9 14.1180 Ukraine 59.2 54.9 54.1 - 55.9 10.3 9.7 - 11.1 63.6 62.8 - 64.7 13.7 13.4 - 14.0 6.8 9.4 11.0 12.8181 United Arab Emirates 63.9 63.5 62.6 - 64.0 12.0 11.8 - 12.2 64.2 63.6 - 65.0 12.5 12.3 - 12.7 7.8 10.9 10.9 14.5182 United Kingdom 70.6 69.1 68.5 - 69.9 15.7 15.4 - 16.1 72.1 71.3 - 73.0 18.1 17.7 - 18.4 6.7 8.4 8.8 10.4183 United Republic of Tanzania 40.4 40.0 38.7 - 41.5 9.6 9.4 - 9.8 40.7 39.6 - 42.3 10.1 9.9 - 10.3 5.5 6.8 12.1 14.3184 United States of America 69.3 67.2 66.6 - 67.8 15.3 15.0 - 15.5 71.3 70.8 - 72.0 17.9 17.7 - 18.1 7.4 8.5 9.9 10.7185 Uruguay 66.2 63.0 62.1 - 63.9 13.0 12.8 - 13.3 69.4 68.6 - 70.2 17.1 16.8 - 17.4 8.0 9.9 11.3 12.5186 Uzbekistan 59.4 57.9 56.9 - 58.9 10.8 10.6 - 11.1 60.9 59.4 - 61.4 12.6 12.3 - 12.9 7.6 10.0 11.6 14.1187 Vanuatu 58.9 58.5 56.9 - 60.3 11.1 10.7 - 11.5 59.4 57.9 - 61.2 11.7 11.3 - 12.1 8.0 9.8 12.0 14.1188 Venezuela,Bolivarian Republic of 64.2 61.7 60.8 - 62.6 13.9 13.6 - 14.2 66.7 66.0 - 67.6 15.7 15.4 - 15.9 9.3 10.1 13.1 13.1189 Viet Nam 61.3 59.8 58.7 - 60.9 11.4 11.2 - 11.7 62.9 62.0 - 64.2 13.1 12.8 - 13.4 7.4 9.3 11.0 12.9190 Yemen 49.3 48.0 42.3 - 52.6 8.7 7.7 - 9.9 50.7 44.2 - 55.2 10.4 9.2 - 11.4 10.8 11.5 18.4 18.5191 Zambia 34.9 34.8 30.8 - 38.7 9.8 8.9 - 11.0 35.0 30.8 - 39.4 10.4 9.6 - 11.6 4.3 5.3 11.0 13.1192 Zimbabwe 33.6 33.8 31.9 - 36.0 9.7 9.4 - 9.9 33.3 31.5 - 36.0 10.6 10.4 - 10.9 3.9 4.7 10.4 12.3a See explanatory notes for sources and methods.
170 <strong>The</strong> <strong>World</strong> <strong>Health</strong> <strong>Report</strong> 2003 Statistical Annex 171Annex Table 5 Selected national health accounts indicators: measured levels of expenditure on health, 1997–2001Figures computed by WHO to assure comparability; a they are not necessarily the official statistics of Member States, which may use alternative rigorous methods.Member State Total expenditure General government Private expenditure General governmenton health expenditure on health as % of on health as % of expenditure on health as % ofas % of GDP total expenditure on health total expenditure on health total government expenditure1997 1998 1999 2000 2001 1997 1998 1999 2000 2001 1997 1998 1999 2000 2001 1997 1998 1999 2000 20011 Afghanistan 5.6 5.5 5.5 5 5.2 50 52.8 53.1 53.8 52.6 50 47.2 46.9 46.2 47.4 14 14.6 14.8 13.5 11.82 Albania 3.8 3.4 3.6 3.8 3.7 61.2 61.9 62.3 63.9 64.6 38.8 38.1 37.7 36.1 35.4 7.8 6.9 6.9 7.7 7.33 Algeria 3.4 3.6 3.6 3.8 4.1 71.7 70.5 69.6 70.6 75 28.3 29.5 30.4 29.4 25 7.9 8.2 8.5 9.3 9.94 Andorra 5.7 7.8 5.9 5.5 5.7 71.5 78.6 71.6 70.1 71 28.5 21.4 28.4 29.9 29 32.5 39.2 31.8 32 26.35 Angola 3.9 3.5 3.3 3.5 4.4 45.2 39.8 44.3 55.8 63.1 54.8 60.2 55.7 44.2 36.9 4.6 2.5 2.4 3.3 5.56 Antigua and Barbuda 5.4 5.3 5.3 5.5 5.6 61.9 62.5 61.3 59.9 60.9 38.1 37.5 38.7 40.1 39.1 14.2 14.5 13.9 14.1 137 Argentina 8.1 8.2 9 8.9 9.5 55.5 55.2 56.2 55.2 53.4 44.5 44.8 43.8 44.8 46.6 22.9 22.6 23.3 22 21.38 Armenia 7.1 7.1 7.9 8 7.8 35.2 36.8 41 40.2 41.2 64.8 63.2 59 59.8 58.8 9.4 10.8 10.5 10.6 11.59 Australia 8.5 8.6 8.7 8.9 9.2 67.8 68.2 69.1 68.9 67.9 32.2 31.8 30.9 31.1 32.1 15.8 16.2 16.8 16.5 16.810 Austria 8 8 8 8 8 70.9 71.4 70 69.7 69.3 29.1 28.6 30 30.3 30.7 10.4 10.5 10.4 10.6 10.711 Azerbaijan 2.2 2.3 2 1.7 1.6 73.4 73.1 70.3 67.9 66.9 26.6 26.9 29.7 32.1 33.1 8.8 11 8 7.3 7.212 Bahamas 5.4 5.6 5.4 5.7 5.7 55.6 57.6 57.4 56.8 57 44.4 42.4 42.6 43.2 43 13.7 15.3 15 15.9 15.113 Bahrain 4.8 5 4.8 4.1 4.1 70.5 69.7 69.3 69.1 69 29.5 30.3 30.7 30.9 31 11.9 11.5 11.4 10.8 10.814 Bangladesh 2.9 2.9 3.1 3.6 3.5 33.7 36 36.9 45.3 44.2 66.3 64 63.1 54.7 55.8 5.6 5.9 6.3 8.6 8.715 Barbados 5.9 5.9 6.1 6.2 6.5 65.2 65.6 65.7 65.9 66.3 34.8 34.4 34.3 34.1 33.7 11.7 11.8 12 12 11.516 Belarus 6.1 5.7 5.8 5.4 5.6 87.2 86.1 85.5 85.4 86.7 12.8 13.9 14.5 14.6 13.3 11.6 11.9 11.7 13.1 14.217 Belgium 8.4 8.4 8.5 8.6 8.9 71.5 72 72.2 72.1 71.7 28.5 28 27.8 27.9 28.3 11.7 11.9 12.3 12.6 1318 Belize 4.7 4.9 5.1 5 5.2 51 51.7 48.6 48 45.1 49 48.3 51.4 52 54.9 5.6 5.6 5.5 5.3 519 Benin 3.7 3.8 3.9 4.2 4.4 34 36.5 38.6 43.3 46.9 66 63.5 61.4 56.7 53.1 6.7 8.5 8.7 8.9 10.920 Bhutan 3.6 3.8 3.5 3.9 3.9 90.4 90.3 89.6 90.6 90.6 9.6 9.7 10.4 9.4 9.4 10.1 9.6 8.3 9.2 7.521 Bolivia 4.7 5 5.2 5.2 5.3 63.9 65.6 66.1 67 66.3 36.1 34.4 33.9 33 33.7 9.1 10 10.4 10.3 10.322 Bosnia and Herzegovina 6.7 7.9 7.7 7.7 7.5 52.4 40.2 39.4 39.7 36.8 47.6 59.8 60.6 60.3 63.2 12.6 11.7 9.4 9.1 9.623 Botswana 5.7 5.5 6 6 6.6 58.8 59.7 60.6 62 66.2 41.2 40.3 39.4 38 33.8 7.8 7.2 7.4 8.4 7.624 Brazil 7.4 7.4 7.8 7.6 7.6 43.5 44 42.8 40.8 41.6 56.5 56 57.2 59.2 58.4 9.1 9 9.3 8.4 8.825 Brunei Darussalam 2.8 3 3.2 3.1 3.1 79.4 81.3 79.4 80 79.4 20.6 18.7 20.6 20 20.6 4.5 5.1 5.1 5.2 5.126 Bulgaria 4.7 3.9 5 4.8 4.8 82.8 79.4 83.7 82.5 82.1 17.2 20.6 16.3 17.5 17.9 10 8.1 10.5 9.3 9.327 Burkina Faso 3.5 3.5 3.8 3.5 3 67.1 65.3 66.6 63.5 60.1 32.9 34.7 33.4 36.5 39.9 9.6 9.6 8.8 8.1 8.128 Burundi 3.1 3.2 3.2 3.5 3.6 50.3 53.8 55.3 55.6 59 49.7 46.2 44.7 44.4 41 7.5 7.7 8.4 7.1 8.129 Cambodia 10.9 10.8 10.8 11.8 11.8 10.2 10.1 10.1 14.2 14.9 89.8 89.9 89.9 85.8 85.1 12.5 11.8 11.3 15.7 1630 Cameroon 3.7 3.4 3.1 3.1 3.3 21.2 19.2 22.8 33.7 37.1 78.8 80.8 77.2 66.3 62.9 5.2 4.1 4.4 7.9 7.831 Canada 8.9 9.1 9.1 9.1 9.5 70 70.7 70.4 70.9 70.8 30 29.3 29.6 29.1 29.2 13.9 14.4 15 15.5 16.232 Cape Verde 3.1 3.5 3 3.1 3.7 68.5 73 69.8 70 74.2 31.5 27 30.2 30 25.8 5 7.1 5.6 6.1 8.833 Central African Republic 3.6 4 4.1 4.3 4.5 37.9 44.4 48 49.2 51.2 62.1 55.6 52 50.8 48.8 8.4 9 10.1 13.9 18.534 Chad 2.8 2.3 2.7 3.1 2.6 78.1 72.7 75 78.7 76 21.9 27.3 25 21.3 24 12.5 10.8 11.2 12.2 15.235 Chile 6.6 6.9 6.8 6.8 7 37.8 39.6 40.8 42.6 44 62.2 60.4 59.2 57.4 56 12.1 12.4 11.8 11.9 12.736 China 4.6 4.8 5.1 5.3 5.5 40 39 38 36.6 37.2 60 61 62 63.4 62.8 14.2 13.3 11.8 10.8 10.237 Colombia 7.7 5.8 6.4 5.5 5.5 47.7 60.2 62 67.3 65.7 52.3 39.8 38 32.7 34.3 14.5 13 12.9 12.7 10.838 Comoros 3.1 3 3.1 3.1 3.1 60.3 58.6 59.6 59.7 60 39.7 41.4 40.4 40.3 40 5.9 5.1 5.8 5.7 5.839 Congo 3 3.1 2.6 2 2.1 70.3 76.9 70.6 73.3 63.8 29.7 23.1 29.4 26.7 36.2 5.7 5.6 5.7 5.6 5.740 Cook Islands 5.1 5.1 4.8 4.6 4.7 72.7 71.9 65.1 64.4 67.6 27.3 28.1 34.9 35.6 32.4 9.5 9.2 9.1 8.6 8.941 Costa Rica 6.7 6.7 6.5 6.9 7.2 70.7 67.6 68.5 68.5 68.5 29.3 32.4 31.5 31.5 31.5 20.8 20.5 20.1 20.4 19.542 Côte d’Ivoire 6.2 6.4 6.3 6.2 6.2 19 19.2 20 15.4 16 81 80.8 80 84.6 84 5.4 5.9 6.4 5.3 643 Croatia 8.1 8.8 8.9 9.4 9 80.5 81.8 82.6 83.2 81.8 19.5 18.2 17.4 16.8 18.2 13.2 13.7 13.4 14.4 12.844 Cuba 6.6 6.6 7.1 7.1 7.2 83.7 84.7 85.5 85.8 86.2 16.3 15.3 14.5 14.2 13.8 10 10.3 11.1 10.8 11.445 Cyprus 8.3 8.1 7.6 8 8.1 50.3 52 50.6 48.7 47.7 49.7 48 49.4 51.3 52.3 11.4 11.4 10.9 10.7 10.246 Czech Republic 7.1 7.1 7.1 7.1 7.4 91.7 91.9 91.5 91.4 91.4 8.3 8.1 8.5 8.6 8.6 14 13.6 13.9 13.9 14.147 Democratic People’sRepublic of Korea 2.2 2.8 2.6 2.4 2.5 71.4 76.9 75.3 73.5 73.4 28.6 23.1 24.7 26.5 26.6 3.5 3.3 3.2 2.9 348 Democratic Republicof Congo 3.3 3 3.1 3.2 3.5 47.1 41.7 41.5 44.7 44.4 52.9 58.3 58.5 55.3 55.6 10.3 8.3 8.7 9.7 10.349 Denmark 8.2 8.4 8.5 8.2 8.4 82.3 82 82.2 82.5 82.4 17.7 18 17.8 17.5 17.6 11.7 11.9 12.4 12.6 12.850 Djibouti 7.3 7.2 7.1 7.1 7 58.1 58 58.4 58.4 58.8 41.9 42 41.6 41.6 41.2 11.8 12.5 12.4 12.5 13.751 Dominica 5.9 5.7 6.2 5.8 6 75 74.7 74.3 71.5 71.3 25 25.3 25.7 28.5 28.7 11.8 11.8 12.8 12.8 10.552 Dominican Republic 5.8 5.8 5.7 6.2 6.1 32 31.4 32.2 35.4 36.1 68 68.6 67.8 64.6 63.9 12.2 11.8 11.3 14.6 13.553 Ecuador 4.4 4.4 3.7 4.1 4.5 53.3 50.3 55.6 55.2 50.3 46.7 49.7 44.4 44.8 49.7 10.4 10.7 9 9.3 9.654 Egypt 3.9 3.9 3.9 3.8 3.9 45.9 46 46.4 46.1 48.9 54.1 54 53.6 53.9 51.1 5.9 6.5 6.2 6.5 7.455 El Salvador 8.1 8.2 8 8 8 38.7 42.5 43.5 45.1 46.7 61.3 57.5 56.5 54.9 53.3 22.6 24.2 25.1 25 24Member State External resources for health Social security expenditure Out-of-pocket expenditure Private prepaid plansas % of total on health as % of general govenment as % of private as % of privateexpenditure on health expenditure on health expenditure on health expenditure on health1997 1998 1999 2000 2001 1997 1998 1999 2000 2001 1997 1998 1999 2000 2001 1997 1998 1999 2000 20011 Afghanistan 9.1 3.7 4.4 14.8 11.2 0 0 0 0 0 100 100 100 100 100 0 0 0 0 02 Albania 9.4 7.4 5.1 7 3.4 20.6 24.2 22.5 18.5 19.3 65.1 61.2 63.3 65 65.3 34.1 38 36 34.3 33.93 Algeria 0.2 0 0.1 0.1 0.1 46.9 45.2 43.5 39.9 37.4 91.9 91.6 92 91.1 89.9 4.1 4.2 4 4.2 5.14 Andorra 0 0 0 0 0 78.6 60 87.5 88.1 86.2 95.5 95.2 95.6 96.1 92.6 n/a n/a n/a n/a n/a5 Angola 9.4 5.6 8.7 14.3 14.2 0 0 0 0 0 100 100 100 100 100 0 0 0 0 06 Antigua and Barbuda 2.4 3.4 3.2 3.1 2.9 n/a n/a n/a n/a n/a 100 100 100 100 100 n/a n/a n/a n/a n/a7 Argentina 0.3 0.3 0.3 0.3 0.3 61 60.2 59 59.5 58.6 63.2 63.8 64 63.3 62.4 33.4 32 31.9 32.6 31.18 Armenia 4.5 5.2 2.2 2 3.7 0 0 0 0 0 100 100 100 100 100 0 0 0 0 09 Australia 0 0 0 0 0 0 0 0 0 0 53.7 57.6 59.3 60.4 59.6 27.8 24 21.3 23.4 24.210 Austria 0 0 0 0 0 59.8 59.8 60.6 61 61.7 59.4 58.7 60.7 61.3 61.3 26.6 25.6 23.8 23.2 23.311 Azerbaijan 1.5 1.7 2.5 4.7 7.7 0 0 0 0 0 100 100 100 90.5 97.7 0 0 0 0 2.312 Bahamas 0 0 0 0 0.3 0 0 0 0 0 100 100 100 100 100 n/a n/a n/a n/a n/a13 Bahrain 0 0 0 0 0 0.4 0.4 0.4 0.4 0.3 70.7 70.1 70.1 70 69.3 25.4 26.2 26 26.3 27.214 Bangladesh 10 12.6 11.8 13.8 13.3 0 0 0 0 0 94 93 93.2 93.2 93.2 0 0 0 0 015 Barbados 4.9 4.5 4.2 4 4.6 0 0 0 0 0 75.8 76.3 77 77.3 76.6 24.2 23.7 23 22.7 23.416 Belarus 0.1 0 0 0 0 19 20.8 19.9 22.8 24.8 100 100 100 99.6 99.7 0 0 0 0.4 0.317 Belgium 0 0 0 0 0 89.5 89.3 86.6 82.2 77.6 48.8 50.6 49.6 58.4 58.8 7.1 7.4 7.3 7.1 6.818 Belize 5.5 3.6 3.1 2.9 6.1 0 0 0 0 0 100 100 100 100 100 0 0 0 0 019 Benin 20.9 20.1 20.4 21.3 21.5 0 0 0 0 0 99.9 99.9 99.9 99.9 99.9 n/a n/a n/a n/a n/a20 Bhutan 32.1 30.6 29.2 42 38.2 0 0 0 0 0 100 100 100 100 100 0 0 0 0 021 Bolivia 6 5.2 9.6 12.1 12.2 65.3 64.8 62 66.7 66.3 85.7 85.7 85.5 85.4 85.7 7.8 7.8 8.1 7.9 7.722 Bosnia and Herzegovina 15 8 6.2 7.9 2.4 0 0 0 0 0 100 100 100 100 100 0 0 0 0 023 Botswana 1.8 1.4 1.4 1.3 0.4 0 0 0 0 0 26.3 28.8 30.3 30.8 35.3 24.1 23.8 22.7 20.8 20.524 Brazil 0.2 0.3 0.5 0.5 0.5 0 0 0 0 0 66.9 66.9 67.1 64.9 64.1 33.1 33.1 32.9 35.1 35.925 Brunei Darussalam n/a n/a n/a n/a n/a 0 0 0 0 0 100 100 100 100 100 0 0 0 0 026 Bulgaria 0.1 0 0.2 2.5 2.1 7.7 11.3 7.8 9.7 30.1 100 100 100 100 98 0 0 0 0 027 Burkina Faso 32.5 24.7 26.4 23.9 25.6 0 0 0 0 0 99.6 97.3 97.4 97.4 97.4 n/a n/a n/a n/a n/a28 Burundi 30.5 35.2 39.6 40.4 43.7 0 0 0 0 0 100 100 100 100 100 0 0 0 0 029 Cambodia 13.5 12 13.4 18.8 19.7 0 0 0 0 0 89.9 90.2 90.1 85.4 84.6 0 0 0 0 030 Cameroon 5.9 6 6.1 5.7 6.3 0 0 0 0 0 87 85.5 84.1 81.9 81.6 n/a n/a n/a n/a n/a31 Canada 0 0 0 0 0 1.8 1.8 1.9 2 2 56 55.2 55.3 54.3 52.3 36.5 38.4 37.6 39.1 39.332 Cape Verde 12.9 13.5 7.2 9.7 20.3 0 0 0 0 0 99.9 99.9 99.8 99.9 99.8 0.1 0.1 0.2 0.1 0.233 Central African Republic 14.7 25.4 28.4 30.8 32.4 0 0 0 0 0 95.2 95.3 95.1 95.5 95.4 0 0 0 0 034 Chad 66.9 58.7 65.2 59.7 62.9 0 0 0 0 0 80.4 80.6 82 81.6 80.9 n/a n/a n/a n/a n/a35 Chile 0.2 0.1 0.1 0.1 0.1 83.6 75.7 77.3 71.8 71.8 66.2 66.2 65.5 59.7 59.6 33.7 33.7 34.5 40.2 40.336 China 0.3 0.2 0.3 0.2 0.2 58 53 51.4 50.7 50.7 94.2 94 94.9 95.2 95.4 0.4 0.6 0.4 0.4 0.437 Colombia 0.3 0.5 0.5 0.4 0.2 16.7 22.8 20.2 19.6 25 85 76.2 73.2 65.1 65.2 15 23.8 26.8 34.8 34.838 Comoros 58.5 44 44.5 42.9 39.9 0 0 0 0 0 100 100 100 100 100 0 0 0 0 039 Congo 3.1 3.6 4.7 4 3.3 0 0 0 0 0 100 100 100 100 100 n/a n/a n/a n/a n/a40 Cook Islands 0.2 33.4 26.8 25.4 23.2 0 0 0 0 0 100 100 100 100 100 0 0 0 0 041 Costa Rica 1.7 1.7 1.6 1.3 1.3 88.1 89.8 89.6 90.2 90.8 90.1 91.5 91.6 91.8 92.1 2.1 1.8 1.6 1.6 1.542 Côte d’Ivoire 2.6 3.1 6 2.1 3.2 0 0 0 0 0 87 88.1 88.1 89.2 89.7 13 11.9 11.9 10.8 10.343 Croatia 0.2 0.2 0.4 0.3 0.1 86.6 91.7 97.9 97.8 94.9 100 100 100 100 100 0 0 0 0 044 Cuba 0.1 0.1 0.2 0.2 0.2 0 0 0 0 0 72.8 78.5 76 75.6 76.8 0 0 0 0 045 Cyprus 0 0 0 0 2.3 44.7 44.6 47.3 48.1 48.2 98.2 98.8 98.4 97.9 98 1.8 1.2 1.6 2.1 246 Czech Republic 0 0 0 0 0 89.5 90.2 89.4 89.4 86.1 100 100 100 100 100 0 0 0 0 047 Democratic People’sRepublic of Korea n/a 0.2 0.2 0.3 0.3 0 0 0 0 0 100 100 100 100 100 0 0 0 0 048 Democratic Republicof Congo 11 12.6 5.7 6.6 18 0 0 0 0 0 100 100 100 100 100 0 0 0 0 049 Denmark 0 0 0 0 0 0 0 0 0 0 92.1 92 90.4 90.9 90.8 7.9 8 9.6 9.1 9.250 Djibouti 29.3 29.2 29.4 29.5 30 0 0 0 0 0 53.7 54.5 54.1 53.9 55.2 0 0 0 0 051 Dominica 3.2 2.3 2.1 1.3 0.9 0 0 0 0 0 100 100 100 100 100 0 0 0 0 052 Dominican Republic 1.5 3.2 3.2 2.5 1.8 26.8 21.4 20.3 22.4 22.6 88.6 88.4 88.4 88.4 88.4 0.1 0.4 0.4 0.4 0.453 Ecuador 2.1 1.8 3.2 3.2 1.9 32.8 36 37.9 38.7 45.3 74.3 74.3 71.6 72.7 73.8 7.8 7.8 9.4 8.3 9.554 Egypt 1.9 2.1 1.8 1.8 2 28 28.4 29.5 29.5 29.7 91.5 91.6 91.9 92 92.2 0.5 0.6 0.5 0.5 0.555 El Salvador 3.4 2.9 1.5 0.9 0.9 43.3 41.7 44 44.2 44.5 95.4 94 90.2 95.6 94.9 4.4 5.8 9.6 4.2 4.9
172 <strong>The</strong> <strong>World</strong> <strong>Health</strong> <strong>Report</strong> 2003 Statistical Annex 173Annex Table 5 Selected national health accounts indicators: measured levels of expenditure on health, 1997–2001Figures computed by WHO to assure comparability; a they are not necessarily the official statistics of Member States, which may use alternative rigorous methods.Member State Total expenditure General government Private expenditure General governmenton health expenditure on health as % of on health as % of expenditure on health as % ofas % of GDP total expenditure on health total expenditure on health total government expenditure1997 1998 1999 2000 2001 1997 1998 1999 2000 2001 1997 1998 1999 2000 2001 1997 1998 1999 2000 200156 Equatorial Guinea 3 4.1 2.8 2.1 2 63.1 62 61.9 62.5 60.4 36.9 38 38.1 37.5 39.6 10.4 8.3 9.9 10 1057 Eritrea 4.4 5 5.4 5.6 5.7 65.8 66.1 67.6 67.2 65.1 34.2 33.9 32.4 32.8 34.9 5.3 4.5 4.5 4.5 4.558 Estonia 5.5 6 6.5 5.9 5.5 86.7 86.4 80.4 76.8 77.8 13.3 13.6 19.6 23.2 22.2 12.6 13.4 12.7 12.4 12.159 Ethiopia 3.4 3.6 3.5 3.2 3.6 37.9 39.3 37.7 34.5 40.5 62.1 60.7 62.3 65.5 59.5 5.8 5.9 4.3 3.2 4.960 Fiji 3.9 4.1 3.7 3.9 4 66.7 65.4 65.2 65.2 67.1 33.3 34.6 34.8 34.8 32.9 7.4 6.9 7.5 7.2 6.961 Finland 7.3 6.9 6.9 6.6 7 76.1 76.3 75.3 75.1 75.6 23.9 23.7 24.7 24.9 24.4 9.8 10 10 10.3 10.762 France 9.4 9.3 9.3 9.4 9.6 76.2 76 76 75.8 76 23.8 24 24 24.2 24 13 13.1 13.2 13.4 13.763 Gabon 2.9 3.7 3.5 3.3 3.6 65.6 66.8 64.9 50.2 47.9 34.4 33.2 35.1 49.8 52.1 5.9 7.4 7.5 7.2 7.364 Gambia 6.1 7.1 6.7 6.3 6.4 47.2 42.9 46.9 46.8 49.4 52.8 57.1 53.1 53.2 50.6 11.3 13.2 13.8 13.3 13.665 Georgia 2.9 2.4 2.5 3.4 3.6 39.9 45.4 37.6 33.5 37.8 60.1 54.6 62.4 66.5 62.2 5.3 5.1 4.3 5.9 6.766 Germany 10.7 10.6 10.7 10.6 10.8 75.3 74.8 74.8 75 74.9 24.7 25.2 25.2 25 25.1 16.3 16.3 16.3 17.3 16.667 Ghana 4.1 4.3 4.2 4.3 4.7 47.6 53.8 53.9 55.9 59.6 52.4 46.2 46.1 44.1 40.4 9.4 9 9.2 8.1 8.668 Greece 9.4 9.4 9.6 9.4 9.4 52.8 52.1 53.4 56.1 56 47.2 47.9 46.6 43.9 44 10.8 10.5 11 10.8 11.269 Grenada 4.7 4.8 4.8 4.9 5.3 66.1 65.8 69.7 70.1 71.9 33.9 34.2 30.3 29.9 28.1 10.6 11.3 12.3 12.3 12.470 Guatemala 3.8 4.4 4.7 4.7 4.8 37.2 47.4 48.3 47.6 48.3 62.8 52.6 51.7 52.4 51.7 11.3 14 15.5 16.3 15.771 Guinea 3.6 3.3 3.6 3.4 3.5 56.3 51.4 55.3 53.4 54.1 43.7 48.6 44.7 46.6 45.9 9.3 9.6 9.4 10.9 11.372 Guinea-Bissau 5.4 5.5 5.9 6.1 5.9 43.2 44.5 48.5 55.3 53.8 56.8 55.5 51.5 44.7 46.2 7.3 9.8 9.1 7.7 7.473 Guyana 4.8 5 4.8 5.1 5.3 83.5 83.4 84 82.7 79.9 16.5 16.6 16 17.3 20.1 9.3 9.3 9.1 9.3 9.374 Haiti 4.9 5.1 4.9 4.8 5 51.7 49.9 51 50.7 53.4 48.3 50.1 49 49.3 46.6 12 11.7 11 12.3 14.175 Honduras 5.4 5.6 5.6 6 6.1 53 53.8 51.8 53.5 53.1 47 46.2 48.2 46.5 46.9 13.7 14.6 13.7 13.6 13.876 Hungary 7 6.9 6.8 6.7 6.8 81.3 79.4 78.1 75.5 75 18.7 20.6 21.9 24.5 25 11.4 10.1 11.4 11.7 11.577 Iceland 8.2 8.6 9.5 9.3 9.2 83.1 83 84 83.7 82.9 16.9 17 16 16.3 17.1 16.3 16.8 18.3 18 17.578 India 5.3 5 5.2 5.1 5.1 15.7 18.4 17.9 17.6 17.9 84.3 81.6 82.1 82.4 82.1 3.2 3.5 3.3 3.1 3.179 Indonesia 2.4 2.5 2.6 2.7 2.4 23.7 27.2 28 23.7 25.1 76.3 72.8 72 76.3 74.9 2.8 3.2 3.6 3.2 380 Iran, Islamic Republic of 5.9 6 6.5 6.4 6.3 45 43.9 41.9 41.5 43.5 55 56.1 58.1 58.5 56.5 10.5 10.8 11.2 11.8 1281 Iraq 3.4 3.3 3.3 3.3 3.2 32.7 31.7 31 31.2 31.8 67.3 68.3 69 68.8 68.2 4.2 4.3 4.5 4.5 4.682 Ireland 6.4 6.2 6.2 6.4 6.5 74.6 76.5 72.8 73.3 76 25.4 23.5 27.2 26.7 24 12.9 13.6 13.1 14.6 1483 Israel 8.1 8.1 8.2 8.2 8.7 74 72 71 69.8 69.2 26 28 29 30.2 30.8 12.1 11.4 11.8 12.1 11.584 Italy 7.7 7.7 7.8 8.2 8.4 72.2 71.8 72 73.4 75.3 27.8 28.2 28 26.6 24.7 10.9 11.1 11.5 12.8 1385 Jamaica 6.5 6.5 6.1 6.2 6.8 56.2 59.5 50.9 47 42.1 43.8 40.5 49.1 53 57.9 7.7 7.7 5.9 5.3 4.486 Japan 6.8 7.1 7.5 7.7 8 77.2 77.4 78.1 77.7 77.9 22.8 22.6 21.9 22.3 22.1 14.9 13.2 15.3 15.5 16.487 Jordan 8.2 8.1 8.6 9.2 9.5 54.5 57 50.8 46.5 47 45.5 43 49.2 53.5 53 11.7 12.4 12.4 12.5 12.888 Kazakhstan 3.2 3.5 3.5 3.3 3.1 72.9 70 63.5 62.9 60.4 27.1 30 36.5 37.1 39.6 8.9 9.4 9.6 9 889 Kenya 8 8.4 7.9 8.7 7.8 21.7 24.1 18.7 23.8 21.4 78.3 75.9 81.3 76.2 78.6 6.1 7.2 5.1 8.6 6.290 Kiribati 8.7 8.3 7.8 8.3 8.6 99.1 99 98.9 98.8 98.8 0.9 1 1.1 1.2 1.2 11.2 10.9 9.7 10 9.391 Kuwait 3.7 4.4 3.9 3.5 3.9 79.5 78.8 78.7 78.7 78.8 20.5 21.2 21.3 21.3 21.2 8.4 8 8.2 8.9 8.192 Kyrgyzstan 4.1 4.7 4.4 4.2 4 67.9 59.5 53.9 48.3 48.7 32.1 40.5 46.1 51.7 51.3 10.5 10.1 10.2 9.5 993 Lao People’s DemocraticRepublic 2.9 2.5 3 2.9 3.1 62.1 48.6 49.4 53.3 55.5 37.9 51.4 50.6 46.7 44.5 9.8 5.7 8.8 7.6 8.794 Latvia 6.8 6.8 6.9 6.3 6.4 56.8 60.7 59.7 55.8 52.5 43.2 39.3 40.3 44.2 47.5 10.1 10.6 10 8.8 9.195 Lebanon 11.8 12.4 12.1 12.6 12.2 31.1 27.2 26.7 29.3 28.1 68.9 72.8 73.3 70.7 71.9 8.6 9.8 9 8.3 9.596 Lesotho 5.3 5.9 6.1 6.1 5.5 76 78.3 80.9 80.8 78.9 24 21.7 19.1 19.2 21.1 12.4 11.5 11.9 12 1297 Liberia 3.2 3.5 4 4.2 4.3 69.1 73.4 76.5 76.2 75.9 30.9 26.6 23.5 23.8 24.1 9.3 10.1 10.8 10.7 10.698 Libyan Arab Jamahiriya 3.4 3.7 3.5 2.8 2.9 47.9 49.6 49.1 51.5 56 52.1 50.4 50.9 48.5 44 6.2 5.3 5.6 4.9 599 Lithuania 6 6.4 6.3 6.2 6 76.2 75.1 73.5 70.7 70.5 23.8 24.9 26.5 29.3 29.5 13.6 14.8 11.7 13.9 14100 Luxembourg 6 5.9 6 5.5 6 91.1 90.9 89.4 89.3 89.9 8.9 9.1 10.6 10.7 10.1 12.5 12.7 12.9 12.3 13.3101 Madagascar 1.8 2.7 2.5 2.4 2 78.4 64.4 58.5 64.8 65.9 21.6 35.6 41.5 35.2 34.1 9 10.3 8.4 9.2 7.7102 Malawi 8.7 8.5 8.7 8.2 7.8 35.6 35.5 37.8 36.9 35 64.4 64.5 62.2 63.1 65 12.2 12.9 13.9 12.2 12.3103 Malaysia 2.8 3 3.1 3.3 3.8 53.5 51.6 52.9 53.1 53.7 46.5 48.4 47.1 46.9 46.3 6.1 5.1 6 6.1 6.5104 Maldives 6.5 6.4 6.8 6.9 6.7 81.9 81.8 82.5 84 83.5 18.1 18.2 17.5 16 16.5 10.9 10.1 10.4 10.9 10.3105 Mali 4.2 4.2 4.1 4.7 4.3 43.3 37.5 32.6 38.9 38.6 56.7 62.5 67.4 61.1 61.4 8.2 7 5.7 7.8 6.8106 Malta 8.6 8.4 8.3 8.8 8.8 67.9 69.3 67.5 68.5 68.5 32.1 30.7 32.5 31.5 31.5 11.7 11.9 11.8 13.2 12.8107 Marshall Islands 9.9 9.7 9.5 9.8 9.8 70.5 66.4 65.2 65 64.7 29.5 33.6 34.8 35 35.3 10.7 10.9 10.8 9.6 9.6108 Mauritania 3.4 3.6 3.6 3.7 3.6 74.5 71.1 71.9 73.5 72.4 25.5 28.9 28.1 26.5 27.6 10.2 10.1 10.5 11 10.3109 Mauritius 3 3.2 3.1 3.3 3.4 61.2 62.6 62 58.7 59.5 38.8 37.4 38 41.3 40.5 6.8 7 7.2 6.6 7.6110 Mexico 5.5 5.6 5.7 5.7 6.1 45.3 46.6 46.9 45.7 44.3 54.7 53.4 53.1 54.3 55.7 15 16.8 17.2 16.6 16.7Member State External resources for health Social security expenditure Out-of-pocket expenditure Private prepaid plansas % of total on health as % of general govenment as % of private as % of privateexpenditure on health expenditure on health expenditure on health expenditure on health1997 1998 1999 2000 2001 1997 1998 1999 2000 2001 1997 1998 1999 2000 2001 1997 1998 1999 2000 200156 Equatorial Guinea 23.6 29.2 14.9 17.2 10.6 0 0 0 0 0 95.1 95.1 89.3 70.5 52.3 0 0 0 0 057 Eritrea 48.1 41.5 49.8 51.1 52.3 0 0 0 0 0 100 100 100 100 100 0 0 0 0 058 Estonia 1.7 1.5 3.5 0.9 0 84.6 77.1 82 85.9 86 97.9 96.6 71.3 84.9 84.7 0 0 4.1 4.1 4.859 Ethiopia 9.3 23.5 27.6 29.6 34.3 0.7 0.7 0.8 1 0.8 86.2 85.7 85.4 84.6 84.7 0 0 0 0 060 Fiji 4.2 7.7 11.1 10.9 10.1 0 0 0 0 0 100 100 100 100 100 0 0 0 0 061 Finland 0 0 0 0 0 18.7 19.4 19.8 20.5 20.8 82.4 81.9 82.2 81.9 82.7 11 11.1 10.8 10.5 8.362 France 0 0 0 0 0 96.8 96.8 96.7 96.7 96.5 43.5 43.1 43 43.1 42.6 52.2 52.6 52.6 52.6 53.163 Gabon 3.7 4 4.6 1.3 1.8 0 0 0 0 0 100 100 100 100 100 0 0 0 0 064 Gambia 29.4 25 28.2 26.1 26.6 0 0 0 0 0 89.2 86.3 88.6 88.9 90 0 0 0 0 065 Georgia 5.4 7.1 7.3 3.1 5.1 54.3 39.3 54.4 47.9 41.5 99.7 99.5 99.5 99.7 99.7 0.3 0.5 0.5 0.3 0.366 Germany 0 0 0 0 0 90.7 91.4 91.5 91.6 91.8 43.9 44.5 43.2 42.2 42.4 32 31.7 32.5 33.3 33.567 Ghana 6.8 8.2 8.6 13.2 23.2 0 0 0 0 0 100 100 100 100 100 0 0 0 0 068 Greece 0 0 0 0 0 26.9 37.5 35.4 31.9 35 72.1 71 69.5 74.5 73.9 4.3 4.2 4.1 4.4 4.469 Grenada 1 0.9 0 0 0 0 0 0 0 0 100 100 100 100 100 0 0 0 0 070 Guatemala 3.2 5.4 5.3 4.6 1.4 49 55.3 54.8 57.1 54.1 92.2 93.2 85.6 86.2 85.7 3.8 4.5 5.4 5.2 5.371 Guinea 14 14 14.3 19.1 20.5 0 0 0 0 0 100 100 100 100 100 0 0 0 0 072 Guinea-Bissau 22 29.4 30 39.8 38.6 0.2 0.2 0.2 0.1 0.1 100 100 100 100 100 0 0 0 0 073 Guyana 4.7 3.6 4 3.1 2.2 0 0 0 0 0 100 100 100 100 100 0 0 0 0 074 Haiti 36.5 36.6 38.3 39.2 42.9 0 0 0 0 0 43.2 40.2 43.3 43.3 45.3 n/a n/a n/a n/a n/a75 Honduras 12.1 10.4 10.1 8.7 7.5 16.7 15.4 16.6 16.5 17.3 89.3 89 89.1 88.9 88.9 7.5 7.5 7.5 7.6 7.576 Hungary 0 0 0 0 0 82.8 83.4 83.8 83.9 83.2 n/a 84.9 86.3 87 85.5 n/a 0.2 0.5 0.8 1.377 Iceland 0 0 0 0 0 31.5 29.8 27.7 29.6 28.1 100 100 100 100 100 0 0 0 0 078 India 2.3 2.4 2.2 2.2 0.4 n/a n/a n/a n/a n/a 100 100 100 100 100 n/a n/a n/a n/a n/a79 Indonesia 2.9 6.4 9.5 8.3 6.5 14.1 9 7.3 7.5 7.5 95.7 93.3 89.6 91.8 91.8 4.3 6.7 10.4 8.2 8.280 Iran, Islamic Republic of 0 0 0 0.1 0.1 38.8 40.8 41 40.6 40.8 94.5 93.7 94.4 94.8 94.2 2.5 3 2.5 2.3 2.681 Iraq 0 0 0.1 0 0.1 0 0 0 0 0 100 100 100 100 100 0 0 0 0 082 Ireland 0 0 0 0 0 1.1 1.1 1.1 1.2 1 53.1 45.6 51.4 50.5 55.2 34.1 38.1 29.3 28.4 28.483 Israel 0 0 0.3 0.4 0.1 33.1 34.3 34.9 36.4 37.1 100 100 100 100 100 0 0 0 0 084 Italy 0 0 0 0 0 0.4 0.1 0.1 0.1 0.3 86.7 86.9 85.6 84.9 82.1 3.6 3.3 3.4 3.3 3.685 Jamaica 2.3 2.5 2.5 2 3 0 0 0 0 0 69.4 66.7 70.3 65.6 73.4 25 27.2 24.3 29.5 22.586 Japan 0 0 0 0 0 87.1 84.5 84 83.5 83.6 74.8 78.2 77.8 74.5 74.9 2.5 2.6 2.6 2.8 1.487 Jordan 1.5 4.1 3.5 4.5 4.4 0.7 0.6 0.8 0.8 0.7 78.5 77.9 75.8 74.1 73.9 5.8 5.9 5.7 5.6 7.488 Kazakhstan 0.5 0.4 3.5 4 3.5 0 0 0 0 0 100 100 100 100 100 0 0 0 0 089 Kenya 7.3 7.9 9.6 9.7 9.8 0 0 0 0 0 70 70.7 68.5 69.6 67.6 7.3 6.6 9.1 8.7 9.590 Kiribati n/a n/a n/a 2.2 4.4 0 0 0 0 0 100 100 100 100 100 0 0 0 0 091 Kuwait 0 0 0 0 0 0 0 0 0 0 100 100 100 100 100 0 0 0 0 092 Kyrgyzstan 8.4 8.8 14.3 17 n/a 0.6 4.4 8.4 10.1 10.3 100 100 100 100 100 0 0 0 0 093 Lao People’s DemocraticRepublic 15.8 20.4 19.5 19.7 21.1 n/a n/a n/a n/a n/a 80.1 80 80 80 80 n/a n/a n/a n/a n/a94 Latvia 0 0.8 0.8 0.7 0.7 28.4 29.9 29.9 31.8 27.4 100 100 100 100 99.7 0 0 0 0 0.395 Lebanon 0.6 1.9 0.7 0.2 0.2 42.3 45.6 47.7 43 50.6 80.9 81 81.8 81.1 81.2 16.7 16.7 15.8 16.4 16.596 Lesotho 5.3 3.9 3.2 4.7 6 0 0 0 0 0 100 100 100 100 100 0 0 0 0 097 Liberia 59.4 65.5 66.2 61.9 57.2 0 0 0 0 0 86.2 87.7 88.4 84 84.2 0 0 0 0 098 Libyan Arab Jamahiriya 0 0 0 0 0 0 0 0 0 0 100 100 100 100 100 0 0 0 0 099 Lithuania 0 0 1.1 1.4 1 82.7 89.9 92.2 90.7 88.3 91.9 92 91.5 92.1 91.7 0 0 0 0 0100 Luxembourg 0 0 0 0 0 86 82.7 77 82.9 77.6 81.9 82.4 73.9 73.2 74.6 18.1 17.6 13.4 13.8 14.6101 Madagascar 35.8 28.6 36.3 38.1 36.8 0 0 0 0 0 73.2 89.2 89.7 87.7 85 26.8 10.8 10.3 12.3 15102 Malawi 22.8 20.4 22.9 32.3 26.5 0 0 0 0 0 40.3 40.4 41.3 39.7 43.7 1.4 1.8 1.5 1.7 1.6103 Malaysia 0.9 1.1 1 0.8 0 0.8 0.9 1 0.9 1.1 n/a 94.2 93.9 93.4 92.8 n/a 5.8 6.1 6.6 7.2104 Maldives 4.2 3.6 2.6 2.2 1.9 0 0 0 0 0 100 100 100 100 100 0 0 0 0 0105 Mali 32 24.2 18.8 24.2 20.8 0 0 0 0 0 77.5 77.6 75.6 73.5 72.4 12.4 13.2 15.3 17.8 18.7106 Malta 0 0 0 0 0 64.5 68.9 68 59.9 58.7 100 100 100 100 100 0 0 0 0 0107 Marshall Islands 13.7 13.5 38.2 36.5 25.4 0 0 0 0 0 100 100 100 100 100 0 0 0 0 0108 Mauritania 24.8 19.7 21.5 24.4 23.2 0 0 0 0 0 100 100 100 100 100 0 0 0 0 0109 Mauritius 1.6 1.4 1.2 1.1 1.6 5.2 6.1 6.5 7.8 8.1 100 100 100 100 100 0 0 0 0 0110 Mexico 0.2 0.8 0.7 0.6 0.5 68.5 68.1 69.2 67.7 66.5 92.5 92.5 92.4 92.3 92.4 3.9 3.9 4.1 4.7 4.9
174 <strong>The</strong> <strong>World</strong> <strong>Health</strong> <strong>Report</strong> 2003 Statistical Annex 175Annex Table 5 Selected national health accounts indicators: measured levels of expenditure on health, 1997–2001Figures computed by WHO to assure comparability; a they are not necessarily the official statistics of Member States, which may use alternative rigorous methods.Member State Total expenditure General government Private expenditure General governmenton health expenditure on health as % of on health as % of expenditure on health as % ofas % of GDP total expenditure on health total expenditure on health total government expenditure1997 1998 1999 2000 2001 1997 1998 1999 2000 2001 1997 1998 1999 2000 2001 1997 1998 1999 2000 2001111 Micronesia, FederatedStates of 8.3 8 7.9 7.9 7.8 73.7 72.6 71.8 71.8 72 26.3 27.4 28.2 28.2 28 9.8 7.9 7.9 8.5 8.5112 Monaco 7 7.2 7.4 7.4 7.6 54.7 53.6 52.7 54.5 56.1 45.3 46.4 47.3 45.5 43.9 15.9 16.1 16.3 16.8 17.7113 Mongolia 5 6.2 6.1 6.3 6.4 62.7 65.4 66.5 70.3 72.3 37.3 34.6 33.5 29.7 27.7 9.1 9 9.8 10.5 10.5114 Morocco 4.3 4.4 4.4 4.7 5.1 26 28.3 29.1 34 39.3 74 71.7 70.9 66 60.7 3.7 4 3.9 4.7 5.3115 Mozambique 5 4.9 5 5.7 5.9 60.5 62 64 66.6 67.4 39.5 38 36 33.4 32.6 15.1 15.5 16.5 18.2 18.9116 Myanmar 2.1 2 2 2 2.1 14.3 10.6 11.7 17.1 17.8 85.7 89.4 88.3 82.9 82.2 2.7 2.5 3 5 5.7117 Namibia 6.9 6.8 7 6.9 6.7 71.1 72.2 73.2 68.9 69.3 28.9 27.8 26.8 31.1 30.7 13 13 13.1 12.4 12.2118 Nauru 7.6 7.9 7.7 7.7 7.5 89.1 89 89.1 88.9 88.7 10.9 11 10.9 11.1 11.3 9.1 9.1 9.2 9.2 9.1119 Nepal 5.4 5.5 5.3 5.2 5.2 31.3 33.3 29.8 30.1 29.7 68.7 66.7 70.2 69.9 70.3 9.3 9.9 9 9 8.1120 Netherlands 8.2 8.6 8.7 8.6 8.9 67.8 64.4 63.3 63.4 63.3 32.2 35.6 36.7 36.6 36.7 11.5 11.7 11.7 12.1 12.2121 New Zealand 7.5 7.9 8 8 8.3 77.3 77 77.9 78 76.8 22.7 23 22.1 22 23.2 12.7 13.5 14.1 14.5 14.8122 Nicaragua 6.2 6 5.8 7.1 7.8 53.8 60.3 54 52.5 48.5 46.2 39.7 46 47.5 51.5 18.7 20.2 13.8 17 17.9123 Niger 3.4 3.3 3.2 3.6 3.7 41.7 43 43.6 43.1 39.1 58.3 57 56.4 56.9 60.9 8.9 8.3 7.8 8.6 7.7124 Nigeria 2.8 3.1 3 3 3.4 11.7 15.4 16 14.1 23.2 88.3 84.6 84 85.9 76.8 2.1 2.3 1.7 1.7 1.9125 Niue 7.6 7.4 7.9 8 7.7 97.1 97 97 97 97 2.9 3 3 3 3 13 13.9 15.3 15.4 14.8126 Norway 7.8 8.5 8.5 7.6 8 84.3 84.7 85.2 85.2 85.5 15.7 15.3 14.8 14.8 14.5 14 14.5 15.1 14.9 15.2127 Oman 3.4 3.8 3.5 3 3 81.9 82.3 82.2 81.1 80.7 18.1 17.7 17.8 18.9 19.3 7.4 7.6 7.7 7 6.5128 Pakistan 3.8 3.9 4 4.1 3.9 27.2 29.1 25.6 24.5 24.4 72.8 70.9 74.4 75.5 75.6 3.8 4.2 3.7 3.3 3.5129 Palau 8.5 8.9 9 9 9.2 91.6 92.9 91.4 91.7 92 8.4 7.1 8.6 8.3 8 10.7 11.3 11.3 11.3 11.6130 Panama 7.4 7.4 7.6 7.6 7 68.3 70.2 69.9 69.2 69 31.7 29.8 30.1 30.8 31 18.7 18.5 18.5 18.4 18.4131 Papua New Guinea 3.2 3.8 4.2 4.3 4.4 89 90.9 89.9 89.7 89 11 9.1 10.1 10.3 11 9.6 12.3 13.3 12.9 13132 Paraguay 7.6 7.3 7.9 7.9 8 32.8 37.4 39.4 38.3 38.3 67.2 62.6 60.6 61.7 61.7 13.6 14.9 17.4 16.8 16.9133 Peru 4.4 4.6 4.9 4.7 4.7 51.4 54.8 55.9 55.4 55 48.6 45.2 44.1 44.6 45 11.6 12.9 13 12.7 12.1134 Philippines 3.6 3.5 3.5 3.4 3.3 43.4 43.4 44.8 48.2 45.2 56.6 56.6 55.2 51.8 54.8 6.7 6.6 6.5 7.1 6.2135 Poland 6.1 6.4 6.2 5.8 6.1 72 65.4 71.1 70 71.9 28 34.6 28.9 30 28.1 9.5 9.4 10.6 10.2 10.9136 Portugal 8.6 8.6 8.7 9.1 9.2 64.8 65.5 67.6 68.5 69 35.2 34.5 32.4 31.5 31 12.4 12.8 13 13.7 13.7137 Qatar 3.9 4.5 3.8 2.8 3.1 76.8 76.9 76 74.2 73.5 23.2 23.1 24 25.8 26.5 7 7.6 7.5 6.7 6.5138 Republic of Korea 5 5.1 5.6 5.9 6 41 46.2 43.1 44.4 44.4 59 53.8 56.9 55.6 55.6 9 9.3 9.7 10.7 9.5139 Republic of Moldova 8.3 7.2 5.3 5.2 5.1 73 60.3 54.4 55.9 55.8 27 39.7 45.6 44.1 44.2 14.6 12.1 9.8 9.9 10.6140 Romania 5 6.6 6.8 6.6 6.5 66.7 74.2 77.8 78.9 79.2 33.3 25.8 22.2 21.1 20.8 9.9 13.7 14.1 14.2 15.9141 Russian Federation 5.8 5.8 5.4 5.3 5.4 72.9 68.9 64.7 69.9 68.2 27.1 31.1 35.3 30.1 31.8 9.3 9.8 9.4 10.8 10.7142 Rwanda 5 5 5.5 5.6 5.5 48.8 51.3 54 52.9 55.5 51.2 48.7 46 47.1 44.5 12.5 13.8 13.5 14.8 14.2143 Saint Kitts and Nevis 4.8 4.8 4.7 4.7 4.8 66.3 66.7 66.2 66.3 66.3 33.7 33.3 33.8 33.7 33.7 10.9 11 10.6 10.6 10.9144 Saint Lucia 4.2 4.3 4.1 4.2 4.5 62.3 65.6 65.3 65.2 64.6 37.7 34.4 34.7 34.8 35.4 9 8.8 8.3 8.2 8145 Saint Vincent and theGrenadines 6.1 5.9 6 6 6.1 63.8 62.5 62.7 65.1 63.5 36.2 37.5 37.3 34.9 36.5 9.2 8.7 9.1 9.3 9.3146 Samoa 5.4 5.8 6.2 5.8 5.8 73.6 73.5 74.1 76.9 82.2 26.4 26.5 25.9 23.1 17.8 11.5 13.1 12.9 14.7 15.7147 San Marino 5.9 6.1 6.3 6.7 6.8 75.1 75.4 75.8 77.1 78 24.9 24.6 24.2 22.9 22 11 12 12.4 13.4 13.8148 Sao Tome and Principe 3 2.9 2.3 2.4 2.3 66.7 67.9 67.9 67.8 67.7 33.3 32.1 32.1 32.2 32.3 2.9 3.6 3.6 3.6 3.5149 Saudi Arabia 5.3 5.2 4.5 4.4 4.6 77.3 76.3 73.7 74.4 74.6 22.7 23.7 26.3 25.6 25.4 11.4 11.5 11 9.9 10150 Senegal 5.1 4.9 4.7 4.6 4.8 54.8 57.5 56.1 56.6 58.8 45.2 42.5 43.9 43.4 41.2 14.4 15 13 13.6 12.9151 Serbia-Montenegro 11 9.9 9.2 7.6 8.2 74 71.3 70.9 77.6 79.2 26 28.7 29.1 22.4 20.8 21.1 17.5 15.9 14.7 15152 Seychelles 6.7 6.4 6.2 5.9 6 72.3 69.4 68.8 66.5 68.2 27.7 30.6 31.2 33.5 31.8 8.1 7.5 7.4 6.7 7153 Sierra Leone 3.3 3 3.7 4.3 4.3 46.8 44.2 53.8 60.4 61 53.2 55.8 46.2 39.6 39 8.9 9.4 9.4 9.3 9.4154 Singapore 3.7 4.2 4 3.6 3.9 39 41.6 38.3 35.2 33.5 61 58.4 61.7 64.8 66.5 8.4 8.7 8.2 6.7 5.9155 Slovakia 5.9 5.8 5.8 5.7 5.7 91.7 91.6 89.6 89.4 89.3 8.3 8.4 10.4 10.6 10.7 8.5 8.8 9.2 8.2 8.9156 Slovenia 7.8 8.3 8.2 8 8.4 79.2 75.7 75.5 76 74.9 20.8 24.3 24.5 24 25.1 14.3 14.3 14 14.5 14.6157 Solomon Islands 3.7 4.5 4.9 4.9 5 92 93 93.4 93.4 93.5 8 7 6.6 6.6 6.5 11.4 11.4 11.1 11.4 11.5158 Somalia 2.6 2.7 2.7 2.6 2.6 45.5 46.1 45 44.8 44.6 54.5 53.9 55 55.2 55.4 4.4 4.4 4.2 4.2 4.2159 South Africa 9 8.7 8.8 8.7 8.6 46.1 42.4 42.6 41.8 41.4 53.9 57.6 57.4 58.2 58.6 12.4 11.3 11.1 11.2 10.9160 Spain 7.5 7.5 7.5 7.5 7.5 72.5 72.2 72.1 71.7 71.4 27.5 27.8 27.9 28.3 28.6 13 13.1 13.4 13.4 13.6161 Sri Lanka 3.2 3.4 3.5 3.6 3.6 49.5 51.3 49 49.2 48.9 50.5 48.7 51 50.8 51.1 6 5.8 5.7 6.1 6.1162 Sudan 3.5 3.7 3.7 3.9 3.5 19.6 24.4 22.9 28.7 18.7 80.4 75.6 77.1 71.3 81.3 9.1 12 9.5 9.3 4.6163 Suriname 9.5 9.9 9.8 9.9 9.4 52.4 61.7 59.6 63.3 60.2 47.6 38.3 40.4 36.7 39.8 17.1 18.2 17.6 18.9 17164 Swaziland 3.1 3.2 3.3 3.4 3.3 71.6 70.8 67.7 69.9 68.5 28.4 29.2 32.3 30.1 31.5 7.9 7.7 7 7.8 7.5165 Sweden 8.2 8.3 8.4 8.4 8.7 85.8 85.8 85.7 85 85.2 14.2 14.2 14.3 15 14.8 11.2 11.8 12 12.4 13Member State External resources for health Social security expenditure Out-of-pocket expenditure Private prepaid plansas % of total on health as % of general govenment as % of private as % of privateexpenditure on health expenditure on health expenditure on health expenditure on health1997 1998 1999 2000 2001 1997 1998 1999 2000 2001 1997 1998 1999 2000 2001 1997 1998 1999 2000 2001111 Micronesia, FederatedStates of n/a n/a 22.5 22.1 16.2 0 0 0 0 0 35.7 35.7 35.7 35.7 35.7 0 0 0 0 0112 Monaco 0 0 0 0 0 94.3 94.6 94.9 95.2 95.7 100 100 100 100 100 0 0 0 0 0113 Mongolia 4.2 9 18.9 17.2 15.4 36.8 39.9 39.3 40.2 40.3 73.3 74.5 74.1 73.9 73.4 0 0 0 0 0114 Morocco 2.6 2.2 1.5 1.7 1.4 9.8 9 9 7.6 5.8 74.3 74.4 74.3 74.3 74.1 22.8 22.5 22.7 22.6 22.7115 Mozambique 53.1 44.2 40.3 38.2 36.9 0 0 0 0 0 42.8 40.5 39.2 39.3 39.3 0.6 0.5 0.6 0.5 0.5116 Myanmar 0.4 0.4 0.3 0.4 0.2 3.6 3 2.1 2 1.8 99.6 99.7 99.8 99.6 99.6 0 0 0 0 0117 Namibia 4.4 4.5 4.6 3.8 3.9 1.5 1.4 1.2 1.8 2 21.8 21.8 21.2 18.1 18.7 75.2 74.5 74.3 77.2 75.7118 Nauru n/a n/a n/a n/a n/a 0 0 0 0 0 100 100 100 100 100 0 0 0 0 0119 Nepal 10.6 9.9 10.2 8.3 9.4 0 0 0 0 0 94.2 94.1 94.2 93.8 93.3 0 0 0 0 0120 Netherlands 0 0 0 0 0 93.6 93.3 93.2 93.6 93.8 23.8 24.7 25 24.5 24.1 59.1 43.5 42.7 41.6 42.4121 New Zealand 0 0 0 0 0 0 0 0 0 0 68.8 70.8 70.1 69.9 72 29.8 27.7 28.1 28.5 26.5122 Nicaragua 10.8 11.1 10 7.7 7.7 24.3 23 31.5 27 31.3 97.1 96.9 93.9 91.9 93.1 0.9 1.7 0.7 2.7 4123 Niger 13.7 17.7 9.2 20.9 16.9 0 0 0 0 0 84.5 83.4 82.7 83.4 85.4 3.4 2.9 3.2 3.2 2.9124 Nigeria 1.3 1.2 3.8 7.2 7.1 0 0 0 0 0 100 100 100 100 100 0 0 0 0 0125 Niue n/a n/a n/a n/a n/a 0 0 0 0 0 100 100 100 100 100 0 0 0 0 0126 Norway 0 0 0 0 0 0 0 0 0 0 96.6 96.6 96.6 96.7 96.8 0 0 0 0 0127 Oman 0 0 0 0.1 0 0 0 0 0 0 46.4 51.1 47.5 41.7 42.9 0 0 0 0 0128 Pakistan 2.7 2.2 2 3.8 1.9 43.9 41.6 44.9 39.6 43.3 100 100 100 100 100 0 0 0 0 0129 Palau 12.5 13.5 11.9 11.4 11.8 0 0 0 0 0 100 100 100 100 100 0 0 0 0 0130 Panama 1.4 1.3 1.3 1.2 0.6 60.6 66.2 58.9 57.2 57.9 82.7 82 81.8 81.3 81.2 17.2 18 18.2 18.7 18.7131 Papua New Guinea 26.8 29 18.5 22.1 21.2 0 0 0 0 0 88.7 86.4 83.4 83.9 83.3 2 4.8 9.4 9.3 9.4132 Paraguay 1.6 1.9 2 2 2 47.8 44.9 46.7 48.3 48.2 68.4 76.3 72.9 72.7 71.6 31.6 23.7 27.1 27.3 28.4133 Peru 2.3 2.4 2 1.4 1.7 43 43.1 48.3 47.2 51.9 82.8 81.7 80 81.7 81.7 15.3 16.5 18 16 16.1134 Philippines 2 2.8 3.7 3.5 3.5 11.8 8.8 11.4 14.7 17.2 82.9 82.6 79.5 79.2 78.2 15.6 15.9 18.6 18.6 19.8135 Poland 0 0 0 0 0 0 0 83.4 82.4 76.7 92.7 92.8 92.3 92.4 92.4 7.3 7.2 7.7 7.6 7.6136 Portugal 0 0 0 0 0 6.7 7.7 7.1 6.7 6.8 55.5 57.7 60.6 59.4 58.5 4.3 4.3 4.3 4.3 4.3137 Qatar 0 0 0 0 0 0 0 0 0 0 25.3 24.7 26.8 31.9 33.7 0 0 0 0 0138 Republic of Korea 0 0 0 0 0 71.9 74.5 75.2 77.3 77.2 78.2 77.4 75.7 74.2 74.3 11.3 12.9 13.6 15.6 17.2139 Republic of Moldova 0.4 1 4.1 7.8 8.5 0 0 0 0 0 100 100 100 100 97.6 0 0 0 0 2.4140 Romania 1 2.1 3 2 1 87.1 87 87 88.6 88.3 79.4 78.8 86.7 89.2 92.1 20.6 21.2 13.3 10.8 7.9141 Russian Federation 0.4 1.2 3.8 3.1 3.1 33.8 36.3 36.9 24.5 21.8 77.7 80.5 84.8 85.2 84.4 6.7 5.6 4.6 4.6 4.5142 Rwanda 30.1 25.6 26.5 33.2 24.7 0.6 0.6 0.6 0.6 0.6 66.2 67 64.6 61.3 66.1 0.3 0.3 0.3 0.3 0.3143 Saint Kitts and Nevis 7.2 6.8 6.7 6.2 5.6 0 0 0 0 0 100 100 100 100 100 n/a n/a n/a n/a n/a144 Saint Lucia 0.6 0.6 0.5 0.5 0.6 35.2 17.7 14.6 24 25.5 100 100 100 100 100 n/a n/a n/a n/a n/a145 Saint Vincent and theGrenadines 1.8 1.7 1.6 1.6 0.3 0 0 0 0 0 100 100 100 100 100 n/a n/a n/a n/a n/a146 Samoa 6.1 15.8 13.8 19.1 15.6 0.6 0.6 0.3 0.3 0.2 78.1 79.4 80.1 81.7 87.5 0 0 0 0 0147 San Marino 0 0 0 0 0 54.8 55.7 54.9 52.7 51.7 100 100 100 100 100 n/a n/a n/a n/a n/a148 Sao Tome and Principe 45.3 48.6 64.1 57.8 56.4 0 0 0 0 0 100 100 100 100 100 0 0 0 0 0149 Saudi Arabia 0 0 0 0 0 0 0 0 0 0 42.2 44.3 42.2 38.9 38 33.4 32.1 33.4 35.4 36.8150 Senegal 11.7 11.1 12.4 14.1 20.2 0 0 0 0 0 91.3 90.6 91.2 91.3 91.6 8.7 9.4 8.8 8.7 8.4151 Serbia-Montenegro 0 0.1 0.3 2.2 1.4 92.7 92 92.6 92.4 89.4 100 100 100 100 100 0 0 0 0 0152 Seychelles 13.7 12.9 12.4 11.8 11.9 0 0 0 0 0 77.8 75.3 75 74.6 75 0 0 0 0 0153 Sierra Leone 19.3 18.8 22.2 25.4 25.1 0 0 0 0 0 100 100 100 100 100 0 0 0 0 0154 Singapore 0 0 0 0 0 20.2 17.6 19 23.3 24.5 97.5 97.3 97.4 97.2 97 0 0 0 0 0155 Slovakia 0 0 0 0 0 96.7 96.6 94.2 94.4 95.1 100 100 100 100 100 0 0 0 0 0156 Slovenia 0 0 0 0 0 87.8 87.9 87.5 87.5 77.5 48.8 44.4 39.3 38.6 41.7 51.2 55.6 60.7 61.4 58.3157 Solomon Islands 7 7.7 7.1 16.5 15.9 0 0 0 0 0 47 45.8 47.1 48.3 49.2 0 0 0 0 0158 Somalia 4.3 5.3 6.1 9 9.3 0 0 0 0 0 100 100 100 100 100 0 0 0 0 0159 South Africa 0.2 0.2 0.1 0.4 0.4 0 0 0 0 0 19.7 21.9 21.7 21.8 22.1 78.3 76.4 76.7 76.6 72.2160 Spain 0 0 0 0 0 13.4 11.8 9.4 9.6 9.2 83.9 83.6 83.3 83.1 82.8 12.8 13.1 13.5 13.7 14.1161 Sri Lanka 3.2 2.8 2.7 2.7 3.1 0 0 0 0 0 95 94.9 95.1 95 95 1 1 1 1.1 1.1162 Sudan 1.4 2.4 4.1 2.4 2.7 0 0 0 0 0 99.4 99.3 99.4 99.3 99.3 0 0 0 0 0163 Suriname 9 9.5 17.6 9.8 12.4 32.2 34.9 33.3 28.1 22.8 30.5 33.7 32.7 39.9 57 1.7 1.4 1.3 1 0.7164 Swaziland 9.3 1.5 5.1 0.9 7.9 0 0 0 0 0 100 100 100 100 100 0 0 0 0 0165 Sweden 0 0 0 0 0 0 0 0 0 0 100 100 100 100 100 0 0 0 0 0
176 <strong>The</strong> <strong>World</strong> <strong>Health</strong> <strong>Report</strong> 2003 Statistical Annex 177Annex Table 5 Selected national health accounts indicators: measured levels of expenditure on health, 1997–2001Figures computed by WHO to assure comparability; a they are not necessarily the official statistics of Member States, which may use alternative rigorous methods.Member State Total expenditure General government Private expenditure General governmenton health expenditure on health as % of on health as % of expenditure on health as % ofas % of GDP total expenditure on health total expenditure on health total government expenditure1997 1998 1999 2000 2001 1997 1998 1999 2000 2001 1997 1998 1999 2000 2001 1997 1998 1999 2000 2001166 Switzerland 10.4 10.6 10.7 10.7 11 55.2 54.9 55.3 55.6 57.1 44.8 45.1 44.7 44.4 42.9 15.3 15.4 11.9 12.5 13.2167 Syrian Arab Republic 2.5 2.7 2.8 3.1 3.4 59.5 57.5 57.1 51.8 53.1 40.5 42.5 42.9 48.2 46.9 5.2 5.1 5.2 5.3 5.3168 Tajikistan 5.4 3.6 3.4 3.1 3.4 36 32.4 30.6 29.7 28.9 64 67.6 69.4 70.3 71.1 10.6 7.5 5 5.3 5.5169 Thailand 3.7 3.9 3.7 3.6 3.7 57.2 61.2 57.6 56.8 57.1 42.8 38.8 42.4 43.2 42.9 10.2 13.3 11.6 11.6 11.6170 <strong>The</strong> former YugoslavRepublic of Macedonia 6.1 7.6 6.4 6 6.8 83.9 87.1 85.4 84.5 84.9 16.1 12.9 14.6 15.5 15.1 14.5 19 16.3 15.6 17.4171 Timor-Leste 9.4 6.4 9.6 7.4 9.8 90.5 85.4 88.6 74 59.5 9.5 14.6 11.4 26 40.5 9 5.8 9 5.8 9172 Togo 3 3.5 4 3 2.8 50.2 59.6 62.8 48.7 48.6 49.8 40.4 37.2 51.3 51.4 8.3 9.7 12.8 7.9 9.3173 Tonga 5.5 5.5 5.4 5.3 5.5 59.8 61.2 60.7 60.5 61.6 40.2 38.8 39.3 39.5 38.4 7.8 9.6 12.7 11.6 10.9174 Trinidad and Tobago 4.5 4.8 4.5 3.9 4 43 46.5 46.5 45.9 43.3 57 53.5 53.5 54.1 56.7 6.6 6.7 6.7 6.7 6.4175 Tunisia 6.4 6.3 6.3 6.2 6.4 77.7 76.7 75.9 74.3 75.7 22.3 23.3 24.1 25.7 24.3 15.5 15 14.9 14.2 15.1176 Turkey 4.2 4.8 4.9 5 5 71.6 71.9 71.1 71.1 71 28.4 28.1 28.9 28.9 29 10.8 11.5 9.1 9 9.1177 Turkmenistan 4.7 5 5 4 4.1 75.6 70.3 68 74.5 73.3 24.4 29.7 32 25.5 26.7 12 14.4 17.5 11.5 18.2178 Tuvalu 5.3 5.2 5.4 5.5 5.4 59.1 59.3 57.3 53.5 53.4 40.9 40.7 42.7 46.5 46.6 5.4 3.7 3.6 3.3 2.9179 Uganda 3.9 4 4.1 5.6 5.9 29.1 38 40.9 56.1 57.5 70.9 62 59.1 43.9 42.5 6.5 8.1 8.4 16.4 16.4180 Ukraine 5.4 5 4.3 4.2 4.3 75 71.7 68.3 68.2 67.8 25 28.3 31.7 31.8 32.2 9.3 8 8.3 7.6 7.6181 United Arab Emirates 3.6 4 3.7 3.5 3.5 76.7 77 75.8 75.9 75.8 23.3 23 24.2 24.1 24.2 28.9 28.8 27.9 31.5 32.3182 United Kingdom 6.8 6.9 7.2 7.3 7.6 80.1 80.2 80.5 80.9 82.2 19.9 19.8 19.5 19.1 17.8 13.4 13.9 14.8 15 15.4183 United Republic ofTanzania 4.1 4.4 4.3 4.4 4.4 45.9 47.1 43.4 47.1 46.7 54.1 52.9 56.6 52.9 53.3 14.4 13.1 12.4 12.1 12.1184 United States of America 13 13 13 13.1 13.9 45.3 44.5 44.2 44.2 44.4 54.7 55.5 55.8 55.8 55.6 16.8 16.9 16.9 17.2 17.6185 Uruguay 10 10.2 10.7 10.9 10.9 40.8 41 48.2 46.6 46.3 59.2 59 51.8 53.4 53.7 12.1 12.5 14.9 14.9 14.9186 Uzbekistan 4.2 3.9 3.6 3.7 3.6 72.7 75.1 74 74.9 74.5 27.3 24.9 26 25.1 25.5 9.3 8.8 8.6 9.6 9.2187 Vanuatu 3.4 3.5 3.7 3.8 3.8 65.5 65.4 63.6 60.9 59.2 34.5 34.6 36.4 39.1 40.8 10.2 8.7 10.3 10.1 9.7188 Venezuela, BolivarianRepublic of 5.4 5.4 5.6 5.9 6 57.1 54.4 53.9 57.1 62.1 42.9 45.6 46.1 42.9 37.9 12.5 12.4 13.6 13.8 14.7189 Viet Nam 4.4 4.9 4.9 5.2 5.1 31.5 32.7 32.7 28.5 28.5 68.5 67.3 67.3 71.5 71.5 5.6 7.1 6.7 6.1 6.1190 Yemen 3.8 4.4 4 4 4.5 30.4 39.5 32.5 34.6 34.1 69.6 60.5 67.5 65.4 65.9 3.5 4.8 4.8 3.9 4191 Zambia 6 6 5.7 5.5 5.7 55.1 56.9 54.8 52.5 53.1 44.9 43.1 45.2 47.5 46.9 13.1 12.5 13.7 13.6 13.5192 Zimbabwe 9.3 11.4 7.9 7.4 6.2 59.1 55.9 48.9 50.7 45.3 40.9 44.1 51.1 49.3 54.7 15.4 12.2 10 7.1 8Member State External resources for health Social security expenditure Out-of-pocket expenditure Private prepaid plansas % of total on health as % of general govenment as % of private as % of privateexpenditure on health expenditure on health expenditure on health expenditure on health1997 1998 1999 2000 2001 1997 1998 1999 2000 2001 1997 1998 1999 2000 2001 1997 1998 1999 2000 2001166 Switzerland 0 0 0 0 0 71.6 72.3 72.1 72.6 70.4 72 72.6 74.5 74.1 73.9 25.7 25.2 23.3 23.6 23.8167 Syrian Arab Republic 0.6 0.5 0.3 0.2 0.5 0 0 0 0 0 66.5 67.9 72.4 61.9 57.3 0 0 0 0 0168 Tajikistan 4.1 6.2 3.1 12.4 5.9 0 0 0 0 0 100 100 100 100 100 0 0 0 0 0169 Thailand 0.3 0.4 0.5 0.5 0.1 30.2 25.8 26.9 27 26.8 86.2 84.9 84.9 85 85 8.6 9.6 9.6 9.6 9.6170 <strong>The</strong> former YugoslavRepublic of Macedonia 2.6 2.6 2.6 3.1 3.5 96.3 96.8 94.8 91.9 87.5 100 100 100 100 100 0 0 0 0 0171 Timor-Leste 41.8 66.7 87.2 64.6 53.8 0.9 1.2 n/a n/a n/a 93 88.6 75.8 43.1 20.8 0 0 0 0 0172 Togo 8.1 9.8 5.3 31.2 8.1 0 0 0 0 0 100 100 100 100 100 n/a n/a n/a n/a n/a173 Tonga 6.3 5.9 8.8 10.2 20.7 0 0 0 0 0 100 100 100 100 100 0 0 0 0 0174 Trinidad and Tobago 5.2 4.6 4.4 4.2 3.8 0 0 0 0 0 86.9 87.1 86.4 85.7 86.5 6.2 6.2 6.7 7.6 7.1175 Tunisia 0.6 0.6 0.6 0.6 0.6 45.3 52.7 54.9 57.3 53.4 77.2 76 77.1 78 77.6 22.8 24 22.9 22 22.4176 Turkey 0.4 0.4 0.1 0.1 0 38.8 43.8 28.4 28.4 28.6 99.6 99.6 99.8 99.9 98.8 0.2 0.2 0.2 0.1 1.2177 Turkmenistan 2.1 2.6 1.4 0.9 0.6 8.4 16.2 23.5 26.4 26.8 71.4 76.6 78.1 72.6 73.7 28.6 23.4 21.9 27.4 26.3178 Tuvalu 6.9 7.1 6.4 6.4 29.4 0 0 0 0 0 100 100 100 100 100 0 0 0 0 0179 Uganda 24.4 41.7 22.9 41.2 24.8 0 0 0 0 0 54 54 55.4 55.6 53.4 0.5 0.5 0.5 0.5 0.5180 Ukraine 0.6 0.4 0.3 0.7 0.7 0 0 0 0 0 100 100 100 100 100 0 0 0 0 0181 United Arab Emirates 0 0 0 0 0 0 0 0 0 0 69.4 69.5 67 66 65.6 16.4 16.9 19 19.1 19.1182 United Kingdom 0 0 0 0 0 0 0 0 0 0 53.5 55.1 54.7 55 55.3 17 17.2 16.7 16.7 17.2183 United Republic ofTanzania 16 22 35.3 30 29.5 0 0 0 0 0 87 87.5 83.5 83 83.1 0 0 4.5 4.4 4.4184 United States of America 0 0 0 0 0 32.1 33.3 33.3 33.9 32.9 27.6 28 27.6 27.2 26.5 61.2 61 61.7 62.8 64.1185 Uruguay 0.6 0.6 0.1 0.5 0.8 45.6 46.8 37.6 34.7 35.8 33.5 32.9 33.2 31.2 30.4 66.5 67.1 66.8 68.8 69.6186 Uzbekistan 1 1.3 1.5 0.9 1.7 0 0 0 0 0 100 100 100 100 100 0 0 0 0 0187 Vanuatu 20 30.4 28.7 28.5 8.4 0 0 0 0 0 100 100 100 100 100 0 0 0 0 0188 Venezuela, BolivarianRepublic of 1.3 1.2 1 0.4 0.1 20.9 18.6 25 24.7 20.2 78.6 77.9 79.9 73.8 95.4 4.6 4.8 4.4 4 4.6189 Viet Nam 5.6 2.8 3.4 2.7 2.6 13 11.5 9.5 10.9 10.9 93.5 89.7 86.5 87.7 87.6 0 3.4 3.7 4.2 4.2190 Yemen 6.2 5.2 5.1 4.1 3.7 0 0 0 0 0 87.4 87.9 88.2 87.8 88.7 0 0 0 0 0191 Zambia 23.5 26.1 40.1 33.5 48.7 0 0 0 0 0 70.9 74.1 70.7 71.1 71.8 0 0 0 0 0192 Zimbabwe 2.3 17.2 13 12.5 7.8 0 0 0 0 0 67 75.2 44.9 48 52.2 21 16.4 39.6 39.2 34.8a See explanatory notes for sources and methods.n/a Used when the information accessed indicates that a cell should have an entry but no estimates could be accessed.0 Used when no evidence of the schemes to which the cell relates exist. Some estimates yielding a ratio inferior to 0.04% are shown as 0.
178 <strong>The</strong> <strong>World</strong> <strong>Health</strong> <strong>Report</strong> 2003 Statistical Annex 179Annex Table 6 Selected national health accounts indicators: measured levels of per capita expenditure on health, 1997–2001Figures computed by WHO to assure comparability; a they are not necessarily the official statistics of Member States, which may use alternative rigorous methods.Member State Per capita total Per capita total Per capita government Per capita governmentexpenditure on health at expenditure on health at expenditure on health at expenditure on health ataverage exchange rate (US$) international dollar rate average exchange rate (US$) international dollar rate1997 1998 1999 2000 2001 1997 1998 1999 2000 2001 1997 1998 1999 2000 2001 1997 1998 1999 2000 20011 Afghanistan n/a n/a n/a 9 8 34 35 38 40 34 n/a n/a n/a 5 4 17 19 20 22 182 Albania 28 34 43 46 48 108 108 125 144 150 17 21 27 30 31 66 67 78 92 973 Algeria 57 59 59 68 73 122 133 138 151 169 41 42 41 48 55 87 94 96 106 1274 Andorra 1328 1670 1285 1200 1233 1601 2021 1610 1723 1821 950 1313 920 841 875 1145 1589 1152 1208 12925 Angola 26 19 17 26 31 56 51 48 55 70 12 8 7 14 19 25 20 21 30 446 Antigua and Barbuda 448 464 485 509 531 484 496 526 581 614 278 290 297 305 323 300 310 322 348 3747 Argentina 668 680 700 683 679 1014 1065 1140 1099 1130 371 376 394 377 363 563 588 641 607 6048 Armenia 36 42 46 49 54 171 190 224 246 273 13 16 19 20 22 60 70 92 99 1129 Australia 1909 1709 1870 1808 1741 1978 2093 2230 2363 2532 1293 1165 1293 1246 1182 1341 1427 1542 1629 171810 Austria 2027 2100 2086 1873 1866 1881 1972 2070 2236 2259 1438 1500 1461 1305 1293 1334 1409 1450 1559 156611 Azerbaijan 11 13 11 11 11 44 50 46 46 48 8 9 8 8 8 32 37 32 31 3212 Bahamas 701 754 807 863 864 829 922 1057 1117 1220 390 434 463 490 492 461 531 606 635 69513 Bahrain 484 480 479 484 500 702 715 670 568 664 341 335 332 334 345 495 498 464 393 45814 Bangladesh 10 10 11 13 12 40 41 47 56 58 3 4 4 6 5 13 15 17 26 2615 Barbados 495 531 569 603 613 775 783 839 881 940 323 348 374 397 406 505 514 551 581 62316 Belarus 82 67 63 56 68 375 391 415 424 464 71 58 54 48 59 327 337 355 362 40217 Belgium 2016 2059 2095 1916 1983 1988 1969 2105 2272 2481 1441 1481 1512 1382 1421 1422 1417 1519 1639 177818 Belize 130 133 149 156 167 228 236 257 257 278 66 69 72 75 75 116 122 125 123 12519 Benin 14 15 15 15 16 28 29 31 35 39 5 5 6 7 8 9 11 12 15 1820 Bhutan 8 8 8 9 9 48 52 52 61 64 7 7 7 8 8 43 47 47 55 5821 Bolivia 48 53 53 52 49 104 114 120 122 125 31 35 35 35 33 66 75 79 81 8322 Bosnia and Herzegovina 69 89 94 87 85 192 237 241 259 268 36 36 37 34 31 100 95 95 103 9923 Botswana 169 158 164 173 190 260 260 294 309 381 100 95 100 107 126 153 155 178 192 25224 Brazil 362 348 246 265 222 528 526 560 556 573 157 153 105 108 92 229 231 240 227 23825 Brunei Darussalam 429 463 484 479 453 525 570 607 617 638 340 376 384 383 359 416 464 482 493 50726 Bulgaria 58 60 80 75 81 227 200 272 283 303 48 47 67 62 67 188 159 227 233 24827 Burkina Faso 7 8 8 6 6 25 26 30 29 27 5 5 5 4 4 17 17 20 18 1628 Burundi 5 5 4 4 4 15 17 16 18 19 2 3 2 2 2 8 9 9 10 1129 Cambodia 30 25 28 30 30 146 142 152 174 184 3 3 3 4 4 15 14 15 25 2730 Cameroon 23 23 19 19 20 45 38 36 39 42 5 4 4 7 8 9 7 8 13 1631 Canada 1864 1835 1949 2102 2163 2187 2288 2433 2580 2792 1305 1297 1372 1490 1533 1532 1617 1713 1828 197832 Cape Verde 38 45 41 38 46 88 106 99 109 134 26 33 29 27 34 60 77 69 76 10033 Central African Republic 10 12 12 12 12 41 47 50 55 58 4 5 6 6 6 16 21 24 27 3034 Chad 6 5 5 5 5 17 14 16 19 17 5 4 4 4 4 13 10 12 15 1335 Chile 371 369 331 336 303 643 699 686 681 792 140 146 135 143 133 243 277 280 290 34836 China 33 36 40 45 49 135 155 176 200 224 13 14 15 17 18 54 60 67 73 8337 Colombia 205 140 133 108 105 497 373 395 350 356 98 84 82 73 69 237 225 245 236 23438 Comoros 10 10 10 9 9 28 27 27 26 29 6 6 6 5 6 17 16 16 16 1739 Congo 23 19 19 18 18 33 34 28 20 22 16 14 13 13 12 23 26 20 15 1440 Cook Islands 258 216 214 196 198 430 452 442 444 598 188 155 139 126 134 312 325 288 286 40441 Costa Rica 236 254 268 280 293 445 477 496 533 562 167 171 184 192 201 315 323 339 365 38542 Côte d’Ivoire 48 54 51 42 41 107 117 119 123 127 9 10 10 6 7 20 22 24 19 2043 Croatia 373 429 402 388 394 569 637 651 715 726 300 351 332 323 322 458 521 538 595 59344 Cuba 137 143 163 175 185 166 170 188 193 229 114 121 139 150 160 139 144 161 166 19845 Cyprus 909 991 862 909 932 938 948 917 905 941 457 516 436 443 445 472 493 464 441 44946 Czech Republic 364 392 380 358 407 930 944 972 1031 1129 334 360 347 327 372 853 867 889 942 103147 Democratic People’sRepublic of Korea 10 16 19 21 22 27 47 54 41 44 7 12 14 15 16 19 36 40 30 3248 Democratic Republicof Congo 4 4 8 10 5 13 12 11 11 12 2 2 4 5 2 6 5 5 5 549 Denmark 2629 2725 2769 2474 2545 2099 2238 2344 2398 2503 2163 2234 2276 2042 2097 1727 1835 1927 1979 206350 Djibouti 60 59 58 58 58 90 89 88 89 90 35 34 34 34 34 52 52 51 52 5351 Dominica 190 193 214 200 203 274 278 305 291 312 143 144 159 143 145 205 208 227 208 22252 Dominican Republic 111 114 121 145 153 262 279 298 345 353 35 36 39 51 55 84 88 96 122 12753 Ecuador 88 85 50 52 76 168 167 131 149 177 47 43 28 29 38 89 84 73 82 8954 Egypt 47 48 52 52 46 121 125 134 139 153 21 22 24 24 22 56 57 62 64 7555 El Salvador 153 165 163 169 174 332 347 348 364 376 59 70 71 76 81 128 148 151 164 175Member State Per capita total Per capita total Per capita government Per capita governmentexpenditure on health at expenditure on health at expenditure on health at expenditure on health ataverage exchange rate (US$) international dollar rate average exchange rate (US$) international dollar rate1997 1998 1999 2000 2001 1997 1998 1999 2000 2001 1997 1998 1999 2000 2001 1997 1998 1999 2000 200156 Equatorial Guinea 37 44 42 56 76 59 99 73 65 106 23 27 26 35 46 36 61 45 40 6457 Eritrea 9 10 11 9 10 25 29 31 32 36 6 7 7 6 6 17 19 21 22 2358 Estonia 182 223 244 222 226 430 494 548 551 562 158 193 196 170 176 373 427 440 423 43859 Ethiopia 4 4 3 3 3 12 11 11 11 14 1 1 1 1 1 5 4 4 4 660 Fiji 106 82 85 80 79 187 189 184 213 224 71 54 56 52 53 125 124 120 139 15061 Finland 1737 1734 1713 1550 1631 1543 1528 1614 1696 1845 1322 1323 1290 1164 1233 1174 1165 1215 1274 139562 France 2261 2307 2285 2067 2109 2028 2079 2204 2382 2567 1723 1754 1738 1568 1603 1546 1581 1676 1806 195163 Gabon 131 137 131 130 127 178 228 204 176 197 86 91 85 65 61 116 152 132 88 9464 Gambia 22 24 23 20 19 62 74 73 73 78 10 10 11 9 9 29 32 34 34 3965 Georgia 19 16 13 20 22 71 60 65 95 108 8 7 5 7 8 28 27 25 32 4166 Germany 2753 2773 2731 2408 2412 2458 2515 2621 2766 2820 2073 2075 2043 1807 1807 1851 1882 1961 2075 211367 Ghana 15 17 17 11 12 44 49 49 52 60 7 9 9 6 7 21 26 27 29 3668 Greece 1092 1087 1149 1015 1001 1326 1407 1523 1553 1522 577 566 614 570 560 701 732 813 872 85269 Grenada 179 205 225 245 262 298 331 372 416 445 118 135 157 171 188 197 218 259 291 32070 Guatemala 64 78 78 79 86 140 167 186 190 199 24 37 38 38 41 52 79 90 90 9671 Guinea 18 15 16 13 13 54 52 58 57 61 10 8 9 7 7 31 27 32 30 3372 Guinea-Bissau 12 9 10 10 8 44 31 36 41 37 5 4 5 5 5 19 14 18 23 2073 Guyana 48 48 44 48 50 176 182 184 196 215 40 40 37 40 40 147 152 154 162 17174 Haiti 20 23 24 22 22 51 54 53 56 56 10 11 12 11 12 26 27 27 28 3075 Honduras 42 48 48 54 59 126 134 130 145 153 22 26 25 29 31 67 72 67 78 8176 Hungary 309 315 320 305 345 684 731 771 813 914 251 251 250 231 258 556 581 602 614 68677 Iceland 2190 2509 2877 2759 2441 2003 2226 2563 2607 2643 1820 2084 2417 2309 2025 1665 1848 2154 2182 219278 India 23 22 23 23 24 64 65 71 74 80 4 4 4 4 4 10 12 13 13 1479 Indonesia 26 11 17 20 16 82 72 76 85 77 6 3 5 5 4 19 20 21 20 1980 Iran, Islamic Republic of 149 172 243 310 350 326 342 382 390 422 67 76 102 129 152 147 150 160 162 18381 Iraq 146 170 199 214 225 63 70 80 91 97 48 54 62 67 72 21 22 25 28 3182 Ireland 1404 1451 1591 1586 1714 1417 1439 1625 1797 1935 1047 1110 1159 1162 1303 1057 1101 1183 1317 147083 Israel 1551 1505 1492 1612 1641 1656 1674 1725 1748 1839 1148 1084 1059 1124 1135 1226 1206 1224 1219 127284 Italy 1570 1606 1605 1518 1584 1682 1786 1876 2047 2204 1133 1154 1155 1114 1193 1214 1283 1351 1502 166085 Jamaica 177 179 169 173 191 227 226 215 224 253 100 107 86 82 80 128 135 110 105 10686 Japan 2337 2216 2634 2890 2627 1734 1730 1852 2002 2131 1803 1715 2056 2245 2046 1338 1339 1445 1555 166087 Jordan 129 135 143 154 163 323 324 350 383 412 70 77 73 72 76 176 185 178 178 19488 Kazakhstan 44 48 37 39 44 150 163 174 186 204 32 34 24 24 27 109 114 110 117 12389 Kenya 29 33 28 30 29 110 116 111 124 114 6 8 5 7 6 24 28 21 30 2490 Kiribati 53 47 49 45 40 141 141 144 148 143 53 46 48 44 40 139 140 143 146 14191 Kuwait 596 562 536 553 537 638 750 617 540 612 474 443 422 435 423 507 591 486 425 48292 Kyrgyzstan 15 16 11 12 12 93 109 107 108 108 10 10 6 6 6 63 65 58 52 5393 Lao People’s DemocraticRepublic 10 6 8 9 10 39 33 43 45 51 6 3 4 5 6 24 16 21 24 2994 Latvia 157 171 190 191 210 385 412 439 446 509 89 104 113 107 110 219 250 262 249 26795 Lebanon 532 594 587 607 500 642 701 719 794 673 165 162 157 178 141 200 191 192 232 18996 Lesotho 31 30 31 29 23 94 98 105 109 101 24 23 25 24 18 71 77 85 88 8097 Liberia 1 1 2 2 1 91 99 110 114 127 1 1 1 1 1 63 73 84 87 9798 Libyan Arab Jamahiriya 250 249 177 175 143 274 301 282 233 239 120 124 87 90 80 131 149 138 120 13499 Lithuania 165 197 190 200 206 401 454 431 454 478 126 148 140 141 146 306 341 317 321 337100 Luxembourg 2496 2611 2756 2411 2600 2238 2402 2631 2659 2905 2274 2374 2463 2152 2336 2039 2184 2352 2374 2611101 Madagascar 4 7 6 6 6 16 24 23 23 20 3 4 4 4 4 12 15 13 15 13102 Malawi 21 15 14 12 13 41 41 42 42 39 8 5 5 4 4 15 14 16 15 14103 Malaysia 129 99 109 129 143 237 237 257 297 345 69 51 58 69 77 127 122 136 158 185104 Maldives 83 85 95 104 98 180 190 219 272 263 68 70 78 87 82 147 155 181 228 220105 Mali 10 11 10 10 11 25 25 25 32 30 5 4 3 4 4 11 9 8 13 12106 Malta 738 784 760 807 808 739 759 782 804 813 501 543 513 553 554 502 526 528 551 557107 Marshall Islands 186 187 182 188 190 332 331 327 340 343 131 124 118 122 123 234 220 213 221 222108 Mauritania 15 14 13 13 12 38 40 43 45 45 11 10 9 9 9 28 29 31 33 33109 Mauritius 109 114 113 127 128 227 256 259 288 323 67 72 70 74 76 139 160 160 169 192110 Mexico 231 244 277 327 370 418 446 471 501 544 105 114 130 150 164 190 208 221 229 241
180 <strong>The</strong> <strong>World</strong> <strong>Health</strong> <strong>Report</strong> 2003 Statistical Annex 181Annex Table 6 Selected national health accounts indicators: measured levels of per capita expenditure on health, 1997–2001Figures computed by WHO to assure comparability; a they are not necessarily the official statistics of Member States, which may use alternative rigorous methods.Member State Per capita total Per capita total Per capita government Per capita governmentexpenditure on health at expenditure on health at expenditure on health at expenditure on health ataverage exchange rate (US$) international dollar rate average exchange rate (US$) international dollar rate1997 1998 1999 2000 2001 1997 1998 1999 2000 2001 1997 1998 1999 2000 2001 1997 1998 1999 2000 2001111 Micronesia, FederatedStates of 170 167 169 169 172 315 304 302 296 319 125 121 121 121 124 232 221 217 212 230112 Monaco 1689 1783 1812 1610 1653 1516 1608 1751 1863 2016 924 956 955 878 927 829 862 923 1016 1131113 Mongolia 22 24 21 23 25 84 106 110 118 122 14 16 14 16 18 52 69 73 83 88114 Morocco 52 56 54 54 59 147 160 159 171 199 13 16 16 18 23 38 45 46 58 78115 Mozambique 10 11 11 12 11 29 32 35 40 47 6 7 7 8 8 18 20 23 27 32116 Myanmar 81 109 147 162 197 21 21 22 23 26 12 12 17 28 35 3 2 3 4 5117 Namibia 143 128 127 126 110 308 307 323 330 330 101 92 93 87 76 219 221 236 227 229118 Nauru 719 640 705 643 588 981 987 941 921 1015 640 570 628 571 521 874 878 839 819 900119 Nepal 12 11 12 12 12 58 60 59 61 63 4 4 3 4 3 18 20 18 18 19120 Netherlands 1968 2151 2191 2012 2138 1951 2164 2305 2358 2612 1335 1385 1386 1275 1354 1323 1393 1458 1495 1654121 New Zealand 1301 1125 1169 1054 1073 1357 1440 1534 1611 1724 1005 867 911 822 823 1049 1109 1195 1257 1323122 Nicaragua 45 44 44 55 60 117 110 113 147 158 24 27 24 29 29 63 66 61 77 77123 Niger 6 7 6 6 6 21 22 22 21 22 3 3 3 2 2 9 9 9 9 9124 Nigeria 35 37 10 12 15 23 26 26 26 31 4 6 2 2 3 3 4 4 4 7125 Niue 344 330 335 290 289 945 910 990 1068 1041 334 321 325 281 280 917 883 961 1036 1010126 Norway 2797 2867 3025 2817 2981 2193 2438 2550 2755 2920 2357 2428 2576 2400 2550 1848 2065 2172 2347 2497127 Oman 229 219 221 230 225 348 392 357 316 343 187 180 182 187 181 285 322 294 256 277128 Pakistan 19 19 18 18 16 73 77 80 85 85 5 6 5 4 4 20 22 20 21 21129 Palau 498 502 447 454 426 695 789 823 835 886 456 466 408 416 392 636 733 753 766 816130 Panama 231 244 252 260 258 398 411 434 452 458 158 171 176 180 178 272 289 303 313 316131 Papua New Guinea 32 29 28 27 24 107 121 144 145 144 28 26 25 24 21 95 110 129 130 128132 Paraguay 143 121 115 112 97 320 305 326 323 332 47 45 45 43 37 105 114 129 124 127133 Peru 106 105 99 97 97 207 216 231 228 231 54 57 55 54 53 107 118 129 126 127134 Philippines 41 31 36 34 30 168 162 165 169 169 18 14 16 16 14 73 70 74 81 77135 Poland 228 264 249 245 289 461 543 558 572 629 164 173 177 171 208 332 355 397 400 452136 Portugal 903 956 986 938 982 1339 1370 1457 1512 1618 586 626 666 642 677 868 898 985 1036 1116137 Qatar 813 819 824 860 885 842 1006 874 720 782 624 630 626 638 650 647 773 665 534 574138 Republic of Korea 520 352 484 577 532 657 628 762 893 948 213 163 209 256 236 270 290 329 396 421139 Republic of Moldova 37 28 15 16 18 154 125 92 94 100 27 17 8 9 10 112 76 50 53 56140 Romania 79 124 108 109 117 320 409 424 428 460 53 92 84 86 93 214 303 330 338 365141 Russian Federation 167 112 71 95 115 390 382 378 420 454 122 77 46 66 78 284 263 245 293 310142 Rwanda 16 15 14 13 11 39 39 41 43 44 8 8 8 7 6 19 20 22 23 24143 Saint Kitts and Nevis 304 323 335 364 393 464 495 507 535 576 202 216 222 241 260 307 330 336 355 382144 Saint Lucia 169 187 192 195 199 240 257 254 263 272 105 123 125 127 129 150 169 166 171 176145 Saint Vincent and theGrenadines 155 161 170 170 178 295 302 324 341 358 99 101 106 111 113 188 189 203 222 227146 Samoa 79 76 84 80 74 167 185 210 218 199 58 56 62 61 61 123 136 156 168 164147 San Marino 1188 1252 1286 1196 1222 1275 1391 1511 1610 1711 892 944 974 922 953 957 1049 1145 1240 1334148 Sao Tome and Principe 10 8 8 7 7 26 25 21 22 22 6 6 5 5 5 17 17 14 15 15149 Saudi Arabia 432 368 340 376 375 680 680 583 565 591 334 281 251 280 280 526 519 430 421 441150 Senegal 25 25 24 22 22 53 53 56 58 63 14 14 14 12 13 29 30 31 33 37151 Serbia-Montenegro 198 149 189 89 103 621 542 613 528 616 147 106 131 69 82 460 386 426 409 488152 Seychelles 490 500 491 444 450 732 752 746 733 770 355 347 338 295 307 529 522 513 487 525153 Sierra Leone 7 5 6 6 7 23 21 23 25 26 3 2 3 4 4 11 9 13 15 16154 Singapore 936 902 851 826 816 834 926 947 925 993 365 375 327 291 274 325 385 363 326 333155 Slovakia 230 235 218 208 216 608 636 664 642 681 211 215 196 186 192 558 583 595 574 608156 Slovenia 712 813 829 765 821 1097 1223 1299 1421 1545 564 616 626 582 615 868 927 981 1080 1157157 Solomon Islands 45 40 42 39 40 100 106 113 141 133 41 37 39 37 37 92 99 106 132 124158 Somalia 5 6 7 6 6 14 15 15 15 n/a 2 3 3 3 3 7 7 7 7 n/a159 South Africa 315 270 264 253 222 622 604 623 633 652 145 114 113 106 92 287 256 265 265 270160 Spain 1067 1115 1140 1048 1088 1273 1347 1428 1505 1607 773 805 822 751 778 922 973 1030 1078 1148161 Sri Lanka 27 29 30 32 30 91 102 112 121 122 13 15 15 16 15 45 52 55 60 60162 Sudan 13 14 12 14 14 31 39 38 41 39 2 3 3 4 3 6 9 9 12 7163 Suriname 207 194 104 186 153 371 404 402 407 398 108 120 62 118 92 194 249 239 258 240164 Swaziland 45 43 43 45 41 137 146 152 163 167 32 30 29 31 28 98 103 103 114 115165 Sweden 2300 2336 2395 2268 2150 1855 1903 2053 2195 2270 1975 2005 2053 1929 1832 1592 1633 1760 1866 1935Member State Per capita total Per capita total Per capita government Per capita governmentexpenditure on health at expenditure on health at expenditure on health at expenditure on health ataverage exchange rate (US$) international dollar rate average exchange rate (US$) international dollar rate1997 1998 1999 2000 2001 1997 1998 1999 2000 2001 1997 1998 1999 2000 2001 1997 1998 1999 2000 2001166 Switzerland 3762 3909 3881 3574 3774 2841 2952 3080 3160 3322 2075 2145 2148 1986 2156 1567 1619 1704 1758 1897167 Syrian Arab Republic 27 29 31 36 41 194 217 233 251 266 16 17 18 19 22 116 125 133 130 141168 Tajikistan 8 8 6 5 6 52 36 36 36 43 3 3 2 1 2 19 12 11 11 12169 Thailand 95 73 75 73 69 247 234 233 241 254 54 45 43 41 39 141 143 134 137 145170 <strong>The</strong> former YugoslavRepublic of Macedonia 114 135 117 106 115 263 340 303 302 331 96 118 100 90 98 221 296 259 255 281171 Timor-Leste 46 32 30 28 42 n/a n/a n/a n/a n/a 41 27 27 20 25 n/a n/a n/a n/a n/a172 Togo 11 12 13 8 8 40 51 55 45 45 5 7 8 4 4 20 30 34 22 22173 Tonga 97 87 87 81 73 192 194 203 209 223 58 53 53 49 45 115 119 123 126 138174 Trinidad and Tobago 203 229 238 248 279 332 378 379 360 388 87 106 111 114 121 143 175 176 165 168175 Tunisia 132 133 139 126 134 360 367 398 417 463 102 102 106 94 101 280 282 302 310 350176 Turkey 125 149 137 148 109 272 301 291 311 294 90 107 98 105 77 195 217 207 222 209177 Turkmenistan 28 34 42 42 57 170 195 226 222 245 21 24 29 31 42 129 137 153 166 180178 Tuvalu 71 68 75 74 66 495 558 566 553 673 42 41 43 39 35 293 330 324 296 359179 Uganda 12 11 11 14 14 32 32 37 52 57 3 4 5 8 8 9 12 15 29 33180 Ukraine 53 42 27 27 33 179 166 145 156 176 40 30 19 18 22 134 119 99 107 120181 United Arab Emirates 703 724 729 821 849 727 754 710 781 921 539 557 552 623 643 558 580 538 593 698182 United Kingdom 1563 1683 1792 1783 1835 1516 1573 1704 1827 1989 1253 1349 1442 1444 1508 1214 1261 1371 1479 1634183 United Republic of Tanzania 10 11 11 11 12 21 23 23 25 26 4 5 5 5 5 9 11 10 12 12184 United States of America 3939 4095 4287 4540 4887 3939 4095 4287 4540 4887 1784 1824 1895 2005 2168 1784 1824 1895 2005 2168185 Uruguay 662 696 675 653 603 894 965 988 986 971 270 286 326 304 279 364 396 477 459 450186 Uzbekistan 27 24 25 21 17 89 85 82 88 91 19 18 19 15 12 65 64 60 66 68187 Vanuatu 47 43 44 44 42 102 105 109 109 107 31 28 28 27 25 67 69 70 66 63188 Venezuela, BolivarianRepublic of 210 221 244 296 307 338 333 324 353 386 120 120 132 169 191 193 181 175 201 240189 Viet Nam 16 18 18 21 21 92 108 113 128 134 5 6 6 6 6 29 35 37 36 38190 Yemen 16 16 17 19 20 52 63 58 59 69 5 6 5 7 7 16 25 19 21 24191 Zambia 24 20 19 18 19 51 48 47 47 52 13 12 11 10 10 28 28 26 25 27192 Zimbabwe 66 59 35 42 45 221 275 192 182 142 39 33 17 22 20 131 154 94 92 64a See explanatory notes for sources and methods.n/a Used when the information accessed indicates that a cell should have an entry but no estimates could be accessed.0 Used when no evidence of the schemes to which the cell relates exist. Some estimates yielding a ratio inferior to 0.04% are shown as 0.
182 <strong>The</strong> <strong>World</strong> <strong>Health</strong> <strong>Report</strong> 2003List of Member States byWHO region and mortality stratumTo aid in cause-of-death and burden-of-disease analyses, the 192 Member States of the <strong>World</strong><strong>Health</strong> Organization have been divided into five mortality strata on the basis of their levels ofmortality in children under five years of age (5q0) and in males 15–59 years old (45q15). Thisclassification was carried out using population estimates for 1999 (using United Nations PopulationDivision data) and estimates of 5q0 and 45q15 based on WHO analyses of mortalityrates for 1999.Quintiles of the distribution of 5q0 (both sexes combined) were used to define some countriesas very low child mortality (1st quintile), some as low child mortality (2nd and 3rdquintiles) and others as high child mortality (4th and 5th quintiles). Adult mortality 45q15was regressed on 5q0 and the regression line used to divide countries with high child mortalityinto high adult mortality (stratum D) and very high adult mortality (stratum E). StratumE includes the countries in sub-Saharan Africa where HIV/AIDS has had a very substantialimpact.<strong>The</strong> following table summarizes the five mortality strata. When these mortality strata areapplied to the six WHO regions, they produce 14 subregions, which are used in this reportand in the Annex Tables to present results.Definitions of mortality strata used to definesubregionsMortality stratum Child mortality Adult mortalityA Very low LowB Low LowC Low HighD High HighE High Very high<strong>The</strong> WHO Member States in each region are groupedby subregion as listed below. This classification has noofficial status and is for analytical purposes only.<strong>The</strong> total number of WHO Member States has risen to192, with the addition in <strong>The</strong> <strong>World</strong> <strong>Health</strong> <strong>Report</strong> 2003of Timor-Leste, which is classified in the high-mortalitydeveloping region of Sear-D. In 2003, the Fifty-sixth<strong>World</strong> <strong>Health</strong> Assembly endorsed the reassignment ofCyprus to the European Region from the Eastern MediterraneanRegion.Three major groupings of countries are used in Chapter 1, defined by geography, state ofeconomic and demographic development, and mortality patterns. <strong>The</strong>se are developed countries(Amr-A, Eur-A, Eur-B, Eur-C and Wpr-A), high-mortality developing countries (Afr-D,Afr-E, Amr-D, Emr-D and Sear-D), and low-mortality developing countries (Amr-B, Emr-B,Sear-B and Wpr-B).
List of Member States by WHO region and mortality stratum 183WHO Member States, by region and mortality stratumRegion andmortality stratumDescriptionBroad groupingMember StatesAfricaAfr-DAfrica with high child and highadult mortalityHigh-mortality developingAlgeria, Angola, Benin, Burkina Faso, Cameroon, Cape Verde, Chad,Comoros, Equatorial Guinea, Gabon, Gambia, Ghana, Guinea, Guinea-Bissau, Liberia, Madagascar, Mali, Mauritania, Mauritius, Niger, Nigeria,Sao Tome and Principe, Senegal, Seychelles, Sierra Leone, TogoAfr-EAfrica with high child and veryhigh adult mortalityHigh-mortality developingBotswana, Burundi, Central African Republic, Congo, Côte d’Ivoire,Democratic Republic of the Congo, Eritrea, Ethiopia, Kenya, Lesotho,Malawi, Mozambique, Namibia, Rwanda, South Africa, Swaziland,Uganda, United Republic of Tanzania, Zambia, ZimbabweAmericasAmr-AAmericas with very low childand very low adult mortalityDevelopedCanada, Cuba, United States of AmericaAmr-BAmericas with low child and lowadult mortalityLow-mortality developingAntigua and Barbuda, Argentina, Bahamas, Barbados, Belize, Brazil,Chile, Colombia, Costa Rica, Dominica, Dominican Republic, El Salvador,Grenada, Guyana, Honduras, Jamaica, Mexico, Panama, Paraguay, SaintKitts and Nevis, Saint Lucia, Saint Vincent and the Grenadines, Suriname,Trinidad and Tobago, Uruguay, Venezuela (Bolivarian Republic of)Amr-DAmericas with high child andhigh adult mortalityHigh-mortality developingBolivia, Ecuador, Guatemala, Haiti, Nicaragua, PeruSouth-East AsiaSear-BSouth-East Asia with low childand low adult mortalityLow-mortality developingIndonesia, Sri Lanka, ThailandSear-DSouth-East Asia with high childand high adult mortalityHigh-mortality developingBangladesh, Bhutan, Democratic People’s Republic of Korea, India,Maldives, Myanmar, Nepal, Timor-LesteEuropeEur-AEurope with very low child andvery low adult mortalityDevelopedAndorra, Austria, Belgium, Croatia, Cyprus, Czech Republic, Denmark,Finland, France, Germany, Greece, Iceland, Ireland, Israel, Italy,Luxembourg, Malta, Monaco, Netherlands, Norway, Portugal, SanMarino, Slovenia, Spain, Sweden, Switzerland, United KingdomEur-BEurope with low child and lowadult mortalityDevelopedAlbania, Armenia, Azerbaijan, Bosnia and Herzegovina, Bulgaria,Georgia, Kyrgyzstan, Poland, Romania, Slovakia, Tajikistan, <strong>The</strong> formerYugoslav Republic of Macedonia, Serbia and Montenegro, Turkey,Turkmenistan, UzbekistanEur-CEurope with low child and highadult mortalityDevelopedBelarus, Estonia, Hungary, Kazakhstan, Latvia, Lithuania, Republic ofMoldova, Russian Federation, UkraineEasternMediterrannneanEmr-BEastern Mediterranean with lowchild and low adult mortalityLow-motality developingBahrain, Iran (Islamic Republic of), Jordan, Kuwait, Lebanon, Libyan ArabJamahiriya, Oman, Qatar, Saudi Arabia, Syrian Arab Republic, Tunisia,United Arab EmiratesEmr-DEastern Mediterranean with highchild and high adult mortalityHigh-mortality developingAfghanistan, Djibouti, Egypt,* Iraq, Morocco, Pakistan, Somalia, Sudan,YemenWestern PacificWpr-AWestern Pacific with very lowchild and very low adultmortalityDevelopedAustralia, Brunei Darussalam, Japan, New Zealand, SingaporeWpr-BWestern Pacific with low childand low adult mortalityLow-mortality developingCambodia,** China, Cook Islands, Fiji, Kiribati, Lao People’s DemocraticRepublic,** Malaysia, Marshall Islands, Micronesia (Federated States of),Mongolia, Nauru, Niue, Palau, Papua New Guinea,** Philippines, Republicof Korea, Samoa, Solomon Islands, Tonga, Tuvalu, Vanuatu, Viet Nam* Following improvements in child mortality over recent years, Egypt meets criteria for inclusion in subregion Emr-B with low child and low adult mortality. Egypt has beenincluded in Emr-D for the presentation of subregional totals for mortality and burden to ensure comparability with previous editions of <strong>The</strong> <strong>World</strong> <strong>Health</strong> <strong>Report</strong> andother WHO publications.** Although Cambodia, the Lao People’s Democratic Republic, and Papua New Guinea meet criteria for high child mortality, they have been included in the Wpr-Bsubregion with other developing countries of the Western Pacific Region for reporting purposes.
184 <strong>The</strong> <strong>World</strong> <strong>Health</strong> <strong>Report</strong> 2003
185IndexPage numbers in bold type indicate main discussions.“3 by 5” target for antiretroviral therapy vii, xiii, 44, 52, 53, 105, 109accompagnateurs, in Haiti 49accountability 38, 120, 126acute flaccid paralysis (AFP), surveillance 60, 62, 66adult disease, complex and diverse pattern 21adult health, inequities 12–22adult mortalitydeveloping countries 6global changes 12–13inequities 17not adequately measured 116sub-Saharan Africa xiitrends 15–17, 135–136Afghanistanchild mortality 8polio 62, 63Africa (AFR)adult mortality 16causes of death in children 12child mortality xii, 3, 7, 8, 9, 13health spending vs burden of disease 120health workforce training 111–112HIV/AIDS 45, 46life expectancy 3, 4, 12–13migration of health care workers 113mortality rates 5polio immunization 63vital registration 117see also sub-Saharan Africaageing populations see population ageingAIDS see HIV/AIDSair pollution, from road transport 95, 99airports, screening measures 73, 75–77, 79, 81alcohol consumption, risk factor for CVDs 85alcohol and drug use disorders 19, 20Alma-Ata Declaration (1978) viii, xv, 85, 106Americas (AMR)child mortality 9, 11Observatory of Human Resources in <strong>Health</strong> Sector Reforms 115see also Latin America; North America;United States of America (USA)Angola, polio immunization 63antiretrovirals (ARVs)“3 by 5” target vii, xiii, 44, 52, 53, 105, 109availability vii, xiii, 35, 43, 52cost 50in developing countries vii, 45Khayelitsha programme 108–109provision in primary care setting 108–109quality assurance 35Asiacauses of death in children 11HIV/AIDS 45life expectancy 4polio immunization 63road traffic deaths 96Asia–Pacific Economic Cooperation (APEC) 78aspirin 88assistant medical officers 112Association of Southeast Asian Nations (ASEAN) 78atherosclerosis 87AustraliaHIV prevention and care 47life expectancy 3, 18Austria, deaths related to air pollution 99Bamako Initiative 121Bangladeshchild mortality and poverty 9Expanded Programme on Immunization 124–125polio-free 63behvarzes, in Iran 107Bhutan, polio-free 63bicycles and motorcycles 97births, attended by skilled personnel 29, 31, 110–111blood pressure, raised, risk factor for CVDs 85blood pressure drugs 88blood safety 45, 51Bolivia, child mortality 9, 11Botswanalack of health personnel 110life expectancy 16bottlenecks, in health system financing 121–122brain drain, national and international 112–113Brazilchild mortality 30HIV/AIDS prevention and care xiii, 49participatory budgeting 126polio eradication 59population ageing 18breast cancer 19breast-feeding 30
186 <strong>The</strong> <strong>World</strong> <strong>Health</strong> <strong>Report</strong> 2003burden of diseaseleading causes 14measuring 5–6, 137see also double burden of diseaseCambodiahealth service delivery 113national polio campaign 60road traffic injury prevention 98CanadaGlobal Public <strong>Health</strong> Intelligence Network (GPHIN) 76SARS outbreak 73, 75cancerdeaths 19mortality data 137cardiovascular diseases (CVDs)burden of disease 14, 19causes 87comprehensive approaches 88in developed countries 86–87, 88in developing countries xiv, 21early deaths 85epidemic xi, 85–91leading causes of death 85“lifestyle diseases” 85low-cost interventions 88policy interventions 88–91prevention and control 90cardiovascular health, promotion and protection 87care for chronic conditions framework 108causes of deathin adults 13, 85–86in children 11–12data 116, 136–137, Annex Tables 2 and 3main 3misattribution or miscoding 137regional differences 13censuses and census data 116, 117, 135–136cerebrovascular disease see strokeChad, lack of health personnel 110child mortality 7–12Africa 3causes of death 11–12developing countries vii, xii, 7, 10as development indicator 27–29gender differences 8and HIV/AIDS 10inequities vii, 7–11, 10Latin America 34levels and trends 135–136low-cost interventions 30Millennium Development Goals 27regional changes 9–11socioeconomic differences 8–9Chileaccess to health care 122reduced child mortality 11Chinaaccess to health care 124child mortality 8, 12child smokers 96gender inequities 8household survey 138Millennium Development Goals 27mortality rates 5polio 60, 63population ageing 18road traffic deaths 96SARS epidemic 76, 77, 78vital registration 117CHOICE project 121cholesteroldecrease in population levels 88risk factor for CVDs 85cholesterol lowering drugs 88chronic care model 108chronic obstructive pulmonary disease 20chronic respiratory diseases 21civet cat 74civil society 50, 51, 126climate change gases 95, 99clinical information systems 114Colombiahealth insurance system 124household survey 138population ageing 18colon/rectum cancer, deaths 19commercial interests 90, 91, 93see also private sectorCommission on Macroeconomics and <strong>Health</strong> 26, 32, 37, 109Common Country Assessment 37communicable diseasesas cause of death in adults 13as cause of death in children 11eradication xcommunity health workersin HIV/AIDS prevention and care 49in Iran 107mobilizing 114, 115training 112community involvement in health care system 125–127comorbidity 138condom use 30, 45, 48, 49conflicts 63, 109Congo, Democratic Republic,national immunization days (NIDs) 63Congo, Republic, national immunization days (NIDs) 63consumer groups 90, 91coronary heart disease, risk factors 87coronavirus, SARS xiv, 74Costa Rica, reduced child mortality 11Cubachild mortality 11polio vaccination 59data collection and analysis 116death certification 117death registration datacause-specific 6see also causes of deathdebt, developing countries 31, 32dementia 21demographic techniques 136depressive disordersleading cause of burden of disease 14see also neuropsychiatric conditionsdeveloped countriescardiovascular diseases (CVDs) 86–87, 88life expectancy 3–4road safety measures 97
Index 187developing countriesadult mortality 6antiretroviral (ARV) therapy vii, xiii, 45cardiovascular diseases (CVDs) 85causes of death 21, 85child mortality vii, xii, 7, 10debt 31, 32disabling conditions 21double burden of ill-health xi, 21health care systems 110life expectancy xiimaternal mortality 14mortality rates 4–7noncommunicable diseases xiv, 18–19population ageing 18road traffic deaths and injuries xv, 20, 95, 96developmentand health 26–27new concept 26–27development assistance 31, 32diabetes, identification and management 88diagnostic and treatment algorithms 114diarrhoeal diseases, as cause of death in children 3, 12diet see nutritiondisability, resulting from maternal conditions 14disability-adjusted life years (DALYs) 5, 137disabling conditions, non-fatal 20–22disease burden see burden of diseaseDjibouti, adult mortality 17Doha Declaration 32donor countriesMillennium Development Goal 8 30–32, 38support for polio eradication 60–62donors, non-traditional 64double burden of disease x–xi, xii, 13, 85, 87see also burden of diseasedriverssafety measures 97see also road trafficdrugs see medicineseastern Europechild mortality 9, 11life expectancy 4, 13, 18Millennium Development Goals 33morbidity and mortality rates xii, 16, 20Eastern Mediterranean Region (EMR)adult mortality 17child mortality 9, 11life expectancy 4polio eradication 62, 63economic capabilities, effect on health 26–27Egypthousehold survey 138polio 62electronic communications 75–76, 77, 79, 118environmental issues xii, 27, 95, 99equity, monitoring 116, 118Ethiopia, road traffic injury prevention 98Europe (EUR)adult mortality 17HIV/AIDS 47, 48life expectancy 3polio immunization 63SARS epidemic 73vital registration 116see also eastern EuropeEuropean Observatory on <strong>Health</strong> Care Systems 106exclusion from health care 123fees, for health care 120–121Fermin Tenorio, Luis 60fibre, dietary 87Fiji, child smokers 96financing mechanisms, policy decisions 120–121Finland, agricultural subsidies 88France, deaths related to air pollution 99fruit and vegetables in diet 87, 88Fujian province, China 76Gabonnational immunization days (NIDs) 63reduced child mortality 10<strong>The</strong> Gambia, reduced child mortality 10gender inequitiesaccess to health care 122, 123child mortality 8elimination 27in health professions 80, 111and HIV/AIDS 43, 44, 50injuries 13, 20premature mortality 15general government expenditure on health 140, 144Georgia, household survey 138GFATM see Global Fund to Fight AIDS, Tuberculosis andMalaria (GFATM)Ghanareduced child mortality 10roadway safety strategy 99global alerts, timely 79Global Burden of Disease study 137, 138Global Commission for the Certification of PoliomyelitisEradication 66Global Fund to Fight AIDS, Tuberculosis andMalaria (GFATM) 32, 51, 52global health, ethical vision xiglobal health emergency, HIV/AIDS vii, xiiiglobal health situation, assessment xiiGlobal NCD InfoBase 90Global Outbreak Alert and Response Network (GOARN) 75, 77Global Polio Eradication Initiative xiii, 65Global Public <strong>Health</strong> Intelligence Network (GPHIN) 76Global Youth Tobacco Survey 96globalization, economic xi, 91, 110, 127GOARN see Global Outbreak Alert and ResponseNetwork (GOARN)governmentrole in building health systems 115role in ensuring health equity 122–127stewardship of health care system 125–127Guangdong, China, SARS epidemic 74, 76Guatemalachild mortality 34health care services 113guidelines, written, for health care workers 114Guinea, health personnel 110–111Haitichild mortality 11HIV/AIDS prevention and care 47, 49–50, 51
188 <strong>The</strong> <strong>World</strong> <strong>Health</strong> <strong>Report</strong> 2003harm-reduction strategies 48, 52healthand development 26–27fundamental human right xiinequities ixobjectives, national and global xi–xiitargets and indicators 34, 117health careaccess to 123–125inequities vii, ix, 125organization and delivery of services 108targeting 123–124unsafe practices 44see also primary health carehealth care systems see health systemshealth care workers see health workershealth expendituredata 139–143, Annex Table 6out of pocket 107, 109–110, 120–121, 142private 140, 142public (government) 140, 144regional inequities 119health houses, in Iran 107health informationavailability 126failings 116–119improvement of systems 117–119population-based 116uses 117health insurance schemes 120, 121, 124<strong>Health</strong> InterNetwork (HIN) 118<strong>Health</strong> InterNetwork Access to Research Initiative (HINARI) 118<strong>Health</strong> Metrics Network 36, 119health outcomes, non-fatal 20–22health professionals see heath care workershealth professions see health workforcehealth promotion, advocacy 90–91health services, trade in 31health statistics, improving quality 36<strong>Health</strong> System in Transition country profiles 106health systemsbased on primary health care ix, x, xiv, xv, 106, 108–110decentralization 117definition 105development viiand expanded HIV/AIDS treatment 108–109financial accounting 139, 143financing 119–122see also health expenditureincreased expectations 107inefficiency 109inequities x, 122–127managerial staff 111, 114minimum requirements x–ximodel for improvement 114nongovernmental organizations 113performance assessment framework 105–106private sector 107, 110, 113quality improvement 114reform and decentralization 107, 108, 110research 127–128scaling up 67–69, 124–125strengthening xv, 34–35, 53, 80, 103–131team working 114see also primary health carehealth transition, regional patterns 13–14health workerscooperation 87–88decision support tools 114financial and non-financial incentives 113, 114improved productivity 113, 115mid-level practitioners 112migration 112–113SARS risk 76, 80health workforcebuilding 114education and training 118gender discrimination 80, 111global crisis 110–115size, composition and distribution 110–111training 111–112health-adjusted life expectancy (HALE) 21, 137–139, Annex Table 4hearing loss 20heart disease see cardiovascular disease; ischaemic heart diseaseHigh-Level Forum on <strong>Health</strong>, Nutrition andPopulation Related MDGs 37Highly Indebted Poor Country (HIPC) Initiative 31, 32highways see roadwaysHIPC Initiative see Highly Indebted Poor Country (HIPC)InitiativeHIV/AIDSAfrica xii, 3, 29, 45, 46Asia 45burden of disease 14, 17–18child mortality 10, 12control policy 51–52destigmatizing 48, 49effect on life expectancy and disability 16, 20epidemiology 44–46equity in prevention and care 47European Region 47global health emergency vii, ix, 29, 43, 52–54history of the epidemic 44–46human rights approach 50–51local variations and subepidemics 47, 48, 51–52mortality x, 3, 18, 43orphans 30, 46, 47outcome gap xiii, 43–44people living with 48, 49, 50, 51, 52, 126prevention and care xiii, 41–55, 47–48, 48–50security impact xisocioeconomic factors 46, 48transmission 29, 44, 45, 47, 48, 51treatmentin primary health care setting 108–109in resource-poor settings 49scaling up ix, 115USA trends 44voluntary counselling and testing 48, 51WHO’s expanded role 52–53see also antriretrovirals (ARVs)Hong Kong Special Administrative Region (China),SARS outbreak 73, 74, 76, 77household surveys 117, 138human development, definition 26human poverty, definition 26human rightshealth xi, 35and HIV/AIDS 50–51and Millennium Development Goals 35
Index 189Hungary, life expectancy for older adults 18hypertension see blood pressure, raisedIceland, child mortality 7, 8ill-health, economic effects 26–27Indiaaccess to health care 124child mortality 8, 12gender inequities 8household survey 138Marginal Budgeting for Bottlenecks 122Millennium Development Goals 27polio 63, 66premature deaths from cardiovascular diseases (CVDs) 85road traffic deaths 96vital registration 117indicators, identifying 36indices, multifactorial 26indigenous populations, access to health care 122Indonesiabonuses for medical graduates 113health personnel 110–111household survey 138polio-free 63population ageing 18Influenza Laboratory Network 76infrastructure, Internet access 118injecting drug useEuropean Region 47, 48and HIV/AIDS 44, 45, 52injuriesburden of disease in young men 19–20as cause of death 13, 17gender inequities 13, 20increasing xii, xivintentional 20Integrated Management of Childhood Illnesses (IMCI) 30International Classification of Functioning,Disability and <strong>Health</strong> 138International Conference on Financing for Development,Monterrey, Mexico (2002) 26, 31International Conference on Population and Development,Cairo, Egypt, (1994) 34International Development Goals 35International Financial Facility 32International <strong>Health</strong> Regulations 78International Statistical Classification of Diseases andRelated <strong>Health</strong> Problems (ICD) 136Internet see electronic communicationsinterventionsfor cardiovascular diseases (CVDs) 88–91monitoring 116prioritizing 121to reduce child mortality 27interview surveys, population-based 116investment in health, global 109Iran, Islamic Republichealth houses 107household survey 138Iraq, rebuilding the health sector 109ischaemic heart diseaseburden of disease 14, 19see also cardiovascular diseases (CVDs)Japanfunding for SARS response 76life expectancy ix, 3, 18Jiang Zemin, President 60Kenya, population ageing 18Khayelitsha antiretroviral programme 108–109“Kick Polio Out of Africa” campaign 60Korea, Democratic People’s Republic, polio-free 63Kuwait, adult mortality 17Latin AmericaAIDS programme 49child mortality 9, 11, 34life expectancy 4Lebanonhousehold survey 138polio case 62Lesotho, life expectancy 16life expectancyAfrica 3global trends 3–4health-adjusted (HALE) 21, 137–139, Annex Table 4inequities ix, x, xii, 4regional differences 12summary measures 135life tables 117, 135–136, Annex Table 1liver cancer, deaths 19lower respiratory tract conditions, as cause of death 3, 12lung cancer, deaths 19Making Pregnancy Safer initiative 31malaria, as cause of death 3, 12malaria drugs, quality assurance 35Maldives, polio-free 63Malicommunity-owned health centres 125Marginal Budgeting for Bottlenecks 122Mandela, Nelson, President 60Marginal Budgeting for Bottlenecks 121–122mass deprivation 122, 123, 124maternal conditions, leading causes of burden of disease 14maternal mortalitydeveloping countries 14inequities 29, 31Mauritania, Marginal Budgeting for Bottlenecks 122Mauritius, decrease in population cholesterol levels 88means testing 124measles, mortality in children 12Médecins Sans Frontières 108medical and scientific journals, online availability 118medicinesaccess to 32essential 30, 35quality assurance 35mental ill-health see neuropsychiatric conditionsMexicohealth information 126HIV/AIDS care 49household survey 138road traffic injury prevention 98Millennium Campaign 37Millennium Development Goalscore strategy 37donor countries 25, 30–32, 38
190 <strong>The</strong> <strong>World</strong> <strong>Health</strong> <strong>Report</strong> 2003in eastern Europe 33equitability 34government commitments 25, 26health-related viii, xiii, 23–39, 33, 36, 105and human rights 35interdependent and interrelated 27, 37maternal mortality 51national ownership 33in practice 32–35progress ix, x, 27, 27–30, 37–38, 38targets and indicators 28, 33, 34and WHO 35–38worldwide commitment 37Millennium Project 37Millennium Summit (2000) 25ministries of health, responsibilities 126morbidity, inadequately measured 116mortality, global patterns 4–7Mozambique, técnicos de cirurgia 112Multi-Country Survey Study 137–138musculoskeletal disease 20, 21Myanmar, polio-free 63national health accounts (NHA) 136–143, Annex Table 5National Immunization Days (NIDs) xiii, 60, 62, 65national surveys 116neonatal survival 10Nepalchild mortality gender inequities 8polio-free 63neuropsychiatric conditions 19, 20new diseases x, xivrisk communication 81SARS 71–82New Zealandaccess to health care 122life expectancy 3smoking cessation initiatives 95Nicaragua, reduced child mortality 11nicotine replacement therapy products 94Nigeraccess to health care 122child mortality and poverty 9Nigeriahousehold survey 138polio burden 66noncommunicable diseasesas cause of death 13, 85–86developing countries xiv“double burden” 85increasing burden 18–19nutrient intake goals 89prevention and control strategy 89, 90public health policies 87–88risk factors 85, 87, 90Western/lifestyle diseases 85nongovernmental organizationsin Bangladesh 125in cardiovascular disease control 113health sector 110, 113in HIV/AIDS effort 52in tobacco control 93norms, global, for products with health impacts 90North America, life expectancy 3Northern Mariana Islands, child smokers 96nurse practitioners 112nurseshigh demand 113provided with motorcycles in Senegal 113nutritiondeficiencies 21diet high in saturated fat, sugar and salt 87fresh fruit and vegetables 87, 88intake goals 89for people living with HIV/AIDS 52obesity, risk factor for cardiovascular diseases (CVDs) 85Observatory of Human Resources in <strong>Health</strong> Sector Reforms 115oils, healthy 88older adults, mortality and disease 18Oman, reduced child mortality 10–11oral health professionals 94oral polio vaccine (OPV) 59Organisation for Economic Co-operation and Development (OECD)international development targets 26System of health accounts 139Organization of African Unity (OAU) 60orphans 30, 46, 47overweight see obesityPacific Islands, mid-level health practitioners 112Pakistanchild mortality 8, 30gender inequities 8polio 62, 66Palau, child smokers 96Pan American <strong>Health</strong> Organization (PAHO) 60, 115Paraguay, health personnel 110–111partnershipsfor development 31in polio eradication 59–60, 66patients, systematic support and referral 114people living with HIV/AIDS 48, 49, 50, 51, 52organizations 126perinatal conditions, as cause of death in children 11–12Peru, reduced child mortality 11.Philippineschild mortality 30child smokers 96polio eradication 62SARS response 76physical inactivity 87phytochemicals 87pneumonia see lower respiratory tract conditionsPolandlife expectancy for older adults 18nutrition 88road traffic injury prevention 98polioendemic areas xiii, 61, 66global surveillance and laboratory capacity 66polio eradication x, xiii, 57–69completing 66–67Eastern Mediterranean Region 62financial resources and in-kind contributions 64funding 63–64infrastructure 68partnerships 59–60, 66personnel 65–66reasons for success 67–69
Index 191South-East Asia 63polioviruscontainment 67indigenous 59transmission 66political leaders, role in polio eradication 60–63population ageingand cost of care 88in developing countries 18and high demand for nurses 113population healthaverage level 137statistics 5population laboratories 135–136population risk reduction 88population size and structure 135population-based household surveys 117povertyadverse effects of traffic 100and child mortality 7, 8–9definition 8and health 3, 122and impact of HIV/AIDS 43new concept 26–27perinatal conditions 3reduction x, 26–27, 27see also social inequalitypregnancysafer 31see also maternal conditions; reproductive healthpremature mortalitygender discrepancies 15regional variations 15see also adult mortality; child mortalityprimary education enrolment rates 27primary health careAlma-Ata principles 108as basis of health systems ix, xi, 105changing environment 107–108defining 106evidence based 108health information 116–117importance viiout-of-pocket payments 107, 120–121principles 106–107, 107–110selective 107strengthening 53see also health systemsprivate expenditure on health 140, 142private sectorin health system 107, 110, 113in HIV/AIDS emergency 52see also commercial interestsprofessional cooperation 87–88public expenditure on health 140, 144public healthcompetition for resources 87effect of SARS 78international 78, 79statistics 116public sector unions 113queuing for health care 123, 124raccoon dog 74racial and ethnic discrimination 122, 123reporting, prompt and open 78, 79reproductive health, International Development Goals 34research studies, health information 116risk factors, noncommunicable diseases 85, 87road safetyglobal equity 99government commitment 99national programmes 98policies and practices 96responsibility for 97road traffic, growth xivroad traffic accidents/injuriesepidemic 95–100gender discrepancy 20global economic cost 96hidden epidemic xi, xvleading cause of burden of disease 20political awareness 97prevention 95, 97, 98surveillance and research 98see also injuriesroad users, vulnerable 96, 97roadway safety 97, 98low-cost strategy 99Rotary International, in polio partnership 60, 64, 65Russian FederationHIV/AIDS 45injecting drug use 48life expectancy for older adults 18Sabin, Albert 59, 63sample registration systems 117, 135–136SARSadvice and information 77airport screening measures 73, 75–77, 79, 81burden on health systems 80case definition 73case fatality ratio 74cases worldwide 75, 79contact tracing and surveillance 77, 81control measures 77, 80, 81detection and response 75–78early cases 73–74economic impact 78emergency response and media interest 78global alerts 79key lessons xiv, 78–81management and control strategies 74new disease 71–82origins and spread xiv, 74–75possible recurrence 78, 81response in Western Pacific Region (WPR) 76transmission 74, 77Scientific Peer Review Group (SPRG) 138security, and public health xiSenegal, nurses provided with motorcycles 113severe acute respiratory syndrome see SARSsex workers 47, 48sexually transmitted infections (STIs)and HIV/AIDS 51USA 48Sierra Leonechild mortality 8life expectancy ix
192 <strong>The</strong> <strong>World</strong> <strong>Health</strong> <strong>Report</strong> 2003polio immunization 63Sihanouk, King 60Singaporechild mortality 8child smokers 96household survey 138SARS response 73, 75, 76, 77Slovakia, household survey 138smokingcessation 88, 94–95see also tobaccosocial inequalityand impact of HIV/AIDS 43and injecting drug use 45socioeconomic factors see povertySomalia, polio 62, 63South Africagender discrimination in health professions 111HIV/AIDSprevention and care 47, 108–109socioeconomic impact 46tobacco excise taxation 94South-East Asiapolio eradication 63vital registration 117South-East Asia Region (SEAR), child mortality 9Sri Lanka, polio-free 63STEPwise approach to Surveillance (STEPS) 90stomach cancer, deaths 19stroke (cerebrovascular disease), burden of disease 14, 19sub-Saharan Africaaccess to ARVs viiadult mortality xiicause of death in children 12fragile health 3HIV/AIDS xii, 3, 29lack of health personnel 110Millennium Development Goals 27SudanBasic Development Needs programme 125, 126polio eradication 62suicides 19, 20survey-based sampling 117surveys 135–136Swaziland, life expectancy 16Sweden, life expectancy for older adults 18Switzerland, deaths related to air pollution 99Syrian Arab Republic, household survey 138Taiwan, China, SARS 78, 79Tanzania, United Republiclack of health personnel 110stroke mortality rates 85vital registration 7tariffs and subsidies 31taxationin funding of heath care 120–121of tobacco 87, 94técnicos de cirurgia, in Mozambique 112terrorist risks 67, 79, 81tertiary care, disproportionate expenditure 109tetanus, mortality in children 12Thailandaccess to health care 124Consumer Foundation 125health warnings on cigarette packets 94HIV/AIDS prevention activities 48National Forums for <strong>Health</strong> Care Reform 126polio-free 63population ageing 18<strong>The</strong> AIDS Service Organization (TASO) 48Tiwi Islands, access to health care 122tobaccocontraband/counterfeit products 91control 92–95global epidemic xi, xiv, xv, 19, 91–95rising consumption 92taxation 87, 94tobacco dependence, treatment 94tobacco industry 93tobacco usemortality related to 92, 95risk factor for cardiovascular disease (CVD)s 85, 87trade and development 31–32Trade-Related Aspects of Intellectual Property Rights (TRIPS) 31traditional healers 114, 115traffic noise 99trauma response systems 99travellersadvice 73, 77, 79–80, 81screening at airports 73, 75–77, 79, 81tuberculosisin African countries 45leading cause of death 43opportunistic infection 51prison-seated epidemics 45tuberculosis drugs, quality assurance 35Turkeyaccess to health care 122, 124household survey 138Ugandaelimination of user fees 121HIV/AIDS prevention and care 49Millennium Development Goals 29UkraineHIV/AIDS 45injecting drug use 48UNAIDS (Joint United Nations Programme on HIV/AIDS) 36, 52underinvestment 29undernutrition, as cause of death in children 12United NationsCharter xicountry teams 37Department for Economic and Social Affairs 98Development Assistance Framework 37Development Programme 26, 36, 98General Assembly 98Millennium Action Plan 118Millennium Declaration 25Millennium Development Goalssee Millennium Development GoalsPopulation Division 36, 135Special Rapporteur on the Right to <strong>Health</strong> 35System of national accounts (SNA93) 139United Nations Children’s Fund (UNICEF) 36, 60, 98United States of America (USA)death rates related to motor vehicles 97HIV/AIDS 44, 47, 48sexually transmitted infections (STIs) 48
Index 193United States Census Bureau 135United States Centers for Disease Control and Prevention (CDC) 60United States Millennium Challenge Account 32urban areas, adverse effects of traffic 99–100Urbani, Dr Carlo 78Uzbekistan, health care deprivation 122, 123years lived with disability (YLD) 5years lost through disability (YLD) 137Zimbabwe, adult mortality and life expectancy 16vehicle safety 97, 98–99Viet Namroad traffic injury prevention 98SARS outbreak 73, 75, 76, 77violence see conflicts; injuriesvisual impairment 20vital registration 6–7, 116, 135–136regional disparity 116–117vitamin A supplementation 65, 66volunteersin disease control inititatives 68in expanding access to primary health care 114, 115in polio eradication xiii, 59, 60, 64, 65wartorn countries, polio immunization 63water, safe 27Western Pacific Region (WPR)child mortality 9child smokers 96liver cancer deaths 19response to SARS 76women’s healthimproving 51see also gender inequities<strong>World</strong> Bank, public health recommendations 107<strong>World</strong> <strong>Health</strong> Assembly (1954) 85<strong>World</strong> <strong>Health</strong> Assembly (1988) 59, 65<strong>World</strong> <strong>Health</strong> Assembly (2002) 34<strong>World</strong> <strong>Health</strong> Assembly (2003) xv, 78, 91, 92<strong>World</strong> <strong>Health</strong> Day 98<strong>World</strong> <strong>Health</strong> Organization (WHO)CHOICE project 121Constitution xicooperation with countries 127–128coordinating role 78expanded role in HIV/AIDS 52–53Framework Convention on TobaccoControl (WHO FCTC) xv, 91–93Global Programme on Evidence for <strong>Health</strong> Policy 135Global Strategy on Diet, Physical Activity and <strong>Health</strong> 90and Millennium Development Goals 35–38new way of working vii, xv, 128normative and technical work 36in polio partnership 60in road traffic injury prevention 97–98source of health information 36technical collaboration 36, 109, 128<strong>World</strong> <strong>Health</strong> Organization (WHO)/FAO expert consultationreport on diet, nutrition and the prevention ofchronic diseases 88–89<strong>World</strong> <strong>Health</strong> Survey 118, 138<strong>World</strong> <strong>Report</strong> on Road Traffic Injury Prevention 98<strong>World</strong> Summit on Sustainable Development,Johannesburg, South Africa (2002) 26<strong>World</strong> Trade Organization (WTO) 90Doha, Qatar (2001) 31, 32years of life lost (YLL) 5, 137