FINANCIAL STATEMENTS - Mewah Group
FINANCIAL STATEMENTS - Mewah Group
FINANCIAL STATEMENTS - Mewah Group

You also want an ePaper? Increase the reach of your titles
YUMPU automatically turns print PDFs into web optimized ePapers that Google loves.
ANNUAL REPORT 2012DIRECTORS’ REPORTFor the financial year ended 31 December 2012DIRECTORS’ INTERESTS IN SHARES OR DEBENTURES (CONTINUED)(b) The directors’ interests in the ordinary shares of the Company as at 21 January 2013 were the same as those as at 31 December 2012,except for the following:Holdings registered in name ofdirector or nomineeHoldings in which director isdeemed to have an interestAt 21.01.2013 At 31.12.2012 At 21.01.2013 At 31.12.2012Dr Cheo Tong Choon @ Lee Tong Choon - - 608,723,220 550,340,200Ms Michelle Cheo Hui Ning - - 554,723,220 550,340,220Ms Bianca Cheo Hui Hsin - - 554,723,220 550,340,220DIRECTORS’ CONTRACTUAL BENEFITSSince the end of the previous financial year, no director has received or become entitled to receive a benefit by reason of a contract madeby the Company or a related corporation with the director or with a firm of which he is a member or with a company in which he has asubstantial financial interest, except as disclosed in the accompanying financial statements and in this report.AUDIT COMMITTEEThe members of the Audit Committee at the end of the financial year were as follows:Mr Lim How Teck (Chairman)Tan Sri Dato’ Ir. Muhammad Radzi Bin Haji MansorMr Giam Chin ToonAll members of the Audit Committee were non-executive directors.The Audit Committee carried out its functions in accordance with Section 201B(5) of the Singapore Companies Act. In performing thosefunctions, the Committee reviewed: statutory audit;31 December 2012 before their submission to the Board of Directors, as well as the Independent Auditor’s Report on the statement offinancial position of the Company and the consolidated financial statements of the <strong>Group</strong>.39
MEWAH INTERNATIONAL INC.DIRECTORS’ REPORTFor the financial year ended 31 December 2012AUDIT COMMITTEE (CONTINUED)The Audit Committee has recommended to the Board that the independent auditor, PricewaterhouseCoopers LLP, be nominated for reappointmentat the forthcoming Annual General Meeting of the Company.INDEPENDENT AUDITORThe independent auditor, PricewaterhouseCoopers LLP, has expressed its willingness to accept re-appointment.On behalf of the directorsDr Cheo Tong Choon @ Lee Tong ChoonDirectorMs Michelle Cheo Hui NingDirector8 March 201340
ANNUAL REPORT 2012STATEMENT BY DIRECTORSFor the financial year ended 31 December 2012In the opinion of the directors,(a) the statement of financial position of the Company and the consolidated financial statements of the <strong>Group</strong> as set out on pages 43 to119 are drawn up so as to give a true and fair view of the state of affairs of the Company and of the <strong>Group</strong> as at 31 December 2012,and of the results of the business, changes in equity and cash flows of the <strong>Group</strong> for the financial year then ended; and(b) at the date of this statement, there are reasonable grounds to believe that the Company will be able to pay its debts as and when theyfall due.On behalf of the directorsDr Cheo Tong Choon @ Lee Tong ChoonDirectorMs Michelle Cheo Hui NingDirector8 March 201341
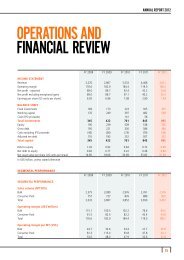
ANNUAL REPORT 2012CONSOLIDATED INCOME STATEMENTFor the financial year ended 31 December 2012Note 2012 2011US$’000US$’000Revenue 4 3,620,781 4,467,933Cost of sales 5 (3,408,599) (4,282,314)Gross profit 212,182 185,619Other income 6 10,840 7,873Expenses- Selling and distribution expenses (109,193) (109,747)- Administrative expenses (72,159) (64,685)- Other (losses)/gains 7 (6,127) 31,868- Finance costs 8 (17,477) (12,887)Share of profit of associated company 60 123Profit before tax 10 18,126 38,164Income tax credit 11 5,399 1,094Profit after tax 23,525 39,258Profit after tax attributable to:Equity holders of the Company 24,788 42,245Non-controlling interests (1,263) (2,987)23,525 39,258Earnings per share attributable to equity holders of the Company(expressed in US cents per share)- Basic and diluted 12 1.64 2.80The accompanying notes form an integral part of these financial statements.43
MEWAH INTERNATIONAL INC.CONSOLIDATED STATEMENTOF COMPREHENSIVE INCOMEFor the financial year ended 31 December 20122012 2011US$’000 US$’000Profit after tax 23,525 39,258Other comprehensive income:Items that may be reclassified subsequently to profit or loss:Currency translation differences arising from foreign subsidiaries 7,853 (3,798)Total comprehensive income, net of tax 31,378 35,460Total comprehensive income attributable to:Equity holders of the Company 32,659 38,247Non-controlling interests (1,281) (2,787)31,378 35,460The accompanying notes form an integral part of these financial statements.44
ANNUAL REPORT 2012CONSOLIDATED STATEMENTOF <strong>FINANCIAL</strong> POSITIONAs at 31 December 2012Note 2012 2011US$’000 US$’000ASSETSCurrent assetsInventories 13 243,446 307,490Trade receivables 14 443,963 410,963Other receivables 15 93,473 24,590Current income tax recoverable 16,518 20,613Deferred income tax assets 25 661 -Derivative financial instruments 16(a) 101,235 38,747Cash and cash equivalents 17 48,747 136,799948,043 939,202Non-current assetsProperty, plant and equipment 18 338,661 287,796Leasehold prepayments 19 17,780 13,514Investment in associated company 20(a) 271 204Intangible asset 21 - 3,189Derivative financial instruments 16(b) 796 185357,508 304,888Total assets 1,305,551 1,244,090LIABILITIESCurrent liabilitiesTrade payables 22 243,503 210,463Other payables 23 46,078 51,353Current income tax liabilities 3,784 1,157Derivative financial instruments 16(a) 56,099 42,317Borrowings 24 284,266 339,359633,730 644,649Non-current liabilitiesBorrowings 24 99,406 46,771Deferred income tax liabilities 25 12,468 14,880111,874 61,651Total liabilities 745,604 706,300NET ASSETS 559,947 537,790EQUITYCapital and reserves attributable to equity holders of the Company:Share capital 26 1,507 1,507Share premium 26 185,416 185,416Retained profits 28(a) 383,946 368,334Other reserves 27 (7,589) (15,415)563,280 539,842Non-controlling interests (3,333) (2,052)Total equity 559,947 537,790The accompanying notes form an integral part of these financial statements.45
MEWAH INTERNATIONAL INC.STATEMENT OF <strong>FINANCIAL</strong> POSITION– COMPANYAs at 31 December 2012Note 2012 2011US$’000 US$’000ASSETSCurrent assetsOther receivables 15 201,750 154,434Derivative financial instruments 16(a) 2 -Cash and cash equivalents 17 381 41,082202,133 195,516Non-current assetsInvestments in subsidiaries 20(b) 820 820Total assets 202,953 196,336LIABILITIESCurrent liabilitiesOther payables 23 250 203Current income tax liabilities 492 248Derivative financial instruments 16(a) - 30742 481Non-current liabilitiesDeferred income tax liabilities 375 -Total liabilities 1,117 481NET ASSETS 201,836 195,855EQUITYCapital and reserves attributable to equity holders of the Company:Share capital 26 1,507 1,507Share premium 26 185,416 185,416Retained profits 28(b) 14,913 8,932Total equity 201,836 195,855The accompanying notes form an integral part of these financial statements.46
ANNUAL REPORT 2012CONSOLIDATED STATEMENT OF CHANGES IN EQUITYFor the financial year ended 31 December 20122012SharepremiumAttributable to equity holders of the CompanyMergerreserveGeneralreserveAssetrevaluationreserveCurrencytranslationreserveRetainedprofits TotalNoncontrollinginterests Total equityNote Share capitalUS$’000 US$’000 US$’000 US$’000 US$’000 US$’000 US$’000 US$’000 US$’000 US$’000Beginning of financial year 1,507 185,416 (50,749) (2,608) 10,146 27,796 368,334 539,842 (2,052) 537,790Acquisition of subsidiaries undercommon control 27(b)(i) - - 43 - - - - 43 - 43Realisation of reserve upon disposal 27(b)(iii) - - - - (470) - 470 - - -Tax relating to asset revaluation reserve 27(b)(iii) 382 - - 382 - 382Dividends 29 - - - - - - (9,646) (9,646) - (9,646)Total comprehensive income for thefinancial year - - - - - 7,871 24,788 32,659 (1,281) 31,378End of financial year 1,507 185,416 (50,706) (2,608) 10,058 35,667 383,946 563,280 (3,333) 559,9472011Beginning of financial yearAs previously stated 1,507 185,416 (50,749) (832) 10,281 31,794 330,287 507,704 1,464 509,168Finalisation of purchase price allocation - - - - - - - - (592) (592)Beginning of financial year (restated) 1,507 185,416 (50,749) (832) 10,281 31,794 330,287 507,704 872 508,576Acquisition of non-controlling interests 27(b)(ii) - - - (516) - - - (516) (232) (748)Put option granted to non-controllinginterests 27(b)(ii) - - - (1,260) - - - (1,260) - (1,260)Realisation of reserve upon disposal 27(b)(iii) - - - - (135) - 135 - - -Dividends 29 - - - - - - (4,333) (4,333) - (4,333)Capital contribution from noncontrollinginterests - - - - - - - - 95 95Total comprehensive income for thefinancial year - - - - - (3,998) 42,245 38,247 (2,787) 35,460End of financial year 1,507 185,416 (50,749) (2,608) 10,146 27,796 368,334 539,842 (2,052) 537,790The accompanying notes form an integral part of these financial statements.47
MEWAH INTERNATIONAL INC.CONSOLIDATED STATEMENTOF CASH FLOWSFor the financial year ended 31 December 2012Note 2012 2011US$’000 US$’000Cash flows from operating activitiesProfit after tax 23,525 39,258Adjustments for:- Income tax credit (5,399) (1,094)- Amortisation 929 58- Depreciation 16,889 14,142- (Gain)/loss on disposal of property, plant and equipment - net (300) 367- Property, plant and equipment written off 24 260- Impairment of goodwill 3,161 2,717- Gain on change in fair value of put option (1,260) -- Interest income (9,571) (5,548)- Interest expense 17,477 12,887- Share of profit of associated company (60) (123)- Exchange differences (net) (3,656) 4,864Operating cash flows before working capital changes 41,759 67,788Changes in operating assets and liabilities:- Inventories 64,044 (64,709)- Trade and other receivables (101,161) 15,690- Trade and other payables 29,025 (40,993)- Derivative financial instruments (49,317) 28,193Cash flows (used in)/generated from operations (15,650) 5,969Interest received 9,130 4,753Interest paid (17,477) (12,887)Income tax refund received/(tax paid) 9,490 (26,424)Net cash flows used in operating activities (14,507) (28,589)Cash flows from investing activitiesAcquisition of non-controlling interests - (748)(Increase)/decrease in other receivables (722) 2,723Additions to property, plant and equipment (58,532) (92,238)Additions of leasehold prepayments 19 (5,195) (14,063)Proceeds from disposal of property, plant and equipment 884 574Net cash flows used in investing activities (63,565) (103,752)Cash flows from financing activitiesPlacement and listing expenses - (1,422)Dividends paid to equity holders of the Company 29 (9,646) (4,333)Increase in restricted short term deposit (19) (1)Proceeds from long term borrowings 81,965 42,184Repayment of long term borrowings (11,000) (17,023)Net (repayment)/proceeds from short term borrowings (72,896) 35,040Repayment of finance lease liabilities (363) (392)Interest received 441 795Net cash flows (used in)/from financing activities (11,518) 54,848Net change in cash and cash equivalents (89,590) (77,493)Cash and cash equivalents at beginning of financial year 136,464 215,152Effect of changes in exchange rate on cash and cash equivalents 1,683 (1,195)Cash and cash equivalents at end of financial year 17 48,557 136,464The accompanying notes form an integral part of these financial statements.48
ANNUAL REPORT 2012NOTES TOTHE <strong>FINANCIAL</strong> <strong>STATEMENTS</strong>For the financial year ended 31 December 2012These notes form an integral part of and should be read in conjunction with the accompanying financial statements.1. GENERAL INFORMATION<strong>Mewah</strong> International Inc. (the “Company”) is listed on the Singapore Exchange and incorporated and domiciled in the Cayman Islands.The address of its registered office is Harbour Place, 2nd Floor, 103 South Church Street, P.O. Box 472, George Town, Grand Cayman,KY1-1106, Cayman Islands. The principal place of business of the Company is at 5, International Business Park, #05-00, <strong>Mewah</strong>Building, Singapore 609914.The principal activity of the Company is that of investment holding. The principal activities of its subsidiaries are disclosed in Note 38of the financial statements.2. SIGNIFICANT ACCOUNTING POLICIES2.1 Basis of preparationThese financial statements have been prepared in accordance with Singapore Financial Reporting Standards (“FRS”). The financialstatements have been prepared under the historical cost convention, except as disclosed in the accounting policies below.The preparation of financial statements in conformity with FRS requires management to exercise its judgement in the process ofapplying the <strong>Group</strong>’s accounting policies. It also requires the use of certain critical accounting estimates and assumptions. Theareas involving a higher degree of judgement or complexity, or areas where assumptions and estimates are significant to thefinancial statements, are disclosed in Note 3.Interpretations and amendments to published standards effective in 2012On 1 January 2012, the <strong>Group</strong> adopted the new or amended FRS and Interpretations to FRS (“INT FRS”) that are mandatory forapplication to the financial year. Changes to the <strong>Group</strong>’s accounting policies have been made as required, in accordance with thetransitional provisions in the respective FRS and INT FRS.The adoption of these new or amended FRS and INT FRS did not result in substantial changes to the accounting policies of the<strong>Group</strong> and Company and had no material effect on the amounts reported for the current or prior financial years.2.2 Revenue recognitionRevenue for the <strong>Group</strong> represents the fair value of the consideration received or receivable from the gross inflow of economicbenefits during the financial year arising from the course of ordinary activities of the <strong>Group</strong>’s business. Revenue is presented net ofgoods and services tax, rebates and discounts, and after eliminating sales within the <strong>Group</strong>.49
MEWAH INTERNATIONAL INC.NOTES TOTHE <strong>FINANCIAL</strong> <strong>STATEMENTS</strong>For the financial year ended 31 December 20122. SIGNIFICANT ACCOUNTING POLICIES (CONTINUED)2.2 Revenue recognition (continued)The <strong>Group</strong> recognises revenue when the amount of revenue and related cost can be reliably measured, it is probable that thecollectability of the related receivables is reasonably assured and when the specific criteria for each of the <strong>Group</strong>’s activities aremet as follows:(a) Sale of goodsRevenue from sale of goods is recognised when significant risks and rewards of ownership are transferred to the buyer andthere is neither continuing managerial involvement to the degree usually associated with ownership nor effective control overthe goods sold.(b) Interest incomeInterest income is recognised using the effective interest method.(c) Rental incomeRental income from operating leases (net of any incentives given to the lessees) is recognised on a straight-line basis over thelease term.2.3 <strong>Group</strong> accounting(a) Subsidiaries(i)ConsolidationSubsidiaries are entities (including special purpose entities) over which the <strong>Group</strong> has power to govern the financial andoperating policies so as to obtain benefits from its activities, generally accompanied by a shareholding giving rise to amajority of the voting rights. The existence and effect of potential voting rights that are currently exercisable or convertibleare considered when assessing whether the <strong>Group</strong> controls another entity. Subsidiaries are consolidated from the date onwhich control is transferred to the <strong>Group</strong>. They are de-consolidated from the date on which control ceases.In preparing the consolidated financial statements, transactions, balances and unrealised gains on transactions betweengroup entities are eliminated. Unrealised losses are also eliminated but are considered an impairment indicator of theasset transferred. Accounting policies of subsidiaries have been changed where necessary to ensure consistency with thepolicies adopted by the <strong>Group</strong>.Non-controlling interests are that part of the net results of operations and of net assets of a subsidiary attributable tothe interests which are not owned directly or indirectly by the equity holders of the Company. They are shown separatelyin the consolidated income statement, consolidated statement of comprehensive income, consolidated statement ofchanges in equity and consolidated statement of financial position. Total comprehensive income is attributed to the noncontrollinginterests based on their respective interests in a subsidiary, even if this results in the non-controlling interestshaving a deficit balance.50
ANNUAL REPORT 2012NOTES TOTHE <strong>FINANCIAL</strong> <strong>STATEMENTS</strong>For the financial year ended 31 December 20122. SIGNIFICANT ACCOUNTING POLICIES (CONTINUED)2.3 <strong>Group</strong> accounting (continued)(a) Subsidiaries (continued)(ii) AcquisitionsThe acquisition method of accounting is used to account for business combinations by the <strong>Group</strong>, except for businesscombination under common control.For business combinations under acquisition method of accounting, the consideration transferred for the acquisitionof a subsidiary or business comprises the fair value of the assets transferred, the liabilities incurred and the equityinterests issued by the <strong>Group</strong>. The consideration transferred also includes the fair value of any contingent considerationarrangement and the fair value of any pre-existing equity interest in the subsidiary.Acquisition-related costs are expensed as incurred.Identifiable assets acquired and liabilities and contingent liabilities assumed in a business combination are, with limitedexceptions, measured initially at their fair values at the acquisition date.On an acquisition-by-acquisition basis, the <strong>Group</strong> recognises any non-controlling interest in the acquiree at the date ofacquisition either at fair value or at the non-controlling interest’s proportionate share of the acquiree’s identifiable netassets.The excess of (i) the consideration transferred, the amount of any non-controlling interest in the acquiree and theacquisition-date fair value of any previous equity interest in the acquiree over the (ii) fair value of the identifiable netassets acquired is recorded as goodwill. Please refer to Note 2.5 for the subsequent accounting policy on goodwill.Acquisitions of entities under common control have been accounted for using the pooling-of-interest method. Under thismethod:has been in existence since the earliest date the entities are under common control; perspective of the controlling party;common control; statement of financial position, statement of cash flows and statement of changes in equity have been prepared asif the combination had occurred from the date when the combining entities or businesses first came under commoncontrol;51
MEWAH INTERNATIONAL INC.NOTES TOTHE <strong>FINANCIAL</strong> <strong>STATEMENTS</strong>For the financial year ended 31 December 20122. SIGNIFICANT ACCOUNTING POLICIES (CONTINUED)2.3 <strong>Group</strong> accounting (continued)(a) Subsidiaries (continued)(ii) Acquisitions (continued)equivalents and fair values of other consideration; and merged subsidiary is taken to merger reserve. Cash paid/payable arising from the acquisition under common controlis also taken to the merger reserves.(iii) Disposals of subsidiaries or businessesWhen a change in the <strong>Group</strong>’s ownership interest in a subsidiary results in a loss of control over the subsidiary, theassets and liabilities of the subsidiary including any goodwill are derecognised. Amounts previously recognised in othercomprehensive income in respect of that entity are also reclassified to profit or loss or transferred directly to retainedearnings if required by a specific Standard.Any retained equity interest in the entity is remeasured at fair value. The difference between the carrying amount of theretained interest at the date when control is lost and its fair value is recognised in profit or loss.Please refer to Note 2.6 for the accounting policy on investments in subsidiaries in the separate financial statements ofthe Company.(b) Transactions with non-controlling interestsChanges in the <strong>Group</strong>’s ownership interest in a subsidiary that do not result in a loss of control over the subsidiary areaccounted for as transactions with equity owners of the Company. Any difference between the change in the carrying amountsof the non-controlling interest and the fair value of the consideration paid or received is recognised in general reserve withinequity attributable to the equity holders of the Company.(c) Associated companiesAssociated companies are entities over which the <strong>Group</strong> has significant influence, but not control, generally accompanied by ashareholding giving rise to voting rights of 20% and above but not exceeding 50%. Investments in associated companies areaccounted for in the consolidated financial statements using the equity method of accounting less impairment losses, if any.52
ANNUAL REPORT 2012NOTES TOTHE <strong>FINANCIAL</strong> <strong>STATEMENTS</strong>For the financial year ended 31 December 20122. SIGNIFICANT ACCOUNTING POLICIES (CONTINUED)2.3 <strong>Group</strong> accounting (continued)(c) Associated companies (continued)(i)AcquisitionsInvestments in associated companies are initially recognised at cost. The cost of an acquisition is measured at the fairvalue of the assets given, equity instruments issued or liabilities incurred or assumed at the date of exchange, plus costsdirectly attributable to the acquisition. Goodwill on associated companies represents the excess of the cost of acquisitionof the associate over the <strong>Group</strong>’s share of the fair value of the identifiable net assets of the associate and is included inthe carrying amount of the investments.(ii) Equity method of accountingIn applying the equity method of accounting, the <strong>Group</strong>’s share of its associated companies’ post-acquisition profits orlosses are recognised in profit or loss and its share of post-acquisition other comprehensive income is recognised in othercomprehensive income. These post-acquisition movements and distributions received from the associated companies areadjusted against the carrying amount of the investments. When the <strong>Group</strong>’s share of losses in an associated companiesequals or exceeds its interest in the associated companies, including any other unsecured non-current receivables, the<strong>Group</strong> does not recognise further losses, unless it has obligations to make or has made payments on behalf of theassociated companies.Unrealised gains on transactions between the <strong>Group</strong> and its associated companies are eliminated to the extent of the<strong>Group</strong>’s interest in the associated companies. Unrealised losses are also eliminated unless the transaction providesevidence of impairment of the assets transferred. The accounting policies of associated companies have been changedwhere necessary to ensure consistency with the accounting policies adopted by the <strong>Group</strong>.(iii) DisposalsGains and losses arising from partial disposals or dilutions in investments in associated companies in which significantinfluence is retained are recognised in profit or loss.Investments in associated companies are derecognised when the <strong>Group</strong> loses significant influence. Any retained equityinterest in the entity is remeasured at its fair value. The difference between the carrying amount of the retained interestat the date when significant influence is lost and its fair value is recognised in profit or loss.Please refer to Note 2.6 for the accounting policy on investments in associated companies in the separate financialstatements of the Company.53
MEWAH INTERNATIONAL INC.NOTES TOTHE <strong>FINANCIAL</strong> <strong>STATEMENTS</strong>For the financial year ended 31 December 20122. SIGNIFICANT ACCOUNTING POLICIES (CONTINUED)2.4 Property, plant and equipment(a) Measurement(i)Property, plant and equipmentAll property, plant and equipment are initially recognised at cost and subsequently carried at cost less accumulateddepreciation and accumulated impairment losses.When an asset is revalued, any accumulated depreciation at the date of revaluation is eliminated against the grosscarrying amount of the asset. The net amount is then restated to the revalued amount of the asset.Increases in carrying amounts arising from revaluation, including currency translation differences, are recognised in theasset revaluation reserve, unless they offset previous decreases in the carrying amounts of the same asset, in which case,they are recognised in profit or loss. Decreases in carrying amounts that offset previous increases of the same asset arerecognised against the asset revaluation reserve. All other decreases in carrying amounts are recognised in the statementof comprehensive income.On 1 January 2007, the <strong>Group</strong> has elected to adopt FRS 101 exemption to deem the previous revaluation of certainproperty, plant and equipment as deemed cost (Note 18(c)).(ii) Components of costsThe cost of an item of property, plant and equipment initially recognised includes its purchase price and any cost that isdirectly attributable to bringing the asset to the location and condition necessary for it to be capable of operating in themanner intended by management. Cost also includes borrowing costs that are directly attributable to the acquisition,construction or production of a qualifying asset (refer to Note 2.8 on borrowing costs).(b) DepreciationDepreciation is calculated using the straight-line method to allocate their depreciable amounts over their estimated usefullives. The annual rates of depreciation are as follows:Leasehold land and buildingsAmortised over the period of leases (30 to 99 years)Freehold buildings 2%Plant and equipment 5%Furniture, fixtures and office equipment 5% to 20%Motor vehicles 20%Freehold land and capital expenditure in progress are stated at cost and not depreciated.The residual values, estimated useful lives and depreciation method of property, plant and equipment are reviewed, andadjusted as appropriate, at each statement of financial position date. The effects of any revision are recognised in profit orloss when the changes arise.54
ANNUAL REPORT 2012NOTES TOTHE <strong>FINANCIAL</strong> <strong>STATEMENTS</strong>For the financial year ended 31 December 20122. SIGNIFICANT ACCOUNTING POLICIES (CONTINUED)2.4 Property, plant and equipment (continued)(c) Subsequent expenditureSubsequent expenditure relating to property, plant and equipment that has already been recognised is added to the carryingamount of the asset only when it is probable that future economic benefits associated with the item will flow to the <strong>Group</strong>and the cost of the item can be measured reliably. All other repair and maintenance expenses are recognised in profit or losswhen incurred.(d) DisposalOn disposal of an item of property, plant and equipment, the difference between the disposal proceeds and its carryingamount is recognised in profit or loss. Any amount in revaluation reserve relating to that asset is transferred to retained profitsdirectly.2.5 Intangible assetsGoodwill on acquisitionsGoodwill on acquisitions of subsidiaries and businesses on or after 1 January 2010 represents the excess of (i) the sum of theconsideration transferred, the amount of any non-controlling interest in the acquiree and the acquisition-date fair value of anyprevious equity interest in the acquiree over (ii) the fair value of the identifiable net assets acquired.Goodwill on acquisitions of subsidiaries and businesses prior to 1 January 2010 and on acquisition of associated companiesrepresents the excess of the cost of the acquisition over the fair value of the <strong>Group</strong>’s share of the net identifiable assets acquired.Goodwill on subsidiaries is recognised separately as intangible assets and carried at cost less accumulated impairment losses.Goodwill on associated companies is included in the carrying amount of the investments.Gains and losses on the disposal of subsidiaries and associated companies include the carrying amount of goodwill relating to theentity sold, except for goodwill arising from acquisitions prior to 1 January 2001. Such goodwill was adjusted against retainedprofits in the year of acquisition and is not recognised in profit or loss on disposal.2.6 Investments in subsidiaries and associated companiesInvestments in subsidiaries and associated companies are carried at cost less accumulated impairment losses in the Company’sstatement of financial position. On disposal of such investments, the difference between disposal proceeds and the carryingamounts of the investments are recognised in profit or loss.55
MEWAH INTERNATIONAL INC.NOTES TOTHE <strong>FINANCIAL</strong> <strong>STATEMENTS</strong>For the financial year ended 31 December 20122. SIGNIFICANT ACCOUNTING POLICIES (CONTINUED)2.7 Impairment of non-financial assets(a) GoodwillGoodwill recognised separately as an intangible asset is tested for impairment annually and whenever there is indication thatthe goodwill may be impaired.For the purpose of impairment testing of goodwill, goodwill is allocated to each of the <strong>Group</strong>’s cash-generating-units (“CGU”)expected to benefit from synergies arising from the business combination.An impairment loss is recognised when the carrying amount of a CGU, including the goodwill, exceeds the recoverable amountof the CGU. The recoverable amount of a CGU is the higher of the CGU’s fair value less cost to sell and value-in-use.The total impairment loss of a CGU is allocated first to reduce the carrying amount of goodwill allocated to the CGU and thento the other assets of the CGU pro-rata on the basis of the carrying amount of each asset in the CGU.An impairment loss on goodwill is recognised as an expense and is not reversed in a subsequent period.(b) Property, plant and equipmentInvestments in subsidiaries and associated companiesProperty, plant and equipment and investments in subsidiaries and associated companies are tested for impairment wheneverthere is any objective evidence or indication that these assets may be impaired.For the purpose of impairment testing, the recoverable amount (i.e. the higher of the fair value less cost to sell and the valuein-use)is determined on an individual asset basis unless the asset does not generate cash inflows that are largely independentof those from other assets. If this is the case, the recoverable amount is determined for the CGU to which the asset belongs.If the recoverable amount of the asset (or CGU) is estimated to be less than its carrying amount, the carrying amount of theasset (or CGU) is reduced to its recoverable amount.The difference between the carrying amount and recoverable amount is recognised as an impairment loss in profit or loss,unless the asset is carried at revalued amount, in which case, such impairment loss is treated as a revaluation decrease. Pleaserefer to Note 2.4 for the treatment of a revaluation decrease in property, plant and equipment.An impairment loss for an asset other than goodwill is reversed only if, there has been a change in the estimates used to determinethe asset’s recoverable amount since the last impairment loss was recognised. The carrying amount of this asset is increased to itsrevised recoverable amount, provided that this amount does not exceed the carrying amount that would have been determined(net of any accumulated amortisation or depreciation) had no impairment loss been recognised for the asset in prior years.A reversal of impairment loss for an asset other than goodwill is recognised in profit or loss, unless the asset is carried at revaluedamount, in which case, such reversal is treated as a revaluation increase. However, to the extent that an impairment loss onthe same revalued asset was previously recognised as an expense, a reversal of that impairment is also credited to profit or loss.56
ANNUAL REPORT 2012NOTES TOTHE <strong>FINANCIAL</strong> <strong>STATEMENTS</strong>For the financial year ended 31 December 20122. SIGNIFICANT ACCOUNTING POLICIES (CONTINUED)2.8 Borrowing costsBorrowing costs are recognised in profit or loss using the effective interest method except for those costs that are directlyattributable to the acquisition, construction or production of a qualifying assets. Capitalising of borrowing costs commences whenthe activities to prepare the asset for its intended use or sale are in progress and the expenditure and borrowing costs are beingincurred. Borrowing costs are capitalised until the assets are ready for their intended use or sale.Borrowing costs on general borrowings are capitalised by applying a capitalisation rate to the acquisition, construction orproduction of qualifying assets that are financed by general borrowings.2.9 Financial assets(a) ClassificationThe <strong>Group</strong> classifies its financial assets in the following categories: at fair value through profit or loss, loans and receivables,held-to-maturity, and available-for-sale. The classification depends on the nature of the asset and the purpose for which theassets were acquired. Management determines the classification of its financial assets at initial recognition and in the case ofassets classified as held-to-maturity, re-valuates this designation at each statement of financial position date.(i)Financial assets at fair value through profit or lossThis category has two sub-categories: financial assets held for trading, and those designated at fair value through profitor loss at inception. A financial asset is classified as held for trading if it is acquired principally for the purpose of selling inthe short term. Financial assets designated as at fair value through profit or loss at inception are those that are managedand their performances are evaluated on a fair value basis, in accordance with a documented <strong>Group</strong> investment strategy.Derivatives are also categorised as held for trading unless they are designated as hedges. Assets in this category arepresented as current assets if they are either held for trading or are expected to be realised within 12 months after thestatement of financial position date.(ii) Loans and receivablesLoans and receivables are non-derivative financial assets with fixed or determinable payments that are not quoted in anactive market. They are presented as current assets, except for those expected to be realised later than 12 months afterthe statement of financial position date which are presented as non-current assets. Loans and receivables are presentedas “trade receivables” (Note 14), “other receivables” (Note 15) and “cash and cash equivalents” (Note 17) on thestatement of financial position.(iii) Held-to-maturity financial assetsHeld-to-maturity financial assets, are non-derivative financial assets with fixed or determinable payments and fixedmaturities that the <strong>Group</strong>’s management has the positive intention and ability to hold to maturity. If the <strong>Group</strong> wereto sell other than an insignificant amount of held-to-maturity financial assets, the whole category would be tainted andreclassified as available-for-sale. They are presented as non-current assets, except for those maturing within 12 monthsafter the statement of financial position date which are presented as current assets.57
MEWAH INTERNATIONAL INC.NOTES TOTHE <strong>FINANCIAL</strong> <strong>STATEMENTS</strong>For the financial year ended 31 December 20122. SIGNIFICANT ACCOUNTING POLICIES (CONTINUED)2.9 Financial assets (continued)(a) Classification (continued)(iv) Available-for-sale financial assetsAvailable-for-sale financial assets, are non-derivatives that are either designated in this category or not classified in any ofthe other categories. They are presented as non-current assets unless the investment matures or management intends todispose of the assets within 12 months after the statement of financial position date.(b) Recognition and derecognitionRegular way purchases and sales of financial assets are recognised on trade date - the date on which the <strong>Group</strong> commits topurchase or sell the asset.Financial assets are derecognised when the rights to receive cash flows from the financial assets have expired or havebeen transferred and the <strong>Group</strong> has transferred substantially all risks and rewards of ownership. On disposal of a financialasset, the difference between the carrying amount and the sale proceeds is recognised in profit or loss. Any amount in othercomprehensive income relating to that asset is reclassified to profit or loss.(c) Initial measurementFinancial assets are initially recognised at fair value plus transaction costs except for financial assets at fair value throughprofit or loss, which are recognised at fair value. Transaction costs for financial assets at fair value through profit or loss arerecognised immediately as expenses.(d) Subsequent measurementAvailable-for-sale financial assets and financial assets at fair value through profit or loss are subsequently carried at fair value.Loans and receivables and held-to-maturity financial assets are subsequently carried at amortised cost using the effectiveinterest method.Changes in the fair values of financial assets at fair value through profit or loss including the effects of currency translation,interest and dividends, are recognised in profit or loss when the changes arise.Interest and dividend income on available-for-sale financial assets are recognised separately in profit or loss. Changes inthe fair values of available-for-sale debt securities (i.e. monetary items) denominated in foreign currencies are analysed intocurrency translation differences on the amortised cost of the securities and other changes; the currency translation differencesare recognised in profit or loss and the other changes are recognised in other comprehensive income and accumulated in thefair value reserve. Changes in fair values of available-for-sale equity securities (i.e. non-monetary items) are recognised in othercomprehensive income and accumulated in the fair value reserve, together with the related currency translation differences.58
ANNUAL REPORT 2012NOTES TOTHE <strong>FINANCIAL</strong> <strong>STATEMENTS</strong>For the financial year ended 31 December 20122. SIGNIFICANT ACCOUNTING POLICIES (CONTINUED)2.9 Financial assets (continued)(e) ImpairmentThe <strong>Group</strong> assesses at each statement of financial position date whether there is objective evidence that a financial asset or agroup of financial assets is impaired and recognises an allowance for impairment when such evidence exists.(i)Loans and receivables/held-to-maturity financial assetsSignificant financial difficulties of the debtor, probability that the debtor will enter bankruptcy, and default or significantdelay in payments are objective evidence that these financial assets are impaired.The carrying amount of these assets is reduced through the use of an impairment allowance account which is calculatedas the difference between the carrying amount and the present value of estimated future cash flows, discounted at theoriginal effective interest rate. When the asset becomes uncollectible, it is written off against the allowance account.Subsequent recoveries of amounts previously written off are recognised against the same line item in profit or loss.The impairment allowance is reduced through profit or loss in a subsequent period when the amount of impairment lossdecreases and the related decrease can be objectively measured. The carrying amount of the asset previously impairedis increased to the extent that the new carrying amount does not exceed the amortised cost had no impairment beenrecognised in prior periods.(ii) Available-for-sale financial assetsIn addition to the objective evidence of impairment described in Note 2.9(e)(i), a significant or prolonged decline in the fairvalue of an equity security below its cost is considered as an indicator that the available-for-sale financial asset is impaired.If any evidence of impairment exists, the cumulative loss that was previously recognised in other comprehensive incomeis reclassified to profit or loss. The cumulative loss is measured as the difference between the acquisition cost (net of anyprincipal repayments and amortisation) and the current fair value, less any impairment loss previously recognised as anexpense. The impairment losses recognised as an expense on equity securities are not reversed through profit or loss.(f) Offsetting financial instrumentsFinancial assets and liabilities are offset and the net amount reported in the statement of financial position when there is alegally enforceable right to offset and there is an intention to settle on a net basis or realise the asset and settle the liabilitysimultaneously.2.10 Financial guaranteesThe Company has issued corporate guarantees to banks for borrowings of its subsidiaries. These guarantees are financial guaranteesas they require the Company to reimburse the banks if the subsidiaries fail to make principal or interest payments when due inaccordance with the terms of their borrowings.59
MEWAH INTERNATIONAL INC.NOTES TOTHE <strong>FINANCIAL</strong> <strong>STATEMENTS</strong>For the financial year ended 31 December 20122. SIGNIFICANT ACCOUNTING POLICIES (CONTINUED)2.10 Financial guarantees (continued)Financial guarantees are initially recognised at their fair values plus transaction costs in the Company’s statement of financial position.Financial guarantees are subsequently amortised to profit or loss over the period of the subsidiaries’ borrowings, unless it is probablethat the Company will reimburse the bank for an amount higher than the unamortised amount. In this case, the financial guaranteesshall be carried at the expected amount payable to the bank in the Company’s statement of financial position.Intra-group transactions are eliminated on consolidation.2.11 BorrowingsBorrowings are presented as current liabilities unless the <strong>Group</strong> has an unconditional right to defer settlement for at least 12 monthsafter the statement of financial position date, in which case they are presented as non-current liabilities.Borrowings are initially recognised at fair value (net of transaction costs) and subsequently carried at amortised cost. Any differencebetween the proceeds (net of transaction costs) and the redemption value is recognised in profit or loss over the period of theborrowings using the effective interest method.2.12 Trade and other payablesTrade and other payables represent liabilities for goods and services provided to the <strong>Group</strong> prior to the end of financial year whichare unpaid. They are classified as current liabilities if payment is due within one year or less (or in the normal operating cycle of thebusiness if longer). If not, they are presented as non-current liabilities.Trade and other payables are initially recognised at fair value, and subsequently carried at amortised cost using the effective interestmethod.2.13 Derivative financial instrumentsDerivative financial instruments comprise mainly of crude palm oil and palm oil products forward contracts, futures contracts andcurrency forward contracts.A derivative financial instrument is initially recognised at its fair value on the date the contract is entered into and is subsequentlycarried at its fair value. Fair value changes on derivatives that are not designated or do not qualify for hedge accounting arerecognised in profit or loss within “cost of sales” when the changes arise.Derivative financial instruments are reported in the financial statements on a net basis where legal right of setoff exists. Derivativefinancial instruments are carried as assets when fair value is positive and as liabilities when fair value is negative.2.14 Fair value estimation of financial assets and liabilitiesThe fair values of financial instruments traded in active markets (such as exchange-traded and over-the-counter securities and derivatives)are based on quoted market prices at the statement of financial position date. The quoted market prices used for financial assets are thecurrent bid prices; the appropriate quoted market prices for financial liabilities are the current asking prices.60
ANNUAL REPORT 2012NOTES TOTHE <strong>FINANCIAL</strong> <strong>STATEMENTS</strong>For the financial year ended 31 December 20122. SIGNIFICANT ACCOUNTING POLICIES (CONTINUED)2.14 Fair value estimation of financial assets and liabilities (continued)The fair values of financial instruments that are not traded in an active market (such as commodities forward contracts) aredetermined by making references to the prices provided by the Malaysian Palm Oil Board, other similar products and other commodityexchanges, and makes assumptions that are based on market conditions existing at each statement of financial position date. Whereappropriate, quoted market prices or dealer quotes for similar instruments are used.The fair values of currency forward contracts are determined using actively quoted forward exchange rates.The fair values of current financial assets and liabilities carried at amortised cost approximate their carrying amounts.2.15 Leases(a) When the <strong>Group</strong> is the lessee:(i)Lessee - Finance leasesLeases where the <strong>Group</strong> assumes substantially all risks and rewards incidental to ownership of the leased assets areclassified as finance leases.The leased assets and the corresponding lease liabilities (net of finance charges) under finance leases are recognised onthe statement of financial position as property, plant and equipment and borrowings respectively, at the inception of theleases based on the lower of the fair value of the leased assets and the present value of the minimum lease payments.Each lease payment is apportioned between the finance expense and the reduction of the outstanding lease liability. Thefinance expense is recognised in profit or loss on a basis that reflects a constant periodic rate of interest on the financelease liability.(ii) Lessee - Operating leasesLeases where substantially all risks and rewards incidental to ownership are retained by the lessors are classified asoperating leases. Payments made under operating leases (net of any incentives received from the lessors) are recognisedin profit or loss on a straight-line basis over the period of the lease.Initial direct costs incurred by the <strong>Group</strong> in negotiating and arranging operating leases are capitalised as prepayments andrecognised in profit or loss over the lease term on a straight line basis.Contingent rents are recognised as an expense in profit or loss when incurred.61
MEWAH INTERNATIONAL INC.NOTES TOTHE <strong>FINANCIAL</strong> <strong>STATEMENTS</strong>For the financial year ended 31 December 20122. SIGNIFICANT ACCOUNTING POLICIES (CONTINUED)2.15 Leases (continued)(b) When the <strong>Group</strong> is the lessor:2.16 InventoriesLessor - Operating leasesLeases where the <strong>Group</strong> retains substantially all risks and rewards incidental to ownership are classified as operating leases.Rental income from operating leases (net of any incentives given to the lessees) is recognised in profit or loss on a straight-linebasis over the lease term.Initial direct costs incurred by the <strong>Group</strong> in negotiating and arranging operating leases are added to the carrying amount ofthe leased assets and recognised as an expense in profit or loss over the lease term on the same basis as the lease income.Contingent rents are recognised as income in profit or loss when earned.Inventories are carried at the lower of cost and net realisable value. Cost is determined on weighted average basis. The cost offinished goods and work-in-progress comprises raw materials, direct labour, other direct costs and related production overheads(based on normal operating capacity) but excludes borrowing costs. Stores, spares and consumables are stated at cost and aredetermined on a weighted average basis. Net realisable value is the estimated selling price in the ordinary course of business, lessthe estimated costs of completion and applicable variable selling expenses.2.17 Income taxesCurrent income tax for current and prior periods is recognised at the amount expected to be paid to or recovered from the taxauthorities, using the tax rates and tax laws that have been enacted or substantively enacted by the statement of financial positiondate.Deferred income tax is recognised for all temporary differences arising between the tax bases of assets and liabilities and theircarrying amounts in the financial statements except when the deferred income tax arises from the initial recognition of goodwill oran asset or liability in a transaction that is not a business combination and affects neither accounting nor taxable profit or loss atthe time of the transaction.A deferred income tax liability is recognised on temporary differences arising on investments in subsidiaries and associatedcompanies, except where the <strong>Group</strong> is able to control the timing of the reversal of the temporary difference and it is probable thatthe temporary difference will not reverse in the foreseeable future.A deferred income tax asset is recognised to the extent that it is probable that future taxable profit will be available against whichthe deductible temporary differences and tax losses can be utilised.62
ANNUAL REPORT 2012NOTES TOTHE <strong>FINANCIAL</strong> <strong>STATEMENTS</strong>For the financial year ended 31 December 20122. SIGNIFICANT ACCOUNTING POLICIES (CONTINUED)2.17 Income taxes (continued)Deferred income tax is measured:(i)at the tax rates that are expected to apply when the related deferred income tax asset is realised or the deferred income taxliability is settled, based on tax rates and tax laws that have been enacted or substantively enacted by the statement of financialposition date; and(ii) based on the tax consequence that will follow from the manner in which the <strong>Group</strong> expects, at the statement of financialposition date, to recover or settle the carrying amounts of its assets and liabilities.Current and deferred income taxes are recognised as income or expense in profit or loss, except to the extent that the tax arises froma business combination or a transaction which is recognised directly in equity. Deferred tax arising from a business combination isadjusted against goodwill on acquisition.2.18 ProvisionsProvisions for restructuring costs and legal claims are recognised when the <strong>Group</strong> has a present legal or constructive obligation as aresult of past events, it is more likely than not that an outflow of resources will be required to settle the obligation and the amounthas been reliably estimated. Restructuring provisions comprise lease termination penalties and employee termination payments.Provisions are not recognised for future operating losses.Other provisions are measured at the present value of the expenditure expected to be required to settle the obligation using a pretaxdiscount rate that reflects the current market assessment of the time value of money and the risks specific to the obligation. Theincrease in the provision due to the passage of time is recognised in the profit or loss as finance costs.Changes in the estimated timing or amount of the expenditure or discount rate are recognised in profit or loss when the changes arise.2.19 Employee compensationEmployee benefits are recognised as an expense, unless the cost qualifies to be capitalised as an asset.(a) Defined contribution plansDefined contribution plans are post-employment benefit plans under which the <strong>Group</strong> pays fixed contributions into separateentities such as the Central Provident Fund on a mandatory, contractual or voluntary basis. The <strong>Group</strong> has no further paymentobligations once the contributions have been paid.(b) Employee leave entitlementEmployee entitlements to annual leave are recognised when they accrue to employees. Accrual is made for the estimatedliability for annual leave as a result of services rendered by employees up to the statement of financial position date.63
MEWAH INTERNATIONAL INC.NOTES TOTHE <strong>FINANCIAL</strong> <strong>STATEMENTS</strong>For the financial year ended 31 December 20122. SIGNIFICANT ACCOUNTING POLICIES (CONTINUED)2.20 Currency translation(a) Functional and presentation currencyItems included in the financial statements of each entity in the <strong>Group</strong> are measured using the currency of the primary economicenvironment in which the entity operates (“functional currency”). The financial statements are presented in United States Dollar(“presentation currency”), which is also the functional currency of the Company.(b) Transactions and balancesTransactions in a currency other than the functional currency (“foreign currency”) are translated into the functional currencyusing the exchange rates at the dates of the transactions. Currency translation differences from the settlement of suchtransactions and from the translation of monetary assets and liabilities denominated in foreign currencies at the closing ratesat the statement of financial position date are recognised in profit or loss.Non-monetary items measured at fair values in foreign currencies are translated using the exchange rates at the date when thefair values are determined.(c) Translation of <strong>Group</strong> entities’ financial statementsThe results and financial position of all the <strong>Group</strong> entities (none of which has the currency of a hyperinflationary economy) thathave a functional currency different from the presentation currency are translated into the presentation currency as follows:(i)Assets and liabilities are translated at the closing exchange rates at the reporting dates;(ii) Income and expenses are translated at average exchange rates (unless the average is not a reasonable approximation ofthe cumulative effect of the rates prevailing on the transaction dates, in which case income and expenses are translatedusing the exchange rates at the dates of the transactions); and(iii) All resulting currency translation differences are recognised in other comprehensive income and accumulated in thecurrency translation reserve.Goodwill and fair value adjustments arising on the acquisition of foreign operations are treated as assets and liabilities of theforeign operations and translated at the closing rates at the reporting date.2.21 Segment reportingOperating segments are reported in a manner consistent with the internal reporting provided to the executive committee whosemembers are responsible for allocating resources and assessing performance of the operating segments.2.22 Cash and cash equivalentsFor the purpose of presentation in the statement of cash flows, cash and cash equivalents include cash on hand, deposits withfinancial institutions which are subject to an insignificant risk of change in value, and bank overdrafts. Bank overdrafts are presentedas current borrowings on the statement of financial position.64
ANNUAL REPORT 2012NOTES TOTHE <strong>FINANCIAL</strong> <strong>STATEMENTS</strong>For the financial year ended 31 December 20122. SIGNIFICANT ACCOUNTING POLICIES (CONTINUED)2.23 Share capitalOrdinary shares are classified as equity. Incremental costs directly attributable to the issuance of new ordinary shares are deductedagainst the share premium account.2.24 Dividends to Company’s shareholdersDividends to the Company’s shareholders are recognised when dividends are approved for payment.3. CRITICAL ACCOUNTING ESTIMATES, ASSUMPTIONS AND JUDGEMENTSEstimates, assumptions and judgements are continually evaluated and are based on historical experience and other factors, includingexpectations of future events that are believed to be reasonable under the circumstances.(a) Fair value of derivative financial instrumentsThe <strong>Group</strong> is exposed to fluctuations in the prices of agri-commodities it deals in, including crude palm oil and palm oil products.The <strong>Group</strong> minimises the risk arising from such fluctuations by entering into commodities forward contracts and futures contracts.As the <strong>Group</strong> has not adopted hedge accounting, the fair value changes on these derivative financial instruments are recognised inthe profit or loss when the changes arise.The <strong>Group</strong>’s commodities forward contracts are not traded in an active market. The <strong>Group</strong> uses a variety of methods, such as makingreferences to the prices listed on Malaysian Palm Oil Board, other similar products and other exchanges, and makes assumptionsthat are based on market conditions existing at each statement of financial position date. Quoted market prices or dealer quotes arealso used to estimate the fair value, where appropriate.If the commodities prices had been higher or lower by 5% from management’s estimates and other variables remain constant, the<strong>Group</strong>’s profit after tax would have been lower or higher by US$7,000,000 respectively, arising from the changes in the fair value ofthe commodities forward contracts and futures contracts.(b) Impairment of loans and receivablesManagement reviews its loans and receivables for objective evidence of impairment on a regular basis. Significant financial difficultiesof the debtor, the probability that the debtor will enter bankruptcy, and default or significant delay in payments are consideredobjective evidence that a receivable is impaired. In determining this, management has made judgement as to whether there isobservable data indicating that there has been a significant change in the payment ability of the debtor, or whether there have beensignificant changes with adverse effect in the technological, market, economic or legal environment in which the debtor operates in.Where there is objective evidence of impairment, management has made judgements as to whether an impairment loss should berecorded as an expense. In determining this, management has made estimates based on historical loss experience for assets withsimilar credit risk characteristics. The methodology and assumptions used for estimating both the amount and timing of future cashflows are reviewed regularly to reduce any differences between the estimated loss and actual loss experienced.65
MEWAH INTERNATIONAL INC.NOTES TOTHE <strong>FINANCIAL</strong> <strong>STATEMENTS</strong>For the financial year ended 31 December 20123. CRITICAL ACCOUNTING ESTIMATES, ASSUMPTIONS AND JUDGEMENTS (CONTINUED)(b) Impairment of loans and receivables (continued)If the net present values of estimated cash flows had been higher or lower by 5% from management’s estimates for all past dueloans and receivables, the <strong>Group</strong>’s allowance for impairment would have been lower or higher by US$725,000 correspondingly toprofit or loss.(c) Uncertain tax positionsThe <strong>Group</strong> is subject to income taxes in numerous jurisdictions. In determining the income tax liabilities, management has estimatedthe amount of capital allowances, incentives and the deductibility of certain expenses (“uncertain tax positions”) at each taxjurisdiction. Where the final outcome of these matters is different from the amounts that were initially recorded, such as due tochanges in tax rules or revised interpretations of existing tax laws and precedent such differences will impact the income taxprovisions in the corresponding periods.(d) Useful lives of plant and equipmentThe cost of plant and equipment are depreciated on a straight-line basis over their useful lives, which management estimates to beof 20 years.These estimates could change significantly as a result of technical innovations.If the actual useful lives of these plant and equipment had been higher or lower by 5% from management estimates, the carryingamount of the plant and equipment would have been higher or lower by US$666,000 and US$736,000 and correspondingly toprofit or loss.4. REVENUE<strong>Group</strong>2012 2011US$’000US$’000Sale of agricultural products including palm based edible oils and fats in bulk 2,649,389 3,187,866Sale of agricultural products including palm based edible oils and fats in the form ofconsumer packs 971,392 1,280,0673,620,781 4,467,93366
ANNUAL REPORT 2012NOTES TOTHE <strong>FINANCIAL</strong> <strong>STATEMENTS</strong>For the financial year ended 31 December 20125. COST OF SALES<strong>Group</strong>2012 2011US$’000 US$’000Cost of inventories 3,403,121 4,212,598(Gains)/losses from derivative financial instruments (33,363) 31,139Labour costs and other overheads 38,841 38,5773,408,599 4,282,3146. OTHER INCOME<strong>Group</strong>2012 2011US$’000 US$’000Interest income on bank deposits 441 795Late interest charge on trade receivables 9,130 4,753Rental income 396 325Commission income 67 426Other miscellaneous income 806 1,57410,840 7,873Other miscellaneous income comprises mainly sales of by-products and waste.67
MEWAH INTERNATIONAL INC.NOTES TOTHE <strong>FINANCIAL</strong> <strong>STATEMENTS</strong>For the financial year ended 31 December 20127. OTHER LOSSES/(GAINS)<strong>Group</strong>2012 2011US$’000US$’000Foreign exchange losses/(gains) 4,502 (35,212)Property, plant and equipment written off 24 260(Gain)/loss on disposal of property, plant and equipment - net (300) 367Impairment of goodwill (Note 21) 3,161 2,717Gain on change in fair value of put option (Note 27(b)(ii)) (1,260) -6,127 (31,868)Non-controlling interests of Molly CGU have the option to put its shares to the <strong>Group</strong> for a cash consideration to be calculated inaccordance with the provisions of the shareholders’ agreement between the <strong>Group</strong> and the non-controlling interests. The <strong>Group</strong>recognises the present value of the estimated redemption amount as a financial liability. In 2012, a gain of US$1,260,000 arising fromthe change in the fair value of the put option has been recognised in profit or loss.8. FINANCE COSTSInterest expense:<strong>Group</strong>2012 2011US$’000US$’000- Bank borrowings 17,438 12,815- Finance lease liabilities 39 7217,477 12,887In 2012, borrowing costs of US$182,000 (2011: US$612,000) were capitalised at a rate of 5.28% (2011: 5.22%) per annum in property,plant and equipment.9. EMPLOYEE COMPENSATION<strong>Group</strong>2012 2011US$’000 US$’000Salaries 39,964 38,165Employer’s contributions to defined contribution plans 2,990 2,667Other staff benefits 456 74343,410 41,57568
ANNUAL REPORT 2012NOTES TOTHE <strong>FINANCIAL</strong> <strong>STATEMENTS</strong>For the financial year ended 31 December 201210. PROFIT BEFORE TAXThe following items have been included in arriving at profit before tax:<strong>Group</strong>2012 2011US$’000 US$’000Freight charges 81,545 68,912Transportation 10,974 12,235Insurance 6,129 6,694Utilities 9,105 9,808Rental on operating lease 829 986Employee compensation (Note 9) 43,410 41,575Depreciation of property, plant and equipment (Note 18) 16,889 14,142Bank charges 7,635 6,278(Reversal of)/allowance for impairment of trade receivables (Note 32(b)(ii)) (1,806) 7,507Amortisation of leasehold prepayments (Note 19) 929 58Audit fees- Auditors of the Company 310 299- Other auditors* 250 230Non-audit fees- Auditors of the Company 29 29- Other auditors* 67 50* Includes the network of member firms of PricewaterhouseCoopers International Limited (PWCIL).69
MEWAH INTERNATIONAL INC.NOTES TOTHE <strong>FINANCIAL</strong> <strong>STATEMENTS</strong>For the financial year ended 31 December 201211. INCOME TAX CREDITTax credit attributable to profit is made up of:<strong>Group</strong>2012 2011US$’000 US$’000Current income tax- Singapore 2,637 1,286- Foreign 1,655 1,4584,292 2,744Deferred income tax (2,958) 2,1501,334 4,894Over provision in prior financial years- Current income tax (6,494) (3,615)- Deferred income tax (239) (2,373)(6,733) (5,988)Income tax credit (5,399) (1,094)Income tax creditThe income tax on the <strong>Group</strong>’s profit before tax differs from the theoretical amount that would arise using the domestic rates of incometax as explained below:<strong>Group</strong>2012 2011US$’000 US$’000Profit before tax 18,126 38,164Tax calculated at domestic rates applicable to profits in the respective countries 3,652 7,384Effects of:- Tax incentives (6,260) (8,893)- Expenses not deductible for tax purposes 3,948 5,837- Income not subject to tax (349) (50)- Deferred tax benefits not recognised 273 916- Others 70 (300)1,334 4,89470
ANNUAL REPORT 2012NOTES TOTHE <strong>FINANCIAL</strong> <strong>STATEMENTS</strong>For the financial year ended 31 December 201211. INCOME TAX CREDIT (CONTINUED)Income tax credit (continued)The Singapore corporate tax rate was 17% for the financial years 2012 and 2011.The Malaysia corporate tax rate was 25% for the financial years 2012 and 2011.The weighted average applicable tax rate was 20.1% and 19.3% for the financial years ended 31 December 2012 and 31 December2011 respectively. The changes in weighted average applicable tax rates arose from changes in the mix of income subject to tax indifferent countries.The weighted average effective tax rate was 7.4% and 12.8% for the financial years ended 31 December 2012 and 31 December 2011respectively. The tax savings arise mainly from the following tax incentives:- certain subsidiaries in Singapore pay tax at a concessionary tax rate of 5% on qualifying income under the Global Trader Programmeof International Enterprise Singapore; and- certain subsidiaries in Malaysia entitled to reinvestment allowance, which allows additional allowance on qualifying capitalexpenditure.Over provision in prior financial yearsOver provision in prior financial years resulted from final tax outcome different from the amounts that were originally estimated forreinvestment allowances on qualifying capital expenditure for Malaysian-based operating subsidiaries, qualifying incomes under theGlobal Trader Programme of International Enterprise Singapore for Singapore-based operating subsidiaries, capital allowances, incentivesand the deductibility of certain expenses at the various tax jurisdictions.12. EARNINGS PER SHAREBasic earnings per share is calculated by dividing the net profit attributable to equity holders of the Company by the weighted averagenumber of ordinary shares outstanding during the financial year.<strong>Group</strong>2012 2011Net profit attributable to equity holders of the Company (US$’000) 24,788 42,245Weighted average number of ordinary shares outstanding for basic earnings per share (’000) 1,507,061 1,507,061Basic earnings per share (US cents per share) 1.64 2.80Diluted earnings per share was the same as the basic earnings per share for the financial years ended 31 December 2012 and 2011 asthere were no potential dilutive ordinary shares outstanding.71
MEWAH INTERNATIONAL INC.NOTES TOTHE <strong>FINANCIAL</strong> <strong>STATEMENTS</strong>For the financial year ended 31 December 201213. INVENTORIES<strong>Group</strong>2012 2011US$’000 US$’000Raw materials 76,915 92,899Finished goods 158,528 206,254Stores, spares and consumables 8,003 8,337243,446 307,490The cost of inventories recognised as an expense and included in “cost of sales” amounts to US$3,403,121,000 (2011: US$4,212,598,000).14. TRADE RECEIVABLES<strong>Group</strong>2012 2011US$’000 US$’000Trade receivables- Related parties 23,784 19,735- Non-related parties 434,670 412,465458,454 432,200Less: Allowance for impairment of trade receivables- non-related parties (Note 32 b(ii)) (14,491) (21,237)Trade receivables - net 443,963 410,963Related parties are companies in which the directors/shareholders of the Company have significant influence or control.15. OTHER RECEIVABLES<strong>Group</strong>Company2012 2011 2012 2011US$’000 US$’000 US$’000 US$’000Non-trade receivables 34,773 16,770 189,713 139,433Dividends receivable - - 12,000 15,000Deposits 7,271 3,990 33 -Prepayments 51,429 3,830 4 193,473 24,590 201,750 154,43472
ANNUAL REPORT 2012NOTES TOTHE <strong>FINANCIAL</strong> <strong>STATEMENTS</strong>For the financial year ended 31 December 201215. OTHER RECEIVABLES (CONTINUED)<strong>Group</strong>In 2012, non-trade receivables, deposits and prepayments included US$23,512,000 (2011: US$5,513,000) paid to Bursa MalaysiaDerivatives Clearing Bhd (“Bursa”) for commodity trading margin and advance payments of US$46,779,000 for the purchase ofraw materials, US$2,920,000 (2011: US$6,837,000) subsidy receivable from Malaysian Palm Oil Board, and US$7,000,000 (2011:US$6,300,000) advance payments for capital expenditure projects.As at 31 December 2012, there is a loan to a director of a subsidiary of US$71,000 (2011: US$94,000). The loan is interest free,unsecured and repayable on demand.CompanyNon-trade receivables included US$189,713,000 (2011: US$91,295,000) short term loans to subsidiaries at interest rates of 2.0% - 4.0%(2011: 2.0% - 3.0%) per annum and advances to subsidiaries of US$ Nil (2011: US$48,138,000) which were repayable on demand.Dividends receivable relates to dividends declared and unpaid by subsidiaries. The amount was non-interest bearing and repayable on demand.16. DERIVATIVE <strong>FINANCIAL</strong> INSTRUMENTS(a) Current portion2012<strong>Group</strong>Fair valuesContract notionalamount Asset LiabilityUS$’000 US$’000 US$’000Currency forward contracts (Note 32(e)) 1,029,988 6,968 2,647Commodities forward contracts (Note 32(e)) 1,891,393 84,735 40,402Futures contracts on commodity exchange (Note 32(e)) 1,072,858 9,532 13,050Total 101,235 56,0992011Currency forward contracts (Note 32(e)) 1,427,074 2,582 8,700Commodities forward contracts (Note 32(e)) 1,436,571 29,634 23,887Futures contracts on commodity exchange (Note 32(e)) 758,128 6,531 9,730Total 38,747 42,31773
MEWAH INTERNATIONAL INC.NOTES TOTHE <strong>FINANCIAL</strong> <strong>STATEMENTS</strong>For the financial year ended 31 December 201216. DERIVATIVE <strong>FINANCIAL</strong> INSTRUMENTS (CONTINUED)(a) Current portion (continued)2012CompanyFair valuesContract notionalamount Asset LiabilityUS$’000 US$’000 US$’000Currency forward contracts (Note 32(e)) 51 2 -2011Currency forward contracts (Note 32(e)) 1,959 - 30(b) Non-current portion2012<strong>Group</strong>Fair valuesContract notionalamount Asset LiabilityUS$’000 US$’000 US$’000Commodities forward contracts (Note 32(e)) 13,176 796 -Total 796 -2011Commodities forward contracts (Note 32(e)) 7,744 172 -Futures contracts on commodity exchange (Note 32(e)) 5,183 13 -Total 185 -(i)Currency forward contracts are entered into by the <strong>Group</strong> in currencies other than their respective functional currencies to manageexposure to fluctuations in foreign currency exchange rates on their transactions.(ii) The <strong>Group</strong> enters into commodities forward contracts and futures contracts to protect the <strong>Group</strong> from movements in market prices ofcrude palm oil and palm oil products by establishing the price at which the products will be sold or purchased.74
ANNUAL REPORT 2012NOTES TOTHE <strong>FINANCIAL</strong> <strong>STATEMENTS</strong>For the financial year ended 31 December 201217. CASH AND CASH EQUIVALENTS<strong>Group</strong>Company2012 2011 2012 2011US$’000 US$’000 US$’000 US$’000Cash at bank and on hand 31,679 49,352 381 15,509Short-term bank deposits 17,068 87,447 - 25,57348,747 136,799 381 41,082For the purposes of presenting the consolidated statement of cash flows, cash and cash equivalents comprise the following:<strong>Group</strong>2012 2011US$’000US$’000Cash and bank balances (as above) 48,747 136,799Less: Bank overdrafts (Note 24) - (164)Less: Restricted short-term bank deposits (190) (171)Cash and cash equivalents per consolidated statement of cash flows 48,557 136,464Restricted short-term bank deposits are deposits placed with a financial institution as security for banking facilities.75
MEWAH INTERNATIONAL INC.NOTES TO THE <strong>FINANCIAL</strong> <strong>STATEMENTS</strong>For the financial year ended 31 December 201218. PROPERTY, PLANT AND EQUIPMENT<strong>Group</strong>2012CostFreehold land andbuildingsLeasehold land andbuildingsPlant andequipmentFurniture, fixtures andoffice equipment Motor vehiclesCapital expenditurein progress TotalUS$’000 US$’000 US$’000 US$’000 US$’000 US$’000 US$’000Beginning of financial year 601 69,856 236,199 15,842 6,819 61,725 391,042Currency translation differences 12 2,803 8,752 477 229 1,457 13,730Additions 1,831 18,333 5,671 1,442 1,636 29,619 58,532Disposals (31) - (620) (711) (1,154) (68) (2,584)Write off (8) - (13) (370) (1) (2) (394)Reclassification - 8,414 29,795 208 - (38,417) -End of financial year 2,405 99,406 279,784 16,888 7,529 54,314 460,326Accumulated depreciationBeginning of financial year 71 10,745 78,108 10,133 4,189 - 103,246Currency translation differences 2 429 2,979 343 147 - 3,900Depreciation charge 46 1,645 12,279 1,834 1,085 - 16,889Disposals (9) - (239) (699) (1,053) - (2,000)Write off (1) - (4) (364) (1) - (370)End of financial year 109 12,819 93,123 11,247 4,367 - 121,665Net book valueEnd of financial year 2,296 86,587 186,661 5,641 3,162 54,314 338,66176
ANNUAL REPORT 2012NOTES TO THE <strong>FINANCIAL</strong> <strong>STATEMENTS</strong>For the financial year ended 31 December 201218. PROPERTY, PLANT AND EQUIPMENT (CONTINUED)<strong>Group</strong>2011CostFreehold land andbuildingsLeasehold land andbuildingsPlant andequipmentFurniture, fixtures andoffice equipment Motor vehiclesCapital expenditurein progress TotalUS$’000 US$’000 US$’000 US$’000 US$’000 US$’000 US$’000Beginning of financial year 207 60,140 186,202 13,720 6,553 44,617 311,439Currency translation differences 1 (1,610) (6,129) (240) (56) (1,330) (9,364)Additions - 10,840 7,904 2,529 731 70,234 92,238Disposals (74) (6) (2,172) (202) (432) (35) (2,921)Write off - (10) (234) (30) - (76) (350)Reclassification 467 502 50,628 65 23 (51,685) -End of financial year 601 69,856 236,199 15,842 6,819 61,725 391,042Accumulated depreciationBeginning of financial year 65 9,532 71,639 8,710 3,560 - 93,506Currency translation differences (2) (219) (1,909) (160) (42) - (2,332)Depreciation charge 31 1,432 9,920 1,798 961 - 14,142Disposals (23) - (1,478) (189) (290) - (1,980)Write off - - (64) (26) - - (90)End of financial year 71 10,745 78,108 10,133 4,189 - 103,246Net book valueEnd of financial year 530 59,111 158,091 5,709 2,630 61,725 287,79677
MEWAH INTERNATIONAL INC.NOTES TOTHE <strong>FINANCIAL</strong> <strong>STATEMENTS</strong>For the financial year ended 31 December 201218. PROPERTY, PLANT AND EQUIPMENT (CONTINUED)(a) The carrying amounts of motor vehicles held under finance leases are US$1,070,000 (2011: US$945,000) at the statement of financialposition date.(b) Bank borrowings are secured on property, plant and equipment of the <strong>Group</strong> with carrying amounts of US$173,187,000 (2011:US$155,772,000).(c) The revalued property, plant and equipment deemed as cost were as follows:<strong>Group</strong>2012 2011US$’000 US$’000Leasehold land and building 10,699 10,214Plant and machinery 19,773 19,158Furniture, fixture and office equipment 220 23130,692 29,60319. LEASEHOLD PREPAYMENTSCost<strong>Group</strong>2012 2011US$’000US$’000Beginning of financial year 13,572 -Addition 5,195 14,063Currency translation differences - (491)End of financial year 18,767 13,572Accumulated amortisationBeginning of financial year (58) -Amortisation (929) (58)End of financial year (987) (58)Net book valueEnd of financial year 17,780 13,514Leasehold prepayments represented land use rights paid by subsidiaries for industrial lands with leasehold period ranging from 16 to 30years.78
ANNUAL REPORT 2012NOTES TOTHE <strong>FINANCIAL</strong> <strong>STATEMENTS</strong>For the financial year ended 31 December 201220. INVESTMENT IN ASSOCIATED COMPANY AND SUBSIDIARIES(a) Investment in associated companyEquity investment at cost<strong>Group</strong>2012 2011US$’000US$’000Beginning of financial year 204 86Share of profits 60 123Currency translation differences 7 (5)End of financial year 271 204The summarised financial information of associated company, not adjusted for the proportion ownership interest held by the <strong>Group</strong>, isas follows:<strong>Group</strong>2012 2011US$’000US$’000Assets 1,107 826Liabilities 553 416Revenue 2,834 2,744Net profit 122 251Details of the associated company are included in Note 38.(b) Investment in subsidiariesEquity investments at costCompany2012 2011US$’000US$’000Beginning of financial year 820 *-Additions - 820End of financial year 820 820* As at 31 December 2011, the nominal value of investment in subsidiaries held directly by the Company was US$104.In 2012, Semenyih Inc. and <strong>Mewah</strong> (HK) Limited were incorporated on 3 May 2012 and 21 May 2012 respectively. Both subsidiariesare wholly owned subsidiaries of the Company. The cost of investment in these newly incorporated subsidiaries is less than US$1,000.Details of the subsidiaries are included in Note 38.79
MEWAH INTERNATIONAL INC.NOTES TOTHE <strong>FINANCIAL</strong> <strong>STATEMENTS</strong>For the financial year ended 31 December 201221. INTANGIBLE ASSETComposition:Goodwill<strong>Group</strong>2012 2011US$’000 US$’000CostBeginning of financial year 5,718 5,846Currency translation differences 112 (128)End of financial year 5,830 5,718Accumulated impairmentBeginning of financial year (2,529) -Impairment charge (Note 7) (3,161) (2,717)Currency translation differences (140) 188End of financial year (5,830) (2,529)Net book value - 3,189Impairment test for goodwillAs at 31 December 2011, goodwill was wholly allocated to the Molly CGU. Molly CGU consist of Molly Foods bvba, a company incorporatedin Belgium which through its wholly owned subsidiary, Bloom Land Enterprises Limited (“Bloomland”), a company incorporated in HongKong, owns 100% of BeCe S.à.r.l. (“BeCe”), a company incorporated in Togo. Molly CGU is involved primarily in importing commodities,including edible oils and fats products produced by the <strong>Group</strong>, for sale in West Africa. Please also see Note 35 for a subsequent eventinvolving Molly CGU.Following continued tough market conditions, slowed demands resulting in high inventory carry cost coupled with losses due to falling pricesand expectations of the market developments, management determined that the recoverable amount of the CGU is below the carrying value.An impairment charge of US$3,161,000 (2011: US$2,717,000) was included in the income statement within “other losses/(gains)” (Note 7).22. TRADE PAYABLES<strong>Group</strong>2012 2011US$’000 US$’000Trade payables- Related parties 890 1,007- Non-related parties 242,613 209,456243,503 210,46380
ANNUAL REPORT 2012NOTES TOTHE <strong>FINANCIAL</strong> <strong>STATEMENTS</strong>For the financial year ended 31 December 201223. OTHER PAYABLESNon-trade payables<strong>Group</strong>Company2012 2011 2012 2011US$’000 US$’000 US$’000 US$’000- Related parties 2 16 48 5- Associated company 232 362 - -- Non-related parties 20,781 24,515 - -21,015 24,893 48 5Accrual for operating expenses 25,063 26,460 202 198<strong>Group</strong>46,078 51,353 250 203Amount due to associated company and related parties, mainly for forwarding services and rental of premises, are unsecured, interest-freeand repayable on demand.CompanyAmount due to related parties are unsecured, interest-free and repayable on demand.81
MEWAH INTERNATIONAL INC.NOTES TOTHE <strong>FINANCIAL</strong> <strong>STATEMENTS</strong>For the financial year ended 31 December 201224. BORROWINGSCurrent<strong>Group</strong>2012 2011US$’000US$’000Bank overdrafts (Note 17) - 164Bank borrowings- Export credit financing 10,204 23,968- Bankers’ acceptance 226,121 153,122- Revolving credit 9,261 11,823- Trust receipts and bills payable 13,267 142,088- Term loans 25,244 7,893Finance lease liabilities (Note 24(c)) 169 301Non-currentBank borrowings284,266 339,359- Term loans 99,222 46,513Finance lease liabilities (Note 24(c)) 184 25899,406 46,771Total borrowings 383,672 386,130(a) Securities grantedThe borrowings of the <strong>Group</strong> are secured by:- Specific fixed charge and legal charges against certain assets of several subsidiaries- Personal guarantee by a director of a subsidiary- Corporate guarantees by the Company and certain subsidiariesFinance lease liabilities are secured over the leased motor vehicles as at 31 December 2012 with carrying value of US$1,070,000 (2011:US$945,000) as the legal title is retained by the lessor and will be transferred to the <strong>Group</strong> upon full settlement of the finance leaseliabilities.(b) Fair value of non-current borrowingsThe fair value of borrowings approximated the carrying value of the borrowings at statement of financial position date as they bearinterest at rates which approximate the current incremental borrowing rate for similar types of lending and borrowing arrangements,which management expects to be available to the <strong>Group</strong>.82
ANNUAL REPORT 2012NOTES TOTHE <strong>FINANCIAL</strong> <strong>STATEMENTS</strong>For the financial year ended 31 December 201224. BORROWINGS (CONTINUED)(c) Finance lease liabilitiesThe <strong>Group</strong> leases certain plant and equipment under finance leases.<strong>Group</strong>2012 2011US$’000 US$’000Minimum lease payments due- Not later than one year 194 336- Between one and two years 115 232- Between two and five years 87 44396 612Less: Future finance charges (43) (53)Present value of finance lease liabilities 353 559The present values of finance lease liabilities were analysed as follows:<strong>Group</strong>2012 2011US$’000 US$’000Not later than one year 169 301Between one and two years 103 219Between two and five years 81 39353 55983
MEWAH INTERNATIONAL INC.NOTES TOTHE <strong>FINANCIAL</strong> <strong>STATEMENTS</strong>For the financial year ended 31 December 201225. DEFERRED INCOME TAXESDeferred income tax assets and liabilities are offset when there is a legally enforceable right to offset current income tax assets against currentincome tax liabilities and when the deferred income taxes relate to the same fiscal authority. The amounts, determined after appropriateoffsetting, were shown on the statement of financial position as follows:<strong>Group</strong>2012 2011US$’000 US$’000Deferred income tax assets- expected to be recovered within one year 661 -Deferred income tax liabilities- expected to be settled within one year (7,783) (5,781)- expected to be settled after one year (4,685) (9,099)(12,468) (14,880)(11,807) (14,880)Movement in deferred income tax account is as follows:2012 2011US$’000 US$’000Beginning of financial year (14,880) (15,453)Currency translation differences (506) 350Tax charged to- profit or loss 3,197 223- equity 382 -End of financial year (11,807) (14,880)84
ANNUAL REPORT 2012NOTES TOTHE <strong>FINANCIAL</strong> <strong>STATEMENTS</strong>For the financial year ended 31 December 201225. DEFERRED INCOME TAXES (CONTINUED)The movement in deferred income tax assets and liabilities (prior to offsetting of balances within the same tax jurisdiction) is as follows:<strong>Group</strong>Deferred income tax liabilities2012Accelerated taxdepreciationRevaluation ofproperty, plant andequipmentUnremitted foreignincomeTotalUS$’000 US$’000 US$’000 US$’000Beginning of financial year (26,591) (3,050) - (29,641)Currency translation differences (1,039) (32) - (1,071)(Charged)/credited to- profit or loss (1,555) 13 (375) (1,917)- equity - 382 - 382End of financial year (29,185) (2,687) (375) (32,247)2011Accelerated taxdepreciationRevaluation ofproperty, plant andequipmentTotalUS$’000 US$’000 US$’000Beginning of financial year (24,981) (2,691) (27,672)Currency translation differences 679 62 741Charged to- profit or loss (2,289) (421) (2,710)End of financial year (26,591) (3,050) (29,641)85
MEWAH INTERNATIONAL INC.NOTES TOTHE <strong>FINANCIAL</strong> <strong>STATEMENTS</strong>For the financial year ended 31 December 201225. DEFERRED INCOME TAXES (CONTINUED)<strong>Group</strong> (continued)Deferred income tax assets2012Unutilised taxlossesUnutilisedreinvestmentallowanceUnrealised loss onderivative financialinstruments Others TotalUS$’000 US$’000 US$’000 US$’000 US$’000Beginning of financial year 110 8,166 4,898 1,587 14,761Currency translationdifferences 4 330 151 80 565Credited/(charged) to- profit or loss 561 3,962 (1,679) 2,270 5,114End of financial year 675 12,458 3,370 3,937 20,4402011Beginning of financial year 45 4,611 6,572 991 12,219Currency translationdifferences (9) (232) (112) (38) (391)Credited/(charged) to- profit or loss 74 3,787 (1,562) 634 2,933End of financial year 110 8,166 4,898 1,587 14,761Deferred income tax assets are recognised for tax losses and capital allowances carried forward to the extent that realisation of the relatedtax benefits through future taxable profits is probable. The <strong>Group</strong> has unrecognised tax losses of US$9,370,000 (2011: US$4,960,000) atthe statement of financial position date which can be carried forward and used to offset against future taxable income subject to meetingcertain statutory requirements by those companies with unrecognised tax losses and capital allowances in their respective countries ofincorporation. The tax losses have no expiry date.86
ANNUAL REPORT 2012NOTES TOTHE <strong>FINANCIAL</strong> <strong>STATEMENTS</strong>For the financial year ended 31 December 201226. SHARE CAPITAL AND SHARE PREMIUM<strong>Group</strong> and CompanyAuthorised sharecapital at par valueof US$0.001/US$0.01No. of ordinary sharesIssued share capitalat par value ofUS$0.001/US$0.01Authorised sharecapital at par valueof US$0.001/US$0.01AmountShare capital at parvalue of US$0.001/US$0.01Share premium‘000 ‘000 US$’000 US$’000 US$’0002012Beginning and end offinancial year, ordinaryshares at par value,US$0.001 30,000,000 1,507,061 30,000 1,507 185,4162011Beginning and end offinancial year, ordinaryshares at par value,US$0.001 30,000,000 1,507,061 30,000 1,507 185,416All issued ordinary shares are fully paid. Fully paid ordinary shares carry one vote per share and carry a right to dividends as and whendeclared by the Company.27. OTHER RESERVES<strong>Group</strong>2012 2011US$’000 US$’000(a) Composition:Merger reserve (50,706) (50,749)General reserve (2,608) (2,608)Asset revaluation reserve 10,058 10,146Currency translation reserve 35,667 27,796(7,589) (15,415)Merger reserve represents the difference between the cost of investment and nominal value of share capital of the merged subsidiary.87
MEWAH INTERNATIONAL INC.NOTES TOTHE <strong>FINANCIAL</strong> <strong>STATEMENTS</strong>For the financial year ended 31 December 201227. OTHER RESERVES (CONTINUED)(b) Movements<strong>Group</strong>2012 2011US$’000 US$’000(i)Merger reserveBeginning of financial year (50,749) (50,749)Acquisition of subsidiaries under common control 43 -End of financial year (50,706) (50,749)(ii) General reserveBeginning of financial year (2,608) (832)Acquisition of non-controlling interests - (516)Put option granted to non-controlling interests* - (1,260)End of financial year (2,608) (2,608)(iii) Asset revaluation reserveBeginning of financial year 10,146 10,281Realisation of reserve upon disposal (470) (135)Tax relating to asset revaluation reserve 382 -End of financial year 10,058 10,146(iv) Currency translation reserveBeginning of financial year 27,796 31,794Net currency translation differences of foreign subsidiaries 7,853 (3,798)Non-controlling interests 18 (200)End of financial year 35,667 27,796Other reserves are non-distributable.* Certain non-controlling interests have the option to put its shares to the <strong>Group</strong> for a cash consideration to be calculated inaccordance with the provisions of the shareholders’ agreement between the <strong>Group</strong> and the non-controlling interests. The <strong>Group</strong>recognises the present value of the estimated redemption amount as a financial liability (included in non-trade payables, Note 23)against equity.28. RETAINED PROFITS(a) Retained profits of the <strong>Group</strong> are distributable, to the extent that it is in compliance with the local guidelines of the countries inwhich the subsidiaries operate and the restrictions imposed by the covenant underlying our borrowings.88
ANNUAL REPORT 2012NOTES TOTHE <strong>FINANCIAL</strong> <strong>STATEMENTS</strong>For the financial year ended 31 December 201228. RETAINED PROFITS (CONTINUED)(b) Movement in retained profits for the Company is as follows:Company2012 2011US$’000 US$’000Beginning of financial year 8,932 (3,105)Dividends (Note 29) (9,646) (4,333)Total comprehensive income for the financial year 15,627 16,370End of financial year 14,913 8,93229. DIVIDENDSDeclared and paid during the financial year:<strong>Group</strong> and Company2012 2011US$’000 US$’000Dividend on ordinary shares:- Final exempt one-tier dividends of S$0.0050 for 2011 per share 6,021 -- Interim exempt dividends of S$0.0030 (2011: S$0.0035) per share 3,625 4,3339,646 4,333Proposed but not recognised as a liability as at 31 December:Dividends on ordinary shares, subject to shareholders’ approval at the AGM:Final exempt one-tier dividends of S$0.0055 (2011: S$0.0050) per share 6,773 5,83089
MEWAH INTERNATIONAL INC.NOTES TOTHE <strong>FINANCIAL</strong> <strong>STATEMENTS</strong>For the financial year ended 31 December 201230. CONTINGENT LIABILITIES<strong>Group</strong>(a) In March 2007, criminal charges in Malaysia were brought against <strong>Mewah</strong>-Oils Sdn Bhd (“MOSB”), a wholly-owned subsidiary, anda director of the Company alleging that between October 2003 and November 2003, MOSB used two falsified customs documents todischarge crude palm oil (“CPO”). MOSB has also been charged with dishonestly receiving 6,998 MT of CPO alleging that such CPOwas stolen property belonging to Lushing Traders Pte Ltd (“Lushing”). The maximum penalty under law is a fine not exceeding MalaysianRinggit 500,000 (US$158,000) or imprisonment for a term not exceeding five years, or both. The charges arose from a complaint madeby Lushing. In 2003, MOSB had purchased and paid for CPO from Summerwind Trading Pte Ltd (“Summerwind”) which Summerwindhad purchased from Lushing.In April 2010, a civil claim was made by Lushing against MOSB in the Malaysian High Courts for having wrongfully received andconverted 6,998 MT of CPO and claimed US$2,650,000 and interest at 8.0% per annum from the alleged date of conversion of theCPO, which is between October 2003 and November 2003, costs and any other relief that may be granted by the court.On 26 January 2012, the Sessions Court Judge in Klang dismissed all charges against MOSB and the director ruling that the prosecutionhad failed to establish a prima facie case and therefore there was no need for the defence to be called. The judge ruled that therewas insufficient evidence to prove that MOSB was capable of forging or falsifying the documents, MOSB did not have any contractualrelationship with Lushing in the said contracts of selling and buying of palm oil and that MOSB could not be blamed for dischargingthe cargo because it must have thought that the deal between Lushing and Summerwind would eventually be settled by those parties.On 27 January 2012, the prosecution has appealed to the High Court of Malaysia against the judgement.Shafee & Co, representing MOSB and the director, is of the view that the cases are without merit, as the documentary evidence availableindicates MOSB had properly imported the CPO into Malaysia and that MOSB was not party to the contract between Lushing andSummerwind for the sale and purchase of the relevant CPO.There is no further progress to the matter since January 2012.(b) In 2010, a claim against Moi Foods Malaysia Sdn Bhd (“Moi Foods”), a wholly-owned subsidiary, in the High Court of Malaya, ShahAlam, in the State of Darul Ehsan, Malaysia for the amount of Malaysian Ringgit 836,805 (US$216,321) for alleged non-paymentby Moi Foods of a construction contract entered into in 2001 between the claimants and <strong>Mewah</strong>-Oils Sdn Bhd (which subsequentlynovated the contract to Moi Foods) to construct a building block consisting of warehouse and offices on Lot 40 Phase 2A Pulau IndahIndustrial Park. Moi Foods has filed a defence disputing the amount claimed in 2010.The pleadings are closed. The matter has been pending since 2010 without any further developments.CompanyThe Company has issued corporate guarantees to banks for borrowings to certain subsidiaries. As at 31 December 2012, the borrowingsunder the guarantees amounted to US$376,106,000 (2011: US$292,420,000). The financial effects of FRS 39 relating to the financialguarantee contracts issued by the Company are not material to the financial statements of the Company and therefore are not recognised.The management is of the view that no loss is expected to arise from the guarantees.90
ANNUAL REPORT 2012NOTES TOTHE <strong>FINANCIAL</strong> <strong>STATEMENTS</strong>For the financial year ended 31 December 201231. COMMITMENTS(a) Capital commitmentsCapital expenditures contracted for at the statement of financial position date but not recognised in the financial statements are asfollows:<strong>Group</strong>2012 2011US$’000US$’000Property, plant and equipment 54,387 40,063(b) Operating lease commitments - where the <strong>Group</strong> is a lesseeThe <strong>Group</strong> leases office premises and equipments from non-related parties under non-cancellable operating lease agreements. Theleases have varying terms, escalation clauses and renewal rights.The future minimum lease payables under non-cancellable operating leases contracted for at the statement of financial position datebut not recognised as liabilities, are as follows:<strong>Group</strong>2012 2011US$’000US$’000Not later than one year 415 333Between one and five years 1,385 1,186Later than five years 4,544 3,984(c) Operating lease commitments - where the <strong>Group</strong> is a lessor6,344 5,503The <strong>Group</strong> leases out office space under its leasehold buildings to non-related parties under non-cancellable operating leases.The future minimum lease receivables under non-cancellable operating leases contracted for at the statement of financial position datebut not recognised as receivables, are as follows:<strong>Group</strong>2012 2011US$’000 US$’000Not later than one year 72 364Between one and five years 50 293Later than five years - 130122 78791
MEWAH INTERNATIONAL INC.NOTES TOTHE <strong>FINANCIAL</strong> <strong>STATEMENTS</strong>For the financial year ended 31 December 201232. <strong>FINANCIAL</strong> RISK MANAGEMENTFinancial risk factorsThe <strong>Group</strong>’s activities expose it to market risk (including currency risk, commodity price risk and interest rate risk), credit risk and liquidityrisk. The <strong>Group</strong>’s overall risk management strategy seeks to minimise any adverse effects from the unpredictability of financial markets on the<strong>Group</strong>’s financial performance. The <strong>Group</strong>’s risk management strategy provides for the use of financial instruments such as currency forwardcontracts, commodities forward and futures contracts of crude palm oil and palm oil products.Financial risk management is carried out by a Risk Committee in accordance with the policies set by the Board of Directors. The RiskCommittee works closely with the <strong>Group</strong>’s operating units in identifying, evaluating and managing financial risks. Regular reports aresubmitted to the Board of Directors.(a) Market risk(i)Currency riskThe <strong>Group</strong>’s revenue is denominated primarily in United States Dollar (“USD”), the functional and reporting currency of theCompany. There are some exposures in other currencies, the most significant of which are the Malaysian Ringgit (“Ringgit”),Singapore Dollar (“SGD”) and Australia Dollar (“AUD”). Currency risk arises within entities in the <strong>Group</strong> when transactions aredenominated in currencies other than the entities’ functional currencies.The <strong>Group</strong>’s risk management strategy provides for the use of currency forward contracts to hedge its future committed foreignexchange exposures, if necessary.92
ANNUAL REPORT 2012NOTES TOTHE <strong>FINANCIAL</strong> <strong>STATEMENTS</strong>For the financial year ended 31 December 201232. <strong>FINANCIAL</strong> RISK MANAGEMENT (CONTINUED)(a) Market risk (continued)(i)Currency risk (continued)The <strong>Group</strong>’s currency exposure based on the information provided to key management is as follows:At 31 December 2012USD SGD Ringgit AUD Others TotalUS$’000 US$’000 US$’000 US$’000 US$’000 US$’000Financial assetsCash and cash equivalents 15,093 767 10,264 210 22,413 48,747Trade and other receivables 328,912 4,142 61,423 4,629 86,901 486,007Intercompany receivables 843,230 20 190,690 4,838 51,514 1,090,2921,187,235 4,929 262,377 9,677 160,828 1,625,046Financial liabilitiesBorrowings (30,232) (158) (346,796) (6,390) (96) (383,672)Other financial liabilities (132,140) (13,979) (135,142) (1,084) (7,236) (289,581)Intercompany payables (843,230) (20) (190,690) (4,838) (51,514) (1,090,292)(1,005,602) (14,157) (672,628) (12,312) (58,846) (1,763,545)Net financial assets/(liabilities) 181,633 (9,228) (410,251) (2,635) 101,982 (138,499)Add: Firm commitments andhighly probable forecasttransactions in foreigncurrencies 326,123 7,011 (71,058) - 76,202 338,278Less: Currency forward contracts (215,473) 6,900 374,399 (9,913) (155,913) -Currency profile 292,283 4,683 (106,910) (12,548) 22,271 199,779Financial (assets)/liabilitiesdenominated in the respectiveentities’ functional currencies (261,067) (7,508) 106,221 8,112 (6,991) (161,233)Currency exposure of financialassets/(liabilities) net ofthose denominated in therespective entities’ functionalcurrencies 31,216 (2,825) (689) (4,436) 15,280 38,54693
MEWAH INTERNATIONAL INC.NOTES TOTHE <strong>FINANCIAL</strong> <strong>STATEMENTS</strong>For the financial year ended 31 December 201232. <strong>FINANCIAL</strong> RISK MANAGEMENT (CONTINUED)(a) Market risk (continued)(i)Currency risk (continued)The <strong>Group</strong>’s currency exposure based on the information provided to key management is as follows: (continued)At 31 December 2011USD SGD Ringgit AUD Others TotalUS$’000 US$’000 US$’000 US$’000 US$’000 US$’000Financial assetsCash and cash equivalents 48,284 31,646 12,455 244 44,170 136,799Trade and other receivables 323,872 3,960 48,333 2,982 52,576 431,723Intercompany receivables 699,619 66,093 206,304 345 80,287 1,052,6481,071,775 101,699 267,092 3,571 177,033 1,621,170Financial liabilitiesBorrowings (150,330) (1,355) (230,562) (3,706) (177) (386,130)Other financial liabilities (105,051) (16,822) (133,445) (1,204) (5,294) (261,816)Intercompany payables (699,619) (66,093) (206,304) (345) (80,287) (1,052,648)(955,000) (84,270) (570,311) (5,255) (85,758) (1,700,594)Net financial assets/(liabilities) 116,775 17,429 (303,219) (1,684) 91,275 (79,424)Add: Firm commitments andhighly probable forecasttransactions in foreigncurrencies 254,497 6,111 (90,593) - 45,542 215,557Less: Currency forward contracts (554,363) 12,788 597,698 (4,260) (51,863) -Currency profile (183,091) 36,328 203,886 (5,944) 84,954 136,133Financial (assets)/liabilitiesdenominated in the respectiveentities’ functional currencies (15,056) (1,206) (205,676) 1,414 (127,164) (347,688)Currency exposure of financialassets/(liabilities) net ofthose denominated inthe respective entities’functional currencies (198,147) 35,122 (1,790) (4,530) (42,210) (211,555)94
ANNUAL REPORT 2012NOTES TOTHE <strong>FINANCIAL</strong> <strong>STATEMENTS</strong>For the financial year ended 31 December 201232. <strong>FINANCIAL</strong> RISK MANAGEMENT (CONTINUED)(a) Market risk (continued)(i)Currency risk (continued)The Company’s currency exposure based on the information provided to key management is as follows: (continued)At 31 December 2012Financial assetsUSD SGD EURO TotalUS$’000 US$’000 US$’000 US$’000Cash and cash equivalents 347 34 - 381Intercompany receivables 201,750 - - 201,750Financial liabilities202,097 34 - 202,131Other financial liabilities - (202) - (202)Intercompany payables (48) - - (48)(48) (202) - (250)Net financial assets/(liabilities) 202,049 (168) - 201,881Less: Currency forward contracts - (49) 51 2Currency profile 202,049 (217) 51 201,883Financial (assets)/liabilities denominatedin the Company’s functionalcurrency (202,049) - - (202,049)Currency exposure of financialassets/(liabilities) net of thosedenominated in the Company’sfunctional currency - (217) 51 (166)95
MEWAH INTERNATIONAL INC.NOTES TOTHE <strong>FINANCIAL</strong> <strong>STATEMENTS</strong>For the financial year ended 31 December 201232. <strong>FINANCIAL</strong> RISK MANAGEMENT (CONTINUED)(a) Market risk (continued)(i)Currency risk (continued)The Company’s currency exposure based on the information provided to key management is as follows: (continued)At 31 December 2011Financial assetsUSD SGD Ringgit TotalUS$’000 US$’000 US$’000 US$’000Cash and cash equivalents 13,008 28,074 - 41,082Intercompany receivables 90,686 63,747 - 154,433Financial liabilities103,694 91,821 - 195,515Other financial liabilities (33) (117) (48) (198)Intercompany payables (5) - - (5)(38) (117) (48) (203)Net financial assets/(liabilities) 103,656 91,704 (48) 195,312Less: Currency forward contracts - 1,959 - 1,959Currency profile 103,656 93,663 (48) 197,271Financial (assets)/liabilities denominatedin the Company’s functionalcurrency (103,656) - - (103,656)Currency exposure of financialassets/(liabilities) net of thosedenominated in the Company’sfunctional currency - 93,663 (48) 93,61596
ANNUAL REPORT 2012NOTES TOTHE <strong>FINANCIAL</strong> <strong>STATEMENTS</strong>For the financial year ended 31 December 201232. <strong>FINANCIAL</strong> RISK MANAGEMENT (CONTINUED)(a) Market risk (continued)(i)Currency risk (continued)With all other variables including tax rate being held constant, the effects arising from the net financial assets/liabilities positionwill be as follows:2012 2011Increase/(decrease)Change Profit after tax Change Profit after tax% US$’000 % US$’000<strong>Group</strong>USD against SGD- Strengthened 6 157 1 (306)- Weakened 6 (157) 1 306USD against Ringgit- Strengthened 3 19 2 31- Weakened 3 (19) 2 (31)USD against AUD- Strengthened 1 41 1 40- Weakened 1 (41) 1 (40)CompanyUSD against SGD- Strengthened 6 11 1 (777)- Weakened 6 (11) 1 777USD against Ringgit- Strengthened 3 - 2 1- Weakened 3 - 2 (1)USD against EURO- Strengthened 2 (1) 2 -- Weakened 2 1 2 -97
MEWAH INTERNATIONAL INC.NOTES TOTHE <strong>FINANCIAL</strong> <strong>STATEMENTS</strong>For the financial year ended 31 December 201232. <strong>FINANCIAL</strong> RISK MANAGEMENT (CONTINUED)(a) Market risk (continued)(ii) Cash flows and fair value interest rate risksCash flows interest rate risk is the risk that the future cash flows of a financial instrument will fluctuate because of changes inmarket interest rates. Fair value interest rate risk is the risk that the fair value of a financial instrument will fluctuate due to changesin market interest rates. The <strong>Group</strong>’s exposure to interest rate risk arises primarily from their borrowings and deposits placed withcreditworthy licensed banks and financial institutions.The <strong>Group</strong>’s policy is to enter into variable interest rates borrowings.The <strong>Group</strong>’s borrowings were denominated mainly in Ringgit and USD. As at 31 December 2012, profit after tax for the financialyear would have been lower or higher by US$372,000 (2011: US$174,000) if market interest rates had been 50 basis points higheror lower with all other variables held constant.(iii) Commodity price risk(b) Credit riskThe <strong>Group</strong> is exposed to fluctuations in the prices of agri-commodities it deals in, including crude palm oil and palm oil productsprices. The <strong>Group</strong> minimises the risk arising from such fluctuations by entering into commodities forward contracts and futurescontracts. The <strong>Group</strong> has not adopted hedge accounting.In the course of entering into these contracts, the <strong>Group</strong> may be exposed to the inherent risk associated with trading activitiesconducted by its personnel. The <strong>Group</strong> has in place a risk management system to manage such risk exposure.As at 31 December 2012, if the commodity prices had increased or decreased by 5% and other variables held constant, the <strong>Group</strong>’sprofit after tax would have been lower or higher by US$7,000,000 (2011: US$6,457,000) respectively, arising from the changes infair value of the commodities forward and futures contracts.Credit risk refers to the risk that counterparty will default on its contractual obligations resulting in financial loss to the <strong>Group</strong>. Themajor classes of financial assets of the <strong>Group</strong> are trade and other receivables and bank deposits. For trade and other receivables, the<strong>Group</strong> adopts the policy of dealing only with customers of appropriate credit history, and obtaining sufficient collateral or buying creditinsurance where appropriate to mitigate credit risk. For other financial assets, the <strong>Group</strong> adopts the policy of dealing only with highcredit quality counterparties.The <strong>Group</strong> has a credit risk policy in place to manage credit risk. All new customers are subject to credit worthiness check; counterpartiesare ranked and assigned a credit limit appropriately. Such credit limit would be approved by a Risk Committee. In addition, any increasein credit limit requires approval from the Risk Committee. The Risk Committee is mandated to monitor the payment ageing profile of thethird party receivables, to review all the outstanding receivables regularly and to identify any potential uncollectible for doubtful debtsprovision and/or write-off.98
ANNUAL REPORT 2012NOTES TOTHE <strong>FINANCIAL</strong> <strong>STATEMENTS</strong>For the financial year ended 31 December 201232. <strong>FINANCIAL</strong> RISK MANAGEMENT (CONTINUED)(b) Credit risk (continued)As the <strong>Group</strong> does not hold any collateral, the maximum exposure to credit risk for each class of financial instruments is the carryingamount of that class of financial instruments presented on the statement of financial position, except as follows:Company2012 2011US$’000US$’000Corporate guarantees provided to financial institutions on subsidiaries’ borrowings 376,106 292,420The management is of the view that no loss is expected to arise from the guarantees.The major trade receivables of the <strong>Group</strong> comprised of 1 debtor for 2012 (2011: 1 debtor) and represented 32% of trade receivables(2011: 26%). The Company did not have trade receivables in 2012 and 2011.The credit risk for trade receivables based on the information provided to key management was as follows:<strong>Group</strong>2012 2011US$’000 US$’000By geographical segment- AsiaMalaysia 182,265 158,152Singapore 33,772 33,306Rest of Asia 50,686 36,745- Africa 44,328 39,903- Middle East 89,761 73,492- Europe 29,798 47,624- Pacific Oceania 6,815 5,450- America 6,538 16,291443,963 410,963(i)Financial assets that are neither past due nor impairedBank deposits that are neither past due nor impaired are mainly deposits with banks of good credit-ratings. Trade receivables thatare neither past due nor impaired are substantially companies with a good collection track record with the <strong>Group</strong> and there wasno historical track record of default.99
MEWAH INTERNATIONAL INC.NOTES TOTHE <strong>FINANCIAL</strong> <strong>STATEMENTS</strong>For the financial year ended 31 December 201232. <strong>FINANCIAL</strong> RISK MANAGEMENT (CONTINUED)(b) Credit risk (continued)(ii) Financial assets that are past due and/or impairedThere is no other class of financial assets that is past due and/or impaired except for trade receivables.The age analysis of trade receivables past due but not impaired is as follows:<strong>Group</strong>2012 2011US$’000US$’000Past due < 3 months 154,483 59,811Past due 3 to 6 months 19,088 10,072Past due 6 to 12 months 28,404 2,337Past due over 1 year 1,766 1,646203,741 73,866The carrying amount of trade receivables individually determined to be impaired and the movement in the related allowance forimpairment are as follows:<strong>Group</strong>2012 2011US$’000 US$’000Gross amount 14,491 21,237Less: Allowance for impairment (14,491) (21,237)- -Beginning of financial year 21,237 16,391Currency translation differences (288) (240)Allowance (written back)/made (1,806) 7,507Allowance utilised (4,652) (2,421)End of financial year 14,491 21,237The impaired trade receivables arise mainly from sales to customers which suffered financial difficulties.100
ANNUAL REPORT 2012NOTES TOTHE <strong>FINANCIAL</strong> <strong>STATEMENTS</strong>For the financial year ended 31 December 201232. <strong>FINANCIAL</strong> RISK MANAGEMENT (CONTINUED)(c) Liquidity riskLiquidity risk is the risk that the <strong>Group</strong> will encounter difficulty in meeting obligations due to shortage of funds. The <strong>Group</strong> maintainssufficient liquidity by closely monitoring its cash flows. The <strong>Group</strong> adopts prudent liquidity risk management policies in maintainingflexibility in funding by keeping credit facilities available with different financial institutions.The table below analyses the maturity profile of the <strong>Group</strong>’s and the Company’s financial liabilities (including derivative financialliabilities) based on contractual undiscounted cash flows. Balances due within 12 months approximate their carrying balances as theimpact of discounting is not significant.Less than 1yearBetween1and 2 yearsBetween 2and 5 years Over 5 years TotalUS$’000 US$’000 US$’000 US$’000 US$’000<strong>Group</strong>At 31 December 2012Trade and other payables (289,581) - - - (289,581)Borrowings (287,278) (72,336) (26,787) (5,061) (391,462)(576,859) (72,336) (26,787) (5,061) (681,043)Gross-settled currency forward contracts- Receipts 511,410 - - - 511,410- Payments (518,578) - - - (518,578)(7,168) - - - (7,168)Gross-settled futures contracts and forward sales andpurchase contracts- Receipts 1,620,959 13,176 - - 1,634,135- Payments (1,343,292) - - - (1,343,292)277,667 13,176 - - 290,843At 31 December 2011Trade and other payables (261,816) - - - (261,816)Borrowings (342,411) (46,053) (3,057) - (391,521)(604,227) (46,053) (3,057) - (653,337)Gross-settled currency forward contracts- Receipts 711,616 - - - 711,616- Payments (715,458) - - - (715,458)(3,842) - - - (3,842)Gross-settled futures contracts and forward sales andpurchase contracts- Receipts 1,189,202 - - - 1,189,202- Payments (1,005,497) (12,927) - - (1,018,424)183,705 (12,927) - - 170,778101
MEWAH INTERNATIONAL INC.NOTES TOTHE <strong>FINANCIAL</strong> <strong>STATEMENTS</strong>For the financial year ended 31 December 201232. <strong>FINANCIAL</strong> RISK MANAGEMENT (CONTINUED)(c) Liquidity risk (continued)CompanyAt 31 December 2012Less than 1 yearUS$’000Other payables 250Gross-settled currency forward contracts- Receipts 51- Payments (49)At 31 December 2011Other payables (203)Gross-settled currency forward contracts- Receipts 1,959- Payments (1,929)The table below analyses the maturity profile of the Company’s contingent liabilities and commitments. The maximum amount of thefinancial guarantee contracts are allocated to the earliest period in which the guarantee could be called.230CompanyAt 31 December 2012Less than 1 yearUS$’000Financial guarantee contracts 376,106At 31 December 2011Financial guarantee contracts 292,420(d) Capital riskThe <strong>Group</strong>’s objectives when managing capital are to safeguard the <strong>Group</strong>’s ability to continue as a going concern and to maintain anoptimal capital structure so as to maximise shareholder value. In order to maintain or achieve an optimal capital structure over businesscycles, the <strong>Group</strong> may adjust the amount of dividend payment, obtain new borrowings or sell assets to reduce borrowings.102
ANNUAL REPORT 2012NOTES TOTHE <strong>FINANCIAL</strong> <strong>STATEMENTS</strong>For the financial year ended 31 December 201232. <strong>FINANCIAL</strong> RISK MANAGEMENT (CONTINUED)(d) Capital risk (continued)Management manages capital based on tangible net worth of the <strong>Group</strong> and a number of key ratios including gross debt-equity ratioand net debt-equity ratio. The <strong>Group</strong> is required by the banks to maintain a certain amount of minimum tangible net worth and grossdebt-equity ratio. The gross debt-equity ratio is defined as total interest bearing debts (“gross debt”) to total equity. Net debt-equityratio is defined as total interest bearing debts less cash and cash equivalents (“net debt”) to total equity.No changes were made in the objectives, policies or processes during the financial years ended 31 December 2012 and 31 December2011.<strong>Group</strong>2012 2011US$’000US$’000Tangible net worth 559,947 534,601Debt-equity ratioGross debt 383,672 386,130Less: Cash and cash equivalents (48,747) (136,799)Net debt 334,925 249,331Total equity 559,947 537,790Gross debt-equity ratio 0.69 0.72Net debt-equity ratio 0.60 0.46The <strong>Group</strong> and the Company were in compliance with all externally imposed capital requirements for the financial years ended31 December 2012 and 2011.(e) Fair value measurementsThe following table assets and liabilities measured at fair value and classified by level of the following fair value measurement hierarchy:(i) quoted prices (unadjusted) in active markets for identical assets or liabilities (Level 1);(ii) inputs other than quoted prices included within Level 1 that are observable for the asset or liability, either directly (i.e. as prices) orindirectly (i.e. derived from prices) (Level 2); and(iii) inputs for the asset or liability that are not based on observable market data (unobservable inputs) (Level 3).103
MEWAH INTERNATIONAL INC.NOTES TOTHE <strong>FINANCIAL</strong> <strong>STATEMENTS</strong>For the financial year ended 31 December 201232. <strong>FINANCIAL</strong> RISK MANAGEMENT (CONTINUED)(e) Fair value measurements (continued)Level 1 Level 2 Level 3 TotalUS$’000 US$’000 US$’000 US$’000<strong>Group</strong>2012Financial AssetsDerivative financial instruments (Note 16)- Currency forward contracts - 6,968 - 6,968- Commodities futures contracts 9,532 - - 9,532- Commodities forward contracts - 85,531 - 85,531As at 31 December 2012 9,532 92,499 - 102,031Financial LiabilitiesDerivative financial instruments (Note 16)- Currency forward contracts - 2,647 - 2,647- Commodities futures contracts 13,050 - - 13,050- Commodities forward contracts - 40,402 - 40,402As at 31 December 2012 13,050 43,049 - 56,0992011Financial AssetsDerivative financial instruments (Note 16)- Currency forward contracts - 2,582 - 2,582- Commodities futures contracts 6,544 - - 6,544- Commodities forward contracts - 29,806 - 29,806As at 31 December 2011 6,544 32,388 - 38,932Financial LiabilitiesDerivative financial instruments (Note 16)- Currency forward contracts - 8,700 - 8,700- Commodities futures contracts 9,730 - - 9,730- Commodities forward contracts - 23,887 - 23,887- Put option - - 1,260 1,260As at 31 December 2011 9,730 32,587 1,260 43,577104
ANNUAL REPORT 2012NOTES TOTHE <strong>FINANCIAL</strong> <strong>STATEMENTS</strong>For the financial year ended 31 December 201232. <strong>FINANCIAL</strong> RISK MANAGEMENT (CONTINUED)(e) Fair value measurements (continued)Company2012Financial LiabilitiesDerivative financial instruments (Note 16)Level 1 Level 2 TotalUS$’000 US$’000 US$’000- Currency forward contracts - 2 22011Financial LiabilitiesDerivative financial instruments (Note 16)- Currency forward contracts - 30 30The fair value of financial instruments traded in active markets (such as exchange-traded and over-the-counter securities and derivatives)is based on quoted market prices at the statement of financial position date. The quoted market price used for financial assets heldby the <strong>Group</strong> is the current bid price; the appropriate quoted market price for financial liabilities is the current asking price. Theseinstruments are included in Level 1.The fair value of financial instruments that are not traded in an active market (such as commodities forward contracts) is determinedby making references to the prices listed on the Malaysian Palm Oil Board, other similar products and other commodity exchanges,and makes assumptions that are based on market conditions existing at each statement of financial position date. Where appropriate,quoted market prices or dealer quotes are used. The fair values of currency forward contracts are determined using quoted forwardexchange rates at the statement of financial position date. These instruments are included in Level 2.The fair value of the financial liability recognised in respect of the put option granted to the non-controlling interests is the present valueof the redemption amount to be determined in accordance with the provision of the shareholders’ agreement between the <strong>Group</strong> andthe non-controlling interests. The redemption amount is dependent on the future financial performance of the subsidiaries. The fair valueis determined based on the management’s best estimate of the future financial performance of the subsidiary. This financial instrumentis included in Level 3.The carrying value less impairment provision of trade receivables and payables approximates their fair value. The fair value of financialliabilities for disclosure purposes is estimated based on quoted market prices or dealer quotes for similar instruments by discounting thefuture contractual cash flows at the current market interest rate that is available to the <strong>Group</strong> for similar financial instruments. The fairvalue of current borrowings approximates their carrying amount.105
MEWAH INTERNATIONAL INC.NOTES TOTHE <strong>FINANCIAL</strong> <strong>STATEMENTS</strong>For the financial year ended 31 December 201232. <strong>FINANCIAL</strong> RISK MANAGEMENT (CONTINUED)(f) Financial instruments by categoryThe carrying amount of the different categories of financial instruments is as disclosed on the face of the statement of financial positionand in Note 16 to the financial statements, except for the following:Loans and receivables<strong>Group</strong>Company2012 2011 2012 2011US$’000 US$’000 US$’000 US$’000Trade receivables 443,963 410,963 - -Other receivables 42,044 20,760 201,750 154,433Cash and cash equivalents 48,747 136,799 381 41,082534,754 568,522 202,131 195,515Financial liabilities at amortised cost<strong>Group</strong>Company2012 2011 2012 2011US$’000 US$’000 US$’000 US$’000Trade payables 243,503 210,463 - -Other payables 46,078 51,353 250 203Borrowings 383,672 386,130 - -673,253 647,946 250 203106
ANNUAL REPORT 2012NOTES TOTHE <strong>FINANCIAL</strong> <strong>STATEMENTS</strong>For the financial year ended 31 December 201233. RELATED PARTY TRANSACTIONSIn addition to the information disclosed elsewhere in the financial statements, the following transactions took place between the <strong>Group</strong> andrelated parties at terms agreed between the parties:(a) Sales and purchases of goods and services and other transactionsSales to related parties<strong>Group</strong>2012 2011US$’000US$’000- Sales of finished goods 48,289 97,711Purchase from related parties- Purchases of raw materials 547 5,800Unrealised gains from derivative financial instruments 2,272 152Service rendered by related parties- Transportation and forwarding 2,400 2,811- Packing material 8,273 10,357- Insurance 23 3,246- Consultation fees 1,728 860- Travelling expenses 343 367Acquisition of subsidiaries from related parties 34 -Rental paid/payable to related parties 82 118Rental received/receivable from related parties 45 41Service agreement 24 22Related parties are companies in which the directors/shareholders of the Company have significant influence or control.Outstanding balances at 31 December 2012 and 2011 arising from the above transactions are set out in Notes 14, 15, 22 and 23respectively.(b) Key management personnel compensationKey management personnel compensation is as follows:<strong>Group</strong>2012 2011US$’000US$’000Wages, salaries and other short-term employee benefits 7,950 7,693Employer’s contribution to defined contribution plans 126 1148,076 7,807107
MEWAH INTERNATIONAL INC.NOTES TOTHE <strong>FINANCIAL</strong> <strong>STATEMENTS</strong>For the financial year ended 31 December 201234. SEGMENT INFORMATIONManagement has determined the operating segments based on the reports reviewed by the Executive Committee (“Exco”) that are used tomake strategic decisions. The Exco comprises the Chief Executive Officer, the Chief Financial Officer, and the department heads of each businesswithin each segment.The Executive Committee considers the business from two segments:(i) The bulk segment which sources, manufactures and sells edible oils and specialty fats and oils in bulk for a variety of end uses; and(ii) The consumer pack segment which manufactures and sells edible oils and bakery fats to consumers in packaged form.The <strong>Group</strong> measures and tracks the profitability in terms of operating margin and earnings before interest, tax, depreciation and amortisation(“EBITDA”).Operating margin is calculated as revenue, less cost of sales (excluding depreciation), selling and distribution expenses and foreign exchangegains/(losses). Operating margin relating to inter-segment sales are reported under the segment where the final sales to third parties are made.EBITDA is calculated as operating margin add other income, less administrative expenses (excluding depreciation and amortisation) and otheroperating expenses.108
ANNUAL REPORT 2012NOTES TOTHE <strong>FINANCIAL</strong> <strong>STATEMENTS</strong>For the financial year ended 31 December 201234. SEGMENT INFORMATION (CONTINUED)The segment information provided to the Exco for the reportable segments for the financial year ended 31 December 2012 was as follows:Bulk Consumer Pack TotalUS$’000 US$’000 US$’000<strong>Group</strong>SalesTotal segment sales 3,148,193 1,044,568 4,192,761Inter-segment sales (498,804) (73,176) (571,980)Sales to external parties 2,649,389 971,392 3,620,781Operating margin 64,479 43,753 108,232Other income 811 458 1,269Interest income 7,836 1,735 9,571Admin expenses, excluding depreciation and amortisation (34,715) (29,371) (64,086)Other gains 19 257 276EBITDA 38,430 16,832 55,262Fair value gains on put option - 1,260 1,260Impairment of goodwill - (3,161) (3,161)Segment results 38,430 14,931 53,361UnallocatedDepreciation (16,889)Amortisation (929)Finance expense (17,477)Income tax credit 5,399Share of profit of an associate 60Profit after tax 23,525Total segment assets 1,014,527 273,574 1,288,101UnallocatedCurrent income tax recoverable 16,518Investment in an associate 271Deferred income tax assets 661Total assets 1,305,551Total assets include:Additions to:- property, plant and equipment 29,114 29,418 58,532- leasehold prepayments 5,195 - 5,195Total segment liabilities (601,134) (128,218) (729,352)UnallocatedCurrent income tax liabilities (3,784)Deferred income tax liabilities (12,468)Total liabilities (745,604)109
MEWAH INTERNATIONAL INC.NOTES TOTHE <strong>FINANCIAL</strong> <strong>STATEMENTS</strong>For the financial year ended 31 December 201234. SEGMENT INFORMATION (CONTINUED)The segment information provided to the Executive Committee for the reportable segments for the financial year ended 31 December 2011 wasas follows:Bulk Consumer Pack TotalUS$’000 US$’000 US$’000<strong>Group</strong>SalesTotal segment sales 3,945,834 1,401,159 5,346,993Inter-segment sales (757,968) (121,092) (879,060)Sales to external parties 3,187,866 1,280,067 4,467,933Operating margin 76,593 42,446 119,039Other income 1,346 979 2,325Interest income 4,075 1,473 5,548Admin expenses, excluding depreciation and amortisation (30,367) (28,072) (58,439)Other operating expenses (282) (346) (628)EBITDA 51,365 16,480 67,845Impairment of goodwill - (2,717) (2,717)Segment results 51,365 13,763 65,128UnallocatedDepreciation (14,142)Amortisation (58)Finance expense (12,887)Income tax credit 1,094Share of profit of an associate 123Profit after tax 39,258Total segment assets 854,277 368,996 1,223,273UnallocatedCurrent income tax recoverable 20,613Investment in an associate 204Total assets 1,244,090Total assets include:Additions to:- property, plant and equipment 58,255 33,983 92,238- leasehold prepayments 14,063 - 14,063Total segment liabilities (549,547) (140,716) (690,263)UnallocatedCurrent income tax liabilities (1,157)Deferred income tax liabilities (14,880)Total liabilities (706,300)110
ANNUAL REPORT 2012NOTES TOTHE <strong>FINANCIAL</strong> <strong>STATEMENTS</strong>For the financial year ended 31 December 201234. SEGMENT INFORMATION (CONTINUED)Geographical informationRevenue is attributed to countries on the basis of the customers’ billing locations. The non-current assets are analysed by the geographical areain which the non-current assets are located.Revenue by geography<strong>Group</strong>2012 2011US$’000US$’000Malaysia 1,150,562 1,674,177Singapore 615,663 707,884Other countries1,766,225 2,382,061- Rest of Asia 481,520 573,030- Africa 375,208 491,994- Middle East 708,945 516,116- Europe 148,452 268,081- Pacific Oceania 70,055 71,003- America 70,376 165,648Non-current assets by geography1,854,556 2,085,8723,620,781 4,467,933Singapore 14,138 12,681Malaysia 315,470 274,294Other countries 27,629 17,709357,237 304,684Approximately 8% of the <strong>Group</strong>’s total revenue for the financial year ended 31 December 2012 was derived from a single external customer(2011: 12%). This revenue was attributable to revenue from Malaysia.111
MEWAH INTERNATIONAL INC.NOTES TOTHE <strong>FINANCIAL</strong> <strong>STATEMENTS</strong>For the financial year ended 31 December 201235. EVENTS OCCURRING AFTER STATEMENT OF <strong>FINANCIAL</strong> POSITION DATEDisposal of subsidariesIn February 2013, the directors of Molly Foods bvba have proposed to liquidate the Molly CGU (“Molly <strong>Group</strong>”) which consists of Molly Foodsbvba, Bloom Land Enterprise Limited and Bece s.à.r.l., following continued tough market conditions and deteriorating demand in the market. The<strong>Group</strong> is assessing the liquidation and the effect on the financial statements.Incorporation of a subsidiariesOn 23 January 2013, the Company’s wholly-owned subsidiary, Ngo Chew Hong Corporation Pte Ltd, through its wholly-owned subsidiary, MoiFoods (Belgium) N.V, incorporated MOI Senegal SURL, a company registerd in Dakar, Senegal, with registered share capital of CFA 1,000,000(approximately US$2,000).On 13 February 2013, the Company’s wholly-owned subsidiaries, Hua Guan Oleo (S) Pte Ltd and Hua Guan Inc. acquired 90% and 10% equityinterest respectively in MOI Commodities India Private Ltd, a company registered in Delhi, India, for a total cash consideration of Rp.100,000(approximately US$2,000).36. NEW OR REVISED ACCOUNTING STANDARDS AND INTERPRETATIONSBelow are the mandatory standards, amendments and interpretations to existing standards that have been published, and are relevant for the<strong>Group</strong>’s accounting periods beginning on or after 1 January 2013 or later periods and which the <strong>Group</strong> has not early adopted: FRS 110 Consolidated Financial Statements (effective for annual periods beginning on or after 1 January 2014)FRS 110 replaces all of the guidance on control and consolidation in IAS 27 “Consolidated and Separate Financial Statements” and SIC 12“Consolidation - Special Purpose Entities”. The same criteria are now applied to all entities to determine control. Additional guidance is alsoprovided to assist in the determination of control where this is difficult to assess. The <strong>Group</strong> has yet to assess the full impact of FRS 110 andintends to apply the standard from 1 January 2014. FRS 112 Disclosure of Interests in Other Entities (effective for annual periods beginning on or after 1 January 2014)FRS 112 requires disclosure of information that helps financial statement readers to evaluate the nature, risks and financial effects associatedwith the entity’s interests in (1) subsidiaries, (2) associates, (3) joint arrangements and (4) unconsolidated structured entities. The <strong>Group</strong> hasyet to assess the full impact of FRS 112 and intends to adopt the standard from 1 January 2014. FRS 113 Fair Value Measurement (effective for annual periods beginning on or after 1 January 2013)FRS 113 provides consistent guidance across IFRSs on how fair value should be determined and which disclosures should be made in thefinancial statements. The <strong>Group</strong> has yet to assess the full impact of FRS 113 and intends to adopt the standard from 1 January 2013.The management anticipates that the adoption of the above FRSs, INT FRSs and amendments to FRS in the future periods will not have a materialimpact on the financial statements of the <strong>Group</strong> and of the Company in the period of their initial adoption.37. AUTHORISATION OF CONSOLIDATED <strong>FINANCIAL</strong> <strong>STATEMENTS</strong>These consolidated financial statements were authorised for issue in accordance with a resolution of the Board of Directors of <strong>Mewah</strong> InternationalInc. on 8 March 2013.112
ANNUAL REPORT 2012NOTES TOTHE <strong>FINANCIAL</strong> <strong>STATEMENTS</strong>For the financial year ended 31 December 201238. LISTING OF COMPANIES IN THE GROUPName of companiesCountry ofincorporationPrincipal activitiesPrincipal countryof operationEquity holding2012 2011% %Directly held by the CompanyOne Marthoma (CI) Inc. (l) Cayman Islands Investment holding Cayman Islands 100 100Subsidiaries of One Marthorma (CI) Inc.<strong>Mewah</strong> Oleo Malaysia Sdn Bhd (b) Malaysia Investment holding Malaysia 100 100Padat Gaya Sdn Bhd (c) Malaysia Investment holding Malaysia 100 100MOI International (Australia) Pty Ltd (e) Australia Trading Australia 83.4 83.4Agri Kurnia Sdn. Bhd. (b) Malaysia Investment holding Malaysia 100 100Kayumanis Warisan Sdn Bhd (b) (n) Malaysia Investment holding Malaysia 100 -Subsidiaries of <strong>Mewah</strong> Oleo Malaysia Sdn Bhd<strong>Mewah</strong>-Oils Sdn Bhd (b) Malaysia Manufacturing andselling of palm oilproductsNgo Chew Hong Oils & Fats (M) Sdn Bhd (b) Malaysia Refining and sellingof palm oil productsMoi Foods Malaysia Sdn Bhd (b) Malaysia Manufacturingand selling ofdownstream palmoil productsContainer Fabricator (M) Sdn Bhd (b) Malaysia Manufacturing ofplastic containers<strong>Mewah</strong>oleo Marketing Sdn Bhd (b) Malaysia Selling of palm oiland palm oil relatedproductsMalaysia 100 100Malaysia 100 100Malaysia 100 100Malaysia 100 100Malaysia 100 100Batam Heights Sdn Bhd (b) Malaysia Dormant Malaysia 100 100G & U Districenters (M) Sdn Bhd (b) Malaysia Dormant Malaysia 100 100Bremfield Sdn Bhd (b) Malaysia Dormant Malaysia 100 100113
MEWAH INTERNATIONAL INC.NOTES TOTHE <strong>FINANCIAL</strong> <strong>STATEMENTS</strong>For the financial year ended 31 December 201238. LISTING OF COMPANIES IN THE GROUP (CONTINUED)Name of companiesCountry ofincorporationPrincipal activitiesPrincipal countryof operationEquity holding2012 2011% %Associated company held by <strong>Mewah</strong> OleoMalaysia Sdn BhdPrelude Gateway Sdn Bhd (b) Malaysia Freight forwarding,transportation,warehousing andlogistical servicesDirectly held by the CompanyNgo Chew Hong Corporation Pte Ltd (a) Singapore InvestmentholdingMalaysia 49 49Singapore 100 100Subsidiaries of Ngo Chew HongCorporation Pte Ltd<strong>Mewah</strong> Oils & Fats Pte Ltd (a) Singapore Trading of edibleoils and providingcommoditybrokerage serviceNgo Chew Hong Edible Oil Pte Ltd (a) Singapore Packagingand trading ofedible oilMOI International (Singapore) Pte Ltd (a) Singapore Trading ofedible oil products<strong>Mewah</strong> Brands (S) Pte Ltd (a) Singapore To own brandsused by relatedparties and groupcorporationsSingapore 100 100Singapore 100 100Singapore 100 100Singapore 100 100Moi Foods Romania S.R.L. (l) Romania Trading Romania 100 100Ngo Chew Hong Industries Pte Ltd (a) Singapore Investment holding Singapore 100 100Ngo Chew Hong Investment Pte Ltd (a) Singapore Dormant Singapore 100 100<strong>Mewah</strong> Commodities Pte Ltd (a) Singapore Investment holding Singapore 100 100114
ANNUAL REPORT 2012NOTES TOTHE <strong>FINANCIAL</strong> <strong>STATEMENTS</strong>For the financial year ended 31 December 201238. LISTING OF COMPANIES IN THE GROUP (CONTINUED)Name of companiesSubsidiaries of Ngo Chew HongCorporation Pte Ltd (continued)Krispi Oil and Food Products Marketing, Import,Export Trading Company (Turkey) (l)(50% equity held by <strong>Mewah</strong> CommoditiesPte Ltd and 50% equity held by Ngo ChewHong Corporation Pte Ltd)Country ofincorporationPrincipal activitiesPrincipal countryof operationEquity holding2012 2011% %Turkey Trading Turkey 100 100Subsidiaries of <strong>Mewah</strong> Commodities Pte LtdKrispi Oil Russia LLC (l) Russia Trading Russia 100 100Krispi Oils Poland Sp. z o.o (l)(90% equity held by <strong>Mewah</strong> CommoditiesPte Ltd and 10% equity held by Ngo ChewHong Corporation Pte Ltd)Moi Foods Belgium N.V. (l)(90% equity held by <strong>Mewah</strong> CommoditiesPte Ltd and 10% equity held by Ngo ChewHong Corporation Pte Ltd)Poland Trading Poland 100 100Belgium Investment holding Belgium 100 100Subsidiaries of Moi Foods Belgium N.V.Molly Foods bvba (l) Belgium Trading andinvestment holdingBelgium 70 70(l) (o)Ngo Chew Hong Edible Oil Limited(90% equity held by Moi Foods BelgiumN.V. and 10% equity held by <strong>Mewah</strong>Commodities Pte Ltd)(l) (n)MOI Foods Nigeria Limited(90% equity held by Moi Foods BelgiumN.V. and 10% equity held by <strong>Mewah</strong>Commodities Pte Ltd)Nigeria Dormant Nigeria 100 -Nigeria Dormant Nigeria 100 -Subsidiary of Molly Foods bvbaBloom Land Enterprises Limited (f) Hong Kong Providingcommoditybrokerage serviceHong Kong 70 70115
MEWAH INTERNATIONAL INC.NOTES TOTHE <strong>FINANCIAL</strong> <strong>STATEMENTS</strong>For the financial year ended 31 December 201238. LISTING OF COMPANIES IN THE GROUP (CONTINUED)Name of companiesCountry ofincorporationPrincipal activitiesPrincipal countryof operationEquity holding2012 2011% %Subsidiary of Bloom Land Enterprises LimitedBeCe S.à.r.l. (d) Togo Trading Togo 70 70Subsidiaries of Padat Gaya Sdn Bhd<strong>Mewah</strong>oleo Industries Sdn Bhd (c) Malaysia Refining and sellingof palm oil products<strong>Mewah</strong> Datu Sdn Bhd (c) Malaysia Refining and sellingof palm oil productsMalaysia 100 100Malaysia 100 100Subsidiaries of Agri Kurnia Sdn Bhd<strong>Mewah</strong> Dairies Sdn Bhd (b)(formerly known as Nilam Tekad Sdn Bhd)Malaysia Dormant Malaysia 100 100G & U Logistic (M) Sdn Bhd (k) (o) Malaysia Freight forwarding,transportation,warehousing andlogistic servicesfor chemical andchemical relatedindustriesMalaysia 100 -Subsidiary of MOI (International) AustraliaPty LtdFrycycle Pty Ltd (e) Australia Dormant Australia 83.4 83.4Directly held by the CompanyPandan Loop International Inc. (l) Cayman Islands Investment holding Cayman Islands 100 100Subsidiaries of Pandan Loop International Inc.Ngo Chew Hong Oleo (S) Pte Ltd (a) Singapore Dormant Singapore 100 100PT Seengatta Palm (m) Indonesia Dormant Indonesia 95 95116
ANNUAL REPORT 2012NOTES TOTHE <strong>FINANCIAL</strong> <strong>STATEMENTS</strong>For the financial year ended 31 December 201238. LISTING OF COMPANIES IN THE GROUP (CONTINUED)Name of companiesCountry ofincorporationPrincipal activitiesPrincipal countryof operationEquity holding2012 2011% %Subsidiaries of Ngo Chew Hong Oleo (S) Pte LtdMOI Foods (Shanghai) Co. Ltd. (g)People’s Republicof ChinaTradingPeople’s Republicof China100 100<strong>Mewah</strong> Oils (ZJG) Co. Ltd. (h)People’s Republicof ChinaTradingPeople’s Republicof China100 100<strong>Mewah</strong> Oils (Tianjin) Co. Ltd. (i)People’s Republicof ChinaTradingPeople’s Republicof China100 100Directly held by the CompanyCavenagh House International Inc. (l) Cayman Islands Investment holding Singapore 100 100Subsidiaries of Cavenagh HouseInternational Inc.Cavenagh Oleo (S) Pte Ltd (a) Singapore Investment holding Singapore 100 100Subsidiaries of Cavenagh Oleo (S) Pte LtdPT Agro Murni (m) Indonesia Dormant Indonesia 95 95PT Timuran Agro (m) Indonesia Dormant Indonesia 95 95PT Agro Indah (m)(95% equity held by Cavenagh Oleo (S) PteLtd and 5% equity held by Cavenagh HouseInternational Inc.)Indonesia Dormant Indonesia 100 100PT Utara Agro (m) Indonesia Dormant Indonesia 95 95PT Agro Perkasa (m) Indonesia Dormant Indonesia 95 95PT Agro Harapan (m) Indonesia Dormant Indonesia 95 95PT Mas Sejahtera (m)(95% equity held by Cavenagh Oleo (S) PteLtd and 5% equity held by Cavenagh HouseInternational Inc.)Indonesia Dormant Indonesia 100 95PT Makmur Bestari (m) Indonesia Dormant Indonesia 95 95117
MEWAH INTERNATIONAL INC.NOTES TOTHE <strong>FINANCIAL</strong> <strong>STATEMENTS</strong>For the financial year ended 31 December 201238. LISTING OF COMPANIES IN THE GROUP (CONTINUED)Name of companiesCountry ofincorporationPrincipal activitiesPrincipal countryof operationEquity holding2012 2011% %Subsidiaries of Cavenagh Oleo (S) Pte Ltd(continued)PT Mas Bestari (m)(95% equity held by Cavenagh Oleo (S) PteLtd and 5% equity held by Cavenagh HouseInternational Inc.)Indonesia Dormant Indonesia 100 95PT Fajar Bestari (m) Indonesia Dormant Indonesia 95 95PT Sawit Bestari (m) Indonesia Dormant Indonesia 95 95PT Mas <strong>Mewah</strong> (m) Indonesia Dormant Indonesia 95 95PT Harapan Bestari (m) Indonesia Dormant Indonesia 95 95PT Agro Baiduri (m) Indonesia Dormant Indonesia 95 95PT Usaha Bestari (m) Indonesia Dormant Indonesia 95 95PT Usaha Lestari (m) Indonesia Dormant Indonesia 95 95PT Nilam Surya Harapan (m) Indonesia Dormant Indonesia 95 95PT Usaha Surya (m)(95% equity held by Cavenagh Oleo (S) PteLtd and 5% equity held by Cavenagh HouseInternational Inc.)Indonesia Dormant Indonesia 100 95PT Nilam Surya Perkasa (m) Indonesia Dormant Indonesia 95 95PT Nilam Surya Jaya (m) Indonesia Dormant Indonesia 95 95(m) (n)PT Nilam Harapan Gemilang(90% equity held by Cavenagh Oleo (S)Pte Ltd and 10% equity held by CavenaghHouse International Inc.)(m) (n)PT Nilam Lestari(90% equity held by Cavenagh Oleo (S)Pte Ltd and 10% equity held by CavenaghHouse International Inc.)Indonesia Dormant Indonesia 100 -Indonesia Dormant Indonesia 100 -118
ANNUAL REPORT 2012NOTES TOTHE <strong>FINANCIAL</strong> <strong>STATEMENTS</strong>For the financial year ended 31 December 201238. LISTING OF COMPANIES IN THE GROUP (CONTINUED)Name of companiesDirectly held by the CompanyCountry ofincorporationPrincipal activitiesPrincipal countryof operationEquity holding2012 2011% %Hua Guan Inc. (l)Subsidiary of Hua Guan Inc.British VirginIslandsInvestment holding Cayman Islands 100 100Hua Guan Oleo (S) Pte Ltd (a) Singapore Investment holding Singapore 100 100Subsidiaries of Hua Guan Oleo (S) Pte Ltd<strong>Mewah</strong> Oils India Pvt Ltd (j)(90% equity held by Hua Guan Oleo (S) PteLtd and 10% equity held by Hua Guan Inc.)India Trading India 100 100(l) (n)<strong>Mewah</strong> Oils FZE UnitedArabEmiratesDormantUnited ArabEmirates100 -Directly held by the CompanyMoi International Inc. (l) Mauritius Dormant Mauritius 100 100Semenyih Inc. (l) (n) Cayman Islands Investment holding Cayman Islands 100 -<strong>Mewah</strong> (HK) Limited (n) (p) Hong Kong Investment holding Hong Kong 100 -(a)Audited by PricewaterhouseCoopers LLP, Singapore(b)Audited by PricewaterhouseCoopers, Kuala Lumpur(c)Audited by PricewaterhouseCoopers, Johor Bahru(d)Not required to be audited under the laws of the country of incorporation. For the audit of consolidated financial statements of theCompany, PricewaterhouseCoopers, Ivory Coast was engaged to perform an audit of BeCe S.à.r.l for the consolidation purposes.(e)Audited by BDO Kendalls (QLD) Pty Ltd, Australia(f)Audited by Yeung, Chan & Associate CPA Limited, Hong Kong(g)Audited by Shanghai Shen Zhou Da Tong Certified Public Accountants Company Limited, People’s Republic of China(h)Audited by Suzhou Qinye Union Certified Public Accountants, People’s Republic of China(i)Audited by Tianjin Beiyang CPAs Co., Ltd., People’s Republic of China(i)Audited by Mehul D Chheda & Co, India(k)Audited by HALS & Associates, Malaysia(l)Not required to be audited under the laws of the country of incorporation(m)Exempted from filing audited accounts under the laws of the country of incorporation(n)Incorporated during the financial year 2012(o)Acquired through common control during the financial year 2012(p)In the process of appointing auditor119