Monthly NCM Report for Nov 2010 - Proshare
Monthly NCM Report for Nov 2010 - Proshare
Monthly NCM Report for Nov 2010 - Proshare

Create successful ePaper yourself
Turn your PDF publications into a flip-book with our unique Google optimized e-Paper software.
ISSN 1597 - 8842 Vol. 1 No. 52The <strong>Monthly</strong> <strong>NCM</strong> <strong>Report</strong> <strong>for</strong> <strong>Nov</strong>‘10Issued on Deceember 02, <strong>2010</strong>The <strong>Monthly</strong> <strong>NCM</strong> <strong>Report</strong> <strong>for</strong> <strong>Nov</strong> <strong>2010</strong> www.proshareng.com Page 1
ContentsISSN 1597 - 8842 Vol. 1 No. 52Executive Summary 3Introduction 6All-Share Index Movement 12Market Dynamics 13Comparison of 2009 and <strong>2010</strong> Market Per<strong>for</strong>mance 14Sectoral Index Movements 15NSE -30 Index, NSE -Food Index, NSE -Banking Index, NSE -Insurance Index & NSE -Oil IndexSectoral Analysis 19Transactions Volume and Value Trend 20Top Ten Trades in the Month 21Top Ten Traded Sectors in the Month 21Top Ten Gainers in the Month 21Top Ten Year to Date Appreciation 21Top Ten Decliners in the Month 22Top Ten Year to Date Depreciation 22New Listing/Supplementary Listing/Delisting in the Month 22Corporate Declarations in the Month 23Forecast Results in the Month 36Dividends Declared 36Outlook/ Analyst Opinion 37Time Lines (Market News/In<strong>for</strong>mation) 38The <strong>Monthly</strong> <strong>NCM</strong> <strong>Report</strong> <strong>for</strong> <strong>Nov</strong> <strong>2010</strong> www.proshareng.com Page 2
The <strong>Monthly</strong> <strong>NCM</strong> <strong>Report</strong> <strong>for</strong> <strong>Nov</strong>ember <strong>2010</strong>ISSN 1597 - 8842 Vol. 1 No. 52Executive SummaryThe trend in the Nigerian capital market during the month of <strong>Nov</strong>ember <strong>2010</strong> has beenunstable, despite an impressive start of 0.24% upswing. The market could not sustainthe promising stable sentiments recorded in the preceding month of October due to thevolatility, filled with superficial euphoria on the back of AMCON, trend distortion byuncertainty surrounding the banking non-per<strong>for</strong>ming loans valuation.The unimpressive month may also be linked to the high speculative trend that pervadedthe market in the month. This made the market to experience heavy turbulence followedby profit taking sentiments that caused more red positions, as investors decided to rakein some of the handsome profits recorded in the previous bullish month, not gettingclear signals about what lies ahead.The trends clearly revealed the speculative tendency in the first nine (9) days of themonth, i.e. between the periods of <strong>Nov</strong>ember 1 st <strong>2010</strong> to 12 th <strong>Nov</strong>ember <strong>2010</strong>. Duringthis period, equity market traded sideways in volatile sessions, as bears and bulls jostled<strong>for</strong> supremacy, in which the bulls triumphed with 3.14% upbeat, upholding theimpressive trend recorded in the preceding months. The impressive earnings reportedprior to this period could be partly attributable to this resilient positive position.Market Outlook - early stage of the monthASI at <strong>Nov</strong> 1,<strong>2010</strong> 25,102.20ASI at <strong>Nov</strong> 11,<strong>2010</strong> 25,891.13%Change 3.14%Source: <strong>Proshare</strong> Research/NSEHowever, the AMCON’s valuation announcement appears to be outside marketsentiments http://www.proshareng.com/news/12537, as this perhaps accounted <strong>for</strong> the sharpreversal that ensued. This was expressed as investors’ pre-emptive move towardsAMCON’s pricing in the weekly report of 19<strong>Nov</strong>10http://www.proshareng.com/news/singlenews.php?id=12598. Market sentiment was there<strong>for</strong>ebearish as market recorded continuous sell volume while investors remained cautious.CBN RescuedBanksBe<strong>for</strong>e Valuation Model<strong>Nov</strong> 1stPrice<strong>Nov</strong> 11Price % ChangeAfter Valuation Model<strong>Nov</strong> 12Price<strong>Nov</strong> 30thprice % ChangeAfribank 2.27 2.73 20.26% 2.86 2.5 -12.59%Finbank 0.69 0.94 36.23% 0.98 0.87 -11.22%Intercont 2.07 2.82 36.23% 2.9 2.26 -22.07%Oceanic 2.42 3.27 35.12% 3.42 2.52 -26.32%UBN 4.12 5.19 25.97% 5.44 4.59 -15.63%Bank PHB 1.47 1.94 31.97% 2.03 1.97 -2.96%Spring Bank 0.78 0.89 14.10% 0.93 1.04 11.83%Wema 1.22 1.66 36.07% 1.74 1.39 -20.11%Unity Bank 1.14 1.37 20.18% 1.43 1.25 -12.59%Source: <strong>Proshare</strong> Research/NSEThe <strong>Monthly</strong> <strong>NCM</strong> <strong>Report</strong> <strong>for</strong> <strong>Nov</strong> <strong>2010</strong> www.proshareng.com Page 3
The perceived unfavourable valuation model by rescued banks further attractedunfavourable sentiments towards market, as equity market nosedived more intonegative zone, erasing previous gains, ASI movement confirmed this trend as marketmarked 7days uninterrupted decline on <strong>Nov</strong>ember 24 th <strong>2010</strong>, losing N455.95 billion ina volatile session.Moreover, the AMCON’s valuation model has generated series of debates within theinvesting community on the premise that a discounted cash flow method is expected tobe used to determine the fair value of the loans; and the pricing date <strong>for</strong> toxic assetsshould be pre CBN’s intervention, since the intervention by CBN triggered panic sell inthe market which consequently depleted the value of these assets. Also, the option ofequity stake in those rescued banks by AMCON raised serious concern about the worth ofthose banks’ shares with heavy equity dilution. http://proshareng.com/blog/?p=476 however,AMCON would commence issuance of bonds by the December 31st <strong>2010</strong>.The pricing model has made the banking sector most volatile despite the impressiveearnings report recorded in the sector. The sector is about to activate the new bankingplat<strong>for</strong>m which took over from universal banking model as the latter ceased to exist by<strong>Nov</strong>ember 15, <strong>2010</strong> according to CBN, though, is early to gauge the impact of the newplat<strong>for</strong>m, we believe that the sector would taking readings from the financials andmarket activities as they fully and finally settled with the new plat<strong>for</strong>m.More so on new banking license, The Board of Directors of Diamond Bank Plc approvedthe Bank’s plans to divest from its non-bank subsidiaries and focus on CommercialBanking. The bank however, decided to uphold its <strong>for</strong>eign bank subsidiaries and operateas an international bank. http://proshareng.com/news/singleNews.php?id=12571On 25 th of <strong>Nov</strong>ember <strong>2010</strong>, the sector witnessed drop in selling pressure, which wasextended to the rescued banks, as the league recorded price appreciation. Consequently,equity market ended the 7days volatile sessions on a positive note as ASI advanced by0.27%. The uptrend gained more support to maintain 4days northward movement,recording 1.23% gain, while the month closed with the positive sentiments on aggregateloss of -1.34% against +5.45% gains recorded previous month. The market volatilityrecorded in the month reclined the year-to-date market per<strong>for</strong>mance from 20.17%recorded in October to 18.84%.On the market capacity building, the management of NSE in the month processed thelisting by introduction of 792.9 million shares of Paints & Coatings Manufacturers NigeriaPlc at N3.00 per share and Multi-Trex Integrated Foods Plc same price.This was perceived by interim management of NSE as a signal of renewed investors’confidence which is yet to be ascertained, as the major of newly listed stocks after 2008market crash still maintained downward trendhttp://www.proshareng.com/news/singlenews.php?id=12638 and the over-hanging N700 billioninvestments in private placements remained unexplained. We expect that investors’confidence would remain superficial as unlisted private placements by private companiesare part of derailing factors. http://www.proshareng.com/news/12483Buttressing the above stated fact, the new stock of Multi-Trex Integrated Foods Plc hashowever recorded no gain position in aggregate while Dangote Cement Plc which waslisted last month, has not traded above listing price of N135.00, the stock is -8.14%down, though, on the back of additional peculiarities http://proshareng.com/news/12614.The <strong>Monthly</strong> <strong>NCM</strong> <strong>Report</strong> <strong>for</strong> <strong>Nov</strong> <strong>2010</strong> www.proshareng.com Page 4
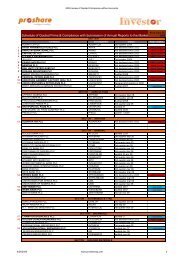
Outlook of Most Recent Newly-Listed CompaniesListed Listed PriceTrading Price at<strong>Nov</strong> 26No OfSharesCompanyDate N N In BillionDangote Cement Plc Oct 26 th ,10 135 121.15 15.49 -10%Multi-Trex Integrated Foods Plc <strong>Nov</strong> 1 st ,10 3 3 3.72 0%Paints and Coatings Manufacturers Nigeria Plc <strong>Nov</strong> 2 nd ,10 3 3.71 0.792 24%Source: <strong>Proshare</strong> Research/NSEPricePer<strong>for</strong>manceOn the note of market confidence, the inconsistency on the part of the management ofNSE could also be perceived as part of derailing factors as NSE listed some companies inQ3 <strong>2010</strong> to be delisted in the month under review (Precisely <strong>Nov</strong> 16 <strong>2010</strong>) due to failureto comply with post listing requirements http://www.proshareng.com/news/12260,which they have not without any reason or in<strong>for</strong>mation disseminated to investingcommunity.Finally, we expect sincere ef<strong>for</strong>ts by regulators to strengthen their role in the protectionof investments and bring back total sanity into the market. A number of developmentswe believed should have impacted events in the month(s) as predicted in the pastmonthly reports include, but not limited to:Impact Assessments TableDevelopments that we believed should have impact in themonths <strong>Nov</strong>ember/December as listed in our October reportResolution of pre-takeover issues and stabilisation of the NSEand exit of SEC;OutcomeNot much traction gained in thisdirectionChanges to business models of firms related to the NSE;reconstitution of the NSE council and restraint incommunications after the <strong>for</strong>ensic report submission;AMCON role to be modified and may possibly act as a keyplayer in determination of recapitalisation ef<strong>for</strong>ts, future sales;Still in the worksAMCON is considering equitystake in rescued banksCBN may dissolve board(s) of rescued banks; Not clear how this wouldmaterialise.Outcome of search <strong>for</strong> new NSE DG continues to provechallenging after only two candidates that made the cut werefound not to have fully met the criteria set out <strong>for</strong> the position.Headhunting after the contrived second advert should see theinterim administration staying longer to continue current work;A new NSE MD should be inplace by December <strong>2010</strong>.Changes to revolutionize nation’s stock market may take placesuch as the listing of ETF’s on the NSE against a poor structuralbase <strong>for</strong> high end market products;Proposal <strong>for</strong> a modern plat<strong>for</strong>m of Straight Through Processing(STP) is delayed;NSE may get approval to increase Trading Hours at a time it isequally seeking to refurbish the building and make structuralchanges – including its trading plat<strong>for</strong>m and website issues;Removal of restrictions on price movementsContinued dominance of pension managers due to the lowliquidity status of the market;Changes are yet to take placeStill on holdThe extended trading hours atNSE has been approvedNot going to happen!Will continue <strong>for</strong> months tocome.The <strong>Monthly</strong> <strong>NCM</strong> <strong>Report</strong> <strong>for</strong> <strong>Nov</strong> <strong>2010</strong> www.proshareng.com Page 5
Issues anticipated to impact the last month of the year:Ef<strong>for</strong>ts by regulators to strengthen their role in the protection of investments andbring back total sanity into the market.Continued drop in the Nigerian Inter-bank lending rates may drive investors back tothe capital market in the days ahead.Ongoing regulation of margin loans should contribute significantly to stability oftransactions at the Nigerian Stock Exchange (NSE).Disbursement of N500 billion soft loans to small and medium scale businesses acrossthe country as part of ef<strong>for</strong>ts to fight poverty and boost economic activities.The outcome of pending law suits on the bank’s recapitalisationInvestors’ seasonal selling to meet personal needs.Closing of books by some institutional investors <strong>for</strong> the <strong>2010</strong> financial year.Conversion of toxic assets of rescued banks to equity.Higher yield in the money market will reduce the flow of liquidity to the capitalmarket as this will trigger switch of investments to money market.Plans by the Nigerian Stock Exchange to increase the limit on daily share pricemovement from five per cent to 10 per cent are dropped.The increased trading hours – to 1430pm daily – is expected to suffer initially due toslack liquidity in the market but should create a push factor that nudges the markettowards a focus on market deepening issues.Thank you <strong>for</strong> reading and do take time to share with us your thoughts on the market,analyst at analyst@proshareng.com. We value your feedback and comments.The <strong>Monthly</strong> <strong>NCM</strong> <strong>Report</strong> <strong>for</strong> <strong>Nov</strong> <strong>2010</strong> www.proshareng.com Page 6
Further analysis revealed that despite the high speculative tendency and fluctuationswitnessed in the first 9 sessions in the month of <strong>Nov</strong>ember, the market outlook recordsmore positive points when compared with the trend in the first 9 sessions in the monthof October as market records 3.10% upbeat. This further buttressed our position onsustained growth within this period.More so, as a result of pre-emptive measures towards <strong>Nov</strong>ember 15 th <strong>2010</strong> as set byAMCON to benchmark valuation and pricing of toxic assets on market price <strong>for</strong> that day,market went unstable with continued sell off mandates which lasted <strong>for</strong> sevenuninterrupted bearish sessions as market records N455.95 billion loss with ASI downby -5.52%, erasing 3.14% upbeat recorded in the early 9days of the month. Thisoutlook buttressed our unstable position of the market in the month.Also, the option of taking equity stake in rescued banks as expressed by AMCON coupledwith unfavourable pricing model as perceived by the banks also contributed to the hugeloss, while short term traders seek opportunity to take profits on the appreciatedportfolios as appetite <strong>for</strong> risk dropped abruptly.The volatility and huge sell-offs was more witnessed among banking stocks particularlythe rescued banks. This confirmed our position on profit taking as those stocks havealready recorded consistent and tremendous price appreciation in the month, includingthose that have witnessed significant year-to-date (YTD) growth-a situation that offersinvestors an opportunity to reap some capital appreciation.Market Reaction Towards AMCON's Pricing ModelDateMarket CAP=N= 'trillionPer<strong>for</strong>mance=N= 'billionASI Status<strong>Nov</strong> 12 <strong>2010</strong> 8.1 -167.1 -2.02<strong>Nov</strong> 15 <strong>2010</strong> 8.07 -21.23 -0.26<strong>Nov</strong> 18 <strong>2010</strong> 8.04 -37.24 -0.46<strong>Nov</strong> 19 <strong>2010</strong> 7.97 -71.59 -0.89<strong>Nov</strong> 22 <strong>2010</strong> 7.94 -25.25 -0.32<strong>Nov</strong> 23 <strong>2010</strong> 7.86 -81.07 -1.02<strong>Nov</strong> 24 <strong>2010</strong> 7.81 -52.44 -0.67Market CAP Per<strong>for</strong>mance 455.95 billion Loss in 7daysASI Position5.52% down in 7daysSource: <strong>Proshare</strong> Research/NSEThe above tabulated in<strong>for</strong>mation buttressed our statement that AMCON’s pricing modelamplified the instability recorded in the month. This has impacted market sentimentsheavily as investors embarked on cautious bargaining following the volatile sessions.The Market – Game OnThe market this month recorded a total volume of 7.43 billion units valued at N60.33billion (US$399.60 million) exchanged in 110,624 deals compared with 9.33bn unitsvalued at N56.11bn (US$350.73bn) exchanged in 120,282 deals in <strong>Nov</strong>ember 2009.Comparing, the volume and value traded in the month reveal a -20.37% drop below thevolume and 7.52% above value recorded in the previous year’s comparable periodrespectively.The <strong>Monthly</strong> <strong>NCM</strong> <strong>Report</strong> <strong>for</strong> <strong>Nov</strong> <strong>2010</strong> www.proshareng.com Page 8
During the month, the NSE All-Share index recorded a negative trend of -1.34%, asignificant negative growth from the +5.45% upbeat recorded in October <strong>2010</strong>.However, the trend is relatively better when compared with the -3.02%recorded in the preceding year’s <strong>Nov</strong>ember closed at 21,010.29.Market capitalisation this month decreased by N104.51 billion (US$708.33 billion) asagainst appreciation by N2.16 trillion (US$14.66bn) recorded in October <strong>2010</strong>.Market capitalisation shed higher figures of N113.03 billion (US$766.09m) in theprevious year’s comparable period (<strong>Nov</strong>ember 2009).The <strong>Monthly</strong> <strong>NCM</strong> <strong>Report</strong> <strong>for</strong> <strong>Nov</strong> <strong>2010</strong> www.proshareng.com Page 9
The Market – Game Changers:The commencement of absorbing the toxic assets in the financial sector by AMCON couldserve as salient game changer in absence of option of equity stake in those rescuedbanks.Other factors that should act as game changers to sustain the upward trend in themarket include - the low valuations of equities, anticipated merger and acquisition in thebanking sector, the recapitalisation opportunities <strong>for</strong> fresh capital, the listing of new andviable companies, high expectation of impressive Q4 earnings report, concerted ef<strong>for</strong>tstowards establishing corporate governance in the NSE and SEC, and continuation of theabdication of the regulatory approach that promotes sensationalism rather than wellthought out communications backed by action and benchmarks.The market recorded sustained growth inherited from preceding month in the early stageof the month with slight volatility emerged from speculative and profit taking tendency.The pricing and valuation model of Nigerian ‘Bad Bank’ rocked market sentimentsnegatively which amplified the selling tendency in the mid month while investorsremained cautiously active in the last 4days of the month. The contributory factors <strong>for</strong>per<strong>for</strong>mance in the month of <strong>Nov</strong>ember <strong>2010</strong> can be located in the following indicesas outlined below:Negative Factors in the marketAbsence of or very low level of lending to the private sector;Uncertainty surrounding AMCON’s pricing and valuation model;Significant activities from short term traders;Close of book by institutional investors;Risk aversion tendency, causing the low bargain position in the market;Sustained shift towards investment in the money market due to attractive rates;Investor’s confidence remained fragile as investors rushed <strong>for</strong> early profit;Concerns related to risk management and corporate governance practices;Hike in the CBN's benchmark interest rate;Persistent low investors’ confidence, liquidity squeeze and the current politics -induced uncertainty in the economy, prospect of capital flight to money marketinstruments;Influx of Fed Govt and state bonds with other fixed income instrument in market;Reduction in volume of transactions in NSE; andAbsence of Margin loans from banks.Positive Factors in the marketTimely communications of recapitalisation ef<strong>for</strong>ts;Low valuation position of stocks;Extension of trading hours;Buying of toxic assets will commence soon;Re-entry of Pension funds in equities;The new management and council members of the NSE;Plans by Federal Government to disburse N500 billion in soft loans to small andmedium scale businesses across the country;Plans by the Nigerian Stock Exchange to increase the limit on daily share pricemovement from five per cent to 10 per cent;En<strong>for</strong>cement of the International Financial <strong>Report</strong>ing Standard (IFRS) in the capitalmarketexpectation a substantive Chief Executive Officer (CEO) <strong>for</strong> the Exchange;The <strong>Monthly</strong> <strong>NCM</strong> <strong>Report</strong> <strong>for</strong> <strong>Nov</strong> <strong>2010</strong> www.proshareng.com Page 10
Disclosure of the merger and acquisition bids by the CBN-managed banks - reflectingtransparency;Corporate declarations announced by some companies – good with relative positives;The recent CBN stand in resorting to dialogue in dealing with recapitalisation of therescued banks also raised the morale of the investing public in the sector;Guaranteeing the domestic inter-bank market by the CBN;The Federal Government giving more funds to agriculture to boost food production;The World Federation of Exchanges (WFE) will soon grant the Nigerian StockExchange (NSE) its full membership; andMarket Concerns: The tight liquidity situation remained a pressing factor, as the levelof market confidence remains fragile, though more optimistic than ever - as volumes areyet to return to levels that should indicate a resurgence of interest and re-entry of theretail end of the market. Using the Q1 <strong>2010</strong> as a base, there is palpable reasons toexpress cautious optimism about the changes occurring; more so with uncertaintiesemerging about the intent, motives and deliverables of the regulators.http://www.ubagroup.com/The <strong>Monthly</strong> <strong>NCM</strong> <strong>Report</strong> <strong>for</strong> <strong>Nov</strong> <strong>2010</strong> www.proshareng.com Page 11
The NSE All-Share Index MovementThe Nigerian Capital Market started the month on positive to sustain the significantgrowth inherited from the preceding month, erasing the negative close <strong>for</strong> the previousmonth which indicates profit taking tendency <strong>for</strong> the month.Trends in the month revealed that bulls dictated the pace in the first nine trading daysinto the month (between 1 st and 11 th <strong>Nov</strong>ember, <strong>2010</strong>), with aggregate upbeat of 3.14%as against 3.10% in October <strong>2010</strong>.The equity market experienced bearish sentiments with 7days uninterrupted downwardtrend with aggregate loss of -5.52%, erasing the upbeat of 3.10% recorded in the early9days, this further amounts to N455.95 billion loss against N255.02 billion gain. Thebearish outlook is due to the uncertainty surrounding the AMCON’s pricing and valuationmodel as perceived by the rescued banks.The trend was reversed as speculative tendency took advantage attractive low equityprice as the month closed with four days rally on moderate buying across the sectors butlargely in Mortgage, Maritime, Foreign Listings, Industrial & Domestic, Food & Beveragesand banking sectors.The month recorded negative outlook with aggregate position of -1.34% to close at24,764.65 compared with -3.02% depreciations recorded in the preceding yearcomparable period to close at 21,010.29. The depreciation in the month was far belowthe +12.97% and +8.43% recorded in the month of March and January <strong>2010</strong>.Meanwhile, at the end of the last trading day of the month under review, All-Share Indexclosed above the figure recorded at the close of 30 <strong>Nov</strong>ember 2009 by +17.87%.At the end of the last trading day of the month, All-Share Index closed above the figurerecorded at the close of 4 th January <strong>2010</strong> by 18.84%.Market pattern basically reveals that market is technically weak and bearish as could beseen from the NSE ASI moving averages trend with index of 24,764.65 as at <strong>Nov</strong>emberThe <strong>Monthly</strong> <strong>NCM</strong> <strong>Report</strong> <strong>for</strong> <strong>Nov</strong> <strong>2010</strong> www.proshareng.com Page 12
30 th , <strong>2010</strong> trading below its 20 days and 200days moving averages of 24,946.50 and25,058.54 respectively but traded above 50 days moving averages of 24,401.62.Source: NSE, <strong>Proshare</strong> Research<strong>Nov</strong>ember <strong>2010</strong> Market DynamicsThe market dynamics as graphically illustrated below showed the appreciation anddepreciations on the daily basis. The profit taking tendency, panic selling due toperceived uncertainty about AMCON’s pricing and valuation model, speculative tendencydue to low valuations of equities, anticipated merger and acquisition in the bankingsector, the recapitalisation process, concerted ef<strong>for</strong>ts towards establishing corporategovernance in NSE and SEC, could have responsible <strong>for</strong> the trend recorded.Source: NSE, <strong>Proshare</strong> ResearchMARKET DYNAMICS IN THE PRECEDING YEAR COMPARABLE PERIOD (NOV 2009)Source: NSE, <strong>Proshare</strong> ResearchThe <strong>Monthly</strong> <strong>NCM</strong> <strong>Report</strong> <strong>for</strong> <strong>Nov</strong> <strong>2010</strong> www.proshareng.com Page 13
Comparison of 2009 and <strong>2010</strong> Market Per<strong>for</strong>manceThe market per<strong>for</strong>mance in October <strong>2010</strong>, when compared with the 2009 comparableperiod; showed an upward trend. In the period under review, ASI recorded -1.34%upbeat compared with -3.02% decline recorded in 2009 October. The outlook in thecurrent period suggests impressive monthly per<strong>for</strong>mance and significant progress onmarket recovery when compared with comparable period of preceding year trend. Themarket closed approximately in the range of 24,000.Source: NSE, <strong>Proshare</strong> ResearchDatesNSE ASIMarketCapitalisation(trillion)MarketCapitalisation ($billions)Jan-02-09 31,357.24 6.93 43.31<strong>Nov</strong>-02-09 21,665.46 5.11 31.94<strong>Nov</strong>-30-09 21,010.29 4.99 31.19Yearly Return -33.00% -27.99% -27.99%<strong>Monthly</strong> Return -3.02% -2.35% -2.35%Jan-04-10 20,838.90 4.99 33.27<strong>Nov</strong>-01-10 25,102.20 8.01 53.05<strong>Nov</strong>-30-10 24,764.65 7.91 52.38Yearly Return 18.84% 58.52% 57.47%<strong>Monthly</strong> Return -1.34% -1.25% -1.25%Source: <strong>Proshare</strong> Research/NSEFrom the table above, the year to date per<strong>for</strong>mance as at 30 th <strong>Nov</strong>ember, <strong>2010</strong> closingat +18.84%, during the previous year comparable period as at 30 th <strong>Nov</strong>ember, 2009with -33.00% deprecation indicating a significant improvement over the trend recordedlast year.Sectoral Index MovementsThe <strong>Monthly</strong> <strong>NCM</strong> <strong>Report</strong> <strong>for</strong> <strong>Nov</strong> <strong>2010</strong> www.proshareng.com Page 14
NSE 30 NSE Food NSE Banking NSE Insurance NSE Oil1-<strong>Nov</strong>-10 1,051.77 806.83 372.94 162.52 336.412-<strong>Nov</strong>-10 1,051.56 804.86 373.73 164.45 334.933-<strong>Nov</strong>-10 1,049.32 803.9 372.76 164.95 334.334-<strong>Nov</strong>-10 1,049.19 801.26 371.84 165.64 336.395-<strong>Nov</strong>-10 1,045.86 798.72 367.22 165.09 336.58-<strong>Nov</strong>-10 1,043.54 794.81 366.49 161.01 340.629-<strong>Nov</strong>-10 1,064.17 802.65 380.8 162.41 340.7510-<strong>Nov</strong>-10 1,084.01 810.96 390.59 163.81 340.0211-<strong>Nov</strong>-10 1,095.96 813.03 398.94 165.56 339.4112-<strong>Nov</strong>-10 1,079.96 803.88 389.94 165.8 336.915-<strong>Nov</strong>-10 1,076.43 802.14 388.63 167.01 337.4218-<strong>Nov</strong>-10 1,077.73 806.71 389.97 165.29 338.8119-<strong>Nov</strong>-10 1,076.75 803.56 389.97 163.79 339.4822-<strong>Nov</strong>-10 1,072.80 797.87 390.44 162.7 339.3223-<strong>Nov</strong>-10 1,058.69 783.44 382.98 160.34 339.3224-<strong>Nov</strong>-10 1,050.35 791.12 377.06 161.3 338.0225-<strong>Nov</strong>-10 1,053.87 790.87 381.81 161.66 338.126-<strong>Nov</strong>-10 1,058.10 797.3 382.41 161.95 343.4129-<strong>Nov</strong>-10 1,061.57 800.15 383.05 162.18 345.3430-<strong>Nov</strong>-10 1,061.16 797.98 381.18 159.97 343.13<strong>Monthly</strong> % Change 0.89% -1.10% 2.21% -1.57% 2.00%Source: <strong>Proshare</strong> Research/NSEIn the month under review, three sectoral index moved up reasonably with NSEBanking topping the chart by 2.21%, followed by NSE Oil & Gas by 2.00% and NSE30 by 0.89%, while NSE Insurance and NSE Food & Beverages dropping by -1.57% and-1.10% respectively.Source: NSE, <strong>Proshare</strong> ResearchThe <strong>Monthly</strong> <strong>NCM</strong> <strong>Report</strong> <strong>for</strong> <strong>Nov</strong> <strong>2010</strong> www.proshareng.com Page 15
<strong>Nov</strong>ember and October Sectoral Indexes ComparedSource: NSE, <strong>Proshare</strong> ResearchWhen compared the current negative outlook with the trend recorded in October withNSE sectoral index movements, the previous outlook outper<strong>for</strong>med the current trend asthree sectoral indexes closed positive as against all five positive positions recordedprevious month.NSE -30 INDEXSource: NSE, <strong>Proshare</strong> ResearchThe trend recorded in the blue chips stocks is reflected in the index movement. Therewere active bullish transactions and interruptions at the many points in the indexper<strong>for</strong>mance in the month due to the volatility resulting from profiteering in the period.The sector experienced low positive growth in the sector as against the impressiveper<strong>for</strong>mance of the preceding month, as a result of consistent profit taking and volatilityin the market, the index recorded marginal gain by +0.89% as against +4.26% upbeatrecorded in the month of October.NSE -FOOD INDEXSource: NSE, <strong>Proshare</strong> ResearchThe <strong>Monthly</strong> <strong>NCM</strong> <strong>Report</strong> <strong>for</strong> <strong>Nov</strong> <strong>2010</strong> www.proshareng.com Page 16
The stocks in the sector experienced high volatility being one of the most hit sectors, assector witnessed series of sell tendency from profit takes to record negative position inthe month, the per<strong>for</strong>mance in the sector impacted the negative posture recorded byASI. The negative position of -1.10% compared with October posture of +9.88%. This isagainst appreciations by +43.03% recorded in the first three months of the year.NSE -BANKING INDEXSource: NSE, <strong>Proshare</strong> ResearchNSE-Banking index closed the month of <strong>Nov</strong>ember with +2.21% appreciations comparedwith +5.80% gains recorded in October. The huge sell-off in the sector due to profittaking and perceived uncertainty about AMCON’s valuation and pricing model impactedthe low positive per<strong>for</strong>mance recorded in the sector. This was significantly observed onrescued banks.NSE -INSURANCE INDEXSource: NSE, <strong>Proshare</strong> ResearchThe per<strong>for</strong>mance in this sector reversed the per<strong>for</strong>mance recorded in previous month;this sector dropped the highest points by -1.57% as against the leading figure of+12.63% recorded in the month of October.The sector experienced continuous profit taking due to impressive growth recorded inthe previous month, this revealed high speculative tendency and low investors’confidence in the sector.The <strong>Monthly</strong> <strong>NCM</strong> <strong>Report</strong> <strong>for</strong> <strong>Nov</strong> <strong>2010</strong> www.proshareng.com Page 17
NSE -OIL INDEXSource: NSE, <strong>Proshare</strong> ResearchThe sector improved on low per<strong>for</strong>mance recorded in the preceding months to attain theleading position in the month under review with 2.00% upbeat as against a marginalgrowth of 0.95% recorded in October. This has been attributed to the moderate buyingobserved in the sector towards the close of the month. Further analysis revealed that thesector is gradually trending positive, which further suggest prospect in the sector, allthings being equal.LAST TRADING DAY – SNAPSHOThttp://www.proshareng.com/investors/theAnalyst.phpThe <strong>Monthly</strong> <strong>NCM</strong> <strong>Report</strong> <strong>for</strong> <strong>Nov</strong> <strong>2010</strong> www.proshareng.com Page 18
SECTORAL ANALYSISSECTORAL Analysis - PERFORMANCESectorYTD %ChangeHOTEL & TOURISM 63.05%BREWERIES 30.51%BUILDING MATERIALS 30.21%FOOD/BEVERAGES & TOBACCO 25.92%CONSTRUCTION 22.71%BANKING 18.88%CHEMICAL & PAINTS 18.02%MARITIME 15.25%HEALTHCARE 11.00%INDUSTRIAL/DOMESTIC PRODUCTS 5.16%CONGLOMERATES 4.70%PETROLEUM(MARKETING) 1.73%THE FOREIGN LISTINGS 0.37%AVIATION 0.00%AGRICULTURE -0.70%PRINTING & PUBLISHING -2.52%COMMERCIAL/SERVICES -3.65%AIRLINE SERVICES -6.13%PACKAGING -6.90%MORTGAGE COMPANIES -7.87%SECOND-TIER SECURITIES -8.32%REAL ESTATE -11.83%ENGINEERING TECHNOLOGY -13.17%INFORMATION & COMMUNICATION TECHNOLOGY -13.48%COMPUTER & OFFICE EQUIPMENT -13.86%ROAD TRANSPORTATION -15.07%INSURANCE -15.70%OTHER FINANCIAL INSTITUTIONS -18.18%FOOTWEAR -18.31%MEDIA -21.90%LEASING -30.94%AUTOMOBILE & TYRE -34.47%TEXTILES -60.53%Source: <strong>Proshare</strong> Research/NSEThe <strong>Monthly</strong> <strong>NCM</strong> <strong>Report</strong> <strong>for</strong> <strong>Nov</strong> <strong>2010</strong> www.proshareng.com Page 19
Transactions Volume and Value TrendMarket <strong>Nov</strong> '09' <strong>Nov</strong> '10' % ChangeAverage Daily Volume of Stocks Traded (in millions) 491.35 379.4 -22.78%Average Daily Value of Stocks Traded (in N'millions) 2,953.52 3,037.41 2.84%Average Daily Value of Stocks Traded (in USD$ millions) 18.46 20.12 8.97%Total Volume of Stocks Traded (in millions) 9335.59 7434.14 -20.37%Total Value of Stocks Traded (in N'millions) 56,116.87 60,339.33 7.52%Total Value of Stocks Traded (in USD$ billion) 350.73 399.6 13.93%New Listing and Delisting <strong>Nov</strong> '09' <strong>Nov</strong> '10'Number of Equities Delisted 0 0Number of New Listings 2 2Source: <strong>Proshare</strong> Research/NSEThe transaction volume in the month of <strong>Nov</strong>ember when compared with the precedingyear comparable period closed lower by -20.37% to close at 7434.14 million unitscompared with 9335.59 million units traded in <strong>Nov</strong>ember 2009. This could be anindication that the investors’ patronage of the market in the month under review wassignificantly different. Also, the transaction value in the month under review closedhigher by 7.52% at N60, 339.33 billion ($399.60 million) compared with N56,2116.87 billion ($350.73 million) of <strong>Nov</strong>ember 2009.<strong>Nov</strong>ember <strong>2010</strong> vs. 2009 Daily Volume ChartSource: NSE, <strong>Proshare</strong> ResearchThe <strong>Monthly</strong> <strong>NCM</strong> <strong>Report</strong> <strong>for</strong> <strong>Nov</strong> <strong>2010</strong> www.proshareng.com Page 20
Top Ten Trades <strong>for</strong> the Month of <strong>Nov</strong>ember <strong>2010</strong>Oceanic Bank Plc topped the transaction volume <strong>for</strong> the month. Banking stocks generallydominated the charts with four rescued banks’ stocks in the sector emerging in the topten trades chart <strong>for</strong> the month.Top 10 Trades <strong>for</strong> the Month of <strong>Nov</strong>ember Recall Top 10 Trades in <strong>Nov</strong>ember 2009Company Total Trades Total Volume Total Value CompanyTotalTrades Total Volume Total ValueOCEANIC 4,195.00 555,586,351.00 1,615,558,254.07 FIRSTINLND 1,596.00 1,057,266,433.00 718,539,476.04UBA 4,398.00 503,984,881.00 4,705,360,940.25 FIRSTBANK 17,698.00 786,895,837.00 11,124,850,027.85ZENITHBANK 7,114.00 460,255,973.00 6,819,983,875.34 ACCESS 3,833.00 769,798,303.00 4,968,002,935.77FIRSTINLND 2,436.00 344,410,891.00 320,731,934.79 OCEANIC 3,403.00 563,734,771.00 1,168,800,409.36GUARANTY 8,686.00 335,207,047.00 5,377,968,272.29 CORNERST 448 433,264,226.00 250,982,619.94FIRSTBANK 13,017.00 320,882,989.00 4,199,601,004.61 UBA 5,000.00 408,210,938.00 4,700,470,120.95ACCESS 3,601.00 280,286,284.00 2,502,785,341.84 GOLDINSURE 144 400,059,538.00 200,029,769.00PLATINUM 2,004.00 245,665,580.00 467,959,565.11 GUARANTY 8,195.00 364,287,757.00 5,832,309,334.04UBN 2,963.00 228,716,013.00 1,103,064,033.59 FIDELITYBK 3,184.00 362,708,121.00 914,456,128.88FIDELITYBK 2,143.00 181,499,131.00 475,670,876.64 DIAMONDBNK 2,003.00 290,665,225.00 2,132,117,318.48Only Zenith, PHB, and UBN did not feature <strong>for</strong> the same period - <strong>Nov</strong>ember 2009.Source: <strong>Proshare</strong> Research/NSETop Ten Traded Sectors <strong>for</strong> the Month of <strong>Nov</strong>emberSector Total Trades Total Volume Total Value % ContributionBANKING 64,393.00 4,617,474,155.00 32,508,266,383.05 66.61%INSURANCE 5,331.00 753,189,067.00 544,374,492.21 10.87%ICT 413.00 228,589,425.00 435,160,255.37 3.30%MORTGAGE COMPANIES 920.00 215,065,226.00 150,332,284.52 3.10%MARITIME 2,141.00 171,823,488.00 219,235,057.12 2.48%TOBACCO 8,768.00 153,610,992.00 5,743,990,982.23 2.22%AGRICULTURE 1,116.00 123,844,513.00 150,268,490.28 1.79%PETROLEUM(MARKETING) 4,995.00 77,385,838.00 4,271,458,204.26 1.12%AIRLINE SERVICES 1,234.00 75,496,842.00 311,948,715.27 1.09%BUILDING MATERIALS 3,202.00 69,384,716.00 4,197,811,444.91 1.00%Top 10 Sectors 92,513.00 6,485,864,262.00 48,532,846,309.22Total Traded Sectors 110,624.00 6,931,585,346.00 55,052,089,392.74Source: <strong>Proshare</strong> Research/NSETop Ten Gainers in the MonthTop Ten Gainers in the Month of <strong>Nov</strong> '10Top Ten YTD Appreciation as at <strong>Nov</strong> '10COMPANY 1-<strong>Nov</strong>-10 30-<strong>Nov</strong>-10 Change % Change COMPANY 4-Jan-10 30-<strong>Nov</strong>-10 Change % ChangeVONO0.85 1.33 0.48 56.47%BERGER 3.2 9 5.8 181.25%PLATINUM1.47 1.97 0.5 34.01%INTBREW 2.276 3.73 164.32%SPRINGBANK 0.78 1.04 0.26 33.33% CADBURY 10.49 27.2 16.71 159.29%FIRSTINLND0.69 0.87 0.18 26.09%ASHAKACEM 11.3925 13.61 119.49%NIGERINS 0.62 0.76 0.14 22.58% CAPHOTEL 1.38 3 1.62 117.39%ABCTRANS0.52 0.62 0.1 19.23%JBERGER 25.7949.98 24.19 93.80%WEMABANK1.22 1.39 0.17 13.93%VONO 0.69 1.33 0.64 92.75%STERLNBANK 1.96 2.19 0.23 11.73% FLOURMILL 36.2 69 32.8 90.61%ACCESS8.26 9.21 0.95 11.50%IKEJAHOTEL 0.871.58 0.71 81.61%SKYEBANK 7.45 8.3 0.85 11.41% NNFM 22.94 39.98 17.04 74.28%UBN4.12 4.59 0.47 11.41%COSTAIN 3.86.61 2.81 73.95%Source: <strong>Proshare</strong> Research/NSEThe <strong>Monthly</strong> <strong>NCM</strong> <strong>Report</strong> <strong>for</strong> <strong>Nov</strong> <strong>2010</strong> www.proshareng.com Page 21
Top Ten Decliners in the monthTop Ten Decliners in the Month of <strong>Nov</strong> '10Top Ten YTD Depreciation at <strong>Nov</strong> '10COMPANY 1-<strong>Nov</strong>-10 30-<strong>Nov</strong>-10 Change % Change COMPANY 4-Jan-10 30-<strong>Nov</strong>-10 Change % ChangeAIRSERVICE 2.23 1.55 -0.68 -30.49% UNITYKAP 2.38 0.5 -1.88 -78.99%IHS 2.71 1.91 -0.8 -29.52% BECOPETRO 2.53 0.7 -1.83 -72.33%NEIMETH 2.08 1.63 -0.45 -21.63% ALUMACO 27.71 7.75 -19.96 -72.03%AP 26.25 21.28 -4.97 -18.93% CRUSADER 1.5 0.5 -1 -66.67%COSTAIN8.02 6.61 -1.41 -17.58%OASISINS 1.49 0.5 -0.99 -66.44%UTC0.86 0.72 -0.14 -16.28%ECOBANK 10.1 3.6 -6.5 -64.36%CONOIL40.98 34.8 -6.18 -15.08%UNTL 1.9 0.75 -1.15 -60.53%RTBRISCOE3.5 3 -0.5 -14.29%POLYPROD 4.45 1.86 -2.59 -58.20%REDSTAREX3.36 2.93 -0.43 -12.80%STACO 1.19 0.5 -0.69 -57.98%FIRSTALUM 0.87 0.76 -0.11 -12.64% WAPIC 1.15 0.5 -0.65 -56.52%CUTIX 2.5 2.21 -0.29 -11.60% UNIC 1.15 0.5 -0.65 -56.52%Source: <strong>Proshare</strong> Research/NSENew ListingsNew Listing in <strong>Nov</strong>ember <strong>2010</strong>CompanyAmounts/Units ListedMulti-Trex Integrated Foods Plc 3,722,493,620Paints and Coatings Manufacturers Nigeria Plc 792,914,256Source: <strong>Proshare</strong> Research/NSESupplementary ListingsSupplementary Listing in <strong>Nov</strong>ember <strong>2010</strong>Company Additional Shares ReasonNEM Insurance Plc 303,580,147 Acquisition of Lambard Insurance Co. PlcSource: <strong>Proshare</strong> Research/NSEDe-ListingsDelisting in <strong>Nov</strong>ember <strong>2010</strong>Company No. of Shares Market Cap ReasonNil Nil Nil N/ASource: <strong>Proshare</strong> Research/NSEThe <strong>Monthly</strong> <strong>NCM</strong> <strong>Report</strong> <strong>for</strong> <strong>Nov</strong> <strong>2010</strong> www.proshareng.com Page 22
Corporate Declarations in the Month<strong>Nov</strong>ember 1st, <strong>2010</strong>: FIRST BANK of NIGERIA PLC<strong>Nov</strong>ember 1st, <strong>2010</strong>: AFRIBANK NIGERIA PLCTHIRD QUARTER REPORT FOR THE PERIOD ENDED 30-SEP-10THIRD QUARTER REPORT FOR THE PERIOD ENDED 30-SEP-10<strong>2010</strong> N'm 2009 N'm %Change <strong>2010</strong> N'm 2009 N'm % ChangeGross Earnings 177,065 197,988 -10.57% Gross Earning 43,236 86,487 -50.01%Profit Be<strong>for</strong>e Tax andExtra-ordinary Items 40,703 19,453 109.24% Profit Be<strong>for</strong>e Tax 8,136 (231,603) 103.51%Exceptional Items Nil (26,113) 0.00% Taxation (197.250) (435.605) 54.72%Taxation (8.141) (1,332) 99.39% Profit/Loss After Tax 7,938 (232,038) 103.42%Profit/Loss After Tax 32,562 (7,992) 507.43%Balance Sheet In<strong>for</strong>mationBalance Sheet In<strong>for</strong>mationFixed Assets 12,152 14,778 -17.77%Fixed Assets 52,948 47,980 10.35% Treasury bills 79,701 10,558 654.89%Treasury bills 25,253 14,219 77.60% Loans and Advances 104,805 118,224 -11.35%Loans and Advances 1,139,000 1,078,000 5.66% Cash and Bank Balances 23,136 27,896 -17.06%Cash and Balances 66,356 70,332 -5.65% Other Debit Balances 96,101 70,441 36.43%Other Debit Balances 650,103 662,515 -1.87% Deposits 338,744 249,506 35.77%Deposits 1,550,000 1,339,000 15.76% Other Credit Balances 227,041 285,601 -20.50%Other Credit Balances 564,428 523,646 7.79% Net Assets -249,887 -258,023 3.15%Net Assets 309,558 309,558 0.00% http://www.proshareng.com/investors/company.php?ref=AFRIBANKhttp://www.proshareng.com/investors/company.php?ref=FIRSTBANK<strong>Nov</strong>ember 1st , <strong>2010</strong>: CONOIL PLC<strong>Nov</strong>ember 1st, <strong>2010</strong>: BOC GASES PLCTHIRD QUARTER REPORT FOR THE PERIOD ENDED 30-SEP-10THIRD QUARTER REPORT FOR THE PERIOD ENDED 30-SEP-10<strong>2010</strong> N'm 2009 N'm % Change <strong>2010</strong> N'm 2009 N'm % ChangeTurnover 64,841 87,758 -26.1% Gross Earnings 1,684 16,616 -89.87%Profit Be<strong>for</strong>e Tax 2,550 3,525 -27.7% Profit Be<strong>for</strong>e Tax 339.685 334.729 1.48%Taxation (816.179) (1,128) 27.6% Taxation (98.685) (99.684) 1.00%Profit/Loss After Tax 1,734 2,397 -27.7% Profit/Loss After Tax 241.00 235.045 2.53%Balance Sheet In<strong>for</strong>mationBalance Sheet In<strong>for</strong>mationFixed Assets 7,462 8,139 -8.3% Fixed Assets 1,090 1,110 -1.80%Investment 2,000 2,000 0.0% Cash and Bank Balances 200.675 145.579 37.85%Stocks 1,971 4,095 -51.9% Other Debit Balances 133.661 88.362 51.27%Trade Debtors 16,697 9,133 82.8% Trade Creditors 153.553 50.312 205.20%Cash and Bank Balances 33,276 10,571 214.8% Short Term Borrowings Nil 32.35 0.00%Other Debit Balances 3,496 7,834 -55.4% Other Credit Balances 877.214 1,046 -16.14%Trade Creditors 5,804 5,296 9.6% Working Capital 173.94 35.700 387.22%Short Term Borrowings 7,890 67.142 11651.2% Net Assets 1,033 910.655 13.43%Other Credit Balances 33,963 20,899 62.5%http://www.proshareng.com/investors/company.php?ref=BOCGASWorking Capital 10,055 7,634 31.7%Net Assets 15,245 13,511 12.8%http://www.proshareng.com/investors/company.php?ref=CONOIL<strong>Nov</strong>ember 1st, <strong>2010</strong>: FIRST ALLUMINIUM NIGERIA PLC<strong>Nov</strong>ember 1st , <strong>2010</strong>: MAY & BAKER PLCTHIRD QUARTER REPORT FOR THE PERIOD ENDED 30-SEP-10AUDITED REPORT FOR THE PERIOD ENDED 30-SEP-10<strong>2010</strong> N'm 2009 N'm % Change <strong>2010</strong> N'm 2009 N'm % ChangeGross Earning 6,774 6,465 4.78% Turnover 2,988 3,134 -4.7%Profit Be<strong>for</strong>e Tax (196.657) (87.494) 124.77%Profit Be<strong>for</strong>e Tax andExtra-ordinary Items 1,167 1,225 -4.7%Taxation (62.903) 27.998 -324.67% Profit Be<strong>for</strong>e Tax 131.680 228.524 -42.4%Profit/Loss After Tax (133.727) (59.496) 124.77% Taxation (42.138) (73.128) -42.4%Balance Sheet In<strong>for</strong>mationProfit/Loss After Tax 89.542 155.396 -42.4%Fixed Assets 6,362 6,271 1.45%Balance Sheet In<strong>for</strong>mationStock 1,872 1,925 -2.75% Fixed Assets 3,693 2,309 59.9%Trade debtors 320.866 427.656 -24.97% Investment 245.325 245.325 0.0%Cash and Bank Balances 37.295 46.925 -20.52% Stocks 936.748 1,231 -23.9%Other Debit Balances 1,901 2,042 -6.90% Trade Debtors 654.887 599.037 9.3%Trade Creditors 1,214 1,447 -16.10% Cash and Bank Balances 423.444 1,342 -68.4%Short Term Borrowings 2,296 2,246 2.23% Other Debit Balances 67.296 67.296 0.0%Other Credit Balances 7,400 7,341 0.80% Trade Creditors 702.812 652.308 7.7%Working capital 78.905 198.662 -60.28% Short Term Borrowings 496.339 427.436 16.1%Net Assets 6,430 6,626 -2.96% Other Credit Balances 3,198 3,093 3.4%http://www.proshareng.com/investors/company.php?ref=FIRSTALUM Working Capital 1,151 2,117 -45.6%Net Assets 2,822 2,702 4.4%http://www.proshareng.com/investors/company.php?ref=MAYBAKERThe <strong>Monthly</strong> <strong>NCM</strong> <strong>Report</strong> <strong>for</strong> <strong>Nov</strong> <strong>2010</strong> www.proshareng.com Page 23
<strong>Nov</strong>ember 1st, <strong>2010</strong>: NIGERIA GERMAN CHEMICALS PLC<strong>Nov</strong>ember 1st , <strong>2010</strong>: NEM INSURANCE PLCAUDITED REPORT FOR THE PERIOD ENDED 31-MAR-10THIRD QUARTER REPORT FOR THE PERIOD ENDED 30-SEP-10<strong>2010</strong> N'm 2009 N'm % Change <strong>2010</strong> N'm 2009 N'm % ChangeGross Earning 3,708 2,845 30.33% Turnover 5,328 4,005 33.0%Profit Be<strong>for</strong>e Tax (450.970) 41.536 -1185.73% Profit Be<strong>for</strong>e Tax 1,116 874.144 27.7%Taxation (17.527) (23.600) 25.73% Taxation (78.145) (64.190) -21.7%Profit/Loss After Tax (468.497) 17.936 -2712.05% Profit/Loss After Tax 1,038 812.954 27.7%Balance Sheet In<strong>for</strong>mationBalance Sheet In<strong>for</strong>mationFixed Assets 25,404 13,817 83.86% Fixed Assets 48.51 482.321 -89.9%Stock 784.843 942.191 -16.70% Stocks 1,956 1,727 13.3%Trade debtors 293.041 461.922 -36.56% Trade debtors 2,165 1,691 28.0%Cash and Bank Balances 31.496 39.848 -20.96% Cash and Bank Balances 395.296 39.840 892.2%Other Debit Balances 792.069 994.037 -20.32% Insurance Funds 966.710 648.573 49.1%Trade Creditors 336.847 155.295 116.91% Other Credit Balances 162.897 213.925 -23.9%Short Term Borrowings 1,374 972.230 41.32% Net Assets 5,881 4,695 25.3%Other Credit Balances 2,361 1,708 38.23%http://www.proshareng.com/investors/company.php?ref=NEMWorking capital -2,171 -397.985 445.50%Net Assets 2,472 1,264 95.57%http://www.proshareng.com/investors/company.php?ref=NIG-GERMAN<strong>Nov</strong>ember 1st, <strong>2010</strong>: AFRIK PHARMACEUTICALS PLC<strong>Nov</strong>ember 1st, <strong>2010</strong>: LIVESTOCK FEEDS PLCSECOND QUARTER REPORT FOR THE PERIOD ENDED 30-JUN-10THIRD QUARTER REPORT FOR THE PERIOD ENDED 30-SEP-10<strong>2010</strong> N'm 2009 N'm % Change <strong>2010</strong> N'm 2009 N'm % ChangeTurnover 24.47 20.66 18.4% Gross Earning 1,450 1,617 -10.33%Profit Be<strong>for</strong>e Tax 1.73 1.28 35.2% Profit Be<strong>for</strong>e Tax 29.30 19.70 48.73%Taxation (0.198) (0.151) 31.1% Taxation (8.80) (1.90) -36.16%Profit/Loss After Tax 1.53 1.12 36.6% Profit/Loss After Tax 20.56 17.77 15.70%Balance Sheet In<strong>for</strong>mationBalance Sheet In<strong>for</strong>mationFixed Assets 20.179 20.72 -2.6% Fixed Assets 350.90 290.80 20.67%Stocks 10.95 9.54 14.8% Stock 306.50 93.60 227.46%Trade debtors 10.87 13.65 -20.4% Trade debtors 113.08 106.55 6.13%Cash and Bank Balances 2.60 3.70 -29.7% Cash and Bank Balances 23.30 23.10 0.87%Other Crebit Balances 25.301 20.925 20.9% Other Crebit Balances 20.00 20.50 -2.44%Net Assets 16.09 13.75 17.0% Net Assets 414.20 393.90 5.15%http://www.proshareng.com/investors/company.php?ref=AFRIKhttp://www.proshareng.com/investors/company.php?ref=LIVESTOCK2nd <strong>Nov</strong>ember , <strong>2010</strong>: LINKAGE ASSURANCE PLC2nd <strong>Nov</strong>ember , <strong>2010</strong>: AIICO INSURANCE PLCTHIRD QUARTER REPORT FOR THE PERIOD ENDED 30-SEP-10THIRD QUARTER REPORT FOR THE PERIOD ENDED 30-SEP-10<strong>2010</strong> N'm 2009 N'm % Change <strong>2010</strong> N'm 2009 N'm % ChangeTurnover 1,596 1,880 -15.1% Turnover 5,621 3,300 70.3%Profit Be<strong>for</strong>e Tax andExtra-ordinary items 118.958 346.023 -65.6% Profit Be<strong>for</strong>e Tax 1,754 1,290 36.0%Exceptional Items (342) (77.751) -339.5% Taxation (282.622) (387.052) 27.0%Taxation (32.161) (51.903) 38.0% Profit/Loss After Tax 1,471 903.121 62.9%Profit/Loss After Tax 75.043 216.369 -65.3%Balance Sheet In<strong>for</strong>mationBalance Sheet In<strong>for</strong>mationFixed Assets 3,293 3,240 1.6%Fixed Assets 710.492 717.561 -1.0% Stocks 9,129 11,210 -18.6%Stocks 749.7 712 5.2% Trade Debtors 1,416 751.908 88.3%Trade Debtors 1,230 1,198 2.7% Cash and Bank Balances 1,112 1,827 -39.1%Cash and Bank Balances 95.253 267.293 -64.4% Other Debit Balances 10,041 8,539 17.6%Other Debit Balances 2,187 1,927 13.5% Insurance Funds 8,058 5,694 41.5%Insurance Funds 531.167 676.810 -21.5% Other Credit Balances 5,575 6,251 -10.8%Other Credit Balances 1,135 1,240 -8.5% Net Assets 14,207 12,880 10.3%Net Assets 3,183 3,075 3.5%http://www.proshareng.com/investors/company.php?ref=AIICOhttp://www.proshareng.com/investors/company.php?ref=LINKASSURE2nd <strong>Nov</strong>ember , <strong>2010</strong>: AG LEVENTIS PLC2nd <strong>Nov</strong>ember, <strong>2010</strong>: ASHAKA CEMENT PLCTHIRD QUARTER REPORT FOR THE PERIOD ENDED 30-SEP-10THIRD QUARTER REPORT FOR THE PERIOD ENDED 30-SEP-10<strong>2010</strong> N'm 2009 N'm % Change <strong>2010</strong> N'm 2009 N'm % ChangeTurnover 9,669 10,695 -9.6% Gross Earnings 13,570 12,706 6.80%Profit Be<strong>for</strong>e Tax 554.649 1,417 -60.9% Profit Be<strong>for</strong>e Tax 2,729 1,775 53.75%Taxation (279.774) (453.733) 38.3% Taxation (819.00) (586.00) -39.76%Profit/Loss After Tax 274.875 964.182 -71.5% Profit/Loss After Tax 1,910 1,189 60.64%Balance Sheet In<strong>for</strong>mationBalance Sheet In<strong>for</strong>mationFixed Assets 9,695 10,001 -3.1% Fixed Assets 14,462 5,218 177.16%Stocks 2,607 3,284 -20.6% Stocks 5,956 4,707 26.53%Trade Debtors 618 335.554 84.1% Trade Debtors 382.00 88.00 334.09%Cash and Bank Balances 1,242 917 35.5% Cash and Bank Balances 921.00 849.00 8.48%Other Debit Balances 3,225 1,895 70.2% Other Debit Balances 6,052 14,756 -58.99%Trade Creditors 1,801 993 81.3% Trade Creditors 1,432 2,296 -37.63%Short Term Borrowings 486 305 59.5% Other Credit Balances 10,468 10,179 2.84%Other Credit Balances 4,954 4,826 2.7% Working Capital (340.00) (3,096.00) -89.02%Working Capital 1,418 1,352 4.9% Net Assets 15,871 13,142 20.77%Net Assets 8,968 8,971 0.0%http://www.proshareng.com/investors/company.php?ref=ASHAKACEMhttp://www.proshareng.com/investors/company.php?ref=AGLEVENTThe <strong>Monthly</strong> <strong>NCM</strong> <strong>Report</strong> <strong>for</strong> <strong>Nov</strong> <strong>2010</strong> www.proshareng.com Page 24
The <strong>Monthly</strong> <strong>NCM</strong> <strong>Report</strong> <strong>for</strong> <strong>Nov</strong> <strong>2010</strong> www.proshareng.com Page 25
2nd <strong>Nov</strong>ember, <strong>2010</strong>: Honeywell Flour Mills Plc2nd <strong>Nov</strong>ember, <strong>2010</strong>: PRESCO PLCTHIRD QUARTER REPORT FOR THE PERIOD ENDED 30-SEP-10THIRD QUARTER REPORT FOR THE PERIOD ENDED 30-SEP-10<strong>2010</strong> N'm 2009 N'm % Change <strong>2010</strong> N'm 2009 N'm % ChangeGross Earnings 18,228 17,728 2.82% Gross Earning 3,814 3,059 24.68%Profit Be<strong>for</strong>e Tax 1,679 1,622 3.51% Profit Be<strong>for</strong>e Tax 1,008 330.358 205.12%Taxation (754.863) (193.928) -289.25% Taxation (193.117) (62.414) -209.41%Profit/Loss After Tax 924.225 828.467 11.56% Profit/Loss After Tax 814.991 267.943 204.17%Balance Sheet In<strong>for</strong>mationBalance Sheet In<strong>for</strong>mationFixed Assets 12,661 12,916 -1.97% Fixed Assets 5.596 4.740 18.06%Stocks 4,503 3,847 17.05% Stock 1.352 1.107 22.13%Trade Debtors 662.08 656.75 0.81% Trade Debtors 0.810 0.327 147.71%Cash and Balances 4,072 3,627 12.27% Cash and Bank Balances 0.749 1.335 -43.90%Other Debit Balances 9,391 8,958 4.83% Other Debit Balances 0.109 0.770 -85.84%Trade creditors 3,091 808.160 282.47% Trade Creditors 0.160 1.132 -85.87%Short Term Borrowings 4,935 8,072 -38.86% Short Term Borrowings 0.120 0.378 -68.25%Other Credit Balances 9,701 7,615 27.39% Other Credit Balances 4.625 3.533 30.91%Working Capital 790.800 331.092 138.85% Working Capital 0.834 0.855 -2.46%Net Assets 13,562 13,510 0.38% Net Assets 3.238 2.623 23.45%http://www.proshareng.com/investors/company.php?ref=HONYFLOURhttp://www.proshareng.com/investors/company.php?ref=PRESCO<strong>Nov</strong>ember 2nd, <strong>2010</strong>: PS MANDRIDES PLC<strong>Nov</strong>ember 2nd, <strong>2010</strong>: TANTALIZER PLCAUDITED REPORT FOR THE PERIOD ENDED 30-SEP-09AUDITED REPORT FOR THE PERIOD ENDED 30-SEP-102009 N'm 2008 N'm % Change <strong>2010</strong> N'm 2009 N'm % ChangeGross Earning 202.180 234.623 -13.83% Gross Earnings 3,686 4,068 -9.39%Profit Be<strong>for</strong>e Tax 32.962 46.184 -28.63%Profit Be<strong>for</strong>e Tax andExtra-ordinary items 1,267 1,416 -10.52%Taxation (11.620) (15.407) 24.58% Profit Be<strong>for</strong>e Tax 78.349 75.006 4.46%Profit/Loss After Tax 21.342 30.777 -30.66% Taxation 20.597 29.000 -28.98%Balance Sheet In<strong>for</strong>mationProfit/Loss After Tax 57.752 46.007 25.53%Fixed Assets 8.723 10.526 -17.13%Balance Sheet In<strong>for</strong>mationInvestment 140.965 130.426 8.08% Fixed Assets 4,620 4,599 0.46%Stock 123.168 107.921 14.13% Stocks 109.817 122.465 -10.33%Trade debtors 32.609 40.317 -19.12% Trade Debtors 102.615 71.955 42.61%Cash and Bank Balances 97.071 81.873 18.56% Cash and Bank Balances 258.204 261.729 -1.35%Other Debit Balances 7.936 29.184 -72.81% Other Debit Balances 645.916 701.398 -7.91%Trade Creditors 52.950 44.555 18.84% Trade Creditors 576.262 490.587 17.46%Other Credit Balances 87.157 88.983 -2.05% Short Term Borrowings 84.823 332.441 -74.48%Working capital 120.677 125.757 -4.04% Other Credit Balances 1,347 1,286 4.74%Net Assets 268.526 264.116 1.67% Working Capital 80.054 (146.623) 154.60%http://www.proshareng.com/investors/company.php?ref=MANDRIDNet Assets 3,729 3,647 2.25%http://www.proshareng.com/investors/company.php?ref=TANTALIZER<strong>Nov</strong>ember 2nd, <strong>2010</strong>: UAC NIGERIA PLC2nd <strong>Nov</strong>ember, <strong>2010</strong>: UACN PROPERTY DEV. COMPANY PLCTHIRD QUARTER REPORT FOR THE PERIOD ENDED 30-SEP-10THIRD QUARTER REPORT FOR THE PERIOD ENDED 30-SEP-10<strong>2010</strong> N'm 2009 N'm %Change <strong>2010</strong> N'm 2009 N'm %ChangeGross Earnings 37,114 41,980 -11.59% Gross Earnings 5,718 11,452 -50.07%Profit Be<strong>for</strong>e Tax 5,035 6,186 -18.61% Profit Be<strong>for</strong>e Tax 2,056 3,052 -32.63%Taxation (1,297) (1,557) 28.05% Taxation (658.229) (976.865) 32.62%Profit/Loss After Tax 3,738 4,628 -19.23% Profit/Loss After Tax 1,398 2,075 -32.63%Balance Sheet In<strong>for</strong>mationBalance Sheet In<strong>for</strong>mationFixed Assets 29,974 30,131 -0.52% Fixed Assets 16,214 16,262 -0.30%Investments 2,240 2,204 1.63% Investment 2,150 2,140 0.47%Stock 6,692 10,244 -34.67% Stock 21,017 14,510 44.84%Trade Debtors 6,394 3,796 68.44% Trade Debtors 1,872 1,094 71.12%Cash and Bank Balances 10,534 5,530 90.49% Cash and Bank Balances 4,663 516 803.07%Other Debit Balances 46,487 42,159 10.27% Other Debit Balances 23,055 26,251 -12.17%Trade creditors 9,976 7,688 29.76% Trade creditors 4,272 5,809 -26.46%Short Term Borrowings 8,233 12,857 -35.96% Short Term Borrowings 4,465 9,280 -51.89%Other Credit Balances 37,432 28,557 31.08% Other Credit Balances 31,796 17,350 83.26%Working Capital 14,450 (86.591) -16787.65% Working Capital 10,519 (5,952) -276.73%Net Assets 37,789 37,486 0.81% Net Assets 28,439 29,844 -4.71%http://www.proshareng.com/investors/company.php?ref=UACNhttp://www.proshareng.com/investors/company.php?ref=UAC-PROP<strong>Nov</strong>ember 3rd, <strong>2010</strong>: FIDELITY BANK PLC3rd <strong>Nov</strong>ember, <strong>2010</strong>: VONO PRODUCTS PLCTHIRD QUARTER REPORT FOR THE PERIOD ENDED 30-SEP-10AUDITED REPORT FOR THE PERIOD ENDED 31-DEC-09<strong>2010</strong> N'm 2009 N'm % Change 2009 N'm 2008 N'm %ChangeGross Earnings 41,097 60,000 -31.51% Gross Earnings 447.867 629.858 -28.89%Profit Be<strong>for</strong>e Tax 7,454 4,002 86.26% Profit Be<strong>for</strong>e Tax (247.983) (118.647) -109.01%Taxation (1,527) (815) 87.36% Taxation (5.614) (1.519) -32.62%Profit/Loss After Tax 5,927 3,187 85.97% Profit/Loss After Tax (253.597) (120.166) -111.04%Balance Sheet In<strong>for</strong>mationBalance Sheet In<strong>for</strong>mationFixed Assets 25,192 24,965 0.91% Fixed Assets 1,801 742.818 142.46%Treasury Bills 35,144 132,397 -73.46% Stock 58.915 112.119 -47.45%Loans & Advances 150,528 160,297 -6.09% Trade Debtors 68.501 21.688 215.85%Cash and Bank Balances 53,168 23,721 124.14% Cash and Bank Balances 59.747 23.215 157.36%Other Debit Balances 143,707 94,346 52.32% Other Debit Balances 42.256 39.667 6.53%Deposits 256,448 288,096 -10.99% Trade creditors 314.768 175.539 79.32%Other Credit Balances 18,134 16,978 6.81% Short Term Borrowings 175.856 72.480 142.63%Net Assets 133,239 130,691 1.95% Other Credit Balances 535.200 548.050 -2.34%http://www.proshareng.com/investors/company.php?ref=FIDEKITYBK Working Capital (609.671) (306.959) 98.62%Net Assets 1,005 143.438 600.65%http://www.proshareng.com/investors/company.php?ref=VONOThe <strong>Monthly</strong> <strong>NCM</strong> <strong>Report</strong> <strong>for</strong> <strong>Nov</strong> <strong>2010</strong> www.proshareng.com Page 26
3rd <strong>Nov</strong>ember, <strong>2010</strong>: Chemical & Allied Products Plc<strong>Nov</strong>ember 3rd, <strong>2010</strong>: NIGERIAN BOTTLING COMPANY PLCTHIRD QUARTER REPORT FOR THE PERIOD ENDED 30-SEP-10THIRD QUARTER REPORT FOR THE PERIOD ENDED 30-SEP-10<strong>2010</strong> N'm 2009 N'm %Change <strong>2010</strong> N'm 2009 N'm % ChangeGross Earnings 2,623.00 2,090.00 25.50% Gross Earnings 73,840 64,740 14.06%Profit Be<strong>for</strong>e Tax 748.762 515.306 45.30% Profit Be<strong>for</strong>e Tax 1,687 2,754 -38.74%Taxation (239.604) (164.898) -45.30% Taxation (5.00) (1,462) -99.66%Profit/Loss After Tax 509.158 350.408 45.30% Profit/Loss After Tax 1,681 1,291 30.21%Balance Sheet In<strong>for</strong>mationBalance Sheet In<strong>for</strong>mationFixed Assets 263.065 245.154 7.31% Fixed Assets 52,757 47,148 11.90%Investments 32.617 Nil 0.00% Stocks 27,495 13,576 102.53%Stock 386.43 333.893 15.74% Trade Debtors 278.00 289.00 -3.81%Trade Debtors 190.66 137.427 38.73% Cash and Bank Balances 1,085 840.00 29.17%Cash and Bank Balances 1,207 1,271 -5.04% Other Debit Balances 2,676 4,520 -40.80%Other Debit Balances 172.034 175.175 -1.79% Trade Creditors 30,267 17,602 71.95%Trade creditors 55.401 150.441 -63.17% Short Term Borrowings 11,302 4,693 140.83%Other Credit Balances 1,268.00 1,258.00 0.79% Other Credit Balances 12,649 6,964 81.63%Working Capital 779.739 643.824 21.11% Working Capital (17,253) (8,005) 115.53%Net Assets 928.281 754.442 23.04% Net Assets 30,071 29,826 0.82%http://www.proshareng.com/investors/company.php?ref=CAPhttp://www.proshareng.com/investors/company.php?ref=NBC3rd <strong>Nov</strong>ember , <strong>2010</strong>: CRUSADER PLC<strong>Nov</strong>ember 3rd, <strong>2010</strong>: Julius Berger Nigeria PlcTHIRD QUARTER REPORT FOR THE PERIOD ENDED 30-SEP-10THIRD QUARTER REPORT FOR THE PERIOD ENDED 30-SEP-10<strong>2010</strong> N'm 2009 N'm % Change <strong>2010</strong> N'm 2009 N'm % ChangeTurnover 3,418 3,515 -2.8% Gross Earning 121,522 111,319 9.17%Profit Be<strong>for</strong>e Tax AndExtra-ordinary Items 107.138 216.935 -50.6% Profit/Loss Be<strong>for</strong>e Tax 4,731 7,026 -32.66%Exceptional Items Nil (154.746) 0.0% Taxation (2.602) (4,582) 99.94%Taxation (124.123) (91.495) -35.7% Profit/Loss After Tax 2,129 2,444 -12.89%Profit/Loss After Tax (16.985) (29.307) 42.0%Balance Sheet In<strong>for</strong>mationBalance Sheet In<strong>for</strong>mationFixed Assets 54,882 48,411 13.37%Fixed Assets 765.702 258.434 196.3% Stock 16,036 14,845 8.02%Stocks 4,811 4,529 6.2% Trade debtors 45,421 46,662 -2.66%Trade debtors 545.185 674.004 -19.1% Cash and Bank Balances 8,610 8,968 -3.99%Cash and Bank Balances 622.838 746.813 -16.6% Other Debit Balances 42,450 32,433 30.89%Other Debit Balances 8,139 8,025 1.4% Trade creditors 14,589 4,000 264.73%Trade Creditors 2,018 1,401 44.0% Short Term Borrowing 13,673 8,093 68.95%Other Credit Balances 7,153 7,140 0.2% Other Credit Balances 132,366 134,486 -1.58%Net Assets 5,712 5,691 0.4% Working Capital 38,034 32,042 18.70%http://www.proshareng.com/investors/company.php?ref=CRUSADER Net Assets 6,971.00 7,722.00 -9.73%http://www.proshareng.com/investors/company.php?ref=JBERGER<strong>Nov</strong>ember 3rd, <strong>2010</strong>: UNIVERSITY PRESS PLC<strong>Nov</strong>ember 3rd, <strong>2010</strong>: RED STAR EXPRESS PLCSECOND QUARTER REPORT FOR THE PERIOD ENDED 30-SEP-10SECOND QUARTER REPORT FOR THE PERIOD ENDED 30-SEP-10<strong>2010</strong> N'm 2009 N'm % Change <strong>2010</strong> N'm 2009 N'm % ChangeGross Earnings 1,192.00 975.896 22.14% Gross Earnings 2,116 2,073 2.07%Profit Be<strong>for</strong>e Tax 292.747 202.684 44.44% Profit Be<strong>for</strong>e Tax 205.399 237.257 -13.43%Taxation (86.683) (60.919) -42.29% Taxation (61.619) (71.177) 13.43%Profit/Loss After Tax 206.064 141.765 45.36% Profit/Loss After Tax 143.779 166.079 -13.43%Balance Sheet In<strong>for</strong>mationBalance Sheet In<strong>for</strong>mationFixed Assets 498.519 531.249 -6.16% Fixed Assets 798.730 735.324 8.62%Stocks 986.92 1,034 -4.55% Investment 4.425 5.925 -25.32%Trade Debtors 379.863 148.087 156.51% Stocks 44.072 30.179 46.04%Cash and Bank Balances 160.421 16.780 856.03% Trade Debtors 1,133 1,133 0.00%Other Debit Balances 51.010 291.354 -82.49% Cash and Bank Balances 58.449 367.298 -84.09%Trade Creditors 98.653 26.743 268.89% Other Debit Balances 375.460 255.440 46.99%Other Credit Balances 658.711 738.097 -10.76% Trade Creditors 140.283 183.056 -23.37%Working Capital 940.664 834.327 12.75% Other Credit Balances 1,003 1,060 -5.38%Net Assets 1,319 1,257 4.93% Working Capital 749.932 798.976 -6.14%http://www.proshareng.com/investors/company.php?ref=UPLNet Assets 1,250 1,283 -2.57%http://www.proshareng.com/investors/company.php?ref=REDSTAREX3rd <strong>Nov</strong>ember, <strong>2010</strong>: OKOMU OIL PALM PLC<strong>Nov</strong>ember 3rd, <strong>2010</strong>: NIGERIA GERMAN CHEMICALS PLCTHIRD QUARTER REPORT FOR THE PERIOD ENDED 30-SEP-10THIRD QUARTER REPORT FOR THE PERIOD ENDED 30-SEP-10<strong>2010</strong> N'm 2009 N'm %Change <strong>2010</strong> N'm 2009 N'm % ChangeGross Earnings 4,900 4,741 3.35% Gross Earning 1,383 819.967 68.67%PBT & Exceptional items 1,313 661.741 98.42% Profit Be<strong>for</strong>e Tax 221.339 (189.009) 217.77%Exceptional items 35.444 (33.464) 205.92% Taxation (70.829) Nil 0.00%Taxation (330.543) (112.217) -194.56% Profit/Loss After Tax 150.511 (189.009) 179.63%Profit/Loss After Tax 1,017 516.060 97.07%Balance Sheet In<strong>for</strong>mationBalance Sheet In<strong>for</strong>mationFixed Assets 4,806 4,261 12.79%Fixed Assets 6,282 6,253 0.46% Stock 670.746 755.582 -11.23%Stock 965.873 1,079 -10.48% Trade debtors 412.016 132.536 210.87%Trade Debtors 55.109 212.448 -74.06% Cash and Bank Balances 190.919 11.158 1611.05%Cash and Bank Balances 325.254 (21.780) -1593.36% Other Debit Balances 890.877 315.847 182.06%Other Debit Balances 205.436 187.687 9.46% Trade Creditors 577.792 285.683 102.25%Trade Creditors 36.366 287.865 -87.37% Short Term Borrowings 334.852 700.941 -52.23%Short Term Borrowings Nil 140.466 0.00% Other Credit Balances 633.235 362.496 74.69%Other Credit Balances 788.699 926.574 -14.88% Working capital 88.879 -1,748 105.08%Working Capital 493.526 87.436 464.44% Net Assets 2,557 2,407 6.23%Net Assets 5,371 4,353 23.39% http://www.proshareng.com/investors/company.php?ref=NIG-GERMANhttp://www.proshareng.com/investors/company.php?ref=OKOMUOILThe <strong>Monthly</strong> <strong>NCM</strong> <strong>Report</strong> <strong>for</strong> <strong>Nov</strong> <strong>2010</strong> www.proshareng.com Page 27
3rd <strong>Nov</strong>ember, <strong>2010</strong>: PORTLAND PAINTS PLC3rd <strong>Nov</strong>ember , <strong>2010</strong>: SOVEREIGN TRUST INSURANCE PLCTHIRD QUARTER REPORT FOR THE PERIOD ENDED 30-SEP-10SECOND QUARTER REPORT FOR THE PERIOD ENDED 30-JUN-10<strong>2010</strong> N'm 2009 N'm % Change <strong>2010</strong> N'm 2009 N'm % ChangeGross Earning 1,688 1,615 4.52% Turnover 2,901 2,826 2.7%Profit Be<strong>for</strong>e Tax 194.843 181.837 7.15% Profit Be<strong>for</strong>e Tax 670.547 572.340 17.2%Taxation (62.350) (58.188) -7.15% Taxation (66.903) (70.657) 5.3%Profit/Loss After Tax 132.493 123.649 7.15% Profit/Loss After Tax 603.643 501.683 20.3%Balance Sheet In<strong>for</strong>mationBalance Sheet In<strong>for</strong>mationFixed Assets 216.012 230.009 -6.09% Fixed Assets 461.212 530.965 -13.1%Stock 656.155 772.500 -15.06% Stocks 1,147 1,308 -12.3%Trade Debtors 269.389 256.202 5.15% Trade debtors 1,884 1,679 12.2%Cash and Bank Balances 119.489 55.053 117.04% Cash and Bank Balances 290.125 65.123 345.5%Other Debit Balances 337.318 333.931 1.01% Other Debit Balances 2,000 1,684 18.8%Trade Creditors 121.665 325.747 -62.65% Insurance Funds 617.420 580.594 6.3%Short Term Borrowings 194.674 195.373 -0.36% Other Credit Balances 1,137 1,248 -8.9%Other Credit Balances 318.135 257.390 23.60% Net Assets 4,028 3,439 17.1%Working Capital 711.641 611.386 16.40%http://www.proshareng.com/investors/company.php?ref=SOVRENINSNet Assets 963.889 869.185 10.90%http://www.proshareng.com/investors/company.php?ref=PORTPAINT<strong>Nov</strong>ember 4th, <strong>2010</strong>: INTERCONTINENTAL BANK PLC4th <strong>Nov</strong>ember , <strong>2010</strong>: CHELLARAMS PLCTHIRD QUARTER REPORT FOR THE PERIOD ENDED 30-SEP-10AUDITED REPORT FOR THE PERIOD ENDED 31-DEC-09<strong>2010</strong> N'm 2009 N'm % Change 2009 N'm 2008 N'm % ChangeGross Earning 74,822 124,289 -39.80% Turnover 4.781 4.732 1.0%Profit Be<strong>for</strong>e Tax 12,734 (222,626) 105.72% Profit Be<strong>for</strong>e Tax 0.83 0.126 -558.7%Taxation (2,547) 60,945 -104.18% Taxation 0.13 0.10 30.0%Profit/Loss After Tax 10,186 (161,680) 106.30% Profit/Loss After Tax 0.690 0.116 -494.8%Balance Sheet In<strong>for</strong>mationBalance Sheet In<strong>for</strong>mationFixed Assets 54,890 55,835 -1.69% Fixed Assets 3.178 3.081 3.1%Stock 108,572 87,250 24.44% Stocks 3.329 3.270 1.8%Trade debtors 152,549 145,833 4.61% Trade debtors 1.106 976 -99.9%Cash and Bank Balances 25,845 28,927 -10.65% Cash and Bank Balances 0.440 0.550 -20.0%Other Debit Balances 308,192 317,845 -3.04% Other Debit Balances 1.610 1.632 -1.3%Trade Creditors 838,618 824,527 1.71% Trade Creditors 1.481 1.535 -3.5%Other Credit Balances 180,311 183,512 -1.74% Short Term Borrowings 4.355 4.091 6.5%Net Assets -368,881 -380,117 -2.96% Other Credit Balances 0.420 0.427 -1.6%http://www.proshareng.com/investors/company.php?ref=INTERCONT Working Capital (0.166) (0.119) 39.5%Net Assets 2.896 2.836 2.1%http://www.proshareng.com/investors/company.php?ref=CHELLARAM5th <strong>Nov</strong>ember, <strong>2010</strong>: EQUITY ASSURANCE PLC8th <strong>Nov</strong>ember, <strong>2010</strong>: SPRING BANK PLCFIRST QUARTER REPORT FOR THE PERIOD ENDED 31-MAR-10THIRD QUARTER REPORT FOR THE PERIOD ENDED 30-SEP-10<strong>2010</strong> N'm 2009 N'm % Change <strong>2010</strong> N'm 2009 N'm % ChangeTurnover 1,095 1,053 4.0% Gross Earning 18,643 15,484 20.40%Profit Be<strong>for</strong>e Tax 258.386 277.639 -6.9% Profit Be<strong>for</strong>e Tax 3,354 (28,580) 111.74%Taxation (45.264) (33.316) -35.9% Taxation (69.911) (58.065) -20.40%Profit/Loss After Tax 331.939 244.322 35.9% Profit/Loss After Tax 3,284 (28,638) 111.47%Balance Sheet In<strong>for</strong>mationBalance Sheet In<strong>for</strong>mationFixed Assets 962.399 978.213 -1.6% Fixed Assets 7,236 7,383 -1.99%Stocks 2,308 2,223 3.8% Treasury Bills 24,177 29,266 -17.39%Trade Debtors 990.322 905.735 9.3% Loans & Advances 22,198 15,902 39.59%Cash and Bank Balances 121.736 48.352 151.8% Cash and Bank Balances 9,209 6,520 41.24%Other Debit Balances 4,525 4,308 5.0% Other Debit Balances 138,228 87,240 58.45%Insurance Funds 983.502 907.993 8.3% Deposits 189,986 142,697 33.14%Short Term Borrowings 137.416 121.138 13.4% Other Credit Balances 101,716 97,553 4.27%Other Credit Balances 1,925 1,905 1.0% Net Assets 201,049 146,313 37.41%Net Assets 5,861 5,529 6.0%http://www.proshareng.com/investors/company.php?ref=SPRINGBANKhttp://www.proshareng.com/investors/company.php?ref=EQUITYASUR8th <strong>Nov</strong>ember, <strong>2010</strong>: EQUITY ASSURANCE PLC<strong>Nov</strong>ember 8th, <strong>2010</strong>: MOBIL OIL PLCSECOND QUARTER REPORT FOR THE PERIOD ENDED 30-JUN-10THIRD QUARTER REPORT FOR THE PERIOD ENDED 30-SEP-10<strong>2010</strong> N'm 2009 N'm % Change <strong>2010</strong> N'm 2009 N'm % ChangeTurnover 1,600 1,630 -1.8% Gross Earnings 45,222 47,078 -3.94%Profit Be<strong>for</strong>e Tax 298.515 340.675 -12.4% Profit Be<strong>for</strong>e Tax 4,298 2,462 74.57%Taxation (35.821) (40.881) -35.9% Taxation (1,364) (797) -71.23%Profit/Loss After Tax 262.693 299.794 -12.4% Profit/Loss After Tax 2,933 1,666 76.05%Balance Sheet In<strong>for</strong>mationBalance Sheet In<strong>for</strong>mationFixed Assets 961.464 978.213 -1.7% Fixed Assets 13,168 245.154 5271.32%Stocks 2,325 2,223 4.6% Stocks 3,140 4,378 -28.28%Trade Debtors 1,083.000 905.735 19.6% Trade Debtors 1,068 1,139 -6.23%Cash and Bank Balances 115.213 48.352 138.3% Cash and Bank Balances 550.552 21.799 2425.58%Other Debit Balances 4,414 4,308 2.5% Other Debit Balances 4,159 4,466 -6.87%Insurance Funds 1,065.000 907.993 17.3% Trade Creditors 4,889 6,434 -24.01%Other Credit Balances 2,041 2,026 0.7% Other Credit Balances 7,934 6,123 29.58%Net Assets 5,792 5,529 4.8% Working Capital (4,465) (3,044) 46.68%http://www.proshareng.com/investors/company.php?ref=EQUITYASURNet Assets 5,006 4,176 19.88%http://www.proshareng.com/investors/company.php?ref=MOBILThe <strong>Monthly</strong> <strong>NCM</strong> <strong>Report</strong> <strong>for</strong> <strong>Nov</strong> <strong>2010</strong> www.proshareng.com Page 28
8th <strong>Nov</strong>ember, <strong>2010</strong>: STANDARD ALLIANCE INSURANCE PLC9th <strong>Nov</strong>ember, <strong>2010</strong>: GOLDLINK INSURANCE PLCAUDITED REPORT FOR THE PERIOD ENDED 31-DEC-09THIRD QUARTER REPORT FOR THE PERIOD ENDED 30-SEP-102009 N'm 2008 N'm % Change <strong>2010</strong> N'm 2009 N'm % ChangeTurnover 1,795 1,481 21.2% Gross Earning 2,924 2,351 24.37%Profit Be<strong>for</strong>e Tax AndExtra-ordinary Items (5,858) 1,123 -621.6% Profit Be<strong>for</strong>e Tax 784.36 761.96 20.14%Taxation (155.741) (121.263) -28.4% Taxation (86.279) (79.502) 8.52%Profit/Loss After Tax -5,956 690.492 -962.6% Profit/Loss After Tax 698.076 678.163 2.94%Balance Sheet In<strong>for</strong>mationBalance Sheet In<strong>for</strong>mationFixed Assets 968.723 938.274 3.2% Fixed Assets 2,879 2,961 -2.77%Stocks 10,889 16,190 -32.7% Stock 4,117 3,626 13.54%Trade Debtors 3,086 1,535 101.0% Trade Debtors 1,893 1,405 34.73%Cash and Bank Balances 80.518 111.120 -27.5% Cash and Bank Balances 452.528 246.500 83.58%Other Debit Balances 3,717 5,427 -31.5% Other Debit Balances 500.00 500.00 0.00%Insurance Funds 545.599 552.825 -1.3% Trade Creditors 351.39 302.07 16.33%Short Term Borrowings 3.667 17.606 -79.2% Other Credit Balances 2,003 1,695 18.17%Other Credit Balances 1,760 565.719 211.1% Working Capital 2,354 1,961 20.04%Net Assets 16,432 23,065 -28.8% Net Assets 4,487 6,778 -33.80%http://www.proshareng.com/investors/company.php?ref=STDINSUREhttp://www.proshareng.com/investors/company.php?ref=GOLDINSURE9th <strong>Nov</strong>ember, <strong>2010</strong>: Multiverse Resources Plc9th <strong>Nov</strong>ember, <strong>2010</strong>: CEMENT CO. OF NORTHERN NIGERIA PLCTHIRD QUARTER REPORT FOR THE PERIOD ENDED 30-SEP-10THIRD QUARTER REPORT FOR THE PERIOD ENDED 30-SEP-10<strong>2010</strong> N'm 2009 N'm % Change <strong>2010</strong> N'm 2009 N'm % ChangeGross Earning 500.619 399.704 25.25% Gross Earnings 8,389 8,910 -5.85%Profit Be<strong>for</strong>e Tax 60.329 74.465 -18.98% Profit Be<strong>for</strong>e Tax 934.836 1,891 -50.56%Taxation (2.00) (2.00) 0.00% Taxation (360.00) (434.123) -17.07%Profit/Loss After Tax 58.329 72.065 -19.06% Profit/Loss After Tax 574.836 1,457 -60.55%Balance Sheet In<strong>for</strong>mationBalance Sheet In<strong>for</strong>mationFixed Assets 3,725 3,728 -0.08% Fixed Assets 4,916 4,950 -0.69%Stock 440.869 405.243 8.79% Stocks 3,103 2,509 23.67%Trade debtors 22.828 8.968 154.55% Trade Debtors 238.451 1,001 -76.18%Cash and Bank Balances 5.443 1.194 355.86% Cash and Bank Balances 774.938 626.266 23.74%Other Debit Balances 19.007 25.287 -24.83% Other Debit Balances 505.173 648.870 -22.15%Trade creditors 84.480 88.648 -4.70% Trade Creditors 2,838 3,446 -17.64%Short Term Borrowings 139.671 137.659 1.46% Short Term Borrowings 1,085 670.942 61.71%Other Credit Balances 408.543 341.884 19.50% Other Credit Balances 1,567 1,468 6.74%Working Capital -144.547 127.498 -213.37% Working Capital 567.141 459.393 23.45%Net Assets 3,714 3,698 0.43% Net Assets 4,465 4,217 5.88%http://www.proshareng.com/investors/company.php?ref=MULTIVERSEhttp://www.proshareng.com/investors/company.php?ref=CCNN10th <strong>Nov</strong>ember, <strong>2010</strong>: BETA GLASS PLC10th <strong>Nov</strong>ember, <strong>2010</strong>: CHAMPION BREWERIES PLCTHIRD QUARTER REPORT FOR THE PERIOD ENDED 30-SEP-10THIRD QUARTER REPORT FOR THE PERIOD ENDED 30-SEP-10<strong>2010</strong> N'm 2009 N'm % Change <strong>2010</strong> N'm 2009 N'm % ChangeGross Earnings 8,066 7,810 3.28% Turnover 1.018 0.911 11.75%Profit Be<strong>for</strong>e Tax 1,204 1,522 -20.89% Profit Be<strong>for</strong>e Tax (0.226) (0.211) -7.11%Taxation (295.70) (396.86) -25.49% Taxation Nil Nil 0.00%Profit/Loss After Tax 908.64 1,125 -19.23% Profit/Loss After Tax (0.226) (0.211) -7.11%Balance Sheet In<strong>for</strong>mationBalance Sheet In<strong>for</strong>mationFixed Assets 8,608 7,953 8.24% Fixed Assets 2.149 2.497 -13.94%Stocks 2,639 1,934 36.45% Stocks 0.928 0.979 -5.21%Trade Debtors 3,519 1,408 149.93% Trade Debtors 0.417 0.222 87.84%Cash and Bank Balances 177.453 150.566 17.86% Cash and Balances 0.50 0.60 -16.67%Other Debit Balances 2,569 1,795 43.12% Other Debit Balances 0.17 0.19 -10.53%Trade Creditors 161.580 363.720 -55.58% Trade creditors 0.178 0.146 21.92%Short Term Borrowings 558.654 600.00 -6.89% Short Term Borrowings 0.168 0.124 35.48%Other Credit Balances 4,898 1,146 327.40% Other Credit Balances 4.504 4.529 -0.55%Working Capital 3,287 3,179 3.40% Working Capital (3.466) (3.563) -2.72%Net Assets 9,085 8,524 6.58% Net Assets (1.301) (1.075) 21.02%http://www.proshareng.com/investors/company.php?ref=BETAGLAShttp://www.proshareng.com/investors/company.php?ref=CHAMPION10th <strong>Nov</strong>ember, <strong>2010</strong>: G. CAPPA PLC10th <strong>Nov</strong>ember, <strong>2010</strong>: G. CAPPA PLCAUDITED REPORT FOR THE PERIOD ENDED 31-MAR-02AUDITED REPORT FOR THE PERIOD ENDED 31-MAR-032002 N'm 2001 N'm % Change 2003 N'm 2002 N'm % ChangeTurnover 3,783 3,882 -2.55% Turnover 404.114 3,783 -89.32%Profit Be<strong>for</strong>e Tax (1,637) 168.512 -1071.44% Profit Be<strong>for</strong>e Tax (1,234) (1,637) 24.62%Taxation (6.700) (8.500) 21.18% Taxation (0.660) (6.700) 90.15%Profit/Loss After Tax (1,644) 160.012 -1127.42% Profit/Loss After Tax (1,234) (1,644) 24.94%Balance Sheet In<strong>for</strong>mationBalance Sheet In<strong>for</strong>mationFixed Assets 1,817 546.635 232.40% Fixed Assets 1,779 1,817 -2.09%Stocks 548.627 318.942 72.01% Stocks 136.958 548.627 -75.04%Trade Debtors 1,182 2,039 -42.03% Trade Debtors 1,212 1,182 2.54%Cash and Balances 114.59 209.59 -45.33% Cash and Balances 144.476 114.587 26.08%Other Debit Balances 1,285 1,435 -10.45% Other Debit Balances 1,335 2,467 -45.89%Trade creditors 518.836 423.384 22.55% Trade creditors 676.444 518.836 30.38%Short Term Borrowings 315.100 434.622 -27.50% Short Term Borrowings 884.776 315.100 180.79%Other Credit Balances 3,398 2,461 38.07% Other Credit Balances 3,971 3,733 6.38%Working Capital (1,436) 263.722 -644.51% Working Capital (2,703) (1,436) 88.23%Net Assets 45.657 390.538 -88.31% Net Assets (1,189) 45.657 -2704.20%http://www.proshareng.com/investors/company.php?ref=GCAPPAhttp://www.proshareng.com/investors/company.php?ref=GCAPPAThe <strong>Monthly</strong> <strong>NCM</strong> <strong>Report</strong> <strong>for</strong> <strong>Nov</strong> <strong>2010</strong> www.proshareng.com Page 29
10th <strong>Nov</strong>ember, <strong>2010</strong>: G. CAPPA PLC10th <strong>Nov</strong>ember, <strong>2010</strong>: G. CAPPA PLCAUDITED REPORT FOR THE PERIOD ENDED 31-MAR-04AUDITED REPORT FOR THE PERIOD ENDED 31-MAR-052004 N'm 2003 N'm % Change 2005 N'm 2004 N'm % ChangeTurnover 171.647 404.114 -57.53% Turnover 134.414 171.647 -21.69%Profit Be<strong>for</strong>e Tax (327.284) (1,234) 73.48% Profit Be<strong>for</strong>e Tax 249.593 (327.284) 176.26%Taxation (0.370) (0.660) 43.94% Taxation 0.323 (0.370) 187.30%Profit/Loss After Tax (327.654) (1,234) 73.45% Profit/Loss After Tax (246.916) (327.654) 24.64%Balance Sheet In<strong>for</strong>mationBalance Sheet In<strong>for</strong>mationFixed Assets 1,724 1,779 -3.09% Fixed Assets 1,680 1,724 -2.55%Stocks 53.445 136.958 -60.98% Stocks 42.756 53.445 -20.00%Trade Debtors 1,143 1,212 -5.69% Trade Debtors 1,143 1,143 0.00%Cash and Balances 60.831 144.476 -57.90% Cash and Balances 57.332 60.831 -5.75%Other Debit Balances 1,335 1,335 0.00% Other Debit Balances 1,335 1,335 0.00%Trade creditors 656.373 676.444 -2.97% Trade creditors 667.021 656.373 1.62%Short Term Borrowings 893.517 884.776 0.99% Short Term Borrowings 1,284 893.517 43.70%Other Credit Balances (1,544) 3,971 -138.88% Other Credit Balances Nil (1,544) 0.00%Working Capital (3,085) (2,703) 14.13% Working Capital (3,299) (3,085) 6.94%Net Assets (1,516) (1,189) 27.50% Net Assets (1,763) (1,516) 16.29%http://www.proshareng.com/investors/company.php?ref=GCAPPAhttp://www.proshareng.com/investors/company.php?ref=GCAPPA10th <strong>Nov</strong>ember, <strong>2010</strong>: G. CAPPA PLC11th <strong>Nov</strong>ember, <strong>2010</strong>: G. CAPPA PLCAUDITED REPORT FOR THE PERIOD ENDED 31-MAR-06AUDITED REPORT FOR THE PERIOD ENDED 31-MAR-072006 N'm 2005 N'm % Change 2007 N'm 2006 N'm % ChangeTurnover 168.683 134.414 25.50% Turnover 78.548 168.683 -53.43%Profit Be<strong>for</strong>e Tax (14.403) 249.593 -105.77% Profit Be<strong>for</strong>e Tax (142.101) (14.403) -886.61%Taxation (3.519) (0.323) -989.47% Taxation (0.253) (3.519) 92.81%Profit/Loss After Tax (17.923) (246.916) 92.74% Profit/Loss After Tax (142.355) (17.923) 694.26%Balance Sheet In<strong>for</strong>mationBalance Sheet In<strong>for</strong>mationFixed Assets 1,645 1,680 -2.08% Fixed Assets 1,532 1,645 -6.87%Stocks 29.929 42.756 -30.00% Stocks Nil 29.929 0.00%Trade Debtors 1,130 1,143 -1.14% Trade Debtors 1,137 1,130 0.62%Cash and Balances 68.801 57.332 20.00% Cash and Balances 35.743 68.801 -48.05%Other Debit Balances 1,198 1,311 -8.62% Other Debit Balances 1,156 1,198 -3.51%Trade creditors 664.484 667.021 -0.38% Trade creditors 630.951 664.484 -5.05%Short Term Borrowings 1,186 1,284 -7.63% Short Term Borrowings 1,204 1,186 1.52%Other Credit Balances 3,929 3,903 0.67% Other Credit Balances 3,916 3,929 -0.33%Working Capital (3,352) (3,299) -1.61% Working Capital (3,421) (3,352) -2.06%Net Assets (1,781) (1,763) -1.02% Net Assets 1,924 (1,781) 208.03%http://www.proshareng.com/investors/company.php?ref=GCAPPAhttp://www.proshareng.com/investors/company.php?ref=GCAPPA11th <strong>Nov</strong>ember, <strong>2010</strong>: G. CAPPA PLC11th <strong>Nov</strong>ember , <strong>2010</strong>: IKEJA HOTELS PLCAUDITED REPORT FOR THE PERIOD ENDED 31-MAR-08THIRD QUARTER REPORT FOR THE PERIOD ENDED 30-SEP-102008 N'm 2007 N'm % Change <strong>2010</strong> N'm 2009 N'm % ChangeTurnover 327.349 78.548 316.75% Turnover 5,600 5,327 5.1%Profit Be<strong>for</strong>e Tax (50.160) (142.101) -64.70% Profit Be<strong>for</strong>e Tax 1,625 1,240 31.0%Taxation (0.564) (0.253) 122.92% Taxation (487.674) (372.118) -31.1%Profit/Loss After Tax (50.725) (142.355) -64.37% Profit/Loss After Tax 1,137 868.275 30.9%Balance Sheet In<strong>for</strong>mationBalance Sheet In<strong>for</strong>mationFixed Assets 6,653 1,532 334.27% Fixed Assets 613 617 -0.6%Trade Debtors 1,137 1,137 0.00% Investment 11,938 11,938 0.0%Cash and Balances 107.541 35.743 200.87% Stocks 220.086 199.598 10.3%Other Debit Balances 1,131 1,156 -2.16% Trade Debtors 1,029 680.362 51.2%Trade creditors 625.095 630.951 -0.93% Cash and Bank Balances 873.381 607.207 43.8%Short Term Borrowings 1,289 1,204 7.06% Other Debit Balances 2,609 3,537 -26.2%Other Credit Balances 3,988 3,916 1.84% Trade Creditors 84.061 99.209 -15.3%Working Capital (3,526) (3,421) 3.07% Short Term Borrowings 2,905 3,602 -19.4%Net Assets 3,126 1,924 62.47% Other Credit Balances 6,459 7,208 -10.4%http://www.proshareng.com/investors/company.php?ref=GCAPPAWorking Capital (3,137) (3,924) 20.1%Net Assets 7,835 6,670 17.5%http://www.proshareng.com/investors/company.php?ref=IKEJAHOTEL11th <strong>Nov</strong>ember, <strong>2010</strong>: AIRLINE SERVICES & LOGISTICS PLC<strong>Nov</strong>ember 12th, <strong>2010</strong>: BAGCO PLCTHIRD QUARTER REPORT FOR THE PERIOD ENDED 30-SEP-10SECOND QUARTER REPORT FOR THE PERIOD ENDED 30-SEP-10<strong>2010</strong> N'm 2009 N'm % Change <strong>2010</strong> N'm 2009 N'm % ChangeTurnover 2,682 2,896 -7.4% Gross Earning 5,737 5,168 11.01%Profit Be<strong>for</strong>e Tax &Exceptional Items 217.812 517.181 -57.9% Profit Be<strong>for</strong>e Tax 749.08 691.98 8.25%Exceptional Items (45.778) (130.568) 64.9% Taxation (239.71) (221.43) -8.25%Profit/Loss After Tax 112.012 253.622 -55.8% Profit/Loss After Tax 509.37 470.54 8.25%Balance Sheet In<strong>for</strong>mationBalance Sheet In<strong>for</strong>mationFixed Assets 841.830 767.039 9.8% Fixed Assets 7,428 6,614 12.31%Investment 1.416 1.416 0.0% Stock 4,061 3,273 24.08%Stocks 215.384 216.240 -0.4% Trade Debtors 517.02 440.57 17.35%Trade debtors 649.957 715.134 -9.1% Cash and Bank Balances 186.04 55.39 235.88%Cash and Bank Balances 182.322 215.118 -15.2% Other Debit Balances 7,615 8,274 -7.96%Other Debit Balances 434.103 648.345 -33.0% Trade Creditors 1,887 857 120.29%Trade Creditors 111.839 344.541 -67.5% Short Term Borrowing 4,561 4,516 1.00%Short Term Borrowings 104.249 496.524 -79.0% Other Credit Balances 2,879 3,553 -18.97%Other Credit Balances 635.365 289.777 119.3% Working Capital 5,244 6,000 -12.60%Working Capital 515.696 568.515 -9.3% Net Assets 10,515 9,766 7.67%Net Assets 1,470 1,432 2.7%http://www.proshareng.com/investors/company.php?ref=BAGCOhttp://www.proshareng.com/investors/company.php?ref=AIRSERVICEThe <strong>Monthly</strong> <strong>NCM</strong> <strong>Report</strong> <strong>for</strong> <strong>Nov</strong> <strong>2010</strong> www.proshareng.com Page 30
12th <strong>Nov</strong>ember, <strong>2010</strong>: DAAR COMMUNICATIONS PLC12th <strong>Nov</strong>ember , <strong>2010</strong>: CONSOLIDATED HALLMARK INSURANCE PLCSECOND QUARTER REPORT FOR THE PERIOD ENDED 30-JUN-10THIRD QUARTER REPORT FOR THE PERIOD ENDED 30-SEP-10<strong>2010</strong> N'm 2009 N'm % Change <strong>2010</strong> N'm 2009 N'm % ChangeTurnover 1,875 1,885 -0.5% Gross Premium 2,126 2,053 3.6%Profit Be<strong>for</strong>e Tax (727.364) 141.216 -615.1%Profit Be<strong>for</strong>e Tax AndExtra-ordinary Items 274.492 438.685 -37.4%Taxation Nil (42.365) 0.0% Exceptional Items (3.786) Nil 0.0%Profit/Loss After Tax (727.364) 98.851 -835.8% Taxation (89.333) Nil 0.0%Balance Sheet In<strong>for</strong>mationProfit/Loss After Tax 181.373 438.685 -58.7%Fixed Assets 23,383 23,341 0.2%Balance Sheet In<strong>for</strong>mationStocks 248.999 248.999 0.0% Fixed Assets 933.129 999.458 -6.6%Trade debtors 1,702 2,073 -17.9% Stocks 1,387 987.455 40.5%Cash and Bank Balances 215.954 61.842 249.2% Debtors 1,393 1,464 -4.8%Other Debit Balances 626.098 842.674 -25.7% Cash and Bank Balances 206.293 143.052 44.2%Trade Creditors 555.705 586.929 -5.3% Other Debit Balances 1,447 1,397 3.6%Short Term Borrowings 4,799 3,120 53.8% Insurance Funds 587.531 490.531 19.8%Other Crebit Balances 768.255 1,512 -49.2% Other Credit Balances 629.001 528.015 19.1%Working Capital 3,878 2,557 51.7% Net Assets 5,368 4,991 7.6%Net Assets 13,260 13,987 -5.2%http://www.proshareng.com/investors/company.php?ref=HMARKINShttp://www.proshareng.com/investors/company.php?ref=DAARCOMM<strong>Nov</strong>ember 12th, <strong>2010</strong>: OANDO PLC<strong>Nov</strong>ember 12th, <strong>2010</strong>: Nigerian Breweries PlcTHIRD QUARTER REPORT FOR THE PERIOD ENDED 30-SEP-10THIRD QUARTER REPORT FOR THE PERIOD ENDED 30-SEP-10<strong>2010</strong> N'm 2009 N'm % Change <strong>2010</strong> N'm 2009 N'm % ChangeGross Earning 277,524 252,816 9.77% Gross Earning 130,706 118,975 9.86%Profit Be<strong>for</strong>e Tax 15,188 9,339 62.63% Profit Be<strong>for</strong>e Tax 31,710 31,593 0.37%Taxation (6,384) (2,599) 145.63% Taxation (10,573) (10,245) 3.20%Profit/Loss After Tax 8,808 6,740 30.68% Profit/Loss After Tax 21,137 21,349 -0.99%Balance Sheet In<strong>for</strong>mationBalance Sheet In<strong>for</strong>mationFixed Assets 137,375 131,713 4.30% Fixed Assets 68,885 69,003 -0.17%Stock 20,925 9,693 115.88% Investment 150 150 0.00%Trade Debtors 66,990 49,774 34.59% Stocks 26,228 22,064 18.87%Cash and Bank Balances 11,288 25,760 -56.18% Trade debtors 5,416 2,068 161.90%Other Debit Balances 68,912 89,723 -23.19% Cash and Bank Balances 1,791 11,812 -84.84%Trade Creditors 32,989 40,129 -17.79% Other Debit Balances 2,913 1,521 91.52%Short Term Borrowing 63,669 140,474 -54.68% Short Term Borrowing 3,027 502.196 0.00%Other Credit Balances 129,883 291,336 -55.42% Other Credit Balances 68,424 66,106 3.51%Working Capital -15,153 -93,150 -83.73% Working Capital -9,712 -4,689 107.12%Net Assets 78,961 53,520 47.54% Net Assets 40,892 46,570 -12.19%http://www.proshareng.com/investors/company.php?ref=OANDOhttp://www.proshareng.com/investors/company.php?ref=NB<strong>Nov</strong>ember 12th, <strong>2010</strong>: Flour Mills Nigeria Plc12th <strong>Nov</strong>ember, <strong>2010</strong>: LINKAGE ASSURANCE PLCSECOND QUARTER REPORT FOR THE PERIOD ENDED 30-SEP-10AUDITED REPORT FOR THE PERIOD ENDED 31-DEC-09<strong>2010</strong> N'm 2009 N'm % Change 2009 N'm 2008 N'm % ChangeGross Earning 89,487 81,601 9.66% Turnover 829.437 905.684 -8.4%Profit Be<strong>for</strong>e Tax 8,897 6,980 27.46%Profit Be<strong>for</strong>e Tax andExtra-ordinary items (55.293) 361.998 -115.3%Taxation (3,045) (2,094) -45.42% Exceptional Items (178.454) (510.317) -339.5%Profit/Loss After Tax 5,851 4,886 19.75% Taxation (25.542) (8.061) 38.0%Balance Sheet In<strong>for</strong>mationProfit/Loss After Tax -259.289 -156.38 65.8%Fixed Assets 28,059 28,313 -0.90%Balance Sheet In<strong>for</strong>mationStocks 11,634 10,271 13.27% Fixed Assets 717.561 729.870 -1.7%Trade debtors 4,023 4,264 -5.65% Stocks 1,367.0 1,047 30.6%Cash and Bank Balances 3,116 4,526 -31.15% Trade Debtors 712.438 1,056 -32.5%Other Debit Balances 60,964 53,580 13.78% Cash and Bank Balances 267.293 410.634 -34.9%Trade creditors 1,500 7,335 -79.55% Other Debit Balances 1,927 2,020 -4.6%Short Term Borrowing 11,145 13,782 -19.13% Trade creditors 676.810 724.789 -6.6%Other Credit Balances 53,915 41,931 28.58% Other Credit Balances 1,240 1,293 -4.1%Working Capital 9,393 7,881 19.19% Net Assets 3,075 3,247 -5.3%Net Assets 41,236 35,384 16.54%http://www.proshareng.com/investors/company.php?ref=LINKASSUREhttp://www.proshareng.com/investors/company.php?ref=FLOURMILL<strong>Nov</strong>ember 12th, <strong>2010</strong>: PHARMADEKO PLC<strong>Nov</strong>ember 15th, <strong>2010</strong>: JULI PLCAUDITED REPORT FOR THE PERIOD ENDED 31-DEC-09THIRD QUARTER REPORT FOR THE PERIOD ENDED 30-SEP-102009 N'm 2008 N'm % Change <strong>2010</strong> N'm 2009 N'm % ChangeGross Earning 501.930 1,105 -54.58% Gross Earning 188.65 216.0 -12.66%Profit Be<strong>for</strong>e Tax (460.455) (194.826) -136.34% Profit Be<strong>for</strong>e Tax (25.6) (18.9) 35.45%Taxation (1.042) (3.146) 66.88% Taxation Nil Nil 0.00%Profit/Loss After Tax (461.497) (197.972) -133.11% Profit/Loss After Tax (25.6) (18.9) 35.45%Balance Sheet In<strong>for</strong>mationBalance Sheet In<strong>for</strong>mationFixed Assets 910.110 999.419 -8.94% Fixed Assets 47.5 53.0 -10.38%Stocks 130.114 66.210 96.52% Stocks 23.2 26.9 -13.75%Trade debtors 52.943 322.216 -83.57% Trade debtors 1.1 1.2 -8.33%Cash and Bank Balances 2.507 32.023 -92.17% Cash and Bank Balances 0.38 7.1 -94.65%Other Debit Balances 149.731 67.688 121.21% Other Debit Balances 13.2 15.3 -13.73%Trade creditors 231.042 210.288 9.87% Trade creditors 26.3 19.5 34.87%Short Term Borrowing 1,119 683.520 63.71% Short Term Borrowings 19 Nil 0.00%Other Credit Balances 541.402 778.658 -30.47% Other Credit Balances 19.2 15.8 21.52%Working Capital -1,301 -915.904 -42.05% Net Assets 20.7 54.23 -249.60%Net Assets (646.407) (184.901) -249.60%http://www.proshareng.com/investors/company.php?ref=JULIhttp://www.proshareng.com/investors/company.php?ref=PHARMDEKOThe <strong>Monthly</strong> <strong>NCM</strong> <strong>Report</strong> <strong>for</strong> <strong>Nov</strong> <strong>2010</strong> www.proshareng.com Page 31
<strong>Nov</strong>ember 18th, <strong>2010</strong>: UNION BANK NIGERIA PLC18th <strong>Nov</strong>ember, <strong>2010</strong>: SEVEN-UP PLCTHIRD QUARTER REPORT FOR THE PERIOD ENDED 30-SEP-10SECOND QUARTER REPORT FOR THE PERIOD ENDED 30-SEP-10<strong>2010</strong> N'm 2009 N'm % Change <strong>2010</strong> N'm 2009 N'm % ChangeGross Earnings 85,565 142,618 -40.00% Turnover 22,828 17,853 27.9%Profit Be<strong>for</strong>e Tax 7,683 (122,157) 106.29% Profit Be<strong>for</strong>e Tax 1,214 1,004 20.9%Taxation (876.00) (5,729) 84.71% Taxation (242.990) (150.656) -61.3%Profit/Loss After Tax 6,807 (127,886) 105.32% Profit/Loss After Tax 971.958 853.715 13.9%Balance Sheet In<strong>for</strong>mationBalance Sheet In<strong>for</strong>mationFixed Assets 58,870 61,189 -3.79% Fixed Assets 20,796 20,525 1.3%Treasury Bills 27,137 20,953 29.51% Stock 8,189 7,164 14.3%Loans and Advances 371,199 469,618 -20.96% Trade debtors 281.110 231.687 21.3%Cash and Bank Balances 87,414 86,846 0.65% Cash and Bank Balances 4,343 1,599 171.6%Other debit balances 403,202 522,100 -22.77% Other Debit Balances 4,059 3,903 4.0%Deposits 816,776 979,102 -16.58% Trade creditors 2,370 2,952 -19.7%Other Credit Balances 364,394 410,581 -11.25% Short Term Borrowings 759 1,408 -46.1%Net Assets (244,152) (238,328) -2.44% Other Credit Balances 11,506 6,779 69.7%http://www.proshareng.com/investors/company.php?ref=UBNWorking Capital 2,237 1,759 27.2%Net Assets 10,188 8,973 13.5%http://www.proshareng.com/investors/company.php?ref=7UP<strong>Nov</strong>ember 18th, <strong>2010</strong>: NORTHERN NIGERIA FLOUR MILLS PLC18th <strong>Nov</strong>ember, <strong>2010</strong>: TRIPPLE GEE PLCSECOND QUARTER REPORT FOR THE PERIOD ENDED 30-SEP-10SECOND QUARTER REPORT FOR THE PERIOD ENDED 30-SEP-10<strong>2010</strong> N'm 2009 N'm % Change <strong>2010</strong> N'm 2009 N'm % ChangeGross Earnings 5,300 5,360 -1.12% Turnover 221.121 300.639 -26.4%Profit Be<strong>for</strong>e Tax 405.741 425.403 -4.62% Profit Be<strong>for</strong>e Tax (38.434) 2.430 -1681.6%Taxation (32.929) (96.694) 65.95% Taxation (0.135) (0.365) 63.0%Profit/Loss After Tax 372.812 328.709 13.42% Profit/Loss After Tax (38.569) 2.065 -1967.7%Balance Sheet In<strong>for</strong>mationBalance Sheet In<strong>for</strong>mationFixed Assets 777.807 395.242 96.79% Fixed Assets 964.683 972.482 -0.8%Stocks 2,042 1,097 86.14% Stock 12.860 15.154 -15.1%Trade Debtors 108.566 59.353 82.92% Trade debtors 66.565 358.973 -81.5%Cash and Bank Balances 623.117 351.996 77.02% Cash and Bank Balances 7.358 4.321 70.3%Other Dedit Balances 31.733 21.024 50.94% Other Debit Balances 315.880 311.112 1.5%Trade Creditors 1,219 110.051 1007.67% Trade creditors 52.275 82.727 -36.8%Other Credit Balances 290.293 126.267 129.90% Short Term Borrowings 419.578 424.575 -1.2%Working Capital 1,263 1,511 -16.41% Other Credit Balances 244.039 289.899 -15.8%Net Assets 1,576 1,458 8.09% Working Capital (313.229) (107.641) 191.0%http://www.proshareng.com/investors/company.php?ref=NNFMNet Assets 651.454 864.841 -24.7%http://www.proshareng.com/investors/company.php?ref=TRIPPLEG19th <strong>Nov</strong>ember, <strong>2010</strong>: AFRICAN ALLIANCE INSURANCE PLC19th <strong>Nov</strong>ember, <strong>2010</strong>: GUINEA INSURANCE PLCAUDITED REPORT FOR THE PERIOD ENDED 31-DEC-09AUDITED REPORT FOR THE PERIOD ENDED 31-DEC-092009 N'm 2008 N'm % Change 2009 N'm 2008 N'm % ChangeTurnover 1,430 1,229 16.4% Turnover 1,169 935.472 25.0%Profit Be<strong>for</strong>e Tax (1,409) (7,948) 82.3% Profit Be<strong>for</strong>e Tax 19.663 63.289 -68.9%Taxation (290.555) (13.873) -1994.4% Taxation (33.057) (12.059) -174.1%Profit/Loss After Tax (1,699) (7,962) 78.7% Profit/Loss After Tax (13.394) 75.348 -117.8%Balance Sheet In<strong>for</strong>mationBalance Sheet In<strong>for</strong>mationFixed Assets 5,665 3,319 70.7% Fixed Assets 100.502 67.810 48.2%Stock 506.566 2,706 -81.3% Stock 109.997 134.902 -18.5%Trade debtors 219.402 230.207 -4.7% Trade debtors 1,213 855.249 41.8%Cash and Bank Balances 261.561 91.001 187.4% Cash and Bank Balances 161.695 164.976 -2.0%Other Debit Balances 8,968 10,726 -16.4% Other Debit Balances 1,449 1,896 -23.6%Trade creditors 1,904 1,757 8.4% Insurance Funds 546.053 396.769 37.6%Short Term Borrowings 149.902 1.192 12475.7% Short Term Borrowings Nil 4.473 0.0%Other Credit Balances 3,911 2,825 38.4% Other Credit Balances 378.220 351.635 7.6%Net Assets 20,167 20,966 -3.8% Net Assets 3,297 3,337 -1.2%http://www.proshareng.com/investors/company.php?ref=AFRINSUREhttp://www.proshareng.com/investors/company.php?ref=GUINEAINS<strong>Nov</strong>ember 19th, <strong>2010</strong>: MRS OIL PLC25th <strong>Nov</strong>ember , <strong>2010</strong>: CHAMS PLCTHIRD QUARTER REPORT FOR THE PERIOD ENDED 30-SEP-10THIRD QUARTER REPORT FOR THE PERIOD ENDED 30-SEP-10<strong>2010</strong> N'm 2009 N'm %Change <strong>2010</strong> N'm 2009 N'm % ChangeGross Earnings 58,948 54,345 8.47% Turnover 1,420 223.003 536.8%Profit Be<strong>for</strong>e Tax 1,933 1,929 0.21% Profit Be<strong>for</strong>e Tax (1,021) (697.730) -46.3%Taxation (618.657) (617.589) -0.17% Taxation (153.243) (104.659) -46.4%Profit/Loss After Tax 1,314 1,312 0.15% Profit/Loss After Tax (1,174) (802.390) -46.3%Balance Sheet In<strong>for</strong>mationBalance Sheet In<strong>for</strong>mationFixed Assets 3,255 3,183 2.26% Fixed Assets 5,210 2,585 101.5%Stock 3,682 4,844 -23.99% Stocks 1,311 333.949 292.6%Trade Debtors 2,175 1,725 26.09% Trade Debtors 3,235 3,414 -5.2%Cash and Bank Balances 2,344 1,274 83.99% Cash and Bank Balances 25.574 10.110 153.0%Other Debit Balances 8,071 5,580 44.64% Other Debit Balances 1,187 1,612 -26.4%Trade creditors 11,401 7,488 52.26% Trade Creditors 653.225 253.664 157.5%Other Credit Balances 4,164 6,153 -32.33% Short Term Borrowings 1,171 637.192 83.8%Working Capital 1,592 555.996 186.33% Other Credit Balances 1,369 1,080 26.8%Net Assets 3,963 2,965 33.66% Working Capital 1,958 3,875 -49.5%http://www.proshareng.com/investors/company.php?ref=CHEVRONNet Assets 7,997 8,761 -8.7%http://www.proshareng.com/investors/company.php?ref=CHAMSThe <strong>Monthly</strong> <strong>NCM</strong> <strong>Report</strong> <strong>for</strong> <strong>Nov</strong> <strong>2010</strong> www.proshareng.com Page 32
<strong>Nov</strong>ember 19th, <strong>2010</strong>: EVANS MEDICAL PLC<strong>Nov</strong>ember 23rd, <strong>2010</strong>: E-TRANZACT PLCAUDITED REPORT FOR THE PERIOD ENDED 31-MAR-09THIRD QUARTER REPORT FOR THE PERIOD ENDED 30-SEPT-102009 N'm 2008N'm % Change <strong>2010</strong> N'm 2009 N'm % ChangeGross Earning 3,523.00 4,465.00 -21.10% Turnover 567.324 601.508 -5.68%Profit/Loss After Tax (889.60) (510.10) -74.40% Profit Be<strong>for</strong>e Tax 36.103 (104.426) 134.57%http://www.proshareng.com/investors/company.php?ref=EVANSMEDTaxation 9.366 12.531 -25.26%Profit/Loss After Tax 26.737 (116.958) 122.86%http://www.proshareng.com/investors/company.php?ref=ETRANZACT<strong>Nov</strong>ember 23rd, <strong>2010</strong>: LONGMAN NIGERIA PLC<strong>Nov</strong>ember 23rd, <strong>2010</strong>: LONGMAN NIGERIA PLCSECOND QUARTER REPORT FOR THE PERIOD ENDED 30-JUN-10THIRD QUARTER REPORT FOR THE PERIOD ENDED 30-SEPT-10<strong>2010</strong> N'm 2009 N'm % Change <strong>2010</strong> N'm 2009 N'm % ChangeTurnover 1,072 614.812 74.36% Turnover 2,101 2,013 4.37%Profit Be<strong>for</strong>e Tax (370.182) (111.352) -232.44% Profit Be<strong>for</strong>e Tax 83.997 389.257 -78.42%Taxation - - Taxation 26.879 124.562 -78.42%Profit/Loss After Tax (370.182) (111.352) -232.44% Profit/Loss After Tax 57.118 264.695 -78.42%http://www.proshareng.com/investors/company.php?ref=LONGMANhttp://www.proshareng.com/investors/company.php?ref=LONGMAN<strong>Nov</strong>ember 23rd, <strong>2010</strong>: TOURIST COMPANY OF NIGERIA PLC<strong>Nov</strong>ember 23rd, <strong>2010</strong>: TOURIST COMPANY OF NIGERIA PLCFIRST QUARTER REPORT FOR THE PERIOD ENDED 31-MAR-10SECOND QUARTER REPORT FOR THE PERIOD ENDED 30-JUN-10<strong>2010</strong> N'm 2009 N'm % Change <strong>2010</strong> N'm 2009 N'm % ChangeTurnover 630.00 577.597 9.07% Turnover 1,222 1,030 18.64%Profit Be<strong>for</strong>e Tax 77.754 48.501 60.31% Profit Be<strong>for</strong>e Tax 77.478 29.025 166.94%Taxation - - Taxation (3.770) -Profit/Loss After Tax 77.754 48.501 60.31% Profit/Loss After Tax 75.247 29.025 159.25%http://www.proshareng.com/investors/company.php?ref=TOURISThttp://www.proshareng.com/investors/company.php?ref=TOURIST<strong>Nov</strong>ember 23rd, <strong>2010</strong>: TOURIST COMPANY OF NIGERIA PLC<strong>Nov</strong>ember 23rd, <strong>2010</strong>: UNION HOMES SAVINGS & LOANS PLCTHIRD QUARTER REPORT FOR THE PERIOD ENDED 30-SEPT-10THIRD QUARTER REPORT FOR THE PERIOD ENDED 30-SEP-10<strong>2010</strong> N'm 2009 N'm % Change <strong>2010</strong> N'm 2009 N'm % ChangeTurnover 1,896 1,379 37.49% Turnover 6,798 4,573 48.66%Profit Be<strong>for</strong>e Tax (188.246) (15.777) -1093.17% Profit Be<strong>for</strong>e Tax 1,870 370.000 405.41%Taxation (3.770) 0.530 -811.32% Taxation (561.000) (111.000) 405.41%Profit/Loss After Tax (184.476) (16.307) -1031.27% Profit/Loss After Tax 1,309 259.000 405.41%http://www.proshareng.com/investors/company.php?ref=TOURISThttp://www.proshareng.com/investors/company.php?ref=UNHOMES25th <strong>Nov</strong>ember, <strong>2010</strong>: ETERNA OIL PLC<strong>Nov</strong>ember 25th, <strong>2010</strong>: Guinness Nigeria PlcTHIRD QUARTER REPORT FOR THE PERIOD ENDED 30-SEP-10FIRST QUARTER REPORT FOR THE PERIOD ENDED 30-SEP-10<strong>2010</strong> N'm 2009 N'm % Change <strong>2010</strong> N'm 2009 N'm % ChangeGross Earning 11,158 6,762 65.01% Gross Earnings 24,416 20,618 18.42%Profit Be<strong>for</strong>e Tax 943.489 (627.053) 250.46% Profit Be<strong>for</strong>e Tax 3,376 2,559 31.93%Taxation (301.917) Nil 0.00% Taxation (1,060) (926.372) -14.42%Profit/Loss After Tax 641.573 (627.053) 202.32% Profit After Tax 2,316 1,633 41.82%Balance Sheet In<strong>for</strong>mationBalance Sheet In<strong>for</strong>mationFixed Assets 1,152 1,181 -2.46% Fixed Assets 38,760 35,358 9.62%Stocks 1,170 356.328 228.35% Stocks 19,597 23,481 -16.54%Trade debtors 293.84 1,024 -71.30% Trade Debtors 11,178 7,627 46.56%Cash and Bank Balances 463.079 270.638 71.11% Cash and Bank Balances 6,091 2,074 193.68%Other Debit Balances 625.208 717.254 -12.83% Other Debit Balances 10,521 6,655 58.09%Trade Creditors 4,222 3,691 14.39% Trade Creditors 11,324 6,562 72.57%Short Term Borrowings (2,342) (1,141) 105.26% Short Term Borrowings Nil 5,240 0.00%Other Credit Balances 1,436 515.580 178.52% Other Credit Balances 74,826 63,395 18.03%Working capital -801.237 -3289 -75.64% Working Capital 9,319 7,061 31.98%Net Assets 4,398 3,455 27.29% Net Assets 13,528 11,100 21.87%http://www.proshareng.com/investors/company.php?ref=ETERNAOILhttp://www.proshareng.com/investors/company.php?ref=GUINNESS25th <strong>Nov</strong>ember , <strong>2010</strong>: NIGERIA ROPES PLC25th <strong>Nov</strong>ember, <strong>2010</strong>: NIGERIA ROPES PLCFIRST QUARTER REPORT FOR THE PERIOD ENDED 31-MAR-10SECOND QUARTER REPORT FOR THE PERIOD ENDED 30-JUN-10<strong>2010</strong> N'm 2009 N'm % Change <strong>2010</strong> N'm 2009 N'm % ChangeTurnover 77.584 89.155 -13.0% Turnover 177.137 217.236 -18.5%Profit Be<strong>for</strong>e Tax (14.318) (4.147) -245.3% Profit Be<strong>for</strong>e Tax (19.625) (14.851) -32.1%Taxation Nil Nil 0.0% Taxation Nil Nil 0.0%Profit/Loss After Tax (14.318) (4.147) -245.3% Profit/Loss After Tax (19.625) (14.851) -32.1%Balance Sheet In<strong>for</strong>mationBalance Sheet In<strong>for</strong>mationFixed Assets 124.545 132.969 -6.3% Fixed Assets 114.613 132.969 -13.8%Stocks 333.042 336.064 -0.9% Stocks 362.277 336.064 7.8%Trade Debtors 60.098 73.308 -18.0% Trade Debtors 91.461 73.308 24.8%Cash and Bank Balances 2.296 1.510 52.1% Cash and Bank Balances 0.965 1.510 -36.1%Other Debit Balances 133.770 126.267 5.9% Other Debit Balances 81.260 126.267 -35.6%Trade Creditors 22.515 16.577 35.8% Trade Creditors 33.146 16.577 100.0%Short Term Borrowings 103.820 30.807 237.0% Short Term Borrowings 89.555 30.807 190.7%Other Credit Balance 527.417 622.734 -15.3% Other Credit Balance 527.874 622.734 -15.2%Working Capital 153.975 159.736 -3.6% Working Capital 167.095 159.736 4.6%Net Assets 136.414 150.255 -9.2% Net Assets 139.196 150.255 -7.4%http://www.proshareng.com/investors/company.php?ref=NIGROPEShttp://www.proshareng.com/investors/company.php?ref=NIGROPESThe <strong>Monthly</strong> <strong>NCM</strong> <strong>Report</strong> <strong>for</strong> <strong>Nov</strong> <strong>2010</strong> www.proshareng.com Page 33
<strong>Nov</strong>ember 25th, <strong>2010</strong>: RESORT SAVINGS & LOANS PLC<strong>Nov</strong>ember 26th, <strong>2010</strong>: DN MEYER PLCTHIRD QUARTER REPORT FOR THE PERIOD ENDED 30-SEP-10FIRST QUARTER REPORT FOR THE PERIOD ENDED 30-SEP-10<strong>2010</strong> N'm 2009 N'm % Change <strong>2010</strong> N'm 2009 N'm % ChangeGross Earning 859.397 854.719 0.55% Gross Earnings 831.612 1,526 -45.50%Profit Be<strong>for</strong>e Tax 208.767 330.515 -36.84% Profit Be<strong>for</strong>e Tax (196.380) (76.890) -155.40%Taxation Nil Nil 0.00% Taxation (5.559) (5.559) 0.00%Profit/Loss After Tax 208.767 330.515 -36.84% Profit/Loss After Tax (201.939) (82.449) -144.93%Balance Sheet In<strong>for</strong>mationBalance Sheet In<strong>for</strong>mationFixed Assets 340.115 245.556 11.14% Fixed Assets 1,935 2,001 -3.30%Stock 716.515 1,046 1.08% Stocks 415.221 402.542 3.15%Trade Debtors 1,109 2,247 27.69% Trade Debtors 67.595 219.040 -69.14%Cash and Bank Balances 837.47 1,849 -52.52% Cash and Bank Balances 215.147 13.685 1472.14%Other Debit Balances 7,519 3,723 4.75% Trade Creditors 424.650 408.538 3.94%Trade Creditors 925.467 424.496 19.30% Short Term Borrowings 802.257 730.128 9.88%Other Credit Balances 8,881 7,641 76.82% Other Credit Balances 801.284 691.351 15.90%Net Assets 7,084 7,106 0.48% Working Capital (870.259) (854.781) -1.81%http://www.proshareng.com/investors/company.php?ref=RESORTSAL Net Assets 605.064 807.003 -25.02%http://www.proshareng.com/investors/company.php?ref=DNMEYER<strong>Nov</strong>ember 26th, <strong>2010</strong>: MTI PLC<strong>Nov</strong>ember 26th, <strong>2010</strong>: EVANS MEDICAL PLCTHIRD QUARTER REPORT FOR THE PERIOD ENDED 30-SEP-10THIRD QUARTER REPORT FOR THE PERIOD ENDED 30-SEP-10<strong>2010</strong> N'm 2009 N'm % Change <strong>2010</strong> N'm 2009 N'm % ChangeGross Earnings 650.046 706.446 -7.98% Gross Earnings 2,903 2,770 4.80%Profit Be<strong>for</strong>e Tax (873.228) (28.141) -3003.05% Profit Be<strong>for</strong>e Tax (127.022) (387.568) -67.23%Taxation Nil Nil 0.00% Taxation Nil (3.634) 0.00%Profit/Loss After Tax (873.228) (28.141) -3003.05% Profit/Loss After Tax (127.022) (391.202) -67.53%Balance Sheet In<strong>for</strong>mationBalance Sheet In<strong>for</strong>mationFixed Assets 641.598 118.116 443.19% Fixed Assets 1,534 1,683 -8.85%Stocks 135.464 231.922 -41.59% Stocks 1,457 1,510 -3.51%Trade Debtors 2,491 2,330 6.91% Trade Debtors 661.864 673.553 -1.74%Cash and Bank Balances 545.894 2,273 -75.98% Cash and Bank Balances 318.072 136.526 132.98%Other Debit Balances 1,195 420.134 184.43% Other Debit Balances 526.457 256.005 105.64%Trade Creditors 300.714 20.669 1354.90% Trade Creditors 312.181 290.246 7.56%Short Term Borrowings 522.338 618.104 -15.49% Short Term Borrowings 1,137 2,779 -59.09%Other Credit Balances 240.995 236.978 1.70% Other Credit Balances 1,646 1,227 34.15%Working Capital 3,258 4,380 -1.81% Working Capital 104.373 (1,463) 107.13%Net Assets 3,946 4,498 -12.27% Net Assets 1,419 (65.807) 2256.31%http://www.proshareng.com/investors/company.php?ref=MTIhttp://www.proshareng.com/investors/company.php?ref=EVANSMED<strong>Nov</strong>ember 26th, <strong>2010</strong>: ACADEMY PRESS PLC<strong>Nov</strong>ember 26th, <strong>2010</strong>: ALUMACO PLCSECOND QUARTER REPORT FOR THE PERIOD ENDED 30-SEP-10AUDITED REPORT FOR THE PERIOD ENDED 31-DEC-09<strong>2010</strong> N'm 2009 N'm % Change 2009 N'm 2008N'm % ChangeGross Earning 1,245 1,086 14.64% Gross Earning 312.02 664.91 -53.07%Profit/Loss After Tax 67.00 67.40 -0.59% Profit/Loss After Tax (229.85) (133.00) -72.82%http://www.proshareng.com/investors/company.php?ref=ACADEMYhttp://www.proshareng.com/investors/company.php?ref=ALUMACO<strong>Nov</strong>ember 29th, <strong>2010</strong>: NIGERIA ENALMELWARE PLC30th <strong>Nov</strong>ember, <strong>2010</strong>: STANDARD ALLIANCE INSURANCE PLCTHIRD QUARTER REPORT FOR THE PERIOD ENDED 31-JAN-10THIRD QUARTER REPORT FOR THE PERIOD ENDED 30-SEP-10<strong>2010</strong> N'm 2009 N'm % Change <strong>2010</strong> N'm 2009 N'm % ChangeGross Earnings 1,823 1,631 11.77% Turnover 3,058 1,397 118.9%Profit Be<strong>for</strong>e Tax 70.227 54.492 28.88%Profit Be<strong>for</strong>e Tax AndExtra-ordinary Items 1,025 1,251 -18.1%Taxation (22.473) (17.636) -27.43% Exceptional Items (10.254) Nil 0.0%Profit/Loss After Tax 47.754 36.856 29.57% Profit Be<strong>for</strong>e Taxation 1,015 1,251 -18.9%Balance Sheet In<strong>for</strong>mationTaxation (91.876) (2,924) 96.9%Fixed Assets 40.505 41.780 -3.05% Profit/Loss After Tax 923.279 -1673 -155.2%Stocks 499.580 276.291 80.82%Balance Sheet In<strong>for</strong>mationTrade Debtors 499.580 276.291 80.82% Fixed Assets 1,160.000 968.723 19.7%Cash and Bank Balances 3.206 101.168 -96.83% Stocks 10,917 10,889 0.3%Other Debit Balances 663.525 724.693 -8.44% Trade Debtors 4,605 3,724 23.7%Trade Creditors 47.447 572.908 -91.72% Cash and Bank Balances 175.679 80.518 118.2%Short Term Borrowings 827.170 300.595 175.18% Other Debit Balances 3,167 3,079 2.9%Other Credit Balances 110.394 96.378 14.54% Trade Creditors 602.375 465.411 29.4%Working Capital 197.055 138.926 -1.81% Short Term Borrowings 0.262 3.667 -92.9%Net Assets 221.805 174.051 27.44% Other Credit Balances 2,173 1,840 18.1%http://www.proshareng.com/investors/company.php?ref=ENAMELWAWorking Capital 15,175 14,292 6.2%Net Assets 17,250 16,432 5.0%http://www.proshareng.com/investors/company.php?ref=STDINSUREThe <strong>Monthly</strong> <strong>NCM</strong> <strong>Report</strong> <strong>for</strong> <strong>Nov</strong> <strong>2010</strong> www.proshareng.com Page 34
30th <strong>Nov</strong>ember, <strong>2010</strong>: STARCOMMS PLC30th <strong>Nov</strong>ember, <strong>2010</strong>: ANINO INTERNATIONAL PLCTHIRD QUARTER REPORT FOR THE PERIOD ENDED 30-SEP-10FIRST QUARTER REPORT FOR THE PERIOD ENDED 31-MAR-10<strong>2010</strong> N'm 2009 N'm % Change <strong>2010</strong> N'm 2009 N'm % ChangeTurnover 23,966 25,621 -6.5% Turnover 8.03 Nil 0.0%Profit Be<strong>for</strong>e Tax (4,854) (4,802) 1.1% Profit Be<strong>for</strong>e Tax 0.84 Nil 0.0%Taxation (188.627) Nil 0.0% Taxation Nil Nil 0.0%Profit/Loss After Tax (5,042) (4,802) 5.0% Profit/Loss After Tax 0.84 Nil 0.0%Balance Sheet In<strong>for</strong>mationBalance Sheet In<strong>for</strong>mationFixed Assets 49,190 53,989 -8.9% Fixed Assets Nil Nil 0.0%Stocks 1,883 2,535 -25.7% Stocks 4.05 Nil 0.0%Trade debtors 5,441 4,344 25.3% Trade debtors 2.10 Nil 0.0%Cash and Bank Balances 1,507.000 2,225 -32.3% Cash and Bank Balances 2.1 0.11 1790.9%Other Debit Balances 50,311 10,491 379.6% Other Debit Balances 0.450 Nil 0.0%Trade Creditors 3,072 1,512 103.2% Trade Creditors 2.03 Nil 0.0%Short Term Borrowings 19,184 11,761 63.1% Short Term Borrowings 3.0 3.0 0.0%Other Credit Balances 7,456 7,471 -0.2% Other Credit Balances 7.8 1.1 609.1%Working Capital (19,760) (7,006) 182.0% Net Assets 9.8 9.9 -0.8%Net Assets 20,206 31,249 -35.3%http://www.proshareng.com/investors/company.php?ref=ANINOhttp://www.proshareng.com/investors/company.php?ref=STARCOMMS30th <strong>Nov</strong>ember, <strong>2010</strong>: ANINO INTERNATIONAL PLCSECOND QUARTER REPORT FOR THE PERIOD ENDED 30-JUN-10<strong>2010</strong> N'm 2009 N'm % ChangeTurnover 53.27 Nil 0.0%Profit Be<strong>for</strong>e Tax 0.371 Nil 0.0%Taxation Nil Nil 0.0%Profit/Loss After Tax 0 Nil 0.0%Balance Sheet In<strong>for</strong>mationFixed Assets 25 Nil 0.0%Stocks 50.37 Nil 0.0%Trade debtors 2.88 Nil 0.0%Cash and Bank Balances 2.2 0.11 1900.0%Trade Creditors 3.51 Nil 0.0%Short Term Borrowings 3.0 3.0 0.0%Other Credit Balances 8 1 656.4%Net Assets 34.64 9.88 250.6%http://www.proshareng.com/investors/company.php?ref=ANINOThe <strong>Monthly</strong> <strong>NCM</strong> <strong>Report</strong> <strong>for</strong> <strong>Nov</strong> <strong>2010</strong> www.proshareng.com Page 35
Forecast Results in the MonthDECLARED FORECASTS FOR NOVEMBERGross EarningsCompany Year End Period in N' billionPAT in N'billionBOC Gases Plc December Q4 2.214 0.278Oceanic Bank Intl Plc December Q4 126.364 43.862Livestock Feeds Plc September Q2 0.641 0.15Dangote Cement Plc December Q4 17.841 4.213Eterna Oil Plc December Q3 21.986 0.41Cutix Plc April Q4 0.451 NilSource: <strong>Proshare</strong> Research/NSEDividends DeclaredDIVIDENDS DECLARED FOR NOVEMBERCompany Dividend Declared Bonus Declared AGM Date Price Adjustment DateCAP Plc N1.00 16th - 19th <strong>Nov</strong>ember, <strong>2010</strong>Interlinked Technologies Plc 16th Dec, <strong>2010</strong>The Tourist Company of Nig Plc 14th Dec, <strong>2010</strong>Tripple Gee & Company Plc 30th <strong>Nov</strong>, <strong>2010</strong>Evans Medical Plc 24th Feb, 2011Scoa Nigeria Plc 9th Dec, <strong>2010</strong>Guinea Insurance Plc 1k 16th Dec, <strong>2010</strong> 7th to 11th Dec, <strong>2010</strong>Standard Alliance Insurance Plc 9th Dec, <strong>2010</strong>Total Plc 200k 30th <strong>Nov</strong>ember <strong>2010</strong>Pharma-Deko Plc 17th Dec, <strong>2010</strong>Union Bank Plc 16th Dec, <strong>2010</strong>Vono Products Plc 15th Dec, <strong>2010</strong>Sovereign Trust Insurance Plc 8th Dec, <strong>2010</strong>Union Diagnostic & Clinical Services Plc 20th Dec, <strong>2010</strong>MTI Plc 29th Dec, <strong>2010</strong> 6th to 14th Dec, <strong>2010</strong>Source: <strong>Proshare</strong> Research/NSEThe <strong>Monthly</strong> <strong>NCM</strong> <strong>Report</strong> <strong>for</strong> <strong>Nov</strong> <strong>2010</strong> www.proshareng.com Page 36
Outlook /Analyst OpinionThe turbulence witnessed in the early stage of the market activities, during the monthunder review, has been a reflection of significant speculative tendency of short termtraders. This has been buttressed with the up and down swings experienced in themovement of All Share Index. Though, this was expected on the heels of impressivegains recorded in the previous month which closed the month on speculative note asprofit takers showed late interest in harvesting the yield <strong>for</strong> the period.This sentiment got distorted by AMCON’s valuation model <strong>for</strong> the pricing of the toxicassets in the banking industry as investors and the banks engaged in the panic selling asa way of adjusting to the pricing valuation proposed by the ‘Bad Bank’. The bleedingscenario lasted <strong>for</strong> uninterrupted 7days. Also, the “closing of books” by someinstitutional investors <strong>for</strong> the <strong>2010</strong> financial year contributed its quota to the trend.This in our opinion was one of the factors expected to impact the market in the monthunder review and play a key role in the recapitalisation or sale of the banks, particularlythe rescued banks as stated in our October report. http://proshareng.com/reports/3003Going <strong>for</strong>ward, has the stage is set <strong>for</strong> the absorption of toxic assets which is expectedto ease the tight liquidity situation in the sector and relief the cleared banks of debtburden, coupled with the ongoing discussion on merger and acquisition, the capitalmarket activity is likely to gain more upward momentum with possible volatile sessionsbecause both speculators and value investors would dominate the stage while events areunfolding, just as observed on rescued banks recently. But on the other hand, shouldAMCON take equity stake in those rescued banks; this might reverse the expected trend.http://proshareng.com/blog/?p=476Still on the possible volatile session mentioned above, the CBN maintained its positiontowards anticipated inflation growth by leaving the MPR unchanged at 6.25% asexpected but with slight increase in SDF (Standing Deposit Facility). With this,conservative investors are likely to patronise banks as a result of possible attractiveinterest on deposit, also the bond market is likely to gain more attention from investors.This further suggests that the capital market might witness a drop in liquidity levels,compounding the existing low liquidity issue. But we cautiously remain optimistic aboutupward movement as the capital market remains the only possible outlet <strong>for</strong> higherreturns.The concerns about corporate governance and financial issues with and within theSEC/NSE recently http://www.proshareng.com/articles/2187 has created concerns which are nowbeing addressed through engagements. We however do not expect this and other nonstockrelated issues to have a negative impact as the effect of impeding M&A’s andplanned recapitalisation of the banks should override any rumble. To this regards,tightening of bolts on compliance and corporate governance issues in the financialindustry and improved transparency in the market will boost the participation of valueinvestors, particularly the <strong>for</strong>eign investors.Conclusively, the mixed outlook is likely to influence the market sentiments which mightset the stage <strong>for</strong> further volatility in the last month of the year. Despite this, there ispossibility of price appreciation as market swings occur. Also, the expectation ofimpressive Q4 earnings report in the month ahead could encourage moderate buying aslots of good companies have their financial year ends in the coming month.The <strong>Monthly</strong> <strong>NCM</strong> <strong>Report</strong> <strong>for</strong> <strong>Nov</strong> <strong>2010</strong> www.proshareng.com Page 37
Time Lines - (News/In<strong>for</strong>mation in the month and Reaction of Market)Date Timelines Gainers Losers ASI and Market Capitalisation Remarks<strong>Nov</strong> 1 Naira Strengthens at Inter-bank Market- The Nigerian currency, the naira,appreciated at the inter-bank market last week as it climbed to N150.44 to a dollar lastFriday. The value of the local currency as at Friday, represented an appreciation of N1.71,compared with the N152.15 to a dollar it traded on the last business day of the precedingweek.<strong>Nov</strong> 2Nigerian Equities Maintain Winning Streak- The Nigerian equities market continued itsrally last week fueled by a combination of factors, which include strong corporate earningsand assurance by dealing firms of investors’ safety in the market.No Rift with Stockbrokers, Says NSE DG- The Interim Administrator of the NigerianStock Exchange (NSE), Mr. Emmanuel Ikazoboh, has said that there is no rift with theChartered Institute of Stockbrokers (CIS), over demands to have a new director generalappointed by year-end.Ikazoboh, who made this known in a chat with newsmen, said he is not aware that the CIShas made submission to the Securities and Exchange Commission (SEC) in that respect aswas being speculated.Bonus sharing: How NSE may have defied corporate governance- The report byAkintola Williams Deloitte on the four year financial statement of the Nigerian StockExchange (NSE), has revealed how the <strong>for</strong>mer management of the Exchange may havedefied the tenet of good corporate governance.Money market investors reap higher returns as rates rise- Following the upwardrevision of the MPR and hike in Standard Deposit Rate from 3 to 3.25 percent rates inchedup with 7-day NIBOR closing 9.50%, a 58 basis point increase from 8.92% earlier , while90-day NIBOR closed at 12.93%, a 55 basis point increase from the previous 12.38%. Atthe 91-day Treasury Bill (TB) auction, securities were offered and sold at a discount rate of6.593%.Bond yield to rise on tight monetary policy- Insinuations in the financial circle thatspike in money market rates may depress investments in bond may not be true <strong>for</strong> alltenors of bonds, operators have said. The perception that rise in average Interbank ratesto 7 percent could lead to portfolio reshuffling in favour of the money market was borneout of the understanding that both markets are competitive in nature.CBN engages specialists to en<strong>for</strong>ce corporate governance code- Dissatisfied withthe level of banks’ compliance with the new code of corporate governance, the CentralBank of Nigeria (CBN) is in the process of engaging specialists to oversee and review thepractice in the industry on a continuous basis.Exchange’s boss urges firms to list shares, as market capitalisation rises- THEInterim Administrator of the Nigerian Stock Exchange (NSE), Mr. Emmanuel Ikazoboh, hasurged firms to apply <strong>for</strong> listing of their shares on the Exchange, as the Exchange admittedinto its daily official list, 3.7 billion shares of Multi-Trex Integrated Foods Plc by a way ofThe <strong>Monthly</strong> <strong>NCM</strong> <strong>Report</strong> <strong>for</strong> <strong>Nov</strong> <strong>2010</strong> www.proshareng.com Page 3832 15 At the close of trading session, the NSE All-ShareIndex gained by 0.24% to close at 25,102.20 asagainst a marginal decline by -0.10% recorded onFriday to close at 25,042.16. In the same vein,market capitalization increased by N30.33billion (US$205.62 million) to close at N8.01trillion (US$54.30 billion) as against decline ofN8.15 billion (US$55.28 million) recorded previoussession to close at N7.98 trillion (US$54.10billion).Market report <strong>for</strong> the day was titled: Market CapHits N8trillion, as First Bank Plc grows profitby507.43%(http://www.proshareng.com/news/12472)27 25 At the close of trading session, the NSE All-ShareIndex dropped by -1.19% to close at 24,804.22as against an upbeat by 0.24% recorded previoussession to close at 25,102.20. In the same vein,market capitalization declined by N92.05 billion(US$623.89 million) to close at N7.98 trillion(US$53.68 billion) as against a gain of N30.33billion (US$205.62 million) recorded yesterday toclose at N8.01 trillion (US$54.30billion). Marketreport <strong>for</strong> the day was titled: All Share Indexreclines by -1.19%, as Dangote Cement Plcleads decliners by5.00%.(http://www.proshareng.com/news/12485 )
<strong>Nov</strong> 3<strong>Nov</strong> 4introduction. Precisely, the shares of the company were listed at the rate of N3.00 pershare, as the number of listed equities increased by one, while the capitalisation of listedequities increased by N11.2 billion by the action of the Exchange.NSE blames market crisis on N700bn private placements- The Sole Administrator ofthe Nigerian Stock Exchange (NSE), Mr Emmanuel Ikazoboh, on Monday, blamed thedecline in the market on the loss of investors’ fund estimated at N700 billion invested invarious private placements in the boom period prior to the 2008 crisis.Firms to Resume Public Offerings in Q1 2011- Encouraged by the current positive runin the stock market and ef<strong>for</strong>ts by the Nigerian Stock Exchange (NSE) to sustain thetrend, companies are preparing to access the market <strong>for</strong> fresh funds early 2011,THISDAY checks has revealed.Wema Bank Raises Regional Banking Capital- Wema Bank has attained andmarginally exceeded the N10 billion minimum capital set <strong>for</strong> regional banking under thespecialised banking model introduced by the Central Bank of Nigeria (CBN) recently.Private Placements Liable <strong>for</strong> Stock Mkt Plunge – NSE- Interim Administrator of theNigerian Stock Exchange (NSE), Mr. Emmanuel Ikazoboh, has said that over 40 per cent ofthe plunge in the capital market was as a result of monies tied to private placements thatare not listed on the NSE.Market infractions: Disquiet as SEC releases incomplete offenders’ list- TheSecurities and Exchange Commission has released 36 more names from the list of 260entities and individuals it dragged to the Investments and Securities Tribunal on July 27,<strong>2010</strong> <strong>for</strong> alleged violation of capital market rules.New listings signal investors’ renewed confidence – Ikazoboh- The InterimAdministrator of the Nigerian Stock Exchange, Mr. Emmanuel Ikazoboh, said on Tuesdaythat investor confidence had fully returned to the capital market.First Bank emerges NSE’s most active stock in October- FIRST Bank of Nigeria Plc, inOctober, emerged as the most active stock on the floor of Nigerian Stock Exchange (NSE),with transactions volume of 443.82 million shares.Share manipulation: SEC drags Ebong, Union Bank directors, others to court-Securities and Exchange Commission has dragged <strong>for</strong>mer Union Bank Managing DirectorBartholomew Bassey Ebong, Samuel Idowu Ayininuola, Austin Iheanyi Obigwe, KennethSola Adeyemi, Ado Abdullahi, Ebenezer Uzoma Emeruem, directors of the bank, and thoseof Union Trustees and Falcon Securities be<strong>for</strong>e the Investment and Securities Tribunal oncharges of share price manipulation at the capital market.Stock Exchange engaged in culture of dubious spending- A report by <strong>for</strong>emost auditfirms, KPMG and Akin Oyebode & Co, on the activities of the Nigerian Stock Exchange(NSE), has unearthed a lot of questionable spending amounting to billions of naira.AMCON commences operation as Senate approves 10-member board-•First priorityis bad loans at distressed banks. The Senate on Wednesday approved a <strong>for</strong>mer GoldmanSachs banker to run a state- owned “bad bank” Asset Management Corporation of Nigeria(AMCON), paving the way <strong>for</strong> it to begin absorbing non-per<strong>for</strong>ming loans from lendersrescued in last year’s $4 billion (N620 billion) bailout. The firm is starting workimmediately.29 20 At the close of trading session, the NSE All-ShareIndex dropped by -0.09% to close at 24,782.90as against a decline of -1.19% recorded previoussession to close at 24,804.22. In the same vein,market capitalization declined by N6.80 billion(US$46.15 million) to close at N7.91 trillion(US$53.63 billion) as against a loss of N92.05billion (US$623.89 million) recorded yesterday toclose at N7.92 trillion (US$53.68 billion). Marketreport <strong>for</strong> the day was titled: Market slidesfurther by -0.09%, as Fidelity Bank Plcrecords profit growth by 85.97%(http://www.proshareng.com/news/singlenews.php?id=12500 )26 29 At the close of trading session, the NSE All-ShareIndex upswing by 0.16% to close at 24,822.03 asagainst a decline of -0.09% recorded previoussession to close at 24,782.90. In the same vein,market capitalization gained by N12.49 billion(US$84.69 million) to close at N7.92 trillion(US$53.72 billion) as against a loss of N6.80 billion(US$46.15 million) recorded yesterday to close atN7.91 trillion (US$53.63 billion). Market report <strong>for</strong>The <strong>Monthly</strong> <strong>NCM</strong> <strong>Report</strong> <strong>for</strong> <strong>Nov</strong> <strong>2010</strong> www.proshareng.com Page 39
<strong>Nov</strong> 5<strong>Nov</strong> 8<strong>Nov</strong> 9SEC probes culpability of NSE Consult in insider trading-•N1.6bn spent on dubiousCoral Property Project •N10.4m spent on diesel in one month •More searches oncompanies used as fronts. The interim report of the <strong>for</strong>ensic audit commissioned by theSecurities and Exchange Commission (SEC) on the activities of the Nigerian StockExchange (NSE) is expected to unravel the extent to which NSE Consult, a wholly ownedsubsidiary of the Exchange, was used as a tool <strong>for</strong> insider trading.How NSE answers questions about dematerialisation of shares in a CentralSecurities Depository- What are the charges to be paid <strong>for</strong> opening an account and todematerialise one’s physical shares? Will there be any charges <strong>for</strong> each transaction? EachDepository Participant (DP) can levy charges by way of account opening fees, transactionfees, custody fees and so on. The charges differ from Depository Participant to DepositoryParticipant and there<strong>for</strong>e, you will have to contact your DP <strong>for</strong> the same.CBN to Float Microfinance Fund- The Central Bank of Nigeria (CBN) is to establish amicrofinance fund to support medium to long term lending by microfinance institutions.NSE DG: Committee Concludes Applications’ Screening-As the capital marketcommunity and other stakeholders eagerly await the appointment of a substantive CEO <strong>for</strong>the NSE, THISDAY can report that the waiting would soon end. Sources close to thecommittee set up to screen all the applications <strong>for</strong> the job, said that the screening exercisehas been concluded.Margin Loan: CBN, SEC to Issue Fresh Guidelines-The CBN has said that it wasworking with the SEC to issue out a fresh guideline to limit all capital market related loansto a maximum of 10 per cent of the loan book of both banks and stock-broking firms. TheGovernor of the CBN, Mallam Lamido Sanusi, disclosed this in his address presented at theCIBN 44th Annual Bankers dinners, held at the weekend in Lagos. The CBN helmsman alsowarned banks against an impending bubble in the fixed income securities market.NSE Paid N134m <strong>for</strong> ‘Fictitious’ Bullet-proof Cars-The <strong>for</strong>ensic audit of the NSEordered by the SEC has revealed that the <strong>for</strong>mer DG of the NSE, Mrs. Ndi Okereke-Onyiuke, purchased two bullet-proof Cadillac Escalade cars <strong>for</strong> N134 million in 2007.NSE checks excess spending with new internal audit unit-Determined to <strong>for</strong>estallthe regime of blanket approvals which characterized the immediate past administration ofthe NSE, its interim management has appointed internal auditors <strong>for</strong> the bourse,BusinessDay learnt at the weekend.AMCON Releases Valuation <strong>for</strong> Purchase of Banks’ Loans-The Board of the AMCONhas announced valuation methodology <strong>for</strong> the purchase of NPLs of the banking system. Ithas also stated its readiness to buy all the margin loans in the banking sector and all theNPLs of the rescued banks, both totalling in excess of N2.2 trillion. Decisions on the loansvaluation mythology and the amount under purchase were taken at the first board meetingof the AMCON in Abuja yesterday.the day was titled: ASI regains its strength by0.16% upbeat as CAP Plc rewards investorswith N1.00 dividend.(http://www.proshareng.com/news/12517)31 21 The All-Share Index in the week under reviewdropped by -0.97% to close at 24,800.47 asagainst an upbeat of 0.25% recorded last week toclose at 25,042.16In the same vein, the market capitalization in theweek depreciated by N62.91 billion (US$436.38million) to close at N7.91 trillion (US$ 53.67 billion)as against a gain of N1.86 billion (US$12.62million) recorded last week to close at N7.98 trillion(US54.10 billion). Market report <strong>for</strong> the week wastitled: Capital Market slides by -0.97, asBankPHB Plc leads gainers <strong>for</strong> the week.(http://www.proshareng.com/news/12527)20 36 At the close of trading session, the NSE All-ShareIndex declined by -0.29% to close at 24,728.08as against a decline of -0.09% recorded previoussession to close at 24,800.47. In the same vein,market capitalization dropped by N23.11billion(US$156.68 million) to close at N7.89 trillion(US$53.51 billion) as against a loss of N6.88 billion(US$46.64 million) recorded on Friday to close atN7.91 trillion (US$53.63 billion). Market report <strong>for</strong>the day was titled: Spring Bank Plc grows PATby 111.4% as Market CAP sheds N23.11billion(http://proshareng.com/news/12533)43 20 At the close of trading session, the NSE All-ShareIndex moved up significantly by 2.65% to close at25,383.37 as against a decline of -0.29% recordedprevious session to close at 24,728.08. In the samevein, market capitalization gained byN209.25billion (US$1.41 billion) to close at N8.10The <strong>Monthly</strong> <strong>NCM</strong> <strong>Report</strong> <strong>for</strong> <strong>Nov</strong> <strong>2010</strong> www.proshareng.com Page 40
<strong>Nov</strong> 10<strong>Nov</strong> 11Capital market: Okereke-Onyiuke, four others shared N1.13bn – <strong>Report</strong>-Five topofficials of the NSE allegedly shared N1.13bn productivity allowance between 2006 and2008, findings by <strong>for</strong>ensic auditors appointed by the SEC to audit the accounts of theExchange have revealed. A copy of the auditors’ report, obtained by PUNCHcorrespondents on Monday, alleged that the immediate past DG, NSE, Prof. Ndi Okereke-Onyiuke, was paid N592.55m in the three years, representing 52 per cent of the totalamount shared.AMCON takes off with three major operational policies-The Board of the AMCONyesterday swung into business, swiftly rolling out three major policy decisions. In its first<strong>for</strong>mal meeting concluded late last night in Abuja, the board announced that AMCON willvalue NPLs backed by shares of listed companies at an implied premium of approximately60 percent on the 60-day average of recent prices ending <strong>Nov</strong>ember 15th <strong>2010</strong>, whilethose backed by other perfected collateral would be accepted at the most current estimateof the loan value supplied by the institution, but <strong>for</strong> this category, AMCON put a caveat,"there must be a post-transaction adjustment agreement that allows AMCON toindependently value the loan as of the transaction date of <strong>Nov</strong>ember 15th <strong>2010</strong>."AMCON to Convert Rescued Banks’ Bad Loans to Equity-The AMCON has said thetoxic assets of the rescued banks by the CBN will be taken over by the corporation andconverted to equity. CE of AMCON, Mustafa Chike Obi, was quoted by Reuters to have toldCNBC Africa television yesterday.NSE May Defer Policy on Price Cap-The NSE may defer its plans to raise the daily pricemovement limit from the current five per cent to 10 per cent and lengthening tradinghours following the advice from stockbrokers.CBN’s new banking model kicks off <strong>Nov</strong>. 15-From <strong>Nov</strong>ember 15, <strong>2010</strong>, universalbanking in the country will cease. In its place will be the new banking model that the CBNhas designed to keep the financial sector on an even keel.Withdrawal of Class ‘A’ Licences Opens Forex Mkt- After three days of <strong>for</strong>eignexchange transactions without the old categorisation of the Bureau De Change segmentinto Class ‘A’ and ‘B’, operators said the market has opened up the more, with healthycompetition injected in it.DMO revises auction sells N70.3 billion <strong>for</strong> <strong>Nov</strong>ember-The DMO is set to raise atotal of N70.31 billion through the bond auction as announced by a revised auction circular<strong>for</strong> <strong>Nov</strong>ember.trillion (US$54.93 billion) as against a loss ofN23.11 billion (US$156.68 million) recordedyesterday to close at N7.89 trillion(US$53.51billion). Market report <strong>for</strong> the day wastitled: Equity market surged by 2.65% asAMCON sets to absorb bad loans(http://proshareng.com/news/12539)48 21 At the close of trading session, the NSE All-ShareIndex moved up by 0.13% to close at 25,416.21as against an impressive upbeat of 2.65% recordedprevious session to close at 25,383.37. In the samevein, market capitalization gained byN10.48billion (US$71.07 million) to close at N8.11trillion (US$55.00 billion) as against an appreciationof N209.25 billion (US$1.41 billion) recordedyesterday to close at N8.10 trillion(US$54.93billion). Market report <strong>for</strong> the day wastitled: ASI climbs further by 0.13% as OceanicBank Plc ticks 186% price appreciation in 30sessions(http://www.proshareng.com/news/12545)49 14 At the close of trading session, the NSE All-ShareIndex moved up by 1.87% to close at 25,891.13as against a modest upbeat of 0.13% recordedprevious session to close at 25,416.21. In the samevein, market capitalization gained byN151.65billion (US$1.02 billion) to close at N8.26trillion (US$56.03 billion) as against an appreciationof N10.48 billion (US$71.07 billion) recordedyesterday to close at N8.11 trillion(US$55.00billion). Market report <strong>for</strong> the day wastitled: Equity Market consolidates position withN151.65 billiongain.(http://www.proshareng.com/news/12552)The <strong>Monthly</strong> <strong>NCM</strong> <strong>Report</strong> <strong>for</strong> <strong>Nov</strong> <strong>2010</strong> www.proshareng.com Page 41
<strong>Nov</strong> 12<strong>Nov</strong> 15<strong>Nov</strong> 18Conoil begins online registration of shareholders-To further upgrade and modernizeits in<strong>for</strong>mation database; Conoil plc has commenced online registration of its shareholders.Foreign suitors emerge <strong>for</strong> Bank PHB, Union Bank-Two of Nigeria’s ninerescued banks are in talks with <strong>for</strong>eign investors about recapitalization but most of theothers are more likely to be taken over by local rivals, banking sources said on Thursday.CBN releases guidelines <strong>for</strong> new banking model-The CBN has released the rules andregulation governing the implementation of the modified universal banking model which isbilled to take off Monday.AMCON: Fitch sees hope in banking sector-Fitch Ratings say that the AMCON recentguidance on the purchase of non-per<strong>for</strong>ming loans from Nigeria’s failed banks was apositive first step in addressing the uncertainty affecting the institutions.Operators decry delay in naming capital market head-Some capital market operatorshave raised concern over the delay in the appointment of a permanent head <strong>for</strong> the NSE,despite the initial promise by the SEC that the process will be done quickly.Total net assets of ‘strong banks’ hit N1.89tn-The total net assets of the 12 publiclyquoted banks that passed the CBN‘s stress test have increased in value to N1.89tn,investigation by our correspondent has revealed.AMCON to sell bonds to fund operations -The Asset Management Corporation ofNigeria has said that it will sell at least five tranches of bonds to fund its operations.Capital market: More re<strong>for</strong>ms coming – Oteh -he DG, SEC, Ms. Arunma Oteh, has saidthat more re<strong>for</strong>ms will soon take place in the Nigerian capital market.New NSE CEO Emerges Q1 2011, Says Ikazoboh-The Interim Administrator of theNSE, Mr. Emmanuel Ikazoboh yesterday said that the capital market community andstakeholders should expect a substantive CEO <strong>for</strong> the Exchange in the first quarter of2011.SEC will sustain re<strong>for</strong>ms in Nigeria’s capital market, says Oteh –The SEC said itwould sustain the ongoing re<strong>for</strong>ms in the Nigerian capital market. Speaking with thedelegation of the Board of Governors of the Pearl Awards recently, at SEC’s corporate headoffice, in Abuja, the Director-General of the commission, Arunma Oteh, said the job oftrans<strong>for</strong>ming the Nigerian capital market is one that she had dedicate her life to, addingthat she also agreed that there was need to identify companies and institutions thatper<strong>for</strong>med well.CBN pegs rescued banks’ prospects on repositioning ef<strong>for</strong>ts-The sale of eight34 31 The All-Share Index in the week under reviewgained by 2.29% to close at 25,367.83 as againsta decline of -0.97% recorded last week to close at24,800.47In the same vein, the market capitalization in theweek depreciated by N181.17 billion (US$1.22billion) to close at N8.10 trillion (US$ 54.90 billion)as against a depreciation of N62.91 billion(US$436.38 million) recorded last week to close atN7.91 trillion (US53.67 billion). Market report <strong>for</strong>the week was titled: All Share Index climbs by2.29% as bargain tendency dominates theweek.(http://www.proshareng.com/news/singlenews.php?id=12559)31 29 At the close of trading session, the NSE All-ShareIndex moved down by -0.26% to close at25,301.34 as against a decline of -2.02% recordedprevious session to close at 25,367.83. In the samevein, market capitalization depreciated byN21.23billion (US$143.91 million) to close atN8.07 trillion (US$54.75 billion) as againstdepreciation of N167.10 billion (US$1.13 billion)recorded on Friday to close at N8.10 trillion(US$54.90billion). Market report <strong>for</strong> the day wastitled: Nigerian Equity Market treadssouthward by -0.26% as festive mood setsin.(http://www.proshareng.com/news/singlenews.php?id=12575)28 33 At the close of trading session, the NSE All-ShareIndex moved down by -0.46% to close at25,184.13 as against a decline of -0.26% recordedprevious session to close at 25,301.34. In the samevein, market capitalization depreciated byN37.24billion (US$252.44 million) to close atN8.04 trillion (US$54.50 billion) as againstdepreciation of N21.23 billion (US$143.91 million)recorded on Monday to close at N8.07 trillion(US$54.75billion). Market report <strong>for</strong> the day wastitled: Capital Market drops further by -0.46%as sell-traders consolidateThe <strong>Monthly</strong> <strong>NCM</strong> <strong>Report</strong> <strong>for</strong> <strong>Nov</strong> <strong>2010</strong> www.proshareng.com Page 42
<strong>Nov</strong> 19<strong>Nov</strong> 22<strong>Nov</strong> 23rescued banks may have been put on hold by the CBN, following the apex bank’s re-think,based on the recent ef<strong>for</strong>ts of the financial institutions to reposition their respectiveportfolios <strong>for</strong> more viable ventures.SEC, NSE to brief National Assembly on market developments -The DG of the SEC,Ms Arunma Oteh, and the Interim Administrator of the NSE, Mr. Emmanuel Ikazoboh, willon Tuesday brief the National Assembly on the operations of the NSE and the capitalmarket in the last 100 days.NSE to delist more moribund companies -Following their inability to meet the postlistingrequirements of the NSE, some moribund companies may be delisted from theNSE’s official list next week. Already, the list of affected companies has been compiled bythe management of the NSE and will be presented to the council on Monday <strong>for</strong>ratification, after which the names will be released to the public.Operators warn against another banking crisis -While the financial market awaits theissuance of the first series of bonds by the AMCON, the focus is on how the bankingindustry will fare after the bad debts are taken off their books. Financial market operatorsspoke of a situation where the regulators still need to keep close watch on the market inorder to prevent a reoccurrence.NSE: Reps’ committee wants Okereke Onyiuke reinstated -The House ofRepresentatives Committee on Capital Market has recommended the reversal of thesacking of the <strong>for</strong>mer DG of the NSE, Prof. Ndi Okereke-Onyiuke.Capital market: 10 listed companies lose N339bn-en newly-listed companies on theNSE have lost 15 per cent of their cumulative listing value in the last one year. Thecompanies, quoted in the First-Tier Securities sector of the NSE between August 2009 and<strong>Nov</strong>ember <strong>2010</strong>, lost N339bn from a cumulative listing value of N2.328tn to close atN1.989tn on Friday. The companies in the newly-listed category are Beco Petroleum Plc,Honeywell Flour Mills Plc, African Alliance Insurance Company Plc, GTA Assurance Plc,Resort Savings and Loans Plc, Unity Kapital Assurance Plc and Union Homes Real EstateInvestment Trust Plc. Others are Dangote Cement Plc, Paints and Coatings ManufacturersNigeria Plc and Multi-Trex Integrated Foods Plc.Ikhazoboh harps on imperatives of demutualisation -The Interim Administrator ofthe NSE, Mr. Emmanuel Ikazoboh, has listed demutualisation as one of the factors thatwould enhance integrity and restore confidence in the Nigerian capital market.Banks to finance critical sectors of economy-Deposit Money Banks, under theumbrella of the Bankers’ Committee, have resolved to provide funding to critical sectors ofthe economy.Okereke-Onyiuke’s removal: We acted within our powers – SEC -The SEC said onMonday that it complied strictly with the provisions of the Investments and Securities Actin removing the <strong>for</strong>mer CEO of the NSE, Prof. Ndi Okereke-Onyiuke.Uncertainty as NSE Holds AGM -As the NSE holds its annual general meeting today,positions(http://www.proshareng.com/news/12585)27 40 The All-Share Index in the week under reviewdropped by -1.61% to close at 24,959.95 asagainst a gain of 2.29% recorded last week to closeat 25,367.83In the same vein, the market capitalization in theweek depreciated by N130.07 billion (US$881.55million) to close at N7.97 trillion (US$ 54.02 billion)as against appreciation of N181.17 billion (US$1.22billion) recorded last week to close at N8.10 trillion(US54.90 billion). Market report <strong>for</strong> the week wastitled: ASI dips by -1.61% <strong>for</strong> the week asTotal Plc rewards shareholders with N2.00dividend(http://www.proshareng.com/news/singlenews.php?id=12598).18 38 At the close of trading session, the NSE All-ShareIndex moved down by -0.32% to close at24,880.86 as against a decline of -0.89% recordedprevious session to close at 24,959.95. In the samevein, market capitalization depreciated byN25.25billion (US$171.15 million) to close atN7.94 trillion (US$53.84 billion) as againstdepreciation of N71.59 billion (US$485.19 million)recorded on Friday to close at N7.79 trillion(US$54.02billion).Market report <strong>for</strong> the day wastitled: Market CAP sheds N322.43billion assell-traders maintained 5days dominance.(http://www.proshareng.com/news/12609)15 46 At the close of trading session, the NSE All-ShareIndex moved down by -1.02% to close at24,626.98 as against a decline of -0.32% recordedprevious session to close at 24,880.86. In the samevein, market capitalization depreciated byN81.07billion (US$549.47 million) to close atN7.87 trillion (US$53.29 billion) as against a loss ofThe <strong>Monthly</strong> <strong>NCM</strong> <strong>Report</strong> <strong>for</strong> <strong>Nov</strong> <strong>2010</strong> www.proshareng.com Page 43
<strong>Nov</strong> 24<strong>Nov</strong> 25<strong>Nov</strong> 26there are fears that the meeting might end in stalemate. MDs and CEOs of dealingmember firms met yesterday to pacify their members who were irked by the shadyarrangement put in place by the Exchange <strong>for</strong> the AGM.Dangote Cement plans London GDR issue -Nigeria’s biggest cement maker DangoteCement will issue Global Depository Receipts to be listed on the London Stock Exchangenext year, its Chairman, Alhaji Aliko Dangote, told Reuters on Tuesday.NSE: Stockbrokers, Council disagreed over 2009 financial results-The crisis rockingthe Nigerian stock market reared its ugly head again in Lagos on Tuesday as stockbrokersand operators openly disagreed with the 2009 financial results of the NSE.Ex-NSE DG: House C’ttee Directive Jolts Stakeholders -Stakeholders in the Nigeriancapital market have expressed shock over the news that the House of RepresentativesCommittee on Capital Market has directed the SEC to revisit its removal of the <strong>for</strong>mer DGof NSE, Mrs. Ndi Okereke-Onyiuke.NSE approved N2.4tn issues in <strong>2010</strong>-The Council of The NSE has considered andapproved a total of 27 applications <strong>for</strong> the issuance of 69.24 billion shares valued at N2.4trillion in <strong>2010</strong>, compared with 30 applications <strong>for</strong> the issuance of 83.9 billion sharesvalued at N279.25 billion recorded in 2009.UACN acquires 51% stake in South African conglomerate-As part of moves toenhance profitability and returns to shareholders, the management of UAC of Nigeria Plc,has agreed in principle to <strong>for</strong>m a strategic partnership with Tiger Brands Limited, a leadingSouth African conglomerate.SEC Spent N40bn in Four Years –House -The SEC generated a total of N40 billionbetween 2006 and <strong>2010</strong> and spent all the money on salaries, wages and other operationalexpenses, House Committee on Capital Market has said.Pen COM to allow <strong>for</strong>eign investments on pension funds-The National PensionCommission has said that plans are on the ways to introduce multi-funds and allow <strong>for</strong>eigninvestments by pension funds.Dangote Cement pays N30.98bn interim dividend -Dangote Cement Plc, a companyrecently quoted in the building materials sub-sector of the NSE has announced an interimdividend of N30.98bn <strong>for</strong> the period ended September 30, <strong>2010</strong>.SEC Clears Past NSE Mgt -The SEC has absolved the management of the NSE under its<strong>for</strong>mer DG, Ndi Okereke-Onyiuke of any financial impropriety from 2006 to 2009. A teamof investigators led by Mrs. A.O Obhielo, however, absolved the Ndi Okereke-Onyiuke ledNSE of any financial misconduct in its findings submitted in October 2009, according todocuments obtained by THISDAY.N25.25 billion (US$171.15 million) recorded onMonday to close at N7.94 trillion (US$53.84billion).Market report <strong>for</strong> the day was titled: EquityMarket bleeds further by -1.02%, as sellvolume hits Market.(http://www.proshareng.com/news/singlenews.php?id=12617)25 34 At the close of trading session, the NSE All-ShareIndex moved down by -0.67% to close at24,462.72 as against a dip cut of -1.02% recordedprevious session to close at 24,626.98. In the samevein, market capitalization depreciated byN52.44billion (US$355.47 million) to close atN7.81 trillion (US$52.94 billion) as against a loss ofN81.07 billion (US$549.47million) recordedyesterday to close at N7.84 trillion (US$53.29billion). Market report <strong>for</strong> the day was titled: Bearson rampage as market maintains 7dayscontinuousfall.(http://www.proshareng.com/news/12634)26 30 At the close of trading session, the NSE All-ShareIndex moved up by 0.27% to close at 24,529.56as against a decline of -0.67% recorded previoussession to close at 24,462.78. In the same vein,market capitalization gained by N21.34billion(US$355.47 million) to close at N7.83 trillion(US$53.08 billion) as against a loss of N52.44billion (US$355.47million) recorded yesterday toclose at N7.81 trillion (US$52.94 billion). Marketreport <strong>for</strong> the day was titled: ASI retraced by0.27% on moderate buying, as Guinness NigPlc grows PAT by 41.82%(http://www.proshareng.com/news/12642)29 27 The All-Share Index in the week under reviewdropped by -1.40% to close at 24,611.56 asagainst a decline of -1.61% recorded last week toclose at 24,959.95In the same vein, the market capitalization in theweek depreciated by N111.25 billion (US$753.99million) to close at N7.85 trillion (US$ 53.26 billion)as against depreciation of N130.07 billion(US$881.55 billion) recorded last week to close atN7.97 trillion (US54.02 billion). Market report <strong>for</strong>The <strong>Monthly</strong> <strong>NCM</strong> <strong>Report</strong> <strong>for</strong> <strong>Nov</strong> <strong>2010</strong> www.proshareng.com Page 44
<strong>Nov</strong> 29<strong>Nov</strong> 30N500m claim: Shareholders sue Unity Bank over merger-Some aggrievedshareholders of Centre Point Bank Plc have filed legal action be<strong>for</strong>e a Federal High Court inLagos against Unity Bank Plc and some of its principal officers, challenging the allegedunfair treatment in the merger arrangement.Recapitalisation: Bank PHB negotiates with other financial institutions -Themanagement of Bank PHB Plc has notified the council of the NSE that it has entered intoan exclusive negotiation with a consortium of international financial institutions torecapitalize the bank.SEC debunks infractions allegations-The SEC has debunked various allegations ofinfractions levelled against its management recently, saying the attacks were aimed atintimidating the apex regulatory capital market body from per<strong>for</strong>ming its statutory roles.Banks’ return to profitability offers investors fresh hope-Following the recentre<strong>for</strong>ms in the banking sector, banks appear to be crawling out of the red-zone astheir per<strong>for</strong>mance indices are beginning to turn green again.Infrastructure: Banks to Float Bonds-Dissatisfied by the pathetic state of infrastructurein the country, Nigerian Banks under the aegis of the Bankers’ Committee have restatedtheir resolve to float development bonds to finance infrastructural development in criticalsectors of the economy.SEC tasks stakeholders on money laundering, capital market abuse- TO curtail themenace of money laundry in Nigeria’s capital market, the Securities and ExchangeCommission (SEC), yesterday, advised operators and investors to keep themselvesabreast of developments in the sector.Capital market community kicks over proposed bill- The moves by the House ofRepresentatives committee on capital market to revisit the unclaimed dividends issue hasbeen described as overzealous, in the light of more pressing national issues.CBN governor blames economic troubles on wasteful politicians- The Governor ofthe Central Bank of Nigeria, Sanusi Lamido Sanusi, has blamed the nation's economictroubles on the poor leadership provided by political leaders who lacked the ability to leadthe country to the Promised Land.the week was titled: ASI remains weak below25,000 psychological lines with -1.40% dip <strong>for</strong>theweek.(http://www.proshareng.com/news/singlenews.php?id=12652)34 26 At the close of trading session, the NSE All-ShareIndex moved up by 0.22% to close at 24,665.50as against an upbeat of 0.33% recorded previoussession to close at 24,611.56. In the same vein,market capitalization gained by N71.22billion(US$116.73 million) to close at N7.87 trillion(US$53.38 billion) as against a loss of N26.18billion (US$177.47million) recorded on Friday toclose at N7.85 trillion (US$53.26 billion). Marketreport <strong>for</strong> the day was titled: ASI gains supportby 0.22% as Intercontinental Bank Plc topswith 5.00%gain(http://www.proshareng.com/news/singlenews.php?id=12663)25 38 At the close of trading session, the NSE All-ShareIndex moved up by 0.40% to close at 24,764.65as against an upbeat of 0.22% recorded previoussession to close at 24,665.50. In the same vein,market capitalization gained by N31.66billion(US$214.60 million) to close at N7.90 trillion(US$53.59 billion) as against a loss of N71.22billion (US$116.73million) recorded on Friday toclose at N7.87 trillion (US$53.36 billion). Marketreport <strong>for</strong> the day was titled: ASI consolidates4days uptrend by 0.40% on moderatebuying.(http://www.proshareng.com/news/12674)The <strong>Monthly</strong> <strong>NCM</strong> <strong>Report</strong> <strong>for</strong> <strong>Nov</strong> <strong>2010</strong> www.proshareng.com Page 45
ADVICE TO USERS OF THIS REPORTYou are given the limited right to print this report and todistribute it by any means. You can print out pages and usethem in your private discussion groups as long as youacknowledge PROSHARE and you do not alter the reportin any way. Most importantly, you should not charge <strong>for</strong> it.Stock trading is inherently risky and you agree to assumecomplete and full responsibility <strong>for</strong> the outcomes of alltrading decisions that you make, including but not limitedto loss of capital. None of the stock trading calls made by<strong>Proshare</strong>, its analyst board, employees, contributingpartners and companies associated with it should beconstrued as an offer to buy or sell securities, nor advice todo so. <strong>Proshare</strong> is not responsible <strong>for</strong> any errors,omissions or representations on any of the pages in thisreport. <strong>Proshare</strong> does not endorse in anyway anyadvertisers or firm(s) used as case studies in the report.Please verify the veracity of all in<strong>for</strong>mation on your ownbe<strong>for</strong>e undertaking any alliance.Our opinions and analyses are based on sources believedto be reliable and are written in good faith, but norepresentation or warranty, expressed or implied, is madeas to their accuracy or completeness. The in<strong>for</strong>mation inthis report is updated from time to time. <strong>Proshare</strong> howeverexcludes any warranties (whether expressed or implied),as to the quality, accuracy, efficacy, completeness,per<strong>for</strong>mance, fitness or any of the contents of the report,including (but not limited) to any comments, feedback,interviews, articles reproduced and advertisementscontained in the report.All in<strong>for</strong>mation contained in our report or on our websiteshould be independently verified with the companiesmentioned.The editor and publisher are not responsible <strong>for</strong> errors oromissions. You should consult a qualified broker or otherfinancial advisor prior to making any actual investment ortrading decisions. You agree to not make actual stocktrades based on comments in the report, nor on anytechniques presented nordiscussed in this report or anyother <strong>for</strong>m of in<strong>for</strong>mation presentation. All in<strong>for</strong>mation is<strong>for</strong> educational and in<strong>for</strong>mational use only. You agree toconsult with a registered investment advisor, which we arenot, prior to making any trading decision of any kind.Hypothetical or simulated per<strong>for</strong>mance results havecertain inherent limitations. Unlike an actual per<strong>for</strong>mancerecord, simulated results do not represent actual trading.Since the trades have not been executed, the results mayhave under or over compensated <strong>for</strong> the impact. Norepresentation is being made that any account will or islikely to achieve profits or losses similar to those shown inthe report.<strong>Proshare</strong> receives no compensation of any kind from anycompanies that may be mentioned in our reports or on ourweb site. Any opinions expressed are subject to changewithout notice. Owners, employees and writers may holdpositions in the securities that are discussed in our reportor on our web site. Any reference to a trade mentioned inthe report or website, e-mail, publication or material ishypothetical and is not an actual trade. Hypotheticalper<strong>for</strong>mances and results do not represent actual cost of atrade.We encourage all investors to use the in<strong>for</strong>mation in thereport as a resource only to further their own research onall featured companies, stocks, sectors, markets andin<strong>for</strong>mation presented in the report and on our site.Nothing published in this report and on our site should beconsidered as investment advice. Any prediction made onthe direction of the stock market or on the direction ofindividual stocks may prove to be incorrect.Readers/Users/visitors are expected to refer to otherinvestment resources to verify the accuracy of the datapublished in the report on their own. Neither <strong>Proshare</strong> norits principals, agents, associates, employees or licensedstockbrokers, are licensed to provide investment advicethrough this publication.No materials in the report, either on behalf of <strong>Proshare</strong>, orany participant in The Analyst Network should be taken asinvestment advice directly, indirectly, implicitly, or in anymanner whatsoever, including but not limited to trading ofstocks on a short term or long term basis, or trading of anyfinancial instruments whatsoever. Past Per<strong>for</strong>mance IsNot Indicative of Future Returns. All analyst commentaryprovided in this report is provided <strong>for</strong> in<strong>for</strong>mation purposesonly. This in<strong>for</strong>mation is NOT a recommendation orsolicitation to buy or sell any securities. Your use of thisand all in<strong>for</strong>mation contained in this report is governed bythis Terms and Conditions of Use. This material is basedupon in<strong>for</strong>mation that we consider reliable, but we do notrepresent that it is accurate or complete, and that it shouldbe relied upon, as such.You should not rely solely on the In<strong>for</strong>mation in making anyinvestment. Rather, you should use the In<strong>for</strong>mation onlyas a starting point <strong>for</strong> doing additional independentresearch in order to allow you to <strong>for</strong>m your own opinionregarding investments. By using this report including anysoftware and content contained therein, you agree thatuse of the Service is entirely at your own risk. Anyin<strong>for</strong>mation, opinions, advice or offers postedby any person or entity logged in to the <strong>Proshare</strong> websiteor any of its associated sites is to be construed as publicconversation only. <strong>Proshare</strong> makes no warranties andgives no assurances regarding the truth, timeliness,reliability, or good faith of any material posted at <strong>Proshare</strong>.<strong>Proshare</strong> Nigeria is the country's premier investorrelations/education and analyst services plat<strong>for</strong>mproviding a critical role in ensuring that market confidence& safety is enshrined in the conduct of/and market relianceon the in<strong>for</strong>mation and activities of firms quoted on theNigerian Stock Exchange; as a wealth creator <strong>for</strong> theinvesting public. In delivering this service, the firm workswith and through organisations with distinct servicecompetencies in stock investment analysis, investor toolsand solutions and capital market practices; all designed toprovide investors with a credible resource <strong>for</strong> intelligentdecision making.The firm takes extra steps to ensure that in<strong>for</strong>mationprovided by it are accurate, fact checked and validated <strong>for</strong>compliance with internationally acceptable standards andpractices. While this report is checked <strong>for</strong> accuracy, we arenot liable <strong>for</strong> any incorrect in<strong>for</strong>mation included. Werecommend that you make enquiries based on your owncircumstances and, if necessary, seek professional advicebe<strong>for</strong>e entering into transactions. We are always happy toreceive your comments on how we can improve ourservices and make it more meaningful to the investingpublic. Should you be interested in contacting us <strong>for</strong>further discussions on how such reports can be mademore meaningful to you or your organisation/investmentclub; kindly contact analyst@proshareng.comThe <strong>Monthly</strong> <strong>NCM</strong> <strong>Report</strong> <strong>for</strong> <strong>Nov</strong> <strong>2010</strong> www.proshareng.com Page 46
OnlineirsTrainingAnalystServicenews & investigations<strong>Nov</strong>ember <strong>2010</strong>, Lagos, NigeriaISSN 1597 - 8842 Vol. 1 No. 52www.proshareng.comPlot 590b, Pat Ojebuoboh Close, Omole Phase II,Isheri LGA, P.O.Box 18782, Ikeja, Lagos, NGDL: +234 1 7624131 E-mail: info@proshareng.comWebsite: www.proshareng.comThe <strong>Monthly</strong> <strong>NCM</strong> <strong>Report</strong> <strong>for</strong> <strong>Nov</strong> <strong>2010</strong> www.proshareng.com Page 47