第22回 ロボット聴覚特集 - 奥乃研究室 - 京都大学
第22回 ロボット聴覚特集 - 奥乃研究室 - 京都大学
第22回 ロボット聴覚特集 - 奥乃研究室 - 京都大学

Create successful ePaper yourself
Turn your PDF publications into a flip-book with our unique Google optimized e-Paper software.
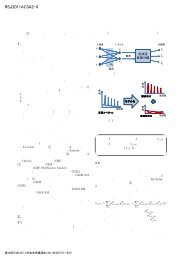
Fig. 4. Illustration of the population-vector modelfor IPD (interaural phase difference) representation,and an example of population responses. 9) A:an array of units tuned to various IPDs, curvesrepresenting the units’ IPD functions of individualunits (above) and the response strength distributionalong the best IPD axis for a given probe IPD (below).Panel represents cases without a conditioner(adapter). B: as above, but with a conditioner. C:normalized responses of the unit array to a probewith an IPD of 90°, plotted against the unit’s bestIPD. Each open circle or asterisk represents the responseof one unit in the absence of, and in thepresence of, a 0-IPD conditioner, respectively. Twoasterisks accompanied by upward-pointing arrowsindicate the data points outside the ordinate rage,for which the normalized response values are indicatedby the numbers below the symbols. Thickgray lines are drawn to guide the eye to the overalltrends, by computing running averages using aHanning window spanning 90° (broken line: conditionerabsent; solid line: conditioner present).Vertical dashed (conditioner absent) and solid(conditioner present) lines indicate the centroids ofthe response distribution (i.e., IPD representations).3.3. 68