Food Act Report 2009/2010 - SA Health - SA.Gov.au
Food Act Report 2009/2010 - SA Health - SA.Gov.au
Food Act Report 2009/2010 - SA Health - SA.Gov.au

Create successful ePaper yourself
Turn your PDF publications into a flip-book with our unique Google optimized e-Paper software.
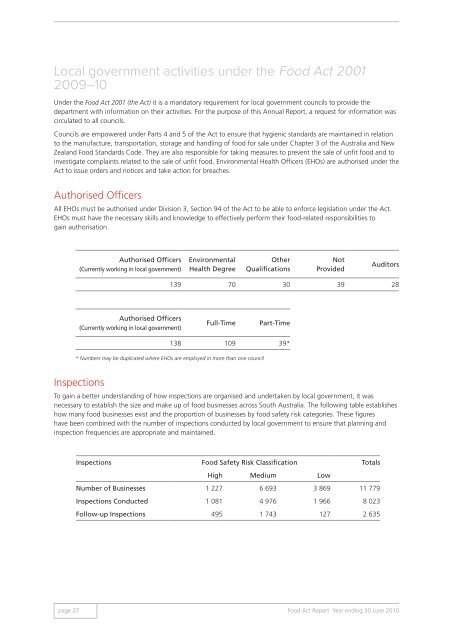
Local government activities under the <strong>Food</strong> <strong>Act</strong> 2001<strong>2009</strong>–10Under the <strong>Food</strong> <strong>Act</strong> 2001 (the <strong>Act</strong>) it is a mandatory requirement for local government councils to provide thedepartment with information on their activities. For the purpose of this Annual <strong>Report</strong>, a request for information wascirculated to all councils.Councils are empowered under Parts 4 and 5 of the <strong>Act</strong> to ensure that hygienic standards are maintained in relationto the manufacture, transportation, storage and handling of food for sale under Chapter 3 of the Australia and NewZealand <strong>Food</strong> Standards Code. They are also responsible for taking measures to prevent the sale of unfit food and toinvestigate complaints related to the sale of unfit food. Environmental <strong>Health</strong> Officers (EHOs) are <strong>au</strong>thorised under the<strong>Act</strong> to issue orders and notices and take action for breaches.Authorised OfficersAll EHOs must be <strong>au</strong>thorised under Division 3, Section 94 of the <strong>Act</strong> to be able to enforce legislation under the <strong>Act</strong>.EHOs must have the necessary skills and knowledge to effectively perform their food-related responsibilities togain <strong>au</strong>thorisation.Authorised Officers(Currently working in local government)Environmental<strong>Health</strong> DegreeOtherQualificationsNotProvidedAuditors139 70 30 39 28Authorised Officers(Currently working in local government)Full-TimePart-Time138 109 39** Numbers may be duplicated where EHOs are employed in more than one councilInspectionsTo gain a better understanding of how inspections are organised and undertaken by local government, it wasnecessary to establish the size and make up of food businesses across South Australia. The following table establisheshow many food businesses exist and the proportion of businesses by food safety risk categories. These figureshave been combined with the number of inspections conducted by local government to ensure that planning andinspection frequencies are appropriate and maintained.Inspections <strong>Food</strong> Safety Risk Classification TotalsHigh Medium LowNumber of Businesses 1 227 6 693 3 869 11 779Inspections Conducted 1 081 4 976 1 966 8 023Follow-up Inspections 495 1 743 127 2 635page 27<strong>Food</strong> <strong>Act</strong> <strong>Report</strong> Year ending 30 June <strong>2010</strong>