No 14 - Journal of Social Informatics / Revista de Informatica Sociala
No 14 - Journal of Social Informatics / Revista de Informatica Sociala No 14 - Journal of Social Informatics / Revista de Informatica Sociala
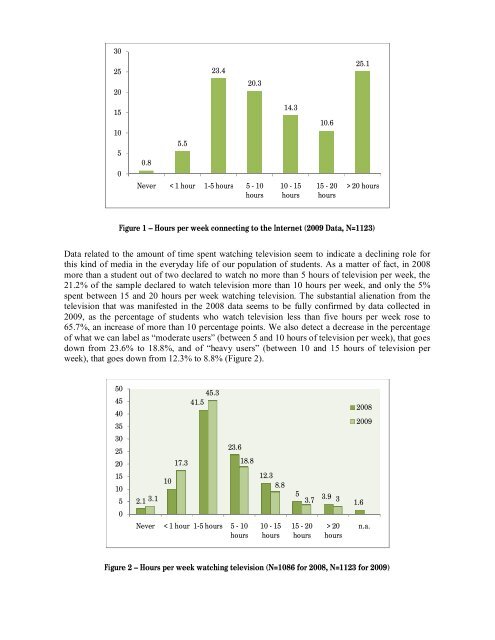
30252023.420.325.11510500.85.5Never < 1 hour 1-5 hours 5 - 10hours14.310 - 15hours10.615 - 20hours> 20 hoursFigure 1 – Hours per week connecting to the Internet (2009 Data, N=1123)Data related to the amount of time spent watching television seem to indicate a declining role forthis kind of media in the everyday life of our population of students. As a matter of fact, in 2008more than a student out of two declared to watch no more than 5 hours of television per week, the21.2% of the sample declared to watch television more than 10 hours per week, and only the 5%spent between 15 and 20 hours per week watching television. The substantial alienation from thetelevision that was manifested in the 2008 data seems to be fully confirmed by data collected in2009, as the percentage of students who watch television less than five hours per week rose to65.7%, an increase of more than 10 percentage points. We also detect a decrease in the percentageof what we can label as “moderate users” (between 5 and 10 hours of television per week), that goesdown from 23.6% to 18.8%, and of “heavy users” (between 10 and 15 hours of television perweek), that goes down from 12.3% to 8.8% (Figure 2).5045403545.341.5200820093025201510502.1 3.11017.323.618.8Never < 1 hour 1-5 hours 5 - 10hours12.38.810 - 15hours53.73.9 315 - 20hours> 20hours1.6n.a.Figure 2 – Hours per week watching television (N=1086 for 2008, N=1123 for 2009)
It’s interesting to compare this with data related to the general population (Istat, 2008), whichshows that on average the television is by far the most preferred media in Italy, but also that peopletend to watch it massively; only the 2% of the overall national population declares to watchtelevision less than one hour every day, the 11.8% watches it between one and two hour, the 26.1%between two and three hours every day, the 19.3% between three and four hours, the 10.4%between four and five hours and the 12.1% for more than five hours every day. Clearly, it seemsthat our target population is less inclined to watch television than the national average. We cansomehow take this to mean that a sort of substitution effect is taking place here, with rates of usageof new media increasing and at the same time declining uses of traditional media among ourpopulation of university students. Data concerning the radio and the books seems to providecorroborating evidence in favour of this assumption.As far as the use of the radio is concerned, we can see that in 2008 the 74.8% of our sample listenedto it less than 5 hours per week, and only the 11.6% of the sample spent between 5 and 10 hours perweek listening to it (Figure 3). Once again, these data seem to be significantly lower than thenational average, and a little below also the data related to the age cohort 20-24. As for the readingof books, data collected in 2008 show that the 13.5% of our students do not read any book at all,while the 48.6% read at least five books a year, the 20.9% read between 5 and 10 books a year andthe 15.5% read more than 10 books a year 3 . The figure for 2009 shows a slight sign of improvementin reading: the percentage of non-readers decreases by nearly 2 percentage points, the percentage ofmoderate reader, that is, those who read fewer than five books a year, decreases by four points,while the number of students who read between 5 and 10 books a year grows by 6 percentage points(see Table 1).40353031.235.12520151058.511.66.72.6 2.6 1.70Never < 1 hour 1-5hours5 - 10hours10 - 15hours15 - 20hours> 20hoursn.a.Figure 3 - Hours per week listening to the radio (2008 Data, N=1086)How many books do you read in a year? 2008 2009None 13,5 11,7Less than 5 48,6 44,6Less than 10 20,9 26,7More than 10 15,5 15,6n.a. 1,5 1,4Table 1 – Number of books read in a year3 These data are related to reading for entertainment purposes only and do not consider the number of books a studenthas to read for study.
- Page 1: Revista de Informatica Sociala 14 /
- Page 7: ● ● ●CONTENTS● ● ●[9-20
- Page 10 and 11: THE TRANSITION FROM OLD TO NEW MEDI
- Page 14 and 15: Overall, we can therefore sum up on
- Page 16 and 17: n.a.I often use itI seldom use it6.
- Page 18 and 19: - Traditional web use: searching th
- Page 20 and 21: 19. Kvavik R.B., Caruso J.B. and Mo
- Page 22: IntroductionIn 1995, Bernie Dodge o
- Page 25 and 26: The Web-Inquiry Project [WIP] is a
- Page 27 and 28: and even orally. The teacher will a
- Page 29 and 30: environment in which the teacher gu
- Page 31 and 32: Transformation Through Online Learn
- Page 33 and 34: INTRODUCTIONLeading practitioners a
- Page 35 and 36: learning. We also describe how the
- Page 37 and 38: Some of these transformations are b
- Page 39 and 40: Recently, Twigg has received suppor
- Page 41 and 42: Stage III: Unbundled Learning, Mark
- Page 43 and 44: perhaps using Second Life-like virt
- Page 45 and 46: performance. Indeed, Stage V will l
- Page 47 and 48: Free-Range Open LearningOver time,
- Page 49 and 50: New communities, tools and services
- Page 51 and 52: Embed enterprise-wide predictive an
- Page 53 and 54: In collaboration with Strategic Ini
- Page 55 and 56: Wiki Tools and English for Academic
- Page 57 and 58: eality. Besides being an additional
- Page 59 and 60: StudentPage 1StudentPage nTeacher
- Page 61 and 62: 100%90%80%70%60%50%40%30%20%10%0%Ac
30252023.420.325.11510500.85.5Never < 1 hour 1-5 hours 5 - 10hours<strong>14</strong>.310 - 15hours10.615 - 20hours> 20 hoursFigure 1 – Hours per week connecting to the Internet (2009 Data, N=1123)Data related to the amount <strong>of</strong> time spent watching television seem to indicate a <strong>de</strong>clining role forthis kind <strong>of</strong> media in the everyday life <strong>of</strong> our population <strong>of</strong> stu<strong>de</strong>nts. As a matter <strong>of</strong> fact, in 2008more than a stu<strong>de</strong>nt out <strong>of</strong> two <strong>de</strong>clared to watch no more than 5 hours <strong>of</strong> television per week, the21.2% <strong>of</strong> the sample <strong>de</strong>clared to watch television more than 10 hours per week, and only the 5%spent between 15 and 20 hours per week watching television. The substantial alienation from thetelevision that was manifested in the 2008 data seems to be fully confirmed by data collected in2009, as the percentage <strong>of</strong> stu<strong>de</strong>nts who watch television less than five hours per week rose to65.7%, an increase <strong>of</strong> more than 10 percentage points. We also <strong>de</strong>tect a <strong>de</strong>crease in the percentage<strong>of</strong> what we can label as “mo<strong>de</strong>rate users” (between 5 and 10 hours <strong>of</strong> television per week), that goesdown from 23.6% to 18.8%, and <strong>of</strong> “heavy users” (between 10 and 15 hours <strong>of</strong> television perweek), that goes down from 12.3% to 8.8% (Figure 2).5045403545.341.5200820093025201510502.1 3.11017.323.618.8Never < 1 hour 1-5 hours 5 - 10hours12.38.810 - 15hours53.73.9 315 - 20hours> 20hours1.6n.a.Figure 2 – Hours per week watching television (N=1086 for 2008, N=1123 for 2009)


