OVERALL TREND - Express Scripts
OVERALL TREND - Express Scripts
OVERALL TREND - Express Scripts
- No tags were found...

You also want an ePaper? Increase the reach of your titles
YUMPU automatically turns print PDFs into web optimized ePapers that Google loves.
<strong>OVERALL</strong> <strong>TREND</strong>Getting to Zero Waste2 008 DRUG <strong>TREND</strong> REPORT
<strong>OVERALL</strong> <strong>TREND</strong>TRADITIONAL <strong>TREND</strong>Trend for traditional drugs fell to a record low of 1.5%. Although inflation had the greatest upward impacton trend at 2.9%, its influence was far below the 5.0% inflation rate reported in 2007. We calculated inflationas the change in ingredient cost net of rebate per prescription for common drugs, which are drugs that wereavailable in both 2007 and 2008. Greater use of generic medications continued to drive trend lower in 2008 by2.7%. Utilization, which had been growing at rates just over 2%, was flat in 2008 at 0.1%. Rounding out 2008trend was the impact of new drugs at 0.2%. New drugs are branded drug products that were introduced to themarket sometime in 2008.To calculate cost/Rx, we used ingredient cost with the exclusion of plan sponsor rebates, which provides a moreaccurate representation of actual costs. The overall rate of price inflation was lower in 2008 driven primarily bya negative 9% infl ation rate for generics compared to a 7.6% increase in infl ation for brands — a rateidentical to brand inflation in 2007. Lower generic inflation was driven by deeper discounts for plan sponsors,loss of generic exclusivity and price decreases by generic manufacturers.EXHIBIT 2Components of PMPY Traditional Cost Trend 2005 to 2008†AWP Less Discount Ingredient Cost Ingredient CostIngredient CostNet of Rebates2004 vs. 2005 2005 vs. 2006 2006 vs. 2007 2007 vs. 2008Price Inflation 5.3% 4.3% 5.0% 2.9%X Units per Prescription 0.1% 0.4% 0.5% 0.3%X Brand/Generic Mix -2.7% -2.9% -4.4% -2.7%X Therapeutic Mix 0.8% 1.7% 1.1% 0.9%= Cost/Rx 3.3% 3.5% 2.0% 1.3%X Utilization 4.0% 2.2% 2.5% 0.1%= Common Drugs 7.5% 5.8% 4.6% 1.3%+ New Drugs 0.4% 0.2% 0.1% 0.2%= All Drugs 7.9% 5.9% 4.7% 1.5%* The percentage contribution of each factor does not total to the All Drugs percentage increase. The calculation takes the base cost for a given yearand multiplies it by one plus the percentage contributed by the first factor (price inflation). The resulting total is then multiplied by the percentagecontributed by the second factor (number of units dispensed), and so on for each Common Drugs factor. The percentage contribution of the New Drugsis then added to the total Common Drugs percentage, to yield an All Drugs percentage increase. Final results may differ due to rounding.The current weak economy had various effects on traditional drug trend, including increased use of lowercost medications (measured by brand/generic mix) and utilization. Individuals have reduced spending acrossmany sectors of the economy, including spending for healthcare. Utilization growth was more modest —particularly for traditional therapy classes that treat asymptomatic conditions, such as high blood pressureand high cholesterol. Fewer declines are being seen for classes that treat symptomatic conditions, such asulcer disease, influenza and pain. Conversely, the weak economy is expected to increase utilization in otherclasses, such as drugs for the treatment of depression and insomnia. The impact on utilization by theeconomic downturn is expected to continue through 2009.4 EXPRESS SCRIPTS 2008 DRUG <strong>TREND</strong> REPORT
<strong>OVERALL</strong> <strong>TREND</strong>The fact that members were also looking for cost-savings opportunities is evidenced through greater use oflower cost generic medications. For traditional drugs, overall utilization of brands decreased by 10.9% whilegeneric use increased by 7.5%. As a result, member cost share was lowered by 2.3% to $12.70 per prescriptionfor traditional drugs. In addition to the slowing economy, decreases in brand utilization were influenced by OTCstrategies, drug safety concerns and patent expirations.EXHIBIT 3Traditional Drug Utilization by Generics and Brands2007 2008PMPYUtilizationPMPYUtilizationGenerics 8.64 9.28 7.5%Brands 5.65 5.04 -10.9%Total 14.29 14.32 0.1%TrendThe top 20 traditional classes accounted for over 80% of traditional-drug spending. The top three— representing one quarter of traditional spend — all treat metabolic syndrome. A cluster of conditions,such as abdominal obesity and insulin resistance, metabolic syndrome increases the risk of heart disease,stroke and diabetes. Seven of the top 20 traditional classes had double-digit spending growth. Drivenby increased utilization of drugs used to treat infl uenza, antiviral medications was the traditional drugclass that had the highest rate of growth at 21%. Increased utilization of medications to treat viralinfections likely was due to decreased vaccine effectiveness and the active 2007-2008 fl u seasonwhich peaked in February of 2008.Blood modifying agents (mainly drugs to prevent blood clots) and drugs used to treat mental and neurologicaldisorders, such as Alzheimer’s disease, psychoses and Parkinson’s disease, both grew at rates of 17% dueprimarily to price inflation. The 32% negative trend for drugs used to treat allergies was due to Zyrtec ® movingto OTC status early in 2008. An in-depth description of several therapy classes is provided in the Therapy ClassReview Section of the Drug Trend Report.EXPRESS SCRIPTS 2008 DRUG <strong>TREND</strong> REPORT 5
<strong>OVERALL</strong> <strong>TREND</strong>EXHIBIT 4Components of Trend for the Top 20 Traditional Therapy ClassesRanked by Percent of Total Traditional Spend% of TotalComponents of TrendTherapy ClassTraditionalSpendPMPYCost Trend Utilization Cost/Rx New Drugs1 High Blood Cholesterol 9.1% -8.0% 2.5% -10.2% 02 High Blood Pressure/Heart Disease 8.6% -3.0% 1.4% -4.7% 0.3%3 Diabetes 8.0% 9.7% 1.6% 7.9% 04 Depression 7.0% -0.9% 0.6% -1.9% 0.4%5 Ulcer Disease 6.3% -5.2% 4.7% -9.5% 06 Asthma 5.6% 3.8% -1.8% 5.8% 07 Seizures 4.7% 13.7% 6.7% 6.6% 08 Infections 4.4% -0.8% -0.5% -0.3% 09 Pain 4.1% 11.4% 2.6% 8.6% 010 Mental/Neurological Disorders 3.3% 16.8% 6.4% 9.8% 011 Viral Infections 3.2% 20.8% 15.7% 4.1% 0.4%12 Attention Disorders 2.8% 13.7% 5.6% 7.6% 013 Allergies 2.3% -32.2% -22.6% -12.8% 0.3%14 Contraceptives 2.3% 8.0% 2.2% 5.7% 015 Urinary Disorders 1.9% 9.9% 2.7% 6.9% 016 Blood Modifying 1.9% 17.2% 5.0% 11.6% 017 Skin Conditions 1.8% 9.9% 0.3% 9.6% 018 Pain and Inflammation 1.6% -0.6% -1.9% -1.0% 2.3%19 Migraine Headaches 1.5% 10.5% -4.9% 14.3% 1.8%20 Hormonal Supplementation 1.4% 7.2% -6.0% 14.1% 0Top 20 81.7% 2.0% 0.6% 1.3% 0.2%All Other 18.3% -0.6% -0.7% 0 0.1%Total 100.0% 1.5% 0.1% 1.3% 0.2%6 EXPRESS SCRIPTS 2008 DRUG <strong>TREND</strong> REPORT
<strong>OVERALL</strong> <strong>TREND</strong>SPECIALTY <strong>TREND</strong>At 11.7%, increased cost/Rx was the main factor contributing to the 15.4% specialty-drug trend for 2008.The major driver was price inflation of 9.4%, a rate three times greater than for traditional medications.As was seen for traditional medications, though, the rate of utilization growth for specialty medicationsdropped by over 40% to 2.7%.EXHIBIT 5Components of PMPY Specialty Cost Trend 2006 to 2008†Ingredient CostIngredient Cost Net of Rebates2006 vs. 2007 2007 vs. 2008Price Inflation 7.3% 9.4%X Units per Prescription -1.3% -0.4%X Brand/Generic Mix 0 0X Therapeutic Mix 2.2% 2.6%= Cost/Rx 8.2% 11.7%X Utilization 4.7% 2.7%= Common Drugs 13.3% 14.4%+ New Drugs 0.7% 0.7%= All Drugs 14.0% 15.4%* The percentage contribution of each factor does not total to the All Drugs percentage increase. The calculation takes the base cost for a given yearand multiplies it by one plus the percentage contributed by the first factor (price inflation). The resulting total is then multiplied by the percentagecontributed by the second factor (number of units dispensed), and so on for each Common Drugs factor. The percentage contribution of the New Drugsis then added to the total Common Drugs percentage, to yield an All Drugs percentage increase. Final results may differ due to rounding.In 2008, taken together as a separate class, specialty drugs lead all therapy classes in terms PMPY spending.At $98.77, PMPY spend on specialty drugs outdistanced $68.68 PMPY for the leading traditional class (drugs totreat high blood cholesterol). The top specialty class, inflammatory conditions, was in the top 10 of all therapyclasses (traditional plus specialty) based on PMPY spend in 2008. The top three specialty classes accountedfor well over 60% of total specialty spend, with seven of the top 10 specialty classes having total trends ofover 10%. Blood cell deficiency was the only class that showed a negative trend. For some classes, utilizationincreases were the major factors in driving up trend; for others cost/Rx had bigger impact. In one class,pulmonary hypertension, both utilization and cost/Rx had large increases.EXPRESS SCRIPTS 2008 DRUG <strong>TREND</strong> REPORT 7
<strong>OVERALL</strong> <strong>TREND</strong>EXHIBIT 6Components of Trend for the Top 10 Specialty Therapy ClassesRanked by Percent of Total Specialty Spend% of TotalComponents of TrendTherapy ClassSpecialtySpendTotalTrend Utilization Cost/Rx New Drugs1 Inflammatory Conditions 27.5% 17.0% 10.5% 5.7% 0.2%2 Multiple Sclerosis 20.2% 18.3% -2.9% 21.9% 03 Cancer 16.0% 18.6% 2.0% 15.7% 0.7%4 Growth Deficiency 5.2% 20.3% 12.9% 6.5% 05 Anticoagulant 5.2% 22.4% 14.0% 7.4% 06 Blood Cell Deficiency 4.3% -11.4% -17.3% 7.1% 0.1%7 Infertility 3.6% 14.4% -2.4% 17.2% 08 Respiratory Conditions 3.2% -0.2% -8.2% 8.8% 09 Hepatitis C 2.9% -7.3% -11.4% 4.6% 010 Pulmonary Hypertension 2.7% 59.2% 36.1% 17.0% 0Top 20 90.7% 15.4% 3.0% 11.8% 0.2%All Other 9.3% 14.8% 0.5% 9.0% 5.3%Total 100.0% 15.4% 2.7% 11.7% 0.7%8 EXPRESS SCRIPTS 2008 DRUG <strong>TREND</strong> REPORT
<strong>OVERALL</strong> <strong>TREND</strong>MEMBER EXPERIENCESince fi rst publishing the Drug Trend Report, <strong>Express</strong> <strong>Scripts</strong> has included member share in totalcost calculations to capture total pharmaceutical spending. Examining trends in member copaymentsis critical to understanding utilization and cost trends because shifting costs to members, whiledecreasing plan-sponsor trend, may inappropriately decrease utilization and compliance withmedication. Compliance is defined as taking medications as prescribed by the doctor.For the second year, both total cost/Rx and member cost share dropped for traditional therapy classes.Overall, cost/Rx dropped by 2.2% to $12.82. Members now pay 22.3% of total traditional-drug costs. Thedrop was infl uenced by increased utilization of lower cost generic medications and lower per-prescriptioncopayments for generic medications. The average specialty copayment was higher at $44 per prescription— primarily driven by plan sponsor copayment designs. However, due to the high per prescription specialtycosts, members paid only 2.6% of total specialty costs, which remained the same in 2007 and 2008.EXHIBIT 7Member Copayment TrendsAverageCopayment2007 2008% TotalCostAverageCopayment% TotalCost TrendTraditional $13.00 23.3% $12.70 22.3% -2.3%Generics $7.45 29.6% $7.82 29.0% -2.3%Brands $21.48 20.9% $22.69 19.6% 5.7%Specialty $41.06 2.7% $44.04 2.6% 7.3%Total $13.11 21.3% $12.82 20.2% -2.2%EXPRESS SCRIPTS 2008 DRUG <strong>TREND</strong> REPORT 9
<strong>OVERALL</strong> <strong>TREND</strong>Trends in ComplianceNow estimated to affect over 130 million Americans, chronic diseases account for 70% of deaths and cost theU.S. $1.3 trillion annually ($1.1 trillion in lost productivity and another $277 billion in direct treatment). 1Prescription drugs are key elements in the appropriate treatment of many chronic diseases. However, not allpatients use chronic prescriptions appropriately. According to a 2007 report from the National Council onPatient Information and Education, nonadherence with medications may result in unnecessary diseaseprogression, disease complications, reduced functional abilities, a lower quality of life and even prematuredeath. 2 Keeping patients adherent to prescription therapy is critical to improving health outcomes andcontrolling long-term healthcare costs. Recently, in light of the diffi cult economic environment, someconsumers have begun taking less of their chronic medications or even foregoing care altogether.To examine compliance patterns among <strong>Express</strong> <strong>Scripts</strong> membership, we evaluated compliance across threekey chronic therapy classes: antidiabetics, antihypertensives and lipid-lowering agents for high cholesterol.EXHIBIT 8Unadjusted Medication Possession Ratios for Key Chronic Therapy Classes 2007 and 2008Medication Possession RatioTherapy Class 2007 2008Antidiabetic Agents 77% 77%Antihypertensives 83% 83%Lipid-lowering Agents 84% 83%Using a standard calculation of compliance called the Medication Possession Ratio (MPR), we evaluated thedays supply of medication over a fixed period of time (measurement period) divided by the number of days inthe measurement period. Our measurement period was one year beginning January 1 and ending December 31.For the calculation of MPR, we analyzed utilization for adult members who were continuously eligible ineach year. All the members we studied were covered by plan sponsors in our commercial book of business.Compliance values represent only members with full employment (continuously eligible), not employees thatlost employer-covered benefits in either year.The numerator is the sum of the days’ supply of all medications that fall within the measurement period,removing the day’s supply that extends past the end of the measurement period and adding the dayssupply spilling into the current measurement period. The denominator is either 365 days for continuoususers of medication or the difference in days between the initiation of therapy and the end of themeasurement period for new users. To ensure at least 270 days of follow up, new users were includedonly if their initial claims were prior to March 31.Our findings show no change in compliance for patients taking antidiabetic and antihypertensive medicationsamong <strong>Express</strong> <strong>Scripts</strong> commercially insured members from 2007 to 2008. Compliance measures for patientstaking medications to treat high blood cholesterol decreased by only 1%. In both years and for all three therapyclasses, compliance rates were above or approaching 80%, a rate believed necessary for achieving optimalhealth outcomes.10 EXPRESS SCRIPTS 2008 DRUG <strong>TREND</strong> REPORT
<strong>OVERALL</strong> <strong>TREND</strong>Managing TrendEven though <strong>Express</strong> <strong>Scripts</strong> pharmacy trend is the lowest in over a decade, significant spend still remainsto be managed. Just because costs are not going up, does not mean that they cannot come down. Managingpharmaceutical spending involves not only weeding out waste or inappropriate use, but also advocatingappropriate utilization to ensure that the right patient is taking the right drug in the right way at the right time.MANAGING OUT WASTE IN PHARMACY BENEFITSPresident Obama has made healthcare reform a key legislative initiative in his administration. While increasingaccess to care and reducing the number of uninsured are primary concerns, the administration also recognizesthat the current inefficient system cannot support the number of individuals who need to be added. Healthcarespending, which made up 16.2% of GDP in 2007, is growing by about 6% yearly. If left unchecked, it is expectedto account for 20% of GDP in 2018 3 , an unsustainable projection.SO WHERE IS THE WASTE IN THE HEALTHCARE SYSTEM?Waste is defi ned as spending more without improving health outcomes. Present at all levels of healthcareprovision and utilization, waste takes many forms. On the provider side, current payment systems rewardproviders for the quantity of care, often leading to unnecessary diagnostic tests or marginally effectiveprocedures. In prescription-drug spend, plan sponsors waste resources through ineffective plan designsthat do not take advantage of programs designed to drive cost-effective utilization. Members waste benefitsby using non-formulary drugs, by being nonadherent to treatment and by fi lling prescriptions throughinefficient delivery channels.For 2008, <strong>Express</strong> <strong>Scripts</strong> researchers estimated the waste within the commercially insured market from use ofhigher cost drugs instead of chemically or therapeutically equivalent lower cost generics. Estimated across 13therapy classes and based upon clinically determined generic fill rate (GFR) potentials, potential savings of over$18 billion were missed in the commercially insured market alone. Extrapolating to the U.S. population, includingindividuals covered by Medicare, Medicaid and other public insurance programs, <strong>Express</strong> <strong>Scripts</strong> estimated thatmissed saving opportunities amounted to over $42 billion. Exhibit 9 summarizes our findings.1The Partnership to Fight Chronic Disease. Almanac of Chronic Disease 2008. Available at: http://www.fi ghtchronicdisease.org/pdfs/PFCD_FINAL_PRINT.pdf. Accessed March 17, 2009.2National Council on Patient Information and Education. Enhancing prescription medication adherence: a national action plan. August 2007.Available at: http://www.talkaboutrx.org/documents/enhancing_prescription_medicine_adherence.pdf. Accessed March 17, 2009.3Sisko A, Truffer C, Smith S, et al. Health spending projections through 2018: recession effects add uncertainty to the outlook. Health Aff (Millwood). 2009;28(2):w346-w357.EXPRESS SCRIPTS 2008 DRUG <strong>TREND</strong> REPORT 11
<strong>OVERALL</strong> <strong>TREND</strong>EXHIBIT 9Estimated Savings From Achieving Potential Generic Fill Rates*Potential SavingsTherapy Class Actual GFR Potential GFR (in $ millions)Oral Contraceptives 65.3% 90% $454Antidiabetics 55.3% 60% $668Beta Blockers 95.0% 98% $167Antihypertensives 64.5% 83% $935Antihyperlipidemics 43.9% 80% $5,110Antihistamines 79.2% 100% $260Systemic and Topical Nasal Products 49.4% 90% $656Gastrointestinal Medications 55.3% 95% $4,508Antidepressants 69.0% 94% $2,559Antipsychotics 32.5% 45% $399Hypnotics 69.4% 95% $858Narcotic Analgesics 93.8% 95% $294Anticonvulsants 57.7% 75% $1,223Total (US Commercially Insured) $18,089Total (US population) $42,383*Therapy class designation was based upon GPI codes12 EXPRESS SCRIPTS 2008 DRUG <strong>TREND</strong> REPORT
<strong>OVERALL</strong> <strong>TREND</strong>Specialty Drug Spending Patterns Between Pharmacy Benefits and Medical BenefitsManagement of specialty-drug spending is another area where untapped savings exist. Because specialtymedications can be reimbursed through both medical benefits and pharmacy benefits, the economic impact ofspecialty spending may be hidden within medical benefits, which often are not well-managed. <strong>Express</strong> <strong>Scripts</strong>conducted a study to identify how specialty-drug costs are distributed between medical and pharmacy benefits.We used an integrated medical and prescription claims database to evaluate specialty-spending distributionsfor 22 conditions from 2005 to 2007. Results from the top 10 specialty classes are presented in Exhibit 10.EXHIBIT 10Proportion of Pharmacy Cost as a Percentage of Total Specialty Spend 2005 to 2007Ranked by 2007 Total PMPY CostsRank Disease State 2005 2006 20071 Cancer 15.5% 18.2% 18.9%2 Inflammatory Conditions 65.8% 66.1% 65.3%3 Blood Cell Deficiency 32.5% 17.4% 15.3%4 Multiple Sclerosis 96.1% 97.2% 97.1%5 Hemophilia 38.0% 33.9% 30.4%6 Growth Deficiency 87.9% 92.5% 93.2%7 Respiratory Conditions 69.9% 68.1% 69.1%8 Immune Deficiency 60.6% 23.1% 20.4%9 Anticoagulant 93.9% 94.5% 94.4%10 Hepatitis C 98.0% 98.6% 98.3%Other 52.8% 52.6% 52.0%Total 48.9% 45.2% 44.9%Source: MarketScan ® Commercial Claims and Encounters Database: 2005 to 2007By viewing total medical and pharmacy costs together, a more complete picture of specialty spending ispresented. When total medical and pharmacy spending is considered, specialty drugs used to treat cancer wasthe number one class. However, cancer was the number three therapy class in terms of total pharmacy specialtyspend — representing only 16%.Our results show that 55% of the costs for specialty medications in 2007 were billed through medicalbenefi ts — an increase from 51% in 2005. The transition of spending to the medical benefi t likely is dueto need for physician monitoring of some therapies, as well as to safety concerns for other treatments. Ourfi ndings show that conditions including immune defi ciencies, blood cell defi ciencies and hemophilia hadsignificant movement of spending out of pharmacy benefits and into medical benefits. Administering specialtydrugs is an important source of revenue for some physicians which may explain some of the transition. Thatsaid, however, many products can be managed appropriately and safely through specialty pharmacies that usedrug-utilization monitoring specifically designed for hard-to-manage conditions. Given the significant savingsunder pharmacy benefits, plan sponsors should ensure that appropriate drugs are covered only under pharmacybenefits. They can also implement utilization-management programs under medical benefits for patients mostappropriately managed by physicians.EXPRESS SCRIPTS 2008 DRUG <strong>TREND</strong> REPORT 13
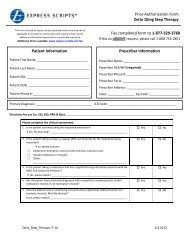
<strong>OVERALL</strong> <strong>TREND</strong>The SolutionClients have many tools available to capture the savings from increased generic usage depending on howactively they manage benefits. Taking an active stance, including tighter formulary management and adoption ofclinical programs such as Step Therapy, has been shown to produce significant savings for plan sponsors andmembers. By the end of 2008, approximately 55% of <strong>Express</strong> <strong>Scripts</strong>’ members were enrolled in plans that hadimplemented at least one Step Therapy program. Step Therapy, which encourages the use of lower-cost, equallyeffective, generic medications prior to stepping up to more costly branded therapies, produced average savingsof $5.11 per member per year (PMPM) for clients that adopted our standard package of modules.Without active management, clients must rely on financial incentives through tiered copayment designsand copayment differentials to encourage cost-effective use of drugs and delivery channels. While optimalcopayment design is necessary to establish the choice framework for members and their physicians to choosethe appropriate drug therapy, relying solely on financial incentives leaves considerable savings on the table.EDUCATIONOver the last five years, PBMs and plan sponsors have utilized member education with targeted and framedmessaging to inform members of savings opportunities. <strong>Express</strong> <strong>Scripts</strong> has seen significant movement to lowercost options through the use of these educational initiatives. 4 Two of our recent studies examined targeted andframed messaging about new therapeutic alternatives after the patent expirations of Ambien ® (zolpidem) andFosamax ® (alendronate). These patent expirations provided the first therapeutically equivalent generic agentsavailable in their respective therapy classes (hypnotics and bisphosphonates).In both studies, movement to the generic alternative was more significant for members receiving targetedand framed messages than for members in control groups (who were given financial incentives alone). Whencategorized by delivery channel, members receiving medications through Home Delivery had a significantlygreater rate of conversion than those receiving medication in retail pharmacies. The greater success in HomeDelivery is consistent with other findings from letter campaigns encouraging use of lower cost alternatives.The implication is that once a relationship is established between <strong>Express</strong> <strong>Scripts</strong> and plan members throughHome Delivery, members are more willing to receive, trust and act on suggestions about improving theirhealth and capitalizing on the value of their prescription-drug benefi ts. Both studies are available on the<strong>Express</strong> <strong>Scripts</strong>.com website at: http://www.express-scripts.com/industryresearch/outcomes/onlinepublications.4Cox ER, Kulkarni A, Henderson R. The Impact of Patient and Plan Design Factors on Switching to Preferred Statin Therapy: The Case of Atorvastatin Formulary Status Change.Annals of Pharmacotherapy. 2007;41(12):1946-53.14 EXPRESS SCRIPTS 2008 DRUG <strong>TREND</strong> REPORT
<strong>OVERALL</strong> <strong>TREND</strong>EXHIBIT 11Adjusted Conversion RatesSelected Brand Hypnotics to ZolpidemHome Delivery(n = 14,277)Retail(n = 2,695)A Brand Bisphosphonate to Alendronate22.1%10%6.1%EXPRESS SCRIPTS 2008 DRUG <strong>TREND</strong> REPORT 15
<strong>OVERALL</strong> <strong>TREND</strong>AN ADVANCED UNDERSTANDING OF CONSUMER BEHAVIORFinancial incentives and targeted patient education have been effective in motivating members to adoptpreferred behaviors, but study results also suggest that standard approaches are not sufficient to wring outwaste and improve health. In 2008, <strong>Express</strong> <strong>Scripts</strong> organized a distinguished team of behavior experts tostart a new initiative aimed at enhancing consumer communications in healthcare. Our Center for Cost-Effective Consumerism studies human behavior specifically in relation to pharmacy benefits. We believe thatan advanced understanding of human behavior, coupled with scientifi cally sound communications, willsignifi cantly improve pharmacy benefi t management. We call this practice Consumerology. Through pilotsand other testing methods, the Center has selected three behavioral economics principles to guide ourresearch and development work:Social ComparisonCapturing the importance that people place on knowing how they are doing relative to others is knownas social comparison. What other people think and how individuals fi t in with the group infl uencebehavior. We are investigating how to improve therapy adherence using this sensitivity. In one pilot,we are providing patients with information that compares their personal medication usage scoreswith average and minimally acceptable scores.Hyperbolic DiscountingHyperbolic discounting demonstrates that future events feel about half as important as events today.This psychological force, which causes current costs to loom surprisingly large relative to futurebenefits, often leads to procrastination. Hyperbolic discounting has important implications for almostevery health-related behavior (such as exercising today to improve future health), as well as for<strong>Express</strong> <strong>Scripts</strong> products such as Home Delivery. Traditionally with Home Delivery, costs are incurredup front for a 90-day supply of medications. A better understanding of hyperbolic discounting hasspurred us to conduct pilot studies aimed at greatly improving the use of Home Delivery. We think that,because members who fill maintenance medications through Home Delivery have two-thirds feweropportunities to procrastinate, adherence to medications in Home Delivery is higher when comparedwith adherence rates to medications filled in retail pharmacies.16 EXPRESS SCRIPTS 2008 DRUG <strong>TREND</strong> REPORT
<strong>OVERALL</strong> <strong>TREND</strong>EXHIBIT 12Adherence in Home Delivery Compared to Retail Across Three Chronic Therapy ClassesSource: Is compliance really better in home delivery? Evidence across three chronic therapy classes. September 2008.Available at: http://www.express-scripts.com/industryresearch/outcomes/onlinepublications/study/homeDeliveryCompliance.pdf. Accessed April 2, 2009.Loss AversionLoss aversion means that people work harder to avoid perceived losses than to obtain perceived gains.For example, people are more willing to undergo a surgical procedure characterized as having a 95%chance of success than one described as having a 5% chance of failure.The loss-aversion principle has been tested in studies examining the impact of lowering copayments.One mechanism proposed to increase adherence is reducing barriers to care through reducing oreliminating copayments for high value medications. But do members react in the same way to loweringcopayments as they do to increasing copayments? Studies have shown that copayment increases of 10%lead to declines in medication use between 2% and 6%. 5Does it follow, then, that lowering prescription-drug copayments improves medication adherence bythe same proportions? In a study published in the December 2008 issue of the American Journal ofManaged Care, <strong>Express</strong> <strong>Scripts</strong> researchers examined the relationships between lowered copaymentsand adherence. 6 We based the study on lower copayments resulting from the patent expiration of thecholesterol-lowering drug Zocor ® (simvastatin). We found only modest gains in overall adherence ascopayments declined. Price elasticity of demand estimates from this study found that a 10% decreasein copayments led to utilization increases of only 0.2% — orders of magnitude smaller than theutilization decreases that result from increasing copayments.So what does all of this mean for plan sponsors designing pharmacy benefi ts? It means that fi nancialincentives are not the sole solution to influencing patient behavior. In addition to price, side effects, and drugeffectiveness; important psychological principles, such as procrastination, expectations, social norms andframing, are also at play in shaping decisions about utilization of pharmaceutical products.5Goldman DP, Joyce GF, Zheng Y. Prescription drug cost sharing: associations with medication and medical utilization and spending and health. JAMA. 2007;298(1):61-69.6Sedjo RL, Cox ER. Lowering Copayments: Impact of Simvastatin Patent Expiration on Patient Adherence. Am J Manag Care. 2008;14(12):813-18.EXPRESS SCRIPTS 2008 DRUG <strong>TREND</strong> REPORT 17
<strong>OVERALL</strong> <strong>TREND</strong>MethodsIn the 2008 Drug Trend Report, prescription-drug use was analyzed for two independent samples ofapproximately 3 million individual members each. The plan sponsors providing pharmacy benefits to thesampled members paid at least some portion of the cost for prescriptions dispensed to its members in both2007 and 2008 and they had stable membership (50% or less of the membership changed in 2007 and 2008).Plan sponsors used <strong>Express</strong> <strong>Scripts</strong> for both retail and home-delivery pharmacy services. Prescription countshave been converted to equivalent quantities that would have been dispensed through retail pharmacies toallow for varying benefit structures and adjust for differential home-delivery usage rates.Non-prescription medications (except for diabetic supplies, which were included for the fi rst time) andprescriptions that were dispensed in hospitals, long-term care facilities and other institutional settingswere not included in this analysis. Calculations also excluded claims for Medicaid recipients and Medicarebenefi ciaries receiving prescription-drug benefi ts through Medicare Part D plans or Managed MedicarePrescription Drug Plans (PDPs).For the first time, plan sponsor rebates were included to provide a more accurate representation of actual costs.Utilization was determined on a per member per year (PMPY) basis. It was calculated by dividing the totalnumber of 30-day adjusted prescriptions by the total number of member-years for all members. A member-yearis the total number of months of eligibility for all members in the sample divided by 12. Prevalence of use foreach drug class was calculated as the number of members taking medications in the class divided by the totalnumber of members (both utilizers and non-utilizers) in the sample. The average number of prescriptions peruser per year (# Rx/User/Year) is the total number of 30-day adjusted prescriptions divided by the total numberof user-years. A user-year is determined by adding the number of months of eligibility for all sample memberswho had at least one claim for a given drug class and then dividing the total by 12.18 EXPRESS SCRIPTS 2008 DRUG <strong>TREND</strong> REPORT