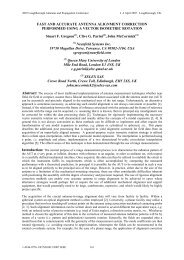
Mathematical Absorber Reflection Suppression (MARS) for ...
Mathematical Absorber Reflection Suppression (MARS) for ...
Mathematical Absorber Reflection Suppression (MARS) for ...

Create successful ePaper yourself
Turn your PDF publications into a flip-book with our unique Google optimized e-Paper software.
<strong>Mathematical</strong> <strong>Absorber</strong> <strong>Reflection</strong> <strong>Suppression</strong>(<strong>MARS</strong>)<strong>for</strong> Anechoic Chamber Evaluation &ImprovementAMTA 200820-Nov-2008Greg Hindman & Allen C. NewellNearfield Systems Inc.19730 Magellan DriveTorrance, CA 905021
Outline• Review Chamber Accuracy Evaluation Methods• <strong>Mathematical</strong> <strong>Absorber</strong> <strong>Reflection</strong> <strong>Suppression</strong> (<strong>MARS</strong>)• <strong>MARS</strong> Usage with 0.5 to 18 GHz Broadband Log Periodicantenna <strong>for</strong> Chamber <strong>Reflection</strong> Evaluation• <strong>MARS</strong> Usage with 2.6 – 3.95 GHz Open Ended Waveguide(OEWG) Probe <strong>for</strong> Chamber <strong>Reflection</strong> Evaluation• <strong>MARS</strong> Results with 0.49 to 0.75 GHz SGH in Open Test Labwith no <strong>Absorber</strong>!• Summary2
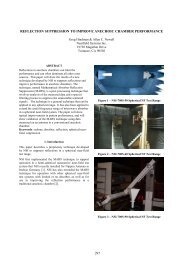
NSI‟s New SNF Chamber• NSI-700S-75 SNF Scanner• 24‟x24‟x20‟ Chamber with36” pyramidal absorber• Tested with NSI-RF-DLP-03(0.5-18 GHz) Dual-Pol LogPeriodic Antennas as AUTand probe• <strong>MARS</strong> Analysis Used3
Range Accuracy Evaluation Methods• Against independent measurements of antenna in other testsystems• Best approach• Time consuming, costly• Simple near-field reflection test• Compare theta cut with AUT at 0 deg vs 180 deg• Easy to do, quick look at reflection levels• Chamber reflection test with AUT offset in Z direction• Full 2D NF tests with AUT offset by ¼ lambda• Time consuming, results affected by AUTremoval/realignment• NSI 180 phi vs. 360 phi vs redundant comparison test• Full 2D NF test with AUT on two measurement spheres• Easy to do, automatic processing, no AUT remounting needed4
Amplitude (dB)Plot Subtraction Explained• Converts measured patterns from powerinto voltage• Per<strong>for</strong>ms subtraction in pattern angles ofinterest• Residual error plot is the error level thatwould cause the observed patternchangesFar-field amplitude of WR137SGH020.nsi - Far-field amplitude of WR137SGH019.nsi0Plot 1 Plot 2 Plot 1 - Plot 2-10-20Pattern difference-30-40-50Measured signal1 st configMeasured signal2 nd config-60-70-75 -50 -25 0 25 50 75Azimuth (deg)5
Amplitude (dB)Simple <strong>Reflection</strong> Test in Chamber• A simple reflection test involvescomparing 0° and 180° Phi cuts• For a correctly alignedmeasurement system, thedifferences in the patterns aredue to the range reflections• Subtraction of the two patternsgives a preliminary estimate ofexpected error signal level• Chamber test result at 10 GHzon the DLP• Shows relatively good result ofabout -40 dB error level0-5-10-15-20-25-30-35-40-45-50-55-60Scattering Estimated <strong>for</strong> File TECOM_509H_TECOM 495H_103.NSIComparing 0 and 180 Phi Cuts at Freq = 10 GHzPhi=0 Phi=180 SCAT. SIG-150 -100 -50 0 50 100 150Theta scan with AUT Phi = 0°Theta scan with AUT Phi = 180°6
Simple Chamber <strong>Reflection</strong> Test• Theta cut with AUTphi = 0 deg from – to +• Theta cut with AUTphi = 180 deg from + to-7
Chamber <strong>Reflection</strong> with AUT OffsetProbeProbe• AUT offset using fixed length standoffs• Requires AUT removal, realignmentAUT positionchange in ZAUT (SGH)8
Typical AUT Offset Test ResultWR SizeFrequencyBand(GHz)Chamber<strong>Reflection</strong>(dB)WR-650 1.12 – 1.7 -32 dBWR-430 1.7 – 2.6 -40 dBWR-284 2.6 – 3.95 -42 dBWR-187 3.95 – 5.85 -40 dBWR-137 5.85 – 8.2 -46 dBWR-90 8.2 – 12.4 -40 dBWR-62 12.4 - 18 -44 dBWR-42 18 – 26.5 -42 dBWR-28 26.5 - 40 -38 dBUsing AUT offset test method9
Self-Comparison Measurements• Self-comparison technique often used to evaluate the effectsof error sources on the measurement results• Useful to establish a „truth model‟, or our best estimate ofthe „correct‟ measurement result• Use this <strong>for</strong> comparison to results derived with compromises inaccuracy in favor of reduced test time. For this, we use threesteps:1. take the data with minimal or controlled position errors (stop motion orslow scanning)2. average out range reflection and alignment errors with a redundantscanning technique3. apply NSI‟s <strong>Mathematical</strong> <strong>Absorber</strong> <strong>Reflection</strong> <strong>Suppression</strong> (<strong>MARS</strong>)technique• These three steps will help to derive the „true‟ antenna radiationpattern <strong>for</strong> use in subsequent self-comparison measurements toderive the effect of error sources.10
360 phi vs. 180 phi SNF ScanningAUT points to + θ and – θ sides of chamberTwo different scanninggeometries – both give acomplete AUT data setAUT points to only + θ sides of chamber11
Redundant dataComparison Method Description+ =Best Estimate of“Truth Model”Best Estimate of“Truth Model” - =Chamber <strong>Reflection</strong>sBest Estimate of- + = “Truth Model”Chamber <strong>Reflection</strong>swith <strong>MARS</strong>12
<strong>MARS</strong> Processing• <strong>MARS</strong> uses the standard NIST Spherical Near-field to Far-FieldTrans<strong>for</strong>mation Algorithm• NIST algorithm uses a mode filtering technique• Mode cutoff is based on the fact that modes above a certainindex number are exponentially attenuated and not detected bythe probe.• Mode cutoff is determined by the physical dimensions of the AUT• NSI‟s <strong>MARS</strong> technique applies a mathematical position shift to theAUT measured data during processing to optimize the way thespherical trans<strong>for</strong>m filtering is done.13
Mode Amplitude in dB<strong>MARS</strong> Mode AnalysisSpherical Modes <strong>for</strong> M=1• Spherical near-field to far-fieldtrans<strong>for</strong>mation involves sortingmeasured energy into sphericalmodes• Higher order modes are caused byreflections and can be filtered outif identified to be outside thephysical boundary of the antenna• Plot at right shows• Normal SNF modes• Modes after phase center trans.• Mode cutoff chosen based onphysical aperture size limit0-5-10-15-20-25-30-35-40-45-50-55-60-65-70Meas Trans maxmodes = 610 20 30 40 50 60Mode N Number14
Key <strong>MARS</strong> Requirements• Over sampling the data in Theta and Phi helps the process• Offsetting antenna phase center helps the process• Need to estimate or determine the phase center of the AUT• Not required <strong>for</strong> <strong>MARS</strong>• Knowledge of the AUT pattern• Knowledge of the test range configuration• Not frequency limited15
DLP Results With <strong>MARS</strong> ON/OFF<strong>Reflection</strong> level at 1, 10, 17 GHz16
dBError Level & Improvement <strong>for</strong> DLPError Level Improvment with <strong>MARS</strong>Error level Error level with <strong>MARS</strong> <strong>MARS</strong> Improvement30.020.010.00.0-10.0-20.0-30.0-40.0-50.0-60.0<strong>MARS</strong> ImprovementError Level0 5 10 15 20Frequency (GHz)17
WR-284 OEWG Result<strong>Reflection</strong> level at 2.5, 3.2, 4 GHz18
dBError Level Improvement <strong>for</strong> WR-284 OEWG20.0Error Level ImprovementError level Error level with <strong>MARS</strong> <strong>MARS</strong> Improvement0.0<strong>MARS</strong> Improvement-20.0-40.0-60.0Error Level2.500 2.750 3.000 3.250 3.500 3.750 4.000Freq (GHz)19
Open Lab Test Results – WR-1500 SGH• Open assemblylab at NSI• No absorber!• Good resultsachieved with<strong>MARS</strong>processing20
Amplitude (dB)Amplitude (dB)Open Lab Test Results – WR-1500 SGHFar-field amplitude of NSI-RF-SG1500_on_NSI-700S-95 SNF in lab_009.NSIFar-field amplitude of NSI-RF-SG1500_on_NSI-700S-95 SNF in lab_009.NSI00.49 GHz 0.56 GHz 0.63 GHz 0.70 GHz 0.75 GHz00.49 GHz 0.56 GHz 0.63 GHz 0.70 GHz 0.75 GHz-5-5-10-10-15-15-20-20-25-25-30-30-35-35-40-40-45-45-50-50-55-55-60-80 -60 -40 -20 0 20 40 60 80Azimuth (deg)-60-80 -60 -40 -20 0 20 40 60 80Azimuth (deg)21
Directivity(dBi)Directivity(dBi)Open Lab Test Results – WR-1500 SGHDirectivity vs. Frequency of C:\i-drive\NSI97\data\NSI-RF-SG1500\on 700S-95 NSF in open lab at NSI\NSI-RF-SG1500_on_NSI-700S-95 SNF in lab_009.NSIWorst-case difference 1.33 dB; average 0.76 dBDirectivity vs. Frequency of C:\i-drive\NSI97\data\NSI-RF-SG1500\on 700S-95 NSF in open lab at NSI\NSI-RF-SG1500_on_NSI-700S-95 SNF in lab_009.NSI<strong>MARS</strong> correction ON - Worst-case difference 0.66 dB; average 0.30 dB18.0Measured DirectivityCalculated NRL Directivity18.0Measured DirectivityCalculated NRL Directivity17.517.517.017.016.516.016.515.516.015.015.514.514.013.513.012.515.01.3 dB p-p 0.7 dB p-p14.514.013.512.00.50 0.55 0.60 0.65 0.70 0.75Frequency (GHz)13.00.50 0.55 0.60 0.65 0.70 0.75Frequency (GHz)22
Open Lab Test Results – WR-1500 SGH<strong>Reflection</strong> level at 0.49, 0.63, 0.75 GHz23
dBOpen Lab Test Results – WR-1500 SGHError Level vs FreqError level Error level with <strong>MARS</strong> <strong>MARS</strong> Improvement20.010.00.0-10.0-20.0-30.0-40.0Error Level0.450 0.500 0.550 0.600 0.650 0.700 0.750Freq (GHz)<strong>MARS</strong> Improvement24
<strong>MARS</strong> Improvement SummaryAntenna AverageErrorLevelAverageError Levelw/<strong>MARS</strong><strong>MARS</strong>improvementFrequencyAntenna / Chamberconfiguration1 -30 dB -47 dB 17 dB 0.5 - 18 GHz Dual LP antenna in newNSI chamber with36” pyramidalabsorber2 -41 dB -52 dB 11 dB 2.6 – 3.95 GHz WR-284 OEWG in newNSI chamber with36” pyramidalabsorber3 -11 dB -23 dB 12 dB 0.49 – 0.75 GHz WR-1500 SGH in openlab environment withno absorber25
Summary• New Chamber at NSI characterized <strong>for</strong> reflection level from0.5 to 18 GHz• Used relatively simple comparison technique and <strong>MARS</strong>reflection suppression technique to establish chamberreflection level with and without <strong>MARS</strong>• -30 dB to -40 dB error level <strong>for</strong> NSI chamber• -40 dB to -50 dB error level improvement with <strong>MARS</strong>• Showed <strong>MARS</strong> ability to extend frequency coverage ofchamber26