4 MB - SKB
4 MB - SKB
4 MB - SKB

Create successful ePaper yourself
Turn your PDF publications into a flip-book with our unique Google optimized e-Paper software.
Technical ReportTR-01-10Äspö Hard Rock LaboratoryAnnual Report 2000Svensk Kärnbränslehantering ABJune 2001Svensk Kärnbränslehantering ABSwedish Nuclear Fueland Waste Management CoBox 5864SE-102 40 Stockholm SwedenTel 08-459 84 00+46 8 459 84 00Fax 08-661 57 19+46 8 661 57 19
Äspö Hard Rock LaboratoryAnnual Report 2000Svensk Kärnbränslehantering ABJune 2001
AbstractThe Äspö Hard Rock Laboratory constitutes an important component of <strong>SKB</strong>’s work todesign, construct, and implement a deep geological repository for spent nuclear fuel andto develop and test methods for characterisation of selected repository sites.The rock surrounding the repository constitutes a natural barrier to release of radionuclidesfrom a deep repository. The retention effect of the rock has been studied bytracer tests in the Tracer Retention Understanding Experiments (TRUE) and the TRUEBlock Scale (TRUE BS). These tests are supplemented by the new Long Term DiffusionExperiment (LTDE) . The experimental programme is designed to generate data forconceptual and numerical modelling at regular intervals. During year 2000 the fieldexperiments of TRUE BS (50 m scale) were completed and preparations made for theLTDE (migration through a fracture wall and into the rock), including boring ofapproximately 10 m deep hole with 300 mm diameter. TRUE (5 m scale) completedearlier than year 2000 was finally reported.Laboratory investigations have difficulties in simulating natural conditions and needsupplementary field studies to support validation exercises. A special borehole probe,CHEMLAB, has therefore been designed for different kinds of validation experimentswhere data can be obtained representative for the in-situ properties of groundwater atrepository depth. During 2000 migration experiments were made with actinides (Am,Np and Pu) in CHEMLAB 2, the simplified supplement to CHEMLAB 1.Colloids of nuclides as well as of bentonite might affect the migration of releasedradionuclides and a separate project was planned during 2000 to assess the existance,stability and mobility of colloids.The development of numerical modelling tools continues with the general objective toimprove the numerical models in terms of flow and transport and to update the sitescaleand laboratory scale models for the Äspö HRL. Modelling of groundwater flow andtransport of solutes is made within a Task Force with eight of the international organisationsrepresented. The Task 5 was completed during the year and the Task 6 plannedfor.The Matrix Fluid Chemistry project aims at determining the origin and age of matrixfluids and the experiment has been designed to sample matrix fluids from predetermined,isolated borehole sections by specialised equipment. The water pressure has slowly raisedin section 4 during the year, but not to a level where sampling can be made.The Äspö HRL also has the task to demonstrate and perform full scale tests of thefunction of different components of the repository system, which are of importance forlong-term safety. It is also important to show that high quality can be achieved in design,construction, and operation of a repository. Several experiments are in operation. ThePrototype Repository experiment is focused on testing and demonstrating repositorysystem function in full scale, and consists of six deposition holes with canisters andelectric heaters surrounded by highly compacted bentonite. The tunnel is to be backfilledand plugged The work during 2000 has focused on geoscientific characterisationand specially hydraulic properties and conditions of the rock. Preparatory work with3
design, purchase and manufacturing as well as rock work (slots for the two plugs)have been going on with the aim of preparing for start of installation during thesecond quarter of 2001. In September the contract with EC was signed for a periodof 42 months.Equipment for installation of bentonite blocks and canisters were testedbefore start of installation in the Canister Retrieval Test. This test was completed inOctober and the heaters as well as the artificial saturation system was turned on immediatelythereafter. The thermal load in the canister was set to 1700 W initially, which isthe average load in the canisters in the future Swedish programmeme. After threemonths the load will be increased to 2600 W in order to obtain a temperature of 90°Con the surface of the single canister.The objectives of the Demonstration of Repository Technology are to develop, test,and demonstrate methodology and equipment for encapsulation and deposition of spentnuclear fuel. The demonstration of handling and deposition is made with the speciallydesigned full scale prototype to a deposition machine at 420 m level. This tunnel is alsoused as an exhibition hall for information about the Swedish Waste ManagementProgramme.The Backfill and Plug Test includes tests of backfill materials and emplacement methodsand a test of a full-scale plug. Half the test part is filled with a mixture of 30% bentoniteand crushed granite rock. The other half is filled with crushed rock without addition ofbentonite, except for the upper 100–200 mm, where a slot was filled with blocks ofhighly compacted bentonite/crushed rock mixture and bentonite pellets. The backfilland rock has been instrumented with about 230 transducers for measuring the thermohydro-mechanicalprocesses. Water saturation has been going on the whole year and thesaturation speed has been slower than expected due to a lower salt content in the waterthan expected. In order to increase the speed a water with a higher salt content can beadded and a higher water pressure applied. Still the saturation is expected to take thewhole of year 2001 as well.The Long Term Tests of Buffer Material (LOT) aims to validate models of bufferperformance at standard KBS-3 repository conditions, and at quantifying clay bufferalteration processes at adverse conditions. In this context adverse conditions have referenceto e.g. super saline ground water, high temperatures, high temperature gradientover the buffer, high pH and high potassium concentration in clay pore water. Further,related processes regarding microbiology, radionuclide transport, copper corrosionand gas transport are also studied. On-going activities during year 2000 have beenon-line readings of temperature, total pressure, water pressure and water content.Decommissioning of one out of five parcels is scheduled to take place in 2001.The operation of the facility has worked properly and an extensive rock supportprogrammeme has been carried through covering the whole tunnel. The informationgroup’s main goal is to create public acceptance for <strong>SKB</strong> in co-operation with otherdepartments in <strong>SKB</strong>. This is achieved by giving information about <strong>SKB</strong>, the Äspö HRLand the <strong>SKB</strong> siting programmeme. The visitors are also given a tour of the Äspö HRL.During year 2000 12 760 visitors (12 211 during year 1999) came to the Äspö HRL.They have represented the general public, communities where <strong>SKB</strong> performs feasibilitystudies, teachers, students, politicians, journalists and visitors from foreign countriesOne objective with the Äspö HRL is to test and develop techniques before they areapplied at the candidate sites. In this context efficient techniques are required to handle,interpret and archive the huge amount of data collected during site characterisation.At present the SICADA data structure contains the sciences engineering, geology,4
geophysics, geotechnics, groundwater chemistry, hydrology, meteorology and rockmechanics. Data have successively been stored in SICADA during the year. On-linerecording of groundwater changes (hydraulic and chemical) has been made by theinstalled Hydro Monitoring System (HMS). Groundwater sampling was performedonce in boreholes drilled from the ground surface and from the underground tunnels.The analysis presented expected results.Nine organisations from eight countries participated during 2000 in the Äspö HRLresearch in addition to <strong>SKB</strong>.5
SammanfattningÄspölaboratoriet utgör en betydelsefull del av <strong>SKB</strong>:s arbete med utformning, byggeoch drift av ett djupförvar för använt kärnbränsle samt för utveckling och testning avmetoder för karakterisering och val av förvarsplats.Bergmassan som omger ett förvar utgör en naturlig barriär mot radionuklider från ettdjupförvar. Bergmassan förmåga att fördröja transporten har studerats med hjälp avspårämnesförsök i Tracer Retention Understanding Experiments (TRUE) och TRUEBlock Scale (TRUE BS). Dessa försök kompletteras med det nya Long Term DiffusionExperiment (LTDE). Försöksprogrammet är utformat för att ta fram data till regelbundenkonceptuell och matematisk modellering. Under år 2000 avlutades experimenteni TRUE BS (50 m skala) samt förbereddes LTDE-försök (transport genom en sprickasbergvägg och in i bergmassan), inkluderande borrning av ett nära 10 m djupt hål meddiametern 300 mm. TRUE (5 m skala), som avslutades före år 2000, slutrapporterades.Laboratoriestudier har svårt att simulera naturliga förhållanden och behöverkompletteras med fältstudier för att stödja valideringsstudier. En speciell borrhålsutrustning,CHEMLAB, har därför utformats för olika slag av valideringsexperiment,där data kan erhållas som är representativa för in situ-förhållande i grundvatten påförvarsdjup. Under år 2000 har transportexperiment gjorts med aktinider (Am, Npoch Pu) i CHEMLAB 2, den förenklade kompletteringen till CHEMLAB 1.Kolloider av nuklider liksom av bentonit kan påverka transporten av frigjorda radionuklideroch ett separat projekt planerades under år 2000 för analys av förekomst,stabilitet och rörlighet hos kolloider.Utvecklingen av matematisk modelleringsverktyg fortsätter med det allmänna syftet attförbättra de numeriska modellerna i fråga om flöde och transport samt att uppdateramodellerna i plats-skala och laboratorieskala för Äspö HRL. Modellering av grundvattenflödeoch transport av lösta ämnen görs i en Task Force med åtta deltagande,internationella organisationer. Task 5 avslutades under 2000 och Task 6 planerades.Projektet Matrix Fluid Chemistry syftar till att bestämma ursprung och ålder hos matrisvatten,och experimentet has utformats i syfte att provta matrisvatten från förutbestämda,isolerade borrhålssektioner med hjälp av specialinstrument. Vattentrycket har under åretsakta stigit i sektion 4 men inte till en sådan nivå att provtagning är möjlig.Äspö HRL har också till uppgift att demonstrera och genomföra fullskaleexperiment påolika förvarskomponenters funktion, vilka är viktiga för den långsiktiga säkerheten. Detär också viktigt att visa att en hög kvalitet kan uppnås i utformning, byggande och driftav ett djupförvar. Flera experiment pågår.Prototypförvaret fokuseras på test och demonstration av förvarskomponenters funktioni fullstor skala och består av sex deponeringshål med kapslar och elektriska värmareomgivna av högkompakterad bentonit. Tunneln återfylls och pluggas igen. Arbetet under2000 har koncentrerats på geovetenskaplig karakterisering av bergmassan, speciellt dessgeohydrauliska egenskaper och förhållanden. Förberedande arbete med utformning,upphandling och tillverkning liksom bergarbeten (slits till de två pluggarna) har pågåttmed målet att förbereda för installationsstart under andra kvartalet 2001. I septemberskrevs kontraktet med EU under gällande en period på 42 månader.7
Utrustning för installation av bentonitblock och kapslar testades innan installationen avCanister Retrieval Test startade. Denna installation var klar i oktober då också värmarnaoch det artificiella bevätningssystemet slogs på. Den termiska lasten i kapsel sattes frånbörjan in på 1700 W, vilket är den beräknade, genomsnittliga effekten i varje kapsel idet framtida djupförvaret. Efter tre månader ska effekten höjas till 2600 W så atttemperaturen blir 90°C på ytan av den ensamma kapseln.Syftet med Demonstration of Repository Technology är att utveckla, testa ochdemonstrera metod och utrustning för inkapsling och deponering av använt kärnbränsle.Demonstration av hantering och deponering görs med den specialbyggda fullskaleprototypentill deponeringsmaskin på 420 m nivå. Nivån används också som besökshallför information om det svenska avfallsprogrammet.Backfill and Plug Test inkluderar tester av återfyllnadsmaterial och inplaceringsmetodersamt test av en fullskaleplugg. Halva experimentet är fyllt med en blandning av 30%bentonit och 70% krossat berg. Den andra halvan är fylld med krossat berg utanbentonittillskott förutom i taket där ett 100–200 mm tjockt lager byggts upp avhögkompakterade block av bentonit och krossat berg samt bentonitpellets. Återfyllenoch berget har försetts med 230 mätinstrument för termo-hydro-mekaniska processer.Vattenmättnad har pågått hela året och mättnadshastigheten har varit långsammare änberäknat till följd av lägre salthalt i grundvattnet än förväntat. För att öka på vattenmättnadshastighetenkan salthalten i det tillsatta vattnet ökas och ett högre vattentryckläggas på. Ändå tar bevätningen hela år 2001.Long Term Tests of Buffer Material (LOT) syftar till validering av modeller förbuffertens funktion under normala KBS-3-förhållanden samt till kvantifiering avomvandlingsprocesser i bufferten under onormala förhållanden. I detta sammanhangbetyder onormala förhållanden hög salthalt i grundvattnet, hög temperatur, högtemperaturgradient över bufferten, högt pH och hög kaliumkoncentration i bentonitleransporer. Processer rörande mikrobiologi, radionuklidtransport, kopparkorrosion ochgastransport studeras också. Pågående aktiviteter under 2000 har varit kontinuerligavläsning av givare för temperatur, totalt tryck, vattentryck och vatteninnehåll. Rivningav ett av fem paket görs under 2001.Driften av Äspöanläggningen har flutit på programenligt och ett omfattande bergförstärkningsprogramhar genomförts i hela tunneln. Informationsgruppens huvudsakligamål är att i samarbete med andra avdelningar inom <strong>SKB</strong> skapa acceptans hos allmänhetenför <strong>SKB</strong>. Detta sker genom information om företaget, Äspö HRL och <strong>SKB</strong>:splatsvalsprogram. Besökare guidas också under jord. Under år 2000 besökte 12 760personer Äspö (12 211 under 1999). De representerade allmänheten, kommuner där<strong>SKB</strong> bedriver förstudier, lärare, politiker, journalister och andra länder.Ett syfte med Äspö HRL är att test och utveckla teknik innan den kommer tillanvändning på kandidatplatserna. I detta sammanhang är effektiv teknik nödvändig föratt hantera, tolka och arkivera stora mängder data som samlas in under platskarakteriseringen.För närvarande innehåller SICADA datastruktur för ingenjörsvetenskap, geologi,geofysik, geoteknik, grundvattenkemi, hydrologi, metrologi och bergmekanik. Data harkontinuerligt lagrats i SICADA under året. Kontinuerlig registrering av grundvattenförändringar(hydrauliska och kemiska) har gjorts av Hydro Monitoring System (HMS).Grundvattenprovtagning har skett en gång i borrhål från dagen och från under jord.Analysresultaten redovisade förväntade värden.Nio organisationer från åtta länder deltog under 2000 i Äspö HRL:s forskning förutom<strong>SKB</strong>.8
Content1 General 131.1 Background 131.2 Goals 151.3 Organisation 161.3.1 Repository Technology and the Äspö HRL 161.3.2 International participation in Äspö HRL 181.3.3 Advisory Groups 181.3.4 Task Force on modelling of groundwater flow andtransport of solutes 191.4 Allocation of experimental sites 192 Methodology for detailed characterisation ofrock underground 212.1 General 212.2 Underground measurement methods and methodology 212.2.1 Background 212.2.2 Objectives 222.2.3 Results 222.2.4 Planned Work 222.3 Rock Visualisation System 222.3.1 Background 222.3.2 Objectives 222.3.3 System concept 232.3.4 Results 243 Test of models for description of the barrier functionof the host rock 273.1 General 273.2 Numerical Modelling293.2.1 Background 293.2.2 Objectives 293.2.3 Modelling concept 303.2.4 Results 303.3 Tracer Retention Understanding Experiment 433.3.1 TRUE-1 433.3.2 TRUE Block Scale 463.3.3 Long-Term Diffusion Experiment 563.4 The REX-experiment 623.4.1 Background 623.4.2 Experimental concept 623.4.3 Results 633.4.4 Main Conclusions from the REX Project 673.5 Radionuclide retention (include CHEMLAB) 673.5.1 Background 673.5.2 Objectives 683.5.3 Experimental concept 693.5.4 Results 699
3.6 Degassing and two-phase flow 743.6.1 Introduction 743.6.2 Two-phase flow 753.6.3 Groundwater degassing 763.7 Hydrochemistry modelling/Hydrochemical stability 813.7.1 Background 813.7.2 Objectives 813.7.3 Model concepts 823.7.4 Results 823.7.5 Conclusions and implications to repository perforemance 833.8 Matrix Fluid Chemistry 853.8.1 Background 853.8.2 Objectives 853.8.3 Experimental Configuration 853.8.4 Programme 853.8.5 Drillcore studies 863.8.6 Sampling863.8.7 Hydraulic character of the rock matrix 873.8.8 The surrounding hydrochemical environment of thematrix borehole 893.8.9 Future activities and milestones 933.9 The Task Force on modelling of groundwater flow andtransport of solutes 933.9.1 Background 933.9.2 Objectives 943.9.3 Results 943.10 Colloids 953.10.1 Background 953.10.2 Objectives 963.10.3 Experimental concept 963.10.4 Scope of work for 2000 973.11 Microbe 983.11.1 Background 983.11.2 Objectives 993.11.3 Experimental concept 993.11.4 Results 1003.11.5 Groundwater chemistry 1003.11.6 Microbiology 1013.11.7 Principal component analysis of groundwaterchemistry results 1024 Demonstration of technology for and function of importantparts of the repository system 1034.1 General 1034.2 The Prototype Repository 1034.2.1 Background 1034.2.2 Objectives 1044.2.3 Experimental concept 1044.2.4 Results 1074.2.5 EU-project 1124.3 Demonstration of Disposal Technology 1134.3.1 Background 11310
4.4 Backfill and Plug Test 1154.4.1 Background 1154.4.2 Objectives 1154.4.3 Experimental concept 1164.4.4 Results 1184.5 Canister Retrieval Test 1194.5.1 Background 1194.5.2 Objectives 1204.5.3 Experimental concept 1204.5.4 Results 1214.6 Long term test of buffer material 1244.6.1 Background 1244.6.2 Objectives 1244.6.3 Experimental concept 1254.6.4 Results 1264.6.5 Planned work 1265 Äspö facility operation 1295.1 Plant operation 1295.2 Information and public relations 1305.3 Data management and data systems 1315.3.1 Background 1315.3.2 Objectives 1325.3.3 System concept 1335.3.4 Results 1355.4 Monitoring of groundwater head and flow 1365.4.1 Background 1365.4.2 Objectives 1365.4.3 Results 1365.5 Quality Assurance 1375.5.1 Background 1375.5.2 Objectives 1375.5.3 Results 1376 International cooperation 1396.1 Current international participation in the ÄspöHard Rock Laboratory 1396.2 Summary of work by participating organisations 1406.2.1 Posiva 1406.2.2 ANDRA 1486.2.3 Japan Nuclear Cycle Development Institute 1566.2.4 BMWi 1726.2.5 GRS 1786.2.6 USDOE/Sandia 180References 185List of papers and articles published 2000 192Document published 2000 19311
1 General1.1 BackgroundThe Äspö Hard Rock Laboratory constitutes an important component of <strong>SKB</strong>’s work todesign and construct a deep geological repository for spent fuel and to develop and testmethods for characterisation of selected repository site. The role of the Äspö Hard RockLaboratory is to provide input to the performance assessments that have to be suppliedas part of each license application and to develop, test, and evaluate methods for siteinvestigations, detailed investigations, repository construction as well as disposal andbackfilling of tunnels before they are applied within the deep repository programme.The Äspö HRL should also provide experience and train staff in performing the varioustasks within the deep repository programme. Äspö HRL also offers the opportunity totest various aspects of repository performance during a long time, up to 20 years, andwill hence provide valuable input to the evaluation made in conjunction with applicationfor regular operation of the deep repository.In 1986 <strong>SKB</strong> decided to construct the underground rock laboratory in order to providean opportunity for research, development, and demonstration in a realistic and undisturbedunderground rock environment down to the depth planned for a future deeprepository. In the autumn of 1986, <strong>SKB</strong> initiated field work for the siting of the undergroundlaboratory in the Simpevarp area in the municipality of Oskarshamn (Figure1-1), and focused the work at the end of 1988 to the southern Äspö about 2 km north ofthe Oskarshamn power station. Excavation started on October 1 st , 1990 after approvalhad been obtained from the authorities concerned, and was completed in February 1995.Figure 1-1. Location of the Äspö HRL.13
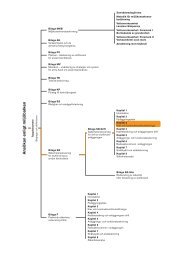
The Äspö HRL has been designed to meet the needs of the research, development, anddemonstration projects that are planned for the Operating Phase. The underground partof the laboratory consists of a tunnel from the Simpevarp peninsula to the southern partof Äspö where the tunnel continues in a spiral down to a depth of 450 m (Figure 1-2).The total length of the tunnel is 3600 m where the last 400 m have been excavated by atunnel boring machine (TBM) with a diameter of 5 m. The first part of the tunnel hasbeen excavated by conventional drill and blast techniques. The underground tunnel isconnected to the ground surface through a hoist shaft and two ventilation shafts. ÄspöResearch Village is located at the surface on the Äspö Island and it comprises officefacilities, storage facilities, and machinery for hoist and ventilation (Figure 1-3).The work with the Äspö HRL has been divided into three phases: the pre-investigationphase, the construction phase, and the operating phase.During the Pre-investigation phase, 1986–1990, studies were made to provide backgroundmaterial for the decision to locate the laboratory to a suitable site. The naturalconditions of the bedrock were described and predictions made of geological, hydrogeological,geochemical etc conditions to be observed during excavation of the laboratory.This phase also included planning for the construction and operating phases.During the Construction phase, 1990–1995, comprehensive investigations and experimentswere performed in parallel with construction of the laboratory. The excavation ofthe main access tunnel to a depth of 450 m and the construction of the Äspö ResearchVillage were completed.The Operating phase began in 1995. A preliminary outline of the programme forthe Operating phase was given in <strong>SKB</strong>’s Research, Development and Demonstration(RD&D) Program 1992. Since then the programme has been revised and the basis forthe current programme is described in <strong>SKB</strong>’s RD&D Program 1998.Figure 1-2. Overview of the Äspö Hard Rock Laboratory Facilities.14
Figure 1-3. Overview of the Äspö Research Village.1.2 Goals<strong>SKB</strong> decided to construct the Äspö HRL for the main purpose of providing an opportunityfor research, development and demonstration in a realistic and undisturbed undergroundrock environment down to the depth planned for the future deep repository.Important tasks for the Äspö HRL are:• to increase scientific understanding of the safety margins of the deep repository,• to test and verify technology that provide cost reductions and simplifies the repositoryconcept without compromising safety,• to demonstrate technology that will be used in the deep repository,• to provide experience and training of staff, and• to inform about technology and methods to be used in the deep repository.To meet the overall time schedule for <strong>SKB</strong>’s RD&D work, the following stage goalshave been defined for the work at the Äspö Hard Rock Laboratory.15
1 Verify pre-investigation methodsdemonstrate that investigations on the ground surface and in boreholes providesufficient data on essential safety-related properties of the rock at repository level, and2 Finalise detailed investigation methodologyrefine and verify the methods and the technology needed for characterisation of therock in the detailed site investigations.3 Test models for description of the barrier function of the host rockfurther develop and at repository depth test methods and models for description ofgroundwater flow, radionuclide migration, and chemical conditions during operationof a repository and after closure.4 Demonstrate technology for and function of important parts of therepository systemtest, investigate and demonstrate on a full scale different components of importancefor the long-term safety of a deep repository system and to show that high quality canbe achieved in design, construction, and operation of system components.1.3 Organisation1.3.1 Repository Technology and the Äspö HRLThe Äspö HRL and the associated research, development, and demonstration tasks aremanaged by the Director of Repository Technology (Olle Olsson). The InternationalCooperation at the Äspö Hard Rock Laboratory is the responsibility of the Director ofRepository Technology, Olle Olsson, and <strong>SKB</strong>’s International Coordinator, MonicaHammarström.The Repository Technology unit is part of the Safety and Technology division that isresponsible for technical development of the repository system, research, and safetyassessments (Figure 1-4).Figure 1-4. Organisation chart for <strong>SKB</strong>.16
The Repository Technology unit is organised as a matrix organisation with three SeniorProject Managers with responsibility to define the programme and manage the projectswithin their respective areas of responsibility (Figure 1-5). The three main tasks are:• Site investigations with responsibility to provide an appropriate site investigationprogramme, methods, equipment, and a competent organisation for site and detailedinvestigations to be applied when needed.• Repository technology with responsibility for development, testing, planning, design,and demonstration of the technology and the methods needed to construct a deeprepository.• Natural barriers with responsibility for management and performance of researchprojects at the Äspö HRL aimed at resolving issues concerning the function of thenatural barrier.The Senior Project Managers report directly to the Director of Repository Technology.The staff is organised into the following groups:• The Technology and Science group is responsible for maintaining knowledge aboutthe characterisation and experimental methods that have been used and the resultsthat have been obtained from work at Äspö. The group is also responsible for thesuccessive updates of the geoscientific models of Äspö based on new data from theexperiments.• The Experiment Service group is responsible for the co-ordination of projects undertakenat the Äspö HRL and providing service (design, installations, measurements etc)to the experiments undertaken at Äspö HRL. They are also responsible for operationand maintenance of monitoring systems and experimental equipment at Äspö.Figure 1-5. Organisation of Repository Technology.17
• The Computer Systems group is responsible for operation and maintenance of computerhardware at <strong>SKB</strong>’s offices in Oskarshamn. They are also responsible for thefurther development and administration of <strong>SKB</strong>’s geoscientific database, SICADA,and the Rock Visualisation System (RVS).• The Facility Operations group is responsible for operation and maintenance of theÄspö HRL offices, workshops and underground facilities.• The Information group is responsible for arranging visits to <strong>SKB</strong>’s facilities andproviding information to visitors to Äspö HRL and <strong>SKB</strong>’s other facilities inOskarshamn.• The Administration group is responsible for providing administrative service andquality systems.Each major research and development task is organised as a project that is led by aProject Manger who reports to one of the Senior Project Managers. Each ProjectManager will be assisted by an On-Site Co-ordinator from the Äspö HRL with responsibilityfor co-ordination and execution of project tasks at the Äspö HRL. The staff at thesite office provides technical and administrative service to the projects and maintains thedatabase and expertise on results obtained at the Äspö HRL.1.3.2 International participation in Äspö HRLThe Äspö HRL has so far attracted considerable international interest. As of December2000 nine foreign organisations are participating in the Äspö HRL in addition to <strong>SKB</strong>.These organisations are: Japan Nuclear Cycle Development Institute (JNC), Japan;Central Research Institute of Electric Power Industry (CRIEPI), Japan; AgenceNationale pour la Gestion des Déchets Radioactifs (ANDRA), France; POSIVA Oy,Finland; United Kingdom Nirex Limited, NIREX, Great Britain; NationaleGenossenschaft für die Lagerung Radioaktiver Abfälle (NAGRA), Switzerland;Bundesministerium für Wirtschaft und Technologie (BMWi), Germany; EmpresaNacional de Residuos Radiactivos (ENRESA), Spain, and United States Departmentof Energy, Carlsbad Field Office (USDOE/CBFO).1.3.3 Advisory GroupsThe international partners and <strong>SKB</strong> reached a joint decision to form the Äspö InternationalJoint Committee (IJC) to be convened in connection with Technical EvaluationForum (TEF) meetings. The role of the IJC is to co-ordinate the contributions oforganisations participating in the Äspö HRL. The TEF meetings are organised tofacilitate a broad scientific discussion and review of results obtained and planned work.Technical experts from each participating organisation and the IJC delegates participatein the TEF meetings. Chairman of IJC/TEF is Tönis Papp and secretary is MonicaHammarström (during 2000).For each experiment the Äspö HRL management establishes a Peer Review Panelconsisting of three to four Swedish or International experts in fields relevant to theexperiment.18
1.3.4 Task Force on modelling of groundwater flow and transportof solutesThe Technical Co-ordinating Board (TCB) which preceded the IJC established the TaskForce on modelling of groundwater flow and transport of solutes. The Task Forcereviews and or proposes detailed experimental and analytical approaches for investigationsand experiments at Äspö HRL. The group convenes twice a year. Approximatelyten different modelling groups are now actively involved in the work. Chairman (December2000) is Gunnar Gustafson, CTH and secretary is Mansueto Morosini, <strong>SKB</strong>.1.4 Allocation of experimental sitesThe rock volume and the available underground excavations have to be divided betweenthe experiments performed at the Äspö HRL. It is essential that experimental sites beallocated so that interference between different experiments is minimised. The currentallocation of experimental sites within the Äspö HRL is shown in Figure 1-6.Figure 1-6. Underground excavations at the 300–450 m levels and current allocation of experimentalsites.19
2 Methodology for detailed characterisation ofrock underground2.1 GeneralA programme for detailed characterisation will be devised before detailed characterisationis initiated on a selected site and construction of the surface and undergroundportions of the deep repository is commenced. In conjunction with the excavationof theÄspö tunnel, several different investigation methods have been tested and the usefulnessof these methods for detailed characterisation for a deep repository is being evaluated.Preliminary experience from Äspö shows that there is a need for refinement of thesemethods to enhance the quality of collected data, boost efficiency and improve reliabilityin a demanding underground environment. Furthermore, the detailed characterisationprogramme needs to be designed so that good co-ordination is obtained between rockinvestigations and construction activities.The objectives are:• to test existing and new methods to clarify their usefulness for detailed characterisation.The methods to be tested are chosen on the basis of their potential use withinthe detailed characterisation programme,• to refine important methods in a detailed characterisation programme to enhancedata quality, efficiency and reliability.Detailed characterisation will facilitate refinement of site models originally based ondata from the ground surface and surface boreholes. The refined models will provide thebasis for updating the layout of the repository and adapting it to local conditions. Due tothe heterogeneity of the rock, the layout of the repository needs to be adapted to thegradually refined model of rock conditions. This approach has a long tradition in undergroundconstruction and it should be used also for a deep repository.2.2 Underground measurement methods and methodology2.2.1 BackgroundDetailed investigation for <strong>SKB</strong>’s deep repository will include a characterisation stepinvolving one candidate site, subsequent following the site investigation which isexpected to be carried out on at least two sites (<strong>SKB</strong> has proposed investigation of therock in three municipalities representing three different geologic settings – municipalities’and government’s decisions are scheduled for year 2001). Detailed investigationswill mostly concern investigations from the underground.During the Construction phase of the Äspö HRL documentation, measurements andtesting activities from underground were performed. Other underground investigationmethods have been used, and will further on be used, during the Operational phase.Preliminary experience shows that methods and instruments in some cases have to beimproved, with regard to correctness in data, efficiency and robustness.21
2.2.2 ObjectivesThe aim is to evaluate the feasibility and usefulness of the methods used, define areas,methods and instruments where improvements have to be made. The work also includestesting of other methods (mainly commercially available) which have not been usedbefore. Tests of methods for detailed characterisation are mainly intended to be carriedout within the framework of ongoing projects.2.2.3 ResultsAn evaluation of MWD (Measurement While Drilling) used during drilling of 2 855metres of percussion probe holes during the excavation of the Äspö HRL tunnel hasbeen performed. During drilling of 20 m long probe holes on either side of the tunnela logging instrument from Bever Control A/S was used. Rate of penetration, feed pressure,rotational pressure and percussion pressure were monitored every 10 th centimetre.An evaluation of the data has been performed and presented like hardness and fracturingof the rock. The result is that the hardness can be evaluated relatively good, the fracturingneeds denser data sampling like one point per centimetre which is possible with thetechnique used today. Today it is also possible to monitor water flow and water pressurewhich can give information of the waterbearing features in the rock.2.2.4 Planned WorkA report on underground investigation methods used during the construction phase ofthe Äspö HRL will be published around mid 2001. The report will describe the differentmethods used with regard to instrument or other working tools and measurement methodology.Resolution and accuracy of the measured values as well as general aspects oferrors will be discussed. The evaluation part will address the usefulness and feasibility ofthe methods. Recommendations on possible modifications will also be given.Based on the report, but also on the basis of other project evaluation and validationreports, further testing of existing methods and testing of new methods will be planned.2.3 Rock Visualisation System2.3.1 BackgroundA digital three dimensional site descriptive model is built by successive collection,processing and interpretation of site data. All site data will be stored in SICADA (<strong>SKB</strong>’sSite Characterisation Database). Furthermore all geological and geophysical maps will beavailable in <strong>SKB</strong>’s GIS database. Advanced software applications are needed to create thesite descriptive model based on correct and documented sets of investigation data.2.3.2 ObjectivesThe experiences obtained from <strong>SKB</strong>’s site investigations and at Äspö HRL have shownthat it is very important to have the possibility to test interactively in 3D differentpossible connections between observations in boreholes, tunnels and on the groundsurface. By effectively visualising the model, based on available site data in SICADA,22
it is also possible to optimise new investigation efforts. Finally, during the design of theDeep Repository, the site descriptive model, also used as a basis in the safety assessment,will be the basis for adaptation of the tunnel layout to the different rock characteristicsat the site.To fulfil the above strategy and requirements <strong>SKB</strong> are developing the Rock VisualisationSystem. The Principal Investigators in the Äspö project and other geoscientific expertsin <strong>SKB</strong>’s organisation have been involved in defining the functions needed in the system.2.3.3 System concept<strong>SKB</strong>’s Rock Visualisation System is based on the CAD-system MicroStation/J. It isdesigned as a single-user system, but the data exchange link between RVS and <strong>SKB</strong>’sSite Characterisation Database System (SICADA) is based on a client/server technique.There is also a database engine (MS/Access 97) required on each RVS workstation. Anopen architecture based on the ODBC data exchange concept is used. Hence, by usingODBC, it will be easy to replace MS/Access 97 if another database is needed in thefuture.In the Rock Visualisation System, in contrast to standard MicroStation, the work is notbased on design files (drawing files) and levels but on projects and objects. In order towork in an organised matter, and for practical reasons, it is for larger projects highlyrecommended to separate the visualisation work into three sub-projects:• Data project (containing visualisations of background data).• Model project (containing modelled objects).• Construction project (containing underground constructions).Hence, data, model and construction can be handled separately which is a great advantage,mainly regarding version handling, when data are updated continuously and muchmore often than the model. The data project is normally attached as a backgroundproject to the model project. In the same way the model project is used as a backgroundproject when working with underground construction tasks.For small projects, limited in time and extension, it could, however, be more efficient togather all information in one project, but independent of how the total set of objectsare managed they can be mixed arbitrary when displayed on the screen. An example isshown in Figure 2-1. By using the object list, an unique feature in the system, objects canbe turned on (visible) or off (not visible).From the users point of view the system can be divided in four main parts, namely:• Data visualisation (mainly borehole data).• Modelling.• Construction.• Drawing.An overview description of each part has been presented in the Annual Report for 1997.23
Figure 2-1. Objects can be turned on (visible) or off (not visible), by using the object selector. Themodel volume visualised in this case includes visible objects of several types including borehole data,modelled objects (a fracture zone in brown and two rock bodies in red and green) and constructionobjects (tunnels in yellow).2.3.4 ResultsRVS version 2.1 and 2.2 has been released during 2000. The programming of version2.3 was completed in December 2000. Totally more than 30 new or improved existingfunctions have been produced. Some of these functions are described briefly in thefollowing text.The unique Object List has been improved. As a result it will be easier to have an overviewof all active objects in a model or set of visualisations. As an example all boreholevisualisations are stored as sub-objects to the borehole it self. A new column, named user,has also been inserted in the Object List. This column stores the name of the personwho has created a certain object in the model. Some other columns in the list have beenrenamed in order to be more understandable.The new feature Work set has been introduced to make it possible for the user to reducethe amount of borehole data in the local database. As an additional positive effect thenumber of boreholes in some lists are shortened as wanted.In the previous version a discontinuity surface, describing a single fracture plane, wasautomatically extended to the borders of the modelled rock volume. This restriction hasbeen removed. A discontinuity is now extended by rules given by the user. It is also possibleto remodel discontinuities.Earlier imported DGN-files can now be reloaded if they have been updated in standardMicroStation/J during the modelling process.24
At some site investigation areas a set of co-ordinate systems have been used. Even thiscircumstance is supported by the latest version (2.3) of RVS. This improvement requiredlot of effort and time but resulted in useful modifications in the data structure ofSICADA.By using the software AuthorIT the on-line help have been refined. AuthorIT helps theadministrator to manage the complete set of information needed in a User’s manual.When the help information have been set up and configured, it is easy to produceHTML-documents, to be executed from any dialogue window in the RVS application,or printed documents.A review study project has been carried out. The aim with this project was to have anindependent opinion of the capabilities, but even lack of capabilities, available in theRock Visualisation System. The study done by Dr Matthew White and Dr Andy Lindat ENVIROSQUANTISCI in England will be an important basis when planning forfurther developments of <strong>SKB</strong>’s Rock Visualisation System. In the final report a set ofrecommendations have been presented.25
3 Test of models for description of the barrierfunction of the host rock3.1 GeneralThe Natural Barriers of a repository for spent nuclear fuel is the bedrock surroundingthe engineered barriers. The barrier functions considered when assessing the long termsafety are isolation, retention and dilution. These functions are provided by the very existenceof the bedrock, its properties and the on-going processes in the rock. The goal ofthe experiments within Natural Barriers is to increase the scientific knowledge of thesafety margins of the deep repository and to provide data for performance and safetyassessment calculations. The priority for the on-going experiments on the natural barriersis to concentrate the efforts on those experiments which results are needed for theplanning of the site investigations, planned to start in 2002.Isolation is the prime function of the repository. It is obtained through the co-functionof the engineered and the natural barriers. In the KBS-3 disposal concept the coppercanister is expected to remain unbroken for millions of years, in case it is intact at deposition.The bentonite clay barrier will further protect the copper canister mechanicallyagainst displacements across the deposition hole as well as chemically against transportof possible corrodants to the canister by minimising the flow of water to the canister.For other waste types, not insulated by copper, the flow of water to the canister/wastecontainment is largely determining the magnitude at which the corrosion and the dissolutionof the waste form can take place. For a good isolation it is thus necessary tominimise the groundwater flow to the waste containment.Additional conditions that affect the isolation are the chemistry of the groundwater andthe mechanical stability of the rock. Present day hydrochemistry is favourable for a lowcorrosion rate of the canister. These conditions can be expected to persist up to, at least,the next major glaciation. The host rock should provide mechanical protection for theengineered barriers and future rock movements should not jeopardise the integrity of theengineered barriers. This can be achieved by proper repository design and emplacementof spent fuel away from active faults.Conceptual and numerical groundwater flow models have been developed through theentire Äspö project up to now. Further development of the tools for groundwater flowand transport calculations is made to meet the needs of the site characterisation phase.Hydrochemical stability has been assessed for both present day as well as previous conditions.The aim has been to explain possible chemical conditions in a repository host rockbased on assumption of different climate conditions in the future. On-going projects aimat investigating the chemistry of the water in the pores of the rock matrix, and at understandingthe microbial effects on the groundwater chemistry.The retention of radionuclides dissolved in groundwater is the second most importantbarrier function of the repository. Retention will be provided by any system and processthat interacts with the nuclides dissolved in the groundwater when eventually the waterhas come in contact with the waste form and dissolved radionuclides. Retention is providedby the physical and chemical processes, which occur in the nearfield and farfield.27
Some elements are strongly retarded while the non-sorbing nuclides are migrating withthe speed of the flowing groundwater. The major emphasis in the safety assessmentcalculations has been on the weakly retarded nuclides because these can potentially betransported up to the biosphere.The large amount of activity in a repository is caused by the fission products, Cs, Sr, I,Tc, and the transuranic elements Am, Np, and Pu. The transuranics, Cs, and Tc are, ifdissolved, effectively sorbed in the near field. However, in case neptunium and technetiumare oxidized to neptonyl and pertechnetate by radiolyses from the waste they mightbe transported into the bentonite buffer before they are reduced to the insoluble tetravalentstate.Strontium and all negatively charged elements will be transported through the bentonitebuffer by diffusion. They will then be retarded by the interaction with the fractureminerals in the flow paths of the rock and through the diffusion into the rock matrix.The effective retention of these nuclides is a combination of radioactive decay, sorptionand diffusion. The more long-lived and the weaker the sorption of the nuclide, the moreimportant is the actual groundwater flow for the migration. The chemical compositionof the groundwater is important for the magnitude of sorption for some of the nuclides.Negatively charged nuclides are retarded from the groundwater flow only through thediffusion into the stagnant pores of the rock matrix.Tracer tests are carried out within experiments in the TRUE projects. These are conductedat different scales with the aim of identifying detailed scale (5 m) and block scale(50 m) flow paths, retention of weakly and moderately sorbing tracers and the effect ofmatrix diffusion. In 2000 the experimental part of TRUE Block Scale was completedand the Long Term Diffusion Experiment (LTDE) was initiated. Modelling of theexperiments is done by several groups associated to the Äspö Task Force for modellingof groundwater flow and transport of solutes.Colloids might affect the retention of radionuclides. A separate project was plannedduring 2000 to assess the existence, stability and mobility of colloids.CHEMLAB experiments are conducted with the moderately and highly sorbing nuclides.Experiments are carried out in simulated near field conditions (bentonite) and in tinyrock fractures. During 2001 experiments including effects of radiolysis will be carriedout in the CHEMLAB 1 unit. In the CHEMLAB 2 unit experiments with actinides willbe started.Dilution is the third barrier function. It will take place in the rock volume surroundingthe repository. The magnitude of dilution is very much depending on the site specificconditions, and for performance assessment calculations on the conceptualisation of theflow. In the geosphere the dilution is caused by the dispersion in the groundwater flow.No specific experiment is focussing on dilution. However, this process is included in aproposal for the next-coming modelling task within the Äspö Task Force for groundwaterflow and transport of solutes.28
3.2 Numerical Modelling3.2.1 BackgroundMathematical model for groundwater flow and transport are important tools in thecharacterisation and assessment of underground waste disposal sites. <strong>SKB</strong> has during theyears developed and tested a number of modelling tools and at Äspö HRL several modellingconcepts as Stochastic Continuum (SC), Discrete Fracture Network (DFN) andChannel Network (CN) have been used. SC approach has been used for the regional andsite scale models /Svensson, 1997a,b/ and in the laboratory scale model the startingpoint has been a fracture network for assigning hydraulic properties to a SC model/Svensson, 1999a/. The methodology of how to transform the fracture network to theSC was shown in Svensson /1999b/. This is called the GEHYCO concept. Based on thenew data available since the Äspö model 1996, reported in Rhén et al /1997b/, and thenew concept of generating the conductivity field /Svensson, 1999b/, it is planned toupdate the site, laboratory and (possibly) the regional models of the Äspö area.Tests of embedded grids have been made with the PHOENICS code. The purpose wasto see if it was feasible to generate local dense grids to get high resolution and betterpossibilities to define small features in the model. The technique is expected to be usefulfor regional, site and laboratory scale models. Both the non-uniform and BFC (BodyFitted Co-ordinates) grids generates cells with high aspect ratio, i.e. ∆ x /∆ y >>1, which isa disadvantage when spatial assignment method for hydraulic conductivity is chosen. Theadvantage with embedded grid is that the cells are cubic which is considered better basefor choosing spatial assignment method.3.2.2 ObjectivesThe general objective is to improve the numerical model in terms of flow and transportand to update the site-scale and laboratory scale models for the Äspö HRL. The modelsshould cover scales from 1 to 10 000 metres and be developed for the Äspö site, but begenerally applicable.The specific objectives with the updated models are:• Test and improve new methodology of generating a conductivity field based on afracture network in a continuum modelling approach.• Develop models for transport and dispersion.• Improve the methodology for calibration and conditioning the model to observedconductive features of the groundwater flow models.• Improve the handling of the inner boundary conditions in terms of generating thetunnel system and applying boundary conditions.• Improve the data handling in terms of importing geometrical data from the RockVisualisation System (RVS) to the numerical code for groundwater flow and to exportmodelling results to the RVS.• Increase the details in the models based on new knowledge of the Äspö site collectedduring the last years.29
3.2.3 Modelling conceptExperiences gained from international modelling tasks within the Äspö Task Force onmodelling of groundwater flow and transport of solutes have shown that the differentconcepts are all useful but development is deemed needed of both the codes in terms ofdata handling and visualisation. It is also necessary to continue developing and testingthe concepts /Gustafson and Ström, 1995; Gustafson et al, 1997/. The model code useduntil year 2000 is PHOENICS, which has been used in regional scale, sites cale andlaboratory models /Svensson, 1997a,b, 1999a/. A new code is under devepment by <strong>SKB</strong>which will be tested during 2001.The results from the construction phase of the Äspö HRL showed a relatively highnumber of events with a high inflow rate during drilling. Features with a hightransmissivity were drilled through at a number of times and these features were inseveral cases not a part of the deterministically defined major discontinuities. This hasalso been seen in boreholes made in the operation phase of the Äspö HRL. Thesefeatures were called High Permeability Feature (HPF). The spatial distribution of thesefeatures, and features with lower transmissivity, has been studied and is a basis for modifyingthe modelling concepts /Rhén and Forsmark, 1999; Rhén et al, 1997b/.High Permeability Feature (HPF), as defined in Rhén and Forsmark /1999/ consists ofa fracture, system of fractures, or a fracture zone with an inflow rate (observed duringdrilling or flow logging) which exceeds 100 l/min or alternatively show a transmissivityT ≥ 10 –5 m 2 /s. Some of the conclusions from the study of the data from the pre-investigationand the construction phase of the Äspö HRL are presented in Rhén andForsmark /1999/.3.2.4 ResultsThe different modelling concepts have their benefits and drawbacks. It seems that SCapproach may be most useful for the larger scales and the DFN approach has benefits inthe smaller scale. The use of the SC approach demands that spatial correlation modelscan be established. The use of conventional geo-statistical methods has indicated problemswhen tests from boreholes have been used. These methods do not take intoaccount the support scale in proper manner and the long distances between boreholesare a problem when a 3D-correlation structure is to be established. It was also stressedin Rhén et al /1997a/ the need to develop better spatial correlation models useful for theSC approach. One way of doing this is to incorporate geometrical models of the fracturenetwork for the generation of the correlation model or directly create the conductivityfield in a SC model. The first approach has been used by Hoch et al /1998/ and thesecond approach has been used by Svensson /1999a/. Important data for the test of themodel in Svensson /1999a/ is the statistics of hydraulic conductivity based on the injectiontests made with 3 m packer spacing but also the statistics of the distances betweenconductive features exceeding a specified limit of the transmissivity. The last type ofstatistics was for Äspö data presented in Rhén et al /1997b/ and later the analysis wasupdated with more data but focussed on High Permeability Features (HPF) /Rhén andForsmark, 1999/. Both the results from Hoch et al /1998/ and Svensson /1999a,b/ seempromising in terms of the possibilities of generation anisotropic conditions as well as amore realistic correlation structure in the SC models. A more advanced way of performinga geo-statistical analysis also indicate good correspondence between statistical modelbased on the injection tests made with 3 m packer spacing and the conductivity field inthe laboratory model /Painter, 1999; Svensson, 1999a/.30
PartrackTransport properties were only briefly studied during the pre-investigation and constructionphase of Äspö HRL. During the operation phase much more effort is paid toincrease the knowledge of the transport properties in fracture crystalline rock. Some ofthe results concerning transport properties in fracture crystalline rock was compiled inRhén et al /1997b/ and was also used in the modelling /Svensson, 1997b/. These relationsare approximate and uncertain but still considered useful for assigning properties tothe rock mass on a large scale. More relevant transport data are available from mainlythe TRUE project (Winberg, /1996/ and later reports from the project). Tests of modellingconcepts for transport in SC have also been made. In Svensson /1992, 1994/ it wastested how micro-dispersion and sorption could be incorporated into a particle trackingroutine. It was further developed and tested. The recent development is focused ondescription of physical and chemical processes. The basic idea in PARTRACK is that aparticle can have two states “moving” or “non-moving”. A frequency pair determines therates by which a particle should change state. Obviously it is possible to describe sorptionin this way but it has also been demonstrated that Taylor dispersion can be exactlyparameterised by the two states. Up to now it has, however, not been possible to handlemore than one process that causes dispersion. The recent development allows for severalphysical and chemical processes working in parallel. It is thus possible to simulate themovement of a particle that is exposed to, for example Taylor dispersion when moving inthe flow, diffusion into a stagnant pool, sorption on the walls of that pool and perhapseven diffusion into the rock matrix. The recent development of PARTRACK is employingsome concepts and formulations from the Multi-rate model of diffusion (Haggertyand Gorelick /1995/ and also the applications of McKenna /1999/). Presently the mathematicalderivations, software development and some basic tests have been carried out.It can be expected that future work should be directed towards implementation ofrelevant physical and chemical processes.Transport of a tracer travelling through a fracture network leads to dispersion for(at least) the following reasons as presented (see also Figure 3-1):• Intersections. At a fracture intersection a tracer cloud may split up and enter pathwayswith different lengths and fluid velocities. This type of dispersion is often calledmacro-dispersion.• Channelling. Spreading occurs within each fracture plane as the different streamlineshave different path lengths and velocities. The flow channels may also merge or splitup.• Taylor dispersion. A velocity profile exists between the two bounding walls of thefracture. The resulting dispersion effect is called shear or Taylor dispersion.• Matrix diffusion and sorption. Interaction with the rock, stagnant pools andmicrofissures causes a number of processes that in fact lead to a delay and dispersionof a tracer pulse. These include: sorption on the fracture walls, diffusion into the rockmatrix with sorption on inner surfaces and interaction with gouge.31
Figure 3-1. Illustration of processes leading to dispersion of a tracer pulse. Two intersecting fractureplanes (top) and micro-scale processes.The basic idea of PARTRACK can be described as follows, see also Figure 3-2:• A particle entering a scalar cell will, if no dispersion effects are activated, travelthrough the cell in a time which is equal to the free volume of the cell divided by theflow rate through the cell (a so called plug-flow). If dispersion effects are active thetravel time will, however, be different and will also be different for different particles.• When the particle is ready to leave the cell, it will leave through one of the cell wallsthat has an outgoing flow direction. The choice between cell walls with an outgoingflow is made with a likelihood that is proportional to the outflows. If several particlesare traced the cloud will thus split up in proportion to the flow rates. Completemixing in a cell is hence assumed.32
Figure 3-2. Illustration of concepts in the flow model (top) and subgrid processes affecting a particle’stravel time.Some basic concepts about PARTRACK with multiple particle states are brieflydescribed below.Consider the laminar velocity profile shown in Figure 3-3. The velocity profile is notsimulated in the flow model but an average pore velocity is obtained as a result of theflow calculation. The dispersion effect of the velocity profile can now be simulated byimaging a number of states a particle can be in and ascribe different velocities to eachstate; the states may be considered as different layers in the velocity profile, see Figure3-3. One may also like to simulate that a particle can get sorbed on the fracture wall,which then introduces one more state a particle can be in. Assume that five states aredefined for the simulation of Taylor dispersion and one state for sorption on the fracturewall. The definition of how a particle may move between the different states is thendone by the intensity matrix, shown in Figure 3-3. The first column gives the conditionsfor state one (the sorbed state). As can be seen, it only has a certain probability to moveto state two, which is the first layer in the fracture. The second column gives the conditionsfor layer one (state two) and so on. It can be shown that the frequency value for2change between two layers in the fracture is Dmol / ∆ , where D molis the moleculardiffusivity of the substance and ∆ the layer thickness.33
Figure 3-3. Illustration of particle states in PARTRACK.To verify that PARTRACK predicts the same breakthrough curves as the multi-ratemodel by McKenna /1999/, for a range of tracers with strongly varying sorptivity, thedat set as in McKenna /1999/ was used. Good agreement is found, see Figure 3-4,except for early arrival times, which may be due to different concepts used for mechanicaldispersion.The simple fracture network in 3D was used to demonstrate simultaneously actingprocesses. The resulting breakthrough curves can be studied in Figure 3-5. When nodispersion processes are activated (solid curve) it is possible to identify the peaks that aredue to the different pathways. When Taylor dispersion is added these peaks are masked.A variable aperture field gives some additional dispersion due to the channelling effect.The multi-rate diffusion process adds a long tail to the breakthrough curve.34
Figure 3-4. The multi-rate model. Comparison of breakthrough curves for tritiated water (HTO),Sr85 and Rb86. Dotted lines give the results from the model by McKenna /1999/............– - – -Advection only.Taylor dispersion added.Variable aperture added.Multi-rate diffusion added.Figure 3-5. Simultaneously acting processes. Breakthrough curves.35
Representation of porosity and connectivity in a continuum modelRepresentation of porosity and connectivity in a continuum model has been studied. Ifonly a steady state solution is sought, the porosity and connectivity structure will mainlyinfluence the dispersion of salt. For a transient simulation all aspects of the porosity andconnectivity structures will, however, be of crucial importance. The main reasons for thisare:• The advective transport velocity of salt is determined from the Darcy flux and thekinematic porosity (to be discussed and defined below).• Dispersion of salt is in principle a manifestation of different flow paths (on severalscales) and hence related to the porosity and connectivity structures of the rock.• Stagnant volumes in the rock may store large water volumes for very long timeperiods. If the long time evolution of the water chemistry is to be studied, it is essentialto characterise the stagnant volumes and their connections to the “moving” water.The analysis is focused on a sparsely fractured rock, as typically found at the Äspö HRL.It will be assumed that flow only takes place in the fracture network, i.e. flow in thematrix is neglected. In Figure 3-6 different parts of the network have been marked withletters; these will now be described:A: Represents a fracture zone. The fracture zone is assumed to be composed of anumber of smaller fractures through which the flow takes place. Most of the smallfractures do, however, not contribute to the flow but are still important for transportand dispersion of a tracer. Fracture zones are often the main flow conductors due totheir high transmissivity and size (length scale > 100 metres). The thickness is typically> 1 metre.B: Some fractures are best characterised as “a single opening”. Typically the thickness,or the aperture, is on the order of 10 –3 metres. The fractures marked with B in Figure3-1 have a through-flow and may hence contribute to the total flow rate. If the transporttime through the B fractures is different from the transport time in the fracture zone adispersion effect will also result from the parallel flow path.C: Isolated fractures or groups of fractures cannot contribute to the flow, transport ordispersion, as flow in the matrix is neglected. In the numerical model these are removedbefore the generation of grid data is performed.D: Some fractures, or fracture zones, may form “dead end systems”. The exchange withfractures with a significant flow is then by molecular diffusion. When storage of waterover long time periods, say longer than 100 years, is studied it is essential to representthe dead end systems correctly.E, F: There is always a lower limit on the fracture size that can be represented correctlyin a numerical simulation. In the present study it will be assumed that fractures below acertain size, to be discussed, do not contribute significantly to the total flow. However,for transport and dispersion it is probably necessary to consider all scales as a largefraction of the pore volume, is expected to be due to the small-scale features of theporosity field.36
ECDBEEBAEDBFEBFigure 3-6. Representation of the real world fracture network as conductive elements and storagevolumes.AWhen a conductive element intersects a grid cell, grid cell values are generated. Itshould be noted, though, that the conductive element generates all kinematic propertiesof the cell, while other volumes in a fracture or zone will be represented as storagevolumes, see Figure 3-7.37
Figure 3-7. Representation of kinematic and storage volumes in the grid. The open rectangle in thegrid represents a kinematic volume (generated by the conductive element), while filled rectanglesrepresent storage volumes.To simulate the mass transfer within a storage volume one needs to solve a 1D diffusionequation. However, as has been shown by Haggerty and Gorelick /1995/, it is possible tosimulate the transport within the storage volume by a series of boxes that exchangematter with the kinematic volume; see Figure 3-3.In one of the test cases data from the Äspö site was used. For a head gradient of 10 –3 ,it is found that disregarding all cells with a maximum absolute cell wall flux of 3 × 10 –11m/s will result in a decrease of the average flux through the domain that is smaller than1%. Here “stagnant cells” is cells with a cell wall flux of 3 × 10 –11 m/s or less. In Figure3-8 three porosity fields are shown; in the top one all generated fractures contribute tothe porosity field, in the middle one all isolated volumes are disregarded and in thelower one also the stagnant volumes have been removed. It is clear that most of theflow is due to a limited number of fractures.38
Figure 3-8. Kinematic porosity fields at a depth of 450 metres, based on all generated fractures(top), all connected fractures (middle) and all connected fractures disregarding stagnant volumes.39
Storage volumes, see Figure 3-7, are connected to the kinematic porosity. It is expectedthat these volumes are 10–100 times larger than the kinematic volumes. They are notimportant (except through the storativity term) in flow simulations but need to be consideredin transport calculations. A visualisation of the kinematic porosity (n c ) and flowfield is shown in Figure 3-9.Figure 3-9. Illustration of porosity (top) and flow fields. Depth interval shown is 400 to 500 metresbelow ground level. The flow is from west to east. View from south.40
The next case deals with long time storage of water. Also in this case a steady flow fromwest to east is used. The initial condition is a tracer concentration of 1.0. The concentrationof the inflowing water is 0.0 and the mean concentration in the domain willhence decrease. If no storage volumes are active the concentration in the domain willbe rapidly decreasing; it is close to zero everywhere after about 100 years. With storagevolumes included, a significant amount of the tracer is still in the domain after 1000years, see Figure 3-10.Figure 3-10. Illustration of long time storage of water. Tracer concentration in “kinematic volumes”(top) and in storage volumes, after 1000 years of integration.41
A qualitative study of the gravitational effects was carried out. As in the previous casea pressure gradient was specified in the west to east direction. The inflow and outflowsections were, however, now limited to a 10 metres high horizontal band at a depth of380 metres. The initial salinity in the domain was zero, while the inflowing water had asalinity that varies in time, according to the different stages of the Baltic Sea. The totalintegration time was 10 000 years. What one can expect is that the salt water will replacethe water in the lower half of the domain, while some water with zero salinity mayremain (note that the inflowing water always has a salinity > 0%) in the upper half of thedomain.The result after 10 000 years of integration can be studied in Figure 3-11. The twovertical sections show the result with (top) and without gravity activated. Obviouslygravity is a very important factor when storage of old water types is to be analysed.A comment may be needed on the “horizontal band of 10 metres” giving the inflow andoutflow boundaries. The salinity of the inflowing water is intended to illustrate differentstages, with different salinities, of the Baltic Sea. In the present model set-up we do notsimulate the contact with the Baltic Sea, as the top of the model domain is at a depth of200 metres, and we are thus forced to specify “unrealistic” boundary conditions. Itshould, however, be noted that the purpose of the simulation is to illustrate the effectof density variations, in a qualitative way.Figure 3-11. Effect of gravity. Vertical sections, West(left)to East (right), of salinity field after10 000 years of integration with (top) and without gravity activated.42
3.3 Tracer Retention Understanding Experiment3.3.1 TRUE-1BackgroundA programme has been defined for tracer tests at different experimental scales, theso-called Tracer Retention Understanding Experiments (TRUE) /Bäckblom and Olsson,1994/. The overall objective of the TRUE experiments is to increase the understandingof the processes which govern retention of radionuclides transported in crystalline rock,and to increase the credibility in the computer models for radionuclide transport whichwill be used in licensing of a repository. The basic concept is that tracer experiments willbe performed in cycles with an approximate duration of 2 years. At the end of each testcycle, results and experience will be evaluated and the programme revised.The basic idea is to perform a series of tracer tests with progressively increasing complexity.In principle, each tracer experiment will consist of a cycle of activities beginningwith geological characterisation of the selected site, followed by hydraulic and tracertests, after which resin will be injected. Subsequently the tested rock volume will beexcavated and analysed with regards to flow path geometry, and tracer concentration.The first tracer test cycle (TRUE-1) constitutes a training exercise for tracer testingtechnology on a detailed scale using non-reactive tracers in a simple test geometry, seeFigure 4-1. In addition, supporting technology development is performed for samplingand analysis techniques for matrix diffusion, and for understanding of tracer transportthrough detailed aperture distributions obtained from resin injection. The TRUE-1cycle is expected to contribute data and experience, which will constitute the necessaryplatform for subsequent more elaborate experiments within TRUE.The stated objectives of the first tracer test cycle (TRUE-1) are:• To conceptualise and parametrize an experimental site on a detailed scale (L=5 m)using non-reactive tracers in a simple test geometry.• To improve tracer test methodologies for non-reactive tracer tests on detailed scale.• To develop and test a technology for injection of epoxy resin on a detailed scale andto develop and test techniques for excavation (drilling) of injected volumes.• To test sampling and analysis technologies to be employed in the analysis of matrixdiffusion.During 1995 work within the TRUE experiment has mainly been devoted to site characterisationof the site where the tracer experiments during the First TRUE Stage will beconducted, and development of resin injection technology.Late 1995 <strong>SKB</strong> identified the need for early data on reactive tracer transport and tookthe strategic decision also to include reactive transport experiments during the FirstTracer test cycle. Early 1997 preparatory work at the site commenced at the test sitewith furnishing of two containers to host the injection and pumping equipment. A seriesof design tests (PDT-1 through PDT-3) were performed during the Spring. The first ofthe tests with radioactive sorbing tracers (STT-1) was started up mid July 1997 andcomprised injection of Na. Ca, Sr, Rb, Ba and Cs in the flow path KXTT4-> KXTT3.The results showed a strong retardation of Cs-137. Late 1997 it was decided to prolongthe study of Cs breakthrough. It was also decided to conduct an additional injection in43
the same flow field, but in a different flow path (KXTT1 -> KXTT3). The latter injectionincluded the same tracers as in STT-1 with the exception that Cs-137 and Br-133were not included, and with the addition of the two radioactive conservative tracers,I-131 and Br-82, the sorbing tracer Co-58 and the redox-sensitive tracer Tc-99m. Thelatter test is denoted STT-1b.During 1998 the flow path between KXTT4 and KXTT3 was revisited with a new testwith sorbing tracers using a flow rate of 0.2 l/min, i.e. 50% of the flow rate employedduring STT-1. Apart from radioactive sorbing tracers employed during STT-1 andSTT-1b, also the K-42 and the redox-sensistive tracer Tc-99m were used, the latterwhich did not show breakthrough. The breakthrough curves, unlike the ones observedfor STT-1, show dual peaks, most distinctively in the breakthrough of the conservativetracers, indicating transport in two flow paths. Indeed, two intercepts have been interpretedin section KXTT4:R3. The fact that a dual peak is observed in STT-2, and notin STT-1 is attributed to the 50% reduction in pumping rate, sufficient to activate thesubordinate flow path not mapped by STT-1.Evaluation of the tests has been performed using what we refer to as the LagrangianStochastic Advection Reaction model (LaSAR) /Cvetkovic et al, 1999/. In this approachthe flow path is viewed as part of an open fracture. The key processes are spatiallyvariable advection and mass transfer, the latter assumed linear, and the coupled effect isobtained by convolution. To account for dispersive effects, the convoluted result for asingle flow path is integrated over different flow paths, described by a distribution of τand β. The parameter β [T/L] is flow-dependent, integrating the inverse of the velocityweightedaperture along the a flow path, and τ is the water residence time. The productqβ [L 2 ] provides an estimate of the area over which the tracer is in contact with the rockmatrix (“flow-wetted surface”), where q [L 3 /T] is the volumetric flow rate carrying thetracer. The parameters β and τ have been shown to be significantly correlated forgeneric conditions /Cvetkovic et al, 1999/ and also for Feature A specific conditions,such that an approximate linear (deterministic) relationship β=k⋅τ is applicable. UsingMonte Carlo simulations of flow and particle transport in Feature A, we estimatedk 0 ≈3400 m –1 as an ensemble average. For the strict assumption of linear relation betweenβ and τ, k is equivalent to the “flow wetted surface per volume of water” (a w ) as definedand used in the recently concluded safety analysis SR 97 /<strong>SKB</strong>, 1999/. The sorptionparameters for the fracture are the distribution coefficients for surface sorption K a andsorption in gouge K dg . The key parameter group controlling sorption/diffusion into therock matrix is βκ [T] ½ where κ = θ[D(1+K dm )] 1/2 = θ(DR m ) 1/2 = (θFD w R m ) 1/2 , where θ isthe porosity of the rock matrix (note that no distinction is made between the “totalporosity” and the “diffusion porosity”), F is the formation factor and D and D w are thepore diffusivity in the rock matrix (θD is the effective diffusion coefficient in the rockmatrix) and the diffusivity in water, respectively. K dmis the sorption coefficient in therock matrix. The evaluation includes determination of the water residence time distributiong(τ) by deconvoluting breakthrough curves for tritiated water (HTO). The reactivebreakthroughs are evaluated using g(τ). One of the stated hypotheses is that the laboratory-derivedvalue of κ may not be representative of the corresponding value in the field.During the year the final report of the First TRUE Stage was published /Winberg et al,2000/.44
The basic results and conclusions drawn by the <strong>SKB</strong> project group are:• Feature A follows a reactivated mylonite, exposed to brittle deformation which hasformed the main fault plane = main conductive element. One undulating structure, oralternatively several interconnected fractures. Bounded by a rim zone of altered Äspödiorite. Different mineralogical composition, grain size and porosity relative to themylonite. Indications of clay minerals suggest presence of gouge material.• Available tracer test methodology successfully adapted and applied in the detailedscale under prevailing conditions.• Cationic sorbing tracers featured by sorption through cation exchange successfullyapplied in laboratory experiments and in in situ experiments. The sorbtivity of thetracers show the relative order; 22 Na + < 47 Ca 2+ ≈ 85 Sr 2+ < < 86 Rb + ≈ 133 Ba 2+ < 137 Cs + .• Unlimited diffusion/sorption in the rock matrix is the dominant retention mechanismfor the tested time scales. Surface sorption, limited sorption in gouge material anddiffusion into stagnant zones are second order for the strongly sorbing tracers.• The use of laboratory data on diffusion/sorption parameters constitutes a basis forpredictions of reactive tracer breakthrough, this provided that the water residencetime distribution (conservative breakthrough) is known (can be assessed) and thatvariability in the β parameter is accounted for.• The important processes identified at the time scales of the TRUE-1 in situ experimentsare assumed valid also over PA time scales. Laboratory transport data onunaltered rock, not associated with fracture rim zone, are assumed applicable overPA time scales.• The performed characterisation provides a powerful set of tools for assessment ofconductive geometry and connectivity in future preliminary site characterisation, andin particular during future detailed site characterisation.The results obtained and conclusions drawn were presented and discussed at an internationalseminar. At the seminar, not only the results and conclusions of the experimentalteam were presented, but also those of other analysts whom have worked on the TRUE-1 data. Furthermore, results of studies with similar goals performed elsewhere werereported and discussed. Using the outcome of the ensuing discussion a number of overallconclusions were drawn.Outcome from 4 th International Äspö seminar• There is a general consensus that the observed retardation observed in the TRUE-1experiments requires diffusion into geological material to be an active process. Thissupported by the –3/2 slope noted in log-log breakthrough curves. Whether this isdue to diffusion (and subsequent sorption) in the altered matrix rock, or in possiblefault gouge cannot be differentiated with available data.• Some researchers claim that the observed enhanced retardation may be explained bydiffusion into stagnant water pools, pure surface sorption, or may be due to an underestimationin the flow-wetted surface area. The latter effect may be attributed to amore complex flow path (multi-layered structure) or three-dimensional effects.45
• A clear differentiation between the principal active process can only assessed by resininjection and subsequent excavation and analysis.• It was identified that experiments of TRUE type are important for improving theunderstanding of retention processes. However, this type of experiment may notnecessarily be part of a site characterisation programme.• It was recommended to broaden the data base from the TRUE-1 site before characterisingpore space with resin techniques. This includes tracer dilution tests usingsinks in other features than Feature A.3.3.2 TRUE Block ScaleBackgroundWork on the TRUE Block Scale Project started in mid 1996. This subproject of TRUEbroadens the perspective from an address of a singular feature in TRUE-1, to flow andtransport processes in a network of fractures and a spatial scale between 10 and 50 m.The specific objectives of the TRUE Block Scale Project are to /Winberg, 1997/:1. increase understanding and the ability to predict tracer transport in a fracturenetwork,2. assess the importance of tracer retention mechanisms (diffusion and sorption) in afracture network,3. assess the link between flow and transport data as a means for predicting transportphenomena.A set of desired experimental conditions have been defined and a flexible iterativecharacterisation strategy has been adopted /Winberg, 1997/. The project is dividedinto a five basic stages:• Scoping Stage.• Preliminary Characterisation Stage.• Detailed Characterisation Stage.• Tracer Test Stage.• Evaluation (and reporting) Stage.The total duration of the project is planned to be approximately 5 years with ascheduled finish at the end of the year 2001.The project was originally organised as a multi-partite project involving ANDRA,NIREX, POSIVA, and <strong>SKB</strong>. During 1997, also ENRESA and JNC has joined theproject.As of 1997 in total three boreholes, KA2563A, KI0025F and KI0023B, had been drilledinto the selected rock volume. In addition an already existing borehole, KA2511A, hadbeen used for characterisation and pressure registration.46
During 1998, one additional borehole, KI0025F02, was drilled and used for site characterisation.A comprehensive 3D seismic measurement campaign was carried out withseismic sources distributed in the near proximity tunnel system and with the seismicreceiver system distributed along the length of borehole KI0025F02. The obtained datahas subsequently been co-interpreted with existing old seismic data from the investigatedrock block. During the year a comprehensive cross-hole interference, tracer dilution andtracer test programme was carried out. During the 1998 the POSIVA flow meter wasemployed in a detailed mode for the first time in borehole KI0025F02.Tentative modelling work started up during 1997 using a discrete feature network model(DFN). During 1998, the modelling work has diversified with the inclusion of stochasticcontinuum and channel network modelling. In addition a site scale DFN model has beenconstructed to allow analysis of density effects and also to generate boundary conditionsfor the models constructed on a smaller scale.Also the groundwater chemical data collected from the packed off sections were used inthe integrated interpretation of groundwater flow in the studied block. During the yearone structural model update was produced (Sep’98 model) /Winberg, 1999/ which waspresented in conjunction with the 2 nd Review meeting in November 1998.During 1999 focus was shifted towards planning and preparations for the upcomingTracer Test Stage. Work in the field was concentrated on verifying interpreted structuresand a structural model was developed based on the new field data including data fromthe most recent borehole KI0025F02 to form the March’99 structural model. Anotherimportant component was the performance of a Pre-test tracer test campaign whichclearly demonstrated the feasibility of block scale tracer tests in the selected block.Scoping model calculations were also performed to analyse effects of fracture intersections. In a document which provided an outline of the planned Tracer Test Stageit was recommended to drill one additional borehole to facilitate verification of thestructural model and shorter transport distances. Furthermore, a list of three basicquestions to be addressed by the tracer tests were formulated and a corresponding setof hypotheses were defined. The plans for the Tracer Test Stage were discussed at the3 rd TRUE Block Scale Review Meeting in October 1999.The plan to drill a new borehole (KI0025F03) was accepted and was drilled andcharacterised during the Fall of 1999.ResultsHydro-structural model and conceptualisationThe most recent model update, the March’00 model, cf Figure 3-12, is based on thecharacterisation data from the new borehole KI0025F03. In building the model the newand existing hydrauliuc data has been used to reconcile the model /Hermanson and Doe,2000/. The basic components included in the March’99 model are found to be valid.One structure, #23, only tentatively indicated in the latter model, was confirmed by thecharacterisation performed in the new borehole. The new model also features an newstructure, #24, north of Structure #6, although with limited relevance to the testsplanned for the Tracer Test Stage.47
Figure 3-12. March 2000 hydro-structural model.As part of the preparations for the numerical model predictions of the planned tracertests, simplistic conceptualisations of individual intercepts of interpreted deterministicstructures, as well as composite structural models of interpreted structures along theirextent have been constructed. An example of the latter is given cf Figure 3-13 forStructure #20.Retention propertiesNo site specific through diffusion or batch sorption experiments have been performedon materials from TRUE Block Scale. However, a comprehensive mineralogical andgeochemical analyses programme has been performed. This has involved analyses madeon altered wall rock, fault breccia pieces (> 2 mm) and the smallest fraction (< 2 mm),the smallest fraction < 0.125 mm. Of the latter some 15–45 weight % comprise thefraction < 0.002 mm featured by a variable degree of enrichment in clay minerals,calcite, pyrite and FeOOH. Using the measured water chemistry and mineral-specificcation exchange capacities reported in the literature, integrated caion exchange capacitieswere calculated for the fine-grained fault gouge material (< 0.125 mm). Subsequently,48
Figure 3-13. Schematic conceptual model of Structure #20 based on detailed conceptualisations fromindividual borehole intercepts.by applying the cation exchange sorption model, the sorption distribution coefficient Kdfor the mono- and divalent cations to be used as tracers in the planned Phase C werecalculated.Collected geological samples from structures of interest in the TRUE Block Scale RockBlock have also been subject to porosity determinations. Two techniques have beenemployed; the water saturation technique and the 14 C PMMA method /e.g. Hellmuth etal, 1999/. Porosity determinations with the two methods have been done on three typesof materials; altered wall rock, centimetre sized pieces of fault breccia, and millimetresized fragments of fault breccia. For the first time the PMMA technique was applied tosuch small fractions of crystalline rock. The global picture, which emanates from thewater saturation measurements is one with a porosity of the intact Äspö dirite bedrockof 0.45%, and where the higher extreme is found for the fault breccia fragments with aporosity range of 1.5 to 3%. A sample visualisation of the distribution of porosity in afault breccia piece from the interpreted Structure #20 is shown in Figure 3-14.49
69.9m piece A-C1.21.0porosity (%)0.80.60.40.20.00.0 0.1 0.2 0.3 0.4 0.5 0.6distance (cm)2 cmFigure 3-14. Autoradiograph of a fault breccia piece from Structure #20 KI0023B, L=69.9 m,9 days. An adjoining image also shows the porosity distribution in the sample.Tracer testsThe basic plans for the Tracer Test Stage included a sequence of three phases, denotedA through C. Phase A /Andersson et al, 2000a/ was focused on identification of suitableinjection sections using tracer dilution tests (Tests A1 through A3) and on identificationof the best suitable sink sections (tests A4 and A5). The latter tests were deliberately notcontinued to full breakthrough because of time constraints. The principle objective ofPhase B /Andersson et al, 2000b/ was to demonstrate sufficiently high mass recovery(> 80%) of selected flow paths and also to demonstrate matrix diffusion through the useof dissolved He-3 gas. The final Phase C comprised performance of a series of fourinjections with radioactive tracers in three different flow paths involving one or moreof the interpreted structures.Phase A testsThe performed tracer dilution tests (Tests A1–A3) were found to generally confirmthe March’99 hydro-structural model and performed short-time interference tests inKI0025F03 /Andersson et al, 2000a/. Flow responses from tracer dilution tests generallycorrelate to sections with high drawdown. The tracer dilution tests in 53 differentsections showed that the “natural” flow vary considerably within the Block Scale rockvolume. An extremely high flow rate (11 l/h) was measured in KI0023B:P7 where ashort-circuit between structures #6 and #20 exists. The flow rates in the other measuredsections typically were in the range 0–300 ml/h. There are also variations in the “natural”flow between the different tests for some sections.Based on the results from tests A-1 to A-3, the best alternative sink to the already testedKI0023B:P6 (#21) was selected for test A-5. As test A-2 showed somewhat less goodconnectivity the final choice was between the A-1 and A-3 sinks, KI0025F03:P5 andKI0025F02:P5, both packing off Structure #20. The final choice fell on the A-1 sink,KI0025F03:P5, based on i) the possibility to address the effects of fracture intersections,ii) that some of the sections with very good flow responses are located in KI0025F02and therefore would be easier to use as potential injection points (better defined flowpath).The tracer test in A-4 performed by pumping in structure #21 (KI0023B:P6) resulted intracer breakthrough from two of three injection points, KI0025F03:P5 (Structure #20)and KI0025F03:P6 (#22), cf Figure 3-15. No breakthrough was observed from injectionin section KI0025F03:P7 (#23). The tests cover Euclidean distances ranging between 14to 17 m, which probably are longer in reality. The tracer mass recoveries are not very50
TRUE BLOCK SCALEPHASE CInjection sectionSink section.../TBS March 2000 model.dgn 2000-04-28 07:30:48Figure 3-15. Detail of March’99 Structural model showing the layout of pumping section andinjection sections used in the Phase B tests. The figure also provides means to identify the sink andsource sections used in the Phase A and B tests.high (30–40%) but a large portion of the tail of the breakthrough curves still remainedto be recovered when sampling was finished, and therefore it is likely that the massrecoveries would have increased by another 20–30%.The tracer test in A-5, cf Figure 3-15, performed by pumping in Structure #20(KI0025F03:P5) resulted in tracer breakthrough from four of five injection points,KI0025F02:P5 (Structure #20), KI0025F02:P6 (#22), KI0025F03:P6 (#22) andKA2563A:S4 (#20). No breakthrough was observed from injection in sectionKI0025F02:P3 (#13, 21). The tests cover Euclidean distances ranging between11 to 29 m, which probably are longer in reality.Based on the results from the analysis of the tracer tests performed during tests A-4 andA-5 together with previous tracer tests performed (PT-4) a final choice of sink for theplanned tracer tests during Phase B and C of the Tracer Test Stage was done. Theplanned tests include injections of radioactive sorbing tracers that require high massrecovery and good control of the experiments. Test A-5 only provided one or maybe twoflow paths with high enough mass recovery whereas test A-4, using KI0023B:P6 as sinkgave at least four possible injection points. Thus, the latter sink was proposed to use forthe planned tracer tests in Phase B and C.51
Phase B testsThe Phase B tests /Andersson et al, 2000b/ involved a total of ten different test set-ups,the three first (B-1a through c) with tracer injection in three different flow paths at areduced withdrawal rate (Q=1.2 l/min) at the sink and the remaining seven tests (B-2athrough g) with maximum withdrawal rate (Q=2.1 l/min) at the sink. All tests used thesame sink section KI0023B:P6. Two of the flow paths were also tested using Helium anda reference tracer to study diffusion effects.The tracer injections were mostly performed by injecting with a constant flow throughoutthe entire duration of the test creating an uneven dipole flow field with injectionflow rates in the order of 0.5–2% of the withdrawal rate. The main reason for using thistechnique was to increase the mass flux in the injection points and thereby also increasethe possibility of detecting the tracer at the sink. Earlier tracer injections have preferablybeen performed in sections having high induced groundwater flow (measured by tracerdilution tests), while in Phase B most injection sections had low induced flow. Thisstrategy turned out quite successful as tracer breakthrough was measured from all teninjections made.Four of the Phase B tests were performed with the objective to study diffusion effectsmaking use of injection of dissolved Helium (He-3). The tests were performed in twodifferent pathways, one “single fracture path” (KI0025F03:P5) and one “network path”(KI0025F03:P6). The He and the reference tracer breakthrough curves show that Heliumis delayed and has a more pronounced tailing than the reference tracer. The lowerand delayed He peak indicates that diffusion as a transport process is more accentuatedby the diffusive He. The longer tailing of the He breakthrough curve can also beexplained by the more diffusive He. However, a more thorough analysis is needed todistinguish the interpreted effects of diffusion from phenomena which can give rise tosimilar results (e.g. heterogeneity, multiple flow paths). Another explanation for thedifference may be effects of fracture intersection zones (FIZ) and this will be furtheranalysed as a part of the Evaluation and Reporting Stage.The analysis and interpretation of the breakthrough curves reveal differences betweenthe flow paths that indicate whether the transport occurs within a single fracture orwithin a network of fractures. The interpretation is generally consistent with theMarch’00 structural model /Hermanson and Doe, 2000/ but in two cases attributedsingle fracture flow paths show breakthrough characteristics that indicate transportthrough a network of fractures. One of these paths is also interpreted to be close to afracture intersection zone, and one possible alternative explanation could be that transportoccurs along this intersection having an enhanced pore volume and thus, decreasingthe transport velocity. Another explanation may be that the involved structure (#21) isdiscontinuous or consists of several sub-parallel structures making up a much longertravel distance than the geometrical one.The tests have provided input for selection of flow paths suitable for subsequent testswith sorbing tracers (Phase C). A requirement is to use flow paths with high tracermass recovery. Based on the results such flow paths are those which connect sectionsKI0025F03:P5 (#20), KI0025F03:P7 (#23) and KI0025F02:P3 (#21) with the selectedpumping section KI0023B:P6 (#21), cf Figure 3-15.52
Phase C testsThe Phase C tests were made using the results of the Phase B tests as a base, and injectionof the radioactive tracers were made without interrupting the continuous pumpingin KI0023B:P6 at Q=2.1 l/min.The injections were made in a radially converging flow geometry using basically thesame equipment and methodology for injection/sampling and analyses used for TRUE-1. In sections with low flow rates, the tracer will be forced into the flow path by applyinga slight excess pressure using an external injection pump. The projected excesspressure created by the injection flow rates were assumed to produce strongly unequalstrength dipole flow fields. The location of the injection sections in relation to the pumpsection is shown in plan view in Figure 3-15. One flow path (C2) is in an interpretedsingle structure, one is made up of two structures (C1) and one is made up of > 2 structures(C3). The injection C4 (in the same path as C1), constitutes a test of radionuclideswith a sorption mechanism governed by partial radiolysis and surface complexation.Table 3-1. Listing of tracer injections made as part of Phase C tracer tests(C-1 though C-4). The structural interpretation and notation refers to the updatedand reconciled March 2000 model /Hermanson and Doe, 2000/. Distances withinbrackets are calculated along the structures.Test # Flow path Struc- Flow Inj. Flow Pump flow Tracer Distancetures geometry (ml/min) (ml/min)C-1 KI0025F03:P5 – 20, 21 Forced 45 2000 Br-82, S-35, 14 (16)KI0023B:P6 injection Na-24, K-42,Ca-47, Rb-86,Cs-134,UranineC-2 KI0025F03:P7 – 23, 20, Forced 10 2000 Re-186, Re-188, 17 (97)KI0023B:P6 21 injection Ca-47, Ba-131,Cs-137C-3 KI0025F02:P3 – 21 Passive – 2000 HTO, Na-22, 35 (35)Sr-85, Rb-83,Ba-133C-4 KI0025F03:P5 – 20, 21 Forced 45 2000 HTO, Sr-85, 14 (16)KI0023B:P6 injection Mn-54, Co-57,Zn-65, Uranine53
The results indicate breakthrough of tracer from each of the injections. An example of abreakthrough from injection C1 (#20 → #21) is presented in Figure 3-16. It should benoted that transport here is dominated by Structure #20 resulting in essentially transportalong one single structure.An interesting observation with regards to the Phase C tests is the observed non-breakthroughof Rb (Injection C3) and Cs (injection C2) observed over distances of 30 and100 m respectively, over a time scale of half a year. In addition, the injection C4 whichfeatured injection of Mn-54, Co-57, Zn-65 shows breakthrough of Mn-54, only slightrecovery of Co-57 and no breakthrough of Zn-65, which is in parity with the hypothesisset up beforehand.In summary, despite minor problems with injection circulation pumps during Phase C,the tests with sorbing tracers in the block scale have been highly successful and constitutea valuable data base on transport and retention in the block scale. However, theunderlying data base of tests with conservative tests should not be forgotten. In total,13 flow paths with full breakthrough over distances ranging between 12–120 m andmean travel times of 1.5 to 2200 hours have been characterised. Of these, at least 4 flowpaths show recoveries > 80% (of which three have been used for Phase C tests). Threeflow paths with projected distances 35–50 m show no breakthrough (time is a constraint).In conclusion, the possibility to run sorbing tracer tests in the block scale hasbeen successfully demonstrated.Normalised Activity Flux (1/h)10 010 -110 -210 -310 -410 -5TRUE Block Scale C-1KI0025F03:P5 - KI0023B:P6Br-82Na-24Ca-47K-42Rb-86Cs-13410 -61 10 100 1000 10000Elapsed time (h)Figure 3-16. Example of breakthrough curves from the flow path. KI0025F03:P5 (#20) toKI0023B:P6 (#21).54
Figure 3-17. Model predictions of Phase C tracer tests. Example from Injection C2 involvingtransport over a projected distance of about 100 m.ModellingDuring the year two more modelling concepts have been included in the palette ofvarious modelling approaches used; the LaSAR approach /Cvetkovic et al, 1999, 2000/extended to the block scale and the POSIVA approach /Hautojärvi and Taivassalo, 1994/.The work during the year has been devoted to evaluation and calibration of data fromthe Phase A and Phase B tests, respectively. Following the necessary calibration, thePhase C tracer tests have been predicted using all five modelling approaches, includingthe Stochastic Continuum (ENRESA), Discrete Feature Network (NIREX) and PipeChannel Network concepts (JNC/Golder).In Figure 3-17 the results of model predictions for injection C2 using the various modelapproach are shown in terms of cumulative breakthrough. In making the predictions theLaSAR and CN approaches have been applying the retention parameters which havebeen obtained from the evaluation from the TRUE-1 experiment.Planned work for 2001• Evaluation modelling of Phase C tracer tests.• Reporting.• Continued monitoring of breakthrough at reduced level of ambition (part of TRUEcontinuation).• Application of enrichment techniques to detect tracers and provide more data on thetails of the breakthrough (part of TRUE continuation).55
3.3.3 Long-Term Diffusion ExperimentBackgroundThe Long-Term Diffusion Experiment is intended as a compliment to the in-situdynamic experiments and the laboratory experiments performed within the TRUEProgramme.The objectives of the planned experiment are to /Byegård et al, 1999/:• investigate diffusion into the matrix rock from a natural fracture in situ under naturalrock stress conditions and hydraulic pressure and groundwater chemical conditions,• obtain data on sorption properties and processes of some radionuclides on naturalfracture surfaces,• compare laboratory derived diffusion constants and sorption coefficients for theinvestigated rock fracture system with the sorption behaviour observed in situ atnatural conditions, and to evaluate if laboratory scale sorption results are representativealso for larger scales.In-diffusion phase, 0-4 yearsSurfaceFractureExtraction rate:5ml occasionallyTracer reservoirStubPlastic sealingExtraction of the stub, after 4 yearsSample drilling, slicing,grinding, leaching,dissolution (methoddepending on tracer)Tracer concentrationmeasurement (methoddepending on tracer)Figure 3-18. Schematic of LTDE experimental concept including injection borehole in contact with afracture surface, combined with excavation and penetration profile studies.56
The updated test plan presents an experimental concept centred on establishment of anexperimental (large diameter) borehole which exposes a fracture surface. This fracturesurface is packed off with a cap, similar to the one used in the REX experiment, cfFigure 3-18. The intention is to establish an experimental chamber in which a tracersolution is circulated over a period of four years. Performed scoping calculations usingavailable diffusivity data indicates that axial diffusion will range from mm:s for thestrongly sorbing tracers to dm:s for the weakly sorbing tracers considered. Apart fromtracers used in the TRUE-1 experiment, also PA-relevant tracers ( 99 Tc, 237 Np and 241 Am)have been proposed. The principal challenge of the experiment is to establish axialdiffusion from a natural fracture, through the rim zone of fracture mineralisation andalteration, into the unalterad rock matrix, without any advective flow component(towards the tunnel). This is resolved using a multi-packer system which effectivelyshields off the gradient. In addition, an intricate pressure regulation system is devisedwhich will effectively allow the pressure in the experiment chamber to adapt to theambient conditions without causing pressure differences, and hence no advective transport.The reference pressure is obtained either from a packed-off pilot borehole in theimmediate vicinity of the large diameter experimental borehole (also used to identify thetarget fracture to be investigated) or from a conductive guard section adjacent to the testsection in the experimental borehole.The characterisation of the large diameter borehole includes ia. measurements withvarious geophysical logs (BIPS, resistivity. In addition the core will be analysed usingmineralogical, petrophysical and geochemical methods.ResultsDrilling and site characterisationA suitable target fracture was identified in borehole KA3065A02 at a depth of 9.81 m.This structure constitutes a chlorite splay (141/81) to a main fault, the latter on whichslicken lines on the surface are evident. It shows mylonitic character in diorite/greenstone with an increasing alteration towards the fault centre. The total inflowat this zone is about 16 l/min. The target structure constitutes the delimiting structureof the zone and is followed by a long > 0.5 m long intact portion of Äspö diorite.The drilling of the telescoped experimental borehole (∅ 300 mm) was performed with ahigh degree of interactivity between; careful iterative drilling in short uptakes (particularlyin the inner part of the bortehole), BIPS imaging, core examination and on-sitestructural modelling/updating of structural model. The original plan was that the targetfracture should be intercepted and passed in such a way that an approximately 50 mmlong “stub” remained in the borehole. The distance between the mantel surfaces of thepilot and experimental holes at the location of the target feature is about 0.3 m, cfFigure 3-19. However, because of poor visibility due to degassing (which impaired theBIPS imaging) and the fact that a critical segment of one of the final core uptakes fellout of the core barrel, the final core length is about 150 mm.57
NicheFigure 3-19. Structural model of the identified fractures and target structure at the LTDE site.58
Structural and geological modellingStructural modelling of the area around the target feature is still ongoing, supported bydetailed structural mapping of the two cores and mineralogical and geochemical analyses.The updating of the hydro-structural model of the LTDE site has been more problematicthan anticipated. The problem lies not so much in the linking of the marker structurein the pilot borehole with the target structure in the large diameter borehole.Instead it has been found difficult to link structures/fractures predicted from the pilotborehole with those found in the large diameter experimental borehole. The mainproblem is interpreted to be associated with scale (smaller structures/fractures) comparedto e.g. the structures which have been connected between boreholes at the TRUE BlockScale site, cf Section 3.3.2, in combination with an undulating character in the fracturesconsidered. Detailed mineralogy and geochemistry has in this context helped out inimproving the correlation of structures between the two boreholes. The structural modelof the LTDE site and the identified target structure is shown in Figure 3-19. An interpretationof the layered structure of the target feature and the division of mineral coatingof the surface of the core stub end is shown in Figure 3-20.Figure 3-20. Interpretation of stratigraphy of identified target structure and distribution of fracturecoatings on the core stub end.59
Assessment of core stub statureA pointed out above, the core stub length in KA3065A03 turned out 3 times longer thanthe originally planned 50 mm.The implications of this state of affairs are:1. The projected diffusion length in the core is three times longer than originallyplanned. The diffusion front for the least sorbtive tracers is expected to be in theorder of 0.3–0.4 m, i.e. 50% of the diffusion path of the least sorbing tracers will bein the core stub. The core stub may to a variable degree be affected by sample disturbancedue to; (i) stress concentrations associated with the advancing drill bit, and (ii)unloading of stress acting of the remaining core stub.2. The sealing length of the stub is 150 mm, compared to the originally optimisedsealing length of 50 mm. This was originally regarded as a serious constraint, butthrough design of a sandwiched polyurethane cylinder with successively less deformablematerial towards the surface of the stub, the problem was resolved.To investigate the effects noted under item (1) above, a series of in-situ and laboratorymeasurements have been conducted during the year which have been compared withexisting in-situ Äspö data/results and results/data found in the literature. The performedin-situ measurements included endoscope video imaging of the walls of the core stub inthe 9.75 mm cylindrical slot around the core stub. In addition, the experimentalborehole and the stub surface has been documented by analog video mounted on aremote controlled vehicle. The results showed that no macroscopic fractures could beseen on the walls of the stub. Second, the inflow points along the boreholes could beestablished in a tentative way from the video recordings. The location of inflow pointswas subsequently established in more detail using single packer flow logging. The laboratorywork, apart from basic mineralogy and geochemistry along the pilot and experimentalboreholes, included micro-seismic measurements on drill cores and thin sectionsanalyses in various directions, the latter two measurements aimed at quantifying thedegree of sample disturbance on the core. The seismic work on a 177 mm core specimenindicate a 2–4% reduction in seismic velocity compared to what is attributed tointact unfractured Ävrö granite. The results of the thin section work show that themapped fractures are primarily radial (parallel to core axis) and that they diminish innumber when moving towards the interior of the core, cf Figure 3-21. The backgroundfrequency of micro-cracks in approximately 1 fracture/mm in the interior of the studied177 mm core, whereas the frequency in the outer 3 mm is in the order of 1.7–3.3 fractures/mm,cf Figure 3-21.In addition, existing and new rock mechanical modelling has been used to assess theeffects of drilling and stress relaxation on the core and its environment. The mechanicalmodelling and performed measurements indicate that no, or insignificant disturbancedue to formation of new micro fractures is to be expected. However, opening of existinggrain boundaries and widening of existing micro fractures will occur throughout the corestub. The degree to which unloading of rock stresses will create significant damage isintimately tied to the in situ state of rock stress conditions at the site. The effect of theunloading in the relatively low-stressed rock at Äspö is expected to be small, the effectsin terms of opening of grain boundaries and widening of existing micro fractures isexpected to be minimal.Given that the stub is disturbed and the possibility that diffusion of weakly sorbingspecies through the stub may not reach the intact rock beyond, has stimulated explorationof alternative concepts. These include division of the experiment in two parts, one60
Number of cracks per cell1098765432Line ILine IILine IIILine IVLine Vmean10B1B20 6 12 18 24 30 36 42 48 54 60 66 72Distance to the periphery (mm)Figure 3-21. Number of fractures/cell in samples B1 and B2 vs distance of the measurement cellto the periphery of the 177 mm core (cell size = 3 mm).focused on diffusion/sorption on the fracture surface/core stub and one part focused ondiffusion in the intact bedrock. The concept being considered most feasible is to assessthe intect rock using a small diameter borehole through the centre of the core stub.Hence, although the geometrical premises for the experiment as originally planned arenot fulfilled, the experiment is still doable and relevant, even in light of the insufficiencyintroduced by the too long stub.EquipmentDuring the year the downhole equipment has been finalised. A special installation rackhas been constructed with which the packer system will be installed. Further a flowthrough cell has been manufactured of PEEK which will enable measurement of pH andEh. Apart from monitoring the redox conditions, further precautions will be taken toavoid exposure to oxygen by hosting all relevant equipment (flow meter, circulationpump, flow meter and pressure regulation piston) in two plexi-glass boxes equippedwith gloves and temperature regulation.CE-marking of equipment set-upWithin <strong>SKB</strong> work is ongoing on updating quality systems. In addition a general policydecision has been taken that equipment and experimental setups used should be markedwith the CE marker, governed by European Union regulations. The CE marker is asignature that the equipment and equipment set up is safe from a personal and functionalsafety standpoint, and that the risk for environmental hazard is minimised. TheLTDE in this context constitutes a training set for <strong>SKB</strong>. The CE process has had apositive effect on the final phase of the LTDE construction, although it has slowed downthe project in relation to the original schedule.61
Planned workAdaption of modified experimental concept. Pre-tests in the array of boreholes by whichthe connectivity and piezometry of the structures is controlled. Furthermore, variousleakage scenarios are tested to demonstrate controlled recovery of tracer in the eventthe experiment has to be terminated. A permit will be obtained from the radiationprotection agency for the pre-tests and the main injection before injections are started.3.4 The REX-experiment3.4.1 BackgroundMolecular oxygen entrapped in a crystalline rock repository after closure is a potentialcorrodant of the copper in the canisters. Similarly, future intrusions of oxygen-rich meltwaters during a glacial event may affect the integrity of the canisters, as well as themigration of radionuclides. The rate of disappearance of O 2 in geological environmentsis therefore an important information when evaluating repository designs.A block scale redox experiment was carried out in a fracture zone at 70 m depth in theentrance tunnel to Äspö /Banwart et al, 1996, 1999/. In spite of massive surface waterinput, the fracture zone remained persistently anoxic. The main conclusion from thatstudy was that the increased inflow of relatively organic-rich shallow groundwater insteadof adding dissolved oxygen, it added organic compounds that acted as reductantsin the deeper parts of the fracture zone. These conclusions are specific to this particularfracture zone, experimental conditions and the time scale (3 years) of the experiment, butare probably also relevant for other conductive fracture zones.The detailed scale redox experiment (REX) was started to focus on the question of O 2that is trapped in the tunnels when the repository is closed. The aims of the experimentwere to determine:• How does oxygen trapped in the closed repository react with the rock minerals in thetunnel and deposition holes and in the water conducting fractures?• What is the capacity of the rock matrix to consume oxygen?• How long time will it take for the oxygen to be consumed and how far into the rockmatrix and water conducting fractures will the oxygen penetrate?3.4.2 Experimental conceptThe emphasis of the project was on a field experiment involving groundwater in contactwith a fracture surface /Puigdomenech et al, 1998, 2000b/. To this aim a borehole,≈20 cm in diameter, was drilled at 380 m depth in the tunnel of the Äspö Hard RockLaboratory. Fe-carrying phases in the fracture surface were chlorite, clay minerals,epidote and pyrite. Injection pulses of O 2 dissolved in groundwater were performed atin situ temperature and pressure. Several microbial and chemical parameters were determinedas a function of time: pH, Eh, and O 2 -concentration, microbial counts and activities,and structure of microbial populations. The set-up for the REX field experiment isillustrated in Figure 3-22.62
ReactionchamberSampling andinjection of O 2FractureFlowmeterPumpborehole KA2861AMeasurement of:pH, Eh, O 2 , T & PPackersborehole KA2862AFigure 3-22. Schematic illustration of the REX field experiment.The field study was supported by laboratory experiments to determine O 2 reaction ratesand mechanisms with Äspö samples (both for inorganic and microbially mediated processes).A replica experiment was performed at CEA Cadarache, France, with the otherhalf of the fracture surface obtained in the drilling procedure of the in situ experiment.The aim of the replica experiment was to duplicate as far as possible the conditions ofthe REX in situ experiment, for example by using groundwater sampled at the REX sitein Sweden, shipped in special containers to France.3.4.3 ResultsFour laboratory groups participated in the REX-experiment: the Dept. of Civil & EnvironmentalEngineering of the University of Bradford (UK); the Fluid Processes Groupof the British Geological Survey (UK, financed by PNC, Japan); the Centre d’EtudesNucléaires Cadarache (France, financed by ANDRA); and the Dept. of General andMarine Microbiology of the Göteborg University. Additionally several consultants inSweden participated in the project /Puigdomenech et al, 1998/.Supporting Laboratory InvestigationsLaboratory experiments performed at Bradford University tested the O 2 uptake by rockand fracture filling mineral samples collected from the Äspö tunnel. Fracture-fillingminerals were also collected from the NW-3 fracture zone using the “triple tube”technique in a 3 m long borehole (KA3065A). The core from this borehole was characterisedand the sieved fractions were also used in the laboratory tests at the University ofBradford. Oxygen uptake rates were determined for most of the samples /Puigdomenechet al, 2001/. The results obtained showed that the rate of O 2 uptake is affected by63
particle size of the samples and by their origin in the Äspö tunnel (variation in mineralcomposition and degree of alteration). The values of the first-order rate constantobtained are in the range (1 to 140) × 10 –3 L g –1 day –1 .Dissolved gases (CH 4 , H 2 , etc) were analysed in Äspö groundwaters /Kotelnikova andPedersen, 1999/, and the data were combined with the measurements of microbial O 2reduction and CO 2 production in Äspö groundwaters. These results showed that O 2may be consumed by methanotrophic, hydrogen-oxidising or heterotrophic bacteria in aclosed nuclear waste repository. The results on bacteriological O 2 consumption experimentsperformed in the field at Äspö are given elsewhere /Kotelnikova and Pedersen,1999/. Monod-type kinetic rate laws were used to calculate the time scale to consumeO 2 in a closed repository /Kotelnikova and Pedersen, 1999, 2000; Puigdomenech et al,2001/. The results showed that an initial oxygen content of [O 2 ] o = 8 mg L –1 (0.25×10 –3mol L –1 ) would be consumed by microbial processes in the groundwater to levels below0.1% in one year.The Japan Nuclear Cycle Development Institute (JNC) and the British GeologicalSurvey (BGS) jointly studied the microbial effects on redox groundwater-rock interactionsusing samples from Äspö. Detailed results from these laboratory investigationswere reported elsewhere /Bateman et al, 1998; Yoshida et al, 1999/. Both batch and flowexperiments were performed. Biofilm development was observed in the column experiments.The columns with bacteria became clogged very rapidly, and minor amounts ofsmectite were observed in the reaction residues examined after this period (about twoweeks). Experiments without bacteria did not clog up. These results are consistent withbacterially enhanced smectite formation being responsible for the clogging of the columnexperiments /Bateman et al, 1999; West et al, 2001/.The In-Situ ExperimentThe REX field experiment was conducted on a single fracture at 8.8 m from the tunnelwall (borehole KA2861A, ∅ ≈ 200 mm). The drillcore was sent to CEA (Cadarache,France) where the replica of the field experiment has been completed as described below.The aim of the field study was to isolate the innermost part of the borehole and tomonitor the uptake of O 2 as a function of time. A detailed description of the set-up forthe REX field experiment has been reported /Puigdomenech et al, 1998/, and it issummarised in Figure 3-22.A series of O 2 injection pulses were performed in the REX in situ (and replica) experiments.Dissolved oxygen concentrations in the range 1–8 mg L –1 were consumed in theexperiments within a few days, 5 to 10 days. Data for one of the O 2 -pulses is shown inFigure 3-23. The data could be described with a first order kinetic equation. Furtherrefinements of the rate law were not possible owing to the limitations of the field experiment,mainly: hydraulic leakage through microfractures and o-rings, and diffusion ofatmospheric O 2 into the reaction loop /Puigdomenech et al, 2000a, 2001/.64
10.0010.008.009.50[O2] ppm6.004.00pH9.008.502.008.000.00-0.5 0.5 1.5 2.5 3.5 4.5 5.57.50-0.5 1.5 3.5 5.5DaysDaysFigure 3-23. Results from one of the O 2 -pulses in the REX field experiment.Microbial data from the in situ experiment showed O 2 -induced aerobic microbial respirationand a succession of microbial groups in the groundwater and on mineral surfaces/Kotelnikova and Pedersen, 2000/. It was unexpectedly found that in some cases thenumber of iron-reducing organisms increased during the O 2 pulses. Similar effects wereobserved in the replica experiment. It appears that iron-reducing bacteria developedbecause of the increased Fe(III) concentrations that followed the O 2 pulses.The number of cells attached as biofilms exceeded the number of free-living cells. Thesebiofilms would potentially lead to changes in the absorbing properties of the mineralsurfaces. The O 2 uptake capacity of the rock is therefore largely affected by the microbialfilms developing in fracture surfaces.The replica experimentAs part of the REX project, ANDRA and CEA performed a laboratory experiment thatreproduced closely the field test, i.e. a study in which a diorite core section was submittedto the same succession of O 2 injections as in the field experiment. The use andpurposes of such an experiment, called the replica experiment, were both methodologic(how to dimension and complement the in situ experiment) and scientific (gatheringmore data and better understanding of processes). The small spatial extension of the insitu reaction chamber was especially suitable for a replica investigation. The replicaexperiment was performed on the other half of the fracture surface used in the fieldexperiment. The replica set-up was designed in order to work at a total pressure of1 bar; different tests and preliminary investigations guided the choice of materials for thedifferent parts of the set-up: core confinement unit, measurement unit, water equilibrationunit, tubes and fittings /Puigdomenech et al, 1998, 2001/. The replica experimentstarted in June 1998 and ended in May 1999. During this period, O 2 pulses of increasingintensity were injected and different parameters were monitored (especially O 2 (aq), pH,Eh, solution chemistry, microbial populations). There were long anoxic periods betweenseries of O 2 pulses in order to follow the progressive return to reducing conditions.65
250200150O 2(µmol/l)Pulse 07k1 = 11.4 µmol.l -1 .day -1K = 0.013 µmol.l -1k2 = 0.078 day -110050Time (days)00 2 4 6 8 10 12 14Figure 3-24. Time evolution of dissolved O 2 during a pulse in the replica experiment. The observedevolution is compared to a curve calculated using a combination of first rate law and enzymaticcatalysis (monod law for microbial processes).It was observed that the oxygen uptake kinetics could be fairly simulated by a rate lawcombining both Monod kinetics (enzymatic kinetics) and a first order contribution(Figure 3-24). The form of this rate law was:d[ O2] k1[ O2]= −dt K + [ O ]2− k2[ O ]2the values for k 1 , K and k 2 were found to be respectively 5–20 µmol L –1 day –1 , 0.05–0.50µmol L –1 , and 0.04–0.10 day –1 . During periods of oxygen uptake, the pH was observed todecrease regularly. After O 2 depletion, the pH increased back and a rapid drop of Eh(measured using a Pt electrode) was observed. Upon addition of successive O 2 pulses, thecarbonate alkalinity of the water increased progressively. This feature was consistent withthe succession of major bacterial groups (aerobes, anaerobes and iron-reducing bacteria).During long anoxic periods, the iron and manganese concentrations in solution increasedstrongly, consistently with the continuous drift of Eh to lower values (typical valuesattained in three months were Eh = –0.05 V NHE for pH about 6.2 at 15°C). At the endof anoxic periods, a strong growth of sulfate reducing bacteria was observed. A couplingbetween mineral/solution/bacterial interaction is strongly suggested both in the replicaand in situ experiments.66
3.4.4 Main Conclusions from the REX ProjectThe most important conclusions from the REX project are (Puigdomenech et al, 2001):• O 2 uptake rates in the field were comparable to laboratory results obtained in Franceand UK.• Previous laboratory O 2 uptake rates by mineral samples /White and Yee, 1985/ andresults from the URL in Canada /Gascoyne, 1997/ resulted in expected time scalesfor O 2 depletion in typical granite fractures between 0.2 and 350 years. The datacollected within the REX project results in calculated time scales for oxygen uptakein granitic fractures that are on the order of a few days.• Microbes had a substantial role in O 2 uptake, both in biofilms and in unattachedstate. The microbial processes were apparently coupled to reactions at mineral surfacesthrough iron or manganese cycling (e.g., by fast chemical oxidation of Fe(II) insolution, and consequent microbial reduction of Fe(III) by iron-reducing bacteria).• A substantial reducing capacity should be assigned to CH 4 and H 2 , which diffuse fromdeep geological sources. These compounds may be used by microbes as a redox bufferagainst the intrusion of O 2 -rich waters, independently of surface climatic conditions,i.e. even under glacial periods.3.5 Radionuclide retention (include CHEMLAB)3.5.1 BackgroundThe retention of radionuclides in the rock is the most effective protection mechanismwhen the engineered barriers fail and radionuclides are released from the waste form.The retention is mainly due to the chemical properties of the radionuclides, the chemicalcomposition of the groundwater, and to some extent also due to the conditions of thewater conducting fractures and the groundwater flow.Laboratory studies on the solubility and migration of long lived nuclides of e.g. theelements Tc, Np, and Pu indicate that these elements are so strongly sorbed on thefracture surfaces and into the rock matrix that they will not be transported to the biosphereuntil they have decayed. This very strong retention could well be an irreversiblesorption process. In such a case the migration of the nuclides, released from a wastecontainment, will stop as soon as the source term is ending.Laboratory studies have been undertaken with this kind of nuclides even though naturalconditions are extremely difficult mimic. Although experiences from different scientistsare uniform it is of great value to demonstrate that results from laboratory studies arevalid under natural conditions. Laboratory investigations have difficulties to simulatethese conditions and may therefore be dubious as validation exercises. The CHEMLABborehole probe has been constructed and manufactured for validation experimentsin situ at undisturbed natural conditions. Figure 3-25 illustrates the principles of theCHEMLAB 1 and CHEMLAB 2 units.67
Groundwater inletFilterBore hole sealPACKERPACKERWaterinletEh- and pHelectrodesFilterCHEMMACCHEMMACTracerreservoirsT1T2T3Reservoir partPCFilterElectrovalvePumpsExperimentalchamber formigrationstudiesP1V02bV00P2V02aV01Pump partExperimental partPExp.cellDPHEMLABReservoirPumpPressurereducerV03bV03aP2PressurereducerFractioncollectorsV04bV05V04aFractioncollectors' partElectronic partPushing partPPInternalPressureRegulatorExternalPressureRegulatorFigure 3-25. Schematic illustration of CHEMLAB 1 and 2.3.5.2 ObjectivesThe objectives of the Radionuclide Retention (CHEMLAB) experiments are:• To validate the radionuclide retention data obtained in laboratory experiments by datafrom in situ experiments in the rock.• To demonstrate that the laboratory data are reliable and can be used to predict thebehaviour of radionuclides at conditions prevailing in the rock.• To decrease the uncertainty in the retention properties of relevant radionuclides.68
3.5.3 Experimental conceptCHEMLAB is a borehole laboratory built into a probe, in which migration experimentscan be carried out under ambient conditions with respect to pressure and temperaturewith the use of natural groundwater from the surrounding rock.Initially one “all purpose” unit was constructed in order to meet a wide range ofexpected experimental requirements. This unit CHEMLAB 1 has been used for the“diffusion in bentonite” /Jansson and Eriksen, 2001/ experiments and will now be usedfor similar experiments including the effects of radiolysis. Others to follow are:• Migration from buffer to rock.• Desorption of radionuclides from the rock.• Batch sorption experiments.The CHEMLAB 2 unit is a simplified version of CHEMLAB 1, designed to meet therequirements by experiments where highly sorbing nuclides are involved. These are:• Migration of redox sensitive radionuclides and actinides.• Radionuclide solubility.• Spent fuel leaching.3.5.4 ResultsCationsDuring spring and summer 1997 the first radionuclide in-situ experiments withCHEMLAB were performed at Äspö HRL. These included cation diffusion in compactedbentonite with the tracers Co-57, Sr-85 and Cs-134. The experiments werecarried out, partly to gain experience in the novel experimental technique, but mainlyto validate diffusion and sorption data obtained in laboratory experiments.The selected nuclides are expected to exist predominantly as non-hydrolysed cations thatare not influenced by pH or Eh. Cs + and Sr 2+ have been extensively studied in laboratoryand the diffusive and sorptive properties are reasonably well known /Eriksen andJansson, 1996; Yu and Neretnieks, 1997; Muurinen, 1994/. Of critical importance fortheir sorption and diffusion in bentonite is the concentration of major ions (Na + , K + ,Mg 2+ , Ca 2+ ) and for Sr 2+ also the pH.The sorptive and diffusive properties of Co 2+ are less well known, but Co 2+ is primarilysorbed by surface complexation and/or surface precipitation on the montmorillonite andpH is of critical importance in the pH-range 7 to 10 /Eriksen et al, 1999/.Two experiments were performed, the first with Co-57 and the second with Sr-85 andCs-134. The radionuclides were added in their ionic form (Co 2+ , Sr 2+ and Cs + ) to areservoir in CHEMLAB in a 5 ml solution of degassed, filtered Äspö ground water. Thefirst step in the experiments was to dilute this stock solution to 100 ml with groundwater directly from the rock. In the Co 2+ experiment the 5 mm thick bentonite clay wasthen equilibrated with ground water from both ends of the cell for 14 days. The taggedCo 2+ solution was then circulated at the front end of the cell, while the back end wasflushed to the fraction collectors of CHEMLAB in intervals to remove and collect allradionuclides that had diffused through the cell.69
In the Sr 2+ , Cs + experiment a 10 mm long cell was used. After diluting the radionuclidesolution, the bentonite clay was equilibrated with ground water from one side of the cell.The filter at the front end of the cell was in contact with a solution of constant radionuclideconcentration, while the back end was blocked, allowing the radionuclides todiffuse into, but not through, the cell.To measure the concentration profiles in the bentonite, the cell was dismantled at theend of the experiments and the bentonite cut into thin sections. Each section wasweighted and the activity measured by γ-counting using a germanium detector andmultichannel analyser. The concentration profiles in the bentonite were simulated usinga finite difference based computer code ANADIFF /Eriksen and Jansson, 1996/. Thecobalt results were modelled by using a computer code, LFD, developed by Lehikoinen/Pusch et al, 1999/.The measured and calculated concentration profiles for Cs + , Sr 2+ and Co 2+ are plotted inFigure 3-26, Figure 3-27 and Figure 3-28. It should be pointed out that the measuredCo 2+ profile is expected to be somewhat low at the inlet/bentonite interphase due to apump failure after 8 days diffusion.The K d and D a values used in the computer simulations for the cations are given inTable 3-2. For comparison expected K d values for Cs + , Sr 2+ obtained by regression analysisof sorption data from experiments with solutions and groundwaters with differentsalinity /Eriksen and Jansson, 1996/ as well as apparent diffusivities are also given inTable 3-2. The corresponding Co 2+ values obtained in our laboratory are also given inthe table.800Activity (cps/cm 3 )700600500400300ExperimentalSimulated20010000 1 2 3 4 5 6 7 8 9 10Distance from inlet filter (mm)Figure 3-26. A measured and simulated activity profiles for Cs + in bentonite. Diffusion time15 days, D a = 2 · 10 –8 cm 2 s –1 , K d = 60 g cm –3 .70
250200ExperimentalSimulatedActivity (cps/cm 3)1501005000 1 2 3 4 5 6 7 8 9 10Distance from inlet filter (mm)Figure 3-27. Measured and simulated activity profiles for Sr 2+ in bentonite. Diffusion time 15 days,D a = 7 · 10 –8 cm 2 s –1 , K d = 13 g cm –3 .900800700ExperimentalSimulatedActivity (cps/cm 3 )60050040030020010000 1 2 3 4 5Distance from inlet filter (mm)Figure 3-28. Measured and simulated activity profiles for Co 2+ in bentonite. Diffusion time 8 dayswith constant inlet concentration and 7 days without continuous replenishment of radiotracer at theinlet side, D a = 4 · 10 –9 cm 2 s –1 , K d = 250 g cm –3 .71
Table 3-2. K d values and apparent diffusion coefficients from CHEMLAB andlaboratory experiments.Cation CHEMLAB experiments Laboratory experimentsLog K d [cm 3 g –1 ] D a [cm 2 s –1 ] log K d [cm 3 g –1 ] D a [cm 2 s –1 ]Cs + 1.8 2 · 10 –8 2 ± 0.35 (2 ± 1) · 10 –8Sr 2+ 1.1 7 · 10 –8 1.56 ± 0.32 (9 ± 1) · 10 –8Co 2+ 2.4 4 · 10 –9 3.3 ± 0.3 (2 ± 1) · 10 –9The results of the downhole experiments with Sr 2+ and Cs + are in good agreement withresults from laboratory experiments with sodium bentonite compacted to 1.8 g cm –3 drydensity and equilibrated with synthetic groundwater and electrolyte solutions of the samesalinity as Äspö groundwater. It ought to be pointed out that the Sr 2+ concentration inthe Äspö groundwater is fairly high (~2 · 10 –4 mole/l) so the Sr 2+ sorption observed isreally isotope exchange between sorbed Sr 2+ and Sr 2+ in the porewater in an equilibratedsystem.The difference between the K d values for Co 2+ obtained in laboratory diffusion experimentswith a synthetic Äspö groundwater is most probably caused by a slightly higherpH of the synthetic groundwater (pH ~7.5) used in the laboratory experiments than ofthe groundwater at the experimental site at Äspö (pH 7.2). Co 2+ displays a sorption edgeat pH ~6.5 with K d increasing by two orders of magnitude between pH 6.5 and 8.5.Corresponding sorption edges on Na-montmorillonite for Ni, Zn and Ca have beenmodelled assuming the formation of surface complexes /Bradbury and Baeyens, 1995/.AnionsI – and Tc(VII), probably occurring as pertechnetate, TcO 4– , were chosen. The choice ofanions were based on the following criteria:• Diffusion behaviour at different chemical conditions should be well characterised.• Two ions with different redox behaviour should be studied, one which is conservativeand one which is redox sensitive.The transport capacity of iodide has been found to be increasing with increasing ionicstrength of the groundwater used, due to anion exclusion, which is ionic strengthdependent. In earlier studies using saline synthetic groundwater (NASK, ionic strength= 0.218 molal) the apparent and effective diffusivities were found to be (9.2±1.3)·10 –7 and(7.0±1.7)·10 –8 cm 2 s –1 , respectively /Eriksen and Jansson, 1996/.Technetium is a redox sensitive radionuclide. In an oxidising environment technetiumoccurs as pertechnetate ion (TcO 4– ), which has been found to be as mobile as the iodideion. Under reducing conditions the thermodynamically favoured state is TcO 2·nH 2 O(s).However, it has been shown that the reduction of TcO 4–by Fe(II) proceeds very slowlyif at all in free solution, while when sorbed to a surface or precipitated as Fe(OH) 2 (s)or FeCO 3 (s) the rate for reduction by Fe(II) is significantly faster /Cui and Eriksen,1996a,b/.Figure 3-29 displays the concentration profile for I – and three simulated curves.72
Activity (cps cm -3 )40353025201510ExperimentalTotal8.6E-7 cm2s-1, a=0.15E-10 cm2 s-1, a=2.26500 1 2 3 4 5Distance from inlet filter (mm)Figure 3-29. Experimental and simulated results for iodide.The profile for I – cannot be accommodated by ion exclusion and one diffusion processonly. The non-linearity of the profile has been observed at steady-state in earlier investigations/Eriksen and Jacobsson, 1981/ both for iodide and chloride.The profile can, however, be modelled with two processes. One with anion exclusionand one slower with slight sorbtion. Further laboratory investigations are needed toclarify the behaviour of iodide and similar ions.In Figure 3-30 the profile for technetium can be seen.Activity (cps g -1 )30002500200015001000TcDa=6E-7, a=0.1Da=1E-9, a=0.465000-5000 1 2 3 4 5Distance from inlet filter (mm)Figure 3-30. Experimental and simulated results for technetium.73
The activity level of the Tc-99 profile indicates diffusion of the species TcO 4– . The highactivity spots are probably due to reduction of TcO 4–by iron containing minerals in theclay.Migration of ActinidesThe first experiment carried out in CHEMLAB-2 was the migration of actinides, americium,neptunium and plutonium, in a rock fracture. Pre-studies performed at Institut fürNukleare Entsorgung at Forschungszentrum Karlsruhe indicates that Pu and Am aresorbed strongly, whereas sorption of Np shows a significant kinetic due to reduction ofNp(V) to Np(VI) /Vejmelka et al, 2000/.During fall of 2000 INE carried out a first of several actinide migration experiments atÄspö in cooperation with <strong>SKB</strong> staff and Nuclear Chemistry at the Royal Institute ofTechnology. The rock samples will be analysed with respect to the flow path and to theactinides sorbed onto the solid material. Nondestructive and destructive techniques willbe applied, such as x-ray computer tomography and cutting the samples after injection offluorescent epoxy resin. Distribution of actinides along the flow path will be determinedfrom the abraded material gained by cutting, as well as by coupled laser ablation ICP-MS techniques of the slices. The analysis are yet not completed.3.6 Degassing and two-phase flow3.6.1 IntroductionTwo-phase flow conditions, i.e. a mixed flow of gas and water, may develop in thevicinity of a repository situated in a regionally saturated rock mass. The main sourcesof two-phase flow conditions are 1) gas generation in the repository due to corrosion orbiological processes, 2) exsolution of gas (bubble generation) due to pressure decrease,and 3) entry of gas (air) into the rock mass from ventilated tunnels. The presence of agas phase in the repository before and after closure must be understood in relation to itseffect on repository performance. Waste-generated gas may affect repository integrityand hazardous material may be transported in the gas phase.Understanding evolution and characteristics of two-phase flow conditions near drifts isessential for interpreting observations of hydraulic conditions in drifts, interpretation ofexperiments performed close to drifts, and performance of buffer mass and backfill,particularly during emplacement and repository closure.The objectives for the project on degassing and two-phase flow are:• To show if degassing of groundwater at low pressures has significant effects onmeasurements of hydraulic properties in boreholes and drifts.• To study and quantify other processes causing two-phase flow near excavations suchas air invasion due to buoyancy and evaporation.• To show under what conditions two-phase flow will occur and be significant.Conditions expected to be of importance are gas content, chemical composition ofgroundwater, fracture characteristics (aperture distribution and transmissivities), andflow conditions.74
• To get an idea of the time scales required for resaturation of a repository.• To develop technology for measurement of saturation.During 2000, the results and conclusions achieved in the <strong>SKB</strong> degassing and two phaseflow project were summarised in a final technical report (currently in review). Theachievements include both original development of predictive models, as well as testingof these models and actual use of them for investigation the practical implications ofdegassing and two-phase flow in general for the hydraulic properties of deep bedrock.In the sections below, the main results and conclusions presented in this report aresummarised.3.6.2 Two-phase flowIn order to address the project objectives, quantitative two-phase flow models areneeded. Generally, constitutive relations between capillary pressure, (gas/water) saturationdegree and relative permeability provide an important basis in quantitative twophaseflow modelling. However, traditional constitutive relations for unsaturated flowin porous media (e.g., the Brooks – Corey and van Genuchten relations) are based onparameters that can readily be estimated in soil, but are difficult or impossible to determineindependently in fractured rock. Therefore, the predictive capability of such typicalsoil constitutive relations is limited for rock fractures under field conditions, althoughseveral studies have indicated that they can be calibrated to reproduce observed unsaturatedfracture flow behaviour.An alternative, fracture aperture based, relation for two-phase flow was preented. Therelation is based on properties (the mean aperture and the aperture standard deviation),for which undisturbed field estimates can be obtained through the resin injection technique.Since there are no previous comparative studies for this alternative fractured rockrelation, it was compared with the widely used van Genuchten relation for unsaturatedflow in porous media. The results showed that both relations yield the same kind ofunsaturated flow behaviour, given a wide range of (realistic) parameter values. As discussedabove, the van Genuchten relation has been proven useful for calibrated reproductionof unsaturated fracture flow. The consistent result of the comparison impliesthat the novel fractured rock relation is at least equally capable of calibrated reproductionof unsaturated fracture flow as the van Genuchten relation. Moreover, due to thefact that it is based on parameters that are physically relevant and independently measurablein rock fractures, it has the potential of independent prediction capabilities, which isnot the case with the porous medium relations. For the special case of groundwaterdegassing, this fractured rock relation was developed further, and directly compared withthe predictions of the developed relations with the actual outcome of both laboratoryand field experiments.Whereas groundwater degassing is primarily expected to occur relatively close to openboreholes and drifts, where detailed information on fracture aperture properties inprinciple can be obtained, other multiphase processes that can potentially affect theperformance of deep repositories may take place at much larger scales. For instance, forthe scenario of gas generation in the repository and subsequent transport through thefractured rock, the relevant scale can be on the order of a kilometre. On this scale, thehydrologic conditions cannot be known in detail throughout the domain. Rather, detailedinformation will be available in a finite number of sampling locations. This pointinformation then needs to be interpreted in some way that is relevant for the large-scaleproblem. On basis of the Leverett-scaling procedure for characteristic curves in porous75
media, a corresponding procedure for the fracture aperture based characteristic curveswas developed, and the applicability of this procedure investigated. More specifically, therelevance of using a characteristic curve obtained in a subregion of the model domain(through detailed measurements) was investigated and this curve was scaled based on“soft” data, i.e., some information on the fracture transmissivity distribution in othersubregions, in order to obtain characteristic curves for the latter subregions. The resultsshowed that the errors associated with the proposed scaling procedure were small forfractures of different mean apertures, as long as the aperture standard deviations weresimilar. The method was furthermore exact for fractures with different mean aperturesand the same aperture standard deviation.3.6.3 Groundwater degassingMechanisms and observed gas contents in the fieldThere are at least two factors that may contribute to a considerable hydraulic conductivityreduction due to degassing. First, the occurrence of bubble trapping implies that gasmay accumulate in the fracture, such that that the local degree of fracture gas saturation(i.e., gas volume per total fracture volume) is considerably greater than the evolvingvolumetric gas content ∆θ g . Second, the non-linear relative hydraulic conductivity functionsfor unsaturated flow imply that hydraulic conductivity decreases considerably withincreasing degree of gas saturation. However, none of these two factors can possiblycontribute to hydraulic conductivity reduction unless a separate gas phase forms withinthe fracture pore space.The above-mentioned evolution of a separate gas phase within the fracture is expectedto increase water pressure gradients in the vicinity of the borehole relative to the singlephasecase. This expected change in local water pressures under degassing conditions isillustrated schematically in Figure 3-31 for linear flow conditions. The thick line inFigure 3-31 illustrates the expected single-phase pressure distribution under water saturatedconditions between the fracture outlet (x=0), where the water pressure equals thep 0Water pressure (p)p btwo-phase (water+gas)single-phase (water)p atm0X gcX lowLength (x)LFigure 3-31. Illustration of the expected effect of a local gas-containing zone X gc on the pressuredistribution for linear flow conditions: a comparison between single-phase and two-phase conditions.76
atmospheric pressure p atm , and the outer boundary (x=L), where the water pressure equalsp 0 . The bubble pressure p b is illustrated by the dashed line, and the low-pressure zoneextent at saturated conditions X low extends from x=0 to the intersection between thebubble pressure line and the single-phase water pressure line. The thin pressure line inFigure 3-31 illustrates the water pressure distribution that is expected as a result of agas phase development within the low-pressure zone, and a local decrease in fracturetransmissivity due to unsaturated water flow within this zone. Local transmissivity reductionimplies steeper pressure gradient in the vicinity of the fracture outlet, causing thegas-containing zone under two-phase conditions X gc to be smaller than the low-pressurezone under water saturated conditions (X low ; see Figure 3-31). Since the overall decreasein fracture transmissivity is depending on the extent of the zone where the transmissivitiesare decreased in relation to the full fracture extent (L in Figure 3-31, it isexpected that the probability for degassing-related flow reductions increases as the ratiosX low /L and X gc /L increase. Otherwise, if the developed gas phase occupies only a verysmall part of the water-bearing fracture, the effective hydraulic conductivity of the entirefracture will remain essentially unchanged.A general restriction for the local occurrence of groundwater degassing is that thebubble pressure of the gas dissolved in the water needs to be higher than the local waterpressure; otherwise the gas will not come out of solution, which prevents the evolutionof a separate gas phase within the fracture pore space. Water pressures are oftendecreased down to atmospheric pressure when water is withdrawn from deep boreholesand drifts in the bedrock, for example, during hydraulic and tracer testing. Field datafrom different sites in the deep bedrock in Sweden suggest that the bubble pressuresindeed can be higher than the atmospheric pressure, since up to 5 volumetric percentgas have been observed to evolve when lowering borehole pressures from formationpressure down to atmospheric pressure. At Äspö HRL, between 0.1% and 5% gas hasbeen observed evolving at 350–400 metres depth. At Laxemar, the gas contents rangedbetween 2% and 5% and 1000 metres depth, and at the Stripa mine, the gas contentranged between 2% and 4% at 385 metres depth. At all the above-referenced sites,nitrogen is the dominating gas, occupying approximately 80% of the total gas volume.At the Wellenberg site in Switzerland, a change in gas composition and content withdepth has been observed, with the more shallow groundwater being dominated bynitrogen and the deeper groundwater being dominated by methane. At 300–400 metresdepth, the formation water is generally close to fully saturated with methane at formationpressure (with local existences of a free gas phase), implying even higher volumetricgas contents at atmospheric pressure conditions than for corresponding depths at theSwedish sites.Hence, the gas content data suggest that the natural conditions are such that degassingis plausible in Swedish bedrock. Furthermore, degassing was hypothesised to have causedan observed inflow reduction during a hydraulic and tracer test series in the Stripa minein Sweden. Then, the inflow to the drift was a factor eight smaller than the inflowmeasured at the same location in six boreholes forming a ring before the drift wasexcavated. As opposed to the drift case, water pressures around the boreholes wereconsiderably above atmospheric pressure due to borehole pressure regulation, thuspreventing degassing to occur around the boreholes. The potential occurrence andimpact of degassing, relative to other phenomena that may have contributed to theobserved inflow reduction in Stripa (such as changes in the rock stress conditions), couldnot be quantified based on available data. Without providing any conclusive answers, theStripa observations thus raised important questions about whether or not and to whatextent groundwater degassing may be expected to affect hydraulic property values thatare determined from drift inflow measurements at large depths below the groundwatertable, or from hydraulic tests in boreholes.77
Borehole tests in the fieldTo address the potential degassing problem, the focus of an experimental field programmewas directed towards borehole tests, because they are easier to control andmay be conducted at much lower costs than drift experiments. The main objective wasto investigate whether the lowering of pressures down to atmospheric pressures in aborehole intersecting a water bearing fracture would lead to degassing, unsaturated zoneformation and, as a consequence, changes in the fracture hydraulic properties. Duringthe pilot hole degassing test, there were no indications of considerable flow reductionsdue to degassing /Geller and Jarsjö, 1995/. The same result was obtained for two additionalsingle-well tests /Jarsjö and Destouni, 1997/. The gas contents during all thesethree tests were relatively low; 2.4% and less. Therefore, a dipole test was conducted/Jarsjö and Destouni, 1997/ where the gas content in the test hole was raised to 13%through continuous injection of gas (N 2 ) saturated water in a nearby borehole. Theresults for the dipole test showed that the inflow was considerably reduced under theseconditions; the flow rates at the end of the test were approximately 50% of the ones thatwere expected for single-phase conditions. The field tests hence indicate that considerabledegassing effects may occur in boreholes only under certain conditions.Laboratory experimentsThrough a series of laboratory experiments, degassing effects were further observedunder a wide range of different conditions (e.g., different fracture aperture distribution,gas content, flow geometry and boundary pressure), showing that the magnitude of flowreductions due to degassing indeed differed considerably between the considered set-ups.For instance, radial and linear flow experiments in transparent epoxy replicas of naturalrock fractures (sampled at the Äspö HRL and in the Stripa mine) showed that evolvedgas contents between 3% and 15% can cause fracture gas saturations of up to 40 volumetricpercent, and considerable reductions in flowrates as compared with correspondingsingle-phase conditions. For linear flow experiments /Gale, 1999/ in actual rock fracturesthat were re-assembled in the laboratory, considerable fracture transmissivity reductionswere observed at lower evolved gas contents than for the radial flow experiments. Visualisationexperiments in transparent, artificial fractures, indicated that there are instanceswhere gas bubbles do not accumulate in the fracture (as in the above-mentioned experiments)but are swept away by the (converging) flow. As a result, the relative flowratereductions were not so great, even though gas bubbles formed within the fracture porespace.Model parametersIn order to interpret and predict the occurrence of groundwater degassing, there is aneed to identify governing parameters and conditions. Provided that the differentbehaviours observed in the laboratory and in the field (i.e., occurrence or absence offlow reductions) can be explained by occurrence or absence of groundwater degassing,then some degassing-related condition must have been favourable in the cases whereflowrate reductions were observed, and not so favourable in the other experiments. Basicdegassing relations show that the extent of the low-pressure zone, X low , in relation to thetotal fracture length dimension, L, should provide some indication on whether or not itis reasonable to expect degassing-related flow reductions (see Figure 3-31). It was thereforeinvestigated whether or not there is a correlation between the relative extent of thelow-pressure zone, X low /L, and the actual outcome of degassing experiments and observationsin the field and in the laboratory (in terms of the occurrence or absence of anobservable flow reduction). More specifically all available experiments were considered78
that were conducted either in natural rock fractures, or in replicas of natural rock fractures.The results of this comparison showed that in all experiments where degassing eithercertainly did cause the flow reduction, or was a likely cause for it, the value of X low /Lwas greater than for the tests where degassing did not cause any significant inflow reductions.Considering that in total eight (sets of) experiments where accounted for in thisanalysis, the probability for this X low /L-outcome to occur randomly, i.e., to occur even ifthere were no correlation between X low /L and observed flow reductions, is only 1.8%.This clearly supports that the observed flow reductions are degassing-related.Development of predictive degassing modelsFracture aperture based degassing expressions for gas saturation degree and relativetransmissivity were developed for the condition that gas will accumulate in the fracture,i.e., that the bubble trapping probabilities are high. This condition can be checked usingthe relation of Jarsjö and Destouni /1998/, which expresses the probability of capillarybubble trapping in variable aperture fractures. Since low bubble trapping probabilitiesimply lower gas saturations and lower flow reductions, the developed expressions for gassaturation degree and relative transmissivity constitute limiting cases. Note, however,that experimental results indicated high bubble trapping probabilities in natural fractures,implying that these limiting cases often apply for the observed natural conditions.The degassing relations for gas saturation degree and relative transmissivity weredeveloped through combining a constraint for the existence of a free gas phase with theimplications of capillary effects in the fracture pore space. More specifically, this wasdone by relating the gas content dissolved in the water phase (or corresponding bubblepressure) to a critical aperture, below which gas is no longer assumed to exist as a separatephase. The physical motivation for this assumption is that the phase pressure wouldbe too high (i.e., higher than the bubble pressure) for the gas to exist under equilibriumconditions in apertures smaller than this critical aperture, due to capillary effects. Theassumption that there is such a critical aperture was confirmed by experimental observationsunder degassing conditions in transparent epoxy replicas of rock fractures, wherewater was observed to fully occupy the tighter aperture regions. The same experimentsfurthermore showed that water and gas co-existed in the wider aperture regions (withapertures greater than the critical aperture). This condition was considered in the modelrelations, through the parameter α, which quantifies the fraction of water in the wideaperture region; hence (1-α) quantifies the fraction filled with gas in this region. Acomparison between model predictions and experimental observations for both gassaturation degree and transmissivity reduction showed that a value of α of 0.2 yieldedthe best predictions. This value was therefore used in the modelling of the field results.However, for α-values between 0.2 and 0.4 the model results were relatively insensitiveto the actual value of this parameter, indicating that the exact α-value is not a criticalparameter within this range.Comparing model predictions with the outcome of borehole testsThe derived expression for relative transmissivity was used to predict the outcome of theconducted field borehole tests. In three of these borehole tests (the single-well tests), thetransmissivity reduction was negligible, whereas a considerable, (50%) reduction wasobserved in the dipole test. This experimental result was reproduced using the developeddegassing-based expression for relative transmissivity. However, some of the parametersused in this expression were based on more general, non site-specific estimates, such as79
the radius of influence (R)-value and the aperture standard deviation (σ lna )-value. Withthe aim to investigate whether or not the previously discussed model results were sensitiveto the assumed values of these parameters, and whether or not more general conclusionscan be drawn regarding degassing effects in the vicinity of boreholes, it the impactof different plausible parameter values on the modelled relative transmissivity was investigated.In this investigation a range of parameter values were considered that are relevant forrock fractures intersecting boreholes at depths between 20 and 600 metres. The investigationshowed that the model results were robust, i.e., insensitive to the ratio betweenwell radius and radius of influence (r w /R), the mean aperture µ lna , the aperture standarddeviation s lna and the boundary pressure p bound values within the considered ranges. Thisrobustness further implies that the model predictions of field borehole tests are alsorobust for these realistic parameter ranges.We furthermore identified a single, dominant parameter for degassing effects inboreholes, namely the ratio between the bubble pressure and the boundary pressure(p b /p bound ). Considering radial borehole inflow, we showed that this parameter considerablyinfluences the modelled relative transmissivity, particularly for relatively large ratios(more than about 0.8). For values below 0.8, the modelled relative transmissivity T rel wasclose to unity, implying that flow reductions due to groundwater degassing are negligible.Under natural conditions at the Äspö HRL, the gas contents (mainly nitrogen) atatmospheric pressure are relatively low, around 3% (sometimes even considerably lower).This corresponds to a nitrogen bubble pressure of about 260 kPa. At 200 metres depth,the borehole pressure at no flow (or boundary pressure p bound ) is approximately equal tothe hydrostatic water pressure of 2000 kPa. The above-mentioned p b /p bound ratio is thusaround 0.13, which is far below the value of 0.8. Hence, based on both the borehole testobservations and the consistent model predictions, it was concluded that groundwaterdegassing will not cause considerable inflow reductions in fractures intersecting openboreholes under conditions normal for Swedish granitic bedrock.Comparison with the Stripa SDE experimentThe relatively large inflow reductions observed during the Stripa simulated drift experiment(SDE) were possibly a result of groundwater degassing, although there were alsoother possible causes for the observed flow reductions. The hydrostatic water pressurewas 2300 kPa and the gas content in the water was about 3%, implying a bubble pressurep b of 260 kPa and a relatively low p b /p bound ratio of 0.11. Both experimental andmodel results show that degassing would not cause considerable transmissivity or flowreductions around boreholes for such a low ratio. Considering the difference in sizebetween a borehole and a drift, we investigated the possible influence of scale effectsfor ambient conditions relevant in the SDE. The considered effects included spatialvariability in the fracture aperture statistics (i.e., considering that the larger drift maybe intersected by a larger number of hydraulically different fractures), and slow gasre-dissolution (i.e., considering that the ratio between the gas-water interfacial area andthe gas volume may decrease as the scale and the total gas volume increase). The predictedrelative transmissivities were found to be relatively insensitive to spatial variabilityin the fracture aperture statistics. In contrast, the relative transmissivity predictions wereconsiderably different under the assumption that the gas will not re-dissolve once it hasformed in the fracture pore space (even though local pressures increase above the gasbubble pressure as a consequence of the local transmissivity reduction due to the gasformation). Under this assumption, a considerable transmissivity reduction was predictedfor the SDE, which is consistent with the experimental observations.80
ImplicationsWe conclude that the Stripa SDE cannot be reproduced by the degassing model unlessrelatively slow gas re-dissolution is assumed; we considered the limiting case that the gascould not re-dissolve at all once it had formed. This implies non-equilibrium conditionsbetween the separate, evolved, gas phase and the gas dissolved in the water phase. Themodelling of numerous laboratory experiments and boreholes tests, however, clearlyshowed that at these experimental scales, it is appropriate to assume that equilibriumconditions will be reached after some time. Whereas slow gas re-dissolution provides theonly possible degassing-based explanation for the reduced inflows observed during theStripa SDE, there are also alternative explanations for these reductions, such as stressinducedfracture deformation. With regard to the observed inflow reduction in thedipole degassing (borehole) test, however, neither fracture deformation nor turbulenceconstitute likely explanations for the observations. Further, the large number of experimentalobservations of groundwater degassing at the laboratory scale and the boreholesfield scale, in conjunction with consistent model predictions, imply that the degassingprocesses at these relatively small experimental scales are well understood and that thecorresponding conclusions are empirically well founded.3.7 Hydrochemistry modelling/Hydrochemical stability3.7.1 BackgroundThe chemical properties of the groundwater affect the canister and buffer stability andthe dissolution and transport of radionuclides. It is therefore important to know thepossible changes and evolution of the groundwater chemistry during the repository lifetime. The processes which influence and control pH, redox properties and the salinity(occurrence, character and stability of both saline and non-saline groundwaters) must beunderstood. In addition it is also necessary to know the possible variation in concentrationof those elements which affect the canister corrosion, buffer stability and solubilityand migration of radionuclides.In the past five years this project has been carried out within the framework of the Äspöagreement between <strong>SKB</strong> and Posiva. It also covers the technical parts of the participationin the EC EQUIP project and the modelling Task #5 within the framework of theÄspö Task Force for modelling of groundwater flow and transport of solutes. Theproject is ended and the final report is under way.3.7.2 ObjectivesThe objectives of this project are:• To clarify the general hydrochemical stability (= groundwater chemistry of importancefor canister and bentonite durability and radionuclide solubility and migration).• To describe the possible scenarios for hydrochemical evolution at Äspö over thenext 100 000 years, separated into time slabs of 0–100, 100–1000, 1000–10 000 and10 000–100 000 years.• To develop a methodology to describe the evolution at candidate repository sites, e.g.Olkiluoto.81
3.7.3 Model conceptsGeochemical interpretation of groundwater-rock interaction along flow paths makesuse of the results from groundwater chemical investigations, i.e. chemical constituents,isotopes and master variables pH and Eh in combination with the existing mineralogy,petrology and termodynamic data. Useful tools for these calculations are reaction pathcodes like NETPATH and equilibrium-mass balance codes like EQ 3/6. These codes arefrequently used in hydrochemical studies.A newly developed concept and code, M3, start from the assumption that it is mixingand not chemical reactions that is the dominating process affecting the chemical compositionof the groundwater within the investigated system. The principal assumptionsbehind this concept is that the varying hydraulic conditions of the past have created thecomplex mixing pattern presently observed. When the effects of mixing have beenevaluated, mass balance calculations (resulting from chemical reactions) are then made toexplain the difference between the ideal mixing and the observations. A good descriptionof the different modelling approaches is found in the Applied Geochemistry Journal, vol14, No 7, Sept. 1999.The modelling strategy for the Hydrochemical Stability project involve:• Identification of the dominant (chemical) processes for Finnish and Swedish sites.• Geochemical mixing for Äspö and Olkiluoto.• Site intercomparison and comparison between the M3 and NETPATH techniquesbased on data from Olkiluoto.• Transient hydrodynamic modelling for Äspö and Olkiluoto.The intention with the strategy is to be able to compare the results of the traditionalhydrochemical modelling with the results from M3 and to compare the outcome of thehydrodynamic modelling with the results from M3. The latter comparison is donewithin the Task #5 of the Äspö Task Force for modelling of groundwater flow andtransport of solutes.The EQUIP project has the specific objective to trace the past hydrochemical conditionsthrough investigation of (calcite) fracture filling minerals. The outcome will be comparedto the results from the hydrogeological and hydrochemical models and thusprovide an independent check of the long term stability of the groundwater flow andchemistry.3.7.4 ResultsTask#5The time for the integrated modelling of Task#5 has been prolonged and the results ofthe individual modelling teams will be printed by the middle of this year. The evaluationof the entire Task#5 will start and an external review of the modelling task are plannedto be printed by the end of 2001.The conclusions so far is that there is a need to obtain information on both hydrologicaland hydrochemical properties from the same location at the same time. Even thoughthere is a huge database on hydrochemistry, many modellers still would have neededmore time series observations from more observation points.82
In general there is an agreement that the hydrochemical information has helpedconstraining the groundwater flow models.EQUIPCalcite from open fractures mainly at Äspö and Laxemar, sampled at depth rangingfrom 25 to 1600 metres, have been analysed within the Swedish part of the EQUIPprogramme. The results were presented in the HRL annual report of 1999 /<strong>SKB</strong>,2000a/ and are only shortly presented below:The studies reveal that several generations of calcite can be identified, chemical zoningis common, and the influence on calcite precipitation of fresh or marine water decreaseswith depth.A compilation of the existing data results in identification of 6 different calcite generations:1. Calcite precipitated from meteoric water at low temperature conditions most commonin the upper 50 to 100 metres of the bedrock but may exist down to 1000 m.2. Calcite precipitated from brackish water (Baltic sea water?) at low temperatures isfound down to a depth of approximately 500 m and is possibly (or partly) ofpostglacial age.3. Calcite precipitated from oceanic water is found down to a depth of 300 metres. Thiscalcite may as youngest be Eemian in age (117 000 to 130 000 years) but may well beconsiderable older.4. Calcite precipitated from glacial/cold climate water.5. Calcite precipitated from brine water at temperatures between 60 and 150°C.6. Calcite precipitated from hydrothermal solutions usually associated with epidote,quartz, adularia and fluorite.The occurrence of calcite types 1 to 4 decrease with increasing depth, whereas calcite oftype 6, and to some extent calcite of type 5 increase with depth. Calcite generations oftype 5 and 6 constitute the thickest precipitations (mm thickness) whereas the low temperaturecalcite constitutes extremely thin coatings or rims (µm thickness) on olderhydrothermal calcite precipitates. Reliable age determinations of the low temperatureprecipitates are therefor very difficult to obtain.It is remarkable that calcites precipitated from brackish and marine water are only founddown to ca 500 m depth whereas calcites with meteoric/cold climate recharge signaturescan be traced to larger depth, possibly as deep as 1000 m. One explanation for this maybe differences in hydraulic head: Durig periods when Äspö/Laxemar was covered by sea(brackish or oceanic) the hydraulic driving force would not allow deep penetration of themarine water.3.7.5 Conclusions and implications to repository perforemanceThe first period of 100 to 1000 years are most important for the performance of a deeprepository. During this period, the amount of radionuclides is several powers of tenhigher than during later periods. The hydrochemical stability of a repository site istherefore most important for the first 1000 years.83
Expected hydrochemical conditions during the first 1000 years: Stable groundwater flowconditions, giving steady state mixing and reaction processes. Chemical factors thatinfluence this situation:• Fast precipitation/dissolution reactions (equilibriuum) for several fracture fillingminerals: calcite, iron oxyhydroxides and sulfides, giypsum, fluorite, etc. Thesereactions control the chemistry of HCO 3– , Ca 2+ , Fe II and Fe III , SO 42–, F – .• Ion exchange reactions: Na + , Ca 2+ and Mg 2+ ratios.• Fast weathering reactions: control of silica and aluminium groundwater concentrations.• (biological) redox reactions: control of organic material, Fe III /Fe II ratio, S VI /S II , O 2 ,CH 4 and H 2 , etc.Expected range of concentrations for groundwater constituents will be defined based onthe present day situations.What could change this picture during a 1000 or 10 000 year period? Man-made climatechanges could change local precipitation regimes, and thus affect slightly groundwaterflow conditions. Slow global cooling will change the hydrological regime in the longrun. Fennoscandinavian land upheaval will also affect the groundwater paths.During 10 000 to 100 000, the hydrochemical conditions will be influence by the localclimatic conditions which will probably have large variations during this period. Theprocess that affects hydrochemical stability is varying groundwater flow conditions.These variations will introduce changes in mixing groundwater patterns. Possiblescenarios, and main effects are:ScenarioEffects1. Colder climate, which eventually will Changes in precipitation amounts andlead to permafrostrecharge. Permafrost will probablychange groundwater flow paths.2. Ice sheet: glaciation and deglaciation. Infiltration of glacial melt water.A minimum amount of cations isquickly achieved by fast water-mineralinteractions, as described above. Perhapshigh O 2 contents. Oxidising conditionsmight reach repository level dependingon the ratio between groundwater flowand chemical and microbial reactions.3. Marine conditions: either freshwater Under saline marine conditions,or saline water regimes (lake/seadifferences in water densities mightcoverage).cause a “turnover”: relatively fastgroundwater flows in vertical fracturezones.4. Interglacial periods (land) Climate conditions similar to present,or perhaps colder. Hydrochemistryprobably similar to the first 10 000 yearperiod.84
3.8 Matrix Fluid Chemistry3.8.1 BackgroundKnowledge of matrix fluids and groundwaters from crystalline rocks of low hydraulicconductivity (K< 10 –10 ms –1 ) will complement the hydrogeochemical studies alreadyconducted at Äspö, for example, matrix fluids are suspected to contribute significantly tothe salinity of deep formation groundwaters. Migration of matrix fluids will be facilitatedby small-scale fractures and fissures. Therefore the matrix fluid chemistry will be relatedto the chemistry of groundwaters present in hydraulically-conducting minor fractures(K= 10 –10 –10 –9 ms –1 ). This is important to repository performance since it will be thesegroundwaters that may initially saturate the bentonite buffer material in the depositionholes. Such data will provide a more realistic chemical input to near-field performanceand safety assessment calculations.3.8.2 ObjectivesThe main objectives of the experiment are:• to determine the origin and age of the matrix fluids,• to establish whether present or past diffusion processes have influenced the compositionof the matrix fluids, either by dilution or increased concentration,• to derive a range of groundwater compositions as suitable input for near-field modelcalculations, and• to establish the influence of fissures and small-scale fractures on fluid chemistry in thebedrock.3.8.3 Experimental ConfigurationThe experiment has been designed to sample matrix fluids from predetermined, isolatedborehole sections. The borehole was selected and drilled on the basis of: a) rock type,b) mineral and geochemical homogeneity, c) major rock foliation, d) depth, e) presenceand absence of fractures, and f) existing groundwater data from other completed andon-going experiments at Äspö. Special equipment has been designed to sample thematrix fluids ensuring: a) an anaerobic environment, b) minimal contamination from theinstallation, c) minimal dead space in the sample section, d) the possibility to control thehydraulic head differential between the sampling section and the surrounding bedrock,e) in-line monitoring of electrical conductivity and uranine content, f) the collection offluids (and gases) under pressure, and g) convenient sample holder to facilitate rapidtransport to the laboratory for analysis.3.8.4 ProgrammeDuring the latter part of 1999 a Feasibility Study was carried out on solid drillcorematerial representing one of the borehole sections isolated for sampling matrix fluid.The first stage of the study comprised the basic mineralogy and major and trace elementgeochemistry to generally characterise the rockmass. These data were then used toinitially characterise fluid inclusion populations and to identify which elements andisotopes to be determined. Crush/leach experiments were conducted also to indicate the85
nature of the matrix fluid. During 2000 a full programme of study has been on-goingand activities carried out have involved: a) mineralogical studies, b) porosity measurements,c) crush/leaching experiments, d) Äspö diorite permeability test, e) fluid inclusionstudies, f) matrix water sampling, and g) compilation and interpretation of groundwaterand hydraulic data from the TRUE, Prototype Repository, Chemlab and Microbeexperiments, representing the bedrock environment in the near-vicinity of the MatrixExperiment borehole. The first half status of the project is reported in Smellie /2000/.3.8.5 Drillcore studiesOne of the major problem is to separate and analyse the pore or matrix fluids in theinterconnected pore system of the rock matrix. Pore fluids are important to characterisesince accessibility of these fluids not only influences the chemistry of the formationgroundwaters, but the fluid chemistry can also to be influenced by the formationgroundwaters by out- and in-diffusion processes respectively. The inaccessible fluids inclosed-off pore spaces, at microfracture/fissure dead-ends, and contained in fluid inclusionsare of very little importance unless tectonic stresses induce connected porosity andcause fracturing of the fluid inclusions. These effects may also be caused by water-rockinteraction (i.e. dissolution) over long time periods. In both cases pore fluids and fluidinclusion fluids become accessible via the interconnected porosity and may be furthertransported through the rock by diffusion and, in some cases, ultimately by advectiveflow via micro fissures/fractures. If these fluids are highly saline, they can contribute toincreasing salinity of the formation groundwaters.The matrix drillcore studies to date indicate that the interconnected physical or totalrock porosity is similar throughout the drillcore length studied even though two rocktypes (Äspö diorite and Ävrö granite) have been identified. Crush/leach experiments haveindicated that the total fluid content in the rock (e.g. from fluid inclusions, pore fluid,interstitial fluid etc) is highly saline and most of this can be explained by the influenceof the fluid inclusions. However, the specific chemistry of the accessible pore or matrixfluid is still not known. The permeability experiment has tried to address this byattempting to force out the connected pore fluids by pressurising deionised waterthrough the core. This has still not yielded any results after almost 2 years.3.8.6 SamplingSince the sampling carried out in borehole Section 4 (4.66–5.26 m) in December 1999,borehole Section 2 (green colour; 8.85–9.55 m) has continued to show a small, butsteady pressure increase during 2000 (Figure 3-32). This will be allowed to continueuntil adequate matrix fluid has accumulated (total section volume of 245 mL). This isscheduled for late 2001 and the sampling and analytical protocol will involve a moresophisticated approach that will include gas analysis. A renewed pressure increase inSection 4 (blue colour) indicates that the section is being refilled and resampling isscheduled also for 2001. The much slower accumulation of fluid in Section 2, plus theabsence of large fluid volumes in the adjacent Section 1 (red colour; already opened in1999), may suggest a lower connected porosity and therefore more representative matrixfluid composition than collected from borehole Section 4.86
PLOT TIME :01/02/26 15:05:16PLOT FILE :KF0051ADSPV HRLMD21 KF0051A1kPaLAST CALIBRATION00/12/22 00:00:00160MD22 KF0051A2kPaLAST CALIBRATION00/12/22 00:00:00MD23 KF0051A3kPaLAST CALIBRATION00/12/22 00:00:00MD24 KF0051A4kPaLAST CALIBRATION00/12/22 00:00:001501401301201101009080706001-02 22 02-11 03-02 22 04-11 05-01 21 06-10 30 07-20 08-09 29 09-18 10-08 28 11-17 12-07 27month-daySTART :00/01/01 00:00:00 INTERVAL: >= 24 Hours STOP :01/01/01 00:00:00Figure 3-32. Pressure monitoring curves for each of the four isolated borehole sections; 1(red),2 (green), 3 (yellow) and 4 (blue). Sections 2 and 4 are demarcated for matrix fluid sampling.3.8.7 Hydraulic character of the rock matrixGeneralInformation used in estimating the hydraulic properties of the rock matrix included:• changes in pressure recorded from each of the four isolated borehole sections ofinterest over a period of two years (Figure 3-32),• after a period of 18 months borehole sections 1 and 4 were opened; Section 1 was drybut Section 4 gave 160 mL of water out of a total volume of 210 mL ,• petrological data have located a fine fracture intersection with the borehole at 4.035m were a packer is located; this intersection is some 56.5 cm from Section 4 towardsthe tunnel, and• mineralogical data have suggested that the Äspö diorite may be more porous than theÄvrö granite, although this is presently not reflected in the measured connectedporosity.PredictionsEstimated times to accumulate 250 mL matrix fluid (approximating to the respectivevolumes of Sections 2 and 4 earmarked for sampling) were predicted based on a range ofhydraulic conductivity values. Both radial and spherical Darcian flow were consideredassuming differential pressures within 10–35 bar and a radius of influence 5–10 m. Theresults of the predictions are shown in Figure 3-33. The increase in pressure in boreholeSection 4 after the first 15 months (June 1998 to December 1999) suggests that thehydraulic conductivity in the matrix rock block lies somewhere around 10 –14 –10 –13 ms –1 .87
Hydraulic conductivity (m/s) log base 10-14-13-12-11-102-D flow, diff p 10 bar infl 10 m2-D flow, diff p 35 bar infl 5 m3-D flow, diff p 10 bar3-D flow, diff p 35 bar-90.001 0.01 0.1 1 10 100 1,000 10,000Time (days)Figure 3-33. Predicted times to accumulate 250 mL of matrix fluid, based on a range of hydraulicconductivities, considering both radial and spherical Darcian flow and assumed differential pressurewithin 10–35 bar and radius of influence 5–10 m.Following the opening of the two borehole sections in December 1999, when 160 mL ofwater was recovered from Section 4, out of a maximum of about 180 mL (around 20 mLresidual volume was inaccessible due to packer/borehole geometry), further calculationswere made. From the measured inflow rate, the actual pressure in the borehole section,and an estimate of pressure in the surrounding rock creating differential pressures within10–35 bar and radius of influence 5–10 m, the hydraulic conductivity of the matrix rockblock was calculated. Even though there are uncertainties in estimated pressure and theassumed flow regime, both radial and spherical Darcian flow, the calculated hydraulicconductivity of 1⋅10 –14 –6⋅10 –14 ms –1 of the matrix rock block is judged reasonable and inaccordance with the earlier predictions.Fluid movementThe chemical analysis of the sampled fluid from borehole Section 4 (see discussion inSection 8.3) showed a water composition more typical of conductive minor water-bearingfractures in the near-vicinity of the matrix borehole (e.g. transmissivites of 10 –10 –10 –5m 2 s –1 ) than what was expected from the matrix fluid. Hence, the existence of preferential“flow paths” in the matrix rock, closely located to minor water-bearing fractures seemspossible. In this respect the very fine, semi-permeable fracture/fissure (located on theBIPS image) intersecting the borehole some 56.5 cm from Section 4, may play an importantrole; microscopic characterisation of this fracture is forthcoming.Based on present knowledge of the local bedrock hosting the matrix borehole (~ 10m 3 ),and the groundwater hydraulics and chemistry of the near-vicinity bedrock environment(~ 50m 3 ), a preliminary conceptual model summarising the hydraulic nature of thematrix rock environment, is presented in Figure 3-34. The solid arrows in the figure88
Figure 3-34. Schematic conceptualism of the hydraulic character of the bedrock environmentadjacent to the matrix borehole. (Solid arrows represent advective groundwater flow; broken arrowsrepresent mainly in- and out-diffusion processes.)indicate advective groundwater flow and the broken arrows represent mainly in- andout-diffusion processes through the rock matrix.3.8.8 The surrounding hydrochemical environment of thematrix boreholeGeneralMatrix fluids are here considered to constitute the pore fluids in the rock matrix. However,the accessibility of these fluids, and their ability to move through the rock matrix,will depend on whether or not the pore spaces are interconnected. Assuming interconnectedpore spaces, it is important to try and relate the matrix fluid chemistry to thechemistry of groundwaters present in nearby minor fracture zone(s) of low hydraulictransmissivity (T= 10 –12 –10 –9 m 2 s –1 ), since it will be these groundwaters that will comein contact eventually with the engineered barrier materials following repository closure.Since these fracture zones represent variations in transmissivity, orientation and alsorepresent different geographical locations, they may also be characterised by differenthydrochemical signatures. These signatures may be the result of one or any combinationof the following processes occurring within and close to the fracture zones:• water/rock interaction during long residence times,• mixing of palaeowaters from past marine stages,• mixing of palaeowaters from past glacial periods,89
• mixing of modern groundwater components, and• evolution of groundwater chemistry by out-diffusion of pore fluids from the rockmatrix into fracture zones, or vice versa, in-diffusion of fracture waters to the matrix.These are important points to be addressed, and to deal with them adequately a reliablehydraulic and hydrochemical database is required. To compile a database of fracturegroundwater chemistry, related to hydraulic conductivity and at equivalent depths tothe matrix fluid experiment, three sets of suitable data have been used:• data from fractures present in the near-vicinity of the matrix fluid chemistry experimentborehole, i.e. from the “J” niche as part of the on-going CHEMLAB andMicrobe experiments,• data from the TRUE Block Scale Experiment programme, and• data from the deposition holes (and their surroundings) resulting from the PrototypeRepository.Hydraulic parametersThe hydraulic data from the TRUE Block Scale experiment is well documented andmeasured hydraulic transmissivities of the sampled fractures range from 10 –8 –10 –5 m 2 s –1 .Hydraulic data from the Prototype Repository was obtained in close collaboration;several borehole sections were selected for quantitative hydrochemical characterisationwith transmissivities ranging from 10 –10 –10 –8 m 2 s –1 . No quantitative hydraulic data areavailable from the “J” niche but measured groundwater flow rates (0.6–4.0 mL/min)from packed-off intervals in boreholes KJ0044FO1, KJ0050F01, KJ0052F01,KJ0052F02, KJ0052F03 (Microbe Experiment) would suggest transmissivities inthe range of 10 –8 –10 –7 m 2 s –1 .HydrochemistryThe general chemical character of the groundwaters from each of the sampled sites canbe seen from the PCA plot in Figure 3-35. The exact location of the “matrix” sample isuncertain as all the chemical and isotopic parameters are not known due to the smallvolume of water obtained. Tabell 3-3 shows the average values for TRUE Block Scale,Prototype Repository and J-tunnel (Chemlab/Microbe) experiments, compared to theMatrix data and Prototype Repository sample KA3572G01.Figure 3-35 shows a clear separation of the “J” niche and Prototype Repository sampleswith the TRUE Block Scale samples extending over the full range of both groupings;the “Matrix” sample and that of KA3572G01 (Prototype Repository) are clearly different.The distribution of the plotted data is controlled by variation of the saline, glacialand Baltic Sea components; the greater the Baltic component, the less the glacial (andsaline) component.To date the general conclusion is that over the range of hydraulic conductivity representedby the sampled fractures, most show little obvious correlation with groundwaterchemistry. The data indicate an influx of a modern groundwater component, such asBaltic Sea and meteoric precipitation waters, associated with the hydraulic drawdowncaused by tunnel construction, to the detriment of older saline and glacial melt watercomponents which have been diluted or removed. This has been particularly apparentwith the Prototype Repository samples, despite the generally low transmissive character90
0.40.3Second Principal Component0.20.10-0.1BrineBaltic SeaAltered MarinePrecipitation-0.2Glacial-0.3-0.6 -0.5 -0.4 -0.3 -0.2 -0.1 0 0.1 0.2First Principal ComponentÄspö site Prototype Repository TRUE Block Scale Niche Matrix FluidFirst Principal Componet = – 0.49[Na] – 0.03[K] – 0.01[Ca] – 0.03[Mg] + 0.13[HCO 3 ] + 0.24[Cl]+ 0.16[SO 4 ] – 0.17[ 2 H] + 0.75[ 18 O] + 0.25[ 3 H]Second Principal Component = – 0.25[Na] + 0.35[K] + 0.04[Ca] + 0.45[Mg] + 0.31[HCO 3 ] – 0.69[Cl]– 0.18[SO 4 ] – 0.09[ 2 H] + 0.06[ 18 O] – 0.003[ 3 H]Variance: Comp. 1 = 40%; Comp. 1+2 = 70%Matrix Fluid sample, chemical composition:Na = 2200; K = 11.4; Ca = 964; Mg = 7.76; HCO 3 = 185 (mean value); Cl = 5180; SO 4 = 26;2H = –87.9; 18 O = –11.6; 3 H = 0 (assumed to be; no measurement)Figure 3-35. PCA plot showing distribution of groundwaters from the TRUE Block Scale,Prototype Repository and “J” niche experimental sites. These data are related to the overall Äspödatabase and to the approximate position of the “Matrix Fluid” sample.of the sampling locations, probably due to their near-vicinity to the excavated tunnelopening. Nevertheless there are indications that at least one of the lower transmissivefractures (KA3572G01; 10 –9 m 2 s –1 ) has been less influenced by the drawdown due to alonger response time, retaining a lower Mg content and more negative 18 O signature,together with an overall higher total dissolved solids (TDS) content. This may reflect adifferent fracture orientation than the other sampled fractures. Drawdown effects are lessevident from the J-tunnel and TRUE Block Scale sites probably due to the samplinglocations being further from the excavated tunnel opening.The “matrix” sample, whilst reflecting a generally similar major ion character to nearbyfracture compositions (with the exception of SO 4 and Mg), exhibits anomalous chlorineisotope and strontium isotope signatures and higher contents of most trace elementswhich may be more characteristic of a “true” matrix component. It is hoped that thesampling from borehole Section 2 scheduled for later this year will shed more light onthe matrix fluid chemistry and its origin.91
Tabell 3-3. Average values for TRUE Block Scale, Prototype Repository and J-tunnel(Chemlab/Microbe) experiments, compared to the Matrix data and Prototypesample KA3572G01.Element TRUE Prototype KA3572G01 “J” Niche MatrixBlock[n=8] [n=7] [n=1] [n=5] [n=1](mg/L) (mg/L) (mg/L) (mg/L) (mg/L)Na 1 983 1 887 2 340 2 286 2 200K 7.9 9.1 10.3 9.11 11.4Mg 42.4 86.4 24.8 54.1 7.8Ca 1 396 770 800 1 996 964Fe 0.09 0.34 – 0.90 0.24Si 5.7 7.9 5.4 5.7 7.6F 1.2 1.3 1.2 – –Cl 5 675 4 210 4 810 6 944 5 160Br 30.7 19.9 27.2 39.3 43.16SO 4 363 308 617 447 26Alkalinity 19 155 – 40 Approx.170–200pH 8.0 7.3 7.4 7.4 6.7(µg/L) (µg/L) (µg/L) (µg/L) (µg/L)Li 860 360 435 920 274Sc
3.8.9 Future activities and milestonesThe following activities planned for the immediate future will include:• continuation of drillcore crush/leach experiments with specific emphasis onlithological variation and porosity profiles,• continuation of the permeability test,• continuation of fluid inclusion mineralogical/petrographical charaterisation andchemistry,• expand coverage of drillcore porosity measurements (some integrated with thecrush/leach experiments) to achieve a better idea of large-scale heterogeneity orhomogeneity in the matrix block, and also to further characterise the Ävrö graniterock type,• detailed study of 1–2 micro-fractures/fissures with respect to in- or out-diffusionprocesses. This will include whole-rock measurements of the U-decay series, 37 Cl,11B, 86 Sr and 87 Sr along profiles perpendicular to the fracture intersection with thedrillcore,• simple leaching of drillcore material using distilled water,• scoping study to locate further examples of low transmissive features already characterisedto increase the hydrogeological/hydrochemical database, and• eventual sampling of borehole Section 2 (and possibly a second sampling of Section 4)when indications show that enough water has accumulated.3.9 The Task Force on modelling of groundwater flow andtransport of solutes3.9.1 BackgroundThe work within the Äspö Task Force constitutes an important part of the internationalco-operation within the Äspö Hard Rock Laboratory. The group was initiated by <strong>SKB</strong>in 1992 and is a forum for the organizations to interact in the area of conceptual andnumerical modelling of groundwater flow and transport. The work within the TaskForce is being performed on well-defined and focused Modelling Tasks and the followinghave been defined so far:• Task No 1: The long term pumping test (LPT-2) and tracer experiments. Site scale.• Task No 2: Scoping calculations for a number of planned experiments at the Äspösite. Detailed scale.• Task No 3: The hydraulic impact of the Äspö tunnel excavation. Site scale.• Task No 4: Modelling of radionuclide transport in a hydraulic feature based on datafrom the Tracer Retention and Understanding Experiment ,1 st stage (TRUE-1). Thisinvolves non-reactive and reactive tracer tests at a detailed scale of 5 m.• Task No 5: Impact of the tunnel construction on the groundwater system at Äspö, ahydrological and hydrochemical model assessment exercise. It is conducted at the sitescale of about 1km.93
• Task No 6: Apply performance assessment (PA) and site characterization approachesfor the same tracer experiment and PA boundary conditions. Aims at identifyingrelevant conceptualisations for longer term PA predictions and identify site characterisationdata requirements to support PA calculations. This task was approved forinitiation during 2001.During 2000 eight foreign organisations in addition to <strong>SKB</strong> were participating in theÄspö HRL Task Force. These organizations are: Japan Nuclear Cycle DevelopmentInstitute (JNC), Japan; Central Research Institute of Electric Power Industry (CRIEPI),Japan; Agence National pour la Gestion des Déchets Radioactifs (ANDRA), France;POSIVA Oy, Finland; Nationale Genossenschaft für die Lagerung Radioaktiver Abfälle(NAGRA), Switzerland; Bundesministerium für Wirtschaft und Technologie (BMWi),Germany; Empresa Nacional de Residuos Radiactivos (ENRESA), Spain and US DOE/Sandia National Laboratories.3.9.2 ObjectivesThe Äspö Task Force is a forum for the organizations supporting the Äspö HRL Projectto interact in the area of conceptual and numerical modelling of groundwater flow andsolute transport in fractured rock. In particular, the Task Force shall propose, review,evaluate and contribute to such work. The Task Force interacts with the Principal Investigatorsresponsible for carrying out experimental and Modelling work for the Äspö HRLin areas of particular interest for the members of the Task Force.3.9.3 ResultsModelling for Task 1–3 were completed in previous years. Results are presented for Task4 and 5 only.Task 4Work was undertaken within sub-task E and F which both concerned modelling of thesame geometrical configuration of a dipole test but with different flow rates.Deconvolution of breakthrough curves in Task 4FTo evaluate the breakthrough curves excluding the effects caused by the injection procedurea mathematical treatment of the tracer test data can been done. This treatment,called deconvolution, uses the experimental tracer injection curves and breakthroughcurves to evaluate what the breakthrough curve would have looked like if the injectionwas performed as a pulse with unit mass and zero duration (Dirac function). Ideally, allfeatures of the resulting curve – the unit response function – are caused by processesoccurring during the transport. In reality experimental errors may cause oscillations ormathematical artefacts in the unit response function. Therefore, mathematical manipulationof the experimental curves in the form of smoothing or curve fitting may beneeded.Deconvolution of experimental breakthrough curves using the injection curve in orderto obtain a unit response function is a useful approach to evaluate tracer experiments inorder to identify features in the breakthrough curves caused by transport processes and94
not caused by the shape of the injection curve. In particular they can be used for comparisonwith unit response functions obtained from model predictions.For the STT-2 test which was modelled in Task 4E and 4F the double peak present inthe breakthrough curve remains in the unit response function after deconvolution. Thisis an indication that the double peak is not an effect of the injection procedure, but aneffect due to the presence of multiple pathways during the tracer test.The method presently used for deconvolution has successfully deconvoluted all of thetracers used in the STT-2 test. However, there is a need for further improvement of themethod in order to obtain a better resolution for non-sorbing tracers and to handlecurves with oscillations due to large experimental errors.This work is reported in Elert and Svensson /2001/.Task 5The modelling task consists of: a) predicting water composition expressed as mixingproportions of water types at selected control, b) predicting hydraulic head in selectedboreholes and c) making an assessment of the chemical evolution during tunnel construction.The modelling was completed during the year and draft final reports wereproduced.A Task Force Meeting was held in Carlsbad, NM on February 8–11 /Morosini, 2000/.3.10 Colloids3.10.1 BackgroundColloids are small particles in the size range 10 –3 to 10 –6 mm these colloidal particles areof interest for the safety of spent nuclear fuel because of their potential for transportingradionuclides from a defect repository canister to the biosphere.<strong>SKB</strong> has for more than 10 years conducted field measurements of colloids. The outcomeof those studies performed nationally and internationally concluded that the colloids inthe Swedish granitic bedrock consist mainly of clay, silica and iron hydroxide and thatthe mean concentration is around 20–45 ppb which is considered to be a low value/Laaksoharju et al, 1995/. The low colloid concentration is controlled by the largeattachment factor to the rock which reduces stability and the transport capacity of thecolloids in the aquifer.It has been argued that e.g. plutonium is immobile owing to its low solubility ingroundwater and strong sorption onto rocks. Field experiments at the Nevada Test Site,where hundreds of underground nuclear tests were conducted, indicate that plutonium isassociated with the colloidal fraction of the groundwater. The 240 Pu/ 239 Pu isotope ratioof the samples established that an underground nuclear test 1.3 km north of the samplesite is the origin of the plutonium /Kertsting et al, 1999/. Based on these results <strong>SKB</strong>decided year 2000 to initiate the project COLLOIDS at Äspö-HRL to study the stabilityand mobility of colloids. The project will run during the time period 2000–2002.95
3.10.2 ObjectivesThe objectives of the colloid project is to:1. Study the role of bentonite clay as a source for colloid generation.2. Verify the colloid concentration at Äspö-HRL.3. Investigate the potential for colloidal transport in natural groundwater flow paths.3.10.3 Experimental conceptThe experimental concept for the Colloid project is: laboratory experiments, backgroundmeasurements and fracture specific measurements. These concepts are described below:Laboratory experiments: The role of the bentonite clay as a source for colloid generationat varying groundwater salinities (NaCl/CaCl) will be studied in a laboratory experimentperformed at KTH (Royal Institute of Technology) and at the company ClayTechnology (Figure 3-36).Background measurements: The background colloid concentration associated with thedifferent water types found at Äspö will be sampled at specific locations along the ÄspöHRL-tunnel. The colloid content will be measured on-line from the boreholes by usinga modified laser based equipment LIBD (Laser-induced Breakdown-Detection) whichhas been developed by INE in Germany (Figure 3-37). The advantage is that the resolutionof this equipment is higher compared with standard equipment. It is thereforepossible to detect the colloid contents at much lower concentrations than previouslypossible. The outcome of these measurements will be compared with standard type ofmeasurements such as particle counting by using Laser Light Scattering (LLS) at KTHand at INE. Standard type of filtration performed on-line at the boreholes are used inorder to be able to compare/transform these results to all the earlier colloid samplingcampaigns at Äspö.Figure 3-36. The salinity of the water may affect the colloid generation. The experiment showdifferent degrees of sedimentations of bentonite clay dependent of the ion content (NaCl) in the water.A very high or low ion content may result in bentonite instability and colloid generation.96
Figure 3-37. Equipment for Laser-induced Breakdown-Detection (LIBD) of colloids (upper picture).The equipment is installed in a van in order to allow mobility and on-line measurements (lowerpicture).Fracture specific measurements: For the fracture specific measurements two nearbyboreholes at HRL will be selected for the experiment. One of the boreholes will be usedas an injection borehole and the borehole downstream will be used as a monitoringborehole. The boreholes intersect the same fracture and have the same basic geologicalproperties. After assessing the natural colloid content in the groundwater bentonite claywill be dissolved in ultra pure water to form colloidal particles. These clay colloids willbe labelled with uranine, a water conservative tracer. The mixture will be injected intothe injection borehole (Figure 3-38). From the monitoring borehole the colloidal contentwill be measured with laser (LIBD/LLS), the water will be filtered and the amountof tracers will be measured.The following results are of interest 1) is the bentonite clay a potential source forcolloid generation and, 2) is the colloid content lower after transport. The outcome ofthe experiment is used to check the calculations in the safety assessment report such asTR 91-50 and to be used in future colloid transport modelling.3.10.4 Scope of work for 2000The scope of the work for 2000 contained planning and preparation work for theproject.97
Fracture zonePackerNatural ColloidsFlow directionBentonit Colloids+tracerAInjection boreholsProduction boreholeBÄspö HRL Access Tunnel5mFigure 3-38. Injection of bentonite colloids and a tracer at the injection borehole and monitoring ofthe injected and natural colloids in the production borehole.3.11 Microbe3.11.1 BackgroundA set of microbiology research tasks for the performance assessment of high levelradioactive waste (HLW) disposal has been identified /Pedersen, 1999/. Those with apotential for study at the MICROBE site deal with redox stability of the host rockenvironment, radionuclide transport and copper corrosion. Microbes produce andconsume gases. It is important to understand to what extent microbial production andconsumption of gases like carbon dioxide, hydrogen, nitrogen and methane will influencethe performance of a repository. Microbes are supposed to have an influence on radionuclidemigration. The extent of microbial dissolution of immobilised radionuclides andproduction of complexing agents that increase radionuclide migration rates should bestudied. Attached microbes on fracture walls and fillings may retard migrating radionuclidesand this process should be evaluated as it may add as a retention component intransport models. Bio-corrosion of the copper canisters, if any, will be a result of microbialsulphide production. Survival and activity of sulphide-producing bacteria in thebentonite buffer would result in production of sulphide in the bentonite surroundingthe canisters. The present hypothesis is that highly compacted bentonite does not allowmicrobial sulphide producing activity. This hypothesis needs testing under relevantrepository conditions, such as those at MICROBE.98
3.11.2 ObjectivesThe major objectives for the MICROBE site are:• To assay microbial activity in groundwater at in situ conditions. The microbialinfluence on redox conditions, radionuclide migration and gas production andconsumption will be in focus.• To establish data on hydrogen generation and flow in granitic rock environments.The flow of hydrogen from where it is produced will determine the possible rate oflong-term microbial redox stabilising activity, especially during periods of glaciation.• To enable experiments where engineered barriers (e.g. bentonite, backfill and copper)can be investigated for the influence of microorganisms at realistic and controlledconditions with a significant knowledge about groundwater used.• To generate accurate data about rates of microbial reactions at repository conditions,for performance assessment calculations.3.11.3 Experimental conceptThe objectives above have been addressed in a range of projects, of which some areongoing. Important conclusions have been obtained based on laboratory and field data.While some results seem very solid with general applicability, others are pending inspectionat in situ conditions. This is especially true for data generated at the laboratoryonly. In situ generated data must be obtained for microbial activities anticipated in thefar- and near-field environment at realistic repository conditions. This can be achievedat an underground site, developed for microbiological research, using circumstantialprotocols for contamination control during drilling and operation. An in situ site allowsexperiments at natural pressure with relevant gas content in groundwater, which is ofgreat importance for microbial activity and very complicated to obtain in vitro. Such asite was drilled in May 1999 in the J-niche at Äspö HRL, 450 m underground. TheJ-niche tunnel has a largest diameter of 9 m and is located at about 450 m depth. Thelength of the niche is 20 m. Three boreholes were produced for MICROBE. Two additionalboreholes have been drilled in the J-niche for CHEMLAB. Groundwater datafrom those two adjacent boreholes have been included in the results for comparison.Drilling of the MICROBE boreholes followed an established quality plan using steamand alcohol cleaning to minimize potential contamination. Triple-tube drilling techniquewith the use of a core retriever was used to minimise the exposure of the core to drillwater and to deliver the core intact, also when multi-fractured rock is penetrated. Thedrill tube protected the drill core from contact with aquifer systems intersected duringdrilling. A split tube keept intersected fractures intact, with also small pieces of rock intheir original place.The MICROBE boreholes are instrumented with packers that do not expose metal tothe groundwater. It was deemed important to have the smallest possible void volume inthe packer systems. One water-conducting feature was found in each of the MICROBEboreholes. They have been sectioned off with a double packer with a sealing length of1000 mm per packer. The material chosen for the hard body parts was PEEK.A system that allows circulation of groundwater under full formation pressure is presentlybeing designed (Figure 3-39). This system should enable work with microbes atvery close to in situ conditions. It is planned to be operative early summer 2001.99
MynningAv-gasningManometerCirkulationspumpSprickaBorrhålSolid kropp1,5 mm cylindrisktutrymmePackningarProvtagningManometerFlödesmätningBiofilmreaktorerTillsättningBerg, 450 m under markFigure 3-39. The circulation system at MICROBE.A system for sensible measurement of hydrogen and other reducing gases will also bedeveloped. A reduction gas detector will be applied, having a detection limit for hydrogen,carbon monoxide and methane close to 1 part per billion. This system will be usedfor characterisation of hydrogen generation and flow in granitic rock environments. Theresults will be compared with theoretical calculations performed at KTH, Stockholm.The site will enable a continuation of buffer tests /Pedersen et al, 2000/, including astudy of the potential for microbial copper corrosion at repository conditions. Theplanned start for those experiments is spring 2001. Installation of biofilm reactors in thecirculation system is planned for investigations of radionuclide retention experiments.3.11.4 ResultsThe main activity for the MICROBE site year 2000 has been to characterize the chemistryand the microbiology of the groundwater in the drilled boreholes.3.11.5 Groundwater chemistryGroundwater was sampled and chemical analysis was performed according to the Class Vprotocols. Results on the chemical main constituents, environmental isotopes, stableisotopes of gases and trace elements of the groundwater have been recently reported/Pedersen, 2000/. The contents of gas and the amounts of specific gases are central forthe fulfilment of the objectives and the results are shown in Table 3-4. The nitrogencontent has a position in the middle of the range of gas data obtained in groundwaterfrom the Fennoscandian shield, while argon lies among the lower and helium amongthe higher values obtained /Pedersen, 2000/. Carbon dioxide and hydrogen also haveaverage positions in the ranges while methane is in the upper part of the range observed.100
Table 3-4. The amount and content of gases in the J-niche boreholes.Borehole Volume N 2 H 2 He Ar CO 2 CH 4 C 2H 2 C 2H 4 C 2H 6 C 3H 6 C 3H 8gasml/L ml/L µl/L ml/L ml/L ml/L ml/L µl/L µl/L µl/L µl/L µl/LCHEMLAB 91 77.6 6 9.27 0.78 0.37 0.92
3.11.7 Principal component analysis of groundwater chemistry resultsResults from Principal Component Analysis (PCA) analysis /Laaksoharju et al, 1999/based on the MICROBE data set together with geochemical data from many otherFennoscandian shield sites are shown in Figure 3-40. The constituents used for themodelling were the major components (Na, K, Ca, Mg, HCO 3 , Cl and SO 4 ), tritium( 3 H) and stable isotopes (δ 2 H and δ 18 O). It is known that these components contain mostof the variability of the information in groundwater data. The variability for the first andsecond principal components shown in Figure 3-40 is 70% which means that the firstand second principal components summarize 70% of the groundwater data information.The weight for the different elements is shown in the equations for the first and secondprincipal components respectively. From these weights the importance of the individualelements for the total analysis can be tracked. The MICROBE (and CHEMLAB)groundwater samples plot in the middle of Figure 3-40, showing that those waters donot have an extreme groundwater composition and that the samples are affected bymixing of several reference waters.Figure 3-40. Principal component plot showing groundwater chemical data from the MICROBEand CHEMLAB sites (red) in comparison to data from Fennoscandian field sites (black +). Thesamples from the investigated sites plot in the middle of the PCA-plot indicating that these watersmay be affected by a possible mixing contribution from several reference waters such as glacial, brineand precipitation. 1 and 4 are CHEMLAB boreholes, 2, 3 and 5 are the MICROBE boreholes.102
4 Demonstration of technology for and functionof important parts of the repository system4.1 GeneralStage goal 4 of the Äspö HRL is to demonstrate technology for and function ofimportant parts of the repository system. This implies translation of current scientificknowledge and state-of-the-art technology into engineering practice applicable in a realrepository.It is important that development, testing and demonstration of methods and procedures,as well as testing and demonstration of repository system performance, is conductedunder realistic conditions and at appropriate scale. A number of large-scale field experimentsand supporting activities are therefore in different phases of planning, installationor operation at the Äspö HRL. The experiments focus on different aspects of engineeringtechnology and performance testing, and will together form a major experimentalprogramme.With respect to technology demonstration important overall objectives of thisprogramme are:• To furnish methods, equipment and procedures required for excavation of tunnelsand deposition holes, near-field characterisation, canister handling and deposition,backfilling, sealing, plugging, monitoring and also canister retrieval.• To integrate these methods and procedures into a disposal sequence, that can bedemonstrated to meet requirements of quality in relation to relevant standards, aswell as practicalityWith respect to repository function, objectives are:• To test and demonstrate the function of components of the repository system.• To test and demonstrate the function of the integrated repository system.4.2 The Prototype Repository4.2.1 BackgroundMany aspects of the repository concept (KBS-3) have been tested in a number of in-situand laboratory tests. Models have been developed that are able to describe and predictthe behavior of both individual components of the repository, and the entire system.However, processes have not been studied in the complete sequence, as they will occurin connection during repository construction and operation. There is a need to test anddemonstrate the execution and function of the deposition sequence with state-of-the-arttechnology and in full-scale and to demonstrate that it is possible to understand andqualify the processes that takes place in the engineered barriers and the surrounding hostrock. It is envisaged that this technology can be tested, developed and demonstrated inthe Prototype Repository.103
The execution of the Äspö Prototype Repository is a dress rehearsal of the action neededto construct a deep repository from detailed characterisation to resaturation of depositionholes and backfilling of tunnels. The Prototype Repository is focused on testing anddemonstrating the system function of the KBS-3 concept and will provide a full-scalereference for test of predictive models concerning individual components as well as thecomplete repository system. The Prototype Repository should demonstrate that theimportant processes that take place in the engineered barriers and the host rock aresufficiently well understood.Activities aimed at contributing to development and testing of practical engineeringmeasures to rationally perform the steps of a deposition sequence are included. Effortsin this direction are limited since handling can not be made as in a real deep repository.However, it is believed that experience on handling will be gained to some extent.Handling matters are further addressed in other project such as TechnologyDemonstration and Canister Retrieval Test.4.2.2 ObjectivesThe main objectives for the Prototype Repository are:• To test and demonstrate the integrated function of the deep repository componentsunder realistic conditions in full-scale and to compare results with models andassumptions.• To develop, test and demonstrate appropriate engineering standards and qualityassurance methods.• To simulate appropriate parts of the repository design and construction processes.The evolution of the Prototype Repository should be followed for a long time, possibleup to 20 years. This is made to provide long term experience on repository performanceto be used in the evaluation that will be made after the initial operation stage in the realdeep repository. The Prototype Repository will in this context provide operating experiencefor 10–20 years longer than have been achieved with deposited canisters containingspent fuel.4.2.3 Experimental conceptThe Prototype Repository is set up to simulate a part of the KBS-3 type repositoryunder what can be described as normal conditions, which is essentially the same as thereference scenario described in Research, Development and Demonstration Programme98. The Prototype Repository is planned to simulate, to the extent possible, the realdeep repository system, regarding geometry, materials, and rock environment. The testarrangement is planned to be such that artificial disturbance of boundary conditions orprocesses governing the behaviour of the engineered barriers and the interaction withthe surrounding rock are kept to a minimum.Important limitations with respect to the possibilities to simulate a repository situationare:• The test site area is given and the location in conjunction with certain conditionalcriteria is therefore limited.104
• No spent fuel, or any other form of nuclear waste, will be used. Canisters equippedwith electrical heaters will be used to simulate encapsulated spent fuel.• The Prototype Repository cannot demonstrate long-term safety, since the experimentconsidered will be extended in time at most tens of years.In the deep repository, the plan is that localisation of the repository, deposition tunnelsand final canister positions shall be determined by a step-by-step characterisation systemfollowed by a detailing of the repository layout. Each step is based on data from characterisationof the host rock, which contribute to adjustment of localisation in relation todata as major and minor discontinuities and their orientation, water conditions, magnitudeand orientation of rock stresses etc. The site of the Prototype Repository is given.However, methods for characterisation of the rock mass in the test site are expected tocontribute to the assessment of methods for characterisation of the rock mass and thecanister positions in a real deep repository.Different alternatives as regards location and layout of the Prototype Repository havebeen considered. The test location chosen is the innermost section of the TBM tunnelat 450 m depth. The layout involves six deposition holes with a centre distance of 6 m(Figure 4-1). The distance is evaluated considering the thermal diffusivity of the rockmass and a maximum temperature of 90°C on the canister surface.The deposition holes have been mechanically excavated by full-face boring, diameter1.75 m and to a depth of 8 m. Performance of the boring machine and the boringtechnique has been analysed. Special considerations have been taken to investigatethe geometric results, surface roughness, and the disturbed zone (EDZ) i.e. inducedfracturing.A massive concrete plug designed to withstand full water- and swelling pressures willseparate the test area from the open tunnel system. A second plug will be placed suchthat it divides the test into two sections, comprising four and two canister holes. Thislayout will in practice provide two independent test sections with the advantage that theoutermost one can be dicommissioned without disturbing the testing in the inner one.Section ISection II13 m 6 m 6 m6 m9 m9 m6 m8 mFigure 4-1. Schematic view of the layout of the Prototype Repository (not to scale).105
Canisters with dimension and weight according to the current plans for the deep repositoryand with heaters to simulate the thermal energy output from the waste will bepositioned in the holes. The plan is that decay heat will be controlled by real poweroutput.The buffer surrounding the canisters will be made of highly compacted Na-bentoniteblocks, (Figure 4-2). The blocks will fill up the space between the rock and the canisterbut leave an outer slot of about 50 mm and a 10 mm slot between the blocks and thecanister. The blocks will be made in full diameter 1.65 m and with a height of 0.5 m.The outer slot is planned to be filled with bentonite pellets and water as part of thedeposition process. The final average density of the buffer in the deposition holes afterwater saturation will be about 2 ton/m 3 which represent a confined swelling pressure ofapproximately 5 MPa. The deposition tunnel will be backfilled with a mixture of 30%bentonite (Na-concerted Ca-bentonite) and 70% crushed rock; 10–15% Na-bentonitebeing the normal grade in fresh water.Decision as to when to stop and decommission the test will be influenced by severalfactors, including performance of monitoring instrumentation, results successivelygained, and also the overall progress of the deep repository project. It is envisaged thatthe outer test section (Section II) will be decommissioned after approximately five yearsto obtain interim data on buffer and backfill performance through sampling. The innersection (Section I) will be designed for an operational life time of 20 years.Instrumentation will be used to monitor processes and properties in the buffer, thebackfill and the near-field rock. The intention to minimise disturbance will, however,add restrictions to the monitoring possible.5 mBackfill 30/70Canisterø 1.05 m1 m1.5 mBuffer systemNa-bentoniteDensity 2.0 t/m 34.8 mLevelling bed ofsand or concrete1.05 m0.5 m1.75 mFigure 4-2. Schematic layout of the deposition holes (not to scale).106
Processes that will be studied include:• Water uptake in buffer and backfill.• Temperature distribution in canisters, buffer, backfill and rock.• Displacements of canisters.• Swelling pressure and displacement in buffer and backfill.• Stresses and displacements in the near field rock.• Water pressure build-up and pressure distribution in rock.• Chemical processes in rock, buffer and backfill.• Bacterial growth and migration in buffer and backfill.4.2.4 ResultsCharacterisationDuring the period inflow measurements into the prototype tunnel, to the depositionboreholes and to the lead-through boreholes between tunnel A and tunnel G have beenmade, see Figure 4-3. In one deposition hole detailed inflow observations were mapped.The pressure responses were observed during the drilling of the deposition- and leadthroughboreholes and four pressure build-up tests were made in the three lead-throughboreholes. Pressure observations were also made during blasting work in the PrototypeRepository Tunnel. A few results are presented below and details can be found inForsmark et al /2001/.The result of the inflow measurements to the Prototype Repository tunnel is shown inTable 4-1.G-tunnelF-tunnelJ-tunnelPrototype Repository(A-tunnel)A-tunnelI-tunnelFigure 4-3. Tunnel systems close to the Prototype Repository.107
Table 4-1. Result of inflow measurements to Prototype Repository tunnel.Weir sections Q 1997 Weir sections Q 1999-12-01 Q 2000-03-301997 1999 & 2000(m) (l/min) (m) (l/min) (l/min)3527 – 3533 0.20 – – –3533 – 3539 1.17 – – –3539 – 3545 0.12 – – –3545 – 3551 0.03 – – –3551 – 3557 0.02 – – –3557 – 3562 0.05 – – –3562 – 3568 0.10 3546 – 3552 0.001 0.0063568 – 3575 0.05 3552 – 3570 0.100 0.1103575 – 3581 1.56 3570 – 3576 0.000 0.0003581 – 3587 1.61 3576 – 3582 2.000 1.3203587 – 3593 0.29 3582 – 3588 1.490 1.8203593 – 3600 0.93 3588 – 3600 1.120 1.080SUM (3545–3600) 4.84 SUM (3546–3600) 4.711 4.336SUM (3527–3600) 6.13The measurement sections are not exactly the same and it is therefore not possible tobe certain about the flow rate changes for the passed time. However, the flow rate tosection 3545–3600 and 3546–3600 are approximately the same during 1997, 1999 and2000. Comparing the individual sections between 3545 to 3600 indicates that possibly allsections, but 3576–3582 and 3582–3588 m have slowly decreasing flow rates. In sections3576–3582 and 3582–3588 m the flow rate changes rather much between the measurements,possibly due to changes of the flow rates from the flowing features.In Table 4-2 the result of the whole borehole inflow measurements in the depositionboreholes is shown. The in-leakage rates are small, as can be seen in the table. Due tothe small rates it was difficult to measure the inflow.Table 4-2. Result of inflow measurements to deposition boreholes. Flowmeasurements were made December 1999, March 2000 and June-July 2000.The figures in the table represent what is considered to be the best estimates.Deposition hole Q 1999-12-08 – 1999-12-13(L/min)DA3587G01 0.08DA3581G01 0.002DA3575G01 0.003DA3569G01 0.0007DA3551G01 0.002DA3545G01 0.003SUM 0.097108
In order to get an idea of the variations of in leakage to a borehole, measurements usingordinary diapers applied to the borehole walls of DA3581G01 were made during thesummer of 2000. Figure 4-4 shows the result graphically.The only visually mapped water bearing structure in this borehole is located beneath aplank. Since the diapers closest to it quickly became close to fully water saturated andpart of the fracture is outside the diaper, excess water flowed downwards on both sidesof Z plank. Due to this, below the measuring points for the water bearing structure theflow rate shown in Figure 4-4 may be too high.As can be noticed in Figure 4-4 the inflow is located to the parts of the borehole, whichhas earlier been mapped as an area with water-bearing features. Still inflows exist in amore diffuse pattern in large parts of the borehole walls, even if those parts have not andcould not be mapped as water-bearing parts.The drilling of lead-through boreholes from tunnel G to tunnel A confirms the, duringearlier investigations, indicated pattern of a hydraulically dominant response directionrunning WNW.DA3581G01 - INFLOW MEASUREMENTS USING DIAPERS0-1-21-3-4-52000-09-05-6-7-80 0.5 1 1.5 2 2.5 3 3.5 4 4.5 5(m)Q (l/min)1E-005 < Q < 1E-0041E-006 < Q < 1E-0051E-007 < Q < 1E-006-1E+000 < Q < 1E-007/1310241/DATA/Depositionholes_characterisation/Mapping_geology,_flowing_features/DIAPER_Q_MEAS.SRFVersion 2Figure 4-4. Inflow measurements in DA3581G01 using diapers.109
In the preparations for the concrete plug construction, blasting of niches were made attwo chainage locations in the Prototype Repository tunnel, namely 3537 and 3560.Pressure response registrations were made in boreholes KA3510A, KG0021A01 andKG0048A01 during the blasting period, 2000-08-24 – 2000-09-05.A result is that at several blasting occasions the pressure rises in the observation sectionsafter almost every blasting round. An example is given in Figure 4-5. At the most theincreases were approximately 8–10 meters in four out of five sections in KG0021A01observed during the first blasting round. In KG0048A01 the corresponding pressureincrease was 1–4 meters in all four sections. The pressure increase seems to be somewhathigher for sections closer to the constructed niche.These measurements clearly show that the blasting affects the hydraulic system. A probablecause is that the vibrations from the blasting make the gauge material in the fracturemove. The inter-connected fracture system will then become less permeable and thepressure will increase in the fracture systems up-gradient of the clogged fractures.The pressure increase after each blasting round is of the similar magnitude in severalsections indicating the possibility of the clogging of major flowing features.Pressure changes due to blasting have also earlier been observed during other excavationsin the Äspö HRL.MonitoringDuring the characterisation of the rock around the Prototype Repository a large numberof boreholes has been drilled. These bore holes will be equipped with packer systems toallow for:Head (kPa)3120308030403000296029202880KG0021A01:1Blasting events 2000-08-24–2000-09-01 Chainage 3537 Prototype Repository00:0012:0000:0012:0000:0012:0000:0012:0000:0012:0000:0012:0000:0012:0000:0012:0000:00Borehole depth (m)Round 1Round 2Round 3Round 4Round 5Round 6Round 7Round 8 9Round 10Round 11Figure 4-5. Example of pressure response due to blasting.110
• Pressure measurements.• Water sampling (mostly in Section I).• Dilution measurements.• Interference tests.• Hydromechanical measurements and tests (Section II).For the monitoring in boreholes bentonite packers, see Figure 4-6, have been developedand tested. These will be used in Section I in all boreholes except for the shortest wheremechanical packers will be used.ModellingA second DFN model has been made based on data from the tunnel and the drilledboreholes for characterisation. Predictions were made of the flow into the depositionholes, the fracture statistics in the deposition holes and pressures around the tunnel. Themodellers had no information about the actual outcome. An example of prediction is thepredicted average conductive fracture frequency: P 21 = 0.79 to 1.08 m/m 2 based on 20realisations. A few results are presented in Figure 4-7. The predictions will be comparedto the measurements during spring 2001.Plug for ”inflation”(Water inlet)Water-filled spaceSpace opentowards lower sideSupply-route forwater (to thebentonite)BentoniteFilter socketCovering made ofPUR-rubberTypeAThreaded gableTypeBFigure 4-6. Drawing of the bentonite packer.111
Figure 4-7. An example of the predicted fracture traces in a deposition hole. Left figure: Allfractures. Middle figure: Natural fractures (Open fractures, T>5·10 –11 m 2 /s), Right figure:Conductive fractures (T>5·10 –10 m 2 /s).4.2.5 EU-projectIn September the EC contract was finalised and signed for a period of 42 months,i.e. through February 2004. The participating organisations are:• <strong>SKB</strong> (Svensk Kärnbränslehantering AB) – Co-ordinator– GeoDevelopment AB– VBB VIAK AB– Clay Technology AB• POSIVA (Posiva Oy)– VTT (VTT Communities & Infrastructure)• ENRESA (Empresa Nacional de Resíduos Radioactivos SA)– AITEMIN (Asociacion para la Investigacion y DesarrolloIndustrial de los Recursos Naturales)– CIMNE (Centre Internacional de Mètodes Numèricsen Enginyeria)• GRS (Gesellschaft fuer Anlagen- und Reaktorsicherheit mbH)• BGR (Bundesanstalt für Geowissenschaften und Rohstoffe)• UWC (University of Wales, Cardiff )• JNC (Japan Nuclear Cycle Development Institute)The kick-off meeting was held at Äspö on September 14–15, 2000, and the first modellingmeeting on December 12, 2001 in Lund.112
4.3 Demonstration of Disposal Technology4.3.1 Background<strong>SKB</strong> decided 1996 that the all transport and handling of the copper canister with spentfuel from the encapsulation plant to the deep repository should be carried out with fullradiation shielding. Also the handling of the canister in the deposition tunnel should bedone with full radiation shielding. A feasibility study for the development of a full sizedeposition machine started late 1996 and a number of different concepts were investigated.Mid 1997 the preferred concept for the deposition machine was selected and thework with conceptual design and engineering design of the deposition machine started.Early 1998 the manufacturing drawings and specifications for the main parts of themachine was completed and could be ordered for manufacturing.The assembly of the deposition machine for testing on a test bed at the manufacturingworkshop started in December 1998. The workshop tests were completed in May 1999.The deposition machine was transported to the Äspö HRL in June 1999 and installed ina tunnel prepared with four deposition bore-holes at level 420 m below ground. Thistunnel will also be used as an exhibition hall for information about the Swedish WasteManagement Programme.The development of the equipment needed for the handling of the buffer material andcanisters with heaters for the two planned engineering experiments at Äspö HRL, theCanister Retrieval Test and the Prototype Repository, has been ongoing in parallel.ObjectiveThe main objective with the ongoing work is to develop and demonstrate the techniquesand equipment needed for handling and deposition of the buffer material and coppercanister with spent fuel as well as the emplacement of the backfill material and sealingof the deposition tunnels.ResultsThe full size deposition machine for deposition of copper canisters was installed during1999 and will be used for demonstration at Äspö HRL. The picture in Figure 4-8 belowshows the deposition machine in the demonstration tunnel at Äspö in May 2000.Main data for the machine:Height4.6 mWidth3.7 mLength11.8 mWeight, empty90 tonsWeight, with shieldedtube and canister140 tonsSpeed1—10 m/minPower supplyCableCapacity, main hoist 30 tonsCapacity, auxiliary hoist 5 tonsCapacity, hoist for bentonitetop block inside machine 1 tonFigure 4-8. Picture of the deposition machine in the demonstration tunnel at Äspö.113
The design and testing of temporary equipment for handling and deposition of thebuffer material and canisters for the Canister Retrieval Test and the Prototype Repositorywas completed early 2000.The gantry crane with tools for emplacement of the bentonite buffer into to depositionhole and the small deposition machine that will be used for these experiments. Thegantry crane and the handling tool for the full size compacted bentonite blocks and ringsare shown in Figure 4-9 during the installation of the buffer for the Canister RetrievalTest. During the initial testing of the equipment blocks and rings of concrete were usedbut also bentonite units were handled during the testing of the equipment. This equipmentwill also be used in the Prototype Repository during 2001 and 2002.Development work of the equipment needed in the future deep repository will continuebased on experiences from the ongoing work at Äspö. The different machines, transportand auxiliary equipment will be developed to a feasibility or conceptual stage as part ofthe ongoing design studies of the deep repository. Some of the equipment may later alsobe designed and constructed and tested at the Äspö HRL for verification of the functionand suitability of the equipment.The small deposition machine (Figure 4-10) was used for the deposition of the canisterwith heaters for the Canister Retrieval Test in August 2000. The small deposition machinewill also be used in the Prototype Repository during 2001 and 2002.The main data and features of thegantry crane are as follows:Height: 4.3 mWidth: 2.8 mLength: 8.5 mLifting capacity:Main hoist = 3 metric tonsAuxiliary hoist = 1 metric tons.Figure 4-9. Photo of the gantry crane for handling of the compacted buffer material with handlingtool for buffer material during testing in June 2000.114
The main data of the deposition machine are as follows:Height: 3 mWidth: 3.5 mLength: 8.7 mWeight: 13 metric tons excluding the copper canister.The limited height in the prototype repository requiresthat the canister is tilted down into the deposition hole.Figure 4-10. Illustration of the small deposition machine.4.4 Backfill and Plug Test4.4.1 BackgroundThe Backfill and Plug Test includes tests of backfill materials and emplacement methodsand a test of a full-scale plug. It is a test of the integrated function of the backfill materialand the near field rock in a deposition tunnel excavated by blasting. It is also a testof the hydraulic and mechanical functions of a plug. The test is partly a preparation forthe Prototype Repository.The entire test set-up with backfilling casting of the final part of the plug was finishedin autumn 1999 and the water saturation, with water filling of permeable mats, started inlate 1999. In the year 2000 the water saturation has continued and data from transducershas been collected and reported.4.4.2 ObjectivesThe main objectives of the Backfill and Plug Test are:• to develop and test different materials and compaction techniques for backfilling oftunnels excavated by blasting.• to test the function of the backfill and its interaction with the surrounding rock in fullscale in a tunnel excavated by blasting.• to develop technique for building tunnel plugs and test the function.115
4.4.3 Experimental conceptFigure 4-11 shows an axial section of the test layout. The test region, which is located inthe old part of the ZEDEX drift, can be divided into the following three test parts:1. The inner part filled with backfill containing 30% bentonite (sections A1–A5 and B1).2. The outer part filled with backfill without bentonite and bentonite blocks at the roof(sections B2–B5).3. The plug.The backfill sections were applied layer wise and compacted with vibrating plates thatwere developed and built for this purpose. It was concluded from preparatory tests thatinclined compaction should be used in the entire cross section from the floor to the roofand that the inclination should be about 35 degrees.The inner test part was filled with a mixture of bentonite and crushed rock with a bentonitecontent of 30%. The composition is based on results from laboratory tests andfield compaction tests. The outer part was filled with crushed rock with no bentoniteadditive. Since the crushed rock has no swelling potential but may instead settle withtime, a slot of a few dm was left between the backfill and the roof and filled with a rowof highly compacted blocks with 100% bentonite content, in order to ensure a goodcontact between the backfill and the rock. The remaining irregularities between theseblocks and the roof were filled with bentonite pellets.The two test parts are about 14 meter long and divided by drainage layers of permeablemats in order to apply hydraulic gradients between the layers and to study the flow ofwater in the backfill and nearfield rock. The mats are also used for the water saturationof the backfill. The mats were installed in both backfill parts with the individual distance2.2 m. Each mat section was divided in three units in order to be able to separate theflow close to the roof from the flow close to the floor and also in order to separate theflow close to the rock surface from the flow in the central part of the backfill.Blocks of 20/80bentonite/crushed rockBentonite blocksD1 D2 D3 D4 D5 D6 D7 D8 D9 D10 D11 D12Drainagematerial30/70bent./crushed rockCrushed rock0 A1 A2 A3 A4 A5 B1 B2 B3 B4 B52.2 m28 mBentonite O-ringDrainage and deairinglayers, permeable matsCement plugFigure 4-11. An overview of the Backfill and Plug Test.116
The outer section ends with a wall made of prefabricated beams for temporary supportof the backfill before casting of the plug. Since in situ compaction of the backfill cannotbe made in the upper corner, this triangle was instead filled with blocks of bentonite/sand mixture with 20% bentonite content.The backfill and rock were instrumented with piezometers, total pressure cells, thermocouples,moisture gauges, and gauges for measuring the local hydraulic conductivity.The axial conductivity of the backfill and the near field rock will after water saturationbe tested by applying a water pressure gradient along the tunnel between the mats andmeasuring the water flow. All cables from the instruments were enclosed in Tecalantubes in order to prevent leakage through the cables. The cables were led through therock to the data collection room in boreholes drilled between the test tunnel and theneighbouring Demo-tunnel.The plug is designed to resist water and swelling pressures that can be developed. It isequipped with a filter on the inside and a 1.5 m deep triangular slot with an “O-ring”of highly compacted bentonite blocks at the inner rock contact.The flow testing in the backfill is planned to start after saturation, when steady stateflow and pressure have been reached.Figure 4-12 shows a 3D visualisation of the experimental set-up.Figure 4-12. Illustration of the experimental set-up of the Backfill and Plug Test.117
4.4.4 ResultsThe water saturation of the inner test section (30/70) started on November 29 1999.Every mat in the sections with bentonite/crushed rock has been filled with water withthe salt content 1.6% and pressurised with 50–150 kPa. Due to leakage between thebottom filter mats (probably through the fractured floor) the wetting strategy waschanged. It was initially decided to fill every second mat and use the mat in-between forde-airing. However, some of the bottom mats, which were intended for de-airing, weredue to the leakage filled with water from the neighbouring mats. Therefore all bottomand central mats were filled with water and the top mats used for de-airing.Water filling of the outer test sections (0/100) started in June and has continued duringthe rest of the year. The filling is made slowly and stepwise since when the water level israised water leaks out through the plug between the rock surface and the concrete untilthe bentonite o-ring has had enough water and time to seal the slot at that level. Whenthe entire bentonite o-ring has sealed or if there is a remaining leakage through anotherpassage in the concrete or rock, the interface between the concrete and the rock surfacewill be grouted. The plug was not tight in December.Water saturation, water pressure and swelling pressure in the backfill and water pressurein the surrounding rock have been continuously measured and recorded during thewhole year. It seems as we are recieved acceptable data from almost all instruments.Figure 4-13 and Figure 4-14 show example of measured results. Figure 4-14 shows thewater pressure in the rock measured in the short bore holes about 30 cm below the floorof the tunnel. The results show that water has entered the outer section at the sametime as water was introduced in the inner section and partly filled before the intentionalstart of the water filling in the outer section in June.120Water pressure in bore holesPressure (kpa)100806040200UR24(A2/F/0,5-1,0)UR46 (A3/F/0,5-1,0)UR48(A5/F/0,5-1,0)UR49(B1/F/0,5-1,0)UR50(B2/F/0,5-1,0)UR51(B3/F/0,5-1,0)UR52 (B4/F/0,5-1,0)-20aug-99 okt-99 dec-99 jan-00 mar-00 maj-00 jun-00 aug-00 okt-00 nov-00Datejan-01 feb-01Figure 4-13. Water pressure measured in the rock 30 cm below the floor UR24, 46, 48 and 49 areplaced in the 30/70 sections and the rest in the 0/100 sections.118
5000450040003500Suction (kPa)300025002000 W17 A3:4 0,0W18 A4:1 0,01500W19 A4:3 0,01000 W20 A4:4 0,0500W21 A5:1 0,0W22 A5:3 0,0098-11-21 99-04-10 99-08-28 00-01-15 00-06-03 00-10-21 01-03-10DateFigure 4-14. Suction measured in the centre of different layers in the 30/70 backfill. W18 andW21 are placed in the first layer about 20 cm from the mats. W17 and W20 are placed 40 cm andW19 and W22 are placed 60 cm from the mats.Figure 4-14 shows the suction (negative pore water pressure) measured with psychrometersin the tunnel centre line in different layers of 30/70. Only the sensors placed inthe first layers (about 20 cm from the mat) have been clearly water saturated. A slowdecrease in suction in transducers W17 and W20 started in September, which indicatesthat wetting has reached 40 cm from the mats. These measurements indicate that most30/70 sections are water saturated at the perpendicular distance 20 cm from the matsand that an increased wetting has reached 40 cm in most spots but not to the centre ofthe backfill sections 60 cm from the mats. It is concluded that the saturation needs tocontinue at least for another year (2001).4.5 Canister Retrieval Test4.5.1 Background<strong>SKB</strong>’s strategy for the disposal of canisters with the spent nuclear fuel is based on aninitial emplacement of about 10% of the number of canisters followed by an evaluationof the result before any decision is made on how to proceed. One outcome can be thatthe result is not accepted and that the canisters have to be recovered. In such case some,if not all, canisters can be surrounded by a saturated and swollen buffer, which holds thecanister in such a grip that the canister can not just be pulled up. First the bentonitegrip has to be released, for which two alternative principles can be applied; remove orshrink the bentonite. Then the canister is free to be lifted up to the tunnel and placed ina radiation shield. A concern is any type of radioactive contamination that the bentonitehas been exposed to.119
The Canister Retrieval test is aiming at demonstrating the readiness for recovering ofemplaced canisters also after the time when the bentonite is fully saturated and has itsmaximum swelling pressure. The process covers the retrieval up to the point when thecanister is safely emplaced in a radiation shield and ready for transport to the groundsurface. The test is separated into two phases; Design and Set-up, and the actualRetrieval Test.4.5.2 ObjectivesThe overall aim of the Canister Retrieval Test (CRT) is to demonstrate to specialistsand to the public that retrieval of canisters is technically feasible during any phase ofoperation, especially after the initial operation. In order to provide the test conditionsnecessary for actual retrieval tests the test set-up has to achieve the following objectives:• Two vertically bored test holes in full repository scale, which fulfil the quality requirementsdeemed necessary for the real repository.• Careful and documented characterisation of the properties of these holes includingthe boring disturbed zone.• Emplacement of bentonite blocks, bentonite pellets and canisters with heaters, andartificial addition of water in accordance to conditions planned for the real repository.However, for different reasons only on of these deposition holes has been used forimplementation of the CRT.• Saturation and swelling of the buffer under controlled conditions, which are monitored.• Preparations for testing of canister retrieval.Boring of full-scale deposition holes and geometrical/geotechnical characterisation ofholes as well as emplacement of bentonite and canister with heaters are made withinsub-projects that concern also other tests in the Äspö HRL.4.5.3 Experimental conceptThe deposition tunnel for the experiment is located on the 420 meter level in theextension of the D-tunnel, and is excavated by conventional drill and blast. The tunnelis 6 meters wide and as well, 6 meters high, and the centre distance between the twodeposition holes is 6 meters, which is in agreement with the distance considered for thedeep repository. In the Canister Retrieval Test, however, the temperature influence fromsurrounding canisters is less than in the deep repository, which has the effect that ahigher thermal power is needed in the canister in order to obtain a temperature of about90°C on the surface of the canisters.The buffer was installed in the form of blocks of highly compacted Na-bentonite, withfull diameter, 1.65 m, and a nominal height of 0.5 m. When the stack of blocks was 6 mhigh the canister equipped with electrical heaters was lowered down in the centre, cablesto heaters, thermocouples and strain gauges are connected, and further blocks areemplaced until the hole was filled up to one m from the tunnel floor. On top the holewas sealed with a plug made of concrete and a steel plate as cover. The plug was securedagainst heave caused by the swelling clay with cable anchored to the rock. The tunnelwill be left open for access and inspections of the plug support.120
Artificial addition of water is provided regularly around the bentonite blocks by means ofpermeable mats attached to the rock wall. The design of the mats was done so that theyare not disturbing the future test of retrieval.Saturation time for the test is about two-three years in the 350 mm thick buffer alongthe canister and about 5 years in the buffer below and above the canister. Decision onwhen to start the retrieval tests is dependent on information of the degree of saturation,and instruments will be installed to monitor the process in different parts of the buffer.This instrumentation are similar to the instrumentation in the Prototype Repository andyield comparable information during the saturation period. The intention to minimisedisturbance during retrieval tests, however, restricts the number and locations of instruments.4.5.4 ResultsTest of Deposition ProcessThe test of the deposition process was carried out from March 2000 throughout June2000 prior to the installaton of the Canister Retrieval Test. The equipment used for thedeposition process were tested and adjusted accordingly. The process of placing thebuffer was practised, using concrete blocks and rings, and also deposition of the canister.The ability to maintain a levelled relative humidity in the air in order to avoid destructionof the bentonite was also tested. Processed air was ventilating the deposition holewhere a bentonite block was placed in the bottom and loaded with a weight equivalentto a full column of bentonite buffer.The main results from the Test of the Deposition Process were:• the process of depositing buffer and canister could be adopted after minor adjustmentsconcerning the method of placing the blocks and rings,• the ability to sustain an acceptable climate for the bentonite was not satisfactory sinceleakage water from the borehole-wall could be transported along cables etc.The borehole used for the Canister Retrieval Test is relatively dry and will therefore notbe subjected to this problem. The problem with leakage water in the borehole will beaddressed in a completing test after installation of the Canister Retrieval Test.Canister Retrieval TestPreparations for deposition of bentonite buffer and canister have been made fromJanuary 2000 throughout August 2000. Included in the preparations are:• casting of concrete foundation on the hole bottom,• installation of thermocouples in rock,• drilling of holes for rock anchoring of retaining plug,• grouting of rock anchors,• cutting of grooves for cables,• mounting of filter mats for artificial watering,• installation of cone-shaped steel mould for the retaining plug,• installation of climate control system.121
Figure 4-15 shows the deposition hole prepared with filter mats, ventilation tubes, steelmould, cables from instruments and rock anchors at a stage where the buffer is partlydeposited.Deposition of the bentonite buffer, including buffer instrumentation, started Septemberthe 14 th , 2000. The canister was transported from the manufacturer, Kockums in Malmö,to the Äspö laboratory and reloaded for further transportation underground to the testsite. The canister was placed in the deposition hole at the 22 nd of September. A test ofthe canister heaters revealed malfunction of a number of heaters. Too short cables haddamaged the contacts during mounting of the canister lid. The canister was sent back tothe workshop at Kockums for repairs and subsequently returned to Äspö two weeks later.The installation continued with mounting of heater cables and protective outer lid onthe canister. The last bentonite blocks were placed on top of the canister and pelletswere filled in the slot between the borehole wall and the blocks. The voids in the slotFigure 4-15. Deposition hole during installation of buffer.122
filled with bentonite pellets were filled with water in order to provide as much waterinto the depositon hole as possible. Water filling was done with hoses starting from thehole bottom and pulled back in the same pace as the rising water table. The heavilyreinforced concrete plug was cast immediately after water filling. A pull of the concreteplug was planned to make sure that it was not stuck in the cone-shaped mould.The intention with a loose plug was to measure the initial vertical displacement causedby swelling bentonite. However, the pull was not performed since the plug had alreadymoved during the time for hardening. This was an unexpected quick expansion of thebentonite. The explanation is most likely that surfaces between the blocks had beenexposed to water, which was not accounted for in the predictive modelling.The steel-plate that constitutes an integrated part of the plug was put in place and threeof the nine rock anchors were subsequently pre-tensioned to fixate the system. The lowpre-tension level and the elasticity of the anchors still allow vertical displacement of theplug. After the planned plug displacements had occurred the plug was fixed by distributingthe force to all nine anchors and increase the pre-tensioning to a balanced level.The heaters were turned on October the 26 th at a constant effect of 1700 W. The effectwill be increased to 2600 W when the temperature has reached a certain degree afterapproximately three months.Instruments installed in the test have been activated and connected to the data acquisitionsystem as the deposition went on.Canister Retrieval Test – MeasuringA number of parameters are measured during the test to provide a basis for modellingpurposes. All measurements cannot be accounted for in the annual report at this stage.The actual measurements made on-line are presented in Table 4-3.Table 4-3. Measurements during Canister Retrieval Test.Type of measurementTemperature (°C) inside canister.Temperature (°C) on canister surface.Temperature (°C) in the buffer.Temperature (°C) in the rock.Rock stresses (Pa).Total pressure (Pa) in buffer.Pore pressure (Pa) in buffer.Relative humidity (%) in buffer pores.Strain (µm/m) in canister.Heater effect (W).Artificial watering volume (l).Artificial watering pressure (Pa).Vertical displacement of plug (mm).Forces in rock anchors (kN).123
4.6 Long term test of buffer material4.6.1 BackgroundBentonite clay has been proposed as buffer material in several concepts for HLW repositories.In the Swedish KBS-3 concept the demands on the bentonite buffer are to serveas a mechanical support for the canister, reduce the effects on the canister of a possiblerock displacement, and minimize water flow over the deposition holes.The decaying power from the spent fuel in the HLW canisters will give rise to a thermalgradient over the bentonite buffer by which original water will be redistributedparallel to an uptake of water from the surrounding rock. A number of laboratory testseries, made by different research groups, have resulted in various buffer alterationmodels. According to these models no significant alteration of the buffer is expected totake place at the prevailing physico-chemical conditions in a KBS-3 repository neitherduring nor after water saturation. The models may to a certain degree be validated inlong term field tests. Former large scale field tests in Sweden, Canada, Switzerland andJapan have in some respects deviated from possible KBS-3 repository conditions and thetesting periods have generally been dominated by initial processes, i.e. water uptake andtemperature increase.4.6.2 ObjectivesThe present test series aims at validating models and hypotheses concerning physicalproperties in a bentonite buffer material and of related processes regarding microbiology,radionuclide transport, copper corrosion and gas transport under conditions similar tothose in a KBS-3 repository. The expression “long term” refers to a time span longenough to study the buffer performance at full water saturation, but obviously not “longterm” compared to the lifetime of a repository. The objectives may be summarized inthe following items:• Data for validation of models concerning buffer performance under quasi-steady stateconditions after water saturation, e.g. swelling pressure, cation exchange capacity andhydraulic conductivity.• Check of existing models on buffer-degrading processes, e.g. illitization and saltenrichment.• Information concerning survival, activity and migration of bacteria in the buffer.• Check of calculation data concerning copper corrosion, and information regardingtype of corrosion.• Data concerning gas penetration pressure and gas transport capacity.• Information which may facilitate the realization of the full scale test series withrespect to clay preparation, instrumentation, data handling and evaluation.124
4.6.3 Experimental conceptThe test series (Table 4-4) concern realistic repository conditions except for the scaleand the controlled adverse conditions in three tests. The testing principle for all plannedtests is to emplace “parcels” containing heater, central tube, precompacted clay buffer,instruments, and parameter controlling equipment in vertical boreholes with a diameterof 300 mm and a depth of around 4 m (Figure 4-16).1mTUNNEL0BeamsConcreteSandGAUGES38 1TROCKSPECIALTESTS32 1T-130 Cu28 Filters26 Bacteria26 3T-2InsulationCu tube22 Cu18 Filters20 5T, 1P, 1W, 1MHeater14 6T, 1P, 1W, 2M-308 5T, 1P, 1W, 1M-4Sand05 1 <strong>MB</strong>q 60 Co2 filters02 3T-01 1WTotal 8 mFigure 4-16. Cross-section view of an S-type parcel. The first figures in column denote blocknumber and second figures denote the number of sensors. T denotes thermocouple, P total pressuresensor, W water pressure sensor, and M moisture sensor.125
Table 4-4. Lay out of the Long Term Test series.Type No. max T, °C Controlled parameter Time, years RemarkA 1 130 T, [K + ], pH, am 1 pilot testA 0 120–150 T, [K + ], pH, am 1 main testA 2 120–150 T, [K + ], pH, am 5 main testA 3 120–150 T 5 main testS 1 90 T 1 pilot testS 2 90 T 5 main testS 3 90 T >>5 main testA = adverse conditions S = standard conditionsT = temperature [K + ] = potassium concentrationpH = high pH from cement am = accessory minerals addedAdverse conditions in this context refer to high temperatures, high temperature gradientsover the buffer, and additional accessory minerals leading to i.a. high pH and highpotassium concentration in clay pore water. The central copper tubes are equipped withheaters in order to simulate the decay power from spent nuclear fuel. The heater effectare regulated or kept constant at values calculated to give a maximum clay temperatureof 90°C in the standard tests and in the range of 120 to 150°C in the adverse conditiontests.Temperature, total pressure, water pressure and water content, are measured during theheating period. At termination of the tests, the parcels are extracted by overlapping coredrillingoutside the original borehole. The water distribution in the clay is determinedand subsequent well-defined chemical, mineralogical analyses and physical testing areperformed.4.6.4 ResultsThe one year pilot tests A1 and S1 have been completed and reported /<strong>SKB</strong>, 2000b/.The 4 long term test parcels (Figure 4-16) and the additional 1-year parcel are installedin the G-tunnel, supplied with ground-water and heated to full test temperature. Eachparcel contains 25 thermocouples, 3 total pressure gauges, 3 water pressure gauges,4 relative humidity sensors, 7 filter tubes, and 12 water sampling cups. The power isregulated and temperature, total pressure, water pressure and water content are continuouslybeing measured. Figure 4-17 shows the temperature distribution and evolutionover the year at the warmest level of the A2 parcel, and Figure 4-18 shows the totaland water pressure up build in the same clay volume.4.6.5 Planned workThe physical properties of the 5 installed parcels will be closely followed up during theyear. Minor laboratory work concerning development of test and analyse technique willbe made. Planning for the termination of the A0-parcel will be started in May, and thedrilling for the uplift operation is planned to start in October 2001. The various laboratoryanalyses of parcel material, tracer distribution, pore water and copper plates willthereafter start as soon as possible.126
140120100Temperature, ˚C80604020A214TTA2140TA2142TA2144TA2146TA2148T000-01-01 01-01-01Time, yearsFigure 4-17. Temperature evolution in six radial distributed thermocouples in the warmest levelof the A2 parcel. Uppermost curve represent the copper tube temperature, and the lowest the curverepresents the temperature close to the rock.3Pressure, MPa21A2144PA2144W000-01-01 01-01-01Time, yearsFigure 4-18. Pressure evolution in the warmest level of the A2 parcel.Upper curve represents thetotal pressure and the lower curve represents the water pressure. The latter has stabilised on the samevalue as the surrounding ground water pressure.127
128
5 Äspö facility operation5.1 Plant operationIntroductionThe operation of the facility has worked smoothly. A couple of new projects concerningsafety, security and reliability have been initiated started and completed. These projectsare described below.Surface activitiesThe mainland electrical feed has been replaced with a direct feed from the OKG nuclearplant to the Äspö Research village. The previous variations in the power supply thateffected the operational reliability have disappeared. The Äspö HRL now has two independentand stabile power lines. It has also been decided to keep the old mainland feedas a spare. An agreement with one electrical company has been signed to insure that thespare feed is maintained and that present and future demand of electric power is supplied.As activities at the laboratory has increased the need for parking space has becomeurgentand a new parking area was built. The facilities now has an additional parking lotwith room for 32 cars and 2 busses. In the spring the new area is to be surrounded withlawns in order to blend in to the environment.Reinforcement and widening of the road to Äspö has been carried out. The refurbishingof the road is to be completed with a coating of tarmac in the spring or summer of2001.Underground activitiesAn extensive rock reinforcement programme is in progress as a result of the rock inspectionin 1999. The project is expected to be completed the beginning of February 2001.At present 1 December 2001 shotcreating, bolting and mounting of mesh is carried outon the 450 m level.A facility operation monitoring system (ALFA) has been installed, tested and approved.The system facilitates the operation considerably and gives valuable information formaintenance. Knowledge of running hours for pumps, ventilation and energy consumptionwill also enable optimisation of the different systems.The project for hands-free registration when going underground has been resumed. Theproject has been initiated with a study in order to determine the need, technical requestand possible deliverer. As the study was completed a request for offers where sent out topossible system deliverers. The offers are to be completed and returned by the end ofJanuary 2001.129
A fire risk analysis has shown that improved fire safety underground is required. Aproject based on suggestions in the analysis has been started to improve this and thework has been initiated regard installation of traffic lights in a narrow high-risk part ofthe tunnel. Project will continue with additional fire detection system on the 420 m leveland with voice alarm at strategic places in the underground facility.Replacement of corroded light equipment in the deeper half of the tunnel, 220–450 mlevel, has started and is estimated to the completion in April 2001.One extra mobile rescue chamber has been acquired and placed in the 420 m level.5.2 Information and public relationsBackgroundThe main goal of the Information group is to create public acceptance for <strong>SKB</strong> inco-operation with other departments at <strong>SKB</strong>. This is achieved by presenting informationabout <strong>SKB</strong>, the Äspö HRL and the <strong>SKB</strong> siting programme on surface and underground.New ResultsDuring the year 2000, 12 760 persons visited the Äspö HRL (12 211 persons duringyear 1999). Of these came 6 670 persons from the six muncipals where <strong>SKB</strong> performedfeasibility studies.The groups have represented the general public, teachers, students, politicians, journalistsand visitors from foreign countries.The total amount of visits to the <strong>SKB</strong> facilities in Oscarshamn, Äspö HRL, CLAB andthe Canister Laboratory, is 19 289 during the hole year. Visits have been administratedfrom the information group at ÄspöUrberg 500The new Entrance Building U500 was ready in the beginning of the year.The official inauguration of “Urberg500” took place on March 9.On June 19 th Urberg 500 summer tours opened to the general public. It is a two hourvisit starting with information followed by a guided bus tour down in the Äspö tunnel.1700 persons participated in the tours.Special EventsAn annual event in May is “The Äspö Day”. This year it took place on the 7 th and550 persons from the neighbourhood visited Äspö.130
Special projects• A new booking system/central together with OKG is planned to be ready for useduring the first part of 2001.• A safety video that is a part of the safety instructions to our visitors.• A new visitor’s site at Äspö for information on “The Drilling and Borehole investigations”.5.3 Data management and data systems5.3.1 BackgroundThe regulatory authorities are following <strong>SKB</strong>’s siting work. Before each new stage, theyexamine and review the available data. A repository will never be allowed to be built andtaken into service unless the authorities are convinced that the safety requirements aremet. Hence, <strong>SKB</strong> is conducting general studies of the entire country and feasibility studiesin 5–10 municipalities. Site investigations will then be conducted on a couple of specificsites. With the result of the studies as supporting material, <strong>SKB</strong> will then apply forpermission to carry out detailed characterisation of one of the sites. The licence applicationfor detailed characterisation will include a safety assessment and the results will bereviewed under the Act on Nuclear Activities and the Act concerning the Managementof Natural Resources by the regulatory authorities, the municipality and the Government.Management of investigation data is a highly demanding and critical task in the presentedlicensing process. The safety assessment must be based on correct and relevantdata sets. Hence, the data management routines need to be focused on the followingaspects in a long-term perspective:• traceability,• accessibility,• data security and• efficiency.A high quality baseline for the safety assessment will be established if the aspects specifiedabove are met. The data needed in a typical safety assessment have been reportedin Andersson et al /1998/. Figure 5-1 and Figure 5-2 illustrates the need and input ofinvestigation data in the safety assessment process.131
DataGeological ModelData Data Data DataRockMechanicsModelThermalModelHydrogeologicalModelChemicalModelDataTransportation ModelIsolationTechnicalbarriersRetensionTransport ofsolutesSafety FunctionsRecipientDilution inthe biosphereSafety AssessmentFigure 5-1. Schematic flow chart describing how information are transferred between differentgeoscientific models and how these models are used in the safety assessment to be done. The need ofdifferent types of input data are shown as balloons marked Data.5.3.2 ObjectivesThe different parts of <strong>SKB</strong>’s Data Management System will be improved in conjunctionwith the ongoing and planned activities in <strong>SKB</strong>’s siting work. This in order to fulfil therequirements expected from the regulatory authorities and the internal organisation aswell.SICADA is and will be one of <strong>SKB</strong>’s most strategic database systems. The databaseshould efficiently serve planned investigations activities at the future candidate sites aswell as the experiments at Äspö HRL. The database should be user friendly and alwaysguarantee a high degree of safety, quality and traceability.The system need to be held modern and also adapted and improved in parallel with thedevelopment of new and more extensive investigation programs.132
Figure 5-2. Schematic flow chart describing where from data are taken to the different geoscientificmodels used as a baseline fore the safety assessment to be done. The balloons in Figure 5-2 have beencomplemented with the origin of data. As indicated SICADA and RVS are highly important tools onthe way to convince the authorities that the safety requirements are met.5.3.3 System conceptData modelThe central data table in SICADA is the activity-history table. All data rows in this tablehave a unique activity identifier. This identifier uniquely connects measured data withonly one activity in the activity-history table. The activity identifier is located in the firstcolumn of the table. Normally the activity identifier is hidden, but it is always present inthe background and is handled automatically by the system.Activity identifiers were introduced in order to make it possible to link an arbitrarynumber of investigation data tables to a certain activity. Hence, activity identifiers arepresent in all investigation data tables in the whole system.133
All data rows in the activity-history table also have a time stamp and a user identificationcode to show and control when data was inserted into the table and who did the input.Data structureA hierarchical data structure has been inplemented in order to make it easy to find andretrieve any investigation data. The hierarchy is composed of three levels, viz:• Science (Level 1)• Subject (Level 2)• Method (Level 3)At present the data structure contains the sciences engineering, geology, geophysics,geotechnics, hydrochemistry, hydrogeology, meteorology and rock mechanics. An excerptof the data structure is viewed in Figure 5-3.Figure 5-3. The hierarchical data structure of the SICADA system, with all sciences shown, butonly an excerpt of subjects, methods and activities. Note, in most cases there is an one to one associationbetween a certain method and an activity, but in some cases a set of activities are associated withonly one method.134
Every set of investigation data in SICADA has been collected from boreholes, tunnelsor other objects. Simple name conventions have been set up and used for objects. Forobjects in the Äspö tunnel seven to nine characters are used, like for the cored boreholeKA2511A. The naming of surface boreholes is somewhat different, where only fivecharacters are used. An example is the cored borehole KAS02 and the percussionborehole HAS05. The capitals K and H is used for cored and percussion drilled holes,AS is the area code for Äspö and finally 02 is a sequence number. As an example KAS02was drilled before KAS03 and HAS05 was drilled before HAS06. The object codes(sometimes called idcodes) and the hierarchical data structure are the key informationwhen searching for data in the SICADA system.All investigation data sets or parts of data sets are not possible to store in data tables inSICADA, but at least stored as file references. Some examples of this type of data sets areborehole radar images and geophysical profiles. The file reference is an optional activitytag available during data registration. Actually there is an on-line file archive managed bythe SICADA system. This on-line archive is called SICADA File Archive. A registered filereference is actually an on-line reference to the file in the SICADA File Archive.The activity tag mentioned above is only one example of one of many useful tags in theSICADA system. There are currently about 60 different tags available in the system.ApplicationsThe following SICADA user applications/programs are used to handle the informationin the database.SICADA/DiarySICADA/FinderSICADA/RetrieverSICADA/ProjectThis application is used to insert or update data in the database.This application is used to retrieve data from the database.This application is used to retrieve data from the database.This application is used to check the progress of the data entrywork for a specified project/experiment.5.3.4 ResultsThe full integration of the HMS instrument database as a part of SICADA has beencompleted. Some new improvements have also been introduced, and the set of instrumentationdata has been complemented. After integration the instrumentation databasewas settled.The licensing technique for CA/Ingres II and other CA-products, has earlier causedsevere problems, have been replaced by a new technique.Major efforts have been undertaken to improve the part of the data structure used formanagement of information about all co-ordinate systems handled in the database. TheRock Visualisation System required the modifications implemented.The SICADA administration organisation has been extended with a new employee,assistant database administrator, as planned. The head database administrator will nowhave more time to focus on other important activities e.g. implementation of GIS methodology.135
5.4 Monitoring of groundwater head and flow5.4.1 BackgroundThe Äspö HRL operates a network for the monitoring of groundwater head, flow in thetunnel and electrical conductivity, as the core parameters. This system goes under theacronym of HMS (Hydro Monitoring System). Water levels and pressure head arecollected from surface and tunnel boreholes. Additionally, the electrical conductivityof the water in some borehole sections and in the tunnel water is measured. The networkincludes boreholes on the islands of Äspö, Ävrö, Mjälen, Bockholmen and someboreholes on the mainland at Laxemar.The monitoring of waterlevels started in 1987 while the computerized HMS wasintroduced in 1992. The number of boreholes included in the network has graduallyincreased. The tunnel construction started in October 1990 and the first pressure measurementsfrom tunnel drilled boreholes were included in the HMS in March 1992. Todate (31 December 1997) the monitoring network comprise a total of 62 boreholes mostof which are equipped with inflatable packers, where the pressure is measured by meansof pressure transducers. The measured data is relayed to a central computer situated atÄspö Research village through cables and radiowave transmitters. Once a year the datais transferred to <strong>SKB</strong>’s site characterization database, SICADA. Manual levelling is alsoobtained from the surface boreholes on a regular basis. Water seeping through thetunnel walls is diverted to trenches and further to 21 weirs where the flow is measured.The tunnel excavation began to impact on the groundwater head during the spring 1991.5.4.2 ObjectivesThe scope of maintaining such a monitoring network has scientific as well as legalgrounds:• firstly it is a necessary requirement in the scientific work to establish a baseline of thegroundwater head and flow situation as part of the site characterization exercise. Thatis, a spatial and temporal distribution of groundwater head prevailing under naturalconditions (i.e. prior to excavation),• secondly it is indispensable to have such a baseline for the various model validationexercises which are implemented for the Construction Phase and the OperationalPhase including the comparison of predicted head (prior to excavation) actual head(post excavation),• thirdly it was conditioned by the water rights court when granting the permission toexecute the construction works for the tunnel that a monitoring programme shouldbe put in place and that the groundwater head conditions should continue to bemonitored until the year 2004 at the above mentioned areas.5.4.3 ResultsThe hydro monitoring system continued to support the different experiments undertakenat Äspö HRL. It provides basic information on the influence of the tunneldrainageon the surrounding environment by recording the evolution of head, flow and salinity ofthe groundwater.136
Support of experimentsHMS data were put to use in different ways, in addition to complying with the waterrights court it provided the means to continuously control the groundwater head in arock volume where tracer experiments are conducted. The head distribution in the blockshould remain constant throughout the experiment since it forms an initial condition tothe problem. Alteration in head gradients during the experiment might complicate theanalysis. It is always supporting, and indeed is a necessary requirement during the rockcharacterization stage preceding the experiments.As an example, it was noted through the HMS that during the blasting of the supportfor the plug in the tunnel for the Prototype Repository experiment that the groundwaterpressure in neighbouring fractures/fracturezones did not restore to their original levelafter blasting. This effect warrants further studies. Se section 4.2.4.5.5 Quality Assurance5.5.1 BackgroundQuality Assurance means to ensure that activities are undertaken with due quality andhigh efficiency. In order to achieve this goal it is required that a smoothly runningsystems is in place to manage projects, personnel, purchasing, economy quality, safetyand environment.The structure of a quality assurance system is based on procedures, handbooks, instructionsidentification and traceability, quality audits etc. The overall guiding documents forissues relating to management, quality and environment are written as routines.Employees and contractors related to the <strong>SKB</strong> organisation are responsible for that theworks is performed in an order so it fulfils <strong>SKB</strong>’s quality goals and guidelines.5.5.2 Objectives<strong>SKB</strong> is in progress to implement a common management system to break down allrequirements from legislator, authorities, other interested parties and internal requirementsof our own organisation. The aim of the project is to certify <strong>SKB</strong> accordingto the Environmental Management System ISO 14001 and also to the QualityManagement Standard ISO 9001 before the summer of year 2001.The <strong>SKB</strong>’s Management System has been compared to the requirements from theISO-standards. This work has resulted into actions.5.5.3 ResultsOne internal audit has been executed. Actions have been taken to take care of thedeviations from the ISO-standards.Goals and actions plan to reach the environmental goals have been identified andimportant environmental aspects which influence the environment.Several routines have been produced to manage quality, safety and environment to theÄspö HRL.137
6 International cooperation6.1 Current international participation in the Äspö HardRock LaboratoryNine organisations from eight countries have during 2000 been participating in the ÄspöHard Rock Laboratory in addition to <strong>SKB</strong>. They are:• Agence Nationale pour la Gestion des Dechets Radioactifs, ANDRA, France.• Bundesministerium für Wirtschaft und Technologie, BMWi, Germany.• Empresa Nacional de Residuos Radiactivos, ENRESA, Spain.• Japan Nuclear Cycle Development Institute, JNC, Japan and The Central ResearchInstitute of the Electric Power Industry, CRIEPI, Japan.• Nationale Genossenschaft für die Lagerung Radioaktiver Abfälle, NAGRA,Switzerland.• United Kingdom Nirex Limited, NIREX, Great Britain.• Posiva OY, Finland.• US DOE CBFO/Sandia National Laboratories, SANDIA, USA.In each case the cooperation is based on a separate agreement between <strong>SKB</strong> and theorganisation in question. The cooperation with the Japanese organisations is performedunder one agreement. JNC is the official representative within the cooperation. Thework performed within the agreements and the contributions from the participants aredescribed under section 6.2.Multilateral projects are established on specific subjects within the Äspö HRL programme.These projects are governed by specific agreements under the bilateral agreements.The TRUE Block Scale Experiment (see section 3.3.2) is an example of such aproject.Specific technical groups so called Task Forces is another form of organising the internationalwork. A Task Force on groundwater flow and solute transport in fractured rock isongoing (see section 3.9).A joint committee, the Äspö International Joint Committee, IJC, with members fromall participating organisations, except from Japan which is represented by JNC only(see above), is responsible for the coordination of the work arising from the internationalparticipation. The committee meets once every year. In conjunction with each IJCmeeting a Technical Evaluation Forum, (TEF), is held. TEF consists of scientific expertsappointed by each organisation.139
6.2 Summary of work by participating organisations6.2.1 PosivaIntroductionThe Project Agreement between <strong>SKB</strong> and POSIVA covers the co-operation in the ÄspöHRL. The work within the Joint Project comprises three main areas:• Detailed investigation methods and their application for modelling the repositorysites.• Test of models describing the barrier function of the bedrock.• Demonstration of technology for and function of important parts of the repositorysystem.According to a specific agreement Posiva is participating in TRUE Block Scale (TBS)experiment together with Nirex, ANDRA, <strong>SKB</strong>, ENRESA and PNC.The following text comprises the work done during 2000 according to the Joint Project.Detailed investigation methods and their application for modelling therepository sitesApplicability of different investigation methods for assessment of repository sitesPosiva conducted an investigation programme in the Laxemar KLXO2 borehole by thetechnology used in the site characterisation programme in Finland. Details of this studyare presented in the description of the Hydrochemical Stability project.Test of models describing the barrier functions of the bedrockTask Force on Modelling of groundwater flow and transport of solutesTask 5: Impact of the tunnel construction on the groundwater system at Äspö –a hydrological-hydrochemical model assessment exerciseBackgroundTask 5 (Impact of the tunnel construction on the groundwater system at Äspö, a hydrological-hydrochemicalmodel assessment exercise) aims at the comparison and ultimateintegration of hydrochemistry and hydrogeology. The simulation of reactive transport onthe aerial scale to the Äspö HRL is beyond present scope for several reasons. Therefore,the task “modelling of groundwater flow and transport of solutes” was broken down intotwo sub-tasks: to studies of groundwater chemistry and to hydrogeological simulationsboth done by VTT/Infrastructure and Environment. Task 5 is also part of theHydrochemical Stability project.ObjectivesThe groundwater chemical studies done in VTT aimed to the independent approach tothe <strong>SKB</strong>’s M3 method /Laaksoharju and Wallin, 1997/. The geochemical inverse modellingcalculations attempts to take several aspects contemporaneously into account duringcalculations. 1) Calculations were performed using the reference water types that havebeen identified based on the analyses of geochemical data, 2) on the interpretations ofthe Quaternary history of the Äspö HRL (Figure 6-1), and 3) the calculated geochemical140
a) Preglaciation (< 75,000 BP)Meteoric b)Eem Sea?Sea Bottom?Glaciation (~75,000 - 10,500 BP)Glacial MeltIce Lake"PreglacialAltered"c) Litorina (~8,000 - 4,000 BP)d)Litorina SeaSea BottomSalineGlacial Melt +"PreglacialAltered"SalinePresent (> 4,000 BP)Baltic SeaSea Bottom(Litorina +)Postglacial Altered +Glacial Melt +"Preglacial Altered"SalineMeteoric(Litorina +PostglacialAltered +)Glacial Melt +"PreglacialAltered"SalineFigure 6-1. Quaternary history of the Äspö area, based on analyses of geochemical data andinterpretations of the Quaternary history of the Fennoscandian Shield /e.g. Laaksoharju and Wallin,1997/. Only periods considered significant for groundwater evolution at the Äspö site are presented.mole-transfers are assumed to conform the geochemical steady-state conditions. Importantresults of the inverse modelling calculations are the mixing fractions.In the hydrological simulations the mixing fractions of the reference water-types can betransported like conservative parameters. The initial geochemical boundaries for hydrologicalsimulations are given as mixing fractions. In the hydrological simulations themixing fractions are transported as a function of time, and the evolution of mixingportions in the predefined control is monitored. Detailed performance measures areused for the presentation of the results.Experimental conceptThe flow model was constructed by including the hydrologic connections recognisedduring the tunnel construction. The observed properties of water and bedrock wereincluded in the simulation model. The groundwater table applied over the Äspö islandwas replaced by a flow rate boundary condition in the first updating of the tunnel. Thehydraulic data gained from boreholes was utilised to confirm the residual pressure andflow rate boundary conditions in the tunnel and the shaft(s).In essence, the simultaneous modelling of flow and transport is a coupled process. Theinitial salinity or chloride boundary was fixed in accordance with the observations of thegroundwater composition. The FEFTRA code, which is based on the porous mediumconcept and the finite element method, was used to solve both the coupled equations ofresidual pressure and concentration and the transport equations of the different watertypes.141
The simulation time steps covered the period from the natural conditions until thecompletion of the tunnel and the shafts. The dual porosity transport model was appliedto the equations of the different groundwater types, which were solved using the previouslysimulated residual pressure and concentration fields. The initial concentrationboundary condition for the transport equations of the different water types was given inthe basis of the M3 modelling and the inverse modelling.The geochemical inverse modelling calculations aims at solving step by step referencewater mixing fractions in groundwater samples collected from the Äspö HRL. Simultaneouslythe net geochemical reactions required for reaching the sample composition aresolved. The approach implements the inverse-modelling method (PHREEQC-2) andcalculations are carried out both samples taken before the excavation of the HRL tunnels(undisturbed conditions) and samples taken during and after excavations (disturbedconditions).ResultsThe POSIVA’s contribution to the Task 5 resulted three reports, one on the geochemicalinverse modelling and two on the hydrological simulations, to be published in 2001. Thewhole hydrological simulation process was done twice because there were two sets ofgeochemical modelling results available for the simulations. The M3 based geochemicalresults were delivered by the Task 5 organisation but the inverse modelling basedgeochemical results were calculated in the VTT.As regards the M3 based simulated mixing ratios in the control points, the futurecondition of the brine water seems steady, except in the prediction section (tunnel length> 3000 m), where it is mildly increasing. The glacial water decreases, because it is a reliccomponent in the present-day groundwater conditions. The meteoric water generallyincreases. The overall future condition of the Baltic water seems quite steady. Theseresults are fairly well in line with the M3 modelling. The tunnel construction caused theupconing of the brine water, the decrease of the relic glacial water and the increase ofthe mixing ratios of the meteoric and Baltic waters in the tunnel area. This piece ofwork showed the essential role of the dispersion lengths as regards to the calculatedmixing ratios at the control points. Also, the infiltration from the sea had to be restricted.In the geochemical inverse modelling the calculation results for the undisturbed conditionsform the basis for disturbed sample calculations. Furthermore, the detected depthdistributions of mixing fractions in undisturbed samples form geochemical boundariesnecessary in hydrological simulations. An example of results of disturbed conditioncalculations is given in Figure 6-2 that illustrates how mixing fractions evolve in timein a control point, and how large CaX 2 mole-transfers has to be taken into account as afunction of fresh Baltic Sea fraction intruding into a control point.On the whole, the inverse modelling based simulations give good or fair results atshallow depths compared to the estimated mixing fraction results. Adjusting the surfaceboundary conditions and the transmissivities suitably usually solved the shallow problems.At depth, the simulations exhibit either a systematically growing difference to thegeochemically estimated values, or hint to an exaggerated stiffness of the hydrologicalmodel. These difficulties raised three principal questions: “are the hydrological/structuralproperties of the fracture zones correctly estimated at depth, are the structural relationsbetween the fracture zones correctly defined, and is the open tunnel effect takencorrectly into account in the hydrological model?”142
Mixing Ratio1.00.90.80.70.60.50.40.30.20.10.00200400600SA1229A; -171.3 mSA1327B; 184.1 mSA1327BSampleRef. Day = 01.01.91800100012001400160018002000Figure 6-2. Reference water-type mixing fractions in the control points SA1229A and SA1327B asa function of time, and CaX 2 mole-transfer as a function of the fresh Baltic Sea fraction. Cumulativemaximum errors in mixing fractions and maximum errors related to mole-transfers are shown witherror bars. Drawn regressions are visual approximations.Mole-transfer (mmol/l)8.06.04.02.00.0-2.00.500.550.600.65Mixing Fraction (Baltic > 50%)Meteoric Baltic Altered Litorina Sea Glacial Melt SalineCaX 20.700.750.800.850.900.951.00Hydrochemical stability projectBackgroundPosiva and <strong>SKB</strong> initiated in 1997 a joint project with the aim to investigate thehydrochemical stability of deep groundwater in crystalline bedrock. This project hasbeen carried out within the Äspö agreement between <strong>SKB</strong> and Posiva. It also coversthe technical parts of the participation in the modelling Task 5 (within the frameworkof the Äspö Task Force for modelling of groundwater flow and transport of solutes) andre-sampling and analysis of groundwater from KLX02. The project is in a final reportingstage. Results of Task 5 are explained above and results of flow measurements of KLX02with Posiva flow log are shown below.Fieldwork in borehole KLX02 at LaxemarThe aim of the joint <strong>SKB</strong>/POSIVA measurements of the deep borehole KLX02 atLaxemar was to demonstrate Posiva’s new flow measurement and sampling techniquesand to compare the results with earlier measurements from this borehole. The overallgoal was to increase the information from deep saline groundwater in Sweden andFinland. The equipment used were Posiva Flow Log (Figure 6-3) for hydrogeologicaldetermination of the flow situation including also the EC-electrode (to be used for theestimation of TDS), and the PAVE equipment for groundwater sampling (done during1999).143
Figure 6-3. Posiva Flow Log was used in flow measurements in borehole KLX02 at Laxemar.During the year 2000 two campaigns of flow measurement was carried out in theborehole KLX02. The objective of the measurements of the first campaign (January –February 2000) was to determine hydraulic conditions in the borehole. The main featurediscovered was that the flow direction in the measured depth range of 200–1200 m wasfrom the borehole into the bedrock when the borehole was in natural state (withoutpumping). Pumping reversed the flow direction. There was not any flow detected under1200 m depth. Hydraulic head and hydraulic conductivity was interpreted from themeasured flow and fresh water head values.1. The second flow measurement campaign was carried out in borehole KLX02 inMay-June 2000. A methodology test of the Posiva flowmeter was performed as a partof the Joint Project between Posiva and <strong>SKB</strong>. The second campaign had two mainobjectives:2. To evaluate possibilities to obtain transmissivities of individual fractures from theresults of the flow measurements.3. To perform detailed flow logging with EC (electric conductivity of groundwater)measurement to obtain flow rates of fractures and fracture specific EC ofgroundwater coming from chosen fractures.For the first objective, the borehole was pumped with several pumping rates(drawdowns). The results showed reversed flow directions without pumping and withpumping and flow rate increased with increasing pumping rate, see Figure 6-4. Thepreliminary results for the first objective have been delivered to <strong>SKB</strong>. The benefitsas well as the limitations of the method will be analysed in a report which will bepublished in 2001.144
Figure 6-4. An example of the results of the methodology test, detailed flow logging with severaldrawdowns.Microthermometry and LA-ICP MS investigation in connection with Äspö MatrixFluid ExperimentBackgroundThe fluid inclusions (FI), being a conceivable reservoir of salinity in crystalline rocks,contribute essential geochemical evidence for the main objectives of the matrix fluidproject, which are: 1) to determine the origin and age of the matrix fluids 2) to establishwhether present in- or out-diffusion processes from nearby fractures/fissures have influencedthe composition of the matrix fluids and vise versa and 3) to derive a range ofgroundwater compositions as suitable input for near-field model calculations145
The present investigation aims to 1) to find out the FI appearance in Äspö diorite2) to distinguish the chemical characteristics of the fluid inclusions and 3) to evaluatethe value of Laser Ablation ICP MS methods in determination of FI compositions.Moreover the results of this work are weighted against the analytical data given byRaman spectrometer (analyses carried out by Dr. Sten Lindblom in StockholmUniversity). Double polished thin sections, 200 µm in thickness, were prepared fromseven rock samples at Stockholm University. All the samples were selected from drillcore sample KF0051A01. The analytical methods consist of petrographic microscope,microthermometry (Reynolds Fluid Inc.) and Laser Ablation ICP-MS equipment(Cetah-Perkin Elemers 6000).ResultsThe fluid inclusions in coarse-grained quartz and in plebby quartz of Äspö diorite bearrecord of repeated fracturing, recrystallization and refracturing episodes. Three typesof inclusions were found; vapour, vapour-liquid and liquid. Moreover in one sample avapour-liquid-solid fluid inclusion was detected. The vapour phase in vapour-liquid fluidinclusions is CO 2 and it occupies most generally between 10 and 20% of the total volumeof the inclusion. The inclusions measure from 5 to 20 µm in length. Most of theinclusions occur in quartz, only few of them were detected in apatite and in sphene.The FI’s appear as 1) small clusters in crystals, 2) isolated and 3) related to intragranularfractures. The type 3 is the most common and it carries the majority of the FI’s. Thefluid inclusion trails in these fractures are aligned in several cross cutting directions,which tend to continue directly though the sectionThe microthermometric analyses (Figure 6-5) indicate low to moderate salinity for theaqueous – carbonic fluids. The melting temperatures determined range in general from–4°C to –17°C, which suggests 5–22 wt % NaCl e . The homogenization temperatures laywithin range of 89,6–190°C in most of the determinations, although higher values, up to271,2°C, have been recorded.The La-ICP-MS study indicates the dominating cations in FI’s to be sodium, calciumand magnesium. Furthermore several of the laser transverses, which were focused to thegrain boundary inclusions, reveal elevated concentration of barium.Th250200150100Äspö MFXLS 5.03-5.08(1:1)Äspö MFXLS 8.84-8.89(6:2)Äspö MFXLS 5.42(2:1 CC-HOST)500-50 -40 -30 -20 -10 0T mÄspö MFXLS 7.81-7.85(4:1)Figure 6-5. Microthermetry results for quartz-hosted FI’s in Äspö diorite samples 5.03–5.08 m,5.42 m and 8.84–8.89 m, drill core KF0051A01.146
BALINEFigure 6-6. A scan of double polished thin section (above) from sample KF0051A01 – 5.03–5.08m. Quartz stands out as white grains. Yellow arrow points the area enlarged in the photos on theright. Photo on the right shows a trail of fluid inclusions in the quarz host. The location of LA-ICPMS profile A’–B’ is marked. The profile A’–B’ (figure on the rigth) across a quartz grain bursts ina middle of the transverse one sodium rich fluid inclusion.Demonstration of technology for and function of important parts of therepository systemLong Term Test of Buffer Material (LOT)BackgroundTest “parcels” containing heater, central tube, clay buffer and instruments are placedin boreholes with a diameter of 300 mm and a depth of around 4 m for different timeperiods. The parcel material will thereafter be examined by a general, well-defined setof tests and analyses in order to provide data for the different aims. Posiva’s task in theLOT project is to study porewater chemistry in bentonite. The task will be carried outat VTT Chemical Technology. Excavation of the next parcel (A0) is scheduled for thesecond half of the year 2001.ObjectivesThe aim of the work carried out by VTT Chemical technology is to obtain data of thechemical conditions to be developed in bentonite considering the effect of the temperature,additives and rock fractures. The study gives information about the chemical processesoccurring in bentonite, but also supports the other planned studies in respect of thechemical conditions.147
ResultsThe development work of the measurement and analytical methods for bentonite andbentonite porewater has been completed and reported. The methods were tested withartificial samples considering the small sample size of 1 to 2 ml, which was assumed tobe available. Most of the components of interest can be determined from a squeezedporewater sample of about 1.5 ml by diluting the sample. ICP-AES appeared to be asuitable routine method for Na + , K + Ca 2+ , Mg 2+ , Si 4+ and ion chromatography (IC) forCl – and SO 42–. Sulphide with spectrophotometric method likewise Fe 2+ and Fe tot withferrozine method could be determined down to a level of 0.1 mg/l in the initial sample.Bicarbonate was determined by titration, the determination level being 1 mg/l in theinitial sample.The tests on pH showed that a sample of 0.15 ml was big enough for the microelectrodeto give reliable values. The tests on Eh with reference porewaters, where differentconcentrations of S(-II) or Fe(II) were added, showed that the sample has to be closedcarefully in the measurement cell to avoid oxidation or loss of H 2 S. A sample of 0.3 mlis enough for the microelectrode.A squeezing cell for porewater prepared of titanium was tested with bentonite samplesand sulphide solutions. A vessel was constructed and tested for transportation of thebentonite samples to be taken from the LOT experiment.6.2.2 ANDRAL’Agence Nationale pour la Gestion des Déchets Radioactifs (ANDRA) provides experimentaland modelling support to the HRL with emphasis on site characterisation tocomplete research activities in France.The contributions of ANDRA and its contractors focused on the Tracer Retention UnderstandingExperiment (TRUE) at a Block Scale (TRUE BS) and on the Task 5 of the Äspö TaskForce on modelling dealing with hydro-chemical modelling of the perturbations due toconstruction of the HRLTRUE Block Scale ExperimentANDRA and its contractors carried out suple efforts in the tracer tests phase of theTRUE BS Experiment:• One concerning tracer tests strategy, field work and interpretation of results.• One on the modelling side to help dimensioning tracer tests.Tracer tests background (ANDRA, SOLEXPERTS, GEOSIGMA)Tracer tests have been carried out in order to characterise a granitic block hydraulically.The conceptual model developed in the previous boreholes characterisation phasesserved as a base to elaborate the tracer tests plan. This hydro-structural model comprisesalmost twenty sub-vertical structures (Figure 6-7). All high transmissivity structures(10 –7 to 10 –5 m 2 /s) are NW oriented. The mean gradient of 8% is towards the laboratorytunnel. Dilution tests carried out in various boreholes intersections of the same structureproved very different fluxes.148
PompageQ = 2 l/minInjectionB-2dInjectionB-2cInjectionB-2aInjectionB-2aInjectionB-2gInjectionB-2eInjectionB-2bFigure 6-7. Hydro-structural model at level –450 with sinks and pumping locations.Tracer tests objectivesThe 2000 sorbing and non-sorbing tracer tests aimed at:• Understanding and forecast transport in a given fractures set.• Evaluating the tracer retention mechanisms (matrix diffusion, sorption).• Finding a link between flux and transport parameters.• Evaluating the role on transport of fracture heterogeneity and intersections.Tracer tests plan and resultsThe 2000 tracer tests plan followed a step by step strategy:(A) The first phase aimed at finding the most suitable experimental design having inmind a minimum recovery target of 80% for sorbing tracers. Two configurations provedefficient with low injection rate compared to high extraction rate (~2 l/min): dipole andradial convergence. The best sink proved to be the intersection of borehole KI0023 withstructure 20.149
0.06B-2bBreakthrough NaReO 4Flow path KI0025F02 P3 - KI0023B P60.01B-2cBreakthrough Ho-DTPAFlow path KA2563A:S1 - KI0023B P6MeasuredSimulated0.008MeasuredSimulated0.04Conc. (mg/l)0.02Conc. (mg/l)0.0060.0040.002000 1000 2000 30000 1000 2000 3000 4000Elapsed time (h)Elapsed time (h)0.12B-2dBreakthrough Gd-DTPAFlow path KI0025F03 P7 - KI0023B P60.016B-2eBreakthrough In-EDTAFlow path KI0025F03 P3 - KI0023B P6MeasuredSimulated0.012MeasuredSimulated0.08Conc. (mg/l)0.04Conc. (mg/l)0.0080.004000 400 800 1200 1600 20000 1000 2000 3000Elapsed time (h)Elapsed time (h)1.2B-2gBreakthrough NaphtionateFlow path KI0025F03 P5 - KI0023B P60.08B-2hBreakthrough RdWTFlow path KI0025F02 P6 - KI0023B P6MeasuredSimulated0.06MeasuredSimulatedConc. (ppm)0.8Conc. (ppm)0.040.40.02000 50 100 150 200 250Elapsed time (h)0 200 400 600Elapsed time (h)Figure 6-8. Non-sorbing tracer concentrations (B-2b to h) in the pumped water (rate~2 l/min) atstructure 20 and borehole KI0023 intersection.150
(B) During the second phase, various non-sorbing tracers (He-3, uranine, Yb-EDTA,ReO4, Ho-DTPA, Gd-DTPA, In-EDTA, naphtionate, rhodamine WT) have beeninjected in 7 locations of the fracture network. The tracer concentrations in the pumpedwater have been measured during months (Figure 6-8) to obtain a data set useful toachieve the objectives of the next step. The arrival times and the concentration curvesshape differ with the injection point. Matrix diffusion seems to play a role, consideringthe results with a Yb-ETA, He-3 cocktail (Figure 6-9).(C) With the third phase, cocktails of sorbing tracers with different sorption coefficients(H-3, Br-82, Na-22, Na-24, K-42, Ca-47, Sr-85, Cs-134, Re-186, Rb-86, Mn-54,Co-57) have been injected in 3 selected locations (where non-sorbing tracers recoveryhad been found > 80%). The retardation effect related to each tracer is well observed(Figure 6-10) and is in accordance with the knowledge acquired on a single fracture withTRUE-1. The –3/2 slope of the Log Log plot could indicate a matrix diffusion effectsimilar to observations made in the Swiss Grimsel Test Site. Analysis of these results arestill under way.He-3 and Yb-EDTA Breakthrough2.50E-0850concentration (C/Mo, 1/ml)2.00E-081.50E-081.00E-085.00E-0940302010recovery (%)0.00E+000 50 100 150 200 250 300 350 400 450time (hrs)Helium (hourly average) C/Mo (1/ml) Yb-EDTA C/Mo (1/ml) Helium Recovery (%) Yb-EDTA Recovery (%)0Figure 6-9. B-2a test with He-3 and Yb-EDTA. Later arrival of He-3, smaller maximumconcentration and longer tale may indicate diffusion in rock matrix or stagnant zones.151
1.0E-03Br-82Breakthrough curves C1Na-24C/A tot (kg -1 )1.0E-041.0E-051.0E-06K-42Ca-47Rb-86Cs-1341.0E-071 10 100 1,000 10,000Elapsed time (h)1.00E-04Breakthrough curves C2Re-186Ca-47C/A tot (kg -1 )1.00E-051.00E-061.00E-0710 100 1,000Elapsed time (h)1.00E-05Breakthrough curves C3C/A tot (kg -1 )1.00E-061.00E-07HTONa-22Sr-851.00E-08100 1,000 10,000Elapsed time (h)1.00E-031.00E-04Breakthrough curves C4Br-82I-131Ca-47C/A tot (kg -1 )1.00E-051.00E-06Ba-131Mn-54Co-571.00E-071.00E-081 10 100 1,000 10,000Elapsed time (h)Figure 6-10. Phase C tests with non-sorbing tracers (H-3, Br-82) and sorbing ones(Na-22, Na-24, K-42, Ca-47, Sr-85, Cs-134, Re-186, Rb-86, Mn-54, Co-57).Tests C-1 and C-4 carried out at the same location as B-2g; Test C-2 at location of B-2d;Test C-3 at location of B-2b.152
Modelling background (ITASCA)A major difficulty in experiments such as the TRUE BS project is dimensioning tracertests so that time scales are:• Long enough for the retention to take place.• Short enough for the experiment to be feasible.Being able to assess transport time scales before performing a full-scale experiment isvaluable to the project and this may be possible to do by assessing the correlationbetween the early time response to pumping tests (obtained in a short time) and tracerbreakthrough times. Herweijer /1996/ claimed such a correlation for heterogeneousporous media. The author explained that pumping test data reveal high conductivityinter-well pathways, which also dominate the transport in the aquifer he was considering.In other words, heterogeneity, by forcing well-defined pathways, was the cause of thecorrelation he saw. In fractured rock, where flow path conductivities are generally highlyvariable, this is also likely to be the case.Modelling objectivesThis project investigates the existence and relevance of this correlation in fracture networks,focusing on the understanding of the response of the system modeled, in order tocheck the robustness of the “draw down-breakthrough time” relationship. The objectiveis to assess if this concept can be of use to help dimensioning transport experiments.Simulations and resultsUsing geometrical models developed for a previous study from Äspö TRUE Block Scaledata (Äspö, 1997), we simulate a constant-head test (50 m draw down at pumping well)and advective tracer tests in various fracture networks, changing both network geometryand conductor hydraulic properties. We then compare the breakthrough time for a0.5 cm draw down (1/1000) and the arrival time for 1% of the tracer.First, we assess the influence of the scale of heterogeneity on the correlation betweenthe pumping test response and the tracer breakthrough times. We compute the responseof six networks, with various fracture density and fracture mean radius, everything elsebeing kept constant. For all the networks, we keep the product of the fracture density bythe mean square fracture radius constant. This fixes the average number of fractures aborehole would cut. Therefore, all the networks we use would look identical if crossedby boreholes; they conform to the most robust type of data we have access to.Figure 6-11 shows log-log plots of the relationship between the transport and flowcharacteristic times for four runs, with fracture mean radii varying from 3.2 m to 200 m.It shows how the degree of correlation depends on the respective scale of the fracturesand of the volume of rock tested. In other terms, the correlation we are investigatingmay be of practical interest only if the flow paths tested include only a few fractures. Ina system with many interconnected small features, the pathways between injection andrecovery wells may branch in a lot of ways, adding extra tracer dispersion to the transportprocess, compared to a system with fewer large fractures. This means that, for afracture field with a given “linear density” measured in boreholes, looking at the correlationbetween well test responses and tracer breakthroughs should yield information onthe significant scale of the fracture network. This in itself would be useful, since fracturescales are quite difficult to measure in the field, with size distributions from fracturetrace surveys often truncated because of the inadequate size and shape of the availablesampling areas (tunnel walls and outcrops).153
100Mean fracture radius = 3.2 mCorrelation coefficient = 0.7110Mean fracture radius = 14.1 mCorrelation coefficient = 0.831/1,000 head drawdown time breakthrough (d)1010.10.010.001Distances between injection/recovery wells:< 5 m> 5 m & < 10 m> 10 m & < 15 m> 15 m & < 20 m> 20 m1/1,000 head drawdown time breakthrough (d)10.10.01Distances between injection/recovery wells:< 5 m> 5 m & < 10 m> 10 m & < 15 m> 15 m & < 20 m> 20 m0.000110 100 1,000 10,000 100,000 1,000,0001% tracer breakthrough (d)0.00110 100 1,000 10,000 100,0001% tracer breakthrough (d)1Mean fracture radius = 31.6 mCorrelation coefficient = 0.9110Mean fracture radius = 200 mCorrelation coefficient = 0.961/1,000 head drawdown time breakthrough (d)0.10.010.001Distances between injection/recovery wells:< 5 m> 5 m & < 10 m> 10 m & < 15 m> 15 m & < 20 m> 20 m0.00011 10 100 1,000 10,00010.10.01Distances between injection/recovery wells:< 5 m> 5 m & < 10 m> 10 m & < 15 m> 15 m & < 20 m> 20 m0.0011 10 100 1,000 10,000 100,0001% tracer breakthrough (d) 1% tracer breakthrough (d)1/1,000 head drawdown time breakthrough (d)Figure 6-11. Time for 1% head drawdown versus time for 1‰ tracer breakthrough, for variousmean fracture radii.When investigating the effect of varying conductor hydraulic properties, using networkswith fairly large radii. Figure 6-12 shows a horizontal slice through one of these networks,with a mean radius of 70 m, as well as some correlation pictures obtained withthis network when varying the hydraulic properties. In summary, geometry is by far themost important factor. Incorporating matrix diffusion in a series of runs gave a littleeffect. This may be imputed to the fact tracking the early pressure and early tracerbreakthroughs. The conclusion would certainly differ if monitoring, for example,a 50% tracer recovery.154
3Flo 2.00Center:X: 1.431e-004Y: 2.106e-003Z: 2.538e+001Dist: 2.942e+002RotationX: 90.000Y: 0.000Z: 0.000Ang.:X: 22.500Y: 22.500Pipe conductivity1.0086e-010 to 1.0000e-0091.0000e-009 to 2.0000e-0092.0000e-009 to 3.0000e-0093.0000e-009 to 4.0000e-0094.0000e-009 to 5.0000e-0095.0000e-009 to 6.0000e-0096.0000e-009 to 7.0000e-0097.0000e-009 to 8.0000e-0098.0000e-009 to 9.0000e-0099.0000e-009 to 9.2328e-009Interval = 1.0e-009Pumping wellObservation wells at 10 mItasca Consulting Group, Inc.Minneapolis, MN USA1/1,000 head drawdown time breakthrough (d)1010.1Head drawdown and tracer breakthroughsMean fracture radii = 70.7 m - Seed 2Distances between injection/recovery wells:10 m15 m20 m25 m0.0110 100 1,000 10,000 100,0001% tracer breakthrough (d)a) 10 m thick horizontal slice through the model b) constant aperture and conductivityInfluence of mean fractures hydraulic conductivityMean fracture radii = 70.7 m - Seed 2Injection/recovery well distances: cross = 10 m - circle = 20 m1/1,000 head drawdown time breakthrough (d)10.10.010.001K = 1.4e-9 - 10 m distanceK = 1.4e-8 - 10 m distanceK = 1.4e-7 - 10 m distanceK = 1.4e-9 - 20 m distanceK = 1.4e-8 - 20 m distanceK = 1.4e-7 - 20 m distance0.00010.1 1 10 100 1,000 10,000 100,000Influence of mean fractures hydraulic conductivityMean fracture radii = 70.7 m - Seed 2Injection/recovery well distances: cross = 10 m - circle = 20 m10.10.010.001K = 1.4e-9 - 10 m distanceK = 1.4e-8 - 10 m distanceK = 1.4e-7 - 10 m distanceK = 1.4e-9 - 20 m distanceK = 1.4e-8 - 20 m distanceK = 1.4e-7 - 20 m distance0.00011 10 100 1,000 10,000 100,0001% tracer breakthrough (d) 1% tracer breakthrough (d)1/1,000 head drawdown time breakthrough (d)c) constant aperture, variable conductivity d) variable aperture and conductivityFigure 6-12. Effect of conductor hydraulic properties – time for 1% head drawdown versus time for1‰ tracer breakthrough.In terms of direct field application of the concepts discussed above (i.e. “predicting”tracer breakthrough time scales from well tests), we can expect good results if the distancebetween monitoring and pumping wells is not too large. Besides increasing the testduration and distances between wells may add fracture intersections and complexity intothe flow and transport system and result in poorer correlation. Future adequate well testanalysis techniques, using for instance a variable flow dimension approach, could allow abetter understanding. The information gained from well test analysis would be the keyfor predicting the correlation between tracer and head draw down breakthrough timesand therefore help for designing tracer tests in complex systems.155
Task Force on groundwater flow and transport modelling Task 5ANDRA is participating with three modelling teams in the Task 5 of the Task Force ongroundwater flow and transport modelling. The objectives of its involvement have beenpresented in the previous Annual Report 1999. According to ANDRA’s strategy, teamsare adopting specific complementary approaches:• ANTEA uses a dual porosity model of fractured zones and matrix with the 3Dcomputer code “TAFFETAS” based on Mixed and Hybrid Finite Element Method.• CEA models non sorbing flow and transport in the fracture network with the full 3Dcode “CASTEM 2000” (Mixed and Hybrid Finite Element Method).• ITASCA uses a discrete fracture model (21 fractures zones with channelized flow)implemented with the code “3FLO” (Finite Elements) and a geochemical module.Results obtainedANTEA’s analysis of the flow and transport parameters indicate that:• Calculated concentrations are very sensitive to fracture transmissivities.• Results are sensitive to Dirichlet boundary conditions.• Cinematic porosity, specific storativity and dispersivity influence the calculatedconcentrations.CEA’s preliminary results indicate’s model sensitivity to boundary conditions and totransport parameters (dispersion).• Density effects linked with salinity become significative for deep zones.ITASCA’s flow and transport modelling results show the following:• Simulations over-estimate the Baltic water intrusion at checkpoints.• Integration of chemical information leads to better fit with reality.• Sorbing transport simulation indicates precipitation-dissolution process possiblyinfluence the hydro-geological model.6.2.3 Japan Nuclear Cycle Development InstituteTracer Retention Understanding ExperimentJapan Nuclear Cycle Development Institute (JNC) actively participated in the Äspö TaskForce on Modelling Groundwater Flow and Transport and in the TRUE Block Scaleexperiment during 2000. The Task Force work involved analysis of solute transport forTask 4F, and evaluation of site scale hydrogeochemical modeling of Äspö for Task 5/Wikberg, 1998/.During 2000, JNC activities for the TRUE Block Scale experiment focused on developmentand documentation of the tracer test stage rock block conceptual model, andpredictive simulations for sorbing tracers using the channel network (CN) approach.156
Äspö Task Force on Modeling Groundwater Flow and Transport, Task 4FBackgroundThe Tracer Retention Understanding Experiments (TRUE) are part of a research programmeat Äspö, the Swedish Hard Rock Laboratory, designed to study the transport ofradionuclides in crystalline rock. During 2000, JNC carried out discrete fracture networksolute transport analyses to resolve differences between sorbing tracer experimentscarried out in the “TRUE-1” rock block and the results of stochastic discrete fracturenetwork (DFN) simulations.ObjectivesThe objective of JNC/Golder activities during 2000 were to improve the understandingof the physical and geological material properties and mechanisms behind measuredsorbing and conservative tracer transport experiment results obtained within theTRUE-1 experimental programme at Äspö.Experimental ConceptJNC/Golder team has used a combination of discrete feature network flow modelingand Laplace Transform Galerkin solute transport modeling. The processes considered inthese predictive models are:• pathways through deterministic and stochastic fractures,• advective transport,• dispersion within fracture planes,• surface sorption,• diffusive exchange between mobile and immobile zones,• matrix diffusion,• matrix sorption.The extent of mobile-immobile zone exchange is quantified by effective values fortransport path length, transport path width, effective porosity for the matrix materialactive in transport, and the thickness of the matrix material active in transport at the testtime scale. Geological information clearly indicates the importance of fracture infillingsuch as gouge and breccia, indicating that the high porosity, low thickness assumed formatrix materials in predictive simulations are not inconsistent with what should beexpected.ResultsDuring 2000, JNC carried out extensive simulations to determine whether assumptionsof greater diffusion depth, different values of matrix porosity, or different pathwaygeometries could better explain the predictions made for the sorbing tracer transportexperiment STT-2 during 1999. However, these simulations indicate that while it ispossible to calibrate individual parameters to obtain a better match for a particulartracer, the overall assumptions used during the 1999 predictive simulations provide agood match to observed behavior (Figure 6-13 and Figure 6-14).157
0.014STT-2: Predicted Results versus <strong>SKB</strong> data for Uranine1.20.0121Normalized Mass Flux (1/hrs)0.010.0080.0060.004<strong>SKB</strong> Mass FluxJNC Mass Flux<strong>SKB</strong> Cumulative RecoveryJNC Cumulative Recovery0.80.60.40.2Cumulative Recovery0.00200-0.20 100 200 300 400 500 600 700Elapsed Time (hours)Figure 6-13. STT-2 Prediction for Conservative Tracer Uranine.0.00008STT-2: Predicted Results versus <strong>SKB</strong> Data for 134 Cs0.180.000070.16Normalized Mass Flux (1/hrs)0.000060.000050.000040.000030.000020.00001<strong>SKB</strong> Mass FluxJNC Mass Flux<strong>SKB</strong> Cumulative RecoveryJNC Cumulative Recovery0.140.120.10.080.060.040.02Cumulative Recovery000 500 1000 1500 2000 2500 3000 3500Elapsed Time (hrs)Figure 6-14. STT-2 Prediction for Sorbing Tracer Cesium.158
Äspö TRUE Block Scale ExperimentBackgroundJNC has participated in the Äspö TRUE Block Scale project since 1998. In this project,<strong>SKB</strong> and its partners are characterizing a block of fractured rock at the 50 to 100 mscale, to improve the understanding of flow and transport in networks of multiplefractures. JNC has worked with the project team to formulate the project in terms ofhypotheses defining to characteristic nature of flow in fracture network, and any distinctionsbetween the processes and parameters at fracture network scales when compared tothose observed at the single fracture scale of the TRUE-1 experimentObjectivesNC’s objective within the TRUE Block Scale project is to advance the understanding ofthe nature of flow and transport in fracture networks at 50 to 100 m scales. Toward thisend, JNC participates in the project at all levels from the definition of hypotheses to betested, support to experimental design, development of the hydrostructural model, andhydraulic and tracer test interpretation. In addition, JNC participates in the TRUEBlock Scale project as the channel network (CN) modeling team.Experimental ConceptDuring 2000, JNC activities were primarily in development and improvement of the sitehydrostructural model, and in channel network modeling of the rock block, includingthe possible effect of fracture intersection zones (FIZ). Work on the hydrostructuralmodel led to the development of the reference hydrostructural model used by theexperimental and modeling teams for all project analyses. Figure 6-15 illustrates ahydrogeological interference analysis approach developed by the JNC/Golder team tosupport the hydrostructural model. The hydrostructural model itself is illustrated inFigure 6-16.Response of KI0023 to Drilling in KI0025F02S1 S2 S3 S4 S5 S6 S7 S8 Drill Depth4,5002504,000200Pressure (kPa)3,50076 22 20Drilling Progress1910150100Depth (m)3,000502,50008/11/98 0:00 8/15/98 0:00 8/19/98 0:00 8/23/98 0:00TimeFigure 6-15. Hydraulic Interference Analysis for Development of Hydrostructural Model.159
Figure 6-16. August 2000 Update to Hydrostructural Model for TRUE Block Scale Site.ResultsDuring 2000, the JNC/Golder team implemented the hydrostructural model as achannel network (CN) model. JNC then calibrated this model against both hydraulicinterference and tracer experiments. This formed the basis for sorbing tracer testpredictions to be carried out during 2001.The channel network model combines the discrete deterministic structures of thehydrostructural model with stochastic background fractures as identified during thedetailed site characterization phase of the project. Figure 6-17 and Figure 6-18 illustratethe hydraulic interference and conservative tracer test model calibrations carried out.160
10,000,000TTS A-4: Distance-Drawdown Plot (Sink in KI0023B P6 : Structure #21)<strong>SKB</strong> Test DataJNC PreditionsDrawdown (Sp) / Flux (Q) [ s/m 2 ]1,000,000100,00010,000KI0025F02 P1 &KA2563A P1Features #19KI0023B P5Feature #18KI0025F02 P3 andKI0025F03 P3Structure # 13Note: a breakthrough time oft =2880 (s?) used in both casesValue taken from <strong>SKB</strong>spreadsheet Adistdraw.xls1,0000.1 110 100Response Time (tR) / Distance Squared (r2) [s/m2]Figure 6-17. Channel Network Model Calibration to Hydraulic Interference.90%C2 Calibration: Test B2D (Gadolinium) Recovery80%Mass Recovery (%)70%60%50%40%30%20%10%<strong>SKB</strong> In-situ measurementsCalibration Run 1Calibration Run 2Calibration Run 3Calibration Run 4 (Prediction 1)Calibration Run 5 (Prediction 2)0%0 200 400 600 800 1,000 1,200-10%Elapsed Time (hours)Figure 6-18. Channel Network Model Calibration to Conservative Tracer Experiments.161
Äspö Task Force on Modeling Groundwater Flow and Transport, Task 5BackgroundThe Äspö Task Force on Modeling Groundwater Flow and Transport, Task 5 project hasbeen underway since 1997. In this project, <strong>SKB</strong> and its partners have worked to developan integrated approach to site scale hydrogeology and geochemistry. Within this project,JNC completed hydrogeological modeling of the Äspö site at the 2 km scale during1999. During 2000, JNC focused on addressing uncertainty issues raised by previousmodeling.ObjectivesThe objective of JNC activities for Task 5 during 2000 was to address the uncertaintyissues raised by previous hydrogeochemical modeling within the project. Work focusedon three areas:1. Uncertainty introduced to the analysis by the use of the four M3 geochemicalendmembers. This was addressed by multivariate analysis for endmembers with lowerresidual error.2. Limitations of the graph-theory based pathway analysis used to identify geochemicaltransport pathways. This was addressed by development of a new particle backtrackingalgorithm to improve pathway identification.3. Uncertainties introduced to previous modeling by the use of a simplified spatialinterpolation of initial conditions. This was addressed by development of a spatialinterpolation approach which reflected fracture zone geochemistry patterns, and alsodistinguished waters under Äspö island from those beneath the Baltic.Experimental ConceptThe JNC/Golder analysis during 2000 focused on improving the discrete fracturenetwork/channel network methodology developed for integrated hydrogeochemicalanalysis during 1998 and 1999. Figure 6-19 presents an outline of the approach developedto addressed uncertainty arising from end-member identification issues. In thisapproach, eigenvector based multi-attribute analysis was used to determine mathematicallydistinct end members. These end members were then updated to reflect geologicaland geochemical possibilities.ResultsThe updating of geochemical end-members, spatial interpolation of initial conditions,and improvements to pathway analysis was able to resolve many of the remaining uncertaintiesin the Äspö island scale hydrogeochemical model. However, it did not eliminateall of the errors – many geochemical pathways remain unexplained, and will requirefurther research to resolve the remaining uncertainties. Figure 6-20 illustrates one ofthe better geochemical breakthrough matches from the model updated during 2000.162
Identify the number ofend-members in thegroundwater data matrixby eigenvalue analysisObtain a firstapproximation of themixing proportionsusing the Varimaxrotated factor scoresObtain a firstapproximation of theend-membercomposition matrixusing the firstapproximation of theprofiles matrix and theoriginal dataCarry out checks on thefinal end-member andmixing proportion dataYesArethe mixing proportion and endmembermatrices consistentwith the original data?Refine the mixingproportions and endmembermatrices byiterationData interpretationNoFigure 6-19. Multi-attribute Geochemical End-member Approach.100%SA2074A90%Component Percentage80%70%60%50%40%30%20%10%0%01-10-9030-03-9126-09-9124-03-9220-09-9219-03-9315-09-93DateSim Cpt 1 Sim Cpt 2 Sim Cpt 3 Sim Cpt 4 Sim Cpt 5 Sim Cpt 6 Sim Cpt 7Data Cpt 1 Data Cpt 2 Data Cpt 3 Data Cpt 4 Data Cpt 5 Data Cpt 6 Data Cpt 7Figure 6-20. Example Comparison of Simulated and Measured Geochemcial End-memberbreakthrough using updated endmembers, initial condition interpolation, and pathway analysis.14-03-9410-09-9409-03-9505-09-9503-03-9630-08-9626-02-97163
Redox experiment in detailed scale (REX)ObjectiveThe main objective of the REX projects is to investigate dissolved molecular oxygenconsumption by creating a controlled oxidizing perturbation to the deep rock environmentat the Äspö Hard Rock Laboratory which is representative of a deep repositoryenvironment /Puigdomenech et al, 2001/.The specific objectives are:1. Assess the capacity of the host rock system to buffer against an oxidising disturbance.2. Determine the kinetics (half-life) of oxygen consumption.3. Apply quantitative descriptions of these processes that can be used in performanceassessment of the repository redox stability for the post-closure phase.REX international seminarThe REX project conducted by <strong>SKB</strong> and cofinanced by JNC and ANDRA, consists ofdiffernent of experiments, the in-situ experiment was carried out in the Äspö Hard RockLaboratory whereas surface laboratory experiments were conducted by the universities ofGoteberg and Bradford, by the British Geological Survey and French CEA.The purpose of the REX international seminar is to present the outcome of the entireproject and to put the findings in perspective of redox conditions of importance toperformance and safety assessment for disposal of radioactive waste in deep geologicalformations. The seminar was held in JNC Oarai engineering center on 6–9 November2000.Prototype Repository ProjectJNC participated in the Prototype Repository Project (PRP) during 2000. JNC participatedin Work packages of Emplacement of bentonite buffer, disposal of canister withheaters, backfilling of bentonite, THM modeling of buffer, backfill and interaction withnear-field rock, and C modeling of buffer, backfill and groundwater.Emplacement of bentonite buffer, disposal of canister with heaters,backfilling of bentoniteBackgroundJNC has performed some engineered barrier experiments. Regarding laboratory experiments,“COUPLE” and “BIG-BEN” had performed in JNC Tokai works. COUPLEwas the small scale experiment /Amemiya et al, 2000/ and BIG-BEN was the full scaleexperiment /Chijimatsu et al, 2000a/. On the other hand, regarding in-situ experiment,Kamaishi engineered barrier experiments had performed in Kamaishi in-situ experimentsite. Kamaishi experiments had two experiments that were the small scale experiment/PNC, 1994/ and the full scale one /Chijimatsu et al, 2000b/. In these experiments, JNChas used various types of sensors to measure the THM phenomena in and around theengineered barrier system (EBS). JNC has a wealth of experience and knowledge forapplicability of the measurement techniques. It is considered that this information,which JNC has, is useful to the PRP.164
ObjectivesJNC review the sensor layout in the borehole, and provide the useful information aboutthe application of the sensors to the PRP to obtain the useful experimental data in thePRP.ResultsJNC reviewed the report on instrumentation of buffer and backfill for measuring THMprocesses. This report described the sensor layout plan, JNC has responded to the reportwith some comments.Humidity sensorsAt Kamaishi experiments, 40 psychrometers (PST-55, WESCOR,) and 11 humiditysensors (HMP 233H, VAISALA) were buried in buffer /Sugita et al, 1997/. Every sensorwas no armed type. After 260 days heating and 190 days cooling, 9 psychrometers and4 humidity sensors were out of order.As for psychrometer, 5 were damaged before heating, 3 during the heating (drying)phase, and 1 during wetting. Psychrometer had 2 thermocouples (TC), one was used fortemperature measurement, the other was for cooling by the Peltier effect. The formerTCs were protected enough during THM test. But, 3 of 5 sensors which damagedbefore heating, were damaged not only the TC for cooling, but also TC temperaturemeasurement.As for HMP233H, one was damaged before heating test, 3 were during the dryingphase.Psychrometer (PST-55) and HMP 233H have disadvantage for durability compared withother sensors of PRP. But without initial damages, 88% of PST-55 and 70% of HMP233H worked fairly well for 450 days.As for psychrometer, almost damages occurred during drying phase. Main reason wasthat the vapor movement in buffer might attack the TC for cooling. The measurementof backfill saturation by psychrometer as shown in the plan of PRP is reasonable.At Kamaishi experiments, two types of humidity sensor, PST-55 and HMP 233H, wereset in separate location, so we could not compare the data acquired by different way.It is important that different type sensors set at same condition in order to compare orexamine the accuracy of each measuring method.ThermocoupleThe target measurement region of temperature is significant to select sensor. In thePRP, the target temperature will be up to 120 degrees centigrade. T type thermocouplesensor has adequate measuring range. E type and K type have too wide measuring range.In Kamaishi experiment, all K type thermocouple had drift of measurement data. T typehad measured good data.165
Report on instrumentation of buffer and backfill for measuring THM processesIn the PRP, measurement data will be used for analysis by some numerical codes. Forthe validation of the numerical codes, the detail and dense measurement data are needed.Regarding the sensor positions in a deposition hole, the proposed sensor layout had nosensor at the edge of the bottom end of the deposition hole. JNC suggested that thedata of temperature, at the least, is necessary to obtain the boundary condition. Aroundthe heater, the contour map of water content may be high density, therefore, denseemplacement of water content sensor could monitor the complec distribution of watercontent in the buffer well.Regarding sensor positions of the cross section between the deposition hode sections inthe tunnel, the proposed sensor layout had no sensor in the interface between side rocksurface and the buffer. JNC suggested that the data of temperature, at the least, is necessaryto obtain the boundary condition.THM modeling of buffer, backfill and interaction with near-field rockBackgroundJNC has validated the coupled THM analysis numerical code “THAMES”. THAMESwas originally developed by Professor Ohnishi, Kyoto University /Ohnishi et al, 1985/.JNC has validated the THAMES with Hazama Corporation and Kyoto University.THAMES was applied to the simulation of the coupled THM phenomena in andaround the EBS in the second progress report on research and development for thegeological disposal of HLW in Japan.ObjectivesThe main objective is to predict THM processes in and around the EBS by applyingexisting models, and to compare the prediction with the obtained data. This will demonstratethe validity of the existing model and the capacity of numerical modeling of theperformance of the bentonite buffer and the backfill.ResultsNumerical analysis code THAMES1) Analysis objective.Analysis of the coupled thermal, hydraulic and mechanical process is carried out with thecomputer code named THAMES. THAMES is a finite element code for analysis ofcoupled thermal, hydraulic and mechanical behaviors of a saturated-unsaturated medium.THAMES is extended to take account of the behavior in the buffer materials such as thewater flow due to thermal gradient and the swelling phenomena. The unknown variablesare total pressure, displacement vector and temperature. The quadratic shape function isused for the displacements and linear one is used for total pressure and temperature.2) Governing equations of coupled T-H-M process.The mathematical formulation for the model utilizes Biot’s theory, with the Duhamel-Neuman’s form of Hooke’s law, and energy balance equation. The governing equationsare derived with the fully coupled thermal, hydraulic and mechanical relationships.166
2.1) Governing equations of original THAMES.The governing equations of original code are derived under the following assumptions:(a) The medium is poro-elastic.(b) Darcy’s law is valid for the flow of water through a saturated-unsaturated medium.(c) Heat flow occurs only in solid and liquid phases. The phase change of water fromliquid to vapor is not considered.(d) Heat transfer among three phases (solid, liquid and gas) is disregarded.(e) Fourier’s law holds for heat flux.(f)Water density varies depending upon temperature and the pressure of water.Governing equations for a coupled thermal, hydraulic and mechanical problem proposedby Ohnishi et al (1985) are shown in equation (1) to (3). This model was verified withthe available analytical and experimental results. These equations are used by means of atotal head expression such as,⎡1⎢C⎣2ijkl⎤( u u ) − ( T −T) + χδ ρ gψ+ ρ b 0βδ (1)k , l+l,k ij o ij f ⎥ s i=⎦,j∂uρf ij , j=, i fo r f Pff rfo r T(2)∂t∂ψ∂t∂t∂t∂h∂θ∂h, i∂T{ k( θ ) h } − ρ nS ρ gβ− ρ − ρ Si+ ρ nS β 0∂T( ρCv) + nSrρfCmvfVT∂tβT1− nSrTk, iiβ 2Pfi , i− KTm , ii∂∂t( θ ) h + ( 1−n) βT( u + u ) = 0Ti,jj,i(3)2.2) Governing equations of extended coupled T-H-M model for buffer material(Chijimatsu et al, 2000c).The behavior of the buffer material is influenced by the interdependence of thermal,hydraulic and mechanical phenomena. To treat the water/vapor movement and heatinduced water movement, the continuity equation used in the extended THAMES codeis as follows;2⎧⎫⎨ ξρ ∂θρlgKlD( h,i−z,i) + ( 1−ξ) h,i ⎬ + { ρ D T,},⎩θ l T i i∂ψµl ⎭∂h∂θ∂h∂ui,i ∂T− ρlonSrρlgβP− ρl− ρlSr+ ρlonSrβT= 0(4)∂t∂ψ∂t∂t∂t167
where D θ is the isothermal water diffusivity, θ is the volumetric water content, ψ is thewater potential head and K is the intrinsic permeability. The symbol ξ is the unsaturatedparameter so that ξ =0 at the saturated zone, ξ =1 at the unsaturated zone. The symbolµ l is the viscosity of water, ρ l is the density of water, g is the gravitational acceleration.D T is the thermal water diffusivity, n is the porosity, S r is the degree of saturation, β P isthe compressibility of water, β T the thermal expansion coefficient of water and z is theelevation head. u i is the displacement vector, T is temperature, h is the total head andt is time. The subscript 0 means the reference state. This equation means that the waterflow in the unsaturated zone is expressed by the diffusion equation and in the saturatedzone by the Darcy’s law.The energy conservation equation has to treat the energy change by evaporation.The equation is given as,∂Tv m∂tr lβ ⎧T∂θ+ nSrT⎨ξDθβP ⎩ ∂ψ1 ∂+2 ∂t( ρC) + nS ρ C V T,−KT,+ L D ( h,−z,)( h,−z,) + ( 1−ξ)( 1−n) βT( u + u ) δ 0vlliii, j j,i ij=iiTmii⎧⎨⎩θv∂θ∂ψρ⎫lgKh,i+ DTT,i ⎬,µl⎭ii⎫⎬,⎭ii(5)where (ρC ν ) m is the specific heat of the material consisting of water and the soil particles,C vl is the specific heat of water, V li is the velocity vector of water, K Tm is the thermalconductivity of consisting of water and the solid particles, L is the latent heat of vaporizationper unit volume and D θv is the vapor diffusivity.The equilibrium equation has to take the swelling behavior into account.⎡1⎢C⎣2ijkl⎤( u u ) − F − βδ ( T −T) + χδ ρ g( h − z) + ρb0πδ ⎥(6)⎦k , l+l,kij ij o ij li=where C ijkl is the elastic matrix, ρ is the density of the medium and b i is the body force.χ is the parameter for the effective stress, χ =0 at the unsaturated zone, χ =1 at thesaturated zone. The symbol F is the coefficient relating to the swelling pressure processand β = (3λ + 2µ) α s , where λ and µ are Lame’s constants and α s is the thermal expansioncoefficient.The swelling pressure π can be assumed to be the function of water potential head (ψ) asfollows;θ1∂ψπ ( θ1 ) = ρlg( ∆ψ) = ρlg( ψ ( θ1) −ψ( θ0)) = ρlg∫ dθ(7)θo∂ θwhere θ 0 is the volumetric water content at the initial state. This is based on the theorythat swelling pressure is equivalent to the water potential.168
3) Numerical techniques.The Galerkin type finite element technique is employed to formulate a finite elementdiscretization. In order to obtain stable solution, linear isoparametric elements are usedto represent the behavior of total head h and temperature T. Quadratic isoparametricelements are used to express displacement u i . In order to integrate time derivatives,a time weighting factor is introduced, and thus, any type of finite difference scheme maybe applied.4) Validation of THM model THAMES.JNC has performed some EBS experiments. The results of those experiments are usedto validate the analysis code THAMES. Regarding fundamental behavior, especially theexpression of the hydraulic behavior of the buffer is complex problem. JNC has performedpressurized infiltration test. From the comparison between the measured dataand the analysis, it is clarified that THAMES can evaluate the infiltration phenomena atboth the atmospheric pressure and the pressurized condition /Chijimatsu et al, 2000c/.A two-dimensional axisymmetric model is used to analyze the BIG-BEN experiment.THAMES can explain the distribution of temperature and water content well. InTHAMES, the calculated swelling pressure depends on the change of the water potential.The water contents can be represented well by the numerical calculation. However,regarding swelling behavior, THAMES can not explain transient situation well. Therefore,the other factors in the mechanism of the swelling pressure may exist. And furthermore,relation between water potential and water content is important for the swellingpressure simulation by THAMES.Applicability of the coupled thermo-hydro-mechanical model was also validated withdata under the actual rock mass conditions that were obtained from a coupled thermohydro-mechanicalexperiment at the in-situ test site of the Kamaishi Mine /Chijimatsuet al, 1999a/. Those results of experiments have been compared with results of analysesconducted with the coupled thermo-hydro-mechanical model /Chijimatsu et al, 1999b/.The calculated temperature rise closely matches with measured results. The calculatedwater content change is also similar to the measured results. The measured water contentat the point 150 mm from the heater (middle part) increases at first and then goesdown. It is considered that the buffer at the middle part is wetted at first, and as timepassed, this portion of the buffer begins to dry because water moves further from theheater. This phenomenon cannot be simulated in this analysis. The calculated watermovement is smoother than that of measured one. It is considered that the reason of thisdiscrepancy is due to use of inappropriate property of the thermal water diffusivity, i.e.,the thermal water diffusivity should be a function of water content because the decreasingof water content near heater due to thermal effect is simulated well. However,simulation results agree well with measured results as whole, and it is believed thatthe developed models can be applied in an assessment of the coupled thermo-hydromechanicalphenomena.Preliminary analysis of PRPJNC has prepared the preliminary analysis of PRP. Preliminary analysis is 2 dimensionalaxial-symmetrical analysis. Figure 6-21 shows the analysis model for preliminary analysis.Figure 6-22 shows the finite element mesh for analysis. The upper and bottom boundaryconditions are constant temperature and constant water pressure. The side boundarycondition is adiabatic condition and no flux. All boundaries are fixed.169
Figure 6-21. Analysis for model for preliminary analysis.Figure 6-22. Finite element mesh.170
Figure 6-23. Analysis step.JNC showed the analysis step for the preliminary analysis in the Modeling MeetingWP3 in Lund in Sweden. Figure 6-23 shows the analysis step. In the Case1, the gapbetween bentonite block and rock mass in the test pit is filled with bentonite block. Inthe Case2, the gap remains. In Case3, the gap is filled with the pellets and air. Theexpected saturation behaviors in the test pit are shown in Figure 6-23, too. We thinkthat the Case1 will cover the expected saturation behaviors in the test pit.C modeling of buffer, backfill and groundwaterBackgroundChemical processes are one of the significant processes for assessing the migration ofnuclides of HLW in performance assessment (PA). JNC considers that THM analysishas to be evolved to THMC analysis. However, chemical processes are not simple. Wehave to select the significant chemical processes to consider. We also need the databasefor the selected chemical processes. Therefore, JNC has just started the studies forchemical processes for THMC.ObjectivesTo clarify the main chemical processes for performance assessment in HLW.ResultsJNC has just started the validation of THAMES to add the function for consideringchemical processes. During 2000, JNC has discussed the concept for adding the function(see Figure 6-24). THC processes have been studied by some organizations. For example,the changes of porosity were key issues. Lawrence Livermore National Laboratory171
Figure 6-24. Outline of coupled THMC processes.in USA (LLNL) showed one example of THC analysis /Glassley, 2000/. In this analysis,they showed the appearance of low porosity area over the HLW in host rock. In 2001,JNC will start the progress for adding the chemical processes.6.2.4 BMWiBackgroundIn addition to the German research activities related to final disposal of radioactive wastein rock salt, the objective of the cooperation in the Äspö HRL programme is to completethe knowledge on other potential host rock formations for radioactive waste repositories.The work comprises investigations on two-phase flow, groundwater flow andsolute transport, geochemistry, and on developing and testing of instrumentation andmethods for underground rock characterization. Six research institutions are performingthe work on behalf of BMWi: BGR, FZK, FZR, GRS, Technical University Clausthal,and University Stuttgart.Two-phase and groundwater flowTwo-phase flow investigationsThe two-phase flow project carried out by BGR and GRS during the past years wascompleted. During the first half of year 2000, the final experiment with tracers in thewater phase and in the gas phase was conducted. The equipment is shown schematicallyin Figure 6-25. The final report is due to be concluded in 2001.172
Column filled with backfill (30/70)HO gasfreeWater injectionGas and waterextractionBurettePressure vesselwith waterN 2O 2Pressure sensorsTemperature sensorsHeated wireGas injectionFigure 6-25. Non-isothermal two-phase flow test equipment.In co-operation with KTH, University Stuttgart started a project with the aim to furtherimprove the numerical tools for calculating gas-water flow in fractured and porousmedia. The objectives are to further develop the methods for describing two-phase flowprocesses in single fractures and to develop up-scaling methods for transferring theconstitutive relations from microscale to macroscale. Furthermore, data from the ÄspöHRL are used to generate geostatistical models. During the first half-year of the projectduration, determination of up-scaling parameters and constitutive relationships for localheterogeneities have been initiated. In order to evaluate whether gas migration is dominatedon different scales by main flow paths, the upscaled parameters will be applied tofractured systems.Task Force on modelling of groundwater flow and transport of solutesBGR continued the activities in the Task Force on Modelling of Groundwater Flow andTransport of Solutes by modelling and interpreting the behaviour of radioactive andsorbing tracers in the TRUE test field (Task #4E/F). The results are summarized in theReport “Modelling Reactive Radioactive and Sorbing Tracer Tests in Fractured Rock”.In Task #5, Hydrogeological and Hydrochemical Modelling, a flow and transport modelwith 14 intersecting fracture zones was developed and used to calculate changes in flowvelocity and concentration gradients resulting from tunnel construction.Actinide migrationThe FZK/INE investigations are focusing on sorption and migration of radionuclides,especially actinides, in fractured rock. To guarantee as realistic conditions as possible, theexperiments are designed to be compatible with those carried out in the CHEMLAB IIprobe.173
ObjectivesThe objectives of the experiments to:• to investigate the applicability of radionuclide retention coefficients measured inlaboratory batch experiments for in situ conditions,• to validate the radionuclide retardation measured in laboratories by data from in situexperiments in rock,• to demonstrate reliability and correctness of laboratory data under conditionsprevailing in the natural rock,• to reduce uncertainties in the retardation properties and the governing processes foramericium, neptunium and plutonium.Experimental ConceptIn a first step, the experimental set-up was designed and some preliminary sorptionexperiments with fracture filling material and granite, respectively, and with groundwaterfrom the area of CHEMLAB II were conducted in the laboratory at INE. To run themigration experiments in CHEMLAB II, a drill core sample with a fracture is placed inan autoclave. Core samples with a continuous fracture are chosen and placed in a sleeveof stainless steel. The periphery is filled with epoxy resin. The top and the bottom endsare closed with acrylic glass covers sealed relative to the stainless steel sleeve with ano-ring. The lids are equipped with bores for feeding and extracting groundwater lines.The tightness of the autoclaves was tested in laboratory experiments, indicating leaktightnessup to 60 bar of groundwater pressure. Since the fluid pressure in CHEMLABII is about 27 bar, no leakage of the autoclaves is to be expected under in situ conditions.A total of three autoclaves of appropriate dimensions were prepared from the coresamples available and can now be used for laboratory and in situ experiments.In order to evaluate actinide breakthrough through the fractured rock samples andactinide recovery as a function of the eluted groundwater volume, the hydraulic propertiesof fractured rock samples are investigated at INE. HTO is used as inert tracer;dependences of the breakthrough from the applied flow rates are recorded.At Äspö HRL an inert gas glovebox was installed close to the CHEMLAB II drillhole(Figure 6-26). Tubing from the core in the CHEMLAB probe ends in the glovebox. Thebox contains a sample collector and a balance for recording the breakthrough as well asadditional equipment required for groundwater sample preparations.Based on geochemical model calculations, actinide tracer cocktails are prepared accordingto the maximum solubilities of the actinides. The isotopes Pu-244, Am-243, andNp-237 are chosen due to their long half-lives and low specific activity. In order toapply in the migration experiments cocktails with a composition corresponding to thenatural groundwater, the cocktails are prepared using groundwater from Äspö HRL.The long-lived actinide concentrations in the “ÄSPÖ cocktail” are as follows:Pu-244Am-243Np-237approx. 1x10 –8 mol/lapprox. 1x10 –6 mol/l in laboratory, 1x10 –8 mol/l at Äspöapprox. 1x10 –5 mol/lTotal α-activity of the cocktail amounts to 1.8x10 4 Bq/l.174
Figure 6-26. INE glovebox installed in a container close to CHEMLAB II drillhole (right).ResultsLaboratory migration experimentsOne autoclave with embedded drill core was used in laboratory actinide migration testsapplying the same conditions as expected in the Äspö HRL. The measured effective porevolume of the fracture in the drill core was 1 ml.By use of a calibrated sample loop, the actinide cocktail having a pH = 7 was injected.The flow rate was 0.3 ml/h (7.2 ml/day). Eluted groundwater was collected in samplesof 1.5 ml. These samples were filtrated (450 nm) and analyzed due to the total α-activityby Liquid Scintillation Counting (LSC). By means of a-spectroscopy, Np-237 andAm-243 were distinguished. The total Am-243 concentration of eluted water was 1x10 –11mol/l. Np recovery was 26% of the injected quantity (Figure 6-27). The breakthroughcurve was determined from the mass of the groundwater samples and the measuredactivity (concentrations). The eluted groundwater volume in this experiment amountedto 60 to 80 ml.The measured pH value in the eluted water was similar to that in the injected water, theEh was +20 mV. Additional experiments showed significantly lower Np concentration inthe eluted water. However, in some experiments the measured Eh was in the range of–200 mV. This finding is related to the limited redox buffer capacity of the groundwater.These findings support the hypothesis that Np(V) is reduced to Np(IV) on the innersurfaces of the rock sample and subsequently is sorbed.175
5040Np237Injection 14 ml Cocktail, 0,3 ml/hrecovery Np-237 26 %Activity (Bq/ml)30201000 10 20 30 40 50 60 70 80 90 100Eluate (ml)Figure 6-27. Np-237 breakthrough curve measured in the first INE experiment.In situ migration experimentAfter installation of the glovebox, test runs were performed. The first in situ actinidemigration experiment was started in Äspö HRL in October 2000. A 100 ml reservoircontaining the actinide cocktail was inserted into the CHEMLAB II probe. In order tohave an online test method for controlling the experiment, in addition to the actinidesthe cocktail was spiked with HTO. CHEMLAB II was equipped with the drill coreautoclave and the reservoir at BASELAB laboratory. It was put in place, coupled to theglove box and a test run was performed for 5 days. After successful operation, a volumeof 15 ml of actinide cocktail from the reservoir was injected into the fractured rocksample at a flow rate of 0.3 ml/h. Injection of this volume required 50 hours, afterwardsnatural groundwater was pumped for another 5 days at constant flowrate. After thisperiod, it was intended to increase the flowrate. However, due to a technical defect ofthe CHEMLAB II probe the experiment had to be interrupted. The eluted groundwatersamples were transferred to INE. Breakthrough curves for the HTO tracer and for thetotal a-activity are shown in Figure 6-28.The measured pH in the eluted samples was pH = 7, Eh ranged from +30 to –60 mV.Figure 6-28 shows the measured activity in the eluted samples after filtration by 450 nmfilters. ICP-MS measurements resulted in Am-243 and Pu-244 concentrations below thedetection limit of 1x10 –12 mol/l. These findings indicate that only Np-237 contributes tothe measured α-concentration. This result is equivalent to the results obtained from thefirst laboratory migration experiment. Np-237 recovery was computed to be 40% of theinjected quantity.176
Activity (Bq/ml)10090807060504030201000HTONp237Injection 14 ml Cocktail, 0,3 ml/hrecovery Np-237 40%10 20 30 40 50 60 70 80 90 100Eluate (ml)Figure 6-28. Breakthrough curves for tritiated water and total a concentration from the first insitu CHEMLAB actinide migration experiment.To determine the profiles of the sorbed actinides along the fractures of the drill core, thefracture will be conserved by epoxy resin, cut in slices and analyzed chemically as well asby laser ablation techniques. These techniques are under preparation at present.TUC concluded the investigations addressing 1) mobilization and immobilization ofselected trace elements in different granitic rocks and fluids and 2) mobilization behaviourof Uranium and Thorium as a natural analogue for the mobility of actinides ingranitic rocks. Final Reports will be issued in 2001.A new project was started by TUC in which the mobility of short-lived U-238 decayproducts (U-234 and Th-230) in alterated fracture fillings in the past is used as a naturalanalogon for assessing actinide migration in the future. The investigations are based onthe following idea: Within the Äspö-granitoids, secondary calcites occur as some millionyears old fracture-fillings. U is fixed in these calcites in low concentrations (usually
6.2.5 GRSGRS will conduct electrical resistivity measurements in the Prototype Repository Projectin boreholes and backfilled tunnel sections. The aim is to investigate time-dependentchanges of water content in the buffer, the backfill, and in the EDZ. In these investigationsadvantage is taken of the dependence of the electrical resistivity in rocks on watercontent, porosity, and pore fluid resistivity. In order to correlate the measured resistivitywith the water content, the field measurements will be accompanied by laboratory tests.In the year 2000, in cooperation with <strong>SKB</strong> the measuring programme was finalized. Theprogramme includes the installation of two electrode rings in the backfilled drift abovethe deposition boreholes, four electrode chains at the top of deposition borehole #5 andthree electrode chains between deposition boreholes #5 and #6 (Figure 6-29).Special pressure-watertight cables and connectors have been ordered for connecting theelectrodes to the geoelectrical measuring system which will be installed in the parallelrunning G-tunnel.Laboratory tests have been started aimed at providing relations between resistivity andsolution content of granite, buffer, and backfill. These relations are needed for interpretationof the resistivity data in terms of water or solution content, respectively. Resultsare already available for granitic rock from earlier investigations. The results of thebuffer tests obtained so far indicate most significant resistivity changes between watercontents of 11 and 16 wt %. At higher water contents only comparatively small changeswere measured. Calibration measurements on the backfill material will be performedduring the coming months.40 m 25 mSection ISection II5 m8 mBackfillCanisterBuffer18 m 6 mring with 36 electrodeschain with 30 electrodes4 chains with 8 electrodes each around top of borehole #5Figure 6-29. Arrangement of electrodes in the Prototype Repository.178
Percolation of one sample of compacted bentonite is being continued. At present a totalof about 180 g solution has percolated the sample which corresponds to about 60 timesthe initial pore volume. During the entire experiment, sulfate was released from thesample which may be accounted for by the oxidation of pyrite. The concentrations ofMg and Ca exceed those of the initial solution (Figure 6-30 and Figure 6-31). Thisfinding can be interpreted as a result of two coupled processes: (i) dissolution of accessoriesin MX-80 and (ii) cation exchange. In the initial phase, Mg and Ca is taken up bycation exchange, and therefore the respective concentrations decrease. On the otherhand, Mg and Ca release exceeds their decrease due to cation exchange and their concentrationis increasing. We expect a plateau after some time which would indicate astate of stationary equlibrium between inflowing solution and mineral dissolution.The observed solution compositions do not indicate significant changes in pore fluidresistivity during migration of formation water through the buffer material. Therefore,interpretation of the in situ measured resistivity data will be easier. However, this statementneeds still to be confirmed by separate conductivity measurements in artificiallyprepared solutions with compositions similar to those observed during the percolationexperiment.Since resistivity measurements will be performed in the surroundings of the heateddeposition boreholes at elevated temperatures, alteration of the formation water conductivityis determined in the temperature range between 15 and 70°C. An increase ofelectrical conductivity with increasing temperature is expected which may affect themeasurement results especially in the buffer where only small resistivity changes willoccur.2520KMgCaK, Mg, Ca [mmol/l]1510500 50 100 150 200Percolated Solution [g]Figure 6-30. K, Mg, and Ca-concentration during the percolation experiment.179
120100Cl, SO4 [mmol/l]806040ClSO42000 50 100 150 200Percolated Solution [g]Figure 6-31. Cl and SO4-concentration during the percolation experiment (Cl-concentrations werecalculated from electrical balancing).6.2.6 USDOE/SandiaThe working agreement between Sandia National Laboratories and <strong>SKB</strong> in support ofthe contract to <strong>SKB</strong> from the U.S. DOE includes three separate tasks. These tasks are:1) Validation of the multirate model using results from the TRUE-1 tracer tests conductedat the Äspö underground research laboratory. 2) Experimental visualization ofmass-transfer processes in low porosity rock. 3) Numerical experiments to understandthe scaling of parameters defining mass-transfer from the tracer test scale up to theperformance assessment scale. Work on all three of these tasks was conducted in calendaryear 2000. A summary of the work conducted on each task is provided below.Sandia National Laboratories joined the Äspö task force in September of 1998 in orderto be involved with the TRUE-1 tracer test planning and evaluation. Sandia NationalLaboratories hosted the February, 2000 Äspö Task Force meeting in Carlsbad, NewMexico from the 7 th to the 11 th . A total of 35 participants from 8 different countriesattended the meetings. In addition to the technical presentations on Tasks 4 and 5,highlights of the meetings included a tour of Carlsbad Caverns and an underground tourof the WIPP site. The second task force meeting of 2000 was held in Säro, Sweden inNovember and was attended by Sean A. McKenna from SNL.180
Task 1The objective of Task 1 is to validate the multirate mass-transport model developed atWIPP in a vastly different geologic environment. Previous work on Task 1 was comprisedof the estimation of the STT-1 and STT-1b tracer tests from the TRUE-1 programme.These estimations provided familiarity with the TRUE-1 data and experiencewith using the multirate model to estimate those data. Prior to 2000, a blind predictionof the STT-2 data was also made. In 2000, estimation of the STT-2 data was the primarygoal of Task 1. Preliminary estimation of these data were presented at the ÄspöTask Force meeting held in Carlsbad, New Mexico in February. The STT-2 data aresignificantly different than the STT-1 and STT-1b data in that two separate transportpathways are evident in the breakthrough curve data. The preliminary estimates of theSTT-2 data presented in Carlsbad used a single pathway model to try and represent theobserved breakthrough curves. After the Äspö task force meeting, additional work wasdone to develop a two-path estimation procedure. Results of this two-path estimationprocedure were presented at the American Geophysical Union, Western PacificGeophysical meeting in June in Tokyo, Japan. Figure 6-32, shows results of thistwo-path estimation procedure.1e+51e+4Activity (Bq/kg)1e+3ObservedPath 1Path 2Sum1e+21e+4 1e+5 1e+6Time (s)Figure 6-32. Double transport pathway model fit to the HTO data from tracer test STT-2. Thefinal fit to the data is the sum of the two different pathways.181
Task 2The objective of Task 2 is to develop new techniques for the visualization ofmass-transfer processes in low porosity rock. In 2000, visualization of mass-transferprocesses in the Äspö diortie was focussed on determining the potential of X-ray microtomographyas an imaging tool. Preliminary testing was done to determine the viabilityof micro-tomographic analysis of approximately 1cm diameter rock cores. X-ray beamintensity was varied to observe differences in contrast between two tracers: potasiumiodide (KI) and cesium (Cs).Four different X-ray intensities were used to look at tracer behavior below and above thepotassium iodide and cesium absorption edges. An absorption edge is the energy level atwhich X-ray absorption reaches a maximum for a particular element or compound. Thelower energy boundary tends to be quite sharp while above this boundary the boundaryabsorption decreases more slowly with increasing x-ray energy. We sought to maximizethe visibility of the tracer, with higher absorption, while maintaining detail within therock matrix. Experimentally determined edges were 33.675 KeV and 36.55 Kev for KIand Cs, respectively. Micor-tomographic scans of a single rock core at energies of 33.65KeV, 33.69 Kev, 36.53 KeV, and 36.59 KeV were used to bracket the absorption edge.Preliminary inspection of the data found we were not getting adequate x-ray transmissionthrough the rock cores in zones containing fault gouge, a region of interest forobserving liquid transport. So we increased the beam energy. Initial results suggest thata beam energy of 45 KeV, above the Cs absorption edge, produced better image dataoverall. The higher energy provided good contrast in undisturbed native rock whilemaximizing the signal to noise ratio in the fault gouge. This also suggests Cs would bebetter than KI as a tracer, providing more beam attenuation.ABCGranodiorite fromKamaishi Mine, JapanSheer-zone material fromGrimsel test site,SwitzerlandDiorite from ÄspöUndergroundLaboratory, SwedenFigure 6-33. Two-dimensional slices taken from three-dimensional images obtained nondestructivelyusing synchrotron source microtomography at the Advanced Photon Source at Argonne NationalLaboratory. The images demonstrate how the technique can be used to A) differentiate mafic fromfelsic minerals, B) visualize and be used to quantify pore space, and C) focus on different tracers andhow tracers can be used to enhance the visualization of pore space.182
Task 3Work on Task 3 in 2000 was focussed on the comparison of performance assessmentscale transport calculations done at <strong>SKB</strong> using the FARF-31 transport code and transportcalculations over the same scale done with the multirate transport code, STAMMT-L,developed at Sandia National Laboratories for use on the WIPP project. For both codes,parameters estimated from the STT-1 tracer tests (Task 1) are used as the basis forcomparison. Comparison of the results is ongoing at this time and is focussed on thedifferences in how the two different models represent the diffusive capacity within therock. TheFARF-31 results demonstrate infinite diffusive capacity, even at PA time scales,while the STAMMT-L results show a large fraction of the capacity coming to equilibriumwith the fracture concentrations. Results of an initial comparison between the twomodels are shown in Figure 6-34.1e+61e+51e+4Activity Rate (Bq/yr)1e+31e+21e+11e+01e-11e-21e-3FARF-31 ResultsSTAMMT-L Estimation1e+11 1e+12 1e+13Time (secs)Figure 6-34. Estimation of the Single-Rate FARF-31 performance assessment results using themultirate model STAMMT-L.183
ReferencesAmemiya K, Chijimatsu M, Sugita Y, 2000. Laboratory-scale Laboratory Test onCoupled Thermo-Hydro-Mechanical Processes in the Near Field, International Workshopon Geomechanics, Hydromechanical and Thermo-hydro-mechanical Behavior ofDeep Argillaceous Rocks: Theory and Experiment.Andersson P, Ludvigson J-E, Wass E, Holmqvist M, 2000a. True block scale tracertest stage, interference tests, dilution tests and tracer tests, phase A, final draft report.<strong>SKB</strong> IPR-00-28. Svensk Kärnbränslehantering AB.Andersson P, Wass E, Holmqvist M, 2000b. True block scale tracer test stage,tracer tests phase B, first draft report.<strong>SKB</strong> IPR-00-29. Svensk Kärnbränslehantering AB.Banwart S et al, 1996. Organic carbon oxidatin induced by large-scale shallow waterintrusion into a vertical fracture zone at the Äspö Hard Rock Laboratory (Sweden).J. Contaminant Hydrol., 21, p. 115–125.Banwart S, Wikberg P, Puigdomenech I, 1999. Chemical Containment of Waste inthe Geosphere (R Metcalfe and C A Rochelle, eds).Special Publication Vol. 157, Geological Society, London, pp. 85–99.Bateman K, West J, Aoki K, Yoshida H, Coombs P, Gillespie M R, Henney P,Reeder S, Milodowski A E, 1998. Min. Mag. 62A, 124–125.Bateman K, Coombs P, Hama K, Hards V.L, Milodowski A E, West J M, WettonP D, Yoshida H, 1999. in Proc. 9th V M Goldschmidt Conference, LPI ContributionNr. 971, Luna & Planetary Institute, Houston, Texas, pp. 20–21Bradbury M H, Baeyens B, 1995. A quantitative mechanistic description of Ni, Znand Ca sorption on Na-montmorillonite, Part III, Modelling.Nagra NTB 95-06, 1995.Byegård et al, 1999: LTDE Test Plan.<strong>SKB</strong> IPR-99-36. Svensk Kärnbränslehantering AB.Bäckblom G, Olsson O, 1994. Programme for tracer retention understandingexperiments.<strong>SKB</strong> PR 25-94-24. Svensk Kärnbränslehantering AB.Chijimatsu M, Sugita Y, Fujita T, Amemiya K, 1999a. Coupled Thermo-Hydro-Mechanical Experiment at Kamaishi Mine, Technical Note 15-99-02, ExperimentalResults, Japan Nuclear Cycle Development Institute (JNC).Chijimatsu M, Fujita T, Kobayashi A, 1999b. Coupled Thermo-Hydro-MechanicalExperiment at Kamaishi Mine, Technical Note 16-99-03, Analyses of Task 2C,DECOVALEX II, Japan Nuclear Cycle Development Institute (JNC).185
Chijimatsu, M., Fujita, T., Kobayashi, A., Nakano, M, 2000a. Experiment andValidation of Numerical Simulation of Coupled Thermal, Hydraulic and MechanicalBehaviour in the Engineered Buffer Materials, International Journal for Numerical andAnalytical Methods in Geomechanics, 2000, 24, pp. 403–424.Chijimatsu M, Fujita T, Sugita Y, Amemiya K, Kobayashi A, 2000b. In-situ CoupledThermo-Hydro-Mechanical Experiment at Kamaishi Mine, GeoEng2000 – An internationalconference on Geotechnical & Geological Engineering.Chijimatsu M, Fujita T, Sugita Y, Taniguchi W, 2000c. Evaluation of CoupledThermo-Hydro-Mechanical Phenomena in the Near Field for Geological Disposal ofHigh-Level Radioactive Waste, JNC TN8400 2000-008, Japan Nuclear Cycle DevelopmentInstitute.Cui D, Eriksen T E, 1996a. On the Reduction of Pertechnetate by Ferrous Iron inSolution, Influence of Sorbed and Precipitated Fe(II), Env. Sci. & Tech., Vol. 30, No. 7,pp. 2259–2262.Cui D, Eriksen T E, 1996b. Reduction of Pertechnetate in Solution by HeterogeneousElectron Transfer from Fe(II)-Containing Geological Material. Env. Sci. & Tech., Vol.30, No. 7, pp. 2263–2269.Cvetkovic V, Selroos J-O, Chen H, 1999. Transport of reactive tracers in rockfractures. Submitted to J. of Fluid Mechanics, v. 318, pp. 335–356.Cvetkovic et al, 2000. Modelling of TRUE-1 tests.<strong>SKB</strong> ICR-00-01. Svensk Kärnbränslehantering AB.Elert M, Svensson H, 2001. Evaluation of modelling of the TRUE-1 radiallyconverging tests with sorbing tracers.Eriksen T E, Jacobsson A, 1981. Ion diffusion in compacted Na and Ca bentonitesKBS Tech. Rep. 81-12.Eriksen T E, Jansson M, 1996. Diffusion of I – , Cs + and Sr 2+ in compacted bentonite –Anion exclusion and surface diffusion.<strong>SKB</strong> TR 96-16. Svensk Kärnbränslehantering AB.Eriksen T E, Jansson M, Molera M, 1999. Sorption Effects in compacted Bentonite,Eng. Geol. 54, pp. 231–236.Forsmark T, Rhén I, Andersson C, 2001. Äspö HRL – Prototype repository.Hydrogeology – Deposition- and lead-through boreholes: Inflow measurements,hydraulic responses and hydraulic tests,<strong>SKB</strong> IPR-00-33. Svensk Kärnbränslehantering AB.Gale J, 1999. Impact of flow geometry, flow regime, two-phase flow and degassing onthe transmissivity of rough fractures.<strong>SKB</strong> IPR-99-08. Svensk Kärnbränslehantering AB .Gascoyne M, 1997. Hydrogeol. J. 5, 4-18.Geller J T, Jarsjö J, 1995. Groundwater degassing and two-phase flow: Pilot hole testreport.<strong>SKB</strong> 95-03. Svensk Kärnbränslehantering AB.186
Glassley B, 2000. Virtual time machine for nuclear waste, Science &technology review,March, 2000, LLNL homepage.Gustafson G, Ström A, 1995. The Äspö Task Force on Modelling of GroundwaterFlow and Transport of Solutes. Evaluation report on Task No 1, the LPT2 large scalefield experiments.<strong>SKB</strong> ICR 95-05. Svensk Kärnbränslehantering AB.Gustafson G, Ström A, Vira J, 1997. The Äspö Task Force on Modelling of GroundwaterFlow and Transport of Solutes. Evaluation report on Task No 3, the Äspö tunneldrawdown experiment.<strong>SKB</strong> ICR 97-06. Svensk Kärnbränslehantering AB.Haggerty R, Gorelick S M, 1995. Multiple-rate mass transfer for modelling diffusionand surface reactions in media with pore-scale heterogeneity.WRR, Vol 31, No 10, pp. 2383–2400, Oct. -95Hautojärvi A, Taivassalo V, 1994. The Intraval project – Analysis of the tracerexperiments at Finnsjön by the VTT/TVO Project team. Report YJT-94-24, NuclearWaste Commision of Finnish Power Companies, December 1994, Helsinki.ISSN-0359-548X.Hellmuth K-H, Siitari-Kauppi M, Klobes P, Meyer K, Goebbles J, 1999. Imagingand analyzing rock porosity by autoradiography and Hg-porosimetry/X-raycomputertomography – Applications,Phys. Chem. Earth (A), Vol. 24, No. 7, pp. 569–573.Hermanson J, Doe T, 2000. TRUE Block Scale Project. March ’00 structural andhydraulic model based on borehole data from KI0025F03.<strong>SKB</strong> IPR-00-34. Svensk Kärnbränslehantering AB.Herweijer J C, 1996. Constraining uncertainty of groundwater flow and transportmodels using pumping tests,Calibration and Reliability in Groundwater Modelling, IAHS Publ., 237, 473–482.Jansson M, Eriksen T E, 2001. CHEMLAB – Aprobe for in-situ radionuclideexperiments.<strong>SKB</strong> TR 01-14. Svensk Kärnbränslehantering AB.Jarsjö J, Destouni G, 1997. Groundwater degassing: Pilot injection – withdrawal fieldtests with gas saturated water.<strong>SKB</strong> HRL-97-02. Svensk Kärnbränslehantering AB.Jarsjö J, Destouni G, 1998. Groundwater degassing in fractured rock: Modelling anddata comparison.<strong>SKB</strong> TR 98-17. Svensk Kärnbränslehantering AB.Kertsting A, Efurd D, Finnegan D, Rokop D, Smith D, Thopmson J, 1999.Migration of plotonium in the ground water at the Nevada Test Site.Nature, Vol 397, January 1999, pp. 56–59.Kotelnikova S, Pedersen K, 1997. FEMS Microbiology Rev. 19, 249–262.Kotelnikova S, Pedersen K, 1999. The Microbe-REX project. Microbial O 2consumption in the Äspö tunnel.<strong>SKB</strong> TR-99-17. Svensk Kärnbränslehantering AB.187
Kotelnikova S, Pedersen K, 2000. Microbial oxygen reduction during the REX fieldexperiment.<strong>SKB</strong>-IPR-00-19. Svensk Kärnbränslehantering AB.Laaksoharju M, Degueldre C l, Skårman C, 1995. Studies of colloids and theirimportance for repository performance assessment.<strong>SKB</strong> TR 95-24. Svensk Kärnbränslehantering AB.Laaksoharju M, Wallin B, 1997. Evolution of the groundwater chemistry at ÄspöHard Rock Laboratory. Proceedings of the second Äspö International GeochemistryWorkshop, June 6–7, 1995.<strong>SKB</strong> ICR 97-04. Svensk Kärnbränslehantering AB.Laaksoharju M, Skårman C, Skårman E, 1999. Multivariate mixing and mass balance(M3) calculations, a new tool for decoding hydrogeochemical information.Applied Geochemistry 14, 861-871.McKenna S A, 1999. Solute transport modelling of the Äspö SST-1b tracer tests withmultiple rates of mass transfer, Task 4E, Äspö Task Force on Modelling of GroundwaterFlow and Transport of Solutes. (In prep)Morosini M (ed), 2000. Proceedings from the 13 th task force meeting at Carlsbad, NM,USA, February 8–11, 2000.<strong>SKB</strong> IPR-00-16. Svensk Kärnbränslehantering AB.Muurinen A, 1994. Diffusion of anions and cations in compacted sodium bentonite,Doctoral thesis,VTT Publications 168, Espoo, Finland.Ohnishi Y, Shibata H, Kobayashi A, 1985. Development of Finite Element Code forthe Analysis of Coupled Thermo-Hydro-Mechanical Behavior of Saturated-UnsaturatedMedium,Proc. Of Int. Symp. On Coupled Processes Affecting the Performance of a NuclearWaste Repository, Berkeley, pp. 263–268.Painter S, 1999. Long-range spatial dependence in fractured rock: empirical evidenceand implications for tracer transport.<strong>SKB</strong> R-99-03. Svensk Kärnbränslehantering AB.Pedersen K, 1999. Subterranean microorganisms and radioactive disposal in Sweden.Engineering Geology 52, 163–176.Pedersen K, 2000. Microbial precesses in radioacticve waste disposal.<strong>SKB</strong> TR-00-04. Svensk Kärnbränslehantering AB.Pedersen K, Motamedi M, Karnland O, Sandén T, 2000. Mixing and sulphatereducingactivity of bacteria in swelling compacted bentonite clay under high-levelradioactive waste repository conditions. Journal of Applied Microbiology 89, 1038–1047.Power Reactor and Nuclear Fuel Development Corporation (PNC), 1994. Currentstatus of geological disposal of HLW (H5), PNC TN1410 94-094, pp. 241–242. (InJapanese).188
Puigdomenech I, Banwart S A, Bateman K, Griffault L, Gustafsson E, Hama K,Kotelnikova S, Lartigue J-E, Michaud V, Milodowski A E, Morosini M, PedersenK, Rivas Perez J, Trotignon L, Tullborg E-L, West J M, Yoshida H, 1998. Redoxexperiment on detailed scale (REX).<strong>SKB</strong>-ICR-99-01. Svensk Kärnbränslehantering AB.Puigdomenech I, Kotelnikova S, Pedersen K, Tullborg E-L, 2000a. In-Situdetermination of O 2 uptake by geologic media: Field data for the redox experiment indetailed scale (REX).<strong>SKB</strong>-IPR-00-23. Svensk Kärnbränslehantering AB.Puigdomenech I, Trotignon L, Kotelnikova S, Pedersen K, Griffault L, MichaudV, Lartigue J-E, Hama K, Yoshida H, West J M, Bateman K, Milodowski A E,Banwart S A, Rivas Perez J, Tullborg E-L, 2000b. in Scientific Basis for NuclearWaste Management XXIII. Mat. Res. Soc. Symp. Proc., Vol. 608 (eds R W Smith andD W Shoesmith), Mater. Res. Soc., pp. 179–184.Puigdomenech I, Ambrosi J P, Banwart S A, Bateman K, Eisenlohr L, Griffault L,Gustafsson E, Hama K, Kotelnikova S, Lartigue J-E, Michaud V, Milodowski A E,Pedersen K, Rivas Perez J, Trotignon L, Tullborg E-L, West J M, Yoshida H,2001. O 2 depletion in granitic media. The REX project.<strong>SKB</strong>-TR-01-05. Svensk Kärnbränslehantering AB.Pusch R, Muurinen A, Lehikoinen J, Bors J, Eriksen T E, 1999. Microstructuraland chemical parameters of bentonite as determinants of waste isolation efficiency,European Commission Project Report EUR 18950.Rhén I (ed), Bäckblom (ed), Gustafson G, Stanfors R, Wikberg P, 1997a. ÄspöHRL - Geoscientific evaluation 1997/2. Results from pre-investigations and detailed sitecharacterisation. Summary report.<strong>SKB</strong> TR 97-03. Svensk Kärnbränslehantering AB.Rhén I (ed), Gustafson G, Stanfors R, Wikberg P, 1997b. Äspö HRL – Geoscientificevaluation 1997/5. Models based on site characterization 1986–1995.<strong>SKB</strong> TR 97-06. Svensk Kärnbränslehantering AB.Rhén I, Forsmark T, 1999. High Permeability Features (HPF),<strong>SKB</strong> IPR 00-02. Svensk Kärnbränslehantering AB.<strong>SKB</strong>, 1999. Vol. I, Vol. II and Summary. Deep repository for spent nuclear fuel.SR 97 – Post-closure safety. Main report – Volume I, Volume II and Summary.<strong>SKB</strong> TR-99-06. Svensk Kärnbränslehantering AB.<strong>SKB</strong>, 2000a. Äspö Hard Rock Laboratory. Annual report 1999.<strong>SKB</strong> TR-00-10. Svensk Kärnbränslehantering AB.<strong>SKB</strong>, 2000b. Long term test of buffer material. Final report on the pilot parcels.<strong>SKB</strong> TR-00-22. Svensk Kärnbränslehantering AB.Smellie J A T (ed), 2000. Matrix Fluid Experiment: Status Report (June 1998 – June2000).<strong>SKB</strong> IPR-00-35. Svensk Kärnbränslehantering AB189
Sugita Y, Chijimatsu M, Fujita T, Ishikawa H, 1997. Coupled thermo-hydromechanicalexperiment at Kamaishi mine, Technical Note 12-96-05, Instrumentation inbuffer mass. PNC TN8410 97-072, Power Reactor and Nuclear Fuel DevelopmentCorporation (PNC).Svensson U, 1992. Modelling tracer transport in fractured porous media –An evaluation of concepts and methods using the LPT2 field experiment.<strong>SKB</strong> PR 25-92-12. Svensk Kärnbränslehantering AB.Svensson U, 1994. Refined modelling of flow and transport in the numerical model ofthe Äspö Hard Rock Laboratory. – Refined modelling of fracture zones in the ÄspöHRL numerical model. – An evaluation of the properties of the particle tracking routinedeveloped for the Äspö HRL Project. – Visualisation of data from the Äspö HRL model.<strong>SKB</strong> PR 25-94-12. Svensk Kärnbränslehantering AB.Svensson U, 1997a. A regional analysis of groundwater flow and salinity distribution inthe Äspö area.<strong>SKB</strong> TR 97-09. Svensk Kärnbränslehantering AB.Svensson U, 1997b. A site scale analysis of groundwater flow and salinity distribution inthe Äspö area.<strong>SKB</strong> TR 97-17. Svensk Kärnbränslehantering AB.Svensson U, 1999a. A laboratory scale analysis of groundwater flow and salinitydistribution in the Äspö area.<strong>SKB</strong> TR 99-24. Svensk Kärnbränslehantering AB.Svensson U, 1999b. Representation of fracture networks as grid cell conductivities.<strong>SKB</strong> TR 99-25. Svensk Kärnbränslehantering AB.Vejmelka P, Fanghänel Th, Kienzler B, Korthaus E, Römer J, Schüssler W,Artinger R, 2000. Sorption and Migration of Radionuclides in Granite (HRL ÄSPÖ,Sweden) Status Report Forschungszentrum Karlsruhe, FZKA 6488.West J M, Hama K, Bateman K, Coombs P, Hards W, Milodowski A E, Wetton P,Yoshida H, 2001. in Scientific Basis for Nuclear Waste Management XXIV. Mat. Res.Soc. Symp. Proc. (ed K Hart). Mater. Res. Soc., Pittsburgh, Penn. (In press)White A F, Yee A, 1985. Geochim. Cosmochim. Acta 49, 1263–1275.Wikberg P, 1998. Äspö HRL Task Force on modelling of groundwater flow andtransport of solutes. Plan for modelling task # 5: Impact of the tunnel constructionon the groundwater system at Äspö. A hydrological-hydrochemical model assessmentexercise.<strong>SKB</strong> HRL 98-07. Svensk Kärnbränslehantering AB.Winberg A (ed), 1996. First TRUE stage – Tracer Retention UnderstandingExperiments. Descriptive structural-hydraulic models on block and detailed scalesof TRUE-1 site.<strong>SKB</strong> ICR 96-04. Svensk Kärnbränslehantering AB.Winberg A, 1997. Test plan for the TRUE Block Scale Experiment.<strong>SKB</strong> ICR 97-01. Svensk Kärnbränslehantering AB.190
Winberg A (ed), 1999. TRUE Block Scale Project. Scientific and technical status.Position report prepared for the 2nd TRUE Block Scale review meeting, Stockholm,Nov 17, 1998.<strong>SKB</strong> IPR-99-07. Svensk Kärnbränslehantering AB.Winberg A et al, 2000. Final Report of the First TRUE Stage.<strong>SKB</strong> TR-00-07. Svensk Kärnbränslehantering AB.Yoshida H, Hama K, West J M, Bateman K, Milodowski A E, Baker S J, CoombsP, Hards V L, Spiro B, Wetton D, 1999.BGS-WE/99/8C and <strong>SKB</strong>-IPR-99-19.Yu J-W, Neretnieks I, 1997. Diffusion and sorption properties of radionuclides incompacted bentonite.<strong>SKB</strong> TR 97-12. Svensk Kärnbränslehantering AB.191
List of papers and articles published 2000McKenna S A, 2000. Estimating Multiple Rates of Mass Transfer in a Single FractureTracer Test, (abstract) presented at: AGU 2000 Western Pacific Geophysics Meeting,Special Session: Advances in understanding water and contaminant movement infractured rock, Tokyo Japan, June 2000, EOS Vol. 81, No. 22 Supplement, pp. WP39-WP40.Jarsjö J, Destouni G, 2000. Degassing of deep groundwater in fractured rockaround boreholes and drifts. Water resources research, Vol. 36. No. 9, pp. 2477–2492,September 2000.192
Document published 2000During 2000 the following reports and documents have been published.International Cooperation ReportsShao H, Liedtke L, 1999. Modelling the reactive – radioactive and sorbing tracer testsin fractured rock. Äspö Task Force, Task 4E and 4F.<strong>SKB</strong> HRL ICR 99-03, Svensk Kärnbränslehantering AB.Cvetkovic V, Cheng H, Selroos J-O, 2000. First TRUE stage. Evaluation of TracerRetention Understanding Experiments (first stage) at Äspö.<strong>SKB</strong> HRL ICR-00-01, Svensk Kärnbränslehantering AB.Winberg A (ed), 2000. TRUE Block Scale Project. Final report of the detailedcharacterisation stage. Compilation of premises and outline of programme for tracertests in the block scale.<strong>SKB</strong> HRL ICR-00-02, Svensk Kärnbränslehantering AB.Svensk Kärnbränslehantering AB, 2000. First TRUE Stage (TRUE-1) CD.Conceptual representation of feature A. Compilation and visualisation of tracer test data,Compilation of relevant reports.<strong>SKB</strong> HRL ICR-00-03, Svensk Kärnbränslehantering AB.Technical ReportsWinberg A, Andersson P, Hermansson J, Byegård J, Cvetkovic V, Birgersson L,2000. Äspö Hard Rock Laboratory. Final report of the first stage of the TracerRetention Understanding Experiments.<strong>SKB</strong> TR-00-07, Svensk Kärnbränslehantering AB.<strong>SKB</strong>, 2000. Äspö Hard Rock Laboratory. Annual report 1999.<strong>SKB</strong> TR-00-10, Svensk Kärnbränslehantering AB.Progress ReportsElert M, Svensson H, 1999. Deconvolution of breakthrough curves from TRUE-1tracer tests (STT-1 and STT-1b) with sorbing tracers. Äspö Task Force, Task 4E.<strong>SKB</strong> IPR-99-35, Svensk Kärnbränslehantering AB.Byegård J, Johansson H, Andersson P, Hansson K, Winberg A, 1999. Test plan forthe long term diffusion experiment.<strong>SKB</strong> IPR-99-36, Svensk Kärnbränslehantering AB.Smellie J, 2000. Test plan for Sampling of matrix fluids from low conductive bedrock.<strong>SKB</strong> IPR-00-01, Svensk Kärnbränslehantering AB.Rhén I, Forsmark T, 2000. High-permeability features (HPF).<strong>SKB</strong> IPR-00-02, Svensk Kärnbränslehantering AB.193
Äspö Hard Rock Laboratory, 2000. Status Report October-December 1999.<strong>SKB</strong> IPR-00-03, Svensk Kärnbränslehantering AB.Birgersson L, Gale J, Hakami E, 2000. First TRUE stage. Pilot resin experiment.Summary report.<strong>SKB</strong> IPR-00-04, Svensk Kärnbränslehantering AB.Birgersson L, Gale J, Hakami E, 2000. First TRUE stage. Pilot resin experiment.Background information.<strong>SKB</strong> IPR-00-05, Svensk Kärnbränslehantering AB.Rhén I, 1999. Test plan for Groundwater flow modelling -– natural barriers.Release 1.0.<strong>SKB</strong> IPR-00-06, Svensk Kärnbränslehantering AB.Forsmark T, Rhén I, 1999. Prototype Repository. Hydrogeology interference testcampaign 1 after drill campaign 3.<strong>SKB</strong> IPR-00-07, Svensk Kärnbränslehantering AB.T Forsmark, Rhén I, 1999. Prototype Repository. Hydrogeology drill campaign 3Aand 3B.<strong>SKB</strong> IPR-00-08, Svensk Kärnbränslehantering AB.Gentzschein B, 1999. Demonstration of repository technology. Flow and pressuremeasurements in the pilot holes.<strong>SKB</strong> IPR-00-09, Svensk Kärnbränslehantering AB.Gentzschein B, 1999. Canister retrieval test. Flow and pressure measurements in thepilot holes.<strong>SKB</strong> IPR-00-10, Svensk Kärnbränslehantering AB.Börgesson L, Hernelind J, 1999. Prototype repository. Preliminary modelling of thewatersaturation phase of the buffer and backfill materials.<strong>SKB</strong> IPR-00-11, Svensk Kärnbränslehantering AB.Laajalahti M, Aaltonen T, Kuoppamäki K, Maaranen J, Timonen J, 1999.Measurement with the He-gas methods of the disturbed zone caused by boring.<strong>SKB</strong> IPR-00-12, Svensk Kärnbränslehantering AB.Äspö Hard Rock Laboratory, 2000. Planning report for 2000.<strong>SKB</strong> IPR-00-13, Svensk Kärnbränslehantering AB.Sandén T, 2000. Canister retrieval test report on instrument positions and preparationof bentonite blocks for instruments and cables.<strong>SKB</strong> IPR-00-14, Svensk Kärnbränslehantering AB.Äspö Hard Rock Laboratory, 2000. Status Report January – March 2000.<strong>SKB</strong> IPR-00-15, Svensk Kärnbränslehantering AB.Morosini M (ed), 2000. Proceedings from the 13 th Task Force Meeting at Carlsbad,NM, USA, February 8–11, 2000. Äspö Task Force on Modelling of Groundwater Flowand Transport of Solutes.<strong>SKB</strong> IPR-00-16, Svensk Kärnbränslehantering AB.194
Nyberg G, Jönsson S, 2000. Hydro Monitoring Programme. Report for 1999.<strong>SKB</strong> IPR-00-17, Svensk Kärnbränslehantering AB.Ageskog L, Blix P, 2000. Canister Retrieval Test. Temperature on the Canister Surface.<strong>SKB</strong> IPR-00-18, Svensk Kärnbränslehantering AB.Kotelnikova S, Pedersen K, 2000. Microbial oxygen reduction during the REX fieldexperiment.<strong>SKB</strong> IPR-00-19, Svensk Kärnbränslehantering AB.Forsmark T, Rhén I, 2000. Prototype repository. Hydrogeology – Injection testcampaign 1.<strong>SKB</strong> IPR-00-20, Svensk Kärnbränslehantering AB.Forsmark T, Rhén I, 2000. Prototype repository. Hydrogeology – Interference testcampaign 2 after drill campaign 3.<strong>SKB</strong> IPR-00-21, Svensk Kärnbränslehantering AB.Elert M, Svensson H, 2000. Deconvolution of breakthrough curves from TRUE-1tracer tests (STT-2) with sorbing tracers. Äspö Task Force, Task 4F.<strong>SKB</strong> IPR-00-22, Svensk Kärnbränslehantering AB.Puigdomenech I, Kotelnikova S, Pedersen K, Tullborg E-L, 2000.In-Situ determination of O 2 uptake by geologic media: Field data for the redoxexperiment in detailed scale (REX).<strong>SKB</strong> IPR-00-23, Svensk Kärnbränslehantering AB.Lundholm B, 2000. Rock stress and rock stress measurements at Äspö HRL.<strong>SKB</strong> IPR-00-24, Svensk Kärnbränslehantering AB.Lundholm B, 2000. Numerical modelling of discontinuities to study the effect on thestate of stress.<strong>SKB</strong> IPR-00-25, Svensk Kärnbränslehantering AB.Winberg A (ed), 2000. TRUE Block Scale Project. Final report of the detailedcharacterisation stage. Compilation of premises and outline of porramme for tracer testsin the block scale.<strong>SKB</strong> IPR-00-26, Svensk Kärnbränslehantering AB.Winberg A, Hermansson J, Tullborg E-L, Andersson P, Carlsten S, Rouhiainen P,Nilsson G, Gustafsson C, 2000. Select-2. Evaluation of fracture candidates inboreholes KA2865A01 and KA3065A02. Location of experimental site for the Long-Term Diffusion Experiment.<strong>SKB</strong> IPR-00-27, Svensk Kärnbränslehantering AB.Technical Documents49 Technical Documents were produced during 2000.International Technical Documents21 International Technical Documents were produced during 2000.195
ISSN 1404-0344CM Digitaltryck AB, Bromma, 2001