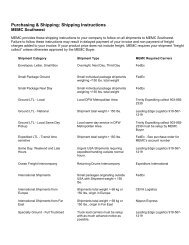
Waste water - Total Sospeded Solids: TSSConnection value at discharge point (mg/l)908070605040302017,861002000 2001 2002 2003 2004 2005 2006 <strong>2007</strong>YEARWaste water - Ammoniacal Nitrogen: N-NH 4+Connection value at discharge point (mg/l)18151296302000 2001 2002 2003 2004 2005 2006 <strong>2007</strong>YEARWaste water - Chloride: Cl-Connection value at discharge point (mg/l)1400120010008006004002000299,274,02000 2001 2002 2003 2004 2005 2006 <strong>2007</strong>YEARWaste water - Nitrite: N-<strong>NO</strong> 21,0Connection value at discharge point (mg/l)Connection value at discharge point (mg/l)0,80,60,40,20,02000 2001 2002 2003 2004 2005 2006 <strong>2007</strong>YEARWaste water - Phosphor P04: P-PO 41210864202000 2001 2002 2003 2004 2005 2006 <strong>2007</strong>YEARYearly average valueAverage valueMax limit by law0,565,95Waste water - Nitric Nitrogen: N-<strong>NO</strong> 324Connection value at discharge point (mg/l)Connection value at discharge point (mg/l)2016128402000 2001 2002 2003 2004 2005 2006 <strong>2007</strong>YEARWaste water - Sulfate: SO 412001050900750600450300150017,0879,72000 2001 2002 2003 2004 2005 2006 <strong>2007</strong>YEAR30
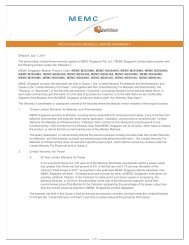
WasteThe total waste production valuefor 2006 has been confi rmedagain for <strong>2007</strong> and an increasehas been confi rmed in the amountof waste disposed of compared tothat recycled, in fact from 2005 itwas no longer possible to sendchemical and physical mud tocement factories for recycling,so it was sent for treatment andsubsequently disposed of in therubbish tip.Also, on analysis of quantitativedata related to waste divided intocategories in accordance with thehazardous nature of the same, aconsistent reduction (about 36%)can be seen in the production ofhazardous waste mainly thanksto a reduction in the production ofspent chromic-hydrofl uoric acidmixture, which has a considerableeffect on the total quantity.Said reduction has been achievedthanks to improvements in theetching process that have madeit more effi cient and reduced theconsumption of acids, leading toa reduction in spent acid waste.With regards to non-hazardouswaste, there was a considerablereduction in the amount of mudproduced by the purifi cation plantin <strong>2007</strong> (a decrease of about28%), mainly achieved thanksto more efficient operation of thedrier, which removes the water inwhich the mud is soaked resultingin a considerably lower volumeand weight.The fact that spent abrasive materialproduced by the wire cuttingdepartment is sent to an externalplant for recycling and there hasbeen a reduction in the consumptionof chemical substancesin the production department,achieved thanks to improvementactions implemented over the lastthree years, have also contributedto a reduction in the formationof said mud. However, sendingspent abrasive material derivingfrom wire-saw cutting machinesto an external plant has causedan increase in the production ofnon-hazardous waste, which hasfor the most part absorbed the reductionin the production of mudsent for recycling or disposal.However, in this case an increasein the production of waste is stillto be considered in a positive lightas it guarantees the recycling ofproduction residue that wouldotherwise have been sent to thepurifi cation plant, adding to theload of pollutants to be treated.In the plant different types of wasteare collected to recovery themaximum quantity.The charts and tables below illustratethe trend of waste productionnormalised by productionlevels, as at the end of <strong>2007</strong>, brokendown by classifi cation (special,non hazardous and hazardous),and destination (recoveryor disposal).Year Disposed waste Recovered waste Total2000200120022003200420052006<strong>2007</strong>t/year1.001417419432524557880816t/MSIE5,763,022,422,272,331,353,493,59%10052423940236162t/year3.2411.6992.2352.6332.7292.9731.8941.878t/MSIE18,6712,3212,9313,8112,1215,107,528,00%10066697465814044t/year4.2422.1162.6543.0653.2533.5312.7742.694t/MSIE24,4315,3415,3516,0714,4516,4511,0111,84%10063636659674548ANNUAL WASTE PRODUCTION (t/year)Waste production5.5005.0004.5004.0003.5003.0002.5002.0001.5001.00050002000 2001 2002 2003 2004 2005 2006 <strong>2007</strong>YEAR3634323028262422201816141210SPECIFIC PRODUCTION (t/MSIE)RecoveredDisposedTotalSpecifi c31