Novara Environmental Statement 2007 English MEMC-NO ...
Novara Environmental Statement 2007 English MEMC-NO ...
Novara Environmental Statement 2007 English MEMC-NO ...
- No tags were found...

Create successful ePaper yourself
Turn your PDF publications into a flip-book with our unique Google optimized e-Paper software.
ABSTRACT OFENVIRONMENTAL STATEMENT<strong>2007</strong><strong>Novara</strong> Plant
Indice01 Introduction 302 General information 4The <strong>MEMC</strong> Electronic Materials Inc. group 4<strong>Novara</strong> site 5Silicon and its applications 6A look at the history 7<strong>MEMC</strong>’s commitment to environmental protection 703 Geographical position and environmental background 804 <strong>Environmental</strong> Policy 905 The organisational structure 1006 The <strong>Environmental</strong> Management System 1107 Description of the activities 1208 Quantifi cation of the <strong>Environmental</strong> Aspects 13Production 14Energy consumption 15Water consumption 16Consumption of auxiliary materials 19Emissions into the atmosphere 23Emission of Carbon Dioxide Equivalent 27Waste and fl uid drainage 28Waste 31Ground contamination 33Polyclorobiphenil PCB 33Ozone depleting substances 33Outside noise 34Signifi cance of indirect environmental aspects 34Activities that are sub contracted on the site 34Procurement of products and services 34External transport 35Processing and employment of the productsupplied by <strong>MEMC</strong> 35Local activities 3609 <strong>Environmental</strong> Improvement ActionsThe environmental program 37Summary of <strong>2007</strong> environmental program 372008 - 2011 <strong>Environmental</strong> program 392
01Introduction<strong>MEMC</strong>’s <strong>Novara</strong> site has adopteda UNI EN ISO 14001 certified <strong>Environmental</strong> ManagementSystem since 1999 and hasbeen registered on the EMASRegister, a register of Europeanorganisations participatingin the EMAS scheme (RegulationEC 761/2001) since 2002(registration number I-000123).In compliance with EMAS regulations,every year <strong>MEMC</strong> of<strong>Novara</strong> places information relatedto the company, the resultsobtained and its environmentalimprovement programs at thedisposal of interested parties bymeans of an <strong>Environmental</strong> Declarationvalidated by an auditor.The <strong>Environmental</strong> Declarationis a communication tool that cements<strong>MEMC</strong>’s desire to operatewith the greatest transparencywith regards to their personnel,the local community and publicbodies, not to mention surroundingcompanies and any companiesoperating within the site itself.This document is a free translationof an extract of the third editionof the factory’s <strong>Environmental</strong>Declaration.3
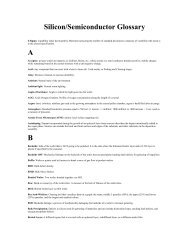
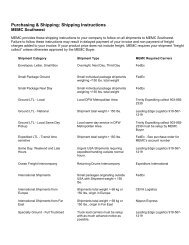
02GeneralinformationThe <strong>MEMC</strong> ElectronicMaterials Inc. group<strong>MEMC</strong> Electronic Materials is aninternational group producing ultra-puresilicon, operating in thefi eld of microelectronics and,since 2004, solar photovoltaics.The head offi ce of the multinationalgroup can be found in St.Peters, Missouri (USA). Thereare a total of 9 productive sitesthroughout the world. These aresituated in America, Asia and Europeand they cover the wholeglobe with their commercial net.Productively <strong>MEMC</strong> is representedin Europe by <strong>MEMC</strong> ElectronicMaterials S.p.A. with the sitesat Merano and <strong>Novara</strong>. The lastof these is the European head office and is also the object of thisenvi ronmental statement. On aworld scale the group consi sts ofanother fi ve productive sites (Threein the USA, one in Japan, onein Malaysia and one in Taiwan,whose Memc has become theonly owner in 2003) plus two jointven ture schemes with other partnersrespectively situated in theUSA, Korea and Taiwan.St.Peters,MissouriSherman,TexasPasadena,Texasfi g.1 - Sites throughout the world<strong>Novara</strong>,ItalyMerano,ItalyKuala Lumpur,MalaysiaHsinchu,TaiwanCheonan,KoreaUtsunomiya,Japan4
<strong>Novara</strong> site<strong>MEMC</strong> Electronic MaterialsS.p.A <strong>Novara</strong> siteViale Gherzi 31, 28100 <strong>Novara</strong>Around 2.5 km north east of thetown centre Internetsite: www.memc.comE-mail: info@memc.itTotal surface area:Total surface area 79.385 m 2Covered area 16.200 m 2Area of the car park 10.800 m 2Annual underscore of the societyin <strong>2007</strong> were 371 million.Number of employees: 782NACE code:DG24.13 - Production of otherchemical products with aninorganic baseCERTIFICATESAccording to internationalstandardsQUALITY SYSTEM:ISO 9002 in 1991ISO 9001 in 1994QS 9000 in 1999ISO 9001:2000 in 2003ISO TS16949 in 2003ENVIRONMENTAL SYSTEM:ISO 14001 IN 1999EMAS in 2002HEALTH AND SAFETYSYSTEM:OHSAS 18001 IN 2006(As at 31/12/07)ACID EMISSIONSTACKEX M.T. BUILDINGBUNKER HCLCVD and EPIDEPARTMENTSDEIONIZEDWATERFACILITYSPECIAL GAS BUNKERMAINTENANCEEXHAUST DRUMSAND BOTTLESCLEANING POINTVIA GHERZISAWING, LAPPINGAND POLISHINGDEPARTMENTSGUARDHOUSEWASTE STORAGERECOVERABLE WASTE STORAGESTORAGE FLAMMABLE CHEMICALSSTORAGE CYLINDER STOCKAGEOUTSIDE CONTRACTCHEMICAL STORAGEOUTSIDE CONTRACTOR AREAWASTEWATER FACILITYCANTEENENTRANCEWIRESAW DEPARTMENTINFIRMARYOFFICESSTORAGEOFFICES<strong>NO</strong>RTHISTAT activity code:24.130 - Production of otherchemical products with aninorganic base5
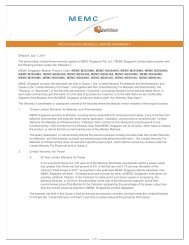
Silicon and itsapplicationsMicroelectronic-solar silicon flow chartSilicon is a chemical elementthat is a semi-conductor in itscrystalline form; as such it fi ndsapplication in the microelectronicsindustry, as a base on which tocreate integrated circuits (chips),that is to say those electric devicesthat, by processing and/or storing data, are fundamentalfor the correct operation of all ofthe electronic equipment usedin industry and our daily lives.Crystalline silicon is also increasinglyused in the fi eld of solar photovoltaicsto produce photovoltaiccells capable of transformingsolar energy into electric power.However, although silicon is thesecond most abundant elementavailable on our planet after oxygen,in nature it is always boundwith other elements: in quartz forexample, in which it is bound withoxygen, or in silicate mineralsin which it is bound with variouselements (magnesium, aluminium,sodium and many others).Silicon can only be obtained bymeans of industrial processesas described in the fl ow chartshere below.MineSilicastoneSemiconductorapplicationsMetallicSilicaRefiningPolycrystalline siliconsolar productsTrichlorosilaneDepositionPolycrystallineSiliconMeltingSinglecrystalline siliconsolar productsAddition of Boron,Phosphorus or ArsenicSinglecrystallineSiliconSlicingIC chipSinglecrystallineWaterSolar cellSolar cell module6
A look at the historyThe construction of the <strong>MEMC</strong> sitewas started in 1976. In the followingyears the site grew at <strong>Novara</strong>with the construction of new offices and productive departments.October 2001, the group E.ON Agsold the ownership to a new majorshareholder, an American investmentcompany called Texas Pacific Group.<strong>MEMC</strong>’s commitment toenvironmental protection<strong>Environmental</strong> protection activitieshave been an important commitmentfor <strong>MEMC</strong> for some time nowand the company has completedvarious environmental improvementprojects over the last two decades,as described here beside:1990 elimination of ozone depletingsubstances1993 aquifer monitoring and decontamination1995 monitoring and decontaminationof acquired areas withground contaminated by pastprocesses1996 creation of own waste treatmentplant and expansion ofacid fumes abatement plant,completed in 20001998 reduction of specific energyand water consumption andreduction in the amount ofwaste produced, as well ascurbing polluting emissions tothe atmosphere and in surfacewater1999 awarded ISO 14001 certificationfor the <strong>Environmental</strong>Management System2002 registration on the EMASregister2005 soundproofing of fan ventslocated on the south side ofthe plant2006 an external company specialisedin the energy industrystarts and completes the constructionof a trigenerationplant on a piece of groundlocated behind the factory,providing almost all of theenergy needed to meet thefactory’s energy requirements.<strong>Novara</strong> trigeneration plant7
03Geographicalposition and environmental background<strong>Novara</strong> can be found in the northeast part of the region of Piemonte.<strong>Novara</strong> contains about102.860 inhabitants. The site issituated in the zone of St.Agabio,which is characterized by a mixtureof industrial activity and residentialhomes, according to thecensus it’s the most populatedwith 12.308 inhabitants with a likelihoodof rising.The site can be found in amongst achemical zone with many companieswhich have several differentproduction activities.Region ofPiemonte<strong>Novara</strong>Provinceof <strong>Novara</strong>Italy8
04<strong>Environmental</strong>Policy<strong>MEMC</strong>’s Health, Safety and <strong>Environmental</strong>Policy consists ofall of the objectives pursued bythe company to protect the environmentand the health andsafety of their personnel and thepopulation. The Policy is defi nedand signed by the managers ofall of the company’s operationalareas, thereby highlighting theirfull support and involvement.It was updated in 2006 in order to:include the new marketing areainto which <strong>MEMC</strong> had entered(solar - photovoltaic) and underlinethe importance of the managementof emergency situations,clarifying the company’s commitmentto the development andobservance of the safety managementsystem in greater detail(in view of the OHSAS18001 certification). A revised version of thedocument was issued in <strong>2007</strong> toadd the signature of <strong>MEMC</strong> SpA’snew human resources manager,with no changes whatsoever tothe text contained within.9
05Theorganisational structure<strong>MEMC</strong> S.p.A.’s organisationalstructure (Merano and <strong>Novara</strong>sites) is shown in the followingillustration.There are six manufacturingunits - three in Merano (Polycrystal,Single Crystal CZ and CZServices) and three in <strong>Novara</strong>- responsible for achieving theoperational objectives in terms ofquality, cost, output and productivityin compliance with companyprocedures and laws in force concerningenvironmental protectionand safety in the workplace.“Supply Chain” is the sole departmentresponsible for supervisingall production planning and progressactivities for both sites, aswell as packing and dispatch ofthe fi nished product, with the aimof ensuring that company objectivesconcerning production andpunctual delivery times are met.Technological development ofthe production processes, maintenanceengineering, plant engineeringplanning, the QualitySystem including the laboratories,the IT Systems and IndustrialEngineering are managed bythe “Innovation” department bymeans of development projectsdesigned to support a generationof new “know how”. Someof the technical specialists alsoact as a technical interface withproduction departments with theaim of bringing technological developmentactivities into line withproduction needs, as well as anyspecifi c market requirements.The Sales, Administration, Accountsand Management Controldepartments manage bothof the sites, whilst each site hastheir own Materials, Human Resourcesand Safety and <strong>Environmental</strong>Protection departments.MATERIALSMERA<strong>NO</strong>PLANTPRODUCTION(O.T. & Maintenance)<strong>NO</strong>VARAPLANTADMIN.&FINANCEIN<strong>NO</strong>VATIONProc./ProductDev. & SystemsH.R.PURCHASING, MATERIALS & SPARESSUPPLY CHAIN(bill of materials)SCHEDULINGPOLYCRYSTALSINGLE CRISTAL CZCZ SERVICESMODS CVDPOLISHING CLEANINGEPITAXYPRODUCTION PROCESSProcessProductsEquipmentFacilitiesProcess Development projectsProcess Development projectsMfgScienceDEVELOPMENT PROCESSProcess Development projectsProcess Development projectsProcess Development projectsProcess Development projectsQualityInformation Technology10
06The<strong>Environmental</strong> Management SystemWithin the scope of the aboveorganisational structure, a managementcommittee - the EHSSteering Committee - has beenset up to deal with the annualplanning of environmental protectionand health and safetyactivities for both of the sites.To manage and coordinate suchactivities at factory level, the EHSSteering Committee avails itself ofan operating committee known asthe EHS Committee, composedof the managers of departmentsthat have the highest impact onthe environment.Health, Safetyand <strong>Environmental</strong>Protection StructureESH Steering CommitteePresident <strong>MEMC</strong> SpA<strong>Novara</strong> and Merano plantDirectorsInnovation group DirectorHuman Resourcesand Training DirectorPurchase Office DirectorManagementRepresentative for<strong>Environmental</strong>ProtectionThe management model adoptedby <strong>MEMC</strong> for protection of the environmentis that commonly knownas PDCA, otherwise known as the“Deming Cycle”, which consists ofthe repetition over time of the followingfour management stages:Planplan the improvementDoimplement that plannedCheckcheck that which is beingimplementedActassess that implemented in orderto strengthen or review the linesof direction undertaken.PlanWhat to do?How to do?DoTo do asplannedESH CommitteePlant DirectorTechnical Offi ce ManagerPlant Facilities ManagerWaste Water Facility ManagerQuality ManagerStorage ManagerMaintenance ManagerOperational TechnologyManagersESH EngineerProduction area ManagerActCan we do itbetter?Deming CycleCheckDone?11
07Descriptionof the activitiesIn the following fl ow chart theproductive cycle of the site isdescribed.Mono Crystal Silicon Bar(<strong>MEMC</strong> Merano)Wire-sawLappingChemical VapourDepositionSolar Silicon cleaningPolishingCleaningEpitaxyWafersCustomerSolar FotovoltaicCustomer12
08Quantification of the <strong>Environmental</strong> AspectsThe following table shows a summaryof the levels of importanceof impacts associated with directenvironmental aspects, manageddirectly by the factory’s organisationalstructure, for <strong>2007</strong>.The following sections contain acollection of environmental indicatorsrelated to <strong>MEMC</strong> in <strong>Novara</strong>,updated to 31st December<strong>2007</strong>, which provide a qualitativeand quantitative indication ofthe factory’s most important environmentalaspects and showthe progress of the company’senvironmental performanceduring the 2000-<strong>2007</strong> period.The indicators shown herein derivefrom data collected duringactivities implemented by thecompany to control their own environmentalaspects and, unlessotherwise indicated, refer to all ofthe activities performed on site.Two types of indicators havebeen used:“absolute”, that is the annualquantity of the parameter in question(e.g. amount of waste producedin a year expressed in kilograms);“specific”, obtained by dividingthe absolute quantity of the parameterconsidered by the quantityof product manufactured in ayear for the electronic and solarphotovoltaic markets (millionsof equivalent square inches ofsilicon). This type of indicator isimportant as it shows the company’sperformance expressedin terms of product units. Someenvironmental aspects also showthe percentage value taken fromthe ratio: specifi c datum of theyear considered related to specific datum of the year 2000.The indicators are also shown ina graphic format for ease of reference.Each one of the following paragraphsis marked with a colouredcircle to indicate the level of importanceof impacts associatedwith the environmental aspectsdescribed therein (red for very importantimpacts, yellow for importantimpacts and green for unimportantimpacts).To individualise the direct or indirecteffects of the production cycleon the external environment theenvironmental aspects associatedwith different activities have beensubjected to a significance evaluation.The results of the evaluation arereported in the following tables.DIRECT ENVIRONMENTALASPECTSElectrical energy, steam and methan consumptionRaw material consumptionOil and combustible consumptionGroundwater consumptionDrinkable water consumptionAuxiliary materials consumption(for production, facility, shipping)Auxiliary materials consumption(for maintenance, storage, offices)Emissions to atmosphereDiffused emissionsWastewater dischargeCooling water, stormwater, civil wastewaterdischargeHazardous waste (recoverable or not)Not hazardous waste (recoverable or not)PCBODS: Ozone depleting chemicalsAsbestosOdorsExternal noiseRadiationSoil contaminationSoil occupationLandscape modificationInternal transportationBiodiversity effectsNormal conditionsEmergencyconditionsPastconditions✖✖✖✖✖✖✖✖✖✖✖ very significative ✖ significative ✖ not significative✖✖✖✖✖✖✖✖ ✖✖ ✖✖ ✖✖ ✖✖ ✖✖ ✖✖✖✖ ✖ ✖✖✖✖✖ ✖13
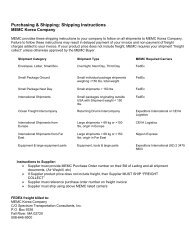
ProductionFor the correct interpretationof the progress of environmentalaspects, that mentioned inthe introduction regarding siliconwafer manufacturing trendsshould be taken into account.To this aim, the graph shown illustratesthe trend in silicon manufacturing,which for <strong>2007</strong> considerssilicon produced for theelectronics industry and for solarphotovoltaics in terms of thepercentage variation comparedto production values for the year2000, chosen as the referenceyear. In fact, the datum relatedto the production of silicon for theelectronics and solar photovoltaicsmarket was considered as thereference datum for the calculationof the specifi c environmentalperformance values indicatedhere below. In fact, silicon hasbeen considerably important forthe solar photovoltaics marketsince 2006.On analysis, in line with the economiccontext described previously,the production data showsthat silicon manufacturing for theelectronics market fell slightly in<strong>2007</strong> compared to the years immediatelybefore, however saidfall was compensated by productionvalues related to siliconmanufactured for the solar photovoltaicsmarket, therefore theproduction of silicon for the electronicsand solar photovoltaics industriesin <strong>2007</strong> showed an overallincrease of 131% comparedto the year 2000.Silicon wafers productionYear(%)200010020017920021002003110200413020051232006145<strong>2007</strong>131Silicon wafers productionANNUAL PRODUCTION QUANTITY (MSIEreferred to 1997, Cconsidered as base year)2001801601401201008060402002000 2001 2002 2003 2004 2005 2006 <strong>2007</strong>YEARSilicon for the electronicsSilicon for the solar photovoltaicsSilicon for the electronics and solar photovoltaicsSilicon has been considerablyimportant for the solar photovoltaicsmarket since 2006.14
Energy consumptionThe main source of energy for thesite in <strong>Novara</strong> is electricity suppliedby a trigeneration plant builtin 2006 and put into operationin the fi rst quarter of <strong>2007</strong>. Saidplant, powered by natural gas(methane), meets all of the site’senergy requirements in terms ofelectricity and steam and 2/3 ofthe frigories required for the productionof cold water. The processesthat consume the highestamounts of electricity are: airconditioningsystems for the clean-rooms(about 30% of the totalamount), the polishing departmentand the epitaxy department(about 20% of the total amount).The site also uses steam for theair-conditioning system, alsosupplied from the trigenerationplant, and to a small degreemethane for drying mud derivingfrom waste purifi cation and dieselfor internal goods handling.Energy consumption values forthe single sources and the totalvalue are proposed in absoluteterms (toe:tonne of oil equiva-lent) and specifi c terms, in otherwords related to the annualamount of silicon produced formicroelectronics and solar photovoltaics(expressed in MSIE:million square inch equivalent).<strong>2007</strong> saw a reduction in absoluteenergy consumption mainly causedby a fall in production, but alsothanks to the completion of plannedimprovement actions, mostimportantly activation of the trigenerationplant designed to meetthe sites energy requirements.Said plant, powered by methane,offers improved energy effi ciencyand at the same time a considerablereduction in carbon dioxideemissions to the atmosphere,as shown in the following graph.Another completed project thathas provided considerable energysavings (about 1 million kWhper year) is the optimisation of thecompressed air production plant.The downward trend seen in specificenergy consumption over thelast few years is proof of the company’scommitment to implementincreasingly more energy efficientproduction processes.Energy consumptionTOTAL CONSUMPTION (tep/year)Total energy consumption Steam Electrical energy Oil & MethanYear tep tep/MSIE tep tep tep2000 18482 106 3003 15269 2102001 18015 131 3185 14725 1052002 18409 107 3356 14950 1032003 19087 100 3417 15576 932004 19818 88 3432 16192 1942005 19208 90 3637 15435 1352006 19556 78 3493 15831 232<strong>2007</strong> 17474 77 3519 13762 193tep = equivalent tons of petroleum oilMSIE = million square inches equivalent20.00018.00016.00014.00012.00010.0008.0006.0004.0002.00002000 2001 2002 2003 2004 2005 2006 <strong>2007</strong>YEARSteamElettrical energyOil&MethanTotal energy consumptionSpecifi c consumption1401301201101009080706050SPECIFIC CONSUMPTION (tep/MSIE)15
Water consumptionThe entire water supply for the site’sproduction processes is providedby underground aquifers.Water is taken from four wells(two in the fi rst aquifer and two inthe second aquifer) to which waterextracted from a piezometerlocated in the factory, downstreamfrom the fl ow direction of theaquifer, which is bled off continuouslyfor decontamination andmonitoring purposes, is added.As explained in greater detail inthe chapter dealing with groundcontamination, water extractedfrom said piezometer is sent to thesite’s waste purifi cation plant andthe annual amount is included inthe total industrial consumptionof water from the fi rst aquifer.Drinking water is supplied bythe mains water supply, whilefi re-fi ghting water is taken fromnearby, well-irrigated canalsand distributed by means of acollection and pump systemmanaged by an adjacent fi rm.Water consumption over the lastfew years is illustrated in the graphsshowing the quantity of waterconsumed for industrial and civiluse (sanitary services and canteen)expressed in m 3 normalizedrespectively to the productionvalues and typical number of employeesfor the year in question.With regards to the environmentalaspect, there is also a downwardtrend in absolute water consumptionfor industrial use followingto the fall in production, whilstthere is a slight increase in theindicator: water consumption forindustrial use normalized to productionvalues. As of <strong>2007</strong>, someof the well water has been usedby the trigeneration plant to coolthe motors. However, in practice,if we reduce the site’s total waterconsumption by the amount ofwater consumed by the trigenerationplant (about 135,400 m 3 /year,calculated by means of a dedicatedfl ow meter), the site’s specifi cwater consumption for industrialuse would be comparable withthe value recorded in 2006, thelowest value achieved over thelast few years, thanks to changesmade to the software that managesthe washing machines, purposelydeveloped to reduce waterconsumption.TotalannualTOTAL WATER CONSUMPTION - INDUSTRIAL USE(1st and 2nd water-bearing stratum wells)2nd waterbearingstratum1st waterbearingstratumSpecific% Yearly specificconsumptionCIVIL WATERCONSUMPTION(town reservoir)AnnualYear m 3 /year m 3 /year m 3 /year m 3 /MSIE - m 3 /year2000 2.758.601 2.206.469 557.451 15.891 100 305212001 2.622.137 2.162.913 745.021 19.013 120 239982002 2.931.534 2.200.360 735.826 16.962 107 255532003 3.027.662 2.299.070 733.095 15.879 100 225192004 3.096.293 2.449.920 646.373 13.755 87 202252005 3.313.581 2.424.522 893.451 15.458 97 227132006 3.173.748 2.332.963 840.785 12.602 79 24287<strong>2007</strong> 3.045.239 2.263.406 781.833 13.388 84 15864The site’s specifi c water consumptionfor industrial use represents the lowestvalue achieved over the last few years.16
Total water consumption - industrial useANNUAL CONSUMPTION (m 3 /year)3.600.0003.300.0003.000.0002.700.0002.400.0002.100.0001.800.0001.500.0001.200.000900.000600.000300.0002001 2002 2003 2004 2005 2006 <strong>2007</strong>YEAR21.00019.00017.00015.00013.00011.0009.0007.0005.000SPECIFIC CONSUMPTION (m 3 /MSIE)2nd water-bearing stratum1st water-bearing stratumTotal yearly consumptionSpecifi c consumptionTotal water consumption - civil useANNUAL CONSUMPTION (m 3 /year)35.00030.00025.00020.00015.00010.0005.00002000 2001 2002 2003 2004 2005 2006 <strong>2007</strong>YEAR3530252015105-SPECIFIC CONSUMPTION (m 3 /MSIE)Total yearly civil waterconsumptionSpecifi c civil waterconsumption(m 3 each employee)17
As per previous versions of thisdocument, values related toanother parameter used to assessthe effi cient use of water onsite are also shown here below,that is to say the quantity ratioof recycled water in productionprocesses or for technologicalpurposes divided by the overallquantity of water procured: Qr/Qa.It can be seen that in <strong>2007</strong> thetotal amount of water recycledcompared to the amount suppliedremains unchanged compared to2006 and is lower than the previousyears.Totalrecovered waterTotal groundwaterconsumption(Qr/Qa)*100Year m 3 /year m 3 /year %2000 420.761 2.763.920 15,22001 459.790 2.627.059 18,92002 451.407 2.931.534 15,02003 467.908 3.027.662 15,52004 461.201 3.096.293 14,92005 350.412 3.313.581 10,62006 226.351 3.173.748 7,1<strong>2007</strong> 211.376 3.045.239 6,9Recovery of groundwater20,0% recovered water referred tototal groundwater consumption16,012,08,04,0-2000 2001 2002 2003 2004 2005 2006 <strong>2007</strong>YEAR18
Consumption ofauxiliary materialsVarious chemical substances (acids,bases, detergents, alcohols,inert and special gases, colloidalsolutions, oils and greases) areused in the production processesthat can give rise to direct or indirectenvironmental impacts. Theformer can be controlled directly onsite and derive from the formationof contaminating or non-contaminatingby-products in productionprocesses, that may lead to emissionsto the atmosphere, the dischargeof liquid, waste and risk ofground contamination during loadingand transport operations. Thelatter involves the areas in whichfactories producing said chemicalsubstances are located. Variousprocess stages performed in thefactory require the use of hydrofl uoricacid, which is classified as verytoxic in concentrations greater than7%. The storage and use of saidsubstance, even when mixed withother acids, means that the factoryfalls under the scope of ItalianDecree 334/99 Art. 6 concerningmajor accident hazards. A SafetyManagement System has thereforebeen defi ned and implementedthat, together with the <strong>Environmental</strong>Management System, defi nesaction to improve the managementof said substances designed to reducethe hazards associated withtheir use and storage. The tablehere below shows trends in theconsumption of substances in usein the factory, considered signifi -cant due to the quantity consumed(> 3 tons/year) or their hazardousnature (classifi ed: Toxic, Corrosiveor Highly Flammable), whilst trendsrelated to substances for whichspecifi c improvement actions havebeen defi ned are also shown ingraphs for ease of reference.Potassiumhydroxide 45%CSodiumhydroxide 30%CHydrofloridricacid 49%T+, CHydrocloridric acidanidrous (gas)T, CHydrocloridricacid 37%CNitricacid 65%CAceticacid 80%CPhosphoric, nitric andhydrofloridric acid mix (50%H<strong>NO</strong>3, 10%CH3COOH,6% HF)T, CYear ton ton/MSIE ton ton/MSIE ton ton/MSIE ton ton/MSIE ton ton/MSIE ton ton/MSIE ton ton/MSIE ton ton/MSIE2000 4 0,03 951 5,50 175 1,01 29 0,17 1019 5,87 34 0,2 non disp --- 660 3,822001 5 0,03 795 4,60 135 0,98 21 0,12 942 6,83 18 0,1 13 0,09 361 2,092002 5 0,03 884 5,12 152 0,88 38 0,22 718 4,20 14 0,08 16 0,09 344 1,992003 6 0,03 902 5,22 172 0,90 31 0,18 761 3,99 13 0,07 13 0,07 310 1,792004 58 0,26 1074 4,77 152 0,68 48 0,22 875 3,89 13 0,06 13 0,06 340 1,512005 94 0,44 1404 6,55 125 0,58 50 0,23 849 3,96 12 0,06 11 0,05 299 1,392006 94 0,37 1151 4,57 114 0,45 60 0,24 730 2,90 12 0,05 13 0,05 225 0,89<strong>2007</strong> 66 0,29 1156 5,08 104 0,46 58 0,25 724 3,18 11 0,05 7 0,03 198 0,87Phosphoric and nitric acidmix (50% H<strong>NO</strong>3, 39% H3PO4)CTrichlorosylaneF+, CIsopropylicalcoholF+Ammonia25%CChandler mix (Hydrofluoricacid, Acetic acid, nitric acid)T+, CHydrogenPeroxide 33%XnLiquidOxygenOLiquidHydrogenF+Year ton ton/MSIE ton ton/MSIE ton ton/MSIE ton ton/MSIE ton ton/MSIE ton ton/MSIE m 3 m 3 /MSIE m 3 m 3 /MSIE2000 582 3,37 21 0,12 72 0,41 84,55 0,49 non disp -- 101 0,58 26.468 152 817.228 4.7082001 536 3,10 17 0,12 68 0,39 63,23 0,46 2,94 0,02 92 0,67 35.711 259 638.803 4.6322002 400 2,31 18 0,10 92 0,53 72,98 0,42 4,2 0,02 89 0,52 40.752 236 741.314 4.2892003 360 2,08 31 0,18 96 0,50 53,56 0,28 6,72 0,04 75 0,39 38.451 202 768.818 4.0322004 525 2,33 38 0,17 103 0,46 66,19 0,29 9,45 0,04 79 0,35 36.838 164 961.415 4.2712005 454 2,12 36 0,17 104 0,49 65,64 0,31 7,35 0,03 76 0,36 39.823 186 879.101 4.1012006 445 1,77 43 0,17 99 0,39 64,83 0,26 7,77 0,03 72 0,29 27.102 108 955.508 3.794<strong>2007</strong> 440 1,94 46 0,20 83 0,36 56,40 0,25 5,46 0,02 63 0,28 31.084 137 931.675 4.09619
Analysis of the data shows a generaldownward turn in total consumptionand a constant specifi cconsumption value, demonstratingthe controlled managementof chemical substances, focusedon meeting production needs andpreventing waste. The situationsidentifi ed last year, as describedhere below, remain unchanged:upward trend in absolute andspecifi c consumption of trichlorosilanethat can be attributed to theincreased production of epitaxialwafers, and the increased thicknessof monocrystalline silicondeposited on the epitaxial wafers,requested by clients over the last3 years;Consumption of chemical sustances: Trichlorosylane SiHCl 345Annual consumption (t)3525152000 2001 2002 2003 2004 2005 2006 <strong>2007</strong>YEAR0,240.160,08Specifi c consumption (t/MSIE)Total annual consumptionSpecifi c consumptiondownward trend in the consumptionof acids (with particularreference to hydrofl uoric acid, asubstance that brings the factorywithin the scope of the ItalianLegislative Decree 334/99 concerningmajor accident hazards)and acid mixtures used during thepost-lapping etching stage, obtainedthanks to the introduction ofan alternative caustic etching processusing potassium and sodiumhydroxide, substances with aconsiderably lower environmentalimpact than those used for acidetching;Consumption of chemical sustances: Nitric acid 65%Annual consumption (t)50403020102000 2001 2002 2003 2004 2005 2006 <strong>2007</strong>YEARConsumption of chemical sustances: Hydrofluoric acid 49%Annual consumption (t)180160140120100802000 2001 2002 2003 2004 2005 2006 <strong>2007</strong>YEAR0,210,160,110,060,011,150,950,750,550,35Specifi c consumption (t/MSIE)Specifi c consumption (t/MSIE)20
Consumption of chemical sustances:Phosphoric, nitric and hydrofloridric acid mixAnnual consumption (t)6805804803802801802000 2001 2002 2003 2004 2005 2006 <strong>2007</strong>YEAR3,72,71,70,7Specifi c consumption (t/MSIE)decrease in the absolute andspecifi c consumption of ammoniacalsolution, hydrogen peroxideand isopropyl alcohol, mainlyused during the wafer washingprocess and obtained by meansof process changes designed tolimit consumption.Consumption of chemical sustances: 25% Ammonia solution (NH 4OH)Annual consumption (t)9085807570656055502000 2001 2002 2003 2004 2005 2006 <strong>2007</strong>YEAR0,500,450,400,350,300,250,200,150,10Specifi c consumption (t/MSIE)Consumption of chemical sustances:Phosphoric and nitric acid mix (H<strong>NO</strong> 3+ H 3PO 4)Annual consumption (t)650550450350250150502000 2001 2002 2003 2004 2005 2006 <strong>2007</strong>YEAR4321Specifi c consumption (t/MSIE)Consumption of chemical sustances: 30% Hydrogen peroxide (H 2O 2)Annual consumption (t)1401201008060402000 2001 2002 2003 2004 2005 2006 <strong>2007</strong>YEARConsumption of chemical sustances: Isopropylic alcohol 99,9%0,700,600,500,400,300,20Specifi c consumption (t/MSIE)Total annual consumptionSpecifi c consumptionAnnual consumption (t)11010090807060502000 2001 2002 2003 2004 2005 2006 <strong>2007</strong>YEAR0,700,600,500,400,300,20Specifi c consumption (t/MSIE)21
The plan to adopt cutting technologyconsisting of a steel wire soakedin an abrasive suspensionfor cutting silicon bars in a singlestep was implemented for all barcutting operations in <strong>2007</strong>. Thismeasure has made it possible toconsiderably limit the consumptionof acetic acid and potassiumhydroxide used in the ungluingstage to remove residuesof glue used to stick the siliconbar to the base prior to cutting.The following graphs illustratethe strong downward trend in thechemical substances listed, bothin specifi c and absolute terms,precisely because the ungluingstage no longer contributes tothe factory’s total consumption ofsaid substances.Consumption of chemical sustances: Potassium hydroxide KOHAnnual consumption (t)1201008060402002000 2001 2002 2003 2004 2005 2006 <strong>2007</strong>YEARConsumption of chemical sustances: Acetic acid CH 3COOH18Annual consumption (t)16141210862001 2002 2003 2004 2005 2006 <strong>2007</strong>YEAR0,50,40,30,20,100,100,080,060,040,020,00Specifi c consumption (t/MSIE)Specifi c consumption (t/MSIE)Finally they highlight a situationderiving from the upkeep of animprovement action, strengthenedover the years, that continuesto offer excellent results in termsof environmental performance:that is to say a reduction in theconsumption of hexavalent chrome,a chemical substance, thecompounds of which are classified as carcinogenic by inhalationand are therefore particularlyhazardous. Said reduction hasbeen achieved thanks to a decreasein the number of productdefect tests performed requiringapplication of the chromic etchingprocess and the application of aprocess foreseeing multiple useof the etching bath.Consumption of chemical sustances: Chromium VI70605040302010-2000 2001 2002 2003 2004 2005 2006 <strong>2007</strong>YEARTotal annual consumptionSpecifi c consumptionAnnual consumption (kg)Consumption ofHexavalent ChromiumTotalCons.Spec.Cons.Year kg kg/MSIE 2000=1002000 40 0,23 1002001 32 0,23 1002002 46 0,27 1162003 61 0,32 1382004 34 0,15 662005 8 0,04 152006 7 0,03 11<strong>2007</strong> 4 0,02 70,20-%Specifi c consumption (kg/MSIE)22
Emissions intothe atmosphereThe productive processes of the siteproduce, as a by-product, vapoursand gasses that collect in the exhaustducts. These are eventually brokendown, according to their typologyand danger level, before they arereleased into the atmosphere.The most important emissions intothe atmosphere are monitored at leastevery three years, as requestedby the latest authorisations obtainedfor the emission points; samplingand analysis are performed by aqualified external laboratory coordinatedby the department for protectionof the environment and safety.The limits foreseen in the authorisationsare complied with for all substances.Samples were taken from the singleflues operating in the most drasticoperating conditions possible for theprocesses determining emissionsand therefore represent the mostcritical situation that could occur,which does not represent the actualsituation in terms of the total annualquantity of pollutants emitted.In fact, during the years in whichthe number of hours of operation ofthe plants is limited, such as <strong>2007</strong>,the annual emission value is lower,as shown in the graph showing theTotal emission (t/year)Year2000200120022003200420052006<strong>2007</strong>95,0085,0075,0065,0055,0045,0035,0025,0015,005,00tot (kg/h)3,03893,38343,03522,92202,30873,67552,43801,8468t/annoEmissions into the atmosphereTotal yearly emissionSpecifi c emissionLimit by law (by permit)TOTAL EMISSIONS26,183027,040026,005325,175619,780731,491521,034914,5379total annual amount of emissions tothe atmosphere expressed in tons,which consists of the sum of contributionsfrom all of the pollutantsemitted from flues monitored due totheir importance.t/MSIE0,00303890,00338340,00303520,00292200,00230870,00367550,00243800,0018468t/year tot.authorized88,673188,673188,673188,033688,033688,033688,033690,24992000 2001 2002 2003 2004 2005 2006 <strong>2007</strong>YEAR0000000000Specifi c emission (t/MSIE)23
The following graphs illustrate trendsrelated to the quantity of singlechemical substances released intothe atmosphere, showing both theabsolute values and values normalizedto production for the relevantyear; the respective legal limits arealso shown.Nitrogen OxidesHydrofluoric acidIsopropyl alcoholHydrocloric acidAmmoniaYear2000200120022003200420052006<strong>2007</strong>kg/h1,992,132,122,431,122,641,651,20Limit by law(by permit)5,505,505,505,505,505,505,505,50kg/MSIE98,6123,7104,9110,042,7105,556,645,5kg/h0,01690,00740,02720,00210,00080,00010,00070,0561Limit by law(by permit)0,11000,11000,11000,11000,11000,11000,11000,1100kg/MSIE0,84080,43151,34650,09530,03200,00520,02362,1263kg/h0,1630,3210,0660,1750,0470,0370,0810,010Limit by law(by permit)0,4550,4550,4550,4550,4550,4550,4550,455kg/MSIE8,09018,5993,2467,8911,7951,4592,7880,368kg/h0,0340,0610,0270,0090,0410,0690,0130,091Limit by law(by permit)0,2900,2900,2900,2900,2900,2900,2900,409kg/MSIE0,84080,43151,34650,09530,03200,00520,02362,1263kg/h0,5170,7090,7510,2650,9630,8450,6110,407Limit by law(by permit)2,5932,5932,5932,5202,5202,5202,5202,520kg/MSIE25,6641,1237,1513,1247,6833,7920,9215,43OzoneSilaneChromium VIAcetic acidTotal dustYear2000200120022003200420052006<strong>2007</strong>kg/h0,0080,023-0,0050,0030,0030,0030,002Limit by law(by permit)0,3340,3340,3340,3340,3340,3340,3340,330kg/MSIE0,3871,334-0,2210,1140,1200,1030,079kg/h-0,00032--0,000600,000010,000450,00210Limit by law(by permit)0,03700,03700,03700,03700,03700,03700,03700,0200kg/MSIE-0,01870--0,022800,000400,015420,07947kg/h0,0007000--0,00001320,00000310,00020000,00010000,0001350Limit by law(by permit)0,030,030,030,030,030,030,030,03kg/MSIE0,0347--0,00060,00010,00800,00340,0051kg/h0,29950,10690,02720,02540,05300,00290,00360,0361Limit by law(by permit)0,5500,5500,5500,5500,5500,5500,5500,550kg/MSIE14,86666,19731,34651,14572,01880,11390,12371,3680kg/h0,0130,0200,0210,0070,0790,0790,0720,0423Limit by law(by permit)0,2260,2260,2260,2260,2260,2260,2260,381kg/MSIE0,6221,1331,0400,3282,9933,1432,4701,60324
Emissions into the atmosphere- Nitrogen OxidesQuantity total emission (kg/h)6,05,55,04,54,03,53,02,52,01,51,02000 2001 2002 2003 2004 2005 2006 <strong>2007</strong>YEAR240,0200,0160,0120,080,040,0-Quantity specifi c emission (kg/MSIE)Emissions into the atmosphere - Hydrofluoric acidQuantity total emission (kg/h)0,120,100,080,060,040,020,002000 2001 2002 2003 2004 2005 2006 <strong>2007</strong>YEAR5,65,14,64,13,63,12,62,11,61,10,60,1Quantity specifi c emission (kg/MSIE)Quantity total emissionQuantity specifi c emissionLimit by law (by permit)Emissions into the atmosphere - Isopropyl alcoholEmissions into the atmosphere - Hydrocloric acidQuantity total emission (kg/h)5,04,03,02,01,00,02000 2001 2002 2003 2004 2005 2006 <strong>2007</strong>YEAR30252015105-Quantity specifi c emission (kg/MSIE)Quantity total emission (kg/h)0,450,400,350,300,250,200,150,100,50,02000 2001 2002 2003 2004 2005 2006 <strong>2007</strong>YEAR10,09,08,07,06,05,04,03,02,01,0-Quantity specifi c emission (kg/MSIE)Emissions into the atmosphere - AmmoniaEmissions into the atmosphere - OzoneQuantity total emission (kg/h)2,52,01,51,00,50,02000 2001 2002 2003 2004 2005 2006 <strong>2007</strong>YEAR30252015105-Quantity specifi c emission (kg/MSIE)Quantity total emission (kg/h)0,400,350,300,250,200,150,100,50,02000 2001 2002 2003 2004 2005 2006 <strong>2007</strong>YEAR6,05,04,03,02,01,0--1,0Quantity specifi c emission (kg/MSIE)25
Emissions into the atmosphere - SilaneEmissions into the atmosphere - Cromium VIQuantity total emission (kg/h)0,0400,0350,0300,0250,0200,0150,0100,0050,0000,300,250,200,150,100,05-Quantity specifi c emission (kg/MSIE)2000 2001 2002 2003 2004 2005 2006 <strong>2007</strong> -0,05 0,0002000 2001 2002 2003 2004 2005 2006 <strong>2007</strong>YEARYEARQuantity total emission (kg/h)0,0280,0240,0200,0160,0120,0080,0040,300,250,200,150,100,05--0,05Quantity specifi c emission (kg/MSIE)Quantity total emissionQuantity specifi c emissionLimit by law (by permit)Emissions into the atmosphere - Acetic acidQuantity total emission (kg/h)0,60,50,40,30,20,10,02000 2001 2002 2003 2004 2005 2006 <strong>2007</strong>YEAR181512963-Quantity specifi c emission (kg/MSIE)Emissions into the atmosphere - Total dustQuantity total emission (kg/h)0,400,350,300,250,200,150,100,50,02000 2001 2002 2003 2004 2005 2006 <strong>2007</strong>YEAR108642-Quantity specifi c emission (kg/MSIE)26
Emission of CarbonDioxide EquivalentSaid trend refl ects the trend seenin the factory’s energy consumptionand is in sharp decline thanksto the fact that from March <strong>2007</strong>all of the electricity, steam andabout 2/3 of the frigories requiredby the factory are provided by thenew trigeneration plant, which ispowered by methane and thereforehas a lower impact on theenvironment in terms of the emissionof carbon dioxide comparedto the previous situation. In fact,in previous years the contributionmade to the rise in temperature ofthe earth’s crust was calculatedbased on the assumption thatall of the electricity consumedby the factory was producedby thermoelectric power plants(which contribute greatly to globalwarming due to the fuel oilburnt to produce energy, whichproduces emissions of carbondioxide and other pollutants tothe atmosphere). In reality, onlypart of the energy consumed bythe company, which could not bequantified to a reasonable degreeof certainty, was producedby said plants, but this approachwas adopted as a precaution.Overall a considerable reductionhas been seen in absolute andspecifi c CO 2emissions, resultingin a lower impact on global warmingof the earth’s crust.The table and chart below show thefacility’s emissions expressed incarbon dioxide equivalent values,which represent the facility’scontribution to raising the temperatureof the earth’s surface, aphenomenon known as greenhouseeffect, or global warming(GW).Year2000200120022003200420052006<strong>2007</strong>YearlySpecificTotal Electr.Energy Steam Methane Diesel oil Freon R134a Totalt CO 255.17051.92754.31757.75259.19457.57158.48241.399t CO 246.87043.24045.29747.82049.71647.38648.60033.917t CO 27.7558.2298.6718.8288.8679.3949.0246.873t CO 217024323668451320541446t CO 210691524356t CO 20,600,500,170,300,300,1700t CO 3364208104884156468312156t CO 2/MSIE318377314303263269232182Emissions of Carbon Dioxide EquivalentANNUAL QUANTITY CO 2(t)80.00070.00060.00050.00040.00030.00020.00010.00002000 2001 2002 2003 2004 2005 2006 <strong>2007</strong>YEARRif. toSpec.Electric energySteamSpecifi c emmission CO 2Note: contributions related to Methane and Diesel Fuel are not included in the graph as they were less than1% overall.%100118999583857357400350300250200150100500SPECIFIC QUANTITY CO 2(t/MSIE)27
Waste and fluid drainageWaste water from the variousproduction processes are channelledto the facility’s wastewater purifi cation plant, in functionsince mid 1997, in whichpollutants are treated and purified waters returned to the CavoVeveri irrigation canal, a confluent of the Terdoppio stream,where cooling waters are alsodischarged.Meteoric waters are also channelledinto the same streamthrough separate piping. Civiliandischarges are channelledto the Agogna stream throughthe municipal sewage system,after treatment in the municipalwater purifi cation plant.Listed in the charts below are thecapacities of the different typesof discharges, and the concentrationvalues (highest monthlyaverage recorded in the year considered,calculated as the mathematicalaverage of the concentrationsidentifi ed through internalanalyses on samples from eachdischarge, taken at least threetimes a week on alternate days)of the typical pollutants recordedat the waste water’s purifi cationplant’s discharge. Also indicatedare the limits imposed by currentlegislation:as shown in the charts,these limits are respected in allcases.To provide a complete picture,from <strong>2007</strong> the graph also showsthe maximum concentration valuefound throughout the year in thesamples described above. Theoffi cial sampling well is locatedimmediately upstream from thepoint of entry into the receivingbody of water (as set forth in theregulations in force) and outsideof the factory’s grounds. Boththe process water and part ofthe cooling water deriving fromthe factory meet at that point.In absolute terms, discharge ratesmaintain the downward trend alreadyseen in 2006. In particularthere has been a more signifi cantdecrease in process dischargerates, in line with the reductionin the consumption of deionisedwater used in production. Thedecrease in cooling water wasless relevant, also due to thefact that since March <strong>2007</strong> partof the water supplied for this purposeis sent to the nearby trigenerationplant to cool the motors.Analysis of the graphs showingthe concentration valuesfor polluting parameters typicalof the purifi cation plant dischargeshows that, overall,trends are in line with those ofthe previous three-year period.Year2000200120022003200420052006<strong>2007</strong>Industrial waterdischargem 3 /year2.758.6012.622.1372.931.5343.027.6223.091.7033.313.5813.173.7483.033.580Waste waterfacility dischargem 3 /year2.093.0011.951.8172.638.1942.532.9132.317.5242.615.9072.485.0952.356.383The site industrial water dischargeTOTAL DISCHARGE (mc/year)3.310.0003.010.0002.710.0002.410.0002.110.0001.810.0001.510.0001.210.000910.000610.000310.00010.000INDUSTRIAL WASTE WATER(Water pumped from 1st and 2nd groundwater private wells)Cooling waterdischargem 3 /year665.600670.320293.340494.749774.179697.674688.653677.197Specific industrialwater dischargem 3 /MSIE15.89119.01316.96215.87913.73415.45812.60213.337% Annual specificconsumption2000=100100120107100869779842000 2001 2002 2003 2004 2005 2006 <strong>2007</strong>YEARWaste water facility dischargeCooling water dischargeTotal industrial water dischargeSpecific industrial water dischargeCIVIL WASTE WATER(water suppliedby municipal waterservice and 2ndgroundwater wells)Civil dischargem 3 /year30.52123.99825.55322.54520.22522.71324.82620.53720.00018.00016.00014.00012.00010.0008.0006.0004.0002.0000SPECIFIC DISCHARGE (mc/MSIE)28
YearLimit by LawDLgs 152/062000200120022003200420052006<strong>2007</strong>7,407,507,807,587,707,587,497,65pH-5,5 - 9,55,55,55,55,55,55,55,55,59,59,59,59,59,59,59,59,545,677,066,060,726,738,421,413,8CODmg/l160160160160160160160160160Fluoridemg/l4,305,405,504,905,004,795,054,106666666668,24,811,714,67,812,327,45,3TSSmg/l808080808080808080Nitrite <strong>NO</strong> 2-mg/l0,200,200,400,500,300,260,210,050,60,60,60,60,60,60,60,60,6NitricNitrogen <strong>NO</strong> 3-mg/l1,201,501,802,305,505,192,353,65202020202020202020AmmoniacalNitrogen NH 4+mg/l0,800,301,700,701,101,040,060,18151515151515151515P - Phosphormg/l1,905,205,902,502,603,272,502,5410101010101010101022,728,033,168,460,361,146,443,7Sulfatemg/l100010001000100010001000100010001000Chloridemg/l231,10218,00193,00178,10220,00180,50161,34180,85120012001200120012001200120012001200Waste water - pHValori medi riscontrati10,09,59,08,58,07,57,06,56,05,55,08,186,52000 2001 2002 2003 2004 2005 2006 <strong>2007</strong>YEARWaste water - CODConcentrazione allo scarico (mg/l)170150130110907050301048,962000 2001 2002 2003 2004 2005 2006 <strong>2007</strong>YEARWaste water - Fluoride: F-Concentrazione allo scarico (mg/l)765432105,42000 2001 2002 2003 2004 2005 2006 <strong>2007</strong>YEARYearly average valueYearly minimal valueAverage valueMax and minimum limit by lawYearly average valueAverage valueMax limit by lawYearly average valueAverage valueMax limit by law29
Waste water - Total Sospeded Solids: TSSConnection value at discharge point (mg/l)908070605040302017,861002000 2001 2002 2003 2004 2005 2006 <strong>2007</strong>YEARWaste water - Ammoniacal Nitrogen: N-NH 4+Connection value at discharge point (mg/l)18151296302000 2001 2002 2003 2004 2005 2006 <strong>2007</strong>YEARWaste water - Chloride: Cl-Connection value at discharge point (mg/l)1400120010008006004002000299,274,02000 2001 2002 2003 2004 2005 2006 <strong>2007</strong>YEARWaste water - Nitrite: N-<strong>NO</strong> 21,0Connection value at discharge point (mg/l)Connection value at discharge point (mg/l)0,80,60,40,20,02000 2001 2002 2003 2004 2005 2006 <strong>2007</strong>YEARWaste water - Phosphor P04: P-PO 41210864202000 2001 2002 2003 2004 2005 2006 <strong>2007</strong>YEARYearly average valueAverage valueMax limit by law0,565,95Waste water - Nitric Nitrogen: N-<strong>NO</strong> 324Connection value at discharge point (mg/l)Connection value at discharge point (mg/l)2016128402000 2001 2002 2003 2004 2005 2006 <strong>2007</strong>YEARWaste water - Sulfate: SO 412001050900750600450300150017,0879,72000 2001 2002 2003 2004 2005 2006 <strong>2007</strong>YEAR30
WasteThe total waste production valuefor 2006 has been confi rmedagain for <strong>2007</strong> and an increasehas been confi rmed in the amountof waste disposed of compared tothat recycled, in fact from 2005 itwas no longer possible to sendchemical and physical mud tocement factories for recycling,so it was sent for treatment andsubsequently disposed of in therubbish tip.Also, on analysis of quantitativedata related to waste divided intocategories in accordance with thehazardous nature of the same, aconsistent reduction (about 36%)can be seen in the production ofhazardous waste mainly thanksto a reduction in the production ofspent chromic-hydrofl uoric acidmixture, which has a considerableeffect on the total quantity.Said reduction has been achievedthanks to improvements in theetching process that have madeit more effi cient and reduced theconsumption of acids, leading toa reduction in spent acid waste.With regards to non-hazardouswaste, there was a considerablereduction in the amount of mudproduced by the purifi cation plantin <strong>2007</strong> (a decrease of about28%), mainly achieved thanksto more efficient operation of thedrier, which removes the water inwhich the mud is soaked resultingin a considerably lower volumeand weight.The fact that spent abrasive materialproduced by the wire cuttingdepartment is sent to an externalplant for recycling and there hasbeen a reduction in the consumptionof chemical substancesin the production department,achieved thanks to improvementactions implemented over the lastthree years, have also contributedto a reduction in the formationof said mud. However, sendingspent abrasive material derivingfrom wire-saw cutting machinesto an external plant has causedan increase in the production ofnon-hazardous waste, which hasfor the most part absorbed the reductionin the production of mudsent for recycling or disposal.However, in this case an increasein the production of waste is stillto be considered in a positive lightas it guarantees the recycling ofproduction residue that wouldotherwise have been sent to thepurifi cation plant, adding to theload of pollutants to be treated.In the plant different types of wasteare collected to recovery themaximum quantity.The charts and tables below illustratethe trend of waste productionnormalised by productionlevels, as at the end of <strong>2007</strong>, brokendown by classifi cation (special,non hazardous and hazardous),and destination (recoveryor disposal).Year Disposed waste Recovered waste Total2000200120022003200420052006<strong>2007</strong>t/year1.001417419432524557880816t/MSIE5,763,022,422,272,331,353,493,59%10052423940236162t/year3.2411.6992.2352.6332.7292.9731.8941.878t/MSIE18,6712,3212,9313,8112,1215,107,528,00%10066697465814044t/year4.2422.1162.6543.0653.2533.5312.7742.694t/MSIE24,4315,3415,3516,0714,4516,4511,0111,84%10063636659674548ANNUAL WASTE PRODUCTION (t/year)Waste production5.5005.0004.5004.0003.5003.0002.5002.0001.5001.00050002000 2001 2002 2003 2004 2005 2006 <strong>2007</strong>YEAR3634323028262422201816141210SPECIFIC PRODUCTION (t/MSIE)RecoveredDisposedTotalSpecifi c31
Year2000200120022003200420052006<strong>2007</strong>Hazardous wasteTotal Spect/year t/MSIE5,87 0,037,46 0,0510,33 0,0616,40 0,0918,12 0,0810,15 0,0511,81 0,057,60 0,03%10016017725424013913999Hazardous waste production20,00ANNUAL PRODUCTION (t/year)18,0016,0014,0012,0010,008,006,004,002,000,10,10,10,0SPECIFIC PRODUCTION (t/MSIE)Hazardous waste productionSpecific production-2000 2001 2002 2003 2004 2005 2006 <strong>2007</strong>YEAR0,0Non hazardous wasteYearTotal Spect/year t/MSIE%2000200120022003200420052006<strong>2007</strong>4.2362.1092.6433.0483.2353.5212.7622.68724,4015,2915,2915,9914,4516,4210,9711,8110063636659674548Non hazardous waste production5.000ANNUAL PRODUCTION (t/year)4.5004.0003.5003.0002.5002.0001.50040,035,030,025,020,015,0SPECIFIC PRODUCTION (t/MSIE)Non hazardous waste productionSpecific production1.0002000 2001 2002 2003 2004 2005 2006 <strong>2007</strong>YEAR10,032
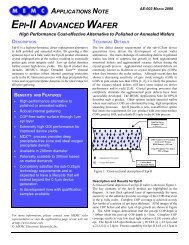
Areas covered by reclaiming planM2M1ABWestsideReclaimed areas at 1997Reclaimed areas at 2004Reclaimed areas at 2006Water proofed areas at 2006Areas to be water proofed at 2008Storical plantCNGround contaminationThe area on which the trigenerationplant stands has been decontaminatedover the last threeyears by means of removal of excavatedearth from the site (about2,000 tons of earth contaminatedwith heavy metals and 400tons contaminated with asbestosfrom activities conducted on thesite before it was purchased by<strong>MEMC</strong>). In fact said plant standson a portion of land covered by adecontamination program agreedwith the relevant authorities, thelast stage of which is to be completedby the end of 2008 andconsists of: waterproofi ng of thesurface and the creation of a meteoricwater collection network.With regards to the aquifer, pumpingfrom active wells and drainagepiezometers and monitoringactivities have been continued.Concentration values of pollutantsin the aquifer have maintainedthe downward trend seen inthe past, highlighting the effectivenessof decontamination measuresalready implemented. Inparticular, this three year periodhas seen the absence of fl uoridesin concentrations in excess ofthose allowed for groundwater inthe monitoring piezometer upstreamfrom the factory.Polyclorobiphenil PCBThe facility is not currently equippedwith transformers with an oilconcentration of over 50ppm, a limitover which a number of are securitymeasures are provided forby current legislation. In anycase, every three years analysesare carried out to verifythe concentration of PCB inoil of the three transformers inwhich previous tests detectedthe presence of PCB traces.Ozone depletingsubstanceFreon 22 is used in the factoryas a cooling liquid in someof the air-conditioning units.A survey of these plants is updatedevery year.Said chemical product is includedin the list of ozone depleting substancesprepared by the EuropeanCommunity (Regulation CE2037/00), for which special actionmust be taken to control its useand prevent emissions to the atmosphere.The date set for completionof the phasing out processis 31/12/2005.A plan to eliminate any R22 stillcontained in some of the factory’scooling systems was defi ned in2005 and plants that still containthe substance are being replacedin compliance with said plan.33
Outside noiseThe environmental impact ofnoise on the surrounding areaswas measured in equivalent noiselevels expressed in decibels,along the facility’s boundaries.The <strong>MEMC</strong> facility is likely to havebeen included in Class VI, “ExclusivelyIndustrial Areas”, for whichthe daytime and night-time noiseoutput limit is set at 65dBA, and thenoise input limit is set at 70dBA.In 2005, many actions has beenput in place, aimed at reducingnoise emissions produced bythe plant in points where previousnoise readings had exceeded65dBA (and were inany case lower than the 70dBAdaytime and night-time limit imposedby previous legislation).The points in question were positionedalong the facility’s southernboundary, where the epitaxy department’sextraction ventilatorsand air conditioning system arelocated, which create noise levelsof close to 70dBA, in close proximityto the boundary.<strong>MEMC</strong> layout whit outside noise levelsValues of outside noise levels are measured in 200660,569,564,061,057,560,0 64,0CaptionNoise samples(during daytime) in dBANoise intput limit 70 dBA65,0Updated results are awaited forthe acoustic impact determinedby the trigeneration plant, currentlybeing defi ned with the plantrunning at full capacity. Consequently,the factory fl oor plan63,067,564,068,059,061,067,5 66,5N57,059,058,058,0shown is marked with the mostup to date noise values available,detected at the boundariesof the grounds and determined by<strong>MEMC</strong> activities.Significance of indirectenvironmental aspectsThe following table summarisesthe activities that, based on asignifi cance valuation of indirectenvironmental aspects, lead to orcan lead to signifi cant indirect environmentalimpacts.ACTIVITIES THAT ARE SUBCONTRACTED ON THE SITEWith regards to companies thatoperate on the site, all personnelbefore starting work receive hazardinformation, as well as whatto do during their working activitiesto assure personal safety andenvironmentalprotection.The dangerous substances usedby contractors and the wastesproduced during their working activitiesare controlled and specifi cinstructions are provided for theuse of proper containment areasto avoid any risk of contamination.The behaviour of employeesof external companies in terms ofenvironmental safety is verifi edby a periodical audit. The resultcontributes to the assignment ofclassifi cation points to the contractor.PROCUREMENT OFPRODUCTS AND SERVICESA considerable change was madeto the factory’s source of supplyin <strong>2007</strong>: a trigeneration plant,owned by the company and managedby a third party, was putinto service. Said plant burns naturalgas instead of fuel oil in thecombustion reaction, producinga far lower quantity of pollutantscompared to the amounts producedby plants using liquid orsolid fuels. This has resulted in adecrease in the indirect environmentalimpact related to emissionsto the atmosphere derivingfrom energy consumption. However,this plant also affects otherindirect environmental aspects,such as: Energy Consumption,Water Consumption, Consumptionof Auxiliary materials, Fluiddrainage, Emissions to the atmosphere,Smells, Outdoor Noise,Ground contamination in emergencysituations, Non-ionizing radiation,Soil consumption, Visualintrusion, Effects on biodiversity.The correct management of saidenvironmental aspects is controlledby means of periodic auditsheld at the plant, by which anyimprovement action to be takento limit associated impacts can beidentifi ed.34
EXTERNAL TRANSPORTWith regards to the transportationof dangerous materials a controlprocedure has been adopted forthe transport vehicles (on enteringand leaving the site) and thequalifi cations of the driver (ADRregulations). The <strong>Novara</strong> site isa considerable contributor to theamount of traffi c in the area inwhich it is situated. (St. Agabio)Inside the organization in 2000an individual has been appointedas the person responsible for thecoordination of movements relatingto travel from home to work,including the planning of actionsto reduce the amount of polluntantemission, noise and vibrationproduced by transport.Every year, the above-mentionedCompany Manager checks the levelof achievement of the actionsplanned for the previous year,prepares a new traffi c improvementaction plan and sends saidplan to the relevant authorities.The following activities of an informativenature were completed aspart of the <strong>2007</strong> company mobilityimprovement plan:information was given to employeesby means of noticesplaced on the notice boardrelated to traffi c restrictionsplanned by <strong>Novara</strong> council,complete with detailed mapsshowing roads open to traffi cadjacent to the boundaries ofthe area concerned, availableparking spaces and shuttleservices to the city centre;participation in a training dayorganised by the province of<strong>Novara</strong> and the <strong>Novara</strong> AutomobileClub for a sustainablemobility project and completionof a relative questionnaire preparedfor the preliminary stageof a survey of companies andscholastic institutions.Data was also collected in previousyears by means of employeequestionnaires. The followingconclusions have been drawnfrom the assessment of data collectedfrom 652 questionnaires:The fl eet of cars owned bycompany employees wasfound to be suffi ciently “modern”,more than 40% of thecars were classifi ed to Euro3;Cars are mainly used in urbanareas for daily family needsand much less frequently forlong-distance journeys;This makes it very diffi cult toencourage the use of car poolingor public transport;The use of alternative fuels topetrol and diesel is extremelylimited.The use of bicycles and car poolingwas found to be limited despitepast improvements made tothe cycle path in Viale Gherzi andthe company’s cycle store designedto encourage employees totravel by bicycle instead of usingthe car and a web site createdand advertised for the exchangeof information for car pooling (forjourneys between home and workmade by employees living in thesame area and for the organisationof trips to the Merano site).PROCESSING AND EMPLOY-MENT OF THE PRODUCTSUPPLIED BY <strong>MEMC</strong>For the movement of the siliconwafers <strong>MEMC</strong> has reached anagreement with its main customersto send the product in aluminiumcases. All our customersalso have the opportunity to retrievethe plastic packages thatcontain the wafers so that theycan be reused for future consignments.<strong>MEMC</strong>’s customers operatein countries that are awareof the environment and they havegot the ISO 14001 certifi cate and/or EMAS registered. The <strong>MEMC</strong>site is frequently audited by itsclients both on quality and environmentaspects. Since 2006<strong>MEMC</strong> has been selling waferstargeted for solar applications.35
LOCAL ACTIVITIESAn indirect environmental aspectthat has considerable significance is the one generated bycommunication activities towardsexternal interested parties. In factthese are specifi ed in the annualexternal communication plans forthe sensitisation of an increasingaudience for the importance ofthe environment. In the course of<strong>2007</strong>, the following communicationand awareness enhancingactivities were planned and carriedout, addressed to the externalcommunity, aimed at informingan increasing number of peopleon the importance of this topic:divulgation of the annualupdate of the 2005-2006<strong>Environmental</strong> Plan throughits Intranet and Internetposting (in Italian and <strong>English</strong>),and dedicated meetings toinform clients;high school visits to the facility;divulgation of the annual updateof the 2006 <strong>Environmental</strong>Plan tocthe external communityby email;participation in post-graduationmaster courses on <strong>Environmental</strong>Management Systems;assistance in the writing of adissertation on <strong>MEMC</strong>’s<strong>Environmental</strong> ManagementSystem;collaboration with competentbodies and nearby enterprisesin the drafting of an informationleafl et addressed to the externalcommunity on the proceduresand behaviours to adoptin case of emergency.INDIRECT ENVIRONMENTAL ASPECTSOUTSIDE CONTRACTORS ACTIVITIES IN SITEMaintenance and civil construction contractorsCleaning contractors and canteen servicePRODUCTS AND SERVICES PURCHASINGRecovery/disposal of waste (hazardous and not hazardous)Raw material purchasing (silicon bars and dopants)Hazardous chemical purchasingNot hazardous product proceding (chemical and not)Electrical energy and steam purchasingOil purchasingMethan purchasingEXTERNAL TRASPORTATIONHazardous waste and sludge from waste water facility trasportationNot hazardous waste trasportationRaw material trasportation (silicon bars and dopants)Hazardous chemical product trasportationNot hazardous product trasportation (chemical and not)Product trasportation (silicon wafer)People trasportation<strong>MEMC</strong> SILICON WAFER TRANSFORMATION AND USAGESilicon wafer transformatione made by the customersChips usageChips disposalFotovoltaic cellsSilicon steel for laminationProduct contains silicon chipPackaging used to contain silicon wafersACTIVITIES FOR OUTSIDE COMUNITYComunication/sensibilationEconomic and social contribution✖ very significative ✖ significative ✖ not significative✖✖✖✖✖✖✖✖✖✖✖✖✖✖✖✖✖✖✖✖✖✖✖✖✖36
09<strong>Environmental</strong>Improvement Actions:“THE ENVIRONMENTAL PROGRAM”The following is a summary of the<strong>2007</strong> environmental program withthe results achieved at the end ofthe year. When the result achieveddiffers from the target setthe value of said result is shown,otherwise achievement of the targetis confi rmed by the words targetachieved. Each environmentalaspect is also marked with anicon, the colour of which indicatesthe level of importance of the impactassessed in <strong>2007</strong>.SUMMARY OF <strong>2007</strong> ENVIRONMENTAL PROGRAMThe following table illustrates the2008-2011 environmental improvementprogram.ObjectiveArea involvedImprovement actionTargetResultachievedNotesEnergy consumption - standard conditionsReduce energyconsumption in the pointsof usePLANTS: Optimisation of compressedair production plant with newcompressorDIRECT ENVIRONMENTAL ASPECTS- 1.000.000 kWh/year(- 250 ton/year)TargetachievedPLANTS: Improve energy performancewith the production of electricity, steamand frigories by means of atrigeneration plant.- 5000 ton/year- 4400ton/yearPAS: Make personnel aware of theneed to reduce energy consumptionConduct meetingswith all personnelTargetachievedMeetings were held withpersonnel and posters weredisplayed on the notice boardsshowing ways of savingenergyWater consumption: 2nd aquifer - standard conditionsReduce the consumptionof water from thesecond aquiferPOLISHING: Reduce consumptionof water from the second aquiferthrough reduced consumption of D.I.-10%TargetachievedConsumption of auxiliary production materials - standard conditionsReduce consumptionof auxiliary productionmaterialsMODIFICATION: Reduce consumptionof acetic acid, KOH for conventionalungluing cutting-50%Targetachieved37
SUMMARY OF <strong>2007</strong> ENVIRONMENTAL PROGRAMObjectiveArea involvedImprovement actionTargetResultachievedNotesWaste and fluid drainageOptimise WWT operationand improve outputparameter controlsReduce production of<strong>NO</strong>N-hazardous wasteReduce diffuseemissionsReduce the level of contaminationof the aquiferfrom VOCs, fl uoridesand other pollutantsReduce potential levelof Freon 22 in theatmospherePLANTS: Improve WWT managementwith control of critical parameters(rev. OP, time schedules andplant engineer training)Non-hazardous waste - standard conditionsEmissions - standard conditionsGround contamination - past conditionsWWT: Reduce production of biologicalmud through external recyclingof SiCInstallation of filter on WWT limedissolverDecontamination of ground andaquifer: Waterproof the area markedM2 located at the rear, west side ofthe factoryOzone depleting substances - standard conditionsEmissions to the atmospherePLANTS: Implement plan to replaceFreon 22 with non-ODC cooling fl uidsDIRECT ENVIRONMENTAL ASPECTSConcentrazioneAverage concentrationof fluorides in24 h < o = 4 ppm-5%Reduction of diffusedust emissionCompletion ofrequested 471/99actionsCompletion ofreplacement planINDIRECT ENVIRONMENTAL ASPECTSTargetachievedTargetachievedTargetachievedDelayedactionAction inprogressThe action was postponedto 2008Reduce indirectemissions causedby internal energyconsumptionWater consumptionGuarantee a suffi cientsupply of water forfi re-fi ghting purposesPLANTS: Provide the plant withelectricity and steam produced by thetrigeneration plant with a consequentreduction in the emissions of <strong>NO</strong>x,SOx, Tot. particles, CO2Groundwater consumption:verify the creation of an autonomousfi re-fi ghting water networkComplete the connectionfor the newsupplyEMERGENCY CONDITIONSComplete verificationTargetachievedTargetachieved38
2008 - 2011 ENVIRONMENTAL PROGRAMObjectiveArea involvedImprovement actionTargetDeadlineDepartmentresponsibleEnergy consumption - standard and anomalous conditionsReduce energyconsumption in thepoints of useReduce the consumptionof water from thesecond aquifer in thepoints of useOPERATIONS: Reduce specific energyconsumption by testing the operation ofmachinery/plants during operation andwhen in standbyOPERATIONS: Reduce the factory’sspecifi c water consumption bytesting the operation of machinery/plants during operation and when instandbyDIRECT ENVIRONMENTAL ASPECTS- 15%Water consumption: 2nd aquifer - standard and anomalous conditions- 15%Consumption of auxiliary production materials - standard and anomalous conditionsRiduzione del consumoReduce specifi c consumptionof chemicalsubstances in the pointsof useOPERATIONS: Reduce the factory’sspecifi c technical gas consumptionby testing the operation of machinery/plantsduring operation and when- 15%in standbyDec - 08Dec - 08Dec - 08IN<strong>NO</strong>VATIONIN<strong>NO</strong>VATIONIN<strong>NO</strong>VATIONMODIFICATIONS: Reduce specificconsumption of HF, H<strong>NO</strong>3, H3PO4for implementation of fast lightprocess on vertical machine 2.-10%Dec - 08IN<strong>NO</strong>VATIONNon-hazardous waste - standard conditionsReduce production of<strong>NO</strong>N-hazardous wasteFACTORY: Make personnel awareof the importance of reducing theproduction of mixed urban wastesent for disposal- 5%Dec - 08PASEmissions - standard conditionsReduce particleemissionsPLANTS: Reduce particles derivingfrom the storage of dusty waste mudby means of a monthly inspectionof container area and definition ofperiodic cleaning if necessaryDefi nition andimplementation ofinspection planDec - 08PLANTS39
2008 - 2011 ENVIRONMENTAL PROGRAMObjectiveArea involvedImprovement actionTargetDeadlineDepartmentresponsibleGround contamination - emergency conditionsEliminate possible contaminationin the event ofaccidental spillageGround contamination - past conditionsReduce the level of aquifercontamination fromVOCs and fl uoridesUpgrading loading/unloading area forfl ammable chemical productsImplement activities agreed with theauthorities that authorised the decontaminationproject in compliance withMinisterial Decree 471/99DIRECT ENVIRONMENTAL ASPECTSComplete upgradingCompletion of MD471/99 actionsDec - 08Dec - 08IN<strong>NO</strong>VATIONPASOzone depleting substances - standard conditionsReduce potential level ofFreon 22 in the atmosphereduring AC maintenanceactivitiesPLANTS: Implement plan to replaceFreon 22 with non-ODC cooling fl uidsCompletion ofreplacement planDec - 09PLANTS40
Free translation of abstract from<strong>Environmental</strong> <strong>Statement</strong> validatedby <strong>Environmental</strong> VerifierERM CVS (Accredition number:UK-V-0031) 33St MaryAxe,London EC3A8LL andapproved by Italian CompetentBody 25/11/2008.<strong>Novara</strong> plant referring:mmigliorini@memc.itazoppis@memc.it1st Edition - 2009Next validation: May 2009All rights riservatedGraphic project:Art: www.julita.it41
<strong>MEMC</strong> Electronic Materials S.p.A.Viale Gherzi, 3128100 <strong>Novara</strong> - ItaliaTel. (+39) 0321 334444Fax (+39) 0321 691000Via Nazionale, 5939012 Merano (Bz) - ItaliaTel. (+39) 0473 333333Fax (+39) 0473 333270www.memc.comCompany Certifi cationISO TS 16949ISO 14001OHSAS 18001<strong>Novara</strong> Plant