Recovery Plan for the Northern Spotted Owl - DRAFT
Recovery Plan for the Northern Spotted Owl - DRAFT Recovery Plan for the Northern Spotted Owl - DRAFT
01CDarTable 1.5. Size class distribution of conservation units under various spotted owl conservation strategies in the Stateof California.Number of Conservation Areas By Size Class (In Acres)AlternativeLess than 10 to10 000 20.00020 to30.00030 to40.00040 to50 00050 to60 00060 to 'More than70.000 80.000TotalUnitsDCAHCALSOG+OWLLSOG514840276846532263113741440333236573848160461 No areas between 70,000 and 80,000 acres were located in CaliforniaDCA = designated conservation areaHCA = habitat conservation area delineated by ISCLSOG+OWL = most significant old-growth units plus owl additionsLSOG = most significant old-growth unitsI
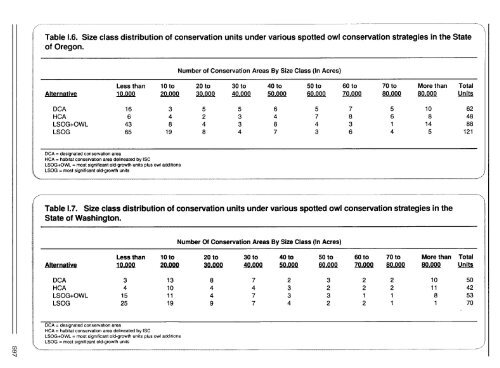
4Table 1.6. Size class distribution of conservation units under various spotted owl conservation strategies in the Stateof Oregon..-.Number of Conservation Areas By Size Class (In Acres)Less than 10 to 20 to 30 to 40 to 50 to 60 to 70 to More than TotalAlternative 10.000 20.000 30,000 40.000 50.000 60000 70 80000 80.000 UnitsDCA 16 3 5 5 6 5 7 5 10 62HCA 6 4 2 3 4 7 8 6 8 48LSOG+OWL 43 8 4 3 8 4 3 1 14 88LSOG 65 19 8 4 7 3 6 4 5 121DCA = designated conservation areaHCA = habitat conservation area delineated by ISCLSOG+OWL = most significant old-growth units plus owl additionsLSOG = most significant old-growth units/KTable 1.7. Size class distribution of conservation units under various spotted owl conservation strategies in theState of Washington.Number Of Conservation Areas By Size Class (In Acres)Less than 10 to 20 to 30 to 40 to 50 to 60 to 70 to More than TotalAlternative 10.000 20.000 30.000 40.000 50.000 60.000 70.000 80.000 80.000 UnitsDCA 3 13 8 7 2 3 2 2 10 50HCA 4 10 4 4 3 2 2 2 11 42LSOG+OWL 15 11 4 7 3 3 1 1 8 53LSOG 25 19 9 7 4 2 2 1 1 70DCA = designated conservation areaHCA = habitat conservation area delineated by ISCLSOG+OWL = most significant old-growth units plus owl additionsLSOG = most significant old-growth units
- Page 562 and 563: County receipts were estimated to d
- Page 564 and 565: B. Potential Social Costs of Owl Co
- Page 566 and 567: The contrast between the behavior d
- Page 568 and 569: 0U1 n1nDTable H.2. Economic depende
- Page 570 and 571: cḻlTable H.4. Economic characteri
- Page 572 and 573: An analysis completed by the State
- Page 574 and 575: V. Preliminary Evaluation of the Ec
- Page 576 and 577: 25-° 20/0M 15-a)CLU)0 10-0CL 5 -0)
- Page 578 and 579: 25 -- 20-0co/o 15--Da)a0a)10m~ C) 5
- Page 580 and 581: forestlands. The costs of productio
- Page 582 and 583: In Figure H.8, the equilibrium betw
- Page 584 and 585: foregone and the way they will save
- Page 586 and 587: The income created by the purchase
- Page 588 and 589: Two concepts are useful for underst
- Page 590 and 591: y an estimate of the price that wou
- Page 592 and 593: Table H.10. Comparison of timber em
- Page 594 and 595: of the second year. The same assump
- Page 596 and 597: are generally much lower than for c
- Page 598 and 599: 582
- Page 600 and 601: studies at University of Washington
- Page 602 and 603: 586
- Page 604 and 605: Most significant late successionall
- Page 606 and 607: to evaluate options. Information in
- Page 608 and 609: Q0Table 1.1. Estimated acres and ow
- Page 610 and 611: soTable 1.3. Estimated acres and ow
- Page 614 and 615: Table 1.8. Frequency distribution o
- Page 616 and 617: Literature CitedThomas, J.W., E.D.
- Page 618 and 619: 602
- Page 620 and 621: - The overlap of home ranges among
- Page 622 and 623: Table J.2. Acreage and owl numbers
- Page 624 and 625: continuedDCA Land AcreageIdent. Sta
- Page 626 and 627: Table J.4. Acreage and owl numbers
- Page 628 and 629: Table J.5. Acreage and owl numbers
- Page 630 and 631: Table J.6. Acreage and owl numbers
- Page 632 and 633: Table J.7. Acreage and owl numbers
- Page 634 and 635: Table J.9. Acrea ?e and owl numbers
- Page 636 and 637: Table J.10. Acreage and owl numbers
- Page 638 and 639: continued-DCA LandIdent. StatusAcre
- Page 640 and 641: -DCAIdent.LandStatusAcreageNRF Tota
- Page 642 and 643: 626
- Page 644 and 645: Experience Includes: Assistant Dire
- Page 646 and 647: Education: B.S. in forestry from Or
- Page 648 and 649: Team SupportCharles Bruce, Oregon D
- Page 650 and 651: continued-1 5-24-91 Other SpeciesSu
- Page 652 and 653: continued-9-16 thru9-20-919-19-91Sp
- Page 654 and 655: Perry, D. 1991. The ecology of coar
- Page 656 and 657: 2mandate the achievement of recover
- Page 658 and 659: 642
- Page 660 and 661: 644
4Table 1.6. Size class distribution of conservation units under various spotted owl conservation strategies in <strong>the</strong> Stateof Oregon..-.Number of Conservation Areas By Size Class (In Acres)Less than 10 to 20 to 30 to 40 to 50 to 60 to 70 to More than TotalAlternative 10.000 20.000 30,000 40.000 50.000 60000 70 80000 80.000 UnitsDCA 16 3 5 5 6 5 7 5 10 62HCA 6 4 2 3 4 7 8 6 8 48LSOG+OWL 43 8 4 3 8 4 3 1 14 88LSOG 65 19 8 4 7 3 6 4 5 121DCA = designated conservation areaHCA = habitat conservation area delineated by ISCLSOG+OWL = most significant old-growth units plus owl additionsLSOG = most significant old-growth units/KTable 1.7. Size class distribution of conservation units under various spotted owl conservation strategies in <strong>the</strong>State of Washington.Number Of Conservation Areas By Size Class (In Acres)Less than 10 to 20 to 30 to 40 to 50 to 60 to 70 to More than TotalAlternative 10.000 20.000 30.000 40.000 50.000 60.000 70.000 80.000 80.000 UnitsDCA 3 13 8 7 2 3 2 2 10 50HCA 4 10 4 4 3 2 2 2 11 42LSOG+OWL 15 11 4 7 3 3 1 1 8 53LSOG 25 19 9 7 4 2 2 1 1 70DCA = designated conservation areaHCA = habitat conservation area delineated by ISCLSOG+OWL = most significant old-growth units plus owl additionsLSOG = most significant old-growth units


