- Page 1 and 2:
I 1.2:Sp 6/draftRecovery Plan for t
- Page 7:
List of FiguresTable 4.1 Abbreviate
- Page 11 and 12:
Recovery ObjectiveSecretary of the
- Page 13 and 14:
Management Rules for Designated Con
- Page 15 and 16:
Monitoring and Research ProgramThe
- Page 17:
Chapter IIntroduction1
- Page 20 and 21:
"Threatened species" means a specie
- Page 22 and 23:
B. The Interagency Scientific Commi
- Page 24 and 25:
lished works and many government do
- Page 27 and 28:
II.A. Natural History of theNorther
- Page 29 and 30:
I- \IzXelT - - -.11 I..., ... I.."
- Page 32 and 33:
spring. Territories probably are sm
- Page 34 and 35:
Northern goshawks (Accipiter gentil
- Page 36 and 37:
also use a variety of nest sites in
- Page 38 and 39:
Home Range SizeHome range is define
- Page 40 and 41:
Table 2.2. Median amounts of old-gr
- Page 42 and 43:
3. Life Historycannot reject the hy
- Page 44 and 45:
Dispersal1984, Thomas et al. 1990,
- Page 46 and 47:
4. ConclusionOur knowledge of the n
- Page 48 and 49:
Ca n a d aEastern Washington Cascad
- Page 50 and 51:
Table 2.3. Estimated spotted owl ha
- Page 52 and 53:
Table 2.4. Significant threats to t
- Page 54 and 55:
Table 2.5. Results of surveys for s
- Page 56 and 57:
isolated. In these provinces, small
- Page 58 and 59:
centers for 30 to 35 spotted owl te
- Page 60 and 61:
Southwest Washington occupies a key
- Page 62 and 63:
Distribution of Habitat and Populat
- Page 64 and 65:
Province Isolation. The eastern Was
- Page 66 and 67:
were in suitable habitat condition.
- Page 68 and 69:
Estimated acres of forest landbase:
- Page 70 and 71:
owned and contain little suitable h
- Page 72 and 73:
Vulnerability to Natural Disturbanc
- Page 74 and 75:
Douglas-fir/hardwood types, the lat
- Page 76 and 77:
miles from the contiguous populatio
- Page 78 and 79:
In comparison, the southern part of
- Page 80 and 81:
Sacramento River Canyon now provide
- Page 82 and 83:
On January 11, 1980, there was an a
- Page 84 and 85:
vation Strategy for the Northern Sp
- Page 86 and 87:
transfer of one area to the Grand R
- Page 88 and 89:
The BLM Spokane (Washington) Distri
- Page 90 and 91:
3. National Park ServiceThe followi
- Page 92 and 93:
The results of a consultation are s
- Page 94 and 95:
- Since landowners already face cut
- Page 96 and 97:
4. Cumulative Effects AssessmentThe
- Page 98 and 99:
Assessment, Planning, and Monitorin
- Page 100 and 101:
Spotted owl nesting sites and activ
- Page 102 and 103:
Coastal Oregon Productivity Enhance
- Page 104 and 105:
including wildlife. In other cases,
- Page 106 and 107:
Currently, the Yakima Indian Nation
- Page 108 and 109:
where timber harvest is limited to
- Page 111 and 112:
III.A. Recovery Objective and Delis
- Page 113:
4. The population is unlikely to ne
- Page 116 and 117:
Needs of other species should be co
- Page 118 and 119:
years. The strategy of managing for
- Page 120 and 121:
't0
- Page 122 and 123:
Finally, the plan recommends mainta
- Page 124 and 125:
A total of 1,181 pairs of owls has
- Page 126 and 127:
DKnown owlsin the OregonprovincesKn
- Page 128 and 129:
mologists, and representatives of o
- Page 130 and 131:
this prey species is an appropriate
- Page 132 and 133:
After 100 years residual snags will
- Page 134 and 135:
2. Fuelwood Gathering. If allowed,
- Page 136 and 137:
The application of prescriptions A,
- Page 138 and 139:
owls. (Refer to tables in section I
- Page 140 and 141:
PRESCRIPTION D -RETAIN OWLS IN MANA
- Page 142 and 143:
126
- Page 144 and 145:
DCA Management Plans.The recovery p
- Page 146 and 147:
Endangered Species Act) or through
- Page 148 and 149:
6. Costs to landowners should be re
- Page 150 and 151:
The real or perceived disincentives
- Page 152 and 153:
authority of the public body to ent
- Page 154 and 155:
* Use the recovery plan's recommend
- Page 156 and 157:
140
- Page 158 and 159:
Supplemental pair areas - Habitat d
- Page 160 and 161:
Numbers of owls currently are estim
- Page 162 and 163:
Biological goals and implementation
- Page 164 and 165:
ning. Also, several unsurveyed area
- Page 166 and 167:
Owl pairsKnown owlsin the province3
- Page 168 and 169:
- Initiate long-range planning effo
- Page 170 and 171:
Table 3.8. Summary comments on the
- Page 172 and 173:
from nonfederal lands are needed to
- Page 174 and 175:
Eastern Washington Cascades Provinc
- Page 176 and 177:
(Owl pairs140 - _ _ _ _ _ _ _ _ _ _
- Page 178 and 179:
habitat in DCA WD- 16. Approximatel
- Page 180 and 181:
Table 3.12. Summary comments on the
- Page 182 and 183:
Ttllwrnook/Astoria area. Provide su
- Page 184 and 185:
connectivity between key DCAs. This
- Page 186 and 187:
ITable 3.14. Summary comments on th
- Page 188 and 189:
crest of the Cascade Mountains. The
- Page 190 and 191:
ITable 3.16. Summary comments on th
- Page 192 and 193:
sites on federal lands (figure 3.21
- Page 194 and 195:
Owl pairsL I 350- _ _ . ...........
- Page 196 and 197:
DCAs, often combined with adjacent
- Page 198 and 199:
Owl pairsLiKnown owlsin the provinc
- Page 200 and 201:
nesting and roosting habitat until
- Page 202 and 203:
Option 3: Management of clusters: g
- Page 204 and 205:
Table 3.21. Summary of acreage and
- Page 206 and 207:
Owl pairs -Known owlsin the provinc
- Page 208 and 209:
and to within 0.5 miles of the acti
- Page 210 and 211:
Spotted owls have been found at 86
- Page 212 and 213:
ITable 3.24. Summary comments on th
- Page 214 and 215:
their distance from other sites. Ar
- Page 216 and 217:
* Recommend population and habitat
- Page 218 and 219:
away in some or all of the range. D
- Page 220 and 221:
4. What are the population dynamics
- Page 222 and 223:
If the monitoring and research prog
- Page 224 and 225:
lowlands, eastern Oregon Cascades,
- Page 226 and 227: 210
- Page 228 and 229: Stepdown Outline1. Management Tasks
- Page 230 and 231: Table 4.1 Abbreviated Cost TableThe
- Page 232 and 233: continued-TaskPriorityResp. PartyCo
- Page 234 and 235: 218
- Page 236 and 237: 220
- Page 238 and 239: and the number of invertebrate anim
- Page 240 and 241: Table 5.2. Numbers of other species
- Page 242 and 243: Amphibians and Reptiles: Larch Moun
- Page 244 and 245: 228
- Page 246 and 247: 230
- Page 248 and 249: Barrows, C. W. 1980. Feeding ecolog
- Page 250 and 251: Clark, R. J., D. G. Smith, and L. H
- Page 252 and 253: Franklin, A. B., J. A. Blakesley, a
- Page 254 and 255: Harestad, A. S., and F. L. Bunnell.
- Page 256 and 257: Lundquist, R. W. and J. M. Mariani.
- Page 258 and 259: O'Halloran, K. 1989. Spotted owl in
- Page 260 and 261: Solis, D. M. 1980. Habitat use by n
- Page 262 and 263: Young, K. D., A. B. Franklin, and J
- Page 264 and 265: 248
- Page 266 and 267: 250
- Page 268 and 269: Table A.1. General approaches for e
- Page 270 and 271: complete count of the territorial b
- Page 272 and 273: Table A.3. Powera for various desig
- Page 274 and 275: Table A.4. Illustration of a Markov
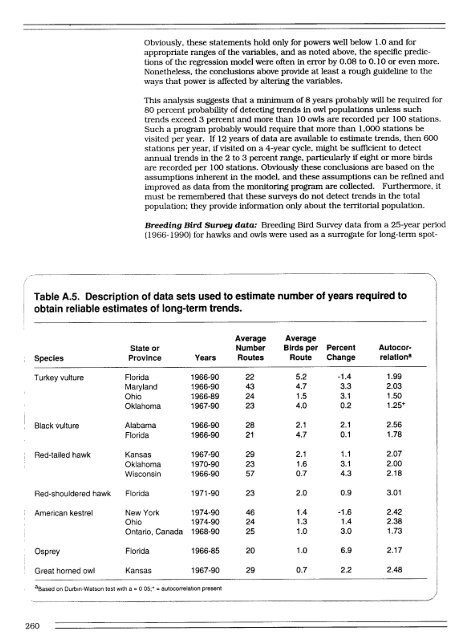
- Page 278 and 279: Table A.6. Reliability of trend est
- Page 280 and 281: Demographic AnalysisAs noted earlie
- Page 282 and 283: the estimate (using the simple equa
- Page 284 and 285: however, we know little about the b
- Page 286 and 287: Table A.8. Summary of information n
- Page 288 and 289: predict the power achieved by diffe
- Page 290 and 291: Other studiestached. If dispersing
- Page 292 and 293: impractical at present. We describe
- Page 294 and 295: Conclusionsthe year effect can be i
- Page 296 and 297: 280
- Page 298 and 299: 282
- Page 300 and 301: 284
- Page 302 and 303: owls. Consequently, the issue of wh
- Page 304 and 305: Use of the informationAssessments a
- Page 306 and 307: Recent LiteratureWe might begin by
- Page 308 and 309: Kerms (1989) measured habitat struc
- Page 310 and 311: Hamer (pers. comm.) described 11 ne
- Page 312 and 313: Table B.3. Percent hardwoods in the
- Page 314 and 315: Table B.5. Comparison of habitats u
- Page 316 and 317: Table B.8. Tree density (number of
- Page 318 and 319: and numbers of trees, and percent o
- Page 320 and 321: Under this hypothesis, owl fitness
- Page 322 and 323: suitable habitat for that region (m
- Page 324 and 325: ResultsDiscussionspotted owl habita
- Page 326 and 327:
__Discussiondata from 41 sites in t
- Page 328 and 329:
Recommendations for Future Research
- Page 330 and 331:
314
- Page 332 and 333:
Hamer, T. 1988. Home range size of
- Page 334 and 335:
318
- Page 336 and 337:
320
- Page 338 and 339:
Parameter Estimatesfor Individual S
- Page 340 and 341:
provided in Table C. 5. Study of th
- Page 342 and 343:
Table C.6. Summary of statistics re
- Page 344 and 345:
3. ConclusionsThis source of bias i
- Page 346 and 347:
330
- Page 348 and 349:
Gray Wolf .........................
- Page 350 and 351:
formed during the initial meeting t
- Page 352 and 353:
provide habitat for the numerous sp
- Page 354 and 355:
The ApproachA committee of the Reco
- Page 356 and 357:
The List of Threatened and Endanger
- Page 358 and 359:
Mammalsoldest trees in a stand. Eig
- Page 360 and 361:
ABBFigure D. 1. Distribution of: a)
- Page 362 and 363:
KTable D.3. A list of threatened an
- Page 364 and 365:
Fishestheir dispersal capabilities
- Page 366 and 367:
OlympicNorthcoastalRockyMountainSou
- Page 368 and 369:
continued-StatusabState Considered
- Page 370 and 371:
continued-SpeciesColumbia sidebandM
- Page 372 and 373:
endemic to the Pacific Northwest).
- Page 374 and 375:
------continued-SpeciesRhyacophila
- Page 376 and 377:
continued-SpeciesFed3tatusa bStateW
- Page 378 and 379:
StatusasbOld ForestState Associatio
- Page 380 and 381:
Summaryspores (Maser et al. 1978b).
- Page 382 and 383:
Biology of Owl Prey, Older Forest A
- Page 384 and 385:
Woodrats.-The dusky-footed woodrat
- Page 386 and 387:
and are less restrictive under stat
- Page 388 and 389:
Stock concept.-The term "stock" was
- Page 390 and 391:
Table D.10. List of fish stocks of
- Page 392 and 393:
continued-Steelhead-owipu Sea-runTr
- Page 394 and 395:
continued-BasinHoodWillametteRogueS
- Page 396 and 397:
Table D.13. Washington streams (or
- Page 398 and 399:
inland distribution currently decre
- Page 400 and 401:
nesting territories in the three st
- Page 402 and 403:
However, little is known about the
- Page 404 and 405:
Fisher (Martes penncmti)Distributio
- Page 406 and 407:
at one time supported marten popula
- Page 408 and 409:
each population of these animals is
- Page 410 and 411:
species also is found under the bar
- Page 412 and 413:
few meters from water after heavy r
- Page 414 and 415:
In considering the needs of other s
- Page 416 and 417:
Barrows, C. W. 1981. Roost selectio
- Page 418 and 419:
Clark, T. W., E. Anderson, C. Dougl
- Page 420 and 421:
Hamer, T. E. 1991. Habitat relation
- Page 422 and 423:
Mannan, R. W., E. C. Meslow, and H.
- Page 424 and 425:
Oakley, A. L., Collins, J. A., Ever
- Page 426 and 427:
Solis, D. M. 1983. Summer habitat e
- Page 428 and 429:
Washington Natural Heritage Program
- Page 430 and 431:
414
- Page 432 and 433:
f. Wilderness.g. Livestock grazing.
- Page 434 and 435:
I. Monitoring.1. Northern spotted o
- Page 436 and 437:
420
- Page 438 and 439:
here will reduce some of that habit
- Page 440 and 441:
424
- Page 442 and 443:
426
- Page 444 and 445:
Selection of Forest TypesAt the tim
- Page 446 and 447:
eceive as little as 25 inches. Disc
- Page 448 and 449:
A. FireThe combination and interact
- Page 450 and 451:
Table F.4. Important forest insects
- Page 452 and 453:
continued-Common Name Causal Agent
- Page 454 and 455:
D. DiseasesForest diseases in the P
- Page 456 and 457:
continued-Common Name Causal Agent
- Page 458 and 459:
continued-Common Name Causal Agent
- Page 460 and 461:
III. Forest Protection in theWest C
- Page 462 and 463:
120 100200 500I~~~~.K446Figure F.4.
- Page 464 and 465:
InsectsDiseasesInsects in this subr
- Page 466 and 467:
__hardwoods are immune. Shade toler
- Page 468 and 469:
pests (Schowalter 1988). Black stai
- Page 470 and 471:
tion and initial attack. If manipul
- Page 472 and 473:
log and snag density was likely low
- Page 474 and 475:
B. Management Effects on StandsMana
- Page 476 and 477:
units (underburning or lop/scatter)
- Page 478 and 479:
In the higher elevation White Fir a
- Page 480 and 481:
growth often increases (Reinhardt a
- Page 482 and 483:
50rcc4*0-cC)2M CmZ13010-yearI ,...*
- Page 484 and 485:
In the East Cascades subregion fore
- Page 486 and 487:
The introduced disease, white pine
- Page 488 and 489:
VI. Conclusionsmortality will resul
- Page 490 and 491:
Baker, F.A. 1988. The influence of
- Page 492 and 493:
Habeck, J.R. 1990. Old-growth ponde
- Page 494 and 495:
Perry, D.A., and J.G. Borchers. 199
- Page 496 and 497:
Weatherspoon, C.P., and C.N. Skinne
- Page 498 and 499:
482
- Page 500 and 501:
484
- Page 502 and 503:
area, structure, ages, location; ne
- Page 504 and 505:
Stand AFigure G.2. A--unthmnned Dou
- Page 506 and 507:
figure 0.3. Effects of thinning Dou
- Page 508 and 509:
II. Review of Natural Vegetation an
- Page 510 and 511:
western hemlock, and sometimes othe
- Page 512 and 513:
year intervals (Appendix F). With t
- Page 514 and 515:
Live crown ratiobecent)6050IStand A
- Page 516 and 517:
Basal area growth continued to incr
- Page 518 and 519:
technology probably will allow some
- Page 520 and 521:
Stand A. No activities (west side 3
- Page 522 and 523:
Stand A. No activities (west side o
- Page 524 and 525:
acre, 4 to 12 inches in diameter),
- Page 526 and 527:
allow redwood sprout clumps maximum
- Page 528 and 529:
KAge 15 years - 511 trees per acre,
- Page 530 and 531:
6Stems per acre100 _ Stand A. Natur
- Page 532 and 533:
Basal Area(square feetper acre)50 1
- Page 534 and 535:
* Opening the canopy in small patch
- Page 536 and 537:
Drew, T.J. and J.W. Flewelling. 197
- Page 538 and 539:
Miller, R.E.; D.L. Reukema, and R.L
- Page 540 and 541:
Tappeiner, J.C., P.M. McDonald, and
- Page 542 and 543:
526
- Page 544 and 545:
528
- Page 546 and 547:
6. Timber supply curve and economic
- Page 548 and 549:
scientifically credible biological
- Page 550 and 551:
E. Summary of Preliminary Estimates
- Page 552 and 553:
II. General Economic Principles for
- Page 554 and 555:
practices may be able to show how s
- Page 556 and 557:
Economic patterns show the efficien
- Page 558 and 559:
The sustainable yield concept that
- Page 560 and 561:
A. Previously Estimated Economic Co
- Page 562 and 563:
County receipts were estimated to d
- Page 564 and 565:
B. Potential Social Costs of Owl Co
- Page 566 and 567:
The contrast between the behavior d
- Page 568 and 569:
0U1 n1nDTable H.2. Economic depende
- Page 570 and 571:
cḻlTable H.4. Economic characteri
- Page 572 and 573:
An analysis completed by the State
- Page 574 and 575:
V. Preliminary Evaluation of the Ec
- Page 576 and 577:
25-° 20/0M 15-a)CLU)0 10-0CL 5 -0)
- Page 578 and 579:
25 -- 20-0co/o 15--Da)a0a)10m~ C) 5
- Page 580 and 581:
forestlands. The costs of productio
- Page 582 and 583:
In Figure H.8, the equilibrium betw
- Page 584 and 585:
foregone and the way they will save
- Page 586 and 587:
The income created by the purchase
- Page 588 and 589:
Two concepts are useful for underst
- Page 590 and 591:
y an estimate of the price that wou
- Page 592 and 593:
Table H.10. Comparison of timber em
- Page 594 and 595:
of the second year. The same assump
- Page 596 and 597:
are generally much lower than for c
- Page 598 and 599:
582
- Page 600 and 601:
studies at University of Washington
- Page 602 and 603:
586
- Page 604 and 605:
Most significant late successionall
- Page 606 and 607:
to evaluate options. Information in
- Page 608 and 609:
Q0Table 1.1. Estimated acres and ow
- Page 610 and 611:
soTable 1.3. Estimated acres and ow
- Page 612 and 613:
01CDarTable 1.5. Size class distrib
- Page 614 and 615:
Table 1.8. Frequency distribution o
- Page 616 and 617:
Literature CitedThomas, J.W., E.D.
- Page 618 and 619:
602
- Page 620 and 621:
- The overlap of home ranges among
- Page 622 and 623:
Table J.2. Acreage and owl numbers
- Page 624 and 625:
continuedDCA Land AcreageIdent. Sta
- Page 626 and 627:
Table J.4. Acreage and owl numbers
- Page 628 and 629:
Table J.5. Acreage and owl numbers
- Page 630 and 631:
Table J.6. Acreage and owl numbers
- Page 632 and 633:
Table J.7. Acreage and owl numbers
- Page 634 and 635:
Table J.9. Acrea ?e and owl numbers
- Page 636 and 637:
Table J.10. Acreage and owl numbers
- Page 638 and 639:
continued-DCA LandIdent. StatusAcre
- Page 640 and 641:
-DCAIdent.LandStatusAcreageNRF Tota
- Page 642 and 643:
626
- Page 644 and 645:
Experience Includes: Assistant Dire
- Page 646 and 647:
Education: B.S. in forestry from Or
- Page 648 and 649:
Team SupportCharles Bruce, Oregon D
- Page 650 and 651:
continued-1 5-24-91 Other SpeciesSu
- Page 652 and 653:
continued-9-16 thru9-20-919-19-91Sp
- Page 654 and 655:
Perry, D. 1991. The ecology of coar
- Page 656 and 657:
2mandate the achievement of recover
- Page 658 and 659:
642
- Page 660 and 661:
644
- Page 662 and 663:
Aspect - the direction a slope face
- Page 664 and 665:
Congressionally classified and desi
- Page 666 and 667:
Empirical - derived from direct obs
- Page 668 and 669:
Hummocky - a landscape characterize
- Page 670 and 671:
Mixed conifer - as used in this doc
- Page 672 and 673:
Potential habitat - a stand of tree
- Page 674 and 675:
Sensitive species - those species t
- Page 676 and 677:
Take -Uunder the Endangered Species
- Page 678:
wild, scenic, or recreational by an


