Recovery Plan for the Northern Spotted Owl - DRAFT
Recovery Plan for the Northern Spotted Owl - DRAFT
Recovery Plan for the Northern Spotted Owl - DRAFT
- No tags were found...

You also want an ePaper? Increase the reach of your titles
YUMPU automatically turns print PDFs into web optimized ePapers that Google loves.
I 1.2:Sp 6/draft<strong>Recovery</strong> <strong>Plan</strong> <strong>for</strong> <strong>the</strong>Nor<strong>the</strong>rn <strong>Spotted</strong> <strong>Owl</strong> -~3Ch<strong>DRAFT</strong>
As <strong>the</strong> Nation's principal conservation agency, <strong>the</strong>Department of <strong>the</strong> Interior has responsibility<strong>for</strong> most ofour nationally owned public lands and naturalresources. This includesfostering <strong>the</strong> wisest use of ourland and water resources, protecting our fish andwildlife, preserving <strong>the</strong> environmental and culturalvalues of our national parks and historical places, andproviding <strong>for</strong> <strong>the</strong> enjoyment of life through outdoorrecreation. The Department assesses our energy andmineral resources and works to assure that <strong>the</strong>irdevelopment is in <strong>the</strong> best interests of all our people.The Department also has a major responsibility <strong>for</strong>American Indian reservation communities and<strong>for</strong>peoplewho live in island Territories under U.S. administration.
List of FiguresTable 4.1 Abbreviated cost table .............................................................. 214Table 4.2 Implementation schedule ......................................................... 215Table 5.1 Summary of 361 plants and animals considered in <strong>the</strong>recovery planning process <strong>for</strong> <strong>the</strong> nor<strong>the</strong>rn spotted owl ....................... 222Table 5.2 Numbers of o<strong>the</strong>r species locations and miles of streams (withfish stocks at risk) in designated conservation areas (DCAs) <strong>for</strong> <strong>the</strong>nor<strong>the</strong>rn spotted owl summarized by physiographic province .............. 224Figure ES. 1 Total acres in <strong>the</strong> range of <strong>the</strong> nor<strong>the</strong>rn stopped owland in DCAs within <strong>the</strong> range .......................... ..................................... ixFigure ES.2 Total known owl pairs rangewide and in DCAs ......................... ixFigure 2.1 Distribution of known spotted owl pairs located inWashington, Oregon, and Cali<strong>for</strong>nia between 1986 and 1990 ................ 13Figure 2.2 Physiographic provinces within <strong>the</strong> range of <strong>the</strong> nor<strong>the</strong>rnspotted owl in <strong>the</strong> United States ........................................................... 32Figure 2.3 Demographic study areas ......................................................... 39Figure 2.4a Land base and suitable habitat, Oregon Coast Range ............... 49Figure 2.4b Trend in nor<strong>the</strong>rn spotted owl habitat, OregonCoast Range province .......................................................................... 50Figure 2.5a Land base and suitable habitat, western Oregon Cascades ....... 52Figure 2.5b Trend in nor<strong>the</strong>rn spotted owl habitat, westernOregon Cascades province ................................................................... 53Figure 2.6a Land base and suitable habitat, Oregon Klamath province ....... 57Figure 2.6b Trend in nor<strong>the</strong>rn spotted owl habitat, Klamathprovince (Oregon portion) ..................................................................... 58Figure 3.1 Total known owl pairs in <strong>the</strong> Washington provincesand in DCAs within <strong>the</strong> provinces ....................................................... 1 09Figure 3.2 Acres in <strong>the</strong> Washington provinces and in DCAswithin <strong>the</strong> provinces .......................................................................... 109Figure 3.3 Total known owl pairs in <strong>the</strong> Oregon provinces andin DCAs within <strong>the</strong> provinces ............................................................. 110Figure 3.4 Acres in <strong>the</strong> Oregon provinces and in DCAs within<strong>the</strong> provinces .............................................................................. 110Figure 3.5 Total known owl pairs in <strong>the</strong> Cali<strong>for</strong>nia provinces andin DCAs within <strong>the</strong> provinces ............................................................. 111Figure 3.6 Acres in <strong>the</strong> Cali<strong>for</strong>nia provinces and in DCAs within<strong>the</strong> provinces .............................................................................. 111Figure 3.7 Known owl pairs in <strong>the</strong> Olympic Peninsula provinceand in DCAs within <strong>the</strong> province ........................................................ 147Figure 3.8 Acres in <strong>the</strong> Olympic Peninsula province and in DCAswithin <strong>the</strong> province ............................................................................ 147Figure 3.9 Known owl pairs in <strong>the</strong> western Washington lowlandsprovince and in DCAs within <strong>the</strong> province ........................................... 150iv
Executive Summaryof <strong>the</strong> Nor<strong>the</strong>rn <strong>Spotted</strong> <strong>Owl</strong><strong>Recovery</strong> <strong>Plan</strong>IntroductionA recovery plan is called <strong>for</strong> by <strong>the</strong> Endangered Species Act to guide <strong>the</strong>management actions needed to bring a threatened or endangered species to acondition in which it no longer needs special protection of <strong>the</strong> act. The nor<strong>the</strong>rnspotted owl (also referred to in <strong>the</strong> recovery plan as <strong>the</strong> spotted owl and <strong>the</strong>owl) was placed on <strong>the</strong> list of threatened species in June 1990. Since February1991, a <strong>Recovery</strong> Team appointed by Secretary of <strong>the</strong> Interior ManuelLujan Jr. has been <strong>for</strong>mulating a recovery plan <strong>for</strong> <strong>the</strong> spotted owl. This reportpresents a draft recovery plan <strong>for</strong> <strong>the</strong> nor<strong>the</strong>rn spotted owl <strong>for</strong> review andcomment by <strong>the</strong> public and government agencies.The nor<strong>the</strong>rn spotted owl draft recovery plan provides a comprehensive basis<strong>for</strong> management actions to be undertakeni by <strong>for</strong>est landowners and wildlifeagencies to alleviate conditions threatening <strong>the</strong> species. Primary actions will betaken by federal land management agencies in <strong>the</strong> Pacific Northwest - <strong>the</strong>U.S. Forest Service, <strong>the</strong> U.S. Bureau of Land Management, and <strong>the</strong> NationalPark Service. The U.S. Fish and Wildlife Service will oversee implementation of<strong>the</strong> plan through its authorities under <strong>the</strong> Endangered Species Act.State <strong>for</strong>est management and wildlife agencies in Oregon, Washington, andCali<strong>for</strong>nia also will take actions that contribute to recovery under <strong>the</strong> plan.These state agencies have an important role in managing state <strong>for</strong>ests and inregulating <strong>for</strong>est practices on private land within <strong>the</strong>ir jurisdiction. Contributionsfrom habitat on Indian lands also were considered in <strong>for</strong>mulating <strong>the</strong>draft plan.The draft recovery plan was developed following review of <strong>the</strong> scientific datafrom previous plans <strong>for</strong> <strong>the</strong> spotted owl, particularly <strong>the</strong> conservation strategydesigned by <strong>the</strong> Interagency Scientific Committee (ISC) (Thomas et al. 1990),and by analyzing <strong>the</strong> most recent data available on owl populations and <strong>the</strong>irhabitat. This biological in<strong>for</strong>mation was <strong>the</strong> basis <strong>for</strong> designing measures toachieve recovery.Vii
<strong>Recovery</strong> ObjectiveSecretary of <strong>the</strong> Interior Lujan also asked that <strong>the</strong> <strong>Recovery</strong> Team considero<strong>the</strong>r species and economic effects to <strong>the</strong> extent allowed by law. The <strong>Recovery</strong>Team made a substantial ef<strong>for</strong>t to determine <strong>the</strong> status and location of o<strong>the</strong>rspecies that could benefit from actions similar to those needed <strong>for</strong> owl recovery.Measures that would contribute to recovery of <strong>the</strong> owl, while also helping o<strong>the</strong>rspecies, were favored in decisions leading to <strong>the</strong> draft recovery plan.Previous studies show that protection of sufficient habitat <strong>for</strong> a viable spottedowl population has substantial economic and social costs because of <strong>the</strong>reduction in timber harvests. The <strong>Recovery</strong> Team recognized that, under <strong>the</strong>Endangered Species Act, it could not consider measures short of achievingrecovery <strong>for</strong> <strong>the</strong> nor<strong>the</strong>rn spotted owl, even though such measures might causesignificantly less economic and social losses. Instead, <strong>the</strong> <strong>Recovery</strong> Teamlooked <strong>for</strong> ways to achieve recovery that would cause less reduction in timberharvest and fewer job losses in <strong>the</strong> timber industry.The objective of <strong>the</strong> draft recovery plan is to remove <strong>the</strong> nor<strong>the</strong>rn spotted owlfrom <strong>the</strong> list of threatened species.The Draft Recoveiy <strong>Plan</strong>The nor<strong>the</strong>rn spotted owl draft recovery plan has seven key elements:1. A recovery objective and a set of criteria <strong>for</strong> determining whe<strong>the</strong>rconditions exist that would allow <strong>the</strong> nor<strong>the</strong>rn spotted owl to beremoved from <strong>the</strong> list of threatened species.2. A network of designated conservation areas on federal <strong>for</strong>estlands,with each area designed to protect owl habitat sufficient to support anumber of breeding pairs of owls.3. A set of guidelines that govern management activities on federal<strong>for</strong>estlands in designated conservation areas.4. A set of guidelines that govern management activities on federal<strong>for</strong>estlands outside of designated conservation areas.5. A set of suggestions <strong>for</strong> contributions from nonfederal <strong>for</strong>estlands tosupport spotted owl populations.6. A monitoring and research program that will provide new in<strong>for</strong>mationon spotted owls and <strong>the</strong>ir habitat, and develop and test managementtechniques <strong>for</strong> promoting and maintaining owl habitatwhile allowing appropriate <strong>for</strong>est management.7. Implementation mechanisms that provide oversight and coordination,relying primarily on existing authorities and <strong>for</strong>est managementplanning procedures.Each of <strong>the</strong>se elements is described briefly, followed by a discussion of <strong>the</strong>scientific basis <strong>for</strong> <strong>the</strong> plan and of <strong>the</strong> economic and social considerations builtinto <strong>the</strong> plan.viii
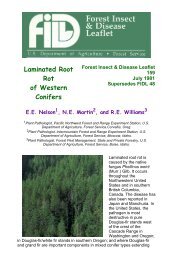
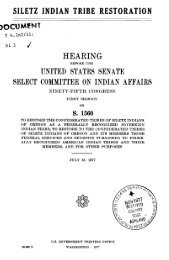
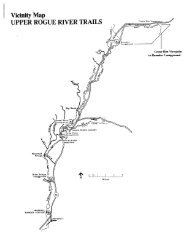
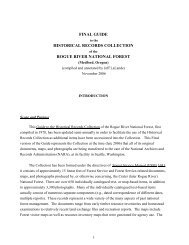
Delisting CriteriaThe primary threat to <strong>the</strong> nor<strong>the</strong>rn spotted owl leading to its designation as athreatened species is <strong>the</strong> reduction and fragmentation of its habitat in <strong>for</strong>estsin Washington, Oregon, and nor<strong>the</strong>rn Cali<strong>for</strong>nia. Nor<strong>the</strong>rn spotted owls useold-growth <strong>for</strong>ests and o<strong>the</strong>r <strong>for</strong>ests with similar characteristics <strong>for</strong> nesting,breeding, and rearing young. As timber harvesting has proceeded in <strong>the</strong> PacificNorthwest, <strong>the</strong> amount of habitat suitable <strong>for</strong> spotted owls has declined andremaining habitat areas have become smaller and more isolated from eacho<strong>the</strong>r, particularly during <strong>the</strong> last 50 years. As a result, <strong>the</strong> population ofspotted owls declined, in some areas ra<strong>the</strong>r sharply.The objective of <strong>the</strong> draft recovery plan is to reduce <strong>the</strong> threats to <strong>the</strong> spottedowl so that it can be removed from <strong>the</strong> list of threatened species anywhere inits range. The decision to remove <strong>the</strong> spotted owl from <strong>the</strong> list of threatenedspecies can be made on an incremental basis <strong>for</strong> individual areas, calledprovinces, or <strong>for</strong> groups of provinces. The range of <strong>the</strong> spotted owl has beendivided into 11 provinces.Four criteria must be met be<strong>for</strong>e delisting is considered: (1) A scientificallycredible plan <strong>for</strong> monitoring owl populations and owl habitat must have beenin effect <strong>for</strong> at least 8 years; (2) <strong>the</strong> population must have been stable orincreasing, as indicated by both density and demographic estimates, <strong>for</strong> atleast 8 years; (3) regulatory mechanisms or land management commitmentsmust have been implemented that provide <strong>for</strong> adequate protection of breeding,<strong>for</strong>aging, and dispersal habitat, and (4) analyses must indicate that <strong>the</strong> populationin unlikely to need protection under <strong>the</strong> Endangered Species Act during<strong>the</strong> <strong>for</strong>eseeable future. The draft recovery plan emphasizes that all of <strong>the</strong>secriteria must be satisfied be<strong>for</strong>e delisting is considered.Designated Conservation AreasAs <strong>the</strong> primary means <strong>for</strong> achieving recovery, <strong>the</strong> draft plan recommendsestablishing 196 designated conservation areas (DCAs) to provide approximately7.5 million acres of federal <strong>for</strong>estland as <strong>the</strong> primary habitat <strong>for</strong> <strong>the</strong>nor<strong>the</strong>rn spotted owl population. These DCAs include approximately 48percent of <strong>the</strong> total remaining spotted owl nesting, roosting, and <strong>for</strong>aginghabitat on federal lands (Figure ES. 1.). The largest DCAs are designed tosupport a population of 20 or more pairs of owls in habitat conditions thatallow successful breeding and rearing of young. They are located to allow owlsto disperse from one DCA to ano<strong>the</strong>r. Each DCA contains areas of currentlyexisting owl habitat combined with areas of younger <strong>for</strong>ests. These youngerstands will be protected so <strong>the</strong>y can mature into owl habitat. The DCAs containapproximately 1,180 known owl pairs on federal lands. This represents about48 percent of <strong>the</strong> total pairs currently known on all federal lands (FigureES.2.). When <strong>the</strong> DCAs become fully developed owl habitat, <strong>the</strong>y will support apopulation of approximately 2,320 pairs of owls.DCAs are located to take advantage of o<strong>the</strong>r <strong>for</strong>estland containing owl habitatthat will not be harvested or will be harvested in a manner that does notreduce habitat value. Such areas include parks, wilderness areas, and certainadministratively reserved areas. DCAs also are located in a pattern to reduce<strong>the</strong> risk to <strong>the</strong> owl population from natural threats such as fire, disease, andinsects.ix
Management Rules <strong>for</strong> Designated Conservation AreasThe draft recovery plan recommends that activities on federal lands within <strong>the</strong>DCAs be focused on improving habitat conditions <strong>for</strong> spotted owls.The following specific management rules <strong>for</strong> federal lands in DCAs are recommended.1. No timber harvest is allowed in habitat suitable <strong>for</strong> nor<strong>the</strong>rn spottedowls.2. Silvicultural practices, such as thinning, will be used to promoterapid development of owl habitat in those areas that currently donot provide habitat suitable <strong>for</strong> owls.3. Salvage of trees in stands significantly affected by fire, wind, insects,or diseases may occur but will be limited to safeguard owlhabitat.4. Management activities designed to reduce <strong>the</strong> risk of large-scale fireor insect infestation are limited to those needed to assure <strong>the</strong>continued existence of owl habitat within <strong>the</strong> DCA.5. The recovery plan recommends that federal lands inside DCAs, with<strong>the</strong> exception of wilderness areas and national parks, be designatedas critical habitat.6. It also recommends that a management plan be prepared <strong>for</strong> eachDCA be<strong>for</strong>e management activities are implemented.Acres (thousands)35,000_D ~~~~25,000-Total acresrangewide 20,00030,000-15,000-Lull 10,000-_ .lTotal acres in 5,000-DCAs 3 rangewideNonfederal land' Federal land NRF habitat 2Figure ES.1. Total acres in <strong>the</strong> range of <strong>the</strong> nor<strong>the</strong>rn spotted owl and in DCAs 3 within <strong>the</strong> range.'No commitments are implied by inclusion of nonfederal land within DCA boundaries. Management of <strong>the</strong>se lands is discussed insection 1Il.C.4.2 NRF habitat = nesting, roosting, and <strong>for</strong>aging habitat. This in<strong>for</strong>mation is available only <strong>for</strong> federal land.3 DCA = designated conservation area.x
Management Guidelines <strong>for</strong> Federal ForestlandsOutside Designated Conservation AreasThe draft recovery plan recommends guidelines <strong>for</strong> <strong>the</strong> maintenance of sufficienthabitat conditions on federal lands outside DCAs to allow dispersal ofowls among DCAs. Movement among DCAs is necessary to maintain populationlevels and prevent genetic deterioration of <strong>the</strong> population. These guidelinesalso contain several recommendations <strong>for</strong> supplementing <strong>the</strong> DCA networkin specific parts of <strong>the</strong> owl's range where conditions currently do notallow full implementation of <strong>the</strong> DCA network guidelines. This would be doneby providing habitat <strong>for</strong> additional owl pairs and territorial single owls outsideDCAs. In some areas, <strong>the</strong> draft recovery plan recommends management of<strong>the</strong>se areas to reduce <strong>the</strong> risk of fire and insect damage. In total, <strong>the</strong>se matrixareas in combination with <strong>the</strong> DCAs will provide <strong>for</strong> approximately 1,300currently known pairs of owls on federal lands. This represents about 53percent of all pairs currently known to occur on federal lands.Suggestions <strong>for</strong> Management of Nonfederal ForestlandsThe draft recovery plan relies first on federal lands <strong>for</strong> recovery of nor<strong>the</strong>rnspotted owls. However, it also recognizes <strong>the</strong> role of nonfederal lands inrecovery, particularly in areas where federal lands are not adequate to fullyachieve <strong>the</strong> recovery objective. The recovery plan recommends specific contributionsfrom nonfederal lands which will complement federal ef<strong>for</strong>ts. Theserecommendations reflect <strong>the</strong> varied conditions within individual provinces, <strong>the</strong>authorities of <strong>the</strong> three states involved, and <strong>the</strong> potential <strong>for</strong> enhanced cooperationwith <strong>the</strong> private sector. They provide a framework <strong>for</strong> development andimplementation of creative ef<strong>for</strong>ts to help achieve recovery.<strong>Owl</strong> pairs2,500_Total known owlsrangewide2,000-_1,500 -Li r I1,000'_Total known owlsin DCAs 1 500_rangewide0- EEENonfederal landIFederal landFigure ES.2. Total known owl pairs rangewide and in DCAs.1 DCA = designated conservation area.\ - ~~~~~~~~xi
Monitoring and Research ProgramThe draft recovery plan is based on extensive scientific data on nor<strong>the</strong>rnspotted owls. This in<strong>for</strong>mation gives <strong>the</strong> <strong>Recovery</strong> Team reasonable assurancethat implementation of <strong>the</strong> draft plan will result in recovery of <strong>the</strong> species.However, increased knowledge of owls and <strong>the</strong>ir habitat will provide opportunitiesto refine and improve <strong>the</strong> plan. Consequently, <strong>the</strong> draft recovery planrecommends a comprehensive monitoring, research, and adaptive managementprogram. The program has two objectives:1) It will help produce in<strong>for</strong>mation to assist in refining managementguidance and practices to promote recovery and, to <strong>the</strong> extentfeasible, achieve greater economic efficiency and effectiveness. Theprogram will include assessments of how implementation techniquesare applied and <strong>the</strong> results <strong>the</strong>y achieve.2) It will provide documentation necessary to consider delisting <strong>the</strong> owlin part or all of its range.In<strong>for</strong>mation derived from <strong>the</strong> monitoring and research program eventually mayresult in significant changes in <strong>the</strong> <strong>Recovery</strong> Team's recommendations. The<strong>Recovery</strong> Team has a long-term goal to move from a landscape composed ofprotected areas and matrix toward a landscape where conditions provide amore continuous distribution of owls. Results from monitoring and researchmay support such a change. In any case, <strong>the</strong> delisting criteria still would beappropriate even if specific recommendations changed.Implementation Mechanisms<strong>Recovery</strong> plans are not self-implementing under <strong>the</strong> Endangered Species Act.Instead, <strong>the</strong>y are used by federal agencies as a guide to refine managementplans, procedures, and strategies so that on-<strong>the</strong>-ground operations helpachieve recovery as it is defined in <strong>the</strong> draft recovery plan. Nonfederal partiesare not required explicitly to follow recovery plans. However, <strong>the</strong>y must followapplicable Endangered Species Act provisions that are reflected in <strong>the</strong> recoveryplan. The draft recovery plan suggests an implementation schedule which, iffollowed, will expedite progress toward recovery and provide increased certaintyand stability in owl management. Also, in recognition that actions are recommendedwhich cover an extended time frame and involve federal andnonfederal parties, <strong>the</strong> draft recovery plan recommends establishment of acoordinating group to guide implementation ef<strong>for</strong>ts over <strong>the</strong> long term. Thegroup would provide advice and assistance on policies, plans, and o<strong>the</strong>raspects of management including monitoring and research.The Scientific Basis <strong>for</strong> <strong>the</strong> <strong>Recovery</strong> <strong>Plan</strong>The draft recovery plan is based on field studies of <strong>the</strong> habitat conditions thatspotted owls prefer <strong>for</strong> nesting and breeding, on demographic studies, and onstudies of owl behavior. It also is based on biological principles that describe<strong>the</strong> interactions within and among subpopulations that depend on areas offavorable habitat separated by areas of less favorable conditions. The <strong>Recovery</strong>Team drew substantially on <strong>the</strong>ories and models of population dynamics todetermine <strong>the</strong> desired size of population groups and <strong>the</strong> overall population.xiiThe draft recovery plan also is based on silvicultural studies of <strong>the</strong> growth of<strong>for</strong>ests under natural conditions and human management. Silvicultural modelswere used to study <strong>the</strong> opportunities <strong>for</strong> promoting more rapid development ofsuitable habitat conditions by appropriate management in younger stands.
Consideration of Economic and Social EffectsConclusionThe draft recovery plan was designed to reduce economic and social costswithout undermining recovery of <strong>the</strong> spotted owl. For example, it allows <strong>for</strong>estmanagement within DCAs in areas that are unsuitable <strong>for</strong> owls if that managementis designed to promote <strong>the</strong> development of suitable owl habitat. Some ofthat management may provide commercial wood products. It also uses muchhabitat already set aside as not suitable <strong>for</strong> timber harvest. The plan alsoprovides programs and procedures to reduce <strong>the</strong> costs of its implementation.However, <strong>the</strong> cost of <strong>the</strong> plan still will be significant, and disruption will beexperienced by individuals and communities when restrictions on timberharvesting cause unemployment.Implementation of <strong>the</strong> draft recovery plan is estimated to reduce employmentin <strong>the</strong> Pacific Northwest timber industry by about 18,900 jobs, compared to <strong>the</strong>employment that would have been expected in 1995 with no protection of <strong>the</strong>spotted owl. Jobs in related sectors also will be reduced by about 13,200. Lostor reduced wages are estimated to be about $1.4 billion during <strong>the</strong> coming 2decades. The value of <strong>the</strong> <strong>for</strong>egone timber harvest is estimated to be $470million per year. This will cause a net reduction of about $328 million per yearin U.S. Treasury funds and $100 million per year in county receipts. Privateassets, such as mills and homes, also will be reduced in value.The conservation of nor<strong>the</strong>rn spotted owls is a difficult public policy issue. It isimportant to achieve recovery in a way that is appropriate under <strong>the</strong> EndangeredSpecies Act, yet also managerially and economically efficient. The draftrecovery plan provides a realistic basis <strong>for</strong> meeting this objective. Consequently,it should meet owl needs and provide greater stability in resourcemanagement than now exists. This will set a precedent <strong>for</strong> constructivelyresolving conflicts between conservation and development of natural resources.xiii
Chapter IIntroduction1
I.A. The Nor<strong>the</strong>rn <strong>Spotted</strong> <strong>Owl</strong> and <strong>the</strong>Endangered Species Act1. How <strong>the</strong> <strong>Owl</strong> Came To Be Protected Under <strong>the</strong> ActThe U.S. Fish and Wildlife Service (FWS) first considered <strong>the</strong> possibility oflisting <strong>the</strong> nor<strong>the</strong>rn spotted owl (also refered to in <strong>the</strong> recovery plan as <strong>the</strong>spotted owl and <strong>the</strong> owl) under <strong>the</strong> Endangered Species Act in <strong>the</strong> early 1980s,but concluded that it would have been inappropriate. In 1987, a small organizationknown as GreenWorld, later joined by o<strong>the</strong>r environmental groups,petitioned <strong>the</strong> FWS to list <strong>the</strong> owl as endangered. The act's petition provisionsrequired a preliminary finding within 90 days as to whe<strong>the</strong>r listing might bewarranted. The FWS made a positive finding and initiated a review of <strong>the</strong> owl'sstatus.A second finding was required within 12 months of receipt of <strong>the</strong> petition. Tilesecond finding, directed at <strong>the</strong> question of whe<strong>the</strong>r listing was warranted, wasmore definitive than <strong>the</strong> 90-day finding. On December 17, 1987, <strong>the</strong> FWSfound listing was not warranted.The legality of <strong>the</strong> negative finding was challenged in court by several environmentalgroups, and <strong>the</strong> federal District Court in Seattle ruled that <strong>the</strong> findingappeared not to be supported by <strong>the</strong> status review that <strong>the</strong> FWS had conducted(see General Accounting Office 1989 <strong>for</strong> a review). When a judgeordered <strong>the</strong> FWS to produce a record that supported its decision, <strong>the</strong> FWSrequested and was granted time to reconsider its finding in light of <strong>the</strong> mostrecently available in<strong>for</strong>mation. In April 1989, <strong>the</strong> FWS made a finding thatlisting was warranted. A proposal to list <strong>the</strong> owl as a threatened species waspublished in June 1989, and <strong>the</strong> owl was listed effective July 23, 1990.2. The Endangered Species Listing ProcessA process <strong>for</strong> ascertaining which species need attention is basic to any programof species conservation. Section 4 of <strong>the</strong> Endangered Species Act assigns thistask to <strong>the</strong> Secretaries of <strong>the</strong> Interior and of Commerce, and operationalauthority within <strong>the</strong> two departments is delegated to <strong>the</strong> FWS and <strong>the</strong> NationalMarine Fisheries Service. The responsibilities and authorities <strong>for</strong> listing under<strong>the</strong> act are framed very broadly as <strong>the</strong> determination ". . . whe<strong>the</strong>r any speciesis an endangered species or a threatened species .... Determinations aremade by regulation through a proposal-and-comment process. In addition tothis broad charge to <strong>the</strong> federal agencies to assess <strong>the</strong> status of species, <strong>the</strong> actprovides a process <strong>for</strong> <strong>the</strong> public to petition <strong>for</strong> a species to be listed, and itmakes <strong>the</strong> agencies accountable to petitioners. Some definitions are useful inunderstanding this assessment phase."Species" means any species or subspecies of plant or animal and,in <strong>the</strong> case of vertebrate life <strong>for</strong>ms, may include any distinct populationsegment."Endangered species" means a species in danger of extinctionthroughout all or a significant portion of its range.3
"Threatened species" means a species likely to become endangeredin <strong>the</strong> <strong>for</strong>eseeable future throughout all or a significant portion of itsrange.The Endangered Species Act requires that listing decisions be made "solely on<strong>the</strong> basis of <strong>the</strong> best scientific and commercial data .... " In this context,"commercial data' refers solely to in<strong>for</strong>mation regarding trade in a species orproducts derived from it, and does not allow <strong>the</strong> probable economic consequencesto affect a decision regarding a species' listing.3. Critical Habitat DesignationThe Endangered Species Act also directs <strong>the</strong> agencies to propose criticalhabitat "to <strong>the</strong> maximum extent prudent and determinable." Once again, <strong>the</strong>act's definitions are important."Critical habitats" are specific areas within <strong>the</strong> geographical areaoccupied by a species at <strong>the</strong> time of listing on which are found thosephysical or biological features (1) essential to <strong>the</strong> conservation of <strong>the</strong>species; (2) which may require special management considerationsor protection; and (3) specific areas outside <strong>the</strong> area occupied by <strong>the</strong>species upon a determination that such areas are essential to itsconservation."Conservation" means <strong>the</strong> use of all methods and proceduresnecessary to bring a species to <strong>the</strong> point at which <strong>the</strong> protectivemeasures of <strong>the</strong> act are no longer necessary. Conservation is <strong>the</strong>process or means of achieving recovery. It is reasonable <strong>for</strong> <strong>the</strong>designation of critical habitat areas "essential to <strong>the</strong> conservation of<strong>the</strong> species" to consider <strong>the</strong> habitat needs identified in a recoveryplan.Designation of critical habitat is considered to be prudent when it would be ofconservation benefit to <strong>the</strong> species <strong>for</strong> which it is designated. Critical habitat isdeterminable if sufficient in<strong>for</strong>mation is available to adequately delineate <strong>the</strong>area or areas that should be included in <strong>the</strong> designation.The act also requires an examination of <strong>the</strong> economic and o<strong>the</strong>r relevantimpacts of <strong>the</strong> designation of critical habitat, and allows areas to be excludedfrom critical habitat if <strong>the</strong> benefits of exclusion outweigh <strong>the</strong> benefits of inclusion,unless exclusion would lead to <strong>the</strong> extinction of <strong>the</strong> species.In <strong>the</strong> proposed and final listing of <strong>the</strong> nor<strong>the</strong>rn spotted owl, <strong>the</strong> FWS deferreddesignation of critical habitat as "not determinable." Critical habitat must bedesignated to <strong>the</strong> maximum extent prudent and determinable at <strong>the</strong> time aspecies is listed. If critical habitat is not determinable at listing, <strong>the</strong> act allowsan additional year beyond <strong>the</strong> one in which listing must progress from proposedto final. At <strong>the</strong> end of <strong>the</strong> second year, critical habitat must be designatedto <strong>the</strong> maximum extent prudent. In fur<strong>the</strong>r consideration of <strong>the</strong> casethat challenged <strong>the</strong> FWS's original petition finding, <strong>the</strong> court did not accept <strong>the</strong>FWS's argument that critical habitat <strong>for</strong> <strong>the</strong> owl was not determinable, andordered <strong>the</strong> FWS to publish a proposal to designate critical habitat by April 29,1991. A proposal <strong>for</strong> 11.6 million acres of critical habitat was published onMay 6, 1991. A revised proposal that reduced <strong>the</strong> area to about 8.2 millionacres, principally by excluding private, Indian, and state lands, was publishedon August 3, 1991, and a final designation of 6.9 million acres was issued onJanuary 15, 1992.4
4. <strong>Recovery</strong> <strong>Plan</strong>sThe Endangered Species Act calls <strong>for</strong> <strong>the</strong> preparation of recovery plans <strong>for</strong>listed species that are likely to benefit from <strong>the</strong> ef<strong>for</strong>t, and authorizes <strong>the</strong>Secretary of <strong>the</strong> Interior to appoint recovery teams. A recovery plan mustestablish recovery goals and objectives, describe site-specific managementactions recommended to achieve those goals, and estimate <strong>the</strong> time and costrequired <strong>for</strong> recovery. A recovery plan is not self-implementing, but presents aset of recommendations endorsed by an approving official representing <strong>the</strong>Department of <strong>the</strong> Interior.The Secretary appointed an interdisciplinary Nor<strong>the</strong>rn <strong>Spotted</strong> <strong>Owl</strong> <strong>Recovery</strong>Team in February 1991. The Secretary's directive to <strong>the</strong> team (see Appendix K)called <strong>for</strong> a biologically credible plan. The Secretary fur<strong>the</strong>r directed that <strong>the</strong>plan should, consistent with its legal mandate, "address concerns such as:potential community and regionwide economic and social impacts: fiscalimplications at <strong>the</strong> local, state and federal levels: compatibility with o<strong>the</strong>r legalmandates; effects on o<strong>the</strong>r threatened and endangered species and thosespecies which might be listed in <strong>the</strong> future; and broader, ecosystem-relatedconsiderations."The Nor<strong>the</strong>rn <strong>Spotted</strong> <strong>Owl</strong> <strong>Recovery</strong> Team includes members of federal agencies,academic scientists, and representatives from <strong>the</strong> governors' offices inCali<strong>for</strong>nia, Oregon, and Washington. The <strong>Recovery</strong> Team held meetings eachmonth from March to September 1991 that were open to <strong>the</strong> public and <strong>the</strong>nmet in closed session while it developed final options and recommendations <strong>for</strong><strong>the</strong> Secretary's review.At its first meeting, <strong>the</strong> <strong>Recovery</strong> Team established standing committees toaddress particular aspects of preparing <strong>the</strong> recovery plan: members of <strong>the</strong>committees are shown in Appendix K. Committees were established <strong>for</strong> owlbiology, planning and implementation, <strong>for</strong>est ecology and management, o<strong>the</strong>rspecies, and economics. An executive committee also was <strong>for</strong>med whosemembership included <strong>the</strong> <strong>Recovery</strong> Team chairman, team coordinator, and allcommittee chairpersons. The committees ga<strong>the</strong>red in<strong>for</strong>mation and providedevaluations in <strong>the</strong>ir respective subject areas <strong>for</strong> presentation to and action by<strong>the</strong> full <strong>Recovery</strong> Team.The <strong>Recovery</strong> Team held numerous meetings as a full team and in smallercommittees working on specific matters. Members visited a wide variety of owlhabitats and <strong>for</strong>ests in <strong>the</strong> three states, including lands in <strong>the</strong> Mt. Hood andSix Rivers National Forests, Olympic National Park, <strong>the</strong> Bureau of Land ManagementEugene District, <strong>the</strong> Yakima Indian Reservation, Oregon's TillamookState Forest, and several privately owned commercial <strong>for</strong>ests.The <strong>Recovery</strong> Team's mandate and its inclusion of some members with backgroundsin areas o<strong>the</strong>r than <strong>the</strong> biological sciences make it unusual amongrecovery teams. This structure enables <strong>the</strong> <strong>Recovery</strong> Team to consider and, asappropriate, to reduce <strong>the</strong> cost of recovery. It is also significant that Congressagreed to Conference Report language accompanying <strong>the</strong> 1992 Interior andRelated Agencies appropriation bill encouraging <strong>the</strong> <strong>Recovery</strong> Team to consider<strong>the</strong> social and economic impacts of <strong>the</strong> recovery plan.5
B. The Interagency Scientific CommitteeWhile <strong>the</strong> proposal to list <strong>the</strong> nor<strong>the</strong>rn spotted owl was pending, <strong>the</strong> four principalfederal agencies involved in management of <strong>the</strong> owl (Forest Service, Bureauof Land Management, Fish and Wildlife Service, National Park Service) commissionedan Interagency Scientific Committee (ISC) to develop a conservationstrategy <strong>for</strong> <strong>the</strong> owl. The committee delivered its product in April 1990 in <strong>the</strong><strong>for</strong>m of a strategy organized around <strong>the</strong> establishment of habitat conservationareas (HCAs) throughout <strong>the</strong> range of <strong>the</strong> owl, including an adaptive managementapproach (Thomas et al. 1990). The ISC strategy represented a significantga<strong>the</strong>ring and syn<strong>the</strong>sis of in<strong>for</strong>mation on <strong>the</strong> biology and conservation of <strong>the</strong>owl and provided a point of departure <strong>for</strong> much of what subsequently hasoccurred regarding owl conservation. The ISC report concluded that at that timemanagement strategies were inadequate to ensure <strong>the</strong> owl's viability. The ISCbelieved its strategy, -. . . if faithfully implemented, has a high probability ofretaining a viable, well-distributed population of nor<strong>the</strong>rn spotted owls over <strong>the</strong>next 100 years," (Thomas et al. 1990:4).In many respects <strong>the</strong> task of <strong>the</strong> <strong>Recovery</strong> Team is similar to that of <strong>the</strong> ISC.There are, however, several significant differences. The most fundamentaldifferences concern <strong>the</strong> frames of reference of <strong>the</strong> two groups. When <strong>the</strong> ISCwas <strong>for</strong>med and prepared its strategy, <strong>the</strong> owl had not been listed as threatenedand was not subject to protection under <strong>the</strong> Endangered Species Act.The strategy was commissioned by federal agencies, and members of <strong>the</strong> corecommittee of <strong>the</strong> ISC were federal employees. The committee had no obligationto and did not attempt to articulate its strategy in terms of <strong>the</strong> owl's recoveryfrom threatened status.The <strong>Recovery</strong> Team began its work after <strong>the</strong> owl had been listed. Protectivemeasures had taken effect and were available as tools <strong>for</strong> conservation. The<strong>Recovery</strong> Team, appointed by <strong>the</strong> Secretary of <strong>the</strong> Interior, includes in its coremembership academic scientists and representatives of <strong>the</strong> governors of <strong>the</strong>three affected states. Direct participation at this level by <strong>the</strong> states gave <strong>the</strong><strong>Recovery</strong> Team a greater opportunity to address <strong>the</strong> entire range of <strong>the</strong> owl andmanagement of owls on nonfederal lands than was af<strong>for</strong>ded <strong>the</strong> ISC. Perhapsmost important, a recovery team must, if possible, develop goals <strong>for</strong> <strong>the</strong> recoveryof a species to <strong>the</strong> point at which it may be removed from <strong>the</strong> endangeredor threatened list and also must describe criteria by which achievement of<strong>the</strong>se goals can be recognized.Similarities between <strong>the</strong> ISC strategy and this recovery plan arise from <strong>the</strong>ircommon foundation in <strong>the</strong> biology of <strong>the</strong> owl and reliance on available managementtools and principles of conservation biology. Differences between <strong>the</strong> tworeflect <strong>the</strong> differing composition and charters of <strong>the</strong> groups that prepared <strong>the</strong>m.C. The Biological Basis of <strong>the</strong> <strong>Plan</strong>The conservation measures in <strong>the</strong> recovery plan reflect general biologicalprinciples and specific knowledge concerning <strong>the</strong> biology of <strong>the</strong> nor<strong>the</strong>rnspotted owl. In large part, <strong>the</strong> plan borrows from and builds upon <strong>the</strong> conceptsand in<strong>for</strong>mation presented in <strong>the</strong> ISC strategy. The following principlesprovide a biological basis <strong>for</strong> <strong>the</strong> plan:* The risk of local or widespread extirpation will be reduced bymanaging <strong>for</strong> owls across <strong>the</strong>ir entire range and in <strong>the</strong> varietyof ecological conditions within that range.6
* Emphasis should be placed on management <strong>for</strong> clusters, orlocal population centers, of owls habitat blocks, ra<strong>the</strong>r than <strong>for</strong>individual pairs.* Habitat conditions and spacing among local populationsshould provide free movement of owls to allow ametapopulation structure to operate.For <strong>the</strong> owl, <strong>the</strong>se principles result in recommendations <strong>for</strong> a) a network ofdesignated conservation areas (DCAs) sufficiently large when possible tosupport 20 pairs of owls each, b) management within DCAs to maintain orincrease suitable habitat <strong>for</strong> owls, and c) management to allow owls to moveamong DCAs. The size and arrangement of DCAs are based on in<strong>for</strong>mationabout <strong>the</strong> size of territories established by pairs of owls and <strong>the</strong> ability of owlsto disperse. Knowledge of habitat characteristics needed to support owlsprovided a basis <strong>for</strong> recommending management of <strong>for</strong>estlands to supportrecovery. Throughout <strong>the</strong> plan, recommendations are tailored to locallyspecific in<strong>for</strong>mation. Organization of recovery around multipair habitat areasis particularly appropriate <strong>for</strong> this species because of knowledge of its behavior,which includes significant inter-pair interaction.In addition to owl conservation, <strong>the</strong> recovery plan considers <strong>the</strong> biology andconservation needs of o<strong>the</strong>r species that occur within <strong>the</strong> range of <strong>the</strong> owl. Therecovery plan incorporates elements to benefit o<strong>the</strong>r species and generalecosystem values when doing so adds little or no additional cost while conserving<strong>the</strong> owl.D. The Means of Achieving <strong>Recovery</strong>E. Sources of In<strong>for</strong>mationThe recovery plan recommends an approach to owl recovery that involvesfederal, state, and private sectors. The underlying strategy is interactive, andaccordingly, recommends management objectives and practices consistent with<strong>the</strong> various implementation mechanisms available among <strong>the</strong>se sectors. The<strong>Recovery</strong> Team believes this approach is <strong>the</strong> most efficient and effective meansto achieve recovery. At <strong>the</strong> same time, however, <strong>the</strong> <strong>Recovery</strong> Team understandsthat <strong>the</strong> statutory mandates of <strong>the</strong> recovery planning process and <strong>the</strong>Endangered Species Act impose different requirements on land managers andowners. Accordingly, <strong>the</strong> recommendations place strong emphasis on <strong>the</strong> need<strong>for</strong> appropriate federal land management as a basis <strong>for</strong> recovery. As <strong>the</strong> plan isimplemented, achieving or exceeding recommended state and private commitmentsin some physiographic provinces may hasten recovery, and perhapsultimately enable greater flexibility in federal management than <strong>the</strong> plan nowenvisions. In o<strong>the</strong>r provinces, however, particularly where obstacles to recoveryare acute, flexibility is not likely to be possible in <strong>the</strong> immediate future.Both published and unpublished documents (unpublished documents arecommonly referred to as "grey literature") have been used as references in thisplan. Grey literature has not been subjected to <strong>for</strong>mal, rigorous peer review,and thus its acceptability among scientists as a source of in<strong>for</strong>mation fromwhich inference can be drawn is low. Likewise, published documents vary in<strong>the</strong>ir utility as sources of in<strong>for</strong>mation. In general, popular articles (e.g., thosein newspapers and magazines) have <strong>the</strong> lowest value as sources of unbiasedin<strong>for</strong>mation. With one exception, none is cited in this review. Privately pub-7
lished works and many government documents are not usually <strong>for</strong>mallyreviewed, and often are referred to as grey literature. Peer-reviewed scientificjournals, symposia, and books <strong>for</strong>m <strong>the</strong> backbone of scientific literature. Whilepeer review cannot, in most cases, assure <strong>the</strong> credibility of raw data, it doesassure <strong>the</strong> reader that <strong>the</strong> in<strong>for</strong>mation has been subjected to rigorous scrutinyof its methods, analysis, logic, and <strong>the</strong> appropriateness of an author's inferencesand conclusions given <strong>the</strong> quality and amount of data and <strong>the</strong> analyticaltools used to evaluate <strong>the</strong> data. In <strong>the</strong> case of <strong>the</strong> nor<strong>the</strong>rn spotted owl, muchof <strong>the</strong> available in<strong>for</strong>mation is found only in grey literature. Grey literaturefrequently has been used in this document because it often represents <strong>the</strong> verylatest field data. In addition, to categorically reject grey literature would resultin a virtual absence of in<strong>for</strong>mation derived from <strong>the</strong> timber industry. Use ofsuch in<strong>for</strong>mation should result in a more in<strong>for</strong>mative review and a strongerrecovery plan.F. Acknowledgments8The Nor<strong>the</strong>rn <strong>Spotted</strong> <strong>Owl</strong> <strong>Recovery</strong> Team has been assisted in its work by alegion of able cooperators. Many of <strong>the</strong>se people volunteered <strong>the</strong>ir time andef<strong>for</strong>ts in excess of what anyone could have plausibly expected, and haveendured schedules and deadlines that can only be described as unreasonable.The list below is undoubtedly incomplete, and <strong>the</strong> <strong>Recovery</strong> Team regrets anyomissions. To all named and any unnamed collaborators, we express ourgratitude: we could not have completed our work without <strong>the</strong>ir contributions.James K. Agee, David Allen, David Anderson, Brad Andres, Keith Aubry, PhilAust, Robert W. Baker, Allison Banks, Timothy A. Barnes, Joseph Beatty, GaryBenson, Marty Berbach, Bill Beyers, Monte Bick<strong>for</strong>d, Bruce Bingham, KevinBirch, Helen Birss, Andrew Blaustein, Kathryn Boula, Nancy Brooks, CharlieBrown, Ken Burnham, Bruce Bury, Andrew Carey, Jill Carroll, JohnCharbonneau, Steve Corn, Eric Cummins, Tom Cyra, Larry Davis, William F.Delaney, Velma Delp, Nicholas Dennis, Randy Dettmers, Lowell Diller, AimeeDour, James Eby, Ed Ehlers, Rich Everett, Robert A. Ewing, Lee Folliard, EricForsman, Louise Fortmann, Alan Franklin, Terrence Frest, Florissa Fuentes,Bob Gara, Keith Gilless, Brian Greber, Jeff Grenier, John H. Grobe, TomHamer, Michael Hamel, Melissa Hamel, Jeff Hannum, Mark Harmon, ConnieHarrington, Michael Hay, Mauragrace Healey, Lorin Hicks, Patrick Higgins,Jerry Hoyer, Robert J. Hrubes, Mark Huff, Larry Irwin, Frank Isaacs, KirkJobeson, K. Norman Johnson, Rebecca Johnson, Connie Kahn, BooneKaufmann, Jon Kennedy, Steve Kerns, Walt Knapp, William LaHaye, JackLattin, Robert G. Lee, George Leitner, Gary Lettman, Rob Lewis, Joe Lint,Bruce Lippke, Dan Luoma, Mike Lunn, Tom Lynch, Kathy Majors, BruceMarcot, Sandy Martin, Bill McComb, Kevin McKelvey, William McKillop, WalterJ. Mead, Chuck Meslow, Joe Meyer, Nanette Miller, Christine Moen, AndrewMoldenke, Jeff Morrell, Peter Morrison, Robert Motroni, Barry Mulder, EdMurphy, Gil Murray, Jim Neely, Susan Nelson, Bill Nietro, Barry Noon, TheronOdell, Kathy O'Halloran, Chad Oliver, Tom Owen, Dave Perry, Rick Peterson,Malcolm Pious, Ann Potter, Terry Raettig, Martin Raphael, Richard Reynolds,Jo Ellen Richards, Paul Roush, Frank Ryals, Bob Saunders, Mel Schamberger,Steve Self, Mike Skinner, David Solis, Paul Sommers, Tom Spies, Mike Srago,Argon Steel, John Steffenson, Dave Stere, Robert Storm, John Teply, SteveTesch, Jack Ward Thomas, Dale Thornburgh, David Thorud, Melvie Uhland,Jerry Verner, Frank Wagner, Paul Warner, Bill Watterson, Phil Wea<strong>the</strong>rspoon,Thomas Williams, Wendell Wilson, George Wyatt, Cindy Zabel, and JohnZasada.No project like this one comes to fruition without exacting a toll on <strong>the</strong> participants'personal support groups of family and friends. We appreciate <strong>the</strong>indulgence of those closest to us, who have put up with our frequent physicaland mental absences during <strong>the</strong> preparation of this recovery plan.
Chapter IIBiology and Managementof <strong>the</strong> Nor<strong>the</strong>rn <strong>Spotted</strong> <strong>Owl</strong>9
II.A. Natural History of <strong>the</strong>Nor<strong>the</strong>rn <strong>Spotted</strong> <strong>Owl</strong>*1. Introduction2. Natural HistoryDescriptionThe nor<strong>the</strong>rn spotted owl (Strix occilentalis caurina) is one of <strong>the</strong> most studiedand best known owls in <strong>the</strong> world. The research ef<strong>for</strong>t on this subspeciesrivals that on some European owls (Sou<strong>the</strong>rn 1970, Saurola 1989, Nero et al.1987). This degree of scientific attention is <strong>the</strong> result of this owl's associationwith late seral stage conifer <strong>for</strong>est of high commercial value in <strong>the</strong> PacificNorthwest (Forsman et al. 1984). The bird is <strong>the</strong> topic of vigorous debateamong <strong>for</strong>esters, wildlife ecologists, academics, politicians, social scientists,and economists (Heinrichs 1984, Dawson et al. 1987, Dixon and Juelson 1987,Simberloff 1987, USDA 1988, Gup 1990).Because of this widespread interest, three major management plans have beendeveloped to protect <strong>the</strong> viability of <strong>the</strong> nor<strong>the</strong>rn spotted owl (USDA 1988,Thomas et al. 1990, USDA 1991). These documents have been reviewed byscientists (Murphy and Noon In Press) and special interest groups alike (Boyce1987, Green 1991, Reich 1991, Sheriff 1991). Two reviews of <strong>the</strong> owl's ecologicalstatus have been conducted by <strong>the</strong> FWS (Gore et al. 1987; USDI 1990).These plans have received widespread scrutiny in <strong>the</strong> scientific literature, and<strong>the</strong> press, by government agencies, and <strong>the</strong> courts (Simberloff 1987, Gup1990, GAO 1989, Portland Audubon Society v. Lujan 1991, respectively). Inaddition, several literature reviews and critiques have been written during <strong>the</strong>past decade that document <strong>the</strong> history of knowledge acquisition on this uniquenocturnal predator (Solis 1980, Forsman 1984, Gutierrez 1985, Gutierrez andCarey 1985, Dawson et al. 1987, Gore et al. 1987, Forsman 1988a, Thomas etal. 1990, USDI 1990). The objective of this section is to summarize <strong>the</strong> ecologyof this controversial animal.The seminal work on <strong>the</strong> natural history of <strong>the</strong> nor<strong>the</strong>rn spotted owl isForsman et al. (1984). However, Thomas et al. (1990) will serve as a referencepoint <strong>for</strong> specific data on certain aspects (home range size, habitat, and foodhabits) of <strong>the</strong> natural history of <strong>the</strong> nor<strong>the</strong>rn spotted owl in this literaturereview since that work represents <strong>the</strong> most complete data yet assembled about<strong>the</strong> nor<strong>the</strong>rn spotted owl.The nor<strong>the</strong>rn spotted owl (Strix occidentalis caunna) is a medium-sized owlfound in <strong>the</strong> Pacific Northwest. It is chocolate brown with round to ellipticalwhite spots on <strong>the</strong> body fea<strong>the</strong>rs and white bars on <strong>the</strong> tail. O<strong>the</strong>r common* Prepared by R. J. Gutierrez1 1
distinguishing features are its dark eyes surrounded by tawny facial disks.Males and females are not easily distinguishable by plumage characters,although Barrows et al. (1982) suggested that <strong>the</strong> sex of spotted owls can bedetermined from <strong>the</strong> number of tail bars. Moen et al. (1991) reported that <strong>the</strong>tail-bar technique is unreliable <strong>for</strong> sex determination. However, a spottedowl's sex is recognized readily by voice (Forsman et al. 1984; see voicedescription under Behavior) and size (Forsman et al. 1984, Blakesley et al.1990). <strong>Spotted</strong> owls, and owls in general, show reversed sexual dimorphism:females are larger than males (Blakesley et al. 1990:323). This reversedsexual dimorphism exists in all commonly measured physical features, butbody mass is <strong>the</strong> single best physical predictor of sex in this owl (Blakesley etal. 1990:323).Plumage characteristics can be used to distinguish among several age classesof spotted owls. Juvenile spotted owls (ages 1 day to approximately 5 months)are distinguished by visible down fea<strong>the</strong>rs (Forsman 1981). The proportion ofdown fea<strong>the</strong>rs decreases with age. Subadult birds are distinguished by <strong>the</strong>presence of adult plumage and white-tipped, pointed tail fea<strong>the</strong>rs (Forsman1981). In nor<strong>the</strong>rn spotted owls, two subadult age classes can be recognized.Subadults that are 1 year old have a downy tuft at <strong>the</strong> tip of <strong>the</strong> pointed tailfea<strong>the</strong>rs, whereas this downy tuft is lost by a bird's second year (Moen et al.1991). Adult (i.e., more than 27 to 28 months old) birds have rounded tips on<strong>the</strong> tail fea<strong>the</strong>rs, which usually are mottled in color.Range And DistributionThe range of a species is that general geographic area within which <strong>the</strong> speciesmay occur. A species' distribution may be synonymous with its range or itmay be specific to <strong>the</strong> habitat types in which it occurs within its range. Nor<strong>the</strong>rnspotted owls are found from sou<strong>the</strong>rn British Columbia, Canada, south toMarin County, Cali<strong>for</strong>nia. They range eastward through this area to <strong>the</strong> edgeof <strong>the</strong> Palouse prairie in Washington and <strong>the</strong> Great Basin shrub steppe inOregon and Cali<strong>for</strong>nia. Although nor<strong>the</strong>rn spotted owls are sighted in almostall areas of <strong>the</strong>ir general range (e.g., urban areas, beach dunes), <strong>the</strong>ir breedingdistribution is restricted to <strong>for</strong>est communities (see Habitat). They are foundfrom sea level to as high as approximately 7,500 feet in <strong>the</strong> sou<strong>the</strong>rn portion of<strong>the</strong>ir range and to approximately 4,000 feet in elevation in <strong>the</strong> nor<strong>the</strong>rn part of<strong>the</strong>ir range. Densities of owls vary across this broad range according to habitattype, habitat quality, and habitat quantity (Thomas et al. 1990). The currentdistribution of known spotted owls within <strong>the</strong>ir historic range is in Figure 2. 1.Taxonomy And Genetic Relationships<strong>Spotted</strong> owls are members of <strong>the</strong> largest family, Strigidae, within <strong>the</strong> orderStrigi<strong>for</strong>mes. Some controversy exists regarding <strong>the</strong> taxonomic and systematicrelationships of birds within this order (Sibley et al. 1988, Cracraft 1981),although most of <strong>the</strong> discussion centers on higher taxonomic levels. Thegenus Strix is a widely distributed group of owls with members occurring in <strong>the</strong>Nearctic, Palearctic, Neotropical, and Indian fauna regions (Clark et al. 1978).In North America <strong>the</strong>re are three species of Strix: <strong>the</strong> spotted owl, <strong>the</strong> barredowl (Strix varia), and <strong>the</strong> great gray owl (Strix nebulosau Johnsgard 1988). Strixowls may be most closely related genetically to owls in <strong>the</strong> genus A<strong>the</strong>ne (Randietal. 1991).<strong>Spotted</strong> owls were described by early naturalists as three subspecies (<strong>the</strong>nor<strong>the</strong>rn spotted owl: <strong>the</strong> Cali<strong>for</strong>nia spotted owl, Strix occidentalis occidentalLs;and <strong>the</strong> Mexican spotted owl, S. occidentals lucida). The Cali<strong>for</strong>nia spotted owlwas first described by Xantus (1859) from a specimen collected in <strong>the</strong>12
I- \IzXelT - - -.11 I..., ... I.." 11 I -- 11
BehaviorTehachapi Mountains of sou<strong>the</strong>rn Cali<strong>for</strong>nia. The nor<strong>the</strong>rn and Mexicansubspecies were named by Merriam (1898) and Nelson (1903), respectively, on<strong>the</strong> basis of plumage color and o<strong>the</strong>r morphological characters. Early naturalistsoften named subspecies on <strong>the</strong> basis of slight differences in plumage orsize variation. Thus, it was not surprising that Oberholser (1915) recommendedthat <strong>the</strong> Cali<strong>for</strong>nia spotted owl and <strong>the</strong> nor<strong>the</strong>rn spotted owl bemerged as one subspecies because of <strong>the</strong> large variation and overlap in plumagecharacters between <strong>the</strong> two subspecies. This recommendation apparentlywas not accepted by <strong>the</strong> American Ornithologists' Union (1957) Committee onNomenclature. More recently <strong>the</strong> American Ornithologists' Union Committeewas requested to reevaluate <strong>the</strong> subspecific status of <strong>the</strong> nor<strong>the</strong>rn and Cali<strong>for</strong>niasubspecies. However, it declined to change <strong>the</strong> current designation becauseof a lack of adequate study of <strong>the</strong> subspecies characters (see discussionin Thomas et al. 1990:59). Never<strong>the</strong>less, <strong>the</strong> original boundaries delineating<strong>the</strong> subspecies' ranges were clearly arbitrary (Gould In Prep.).Barrowclough and Gutierrez (1990) attempted to elucidate <strong>the</strong> relationshipsamong <strong>the</strong> three subspecies using allozyme electrophoresis (a techniqueemployed to assess genetic variation). They compared patterns of proteinvariation at 19 presumptive loci among eight populations of <strong>the</strong> three subspecies.Surprisingly, <strong>the</strong>y found no detectable variation among <strong>the</strong> Pacific Coastpopulations <strong>for</strong> any of <strong>the</strong> loci. One major allelic difference was found between<strong>the</strong> coastal and Mexican subspecies. Thus, <strong>the</strong>ir results did not resolve <strong>the</strong>subspecific relationships of cauina and occidentalis. However, lucida wasclearly a distinguishable taxon, and it probably has been separated from <strong>the</strong>coastal <strong>for</strong>ms <strong>for</strong> many hundreds of years (Barrowclough and Gutierrez1990:742).Low levels of genetic variation in wild populations are considered to be a threatto <strong>the</strong>ir evolutionary potential (Frankel and Soule 1981). This is because apopulation with low genetic variation would not have <strong>the</strong> variety of genes uponwhich natural selection could act to promote adaptation to changing environmentalconditions over evolutionary time. However, <strong>the</strong> lack of electrophoreticvariation in <strong>the</strong> coastal <strong>for</strong>ms of spotted owl does not demonstrate unequivocallythat <strong>the</strong>se subspecies are genetically depauperate. Barrowclough andGutierrez (1990) discuss possible alternative explanations <strong>for</strong> <strong>the</strong> lack ofelectrophoretic variation found in spotted owls.It is evident from <strong>the</strong> few studies conducted on <strong>the</strong> taxonomic and geneticrelationships of spotted owls that more needs to be learned to estimate bothcurrent levels of genetic variation in populations and hybridization with <strong>the</strong>barred owl. A few Cali<strong>for</strong>nia/Mexican hybrids are known from <strong>the</strong> wild (seeintra- and interspecific relationships). Hybridization is common among closelyrelated wild birds that are classified as separate species. The key issues to beresolved in evaluating hybridization as a threat to spotted owls is <strong>the</strong> extent ofhybridization (i.e., <strong>the</strong> levels of gene introgression), and <strong>the</strong> viability of hybrids.Barrowelough and Gutierrez (pers. comm.) currently are using advancedmolecular genetic techniques to help answer some of <strong>the</strong>se questions.Adaptations of a Nocturnal Predator: <strong>Spotted</strong> owls are primarily a nocturnalpredator (Bent 1938). Like o<strong>the</strong>r nocturnal owls, spotted owls possessthree primary adaptations <strong>for</strong> night life: exceptional eyesight, exceptionalhearing, and modified fea<strong>the</strong>rs to facilitate silent flight (Payne 1971, Konishi1973, Clark et al. 1978, Martin 1986). <strong>Spotted</strong> owls are perch-and-pouncepredators (Forsman 1976). That is, owls select a perch and wait, trying tolocate potential prey ei<strong>the</strong>r by sight or sound; once prey is detected, <strong>the</strong>y try tocapture it with <strong>the</strong>ir talons. If prey is located in an inaccessible location or at14
spring. Territories probably are smaller than home ranges, but <strong>the</strong> exactrelationship between <strong>the</strong> defended area and <strong>the</strong> used area is unknown. Bothmembers of a pair vigorously defend <strong>the</strong> territory through vocalizations andvisual displays. This propensity to defend a territory also is <strong>the</strong> key to successfulstudy of <strong>the</strong> species because one can locate <strong>the</strong> birds through imitation of<strong>the</strong>ir calls.<strong>Spotted</strong> owls often <strong>for</strong>m long-term pair bonds (Forsman et al. 1984). Pairbonds do occasionally dissolve, but <strong>the</strong> reasons <strong>for</strong> "divorce" are unknown(Franklin and Gutierrez unpubl. data). Never<strong>the</strong>less, several behaviors occurcommonly among spotted owls that serve to illustrate mechanisms that probablyhave evolved to rein<strong>for</strong>ce pair bonds. Calling serves to streng<strong>the</strong>n pairbonds when it is given in <strong>the</strong> appropriate context (e.g., nest site selection, preydelivery). Courtship feeding by <strong>the</strong> male is common during <strong>the</strong> early part of<strong>the</strong> nesting cycle (Forsman 1976) and may serve as a proximate cue to ei<strong>the</strong>rfood availability or <strong>the</strong> male's ability to hunt successfully. Finally, physicalcontact, as exemplified by "allopreening" (i.e., mutual preening of fea<strong>the</strong>rs),also serves to streng<strong>the</strong>n pair bonds (Forsman and Wight 1979). Allopreeningis common in o<strong>the</strong>r Strix owls (Fitzpatrick 1975, Nero 1980), and is ingrainedso strongly in <strong>the</strong>se birds that captured owls may engage in allopreening with<strong>the</strong>ir captors (Nero 1980).The nesting cycle begins with <strong>the</strong> return of <strong>the</strong> pair from <strong>the</strong> wintering area to<strong>the</strong> nesting area in late winter or early spring (late February to early March).The pair begins to roost toge<strong>the</strong>r on a more frequent schedule as day lengthincreases. The initiation of laying is contingent upon <strong>the</strong> physical condition of<strong>the</strong> female, <strong>the</strong> availability and abundance of prey, and <strong>the</strong> ability of <strong>the</strong> maleto capture sufficient prey. The condition of <strong>the</strong> female probably depends on <strong>the</strong>female's hunting experience and <strong>the</strong> prey levels within <strong>the</strong> territory during <strong>the</strong>winter and <strong>the</strong> preceding fall. Once a pair is committed to nesting, <strong>the</strong> femalelays her clutch of eggs and incubates and broods <strong>the</strong> young without assistancefrom <strong>the</strong> male. In fact, during incubation and <strong>the</strong> first half of <strong>the</strong> broodingperiod, <strong>the</strong> female leaves <strong>the</strong> nest only to defecate, regurgitate pellets, avoidpredation, defend against conspecifics (i.e., o<strong>the</strong>r spotted owls), or receive preydelivered by <strong>the</strong> male. The role of <strong>the</strong> male is to provide sufficient food to <strong>the</strong>female so that <strong>the</strong> female need not <strong>for</strong>age. Once <strong>the</strong> young have hatched, <strong>the</strong>juveniles remain 3 to 5 weeks be<strong>for</strong>e leaving <strong>the</strong> nest. <strong>Owl</strong>ets often leave <strong>the</strong>nest be<strong>for</strong>e <strong>the</strong>y can fly, simply jumping from <strong>the</strong> nest into <strong>the</strong> surroundingtree branches or onto <strong>the</strong> ground. These young birds are fed and tended byone or both of <strong>the</strong> adults until <strong>the</strong>y disperse in early fall (late September orearly October, see Dispersal). Following dispersal of <strong>the</strong> young birds, adultbirds begin to expand <strong>the</strong>ir home ranges and to roost toge<strong>the</strong>r less frequently,signaling an end to <strong>the</strong> annual reproductive cycle.Intra- And Interspecific RelationshipsCompetition: Intraspecific competition is <strong>the</strong> competition <strong>for</strong> resources amongmembers of <strong>the</strong> same species. Territoriality is one expression of intraspecificcompetition. One adaptive advantage of territoriality is that it allows a territoryholder to sequester resources <strong>for</strong> exclusive use. Because spotted owl prey arepatchy in distribution and variable in abundance (Ward 1990), it is important,if not necessary, <strong>for</strong> spotted owls to defend territories and use large areas <strong>for</strong><strong>for</strong>aging.Preliminary in<strong>for</strong>mation on habitat selection ga<strong>the</strong>red by Solis and Gutiirrez(1990) and Sisco (1990) suggest that intersexual (competition between malesand females of <strong>the</strong> same species) competition may have led to <strong>for</strong>aging habitatsegregation between males and females. It appears that males and femalesselect <strong>for</strong>ests of different structure, and that <strong>the</strong> smaller males hunt in denser16
<strong>for</strong>ests. Alternatively, habitat selection by each sex may be <strong>the</strong> result ofreversed sexual dimorphism, which may have evolved <strong>for</strong> o<strong>the</strong>r reasons besidesfood competition (Muller 1986).Competition <strong>for</strong> resources can occur between different species, this is commonlycalled interspecific competition. The use of any finite resource in onearea by more than one species can result in competition, if <strong>the</strong> depletion of <strong>the</strong>resource by one species negatively affects ano<strong>the</strong>r species. Competition iscommonly invoked as a selective mechanism <strong>for</strong> <strong>the</strong> evolution of niche partitioning(Cody 1974). For example, <strong>the</strong> relative differences in body size ofmembers of <strong>the</strong> Pacific Northwest owl community may be an expression of pastcompetition that led to <strong>the</strong> evolution of differences in body size and <strong>for</strong>agingstrategies that minimize diet or habitat overlap. Alternatively, <strong>the</strong> owl communitystructure simply may be an expression of adaptive radiation (adapting toregional environmental conditions) at some time in <strong>the</strong> past (Wiens 1989).Never<strong>the</strong>less, competition can be a serious problem <strong>for</strong> a species when anexotic (nonnative) animal of similar body size and ecological requirementsinvades its habitat. The recent invasion of <strong>the</strong> barred owl into <strong>the</strong> range of <strong>the</strong>spotted owl (Taylor and Forsman 1976) is an example of potential competitionbetween closely related species. Barred owls are larger and more aggressivethan spotted owls in interspecific territorial interactions. They also feed on abroader range of prey, occupy a wider range of habitats, and have smallerannual home ranges than do spotted owls (Hamer 1988). Fur<strong>the</strong>r, <strong>the</strong>y areknown to have to have displaced spotted owls from <strong>the</strong>ir territories (Allen pers.comm.). Thus, barred owls are a competitive threat to spotted owls.Hybridization: At least three spotted owl/barred owl hybrids have beenobserved in <strong>the</strong> wild (Forsman pers. comm.). It is common in nature <strong>for</strong> closelyrelated species to hybridize, especially where habitat disruption has occurred(Short 1965, Johnsgard 1970, Mayr and Short 1970, Short 1972). Vincent(1990) expressed concern about <strong>the</strong> recent invasion of barred owls and <strong>the</strong>potential effect of hybridization on <strong>the</strong> integrity of <strong>the</strong> spotted owl as a species.Several biological outcomes are possible given <strong>the</strong> rapid expansion of barredowls into <strong>the</strong> range of <strong>the</strong> spotted owl. First, <strong>the</strong> barred owl could, throughextensive hybridization, genetically "swamp" <strong>the</strong> spotted owl. Second, a"hybrid swarm" could develop in specific areas of contact. Third, selectioncould act against hybrids, thus favoring development of effective isolatingmechanisms. Fourth, low levels of hybridization could occur continuouslywithout loss of <strong>the</strong> identity of ei<strong>the</strong>r species. Fifth, hybridization could be arandom event. In only <strong>the</strong> first case is <strong>the</strong> genetic integrity of <strong>the</strong> spotted owlseriously challenged. However, in declining populations any loss of spotted owlreproductive capacity to hybridization must be considered a real threat, butprimarily because of its effect on <strong>the</strong> short-term demography of <strong>the</strong> species.Predation: Ano<strong>the</strong>r <strong>for</strong>m of interspecific interaction is predation (<strong>the</strong> killing ofone organism by ano<strong>the</strong>r <strong>for</strong> food). As a medium-sized owl, <strong>the</strong> spotted owlkills and eats smaller owls. There<strong>for</strong>e, it is not surprising that <strong>the</strong> larger greathomed owl (Bubo virginianus) kills and eats spotted owls. This is called a foodchain. Predation by great horned owls on spotted owls is a potential hypo<strong>the</strong>sisto explain spotted owl use of old-growth <strong>for</strong>ests, or to explain spotted owlavoidance of open habitats (Forsman et al. 1984). These two species commonlyshare <strong>the</strong> same habitats, but great horned owls tend to occupy sites thatare more fragmented and open than those used by spotted owls (Johnson pers.comm.), perhaps because <strong>the</strong>ir large size makes <strong>the</strong>m less maneuverable indense <strong>for</strong>est. There is no current test of this hypo<strong>the</strong>sis (i.e., relative predationrates by great homed owls on spotted owls using habitats with differentstructure). However, great homed owls probably prey on spotted owls opportunisticallyra<strong>the</strong>r than seeking spotted owls as prey (Forsman pers. comm.).
Nor<strong>the</strong>rn goshawks (Accipiter gentilis) also prey on adult and juvenile spottedowls (Forsman et al. 1984, Gutierrez et al. 1985, Miller 1989, Johnson 1991pers. comm.). Never<strong>the</strong>less, spotted owls will nest within a goshawk territory(Forsman et al. 1984) and will defend <strong>the</strong>ir young against attacks by goshawks(Gutierrez unpub. data). Thus, goshawks probably are not serious threats tospotted owl populations.Until recently, people rarely have encountered spotted owls and <strong>the</strong>re has beenno historic persecution by humans of this docile creature. The recent, conspicuousrise in spotted owl deaths at <strong>the</strong> hands of humans is a potentialthreat to local owl populations.Diseases and ParasitesHabitatDisease and parasite infections represent ano<strong>the</strong>r <strong>for</strong>m of interspecific interactionbecause it is <strong>the</strong> relationship (in <strong>the</strong> broad biological meaning) of oneorganism with ano<strong>the</strong>r. However, <strong>the</strong> topic of pathogens is treated separatelyhere because it is treated separately in status analyses by <strong>the</strong> FWS whenlisting a species as threatened or endangered.Relatively little is known about <strong>the</strong> diseases and parasites of spotted owls.Gutierrez (1989) conducted an extensive survey of hematozoan parasites (thosethat live in <strong>the</strong> blood) among all three subspecies of <strong>the</strong> spotted owl. Of <strong>the</strong> sixhematozoan species found, all but one species occurred in <strong>the</strong> nor<strong>the</strong>rnspotted owl. The infection rate was 100 percent, which was one of <strong>the</strong> highestrates of infection by <strong>the</strong>se parasites recorded amongbirds (Greiner et al. 1975).However, spotted owls must be adapted to carry <strong>the</strong>se high parasite loadsbecause <strong>the</strong>ir survival rates are very high where infection rates are high (e.g.,northwestern Cali<strong>for</strong>nia, see following text). Hoberg et al. (1989) examined 20nor<strong>the</strong>rn spotted owls <strong>for</strong> helminth (worm) parasites and found eight species,representing nematodes (round worms), cestodes (flat worms), and acanthocephalans(spiny-headed worms). More than 80 percent of <strong>the</strong> birds wereinfected with at least one species; and multiple infections were common.Young et al. (In Review) reported two hippoboscid fly (louse) species fromspotted owls in northwestern Cali<strong>for</strong>nia. One species of fly was recorded onlyonce among <strong>the</strong> 382 owls examined, but approximately 17 percent of <strong>the</strong> owls<strong>the</strong>y examined were infested by <strong>the</strong> o<strong>the</strong>r species. Fly densities on owls werehigher in years of higher summer and fall temperatures and lower winterprecipitation. The authors speculated that low temperatures may have depressedsurvival of fly pupae. Finally, Forsman (pers. comm.) observed twonests where owlets had such high infestations of hippoboscids that <strong>the</strong> fliescaused severe trauma to <strong>the</strong> young birds.Habitat selection and its context: Perhaps <strong>the</strong> most controversial aspect of<strong>the</strong> natural history of <strong>the</strong> spotted owl concerns its habitat requirements.Thomas et al. (1990:143-144) discussed <strong>the</strong> complex habitat needs of <strong>the</strong>nor<strong>the</strong>rn spotted owl.Most species exhibit variation in habitat selection (i.e., most species are notstrict habitat specialists). <strong>Spotted</strong> owls are known to use many habitats.Empirical observations of spotted owls in different habitats can provide understandingof <strong>the</strong> birds' habitat requirements at three different levels (Peek 1986).Habitat use is <strong>the</strong> simple observation of an animal in a habitat without understanding<strong>the</strong> context of <strong>the</strong> observation. Habitat selection is <strong>the</strong> choice of ahabitat or habitats among those that are directly available to <strong>the</strong> animal.Habitat preference is <strong>the</strong> selection of habitat that would be made by an animal18
if all habitats were available to <strong>the</strong> animal. Thus, we have many observationsof spotted owl habitat use, fewer studies of habitat selection, and no studies ofhabitat preference as defined by Peek (1986). Early studies portray <strong>the</strong> nor<strong>the</strong>rnspotted owl as a denizen of primal <strong>for</strong>ests (Grinnell and Miller 1944) basedon observations of habitat use. However, Grinnell and Miller (1944) found thatgeographic variation in habitat use did exist in spotted owls. Subsequentinvestigations (Forsman 1976, 1980, Solis 1983, Forsman et al. 1984,Gutierrez et al. 1984, Solis and Gutierrez 1990, Sisco 1990, Blakesley et al. InPress, Bart and Forsman 1992) reaffirmed <strong>the</strong> naturalists' notions from observationsof habitat use, but more importantly, provided analyses of habitatselection. Recent surveys of managed (i.e., previously logged private lands)<strong>for</strong>ests have added to <strong>the</strong> knowledge of habitat use (Diller 1989, Irwin et al.1989a, 1989b, Kerns 1989, Pious 1989). These latter observations are important,but <strong>the</strong>ir ecological significance is enigmatic because, unlike studiesconducted on public land, <strong>the</strong>re is no supporting demographic in<strong>for</strong>mation. Itis essential that more demographic in<strong>for</strong>mation be ga<strong>the</strong>red to evaluate <strong>the</strong>sepopulations (see section on spotted owl use of young, managed timberlands).Variation in habitats used: <strong>Spotted</strong> owls are known to nest, roost, and feedin a wide variety of habitat types and <strong>for</strong>est stand conditions throughout <strong>the</strong>irdistribution (see discussion of suitable habitat elsewhere in this document).<strong>Spotted</strong> owls use western hemlock, mixed evergreen, mixed conifer, Douglasfir,redwood, Douglas-fir/hardwood, evergreen hardwood, ponderosa pine,western red cedar, and o<strong>the</strong>r <strong>for</strong>est types in different parts of <strong>the</strong>ir range. Mostobservations of spotted owl habitat use have been made in areas having acomponent of old-growth and mature <strong>for</strong>ests (Solis 1983, Forsman et al. 1984,LaHaye 1988, Sisco 1990, Ward 1990, Zabel et al. In Prep.; see additionalsummaries in Thomas et al. 1990). However, observations of spotted owls inmanaged (i.e., previously logged) stands are commonplace (Diller 1989, Kerns1989, Pious 1989). Studies evaluating habitat selection show owl selection <strong>for</strong>mature and/or old <strong>for</strong>est stands with concomitant selection against youngstands (Forsman 1980, Solis 1980, Carey et al. 1990, Blakesley et al. In Press).Selection <strong>for</strong> <strong>for</strong>est stands of intermediate age and size vary among <strong>the</strong> owlsstudied.Nesting habitat: Most nor<strong>the</strong>rn spotted owl nest sites observed on publiclands have been located in old-growth or mature <strong>for</strong>ests (Forsman et al. 1984,LaHaye 1988). In addition, <strong>the</strong> proportion of older seral stage <strong>for</strong>est surroundingnests has been significantly greater than it was in surrounding randomsites in <strong>the</strong> same area (Meyer et al. 1990, Ripple et al. 1991). In areas ofprivate managed <strong>for</strong>est, particularly in <strong>the</strong> Cali<strong>for</strong>nia Klamath and Cali<strong>for</strong>niaCoast physiographic provinces, where some uneven-aged silviculture hasoccurred or where fast tree growth facilitates rapid habitat development,spotted owls are known to nest in managed stands, especially if residual oldgrowthcharacteristics are present (Forsman et al. 1977, Diller 1989, Pious1989, Thomas et al. 1990: see Appendix B).<strong>Spotted</strong> owls do not build <strong>the</strong>ir own nests; <strong>the</strong>y depend upon suitable naturallyoccurring nest sites. In older-age <strong>for</strong>ests, owls tend to nest in broken-top treesand cavities; <strong>the</strong>y use plat<strong>for</strong>ms (i.e., abandoned raptor nests, squirrel nests,mistletoe brooms, debris accumulations) less frequently (Forsman et al. 1984,LaHaye 1988). In younger <strong>for</strong>ests (i.e., <strong>for</strong>ests less than 150 years old), nestsmore frequently are found on plat<strong>for</strong>ms (LaHaye 1988, Irwin et al. 1989a,Buchanan 1991). In one Cali<strong>for</strong>nia study (LaHaye 1988), <strong>the</strong> proportion ofplat<strong>for</strong>m nests used by spotted owls increased north to south, but <strong>the</strong> trendprobably is related to <strong>the</strong> distribution of stand ages in that study ra<strong>the</strong>r thanlatitude.The presence of suitable nest sites has been hypo<strong>the</strong>sized as one possible basis<strong>for</strong> <strong>the</strong> use of old-growth by spotted owls (Forsman et al. 1984). However, owls19
also use a variety of nest sites in younger-aged stands. But one critical piece ofin<strong>for</strong>mation should be assessed be<strong>for</strong>e this hypo<strong>the</strong>sis can be tested. That is,<strong>the</strong> relative nesting success of birds using cavities and broken-top sites shouldbe compared to that of birds using <strong>the</strong> presumably structurally less stabledebris plat<strong>for</strong>ms. In any event, artificial nest sites probably could be provided<strong>for</strong> <strong>the</strong>se birds (Madison and Woodbridge pers. comm.). European owls in <strong>the</strong>genus Strix readily use nest boxes (Sou<strong>the</strong>rn 1970, Saurola 1989). If spottedowls behave in a similar fashion to o<strong>the</strong>r Strix owls, <strong>the</strong> availability of nest sitesprobably is not a critical management problem. However, a critical study ofnest-box acceptance by spotted owls has not been conducted.Several studies have been conducted on <strong>the</strong> structure of spotted owl nestinghabitat (LaHaye 1988, Buchanan 1991, Self and Nelson 1991 pers. comm.). In<strong>the</strong> two studies that compared nest sites with available habitat, one inunmanaged <strong>for</strong>est and <strong>the</strong> o<strong>the</strong>r in managed <strong>for</strong>est (LaHaye 1988 andBuchanan 1991, respectively), owls nested in <strong>for</strong>ests that differed from whatwas available to <strong>the</strong>m, suggesting selection by <strong>the</strong> owls. In general, owlspreferentially used <strong>for</strong>ests with greater complexity and structure. Nestinghabitat structure reported by Self and Nelson in managed <strong>for</strong>ests (1991 pers.comm.) was strikingly similar to <strong>the</strong> habitat structure used by <strong>for</strong>aging spottedowls in unmanaged stands within <strong>the</strong> same province (Solis 1983).Roosting habitat: Nor<strong>the</strong>rn spotted owl roosting habitat has been describedby Forsman (1976), Barrows and Barrows (1978), Forsman (1980), Solis(1983), Forsman et al. (1984), Chavez-Leon (1989), Sisco (1990), and Blakesleyet al. (In Press). Roost sites are typically areas of relatively dense vegetation(high canopy closure dominated by large-diameter trees). During <strong>the</strong> summer<strong>the</strong>se sites are usually cool, shady spots near streams or are on <strong>the</strong> lower thirdof slopes (possibly a simple correlation with stream position; Forsman 1976,Solis 1983, Blakesley et al. In Press). <strong>Spotted</strong> owls respond to variation intemperature and exposure by moving within <strong>the</strong> canopy to find favorablemicroclimate conditions (Forsman 1976, Barrows and Barrows 1978, Forsman1980, Barrows 1981, Solis 1983, Forsman et al. 1984). The multistoried standstructure of roost sites facilitates this movement. Because of this observedbehavioral response to variation in temperature, it has been hypo<strong>the</strong>sized thatold-growth <strong>for</strong>ests are necessary to spotted owls <strong>for</strong> <strong>the</strong>m to avoid heat stress(Barrows and Barrows 1978). However, Gutierrez (1985) pointed out that <strong>the</strong>reare o<strong>the</strong>r plausible hypo<strong>the</strong>ses to explain <strong>the</strong> associated owls with old-growth.Foraging habitat: Of <strong>the</strong> major spotted owl habitat categories, feedinghabitat appears to be <strong>the</strong> most variable (summarized in Thomas et al. 1990).This is predictable given <strong>the</strong> highly variable distribution and abundancepatterns of <strong>the</strong> owl's primary prey (Ward 1990). Within a given geographicprovince, <strong>for</strong>aging habitat may be more variable than ei<strong>the</strong>r nesting or roostinghabitat. Never<strong>the</strong>less, spotted owl <strong>for</strong>aging habitat is characterized by highcanopy closure and complex structure. Comparisons of habitat amongunmanaged stands used by <strong>for</strong>aging owls and managed stands occupied bynesting owls shows a surprising concordance of structural habitat features inCali<strong>for</strong>nia (Appendix B).Solis and Gutierrez (1990) presented evidence that male and female spottedowls may segregate <strong>the</strong>ir <strong>for</strong>aging habitat. The smaller males appeared to beusing stands that had higher tree density than were <strong>the</strong> larger females, which<strong>for</strong>aged in less dense habitats. Earhart and Johnson (1970) suggested thatdifferential habitat use by male and female owls may occur because <strong>the</strong> highwing loading of <strong>the</strong> females would make <strong>the</strong>m less maneuverable than males.However, this probably would be a consequence ra<strong>the</strong>r than a cause of reversedsexual dimorphism (Muller 1986, Solis and Gutierrez 1990).20
<strong>Spotted</strong> owl use of young, managed timberlands: The significance of <strong>the</strong>owl's relationship to old-growth <strong>for</strong>ests (sensu Old-growth Definition TaskGroup 1986) is obvious: old-growth <strong>for</strong>ests are declining rapidly throughout<strong>the</strong> owl's range as a result of logging (Thomas et al. 1990, USDI 1990). Ifnor<strong>the</strong>rn spotted owls are ecologically dependent (Ruggiero et al. 1988) on oldgrowthor mature <strong>for</strong>ests, <strong>the</strong>n continued logging of <strong>the</strong>ir habitat will lead to<strong>the</strong> probable extinction of <strong>the</strong> population (Thomas et al. 1990, USDI 1990).However, Forsman et al. (1977), Forsman (1988b), and Hays et al. (1989)reported spotted owls occupying young, managed stands at lower densitiesthan in old-growth stands. A managed stand is defined in a broad context,that is, managed stands in which cutting of trees has occurred. This clarificationis necessary because <strong>the</strong>re are no examples of <strong>for</strong>ests in which logging orsilviculture has occurred where <strong>the</strong> response of owls is documented experimentally.Fur<strong>the</strong>r, Forsman (1980), Solis (1983), Forsman et al. (1984),LaHaye (1988), Chavez-Leon (1989), Solis and Gutifrrez (1990), and Sisco(1990) describe habitat used by nor<strong>the</strong>rn spotted owls in both old-growth andmature stands. Their descriptions of mature <strong>for</strong>est structure used by spottedowls is similar to <strong>the</strong> structure of uneven-aged managed <strong>for</strong>ests in northwesternCali<strong>for</strong>nia (Appendix B). Thus, it is not surprising that spotted owls arebeing observed in younger managed timberlands throughout <strong>the</strong> distribution of<strong>the</strong> subspecies (Diller 1989, Irwin et al. 1989b, 1989c, Kerns 1989, Pious1989). There is hierarchy of in<strong>for</strong>mation needed to assess and understand<strong>the</strong>se observations of owls in managed <strong>for</strong>ests. In order of increasing importance,<strong>the</strong>se classes of in<strong>for</strong>mation are 1) presence of individuals, 2) presenceof pairs, 3) density, 4) variation in reproduction, 5) survival schedules, 6)dispersal patterns, 6) ratio of internal to external recruitment, and 7) populationstability. The structure and proportions of habitats used by owls relativeto available habitats are also necessary to evaluate <strong>the</strong> observations. Finally,future harvest patterns must be known and must accommodate owl needs inorder to predict <strong>the</strong> effects of <strong>the</strong> logging activities on <strong>the</strong> birds inhabiting <strong>the</strong>semanaged timberlands.On one side, this habitat variation argues that spotted owls are not habitatspecialists. On <strong>the</strong> o<strong>the</strong>r side, it suggests that spotted owls show adaptiveresponses to regional variation in environmental conditions. Regional variationin habitat selection by owls does not indicate that <strong>the</strong>y will respond positivelyto any human-induced habitat changes in one part of <strong>the</strong>ir range that lead tohabitat conditions similar to those used by owls in o<strong>the</strong>r parts of <strong>the</strong>ir range.An additional problem in assessing variation in habitat use is <strong>the</strong> lack of aconsistent definition of vegetation seral stage classification (see Table F 1 inThomas et al. 1990). Terms such as "old-growth, mature, young age,unmanaged, managed, second-growth" are defined in <strong>the</strong> literature usingdifferent parameters and criteria. This impedes ra<strong>the</strong>r than facilitates communicationamong interested persons.<strong>Owl</strong>s in managed <strong>for</strong>ests within <strong>the</strong> Cali<strong>for</strong>nia Klamath and Cali<strong>for</strong>nia Coastprovinces usually occupy stands with high structural diversity, high canopyclosure, and ei<strong>the</strong>r large-diameter trees or residual old trees (Appendix B).These stands are usually more than 60 years old after partial logging events of<strong>the</strong> past (Thomas et al. 1990). For example, stands in <strong>the</strong> redwood region of<strong>the</strong> Cali<strong>for</strong>nia Coast province described by Kerns (1989) have a structuresimilar to unmanaged (i.e., not previously logged) mature stands occupied byowls in a nearby national <strong>for</strong>est (Solis and Gutierrez 1990). Apparently, <strong>the</strong>fast growth of redwood trees, presence of understory hardwood trees, and <strong>the</strong>remnant old trees within <strong>the</strong> stands facilitate rapid structural development of<strong>the</strong>se coastal <strong>for</strong>ests. Critical aspects yet to be estimated in previously harvested<strong>for</strong>ests are <strong>the</strong> survival, recruitment, dispersal, and reproductive patternsof <strong>the</strong>se birds relative to conspecific populations in unlogged <strong>for</strong>ests.21
Home Range SizeHome range is defined generally as <strong>the</strong> area used by an animal and to which<strong>the</strong> animal exhibits fidelity. The size of home ranges of spotted owls is a focalpoint of controversy because of <strong>the</strong>ir large size (Table 2.1; Thomas et al. 1990).Forsman (1980) was <strong>the</strong> first to critically estimate spotted owl home range sizeby using radio telemetry, although Marshall (1957) guessed at <strong>the</strong> nightlyranges of Mexican spotted owls in Arizona and Mexico. Radio telemetry is <strong>the</strong>only method through which scientists reasonably can estimate <strong>the</strong> size ofspotted owl home ranges. There has been some concern expressed about <strong>the</strong>effect of radio transmitters on survival and reproduction (Paton et al. 1991).Foster et al. (1992) found no significant differences in survival or body massbetween radio-marked and unmarked spotted owls, although some owls diddie as a result of improper transmitter attachment. But <strong>the</strong>y did record asignificant negative effect on reproductive output of radio-marked owls.Because of Forsman's (1980) initial observations that spotted owl home rangeswere very large (more than 2,000 acres on <strong>the</strong> average) a great deal of scientificef<strong>for</strong>t has been devoted to verifying his original observations as well as estimating<strong>the</strong> geographic and inherent variation in spotted owl home ranges(Forsman 1981, Solis 1983, Forsman et al. 1984, Gutierrez et al. 1984, Siscoand Gutierrez 1984, Forsman and Meslow 1985, Allen et al. 1989, Hamer et al.1989, Hays et al. 1989, Carey et al. 1990, Paton et al. 1990, Sisco 1990,Thrailkill and Meslow 1990). In addition, Thomas et al. (1990) summarizedthis in<strong>for</strong>mation as well as o<strong>the</strong>r unpublished estimates of home range size (seeTable 2.1).Interpreting <strong>the</strong> variation in home range size and habitat use has been asignificant challenge to spotted owl ecologists. Variation (i.e., <strong>the</strong> distributionof observations of a trait) in observed home range size has <strong>for</strong>med <strong>the</strong> basisupon which scientific inference and generalization were based about spottedowl home range requirements. From <strong>the</strong> studies cited earlier, some generalizationscan be made about home range characteristics. First, all studies of homerange size are consistent with Forsman's (1980) original observations of largespotted owl home ranges (see Table 2.1). Second, <strong>the</strong>re is a large degree ofoverlap in home range areas between members of <strong>the</strong> same pair (Forsman etal. 1984, Solis and Gutierrez 1990) and lesser overlap among adjacent pairs(Forsman et al. 1984). Third, <strong>the</strong>re is considerable geographic variation inhome range size, with owls occupying Washington's Olympic Peninsula having<strong>the</strong> largest home ranges (Thomas et al. 1990). Fourth, home range size increasesas <strong>the</strong> amount of old <strong>for</strong>est within <strong>the</strong> home range decreases (i.e., lossof habitat from logging; Carey 1985, Forsman et al. 1984, Thrailkill andMeslow 1990). It is unknown if this geographic variation is related to latitude,habitat, individual, temporal, or prey-base variation.The size of an owl's home range probably is dependent on many factors (e.g.,food availability, interspecific competition, amount and arrangement of suitablehabitat). For example, spotted owl home range size may be a reflection of anadaptive response to low prey abundance and variation in abundance anddistribution of prey (Ward 1990). Fur<strong>the</strong>r, estimates of owl home range sizecan be influenced by <strong>the</strong> sampling design of <strong>the</strong> home range study and <strong>the</strong>home range estimator used in <strong>the</strong> analyses (Carey et al. 1989, Call 1989).Although <strong>the</strong>se factors may influence <strong>the</strong> estimation of owl home range size,predictions of home range sizes of birds of <strong>the</strong> size and trophic level of spottedowls based on allometric equations are similar to empirical estimates of spottedowl home ranges (Schoener 1969). Predictions of spotted owl home range size,based on allometric analysis of mammals, underestimate direct observations of22
Table 2.1. Median annual home range areas (in acres) of spotted owl pairs in differentstudy areas and physiographic provinces.aState No. RangeLocation of ForestSite Pairs Typeb Median Min Max SourcescCali<strong>for</strong>niaKlamath MountainsUkonom 9 MC 3,314 2,056 7,823 1Mad River 12 MC 2,975 1,803 4,685 1Willow Creek 2 MC 1,692 1,258 2,126 2OregonSouth CoastChetco 4 MH 5,614 5,327 6,197 1Klamath MountainsSouth Umpqua 3 MC 1,411 1,035 1,504 3Cow Creek 6 MC 4,106 2,499 7,494 3Coast RangesTyee 5 DF/HEM 3,387 1,880 8,272 3Peterson 4 DF/HEM 6,318 3,483 10,189 3Eugene BLM 4 DF/HEM 6,390 3,715 8,180 4O<strong>the</strong>rd 4 DF/HEM 4,183 2,849 9,748 5Kellogge 5 MC 4,072 1,618 6,281 3Western Cascades 11 DF/HEM 2,955 1,443 9,758 6,7WashingtonWestern Cascades 11 DF/HEM 6,657 2,969 17,942 8,9,10Olympic Peninsula 10 HEM/DF 14,271 4,497 27,309 9,11(Note -Table follows Thomas et al (1990) with changes based on Forsman and Hays (pers comm.))aPair ranges were calculated by delineating 100 percent MCPs (minimum convex polygons) total = exclusive area of male + exclusive area of female+ <strong>the</strong> area of overlap shared by <strong>the</strong> two sexes.bMC = mixed conifer, MH = mixed conifer/evergreen, DF/HEM = Douglas-fir, western hemlock, HEM/DF = mostly western hemlock with Douglas-firintermixed.C 1 = Paton et al. (1990), 2 = Solis (1983), 3 = Carey (pers comm.), 4 = Thrailkill and Meslow (pers. comm.), 5 = Carey et al (1989), 6 = Forsman andMeslow (1985), 7 = Miller (pers comm ), 8 = Allen et al (1989), 9 = Hays et al (1989), 10 = Hamer (pers. comm.), 11 = Forsman (pers. comm)dIncludes four sites in <strong>the</strong> sou<strong>the</strong>rn Coast Ranges near RoseburgeThis was a relatively dry area bordering <strong>the</strong> Umpqua River Valley, characterized by mixed conifer <strong>for</strong>est more typical of <strong>the</strong> Oregon Klamath provincethan <strong>the</strong> Coast Rangesowl home ranges (Harestad and Bunnell 1979, Lindstedt et al. 1986). Thus,because spotted owls do not fit <strong>the</strong>oretical predictions of <strong>the</strong>ir home range sizebased on mammalian allometric analysis, it should not be expected that <strong>the</strong>ycan survive and reproduce in a much restricted home range based on extrapolationfrom studies of mammals (SOW 1991).One important feature of an owl's home range is <strong>the</strong> amount of suitable habitatwithin <strong>the</strong> boundaries of <strong>the</strong> home range. Thomas et al. (1990) summarized<strong>the</strong> amounts of old-growth and mature <strong>for</strong>est within spotted owl pair homeranges (see Table 2.2). The median amount of <strong>the</strong>se late seral stage <strong>for</strong>ests <strong>for</strong>a number of studies within <strong>the</strong> nor<strong>the</strong>rn spotted owl's range was 615 to 4,579acres. In only three studies were median amounts of <strong>the</strong>se <strong>for</strong>est less than1,000 acres. In one of <strong>the</strong>se studies (Solis 1983), <strong>the</strong> sample was small (two23
Table 2.2. Median amounts of old-growth and mature <strong>for</strong>est (in acres) in annual pairhome ranges of spotted owls, by state and physiographic province.State Number RangeLocation of ForestSite Pairs Typeb Median Min Max SourcescCali<strong>for</strong>niaKlamath MountainsUkonom 9 MC 2,484 1,030 5,654 1,2Mad River 12 MC 1,365 835 1,953 1,2Six Rivers National Forest 2 MC 800 367 1,233 3OregonKlamath MountainsSouth Umpqua 3 MC 615 563 768 4Cow Creek 6 MC 1,549 1,450 1,983 4Coast RangesTyee 5 DF/HEM 2,031 1,645 3,984 4Peterson 4 DF/HEM 2,609 1,284 3,196 4Eugene BLM 4 DF/HEM 1,783 799 3,580 5O<strong>the</strong>rc 4 DF/HEM 2,375 1,795 2,625 6Kelloggd 5 MC 1,018 697 1,983 4West Slope Cascades 9 DF/HEM 1,796 1,050 3,786 7,8WashingtonWest Slope Cascades 11 DF/HEM 3,281 1,715 8,998 9,10,11Olympic Peninsula 7 HEM/DF 4,579 2,787 8,448 12(Note -Table follows Thomas et. al. (1990) with changes based on Forsman and Hays (pers. comm))aMC = mixed conifer, DF/HEM = Douglas-fir, western hemlock, HEM/DF = mostly western hemlock with Douglas-fir intermixed.bl = Paton et al (1990), 2 = Paton (pers comm ), 3 = Solis (1983), 4 = Carey (pers. comm ), 5 = Thraikill and Meslow (pers. comm ), 6 = Carey et al. (1990),7 = Forsman and Meslow (1985), 8 = Miller(pers. comm.), 9= Allen etal. (1990), 10= Haysetal. (1989), 11 = Hamer(pers. comm),12 = Forsman (pers. comm.).cIncludes four sites in <strong>the</strong> sou<strong>the</strong>rn Coast Range near Roseburg.dThis was a relatively dry area bordering <strong>the</strong> Umpqua River valley, characterized by mixed conifer <strong>for</strong>est more typical of <strong>the</strong> Oregon Klamath provincethan <strong>the</strong> Coast Ranges.24pairs) and <strong>the</strong> pairs were sampled only <strong>for</strong> a short time. Thus, both <strong>the</strong> homeranges and <strong>the</strong> amount of late seral stage habitat of <strong>the</strong> study birds were likelyto have been underestimated. In any event, <strong>the</strong> object of Solis' (1983) studywas to quantify owl habitat structure and not to provide an accurate estimateof home range size. In <strong>the</strong> second study (Carey in Thomas et al. 1990:197), <strong>the</strong>sample of pairs was small and <strong>the</strong> study was located in an area of clumpedhabitat distribution. In a third study, Kerns (1989) reported on <strong>the</strong> habitat useof eight spotted owls occupying "managed" redwood <strong>for</strong>est with less than 1percent old-growth, although he did not estimate home range sizes of hismarked owls. However, stands used by owls in Kern's (1989) study oftencontained residual old-growth trees and also had a structure similar to mature<strong>for</strong>ests.Some animals do not exhibit fidelity to an area, and are considered to benomadic. Juvenile animals often wander widely in search of a secure homerange. Such wandering animals are engaging in dispersal. Some birds maymove within or among <strong>the</strong> territories of o<strong>the</strong>r birds, without exhibiting fidelity
Food Habitsto any particular area. These birds often are referred to as "floaters." Theecology of floaters is critical to understanding <strong>the</strong> dynamics of spotted owlpopulations, but we know <strong>the</strong> least about <strong>the</strong>m (Franklin In Press).Diet: Although spotted owls take prey from a broad array of taxa (e.g., mammals,birds, insects), <strong>the</strong>y primarily eat small mammals (Marshall 1942,Barrows 1980, 1985, 1987, Solis 1983, Forsman et al. 1984, Laymon 1988,Richards 1989, Thrailkill and Bias 1989, Ward 1990). Three mammal species,woodrats (Neotomafuscipes and N. ctnerec) and flying squirrels (Glaucomyssabrinus), compose <strong>the</strong> majority of <strong>the</strong> prey biomass eaten by <strong>the</strong>se owls (Solis1983, Forsman et al. 1984). One of <strong>the</strong>se species usually dominates <strong>the</strong> diet inan area, and this regional variation in diet is related to habitat and <strong>the</strong> distributionallimits of <strong>the</strong> prey species (Forsman et al. 1984, Thomas et al. 1990).Barrows (1985, 1987), Laymon (1988), and Thrailkill and Bias (1989) reportedthat <strong>the</strong> diet of breeding owls was dominated by larger prey (i.e., woodrats)whereas nonbreeding owl diets were characterized by smaller prey species.This suggested a strong ecological or evolutionary relationship between spottedowls and <strong>the</strong>se larger small mammal species. Un<strong>for</strong>tunately, <strong>the</strong> small sampleof owls among <strong>the</strong>se studies precludes strong inference about <strong>the</strong>se relationships.Thomas et al. (1990) also pointed out that large prey may be transportedat a higher rate to nest sites than smaller prey. In addition, Ward(1990) and Forsman et al. (pers. comm.) were unable to document this relationship.<strong>Spotted</strong> owl prey: Strong functional responses between prey and a variety ofowl species have been demonstrated in both North America and Europe(Sou<strong>the</strong>rn 1970, Rusch et al. 1972, Adamcik and Keith 1978, Sonerud et al.1988, Saurola 1989). It is surprising, <strong>the</strong>re<strong>for</strong>e, that until recently, littleresearch ef<strong>for</strong>t has been devoted to understanding spotted owl prey andecological responses of spotted owls to <strong>the</strong>ir prey. Most prey studies have beenconcerned with patterns of abundance and distribution of small mammalswithin <strong>the</strong> range of <strong>the</strong> owl (summarized by Thomas et al. 1990). One study,(Ward 1990), has related variation in prey abundance and distribution to owlreproductive success and hunting behavior, although several studies linkingprey and spotted owls have been undertaken (Thomas et al. 1990). In Ward's(1990) study, woodrats were <strong>the</strong> primary prey. <strong>Spotted</strong> owls <strong>for</strong>aged in areaswhere <strong>the</strong> abundance of woodrats was less variable. This suggests that <strong>the</strong>owls may have been optimizing <strong>the</strong>ir search ef<strong>for</strong>t. That is, <strong>the</strong>y were <strong>for</strong>agingin stands that did not necessarily contain <strong>the</strong> most abundant woodrats, but<strong>the</strong>y hunted in areas where <strong>the</strong> occurrence of <strong>the</strong> animals was more predictable.Ward (1990) also showed that not only was prey abundance low but alsothat prey populations were variable across <strong>the</strong> landscape. These limited observationshelp explain <strong>the</strong> large home range sizes observed among spotted owls.Availability of spotted owl prey has been advanced as an explanation <strong>for</strong> <strong>the</strong>occurrence of spotted owls in old-growth/mature <strong>for</strong>ests (Forsman 1980,Forsman et al. 1984; also see Carey 1985, Gutierrez 1985). Nor<strong>the</strong>rn flyingsquirrels clearly depend on <strong>for</strong>est communities, but woodrats do not.Woodrats are more abundant in early seral stage vegetation (e.g., brushy areas)than <strong>the</strong>y are in old-growth <strong>for</strong>ests (Thomas et al. 1990). Yet spotted owlsspend little time hunting in clear-cuts (Forsman et al. 1984, Solis 1983). Thisunpredicted <strong>for</strong>aging behavior may be related to <strong>the</strong> relative availability ofwoodrats to predation in <strong>the</strong> two habitats. That is, in <strong>the</strong> dense vegetation ofearly shrub dominated seral stages, spotted owls may not be able to capturewoodrats effectively. In <strong>the</strong> more open older <strong>for</strong>ests, spotted owls may be moreeffective predators even though <strong>the</strong> woodrats are less abundant. Thus, we25
3. Life Historycannot reject <strong>the</strong> hypo<strong>the</strong>sis that prey availability explains spotted owl selection<strong>for</strong> older age <strong>for</strong>ests. In addition, if <strong>the</strong>y feed in open areas, spotted owlsmay be killed by great homed owls (Forsman et al. 1984).Reproductive BiologyNesting phenology: <strong>Spotted</strong> owls begin <strong>the</strong>ir annual breeding cycle in latewinter (February or March) when <strong>the</strong> pair begins to roost toge<strong>the</strong>r. Copulationoccurs during this nuptial phase (Forsman et al. 1984). Some owl pairs use<strong>the</strong> same nest site repeatedly, some use new ones each year, and o<strong>the</strong>rsalternate nest sites from year to year. Once a clutch of eggs is laid, <strong>the</strong> femaleincubates <strong>the</strong> eggs <strong>for</strong> approximately 30 days (Forsman et al. 1984). After <strong>the</strong>eggs hatch, <strong>the</strong> owlets remain in <strong>the</strong> nest and usually are fed by <strong>the</strong> pair until<strong>the</strong>y leave <strong>the</strong> nest. Juvenile owls leave <strong>the</strong> nest 3 to 5 weeks after hatching.Many abandon <strong>the</strong> nest site well be<strong>for</strong>e <strong>the</strong>y are able to fly. They jump into <strong>the</strong>branches of surrounding trees or fall to <strong>the</strong> ground only to clamber up aleaning tree to a safe perch. The adaptive significance of this behavior isunknown, but Forsman et al. (1984) suggest that it serves to avoid increasingparasite loads in <strong>the</strong> nest as <strong>the</strong> season progresses. Once out of <strong>the</strong> nest <strong>the</strong>young owls are fed by <strong>the</strong> male and <strong>the</strong> female. They grow rapidly under goodfood conditions, reaching <strong>the</strong>ir parents' body mass prior to dispersal (Gutierrezet al. pers. obser.). Although juvenile owls are dependent on <strong>the</strong>ir parents,<strong>the</strong>y begin to hunt by late summer. Dispersal begins in <strong>the</strong> early fall, signalling<strong>the</strong> end of <strong>the</strong> annual reproductive cycle (Gutierrez et al. 1985, Miller andMeslow 1985, Miller 1989). There<strong>for</strong>e, spotted owls are considered to be "birthpulse" breeders (i.e., <strong>the</strong>y have distinct annual breeding periods)(Caughley1977). This knowledge is important when choosing an appropriate model withwhich to derive population projections.Variation in clutch size and nesting success: <strong>Spotted</strong> owls have one of <strong>the</strong>lowest clutch sizes among North American owls (Johnsgard 1988). Normally,spotted owls lay one or two eggs (Forsman et al. 1984). A small proportion of<strong>the</strong> population will lay three-egg clutches. Records of four-egg clutches arerare (Bendire 1892, Dunn 1901). Because clutch size is small <strong>the</strong>re is relativelylittle variation in <strong>the</strong> number of eggs laid by a female. However, <strong>the</strong>re islarge variation in nesting success and in <strong>the</strong> proportion of <strong>the</strong> population thatbreeds over time and among regions (Forsman et al. 1984, Gutierrez et al.1984, Thomas et al. 1990, Lutz 1992, LaHaye et al. In Press). Nesting successwithin a population can range from 0 to 100 percent (Forsman pers. comm.,Gutierrez et al. 1984, Gutierrez 1991 pers. comm.). Interestingly, Franklin etal. (1 990a) reported little variation in nesting during a 6-year study in northwesternCali<strong>for</strong>nia.Fecundity: Technically speaking, fecundity is <strong>the</strong> number of female youngproduced per female (Caughley 1977). However, <strong>the</strong> term has been used in avariety of ways in wildlife literature. Fecundity usually is defined relative tofemales because it is <strong>the</strong> female segment of <strong>the</strong> population that is ma<strong>the</strong>maticallymodeled to project population trends. Because reproductive activityvaries greatly, fecundity also varies. Since biologists assume <strong>the</strong>re is a 50:50sex ratio (Noon and Biles 1990, Thomas et al. 1990, USDI 1990) in a spottedowl population, fecundity in owl populations is almost always between 0.1 and1.5 (Thomas et al. 1990, Forsman 1988a, Franklin et al. 1990a, Lutz 1992,LaHaye et al. In Press).Age atfirst reproduction: <strong>Spotted</strong> owls can breed as early as 1 year old(Barrows 1985, Miller et al. 1985). Yet most birds probably do not breed be<strong>for</strong>e26
SurvivorshipDeensity<strong>the</strong>y are 3 years old (Franklin et al. 1990a, Thomas et al. 1990). In addition,subadult owls have lower fecundity than do adults (Franklin et al. 1990a).Age-specific fecundity also is an important demographic parameter, but <strong>the</strong>reare no age-specific estimates of fecundity <strong>for</strong> <strong>the</strong> adult age classes. There<strong>for</strong>e,<strong>for</strong> purposes of demographic modeling, adult fecundity is assumed to be equalacross age classes.Adult rates: Adult nor<strong>the</strong>rn spotted owls' annual survival rates are very high.Thus, <strong>the</strong>y must be long-lived birds. Based on banding and radio telemetry,<strong>the</strong> chance of an owl living from one year to <strong>the</strong> next is 81 to 96 percent(Barrowclough and Coats 1985, Lande 1985, Franklin et al. 1990a, Thomas etal. 1990). In short-term studies, survival rates may vary as a response bybirds to varying environmental conditions (Gutierrez and Pritchard 1990,LaHaye et al. In Press). Thus, in long-lived species, studies must be of longduration to achieve reliable estimates of age-specific survival rates. The mostrecent estimates of survival are in Appendix C.Subadult survival: Subadult owls have a lower survival rate than adult owls(Franklin et al. 1990a, Thomas et al. 1990)(Appendix C). Since subadults alsohave lower reproductive rates and fecundity, it may be possible that <strong>the</strong> sameenvironmental or behavioral factors influence all aspects of <strong>the</strong> demography of<strong>the</strong> subadults in <strong>the</strong> same way. Never<strong>the</strong>less, <strong>the</strong> subadult segment of <strong>the</strong>population is relatively small and makes only a modest contribution to <strong>the</strong>dynamics of <strong>the</strong> population (Noon and Biles 1990, Thomas et al. 1990).Juvenile survival: Juvenile survival rates have been measured from bandedbirds and radio-marked birds (Barrowclough and Coats 1985, Gutierrez et al.In Prep.). Survival rates <strong>for</strong> this age class are low (<strong>the</strong> chance of a juvenileliving from one year to <strong>the</strong> next is 15 to 29 percent) relative to adult survivalrates (Thomas et al. 1990). It is well known that first-year birds, in general,have low survival. The rigors of dispersal and <strong>the</strong> consequences of inexperience(e.g., poor hunting skills, lack of familiarity with a territory) lead to highermortality rates.Mortality: <strong>Spotted</strong> owls die from a variety of causes. The most frequent causeof mortality recorded among radio-marked birds is predation by o<strong>the</strong>r animals(Johnson pers. comm.). They also die from accidents (e.g., flying into objects,automobiles, and drowning) (Gutierrez et al. 1985, Franklin, LaHaye, Gutierrezpers. comm., Johnson pers. comm.). Accidents are considered to be densityindependent,whereas predation usually is density-dependent in most prey,although predation may be density-independent in spotted owls. Ano<strong>the</strong>rsource of mortality is starvation. Starvation is common among spotted owls(Gutierrez et al. 1985, Miller 1989, Johnson pers. comm.), but occurs lessfrequently among adult spotted owls (Sisco 1990). Starvation could be aconsequence of low prey abundance, low prey availability (i.e., poor huntinghabitat), or inexperience (inability to hunt successfully).The number of nor<strong>the</strong>rn spotted owls is a topic of much debate (Thomas et al.1990). With increasing survey and monitoring of populations, <strong>the</strong> number ofknown owls has increased greatly since <strong>the</strong> first estimates of total abundancewere made. These observations of higher owl abundance reflect greater knowledgeand ef<strong>for</strong>t expended by biologists to count owls; <strong>the</strong>se observations shouldnot be interpreted as evidence that <strong>the</strong> owl population is increasing. The totalabundance of owls appears to be declining gradually over time (Forsman et al.27
Dispersal1984, Thomas et al. 1990, USDI 1990). One important step toward estimating<strong>the</strong> number of owls is to estimate <strong>the</strong>ir density. The density of an animalpopulation is <strong>the</strong> number of individuals per unit area. Once an estimate ofdensity is derived, <strong>the</strong> estimate can be used to compute an estimate of abundance<strong>for</strong> all of <strong>the</strong> area containing similar habitats or environmental conditions.Census and monitoring of nor<strong>the</strong>rn spotted owls have been a high priority withland management agencies and research scientists (O'Halloran 1989, Simon-Jackson 1989, Azuma et al. 1990, Max et al. 1990, Franklin et al. 1990b,Thomas et al. 1990, Ward et al. 1991). Franklin et al. (1990b) estimated <strong>the</strong>density of spotted owls in northwestern Cali<strong>for</strong>nia to be 0.65 owls per squaremile. They also estimated <strong>the</strong> density of owls within suitable habitat; thisvalue was 1.51 to 1.83 owls per square mile, depending on <strong>the</strong> method used toestimate <strong>the</strong> density. Using <strong>the</strong>ir estimates of density, <strong>the</strong>y projected declinesin spotted owl populations between 60.0 percent and 82.5 percent in <strong>the</strong>ir areaif proposed management scenarios (USDA 1988) were implemented.Densities of spotted owls vary across <strong>the</strong>ir range as a function of habitatquality, geographic province, and current environmental conditions (Forsmanet al. 1977, Franklin et al. 1990b, Gutierrez and Pritchard 1990, Lutz 1992,Ward et al. 1991, LaHaye et al. In Press). Although much emphasis is placedon density, high densities can be mistaken as evidence of high quality habitat(Van Home 1983). Density estimates are useful <strong>for</strong> relative comparisons and<strong>for</strong> evaluating management objectives, but <strong>the</strong>y must be used in conjunctionwith knowledge of corresponding survival and fecundity values <strong>for</strong> <strong>the</strong> populations(see Habitat about spotted owl use of young, managed timberlands).Dispersal among vertebrates is <strong>the</strong> process of an animal leaving one area toestablish a new home range in ano<strong>the</strong>r area. Dispersal can be undertaken byjuvenile or adult spotted owls. Fur<strong>the</strong>r, dispersal is often characterized aseffective (i.e., successful breeding occurs at <strong>the</strong> end of <strong>the</strong> dispersal event) orgross (i.e., breeding may or may not be successful following dispersal) (Greenwood1980). Scientists know a great deal more about <strong>the</strong> process and patternof juvenile spotted owl dispersal than of adult dispersal, despite <strong>the</strong> difficulty ofclosely following large numbers of dispersing juvenile owls (Gutierrez et al.1985, Miller and Meslow 1985, Miller 1989, Gutierrez et al. In Prep.).Gutierrez et al. (1985), Miller (1989), and Gutierrez et al. (In Prep.) used radiotelemetry to estimate patterns of gross juvenile dispersal. Juvenile spottedowls dispersed from <strong>the</strong>ir natal areas in September and October after <strong>the</strong>y hadreached adult body mass (Gutierrez et al. 1985, Miller 1989). They apparentlyleft <strong>the</strong>ir natal areas in random directions (Gutierrez et al. 1985, Gutierrez etal. In Prep.), and traveled moderate distances (approximately 9 to 30 miles onaverage) during <strong>the</strong>ir first autumn (Gutierrez et al. 1985, Miller 1989, Gutierrezet al. In Prep.). The pattern of dispersal varied among cohorts in a variety ofways including differences in direction, distance, and survival (Gutierrez et al.In Prep.). Effective dispersal distance, estimated from returning banded birdsaveraged about 4 miles <strong>for</strong> juvenile male spotted owls and about 12 miles <strong>for</strong>female juveniles (Gutierrez et al. In Prep.). Dispersal distances from bandedbirds were slightly higher <strong>for</strong> Oregon owls (Johnson pers. comm.). Estimates ofdispersal distance based on studies with finite area size have been shown to beunderestimates of true dispersal distance (Barrowelough 1980).Adult spotted owls will leave mates or move from territories, but <strong>the</strong> causes of<strong>the</strong>se adult dispersal events are unknown. <strong>Spotted</strong> owls normally <strong>for</strong>m long,28
stable pair bonds because <strong>the</strong> number of recorded adult dispersals is low.Also, <strong>the</strong> conditions surrounding <strong>the</strong>se observations of adult dispersal eventshave not been summarized.Demographic ProjectionsBecause spotted owls are long-lived animals, <strong>the</strong> status of <strong>the</strong>ir populations isdifficult to estimate. Thus, ma<strong>the</strong>matical models are used to project populationtrends using estimates of <strong>the</strong> vital rates described earlier. Models can bedeterministic (linear projections based on <strong>the</strong> estimates of <strong>the</strong> vital rates) orstochastic (projections based on random variation of specific rates or conditions).Stochastic models generally are considered to be more sophisticatedbecause <strong>the</strong>y are more complex, and <strong>the</strong>y simulate variation that would beexpected in natural environments. Models of both kinds have been used toevaluate spotted owl population dynamics and dispersal (Boyce 1987, Marcotand Holthausen 1987, USDA 1988, Doak 1989, Lande 1988, Noon and Biles1990, Thomas et al. 1990, USDI 1990, Lutz 1992, Franklin In Press,Lamberson et al. In Press, LaHaye et al. In Press). In addition, Shaffer (1985)suggested that metapopulation models, in which species have populationsdiscontinuous in time and/or space, be used to evaluate spotted owl populationdynamics. Almost all modeling projections indicate that spotted owlpopulations are declining. However, Boyce (1987) criticized <strong>the</strong> first attempt touse a stochastic model <strong>for</strong> projecting population trends (USDA 1988) because<strong>the</strong> model did not incorporate density dependence. Density dependence is <strong>the</strong>functional response in survival probability and/or fecundity of a population tovariation in density. That is, as a population declines, <strong>the</strong> density declines.Presumably, <strong>the</strong> remaining individuals in <strong>the</strong> population have more resourcesavailable to <strong>the</strong>m per capita (i.e., <strong>the</strong>re is less competition) and <strong>the</strong>se resources<strong>the</strong>n can be used by <strong>the</strong> survivors <strong>for</strong> reproduction and o<strong>the</strong>r life functions.Boyce (1987) argued that if a population declines numerically <strong>the</strong>re should bea density-dependent response in <strong>the</strong> owl population, which would mitigate <strong>the</strong>lower density and serve to stabilize <strong>the</strong> population. In <strong>the</strong> case of <strong>the</strong> spottedowl, density has not been declining, only <strong>the</strong> abundance of owls, becausehabitat loss is <strong>the</strong> causative mechanism <strong>for</strong> <strong>the</strong> decline. Thus, when Thomaset al. (1990) incorporated density dependence into <strong>the</strong>ir metapopulation model,<strong>the</strong> projected population decline was more rapid. Most estimates of changes innor<strong>the</strong>rn spotted owl populations indicate that populations are decliningthroughout <strong>the</strong>ir range (Appendix C).Models also can be spatially explicit. They can incorporate <strong>the</strong> influence oflandscape character on <strong>the</strong> underlying population dynamics (Lamberson et al.In Press, Lamberson and Brooks 1991). These models are useful <strong>for</strong> developinga more complete range of alternative hypo<strong>the</strong>ses to account <strong>for</strong> observedphenomena. For example, <strong>the</strong> recent observations of abundant owls in <strong>the</strong>Cali<strong>for</strong>nia Coast province could be a reflection of good habitat <strong>for</strong> owls, whichresults in high productivity and high survival among <strong>the</strong> owls. Or alternatively,<strong>the</strong> dynamics of <strong>the</strong>se redwood zone, coastal owl populations could be<strong>the</strong> result of immigration of owls from adjacent old-growth/mature <strong>for</strong>ests innational <strong>for</strong>ests in <strong>the</strong> Klamath province (Lamberson and Brooks 1991). Themodel illustrates <strong>the</strong> importance <strong>for</strong> recovery of <strong>the</strong> spotted owl throughout allof <strong>the</strong> provinces within its range (i.e., recovery of <strong>the</strong> owl in <strong>the</strong> Cali<strong>for</strong>niaKlamath province probably could not be achieved if <strong>the</strong>re were not a concomitantrecovery in <strong>the</strong> Cali<strong>for</strong>nia Coast province).29
4. ConclusionOur knowledge of <strong>the</strong> natural and life history of <strong>the</strong> nor<strong>the</strong>rn spotted owl hasgrown tremendously in <strong>the</strong> past 10 years. Unlike data available on manythreatened and endangered species, we have preliminary in<strong>for</strong>mation on <strong>the</strong>demography of <strong>the</strong> owls so that initial projections of populations can be made.However, because <strong>the</strong> bird is long-lived, estimates of vital rates and, <strong>the</strong>re<strong>for</strong>e,estimates of lambda (a population's finite rate of growth) may change as <strong>the</strong>populations are followed through time. These changes will occur because ofnormal population responses to good and poor environmental conditions aswell as to habitat changes. It is evident that much more needs to be learnedabout <strong>the</strong> species (and o<strong>the</strong>r late seral stage species) to allow us to refinemanagement plans compatible with <strong>the</strong> ecology of <strong>the</strong> species. Never<strong>the</strong>less,more is known about this species than about most endangered or threatenedspecies.30
IL.B. Status and Threats1. Habitat StatusThe present range of <strong>the</strong> nor<strong>the</strong>rn spotted owl approximates <strong>the</strong> limits of itshistoric range. The range extends from southwestern British Columbia souththrough <strong>the</strong> coastal mountains and <strong>the</strong> Cascade Range of Washington andOregon, and into northwestern Cali<strong>for</strong>nia as far south as San Francisco.Although <strong>the</strong> total area of <strong>the</strong> subspecies' range has not decreased, its distributionhas changed greatly. The Puget Trough in Washington and lands adjacentto <strong>the</strong> Willamette Valley in Oregon no longer support populations of owlsbecause of loss of habitat to urban, rural residential, and agricultural development.In southwestern Washington and northwestern Oregon, timber cuttingand wildfires have greatly reduced habitat, and spotted owl populations arevery low at present. In British Columbia, only some 20 pairs are known toexist; much of <strong>the</strong> owl's range in Canada has been logged, and little matureand old-growth <strong>for</strong>est remains.Abundance, distribution, and habitat use of <strong>the</strong> spotted owl vary across <strong>the</strong><strong>for</strong>est zones that occur within its range. Physiographic provinces as describedby Franklin and Dyrness (1973) incorporate <strong>the</strong> physical and environmentalfactors that shape <strong>the</strong> landscape of <strong>the</strong> Pacific Northwest. These physiographicprovinces were modified by Thomas et al. (1990) and, with slight fur<strong>the</strong>rmodification, were adopted by <strong>the</strong> <strong>Recovery</strong> Team to describe <strong>the</strong> range of <strong>the</strong>spotted owl (Figure 2.2).The extent of owl habitat that existed prior to logging is unknown, but by <strong>the</strong>early 1980s more than 80 percent of prelogging old-growth had been removed(Booth 1991). Although not all old-growth <strong>for</strong>ests are suitable spotted owlhabitat (e.g. high elevation <strong>for</strong>ests), this great decrease suggests that <strong>the</strong> 7.6million acres of habitat that remain today represent only a small portion of <strong>the</strong>area <strong>for</strong>merly occupied by' spotted owl habitat (USDA 1991). Suitable habitaton national <strong>for</strong>ests currently is declining about 1 to 2 percent annually.Mulder et al. (1989) projected that almost all suitable spotted owl habitat onlands suited <strong>for</strong> timber production would be gone in about 60 years on national<strong>for</strong>ests and in about 30 years on BLM lands.Remaining suitable owl habitat is not distributed evenly over <strong>the</strong> range of <strong>the</strong>species. Habitat reduction has been greatest at low elevations and in <strong>the</strong> CoastRanges of Oregon and Washington, and this reduction is reflected in lowpopulations of spotted owls in those areas. Remaining habitat at higherelevations may be of lower quality than that which historically was present onlow-elevation lands (Thomas et al. 1990). Thus, <strong>the</strong> approximately 50 percentof remaining spotted owl habitat currently in reserved areas or in areasunsuited <strong>for</strong> timber production (Table 2.3) may not contribute proportionally toproductivity, because <strong>the</strong>se lands are commonly at higher elevations.Most remaining suitable habitat is found on federal lands. The Forest Scrvicemanages about 74 percent of this habitat, <strong>the</strong> BLM about 12 percent, and <strong>the</strong>National Park Service about 7 percent. In nor<strong>the</strong>rn Cali<strong>for</strong>nia, as much as 40percent of spotted owl habitat may be on private lands, especially along <strong>the</strong>Coast Range (Gould pers. comm.). In Oregon and Washington, however, morethan 95 percent of <strong>the</strong> estimated acreage of remaining owl habitat is found onfederally managed lands.3 1
Ca n a d aEastern Washington Cascades-- - - - |Olympic Peninsula -…--…Western Washington Lowlands --Western Washington Cascades… --t-WashingtonOregon Coast Range… - - - -The Willamette Valley… - - - - -(has virtually no nor<strong>the</strong>rn spotted owlhabitat; is not discussed as a province inthis recovery plan) OregonEastern Oregon Cascades -- - -- O--regWestern Oregon Cascades es-- -Oregon Klamath ----- --Cali<strong>for</strong>nia Cascades -…-…-…-…- - -Cali<strong>for</strong>nia Klamath…-…---Cali<strong>for</strong>nia Coast- …--rCali<strong>for</strong>niaFigure 2.2. Provinces within <strong>the</strong> range of <strong>the</strong> nor<strong>the</strong>rn spotted owl in <strong>the</strong> United States.32
2. Population StatusThere are no estimates of <strong>the</strong> historical population size of <strong>the</strong> nor<strong>the</strong>rn spottedowl, but owls are believed to have inhabited most old-growth <strong>for</strong>ests throughout<strong>the</strong> Pacific Northwest and northwestern Cali<strong>for</strong>nia, and <strong>the</strong>y still are foundwithin <strong>the</strong>ir historical range in most areas where suitable habitat remains(Thomas et al. 1990).Nor<strong>the</strong>rn Washington and sou<strong>the</strong>rn British Columbia represent <strong>the</strong> nor<strong>the</strong>rnextent of <strong>the</strong> range of <strong>the</strong> owl. Population densities and numbers are lowest in<strong>the</strong>se areas, with fewer than 20 pairs located in extensive surveys along <strong>the</strong>U.S. border with British Columbia (Dunbar 1990). A small, potentially isolatedpopulation of about 125 known pairs of spotted owls is located on <strong>the</strong> OlympicPeninsula in and around Olympic National Park (Fredrickson et al. 1989,Washington Department of Wildlife (WDW) 1991). Fewer than 50 owls havebeen located in recent extensive surveys in <strong>the</strong> Coast Ranges of southwesternWashington and northwestern Oregon north of Corvallis (Forsman 1986,Forsman et al. 1987, Irwin et al. 1989b, Oregon Department of Fish andWildlife (ODFW) 1991). Populations also decrease in size and density from <strong>the</strong>Mendocino National Forest south to Point Reyes, Cali<strong>for</strong>nia, and from <strong>the</strong>Klamath province east to <strong>the</strong> area of contact with <strong>the</strong> Cali<strong>for</strong>nia subspecies in<strong>the</strong> Sierra Nevada Range (Gould pers. comm.).Most of <strong>the</strong> present population of owls is found in <strong>the</strong> Cascades and Klamathprovinces in Oregon, and in <strong>the</strong> Klamath and Coast Range provinces in northwesternCali<strong>for</strong>nia (Advanced Sciences Inc. 1989, Beak Consultants 1989,Brown 1989, Diller 1989, Irwin et al. 1989c, Kerns 1989a and 1989b, Pious1989, ODFW 1991, WDW 1991). Distribution of remaining habitat is similar to<strong>the</strong> present distribution of spotted owls.More than 86 percent of currently known pairs of owls has been observed onfederally managed lands. The distribution of <strong>the</strong>se pairs varies widely by landownership, state, and physiographic province (Table 2.3). Although inventoriesare least complete in Cali<strong>for</strong>nia, about 30 percent of <strong>the</strong> habitat and populationof spotted owls may occur in <strong>the</strong> Coast Range (Gould pers. comm.).Only population data ga<strong>the</strong>red during a 5-year period were analyzed during <strong>the</strong>development of <strong>the</strong> recovery plan because <strong>the</strong>y may provide more reliableestimates of actual numbers than longer cumulative periods or single-yearcounts, given <strong>the</strong> rapidly changing quantity and quality of habitat. It is also<strong>the</strong> period with <strong>the</strong> most intense inventories, and is within <strong>the</strong> average lifespan of <strong>the</strong> species (about 8 years). Depending on availability of data, <strong>the</strong>period used was ei<strong>the</strong>r 1986 through 1990 or 1987 through 1991 (see Table2.3).Inventories from 1987 through 1991 indicate a total of about 3,500 knownpairs of nor<strong>the</strong>rn spotted owls in Washington, Oregon, and nor<strong>the</strong>rn Cali<strong>for</strong>nia(Table 2.3). This number is a minimum estimate of <strong>the</strong> true population size.The actual number of spotted owls remaining is unknown.3. Significant Threats to <strong>the</strong> Nor<strong>the</strong>rn <strong>Spotted</strong> <strong>Owl</strong>Table 2.4 provides a summary of significant threats to nor<strong>the</strong>rn spotted owlpopulations by physiographic province. Threats were characterized as follows:Severe: The problem poses a severe threat to <strong>the</strong> population at <strong>the</strong>current time or will pose such a threat within <strong>the</strong> next several generations.The likely consequence is failure to maintain a population distrib-33
Table 2.3. Estimated spotted owl habitat and number of pairs of spotted owls locatedduring a 5-year period on all lands in Washington, Oregon, and Cali<strong>for</strong>nia.Estimated Acres of <strong>Spotted</strong> <strong>Owl</strong> Nesting, Roosting,and Foraging Habitat by Timber Capability<strong>Owl</strong> PairsUnsuitable Suited Non-Landowner or Agencya Reservedb <strong>for</strong> Harvestc <strong>for</strong> Harvest Total Acres Reserved reservedd TotalsFS, Washington 500,024 804,000 747,000 2,051,024 56 417 473'FS, Oregon 389,974 1,058,000 1,447,000 2,894,974 89 1,242 1,331IFS, Cali<strong>for</strong>nia 304,268 519,000 305,000 1,128,268 64 550 614fBLM, Oregon 158,000 - 873,472 1,031,472 1 540 5416BLM, Cali<strong>for</strong>nia 13,000 - 6,000 19,000 0 11 11eNPS, Washington 480,000 - - 480,000 31 0 316NPS, Oregon 50,000 - - 50,000 4 0 4'NPS, Cali<strong>for</strong>nia 40,000 - - 40,000 2 0 2eIndian lands, Washington NA NA 257,000 257,000 0 51 51fIndian lands, Oregon NA NA 54,000 54,000 0 18 18fIndian lands, Cali<strong>for</strong>nia NA NA 32,000 32,000 0 28 28'FWS, Washington 1,700 NA 5,000 6,700 0 0 OfFWS, Oregon 4,100 NA NA 4,100 0 0 OfWDNR NA NA NA NA 0 33 33'WDW 0 NA 5,000 5,000 0 0 OfState parks, Washington 2,000 0 0 2,000 0 0 OfCities of Seattle, Tacoma, 0 0 1,500 1,500 0 0 OfWashingtonODF 0 NA 77,200 77,200 0 30 30'State parks, Oregon 8,000 0 0 8,000 2 0 2'Counties and cities, Oregon NA NA NA NA 1 0 1fCDF NA NA NA NA 0 4 4eState parks, Cali<strong>for</strong>nia 56,000 0 0 56,000 0 10 0oeBLM/TNC, Cali<strong>for</strong>nia 6,500 0 0 6,500 0 0 oeNAS, Cali<strong>for</strong>nia 600 0 0 600 0 0 oePrivate, Cali<strong>for</strong>nia NA NA NA NA NA 235 235ePrivate, Oregon NA NA NA NA 0 50 50'I Private, Washington NA NA NA NA 0 31 31fTotals 2,014,166 2,381,000 3,810,172 8,205,338 250 3,250 3,500NA = Reliable estimates not available.aln<strong>for</strong>mation obtained from landowners or state wildlife agencies.bWithdrawn from timber harvest (e g wilderness, national park, research natural area).cLands unsuited <strong>for</strong> timber production because of allocation to o<strong>the</strong>r uses by land management plans, ortechnically unsuited <strong>for</strong> timber production because of soils problems or difficulty of regeneration.I doWl pairs that are not on lands not withdrawn from timber harvest or that are on lands withdrawn on an interim basis.eFive-year survey period = 1986-1990.'Five-year survey period = 1987-1991.FS = U S. Forest ServiceBLM = U.S. Bureau of Land ManagementNPS = National Park ServiceDNR = Washington Department of Natural ResourcesWDW = Washington Department of WildlifeODF = Oregon Department of ForestryNAS = National Audubon SocietyTNC = The Nature ConservancyCDF = Cali<strong>for</strong>nia Department of Forestry and Fire ProtectionNote: Numbers used in this table contain updates that were not available <strong>for</strong> <strong>the</strong> mapped data used in <strong>the</strong> geographic in<strong>for</strong>mation system (GIS).Numbers cited elsewhere in <strong>the</strong> document were derived from <strong>the</strong> GIS and are not Identical to numbers In <strong>the</strong> table.34
uted across <strong>the</strong> range of ecological conditions in <strong>the</strong> province and <strong>the</strong>significant reduction of linkages and demographic support to adjacentprovinces.Moderate: The threat is not severe at <strong>the</strong> present time but would beexpected to become severe within <strong>the</strong> next 10 generations if correctivemeasures are not undertaken. In most cases, <strong>the</strong>se corrective measureswill have to include actions to reverse present conditions and trends.Low: The threat to <strong>the</strong> population is currently low and is expected toremain low as long as conservation measures are undertaken.Unknown: Inadequate in<strong>for</strong>mation currently exists to assess <strong>the</strong> threat.Not all threats are equally important, and no attempt was made to assign<strong>the</strong>m weights. Comparisons between provinces cannot be based simplyon <strong>the</strong> number of threats that fall in specific categories, e.g., <strong>the</strong> numberof threats rated severe or moderate.Low Populations. Small populations are vulnerable to extinction from anumber of causes. Random fluctuations in environmental conditions (environmentalstochasticity) and age and sex structure of populations (demographicstochasticity), along with potential loss of genetic variability (geneticstochasticity) are most likely to influence small populations.Declining Populations. Population trends <strong>for</strong> nor<strong>the</strong>rn spotted owls havebeen difficult to estimate because many of <strong>the</strong> adult and subadult birds areprobably nonterritorial and difficult to detect on surveys. These "floaters" maywait <strong>for</strong> several years <strong>for</strong> a territory to become available be<strong>for</strong>e <strong>the</strong>y pair andbegin reproducing. If a population is declining, <strong>the</strong> number of territorial birdsis likely to remain nearly constant as long as floaters remain, because territorialbirds that die are replaced rapidly from <strong>the</strong> pool of floaters. Thus, territorialbirds are <strong>the</strong> only segment of <strong>the</strong> population that can be monitored effectively,but trends in this segment of <strong>the</strong> population do not necessarily providean accurate estimate of trends in <strong>the</strong> overall population.One way to solve this problem is by analyzing birth and death rates. Theserates <strong>the</strong>n can be used to calculate whe<strong>the</strong>r <strong>the</strong> population is declining. Theanalyses, because <strong>the</strong>y depend on how birth and death rates vary with age, areoften complex. The underlying principle, however, is simply that <strong>the</strong> birth rateequals <strong>the</strong> death rate in a stable population. If <strong>the</strong> birth rate is less than <strong>the</strong>death rate, <strong>the</strong>n population size declines.The 1990 Status Review (USDI 1990) provided estimates of <strong>the</strong> rate of populationchange <strong>for</strong> two populations, one in nor<strong>the</strong>rn Cali<strong>for</strong>nia and one in sou<strong>the</strong>rnOregon. Both populations were shown to be declining. By <strong>the</strong> fall of 1991,data from 2 more years were available from <strong>the</strong>se areas, and data were alsoavailable from three o<strong>the</strong>r study areas (Figure 2.3).At <strong>the</strong> request of <strong>the</strong> <strong>Recovery</strong> Team, a group of 12 researchers was convenedat Colorado State University to analyze this new in<strong>for</strong>mation. The resultsindicated that all five populations declined from 1985 to 1991 (Table 2.5). Theestimated rates of decline varied from 7 to 16 percent and averaged about 10percent. The analyses also suggested that <strong>the</strong> rate of decline may be increasing.Details of <strong>the</strong> analysis are summarized in Appendix C. These new estimatesrein<strong>for</strong>ce <strong>the</strong> widely held belief that populations of spotted owls are decliningthroughout all or most of <strong>the</strong>ir range.Limited Habitat. Throughout much of <strong>the</strong> range of <strong>the</strong> nor<strong>the</strong>rn spotted owl,habitat is highly fragmented and is resulting in decreased owl productivity and35
Table 2.4. Significant threats to <strong>the</strong> owl, by physiographic province (S = Severe,M = Moderate, L = Low, U = Unknown).ThreatsLow Declining Limited DecliningPtovince Population Population Habitat Habitat DistributionEastern Washington M M M M MCascadesWestern Washingtona M M M S MCascades(South)Western Washington S U S S SCascades(North)Olympic S M M M MPeninsulaWestern S S S S SWashingtonLowlandsOregonCoast S S S S SWestern Oregon L M L M LCascadesEastern Oregon M U M M SCascadesKlamathb(Oregon) L S L M LKlamath b(Cali<strong>for</strong>nia) L M L M LCali<strong>for</strong>nia S S S M SCascadesCali<strong>for</strong>nia L M M M MCoastaWestern Washington Cascades province divided into north and south portions to reflect differences in severity of threats.bKlamath province includes portions of Oregon and Cali<strong>for</strong>nia, thus threats are shown by state.36
ThreatsConservatlonc NaturalProvince Isolation Predation Competition Measures DisturbanceEastern Washington M U U - SCascadesWestern Washingtona M U U - LCascades(South)Western Washington S U U - LCascades(North)Olympic S M U - SPeninsulaWestern S S U - MWashingtonLowlandsOregon Coast M S M - MWestern Oregon L M M - LCascadesEastern Oregon M U L - SCascadesKlamathb(Oregon) M M M - MKlamathb(Cali<strong>for</strong>nia) M L M - MCali<strong>for</strong>nia M L M - LCascadesCali<strong>for</strong>nia S L M - LCoastc1ecause of rapidly changing conservation measures, it is difficult to assess this threat, although it remains significant over much of <strong>the</strong>range of <strong>the</strong> nor<strong>the</strong>rn spotted owl. See text <strong>for</strong> fur<strong>the</strong>r discussion.
Table 2.5. Results of surveys <strong>for</strong> spotted owls, great horned owls, and barred owls in<strong>the</strong> range of <strong>the</strong> nor<strong>the</strong>rn spotted owl. (Number of individual owls is shown inparen<strong>the</strong>ses.)Location/Province Dates Method of Enumeration <strong>Spotted</strong> <strong>Owl</strong>s Great Horned <strong>Owl</strong>s Barred <strong>Owl</strong>s SourcesSouthwest British Columbia 1985-1988 Responses to spotted owl 14 - 57 Dunbar et al. 1990.calls from different sitesWestern Washington1982, 1983 Responses to spotted owlcalls10211 Hays et al. 1989.Ross Lake Drainage,North Cascades NationalPark, Washington1987 Responses to spotted owlcalls0l11 Bjorklund andDrummond 1987.Wilderness in Wenatcheeand Okanogan NationalForests and NorthCascades National Park,Washington1989 Responses to spotted owl calls,some o<strong>the</strong>r owl calls, and'volunteer responses8 512 Irwin et al. 1989a.Washington Cascades1986-1989 Birds on 122-square-mile study area(16) (25)(31) Hamer et al. 1989.Hoh-Clearwater, OlympicPeninsula, Washington1988, 1989 Responses to spotted owl callsand 'volunteer responses389 2745 Anthony andCummins 1989.Western WashingtonLowlands1987, 1988 Responses to spotted owl calls,some o<strong>the</strong>r owl calls, and'volunteer responses5827917 Irwin et al. 1989b.Washington Eastern Cascades(Yakima Reservation)1991 Responses to spotted owl calls I58(21)703 Hanson, unpubl.dataOregon Western Cascades1989, 1990 Responses to spotted owl and 294(161)great horned owl calls193 (95)27 (16) Johnson, andMeslow unpubl.dataCentral Oregon CoastRange1991 Responses to spotted owl calls,6 percent of 38,000 acres of state landin trees > 75 years027 (10)0 ODFW unpubl. dataOregon Coast Range1990, 1991 Responses to spotted owl and 447(18)great horned owl calls341 (118)0 (0) McGangal,unpubl. data I - - - ---- .....I/dispersal success, as well as increased mortality. Individual pairs are becomingisolated in significant portions of most provinces. Provinces with 20percent or less of potentially suitable habitat currently in suitable conditiongenerally are considered to be under severe threat, and those with less than 40percent in suitable condition generally are considered to be under moderatethreat (Bart and Forsman 1992).Declining Habitat. In <strong>the</strong> near future, continued loss of habitat at recentrates (1 to 2 percent per year) will likely accelerate current population declines.If habitat is already below critically low levels, <strong>the</strong> continued loss of potentialhabitat would fur<strong>the</strong>r reduce management options and leng<strong>the</strong>n <strong>the</strong> timerequired to achieve recovery.Distribution of Habitat or Populations. Within many provinces, populationsand habitat are poorly distributed, so that owls are no longer present across<strong>the</strong> full range of ecological conditions (e.g., elevation zones) and populations are38
NRegionaldemographicstudy areasDensitystudy areasFigure 2.3. Demographic study areas.I ....... I............ 1-1.39
isolated. In <strong>the</strong>se provinces, small clusters of owls are separated widely byhabitat unsuitable <strong>for</strong> dispersal, and populations are vulnerable to extinctionfrom random demographic, genetic, and environmental events (Shaffer 1987).As distance increases beyond 12 miles, <strong>the</strong> probability of interchange amongclusters decreases rapidly (Thomas et al. 1990). Within provinces wherespacing among patches of suitable habitat commonly exceeds this distance,persistence of clusters is threatened severely.Isolation of Provinces. Small, isolated populations are vulnerable to adversedemographic and genetic effects, as well as <strong>the</strong> effects of large-scale disturbance.Adverse effects of isolation not only threaten subpopulations, but mayexclude isolated populations from genetic interchange with a larger, interactivepopulation.Provinces can be isolated from some or all of <strong>the</strong> surrounding provinces byphysical barriers (e.g., <strong>the</strong> Columbia River) and/or by distance between areas ofsuitable habitat. Immigration of only a few individuals per generation may beadequate to prevent deleterious genetic effects from inbreeding. However, immigrationof a larger number of individuals may be needed <strong>for</strong> demographic rescue.Predation and Competition. From 1975 to 1991, some 344 adult or subadult,and 85 juvenile spotted owls have been radio-tagged within <strong>the</strong> range of<strong>the</strong> subspecies (Johnson pers. comm.). Among <strong>the</strong>se, 91 adults or subadultsand 60 juveniles are known to have died. Forty percent of <strong>the</strong> adults orsubadults, and 25 percent of <strong>the</strong> juveniles died from predation by o<strong>the</strong>r birds.Key avian predators of spotted owls are <strong>the</strong> great homed owl (Bubovirgfntanus), goshawk (Accipitergentalis), and red-tailed hawk (Buteojamaicens s). The common raven (Corvus corax also is considered a predator,more likely preying on juvenile than adult spotted owls.The great homed owl is <strong>the</strong> most commonly documented predator of spottedowls (Miller 1989). Great homed owls have become more abundant throughoutmuch of <strong>the</strong> range of <strong>the</strong> nor<strong>the</strong>rn spotted owl, although severity of thisthreat is difficult to measure. Relative densities of <strong>the</strong> two species in undisturbedlandscapes are unknown, however ratios of great homed owl density tonor<strong>the</strong>rn spotted owl density are highest in more fragmented portions of <strong>the</strong>nor<strong>the</strong>rn spotted owl's range (Table 2.5). Johnson and Meslow (unpubl. data)found that great horned owls occupied areas that contained significantly lessmature/old-growth <strong>for</strong>est and interior habitat; had greater edge-to-area ratios:had more shrub/<strong>for</strong>b, sapling, and shelterwood stands; and were more fragmentedthan those occupied by nor<strong>the</strong>rn spotted owls.Barred owls are expanding into areas occupied by nor<strong>the</strong>rn spotted owls. For<strong>the</strong> period of 1980 to 1991, barred owls were reported from 17 locations inCali<strong>for</strong>nia, 260 locations in Oregon, and several hundred locations in Washington.Most of <strong>the</strong>se observations occurred since 1985, and were made incidentalto spotted owl surveys. Relative density of barred owls is high in manyareas of <strong>the</strong> spotted owl's range (Table 2.5) and <strong>the</strong>y are displacing spottedowls in some areas (Taylor and Forsman 1976, USDA 1988). Hybridizationbetween <strong>the</strong> two species also has been documented.Lack of Coordinated Conservation Measures. At <strong>the</strong> time of listing, <strong>the</strong> lackof effective regulatory provisions and conservation measures was judged to beone of <strong>the</strong> most significant threats to <strong>the</strong> nor<strong>the</strong>rn spotted owl. Since thattime, various conservation measures have been applied to federal andnonfederal lands. The Endangered Species Act prohibits actions that willresult in taking owls, regardless of <strong>the</strong> land ownership on which <strong>the</strong> taking40
occurs. The act also prohibits federal agencies from authorizing, funding, orcarrying out action that would jeopardize a listed species, or destroy or adverselymodify its critical habitat.In addition to federal measures specifically protecting owls, <strong>the</strong> states arepursuing additional measures <strong>for</strong> owl conservation, and <strong>for</strong> wildlife habitatconservation in general (see section II.C.). These measures are developingrapidly and fur<strong>the</strong>r change is expected. Various legal proceedings also haveresulted in changes in management practices. Because of <strong>the</strong> differences inland ownership patterns, state regulatory mechanisms, and <strong>the</strong> pace ofchange, it is difficult to accurately quantify <strong>the</strong> impact of <strong>the</strong>se conservationmeasures and <strong>the</strong> relative risk to <strong>the</strong> owl.Despite <strong>the</strong>se developments, <strong>the</strong> lack of effective, coordinated, rangewideconservation measures is one of <strong>the</strong> most significant threats to <strong>the</strong> nor<strong>the</strong>rnspotted owl. The recovery plan will serve to integrate conservation measuresnow in place, and will provide biological principles to guide development andimplementation of additional measures.Vulnerability to Natural Disturbance. There is significant risk that fire,windthrow, insects, or diseases will reduce habitat, with effects on spotted owlpopulations. Although <strong>the</strong>se disturbance events may occur in any of <strong>the</strong>provinces, <strong>the</strong> eastern Cascades of Oregon and Washington, and <strong>the</strong> Cascadesand Klamath provinces of Cali<strong>for</strong>nia are especially vulnerable (Appendix F).Although fire currently may represent a threat to spotted owls, <strong>the</strong> habitat inwhich <strong>the</strong>y evolved owed its structure and species composition to fire (Agee1991a). Historically, owls occupied a dynamic landscape that often consistedof large areas of burned and unburned <strong>for</strong>est (Henderson 1990, Teensma et al.1991). Populations undoubtedly shifted with <strong>the</strong> changing pattern of thislandscape. Today habitat is greatly reduced and fragmented, and owl populationshave become increasingly vulnerable to loss of habitat due to fire.4. Threats by Province within WashingtonOlympic PeninsulaThe Olympic Peninsula is a relatively isolated province, bordered on threesides by bodies of water. A high mountain range encompasses <strong>the</strong> centralportion of <strong>the</strong> peninsula and high-elevation ridges radiate from <strong>the</strong> central areathroughout Olympic National Park and Olympic National Forest.Currently, spotted owls generally are located in mid-elevation <strong>for</strong>ests alongmajor river systems draining <strong>the</strong> mountains. A smaller number of owls resideon primarily nonfederal lands at lower elevations in <strong>the</strong> western portion of <strong>the</strong>peninsula. Major threats to spotted owls on <strong>the</strong> Olympic Peninsula include lowpopulation levels and poor population distribution, habitat loss, isolation, andnatural disturbances.Low Populations. Population estimates <strong>for</strong> <strong>the</strong> Olympic Peninsula rangebetween 175 and 225 current pairs, with 111 currently known pairs and 26territorial singles on <strong>the</strong> Olympic Peninsula (WDW 1991). Survey intensity hasvaried among ownerships, with <strong>the</strong> most intensive surveys historically conductedin Olympic National Forest and <strong>the</strong> Hoh-Clearwater land block of <strong>the</strong>Washington Department of Natural Resources.Private and o<strong>the</strong>r state lands received little survey ef<strong>for</strong>t until summer 1991.when more intensive survey ef<strong>for</strong>ts were undertaken. Currently, activity41
centers <strong>for</strong> 30 to 35 spotted owl territories are located on state or private landson <strong>the</strong> Olympic Peninsula, although additional owls with activity centers onfederal lands likely utilize state and private lands. Most of <strong>the</strong> spotted owl siteslocated on nonfederal lands occur in <strong>the</strong> western portion of <strong>the</strong> province, northof <strong>the</strong> Quinault Indian Reservation.Because of <strong>the</strong> roadless nature of Olympic National Park, spotted owl surveysare extremely difficult and only a portion of <strong>the</strong> park has been surveyed. Pastpopulation estimates <strong>for</strong> <strong>the</strong> park have been based largely on densities of owlsin demographic study areas in adjacent Forest Service lands and Landsatanalysis of amounts and distribution of suitable habitat within <strong>the</strong> park(Thomas et al. 1990). Estimates vary between 60 and 80 pairs in OlympicNational Park. Approximately 45 distinct territories have been located in <strong>the</strong>interior portion of <strong>the</strong> park, with an additional eight territories in <strong>the</strong> narrowcoastal portion.The current estimated population of 200 pairs on <strong>the</strong> peninsula has a lowlikelihood of persistence during <strong>the</strong> next 100 years unless measures are takento resolve <strong>the</strong> existing threats.Declining Populations. High rates of habitat loss on nonfederal and national<strong>for</strong>est lands undoubtedly are reflected in spotted owl population declines.Since World War II, old-growth <strong>for</strong>est in Olympic National Forest has declined76 percent (Morrison 1990). Large areas of habitat loss on <strong>the</strong> Olympic Peninsulainclude <strong>the</strong> Olympic National Forest Shelton Sustained Yield Unit, <strong>the</strong>Quinault Indian Nation, and <strong>the</strong> area of state and private ownership west ofForks and north to <strong>the</strong> Straits of Juan de Fuca. Nor<strong>the</strong>rn spotted owls onceinhabited <strong>the</strong>se lower elevation areas, likely in high densities. Reproductivesuccess has been highly variable in past years, and continued monitoring willbe required <strong>for</strong> adequate trend assessment. However, populations in <strong>the</strong>Olympic Peninsula demographic study area are declining nearly 12 percentannually (Appendix C.).Limited Habitat. Suitable habitat is highly fragmented at lower elevations on<strong>the</strong> Olympic Peninsula. Past habitat loss has likely resulted in low numbers ofspotted owls on Indian, state, and private lands. Many owl sites on national<strong>for</strong>est lands are located in highly fragmented areas, especially along <strong>the</strong> sou<strong>the</strong>mportions of <strong>the</strong> Quinault and Hood Canal Ranger Districts. Habitat withinOlympic National Park is found in relatively large, intact drainages broken byhigh, rocky, and snow-covered mountains. Individual owl pairs along <strong>the</strong>Olympic National Park coastal strip have become relatively isolated from <strong>the</strong>remaining spotted owls in <strong>the</strong> interior peninsula. Effects of habitat loss onspotted owl productivity, dispersal, and turnover on <strong>the</strong> peninsula are not wellknown.Declining Habitat. In <strong>the</strong> near future, <strong>the</strong> expected net rate of habitat lossunder current management will jeopardize significantly <strong>the</strong> potential <strong>for</strong>recovery on nonfederal lands. Habitat has been reduced to critical levels onnational <strong>for</strong>est lands and is declining. Habitat is unchanged and in goodcondition on suitable portions of national park lands.Distribution of Habitat and Population. Suitable habitat in <strong>the</strong> interiorpeninsula is shaped largely like a doughnut, with <strong>the</strong> center or 'hole" consistingof high-elevation, non<strong>for</strong>ested areas of unsuitable habitat. Remaininghabitat and owls on <strong>the</strong> Olympic Peninsula are located centrally around this"doughnut hole" within <strong>the</strong> higher-elevation areas of Olympic National Parkand Olympic National Forest. Large areas of recently logged, low-elevationlands are occupied by scattered, relatively isolated pairs of spotted owls inremaining patches of older <strong>for</strong>est. This central clustering restricts <strong>the</strong> distribu-42
tion of spotted owls to a portion of <strong>the</strong> province, generally at higher elevations.The long-term stability is unknown <strong>for</strong> <strong>the</strong>se populations that once inhabited awide range of ecological conditions, but are limited now to high-elevationhabitat.Predation and Competition. Levels of predation by great homed owls andcompetition with barred owls and nor<strong>the</strong>rn goshawks on <strong>the</strong> Olympic Peninsulaare not understood well. Barred owls are present on <strong>the</strong> peninsula, butno evidence of competition has been documented. Predation by great homedowls may have increased over historic levels with an associated decrease in <strong>the</strong>survival of nor<strong>the</strong>rn spotted owls.Province Isolation. The Olympic Peninsula province is isolated on three sidesby coastline; <strong>the</strong> Pacific Ocean to <strong>the</strong> west, <strong>the</strong> Straits of Juan de Fuca to <strong>the</strong>north, and Hood Canal to <strong>the</strong> east. To <strong>the</strong> south, timber harvest in <strong>the</strong> lowlandsof western Washington virtually has eliminated spotted owls. Currently,approximately 60 miles separate owl subpopulations on <strong>the</strong> Olympic Peninsulaand subpopulations in <strong>the</strong> western Cascades. Distance between currentlyknown reproductive pairs is approximately 75 miles. Isolation may decrease<strong>the</strong> number of successfully dispersing juveniles and inhibit movement of adultsamong populations (Thomas et al. 1990).There is little or no dispersal between this and o<strong>the</strong>r populations, and demographicrescue would be unlikely in <strong>the</strong> event of a population decline on <strong>the</strong>Olympic Peninsula. Following such a decline, inbreeding could become aconcern.Offsetting a demographic decline on <strong>the</strong> peninsula or restocking a populationareawhere spotted owls have become locally extirpated due to catastrophic orstochastic events would be assisted by demographic connectivity betweenspotted owls on <strong>the</strong> Olympic Peninsula and those in o<strong>the</strong>r provinces. Thislikely would require establishment of groups of breeding pairs in <strong>the</strong> westernWashington lowlands province.Vulnerability to Natural Disturbances. Wind is <strong>the</strong> dominant disturbancefactor along <strong>the</strong> western coast of <strong>the</strong> peninsula and as far as 20 to 30 milesinland. Historic stand-replacing wind events occurred in 1921 and 1962(Appendix F). Logging within <strong>the</strong> past 30 years has resulted in increasedfragmentation on Forest Service, state, and private lands. Exposed <strong>for</strong>estedges are much more susceptible to wind damage than are relativelyunfragmented patches. The potential is high <strong>for</strong> a large-scale wind event toadversely affect spotted owl habitat in this region (Appendix F). Fire is also asignificant threat on <strong>the</strong> Olympic Peninsula, particularly in <strong>the</strong> eastern portion.Recent fires, such as <strong>the</strong> Forks Burn, were stand-replacement events thateliminated significant tracts of spotted owl habitat. Agee (1991b) suggests thatunder a worst case scenario, wind and fire could reduce <strong>the</strong> capability of <strong>the</strong>Olympic peninsula to support spotted owl pairs by up to 30 percent during <strong>the</strong>next 100 years.Western Washington LowlandsOwnership in this province is largely nonfederal and includes major urban,industrial, and agricultural areas. Most <strong>for</strong>estland is owned by <strong>the</strong> State ofWashington or large industrial timber corporations. This province includes<strong>the</strong> Puget Trough and southwest Washington physiographic provinces asdelineated by Franklin and Dyrness (1973) because <strong>the</strong>se regions show similaritiesin spotted owl densities, land ownership patterns, and ecologicalconditions.43
Southwest Washington occupies a key position on <strong>the</strong> landscape. It is <strong>the</strong> onlyarea where connectivity could be reestablished with <strong>the</strong> currently isolatedpopulation of nor<strong>the</strong>rn spotted owls on <strong>the</strong> Olympic Peninsula. Major threatsto <strong>the</strong> few currently known spotted owls in <strong>the</strong> western Washington lowlandsprovince include low numbers, local isolation, habitat loss, and poor distribution.Low Populations. There has been considerable concern <strong>for</strong> spotted owls inthis geographic region (Thomas et al. 1990, USDI 1990). Currently three pairsand one territorial single are known in <strong>the</strong> province. In terms of populationstability and structure, spotted owls essentially have been eliminated.Limited Habitat. Forestlands in <strong>the</strong> western Washington lowlands werelogged early in <strong>the</strong> settlement of <strong>the</strong> state, and a considerable area was convertedto urban, industrial, and agricultural lands. Historical observations ofspotted owls are documented from <strong>the</strong> early communities of Seattle andTacoma (WDW 1991). Habitat conversion has been extensive from Tacomanorth to <strong>the</strong> Canadian border, and likely will increase significantly during <strong>the</strong>next 100 years as human populations increase. Extensive <strong>for</strong>estlands stillremain in <strong>the</strong> southwest portion of <strong>the</strong> state. Many of <strong>the</strong>se lands already havebeen logged twice.<strong>Spotted</strong> owl habitat has been reduced greatly during <strong>the</strong> past 60 to 80 years.Late-successional <strong>for</strong>est currently remains in relatively small, scattered parcels,seldom more than a few hundred acres in size. The few existing spottedowls are located in <strong>the</strong>se patches surrounded by young <strong>for</strong>est or are inhabitingyounger <strong>for</strong>est stands that have retained snags and/or dead, decaying logsfrom previous harvest or natural disturbance.Declining Habitat. The little suitable habitat remaining within <strong>the</strong> provincelikely will be reduced fur<strong>the</strong>r unless immediate action is taken. Of equal orgreater concern is <strong>the</strong> rate of harvest of mature <strong>for</strong>est, which may serve as <strong>the</strong>potential foundation <strong>for</strong> restoration of owl habitat in <strong>the</strong> province.Province Isolation. <strong>Spotted</strong> owls within <strong>the</strong> province are extremely isolatedfrom one ano<strong>the</strong>r, with little opportunity <strong>for</strong> interchange among territories.The province currently does not provide <strong>for</strong> demographic interchange with anyof <strong>the</strong> neighboring provinces. Providing <strong>for</strong> that interchange will requiredeveloping subpopulation centers, essentially by growing habitat <strong>for</strong> a numberof pair clusters.Predation and Competition. Predation by great horned owls may be a threatto <strong>the</strong> few remaining owls or to development of owl clusters in <strong>the</strong> future.Recent surveys suggest that great homed owls are numerous (Table 2.5).Vulnerability to Natural Disturbances. Portions of <strong>the</strong> province along <strong>the</strong>Pacific Coast may be susceptible to wind damage, similar to <strong>the</strong> westernportion of <strong>the</strong> Olympic Peninsula. Wind and fire are potential threats to <strong>the</strong>few remaining spotted owls in <strong>the</strong> province.Western Washington CascadesThe western Washington Cascades province lies west of <strong>the</strong> Cascade Crestfrom <strong>the</strong> Columbia River north to <strong>the</strong> Canadian border. Ownership is primarilyfederal, although state, private, and municipal ownerships play importantroles <strong>for</strong> spotted owls in several areas. The province consists of three geographicareas; <strong>the</strong> nor<strong>the</strong>rn Cascades (Interstate 90 to <strong>the</strong> Canadian border),<strong>the</strong> Interstate 90 (1-90) corridor (north of Mt. Rainier to 1-90), and <strong>the</strong> sou<strong>the</strong>rnCascades (Mt. Rainier south to <strong>the</strong> Columbia River). Significant topographic44
differences occur in <strong>the</strong> nor<strong>the</strong>rn and sou<strong>the</strong>rn portions of <strong>the</strong> province. Thenor<strong>the</strong>rn area is dominated by high mountains and ridges unsuitable <strong>for</strong>spotted owls and lower valleys with suitable spotted owl habitat. The resultinglandscape pattern is a mosaic of alternating valleys of suitable habitat andunsuitable ridges, a naturally fragmented environment <strong>for</strong> spotted owls. Thesou<strong>the</strong>rn portion is much less dominated by mountainous areas, and spottedowl habitat is more continuous, although still highly fragmented by past timberharvest.Low Populations. The currently known spotted owl population includesapproximately 200 pair and single owl territories (WDW 1991). This numberwill change as additional areas are surveyed. <strong>Spotted</strong> owls are found throughout<strong>the</strong> province, although at lower densities in <strong>the</strong> nor<strong>the</strong>rn portion and in <strong>the</strong>1-90 corridor area. The 1-90 corridor is an area of checkerboard ownershiplands (federal with state, private, or municipal) that has been harvested heavilyin <strong>the</strong> past 20 to 30 years. Approximately 20 spotted owl territories occur in<strong>the</strong> 1-90 corridor in <strong>the</strong> western Washington Cascades province. In <strong>the</strong> nor<strong>the</strong>rnregion, in only 22 territories are known to have produced young successfullysince 1986 (WDW 1991). In addition, owls only two territories in <strong>the</strong> 1-90corridor have produced young successfully since 1986. Reproductive successhas been higher in <strong>the</strong> sou<strong>the</strong>rn portion of <strong>the</strong> province.Limited Habitat. Current spotted owl habitat generally is located at higherelevations, predominantly on national <strong>for</strong>est lands. Much of <strong>the</strong> accessible,low-elevation habitat has been logged previously, and current stands that haveregenerated after harvest generally are less than 80 years old.Few blocks of old-growth <strong>for</strong>est remain on state, private, and municipal lands.Most of <strong>the</strong> currently known spotted owls on <strong>the</strong>se lands (outside of checkerboardownership lands) inhabit patchwork mosaics of remnant old-growthstands that survived historic <strong>for</strong>est fires within larger naturally regeneratedsecond-growth stands. The 1-90 corridor has been harvested heavily within <strong>the</strong>past 20 years, as has <strong>the</strong> area known as <strong>the</strong> Mineral Block in <strong>the</strong> Gif<strong>for</strong>dPinchot National Forest.Declining Habitat. <strong>Spotted</strong> owl habitat in <strong>the</strong> province has declined significantlyin <strong>the</strong> last 30 years. During this time <strong>the</strong> proportion of old-growth thatwas potential spotted owl habitat has decreased from about 60 percent toabout 40 percent of <strong>the</strong> area of <strong>the</strong> Mt. Baker-Snoqualmie National Forest, withsimilar decreases from about 40 percent to 30 percent <strong>for</strong> <strong>the</strong> Gif<strong>for</strong>d PinchotNational Forest (Henderson 1990). The relatively low proportions of old-growthon <strong>the</strong> Gif<strong>for</strong>d Pinchot National Forest resulted from <strong>the</strong> Yacolt Bum of 1902and <strong>the</strong> eruption of Mount St. Helens in 1980, as well as logging.In recent years, habitat decline has been most severe, proportion in <strong>the</strong> 1-90corridor and <strong>the</strong> Mineral Block of <strong>the</strong> Gif<strong>for</strong>d Pinchot National Forest. Habitatsurrounding 38 randomly selected spotted owl management areas on <strong>the</strong> Mt.Baker-Snoqualmie and Gif<strong>for</strong>d Pinchot National Forests was analyzed in 1984(Allen et al. 1989). The average proportion of suitable habitat within 1.5 and2.1 miles of <strong>the</strong> center of <strong>the</strong>se areas varied between 49 and 55 percent of <strong>the</strong>total area at that time. Analysis of in<strong>for</strong>mation presented in <strong>the</strong> 1991 ForestService Timber Sale Biological Assessment indicates that <strong>the</strong> average proportionof suitable habitat within 1.8 miles of spotted owl territories was near 40percent (Hays pers. comm.). The difference between <strong>the</strong>se habitat estimatesduring <strong>the</strong> past 7 years is an indication of severe habitat decline in a relativelyshort period of time. In <strong>the</strong> near future, <strong>the</strong> expected net rate of habitat losswithout protective measures <strong>for</strong> <strong>the</strong> spotted owl will significantly decrease <strong>the</strong>potential <strong>for</strong> recovery on both federal and nonfederal lands.45
Distribution of Habitat and Populations. There are several concerns about<strong>the</strong> distribution of habitat and owls in <strong>the</strong> western Washington Cascadesprovince. In <strong>the</strong> nor<strong>the</strong>rn portion, no large clusters of spotted owls currentlyoccur. Much of <strong>the</strong> habitat in lower elevation areas has been eliminated, andinterchange among remaining individuals or small clusters of spotted owlslikely is inhibited by non<strong>for</strong>ested, high-elevation ridges, peaks, and glaciers.As in <strong>the</strong> nor<strong>the</strong>rn portion, no large clusters of spotted owls currently occur in<strong>the</strong> 1-90 corridor. Distribution concerns are primarily with north-to-southinterchange of dispersing young and adults. With greatly reduced levels ofsuitable spotted owl habitat in this region, <strong>the</strong>re is significant isolation of <strong>the</strong>nor<strong>the</strong>rn and sou<strong>the</strong>rn portions of spotted owl populations in <strong>the</strong> WashingtonCascades. North-to-south interchange is fur<strong>the</strong>r restricted by narrowing offederal ownership in <strong>the</strong> 1-90 corridor area.In <strong>the</strong> sou<strong>the</strong>rn portion of <strong>the</strong> province, two significant distributional concernsoccur. <strong>Spotted</strong> owl populations in Washington and Oregon are separatednaturally by <strong>the</strong> Columbia River. Historically, spotted owls probably werelocated along <strong>the</strong> nor<strong>the</strong>rn and sou<strong>the</strong>rn banks of <strong>the</strong> Columbia River. Loggingand urban development in lowland areas of western Washington and Oregonhave resulted in a restricted area of interchange, or "bottleneck" betweenspotted owls in both states. Currently, interchange between spotted owlpopulations in <strong>the</strong> two states likely occurs only in a 18- to 20-mile zone in <strong>the</strong>Columbia Gorge, if at all. Primary ownership on <strong>the</strong> Washington side of <strong>the</strong>gorge includes state, private, and federal lands. It is unknown to what degreespotted owls in <strong>the</strong> two states interact. State and private lands are importantin addressing <strong>the</strong>se distributional concerns in <strong>the</strong> I-90 corridor and <strong>the</strong> ColumbiaGorge.The northwest portion of <strong>the</strong> Gif<strong>for</strong>d Pinchot National Forest represents ano<strong>the</strong>rdistributional concern. The Mineral Block is critical to potential geneticand demographic interchange between <strong>the</strong> Olympic Peninsula province and <strong>the</strong>western Washington Cascades province. Currently, 10 known spotted owlterritories are located in this checkerboard ownership block. Nonfederal landscurrently support spotted owls, and are important <strong>for</strong> long-term developmentof a stable subpopulation in this area.Province Isolation. The two provinces that comprise <strong>the</strong> Washington Cascadesare connected by contiguous habitat and owls in only a few high-elevationareas, such as Steven's, Snoqualmie, and White Passes. The extent ofdemographic interchange over <strong>the</strong>se mountain passes is unknown. Thenor<strong>the</strong>rn portion of <strong>the</strong> province is virtually at <strong>the</strong> edge of <strong>the</strong> species' currentrange. <strong>Spotted</strong> owls in sou<strong>the</strong>rn British Columbia are found in low numbersand densities, and are unlikely to provide demographic support to owls innor<strong>the</strong>rn Washington. The degree of province isolation in <strong>the</strong> Columbia Riverarea is unknown. <strong>Spotted</strong> owls in <strong>the</strong> Washington Cascades probably areisolated demographically at present from owl populations on <strong>the</strong> OlympicPeninsula.Vulnerability to Natural Disturbances. The eruption of Mount St. Helenseliminated a large <strong>for</strong>ested region containing a number of spotted owls. Theblast zone is similar in size to an area that might support a large cluster of 20or more pairs of spotted owls as described by Thomas et al. (1990). A volcaniceruption of Mt. Baker, Mt. Rainier, Glacier Peak, or Mt. Adams could result inelimination of one or more conservation areas, and local isolation of subpopulationcenters.46
Eastern Washington CascadesThe eastern Washington Cascades province lies east of <strong>the</strong> Cascade crest from<strong>the</strong> Columbia River north to <strong>the</strong> Canadian border. Ownership is primarilyfederal and Indian lands, although some state and private lands are located inkey areas in <strong>the</strong> province. Within <strong>the</strong> province are several important sub-areas<strong>for</strong> spotted owls. The nor<strong>the</strong>rn portion includes <strong>the</strong> Okanogan National Forest,and Entiat and Chelan Ranger Districts of <strong>the</strong> Wenatchee National Forest. Thecentral area stretches from north of <strong>the</strong> Wenatchee to Yakima, and includes<strong>the</strong> rest of <strong>the</strong> Wenatchee National Forest as well as <strong>the</strong> checkerboard ownershipstate and private lands (including <strong>the</strong> eastern portion of <strong>the</strong> 1-90 corridor)and nonfederal lands adjacent to <strong>the</strong> national <strong>for</strong>est. The Yakima IndianReservation also constitutes a sub-area, located south of <strong>the</strong> WenatcheeNational Forest. The sou<strong>the</strong>rn portion of <strong>the</strong> province is located south andwest of <strong>the</strong> Yakima Indian Reservation, including portions of <strong>the</strong> Gif<strong>for</strong>dPinchot National Forest and mixed ownerships of state and private lands.Low Populations. Population estimates <strong>for</strong> <strong>the</strong> eastern Washington Cascadesprovince range between 250 and 300 current pairs (WDW 1991). There areapproximately 160 known pairs in <strong>the</strong> region. Survey ef<strong>for</strong>ts have variedwidely among ownerships, with more intensive surveys historically conductedon <strong>the</strong> Wenatchee and Okanogan National Forests. State, private, and Indianlands received varying degrees of survey ef<strong>for</strong>t until 1991, when more intensivesurvey ef<strong>for</strong>ts were undertaken.Currently, activity centers <strong>for</strong> 30 spotted owl territories are located on state orprivate lands in <strong>the</strong> eastern Cascades. A number of spotted owls with activitycenters located on federal lands also likely uses state and private lands,primarily as a result of checkerboard ownership patterns. Approximately 20spotted owl territories occur in <strong>the</strong> nor<strong>the</strong>rn sub-area. These territories largelyaffect only federal ownership. Approximately 24 known territories occur on <strong>the</strong>Yakima Indian Reservation. Estimates of current numbers on <strong>the</strong> YakimaIndian Reservation range up to 50 pairs (Hansen pers. comm.).Limited Habitat. In general, habitat in <strong>the</strong> eastern Washington Cascades isin somewhat better condition than that of <strong>the</strong> western Cascades in Washington.In <strong>the</strong> 1-90 Corridor, <strong>the</strong>re is approximately 10 to 15 percent more habitatin <strong>the</strong> eastern Cascades than in <strong>the</strong> western Cascades. This difference mayhave significant effects on occupancy rates and reproductive success of spottedowls (Bart and Forsman 1990). As in o<strong>the</strong>r provinces, much of <strong>the</strong> lowerelevation habitats have been logged heavily but primarily with partial-harvesttechniques.Most spotted owl habitat in <strong>the</strong> eastern Washington Cascades is found in <strong>the</strong>Yakima Indian Reservation and four Ranger Districts in <strong>the</strong> Wenatchee NationalForest: Naches, Cle Elum, Leavenworth, and Lake Wenatchee (including<strong>the</strong> checkerboard ownership nonfederal lands). Much of <strong>the</strong> region is dominatedby high-elevation mountains and ridge-tops that are not suitable spottedowl habitat. These topographic restrictions shift emphasis <strong>for</strong> conservation tolow-elevation, mixed conifer <strong>for</strong>ests and smaller clusters of spotted owls.Distribution of Habitat and Populations. <strong>Spotted</strong> owls and habitat arepoorly distributed in <strong>the</strong> portion of <strong>the</strong> Okanogan National Forest within <strong>the</strong>range of <strong>the</strong> species, <strong>the</strong> Chelan and Entiat Ranger Districts, nonfederal landsbetween <strong>the</strong> Wenatchee National Forest and <strong>the</strong> Yakima Indian Reservation,and <strong>the</strong> mixed-ownership sou<strong>the</strong>rn portion of <strong>the</strong> province. <strong>Recovery</strong> measuresemphasizing habitat development may be needed in <strong>the</strong>se areas toprovide <strong>for</strong> subpopulation centers throughout <strong>the</strong> province.47
Province Isolation. The eastern Washington Cascades province is isolatedsomewhat from o<strong>the</strong>r spotted owl subpopulations on nor<strong>the</strong>rn, sou<strong>the</strong>rn, andwestern boundaries. The two provinces that comprise <strong>the</strong> Washington Cascadesare connected by contiguous habitat and owls in only a few areas. Thenor<strong>the</strong>rn portion of <strong>the</strong> province is virtually at <strong>the</strong> edge of <strong>the</strong> species' currentrange and <strong>the</strong> few spotted owls within this region are isolated from largergroups of owls south of Lake Chelan. <strong>Spotted</strong> owls in sou<strong>the</strong>rn British Columbiaare found in low numbers and densities, and are unlikely to providedemographic support to owls in nor<strong>the</strong>rn Washington. The degree of provinceisolation in <strong>the</strong> Columbia River area is unknown.Vulnerability to Natural Disturbances. There is a significant potential <strong>for</strong>large-scale fire in <strong>the</strong> eastern Washington Cascades province. There is a lowprobability that any conservation area created in <strong>the</strong> eastern Cascades ofWashington will avoid stand-replacing wildfire over a significant portion of <strong>the</strong>landscape during <strong>the</strong> next century (Appendix F). As spotted owls in <strong>the</strong>province currently are clustered in a few key areas, fire poses a severe naturalthreat to population recovery. Similar to <strong>the</strong> situation in <strong>the</strong> western Cascades,volcanic eruptions of Mt. Adams, Mt. Rainier, or Glacier Peak couldeliminate one or more conservation areas and increase within-province isolationof subpopulations.5. Threats by Province within OregonOregon Coast RangeThe Oregon Coast Range province lies west of <strong>the</strong> Willamette Valley andextends along <strong>the</strong> coast from <strong>the</strong> Columbia River south to about <strong>the</strong> CoquilleRiver. The province is characterized by generally low-elevation, productive<strong>for</strong>ests in areas of high precipitation. Land ownership of <strong>the</strong> approximately4.48 million acres in <strong>the</strong> Coast Range is 57 percent private, 13 percent ForestService, 17 percent BLM, and 13 percent state (Figure 2.4a). Federal lands arerepresented by <strong>the</strong> Siuslaw National Forest and parts of <strong>the</strong> Salem, Eugene,Coos Bay, and Roseburg BLM Districts. Timber harvest and extensive wildfireshave greatly reduced and fragmented spotted owl habitat. Threats to <strong>the</strong> owlpopulation in this province are greater than those in any o<strong>the</strong>r Oregon province(Table 2.4).Low Populations. The owl population within this province is extremely low,particularly in <strong>the</strong> nor<strong>the</strong>rn three-fourths of <strong>the</strong> province. A total of about 325pairs has been found within <strong>the</strong> last 5 years. <strong>Owl</strong>s are poorly distributedwithin <strong>the</strong> province and exist at very low densities with many pairs isolated bymore than 10 miles. Forty-five percent of <strong>the</strong> known spotted owl sites lie southof Highway 38, in <strong>the</strong> sou<strong>the</strong>rn quarter of <strong>the</strong> province. Most spotted owl siteswithin <strong>the</strong> province have less than 40 percent suitable habitat within homerange areas (USDI 1991a).Most owl sites are located in <strong>the</strong> sou<strong>the</strong>rn portion of <strong>the</strong> province and areassociated with BLM lands. As a result of timber harvest on <strong>the</strong> interspersedBLM and private lands, <strong>the</strong> <strong>for</strong>est landscape is very fragmented.The Elliott State Forest is a 93,000-acre block of state-owned land nor<strong>the</strong>ast ofCoos Bay. Surveys in <strong>the</strong> Elliott State Forest in 1991 revealed 20 pairs and 18single owls. These owls are of particular interest due to <strong>the</strong> age structure oftrees within <strong>the</strong> <strong>for</strong>est. Sixty percent of <strong>the</strong> Elliott State Forest is composed oftrees from 90 to more than 140 years of age (trees on <strong>the</strong> remaining area are48
Estimated acres of <strong>for</strong>est landbase:Estimated acres of suitable habitat:4,475,000 743,000State 12.6%Private 56.8% Unsuitable 84.8% Tribal 0. 0%BLM 17.2% Private 2.0%State 1.6%BLM = U.S. Bureau of Land ManagementFS = U.S. Forest SenviceTribal 0.3% ES 5.5%FS 13.0%Figure 2.4a. Land base and suitable habitat, Oregon Coast Range.less than 40 years of age). Research is needed to determine if <strong>the</strong> population ofowls is self-sustaining. <strong>Owl</strong> populations elsewhere in <strong>the</strong> province are insignificant decline.Surveys <strong>for</strong> owls were conducted on 38,000 acres of state land in <strong>the</strong> centralportion of <strong>the</strong> province (west of Corvallis) during 1990 and 1991. Only 6.1percent of this state land (6,257 acres) contains trees older than 75 years ofage; mean stand size is 26.2 acres (+sd 20.2; range 1 to 120 acres). Only onespotted owl response was noted in 1991, with that owl being from a siteadjacent to, ra<strong>the</strong>r than within, state lands. Although <strong>the</strong>se state lands likelysupported owls in previous years, owls no longer exist in this landscape.The Tillamook State Forest in <strong>the</strong> nor<strong>the</strong>rn portion of <strong>the</strong> province contains480,000 acres of <strong>for</strong>estlands, 3 percent of which currently support trees olderthan 80 years. Large fires in 1933, 1939, and 1945 burned a total of 345,936acres. Subsequent re<strong>for</strong>estation has created a relatively homogeneous <strong>for</strong>est,with stands 30 to 50 years of age. Older <strong>for</strong>est stands outside of <strong>the</strong> burnedarea, now isolated due to timber harvest, contain <strong>the</strong> remaining owls andhabitat. As of September 1991, 25 owl sites were present on state and federallands north of Highway 18.Declining Populations. Based on demographic data ga<strong>the</strong>red in <strong>the</strong> Roseburgstudy area from 1985 to 1991, <strong>the</strong> finite rate of increase (lambda) <strong>for</strong>Coast Range study areas is 0.941 (Appendix C), indicating an annual populationdecline of about 6 percent.Limited Habitat. Suitable habitat within <strong>the</strong> Oregon Coast Range is extremelylimited and poorly distributed, especially north of Highway 38. Fragmentationof remaining habitat within this province is of significant concernand is due largely to timber harvest and land-ownership patterns. The lack ofsuitable habitat is particularly acute in <strong>the</strong> nor<strong>the</strong>rn part where federal landsare virtually nonexistent. Habitat quantity and quality have been reducedseverely due to: 1) extensive timber harvest, 2) fragmentation and isolation ofremaining stands, and 3) catastrophic fires and <strong>the</strong> resulting salvage of liveand dead trees. As of August 1991, only 37 percent of <strong>the</strong> federal lands (Neitropers. comm., Mellen pers. comm.), 12 percent of <strong>the</strong> state lands (Johnson pers.comm.), and 3 percent of <strong>the</strong> private lands (Greber et al. 1990) in <strong>the</strong> province49
were in suitable habitat condition. As of January 1991, suitable habitatexisted only on an estimated 15 percent of <strong>the</strong> <strong>for</strong>est landbase within <strong>the</strong>province (all ownerships, Figure 2.4a).Dispersal and movement within <strong>the</strong> province is very limited, especially in <strong>the</strong>nor<strong>the</strong>rn half, due to <strong>the</strong> low amount of dispersal habitat on federal and statelands, <strong>the</strong> general lack of habitat on private lands, and <strong>the</strong> substantial distancesbetween suitable habitat areas. An assessment of dispersal habitat onfederal lands was made using <strong>the</strong> dispersal habitat criteria of Thomas et al.(1990). For BLM lands, 130 of 264 (49 percent) of <strong>the</strong> quarter-townshipscontaining one section or more of BLM land did not meet dispersal habitatcriteria. For Forest Service lands, nearly all of <strong>the</strong> quarter-townships containingSiuslaw National Forest lands met <strong>the</strong> dispersal criteria (Frounfelker pers.comm.). Both of <strong>the</strong>se assessments reflect 1991 habitat conditions.Declining Habitat. Since 1950, <strong>the</strong> estimated annual rate of decline insuitable owl habitat <strong>for</strong> <strong>the</strong> province has been 2 percent (Figure 2.4b).Throughout much of <strong>the</strong> Coast Range, remnant stands containing habitat havebeen reduced to small and often isolated parcels; many of <strong>the</strong>se areas nolonger support owls. The little suitable habitat remaining within <strong>the</strong> provincewill be fur<strong>the</strong>r reduced without immediate action. Of equal concern is <strong>the</strong> rateof harvest of 60- to 80-year-old stands, which may serve as <strong>the</strong> foundation <strong>for</strong>restoration of owl habitat in <strong>the</strong> province.Distribution of Habitat and Population. The remaining habitat within <strong>the</strong>province typically occurs as scattered pockets within a matrix of younger/3,000Uea)2,5002,000_0C 1,500U,0 1,000n- 10000 0000000000000~500............... ...... …...................00. -01940 1950 1960 1970Year1980 1990 2000........... All ownerships_..... _ BLM (U.S. Bureau of Land Management)____ FS (U.S. Forest Service)0ooooooPrivate......... State- - - I -- ....--- .-- . I .. .I.. 11.1.11 111.1.11- 111-- -1"ISources: Mellen (pers. comm.),Neitro (pers. comm.), Johnson(pers. comm.), Bruce (pers.comm.), Starkey (pers. comm.),Greber et al. (1990).I/Figure 2.4b. Trend in nor<strong>the</strong>rn spotted owl habitat, Oregon Coast Range province.50
Douglas-fir stands (less than 50 years old). The nearly simultaneous harvestingof large contiguous blocks of industrial-owned lands has created expansesof relatively young <strong>for</strong>ests that isolate <strong>the</strong> residual suitable habitat and occupiedowl sites. Clear-cutting has been <strong>the</strong> predominant harvest practice within<strong>the</strong> province.Few clusters containing more than three pairs of owls exist north of Highway126. Here, in <strong>the</strong> nor<strong>the</strong>rn two-thirds of <strong>the</strong> province, individual owl sitesare generally separated by 3 to more than 15 miles.Predation and Competition. Great horned owls and nor<strong>the</strong>rn spotted owlswere surveyed in <strong>the</strong> central Coast Range in 1990 and 1991. Great hornedowls were nearly seven times more numerous than spotted owls (Table 2.5). Asgreat horned owls are key predators on spotted owls, this great relative abundanceis of concern. Barred owls are distributed throughout <strong>the</strong> province andhave been recorded at 46 sites from 1980 to 1991. The goshawk population isvery low in <strong>the</strong> Coast Range.Province Isolation. The province is connected to <strong>the</strong> western Cascadesprovince in Oregon through <strong>for</strong>ested lands south of Eugene, and to <strong>the</strong> Klamathand western Cascades provinces south of Canyonville. These key linkageareas contain BLM and private lands in a checkerboard pattern. Due to pastand present timber harvest on federal and intervening state and private lands,habitat is particularly limited. For example, BLM lands within 50 percent of<strong>the</strong> quarter-townships in this area do not contain owl habitat adequate <strong>for</strong>dispersal (i.e., do not meet <strong>the</strong> "50-11-40 rule" as described in Thomas et al.1990). There<strong>for</strong>e, <strong>the</strong> risk of isolation of <strong>the</strong> Oregon Coast Range province ishigh and will increase with additional harvest of habitat.Historically, <strong>the</strong>re was probably a significant connection between <strong>the</strong> OregonCoast Range province and <strong>the</strong> western Washington lowlands province, withowls crossing <strong>the</strong> Columbia River. Timber harvest since 1920 likely haseliminated this connection. To increase <strong>the</strong> likelihood of owl recovery in <strong>the</strong>seprovinces, habitat would have to be developed along both sides of <strong>the</strong> ColumbiaRiver to reestablish <strong>the</strong> connection between <strong>the</strong>se two provinces.Vulnerability to Natural Disturbance. Extensive fires historically haveremoved large areas of habitat, although return intervals have been long, andannual risk is fairly low. Because current suitable habitat areas are limitedand disconnected, disturbance events could remove key areas.Western Oregon CascadesThis province lies west of <strong>the</strong> crest of <strong>the</strong> Cascade Mountains and extends <strong>the</strong>length of <strong>the</strong> state from <strong>the</strong> Columbia River to <strong>the</strong> Cali<strong>for</strong>nia border. Habitatextends from <strong>the</strong> eastern edge of <strong>the</strong> Willamette Valley upslope to about 5,000feet, and from <strong>the</strong> moist, true-fir <strong>for</strong>est in <strong>the</strong> north to <strong>the</strong> dry, mixed coniferpine-oakwoodlands in <strong>the</strong> south. Ownership in this province is 54 percentForest Service, 34 percent private, 10 percent BLM, and 2 percent state(Figure 2.5a).Low Populations. <strong>Owl</strong> populations within this province are moderately high,as is <strong>the</strong> amount of remaining habitat on federal lands. Areas with low owlnumbers occur on 1) private lands, 2) checkerboard BLM lands at lowerelevations, 3) checkerboard Forest Service lands in <strong>the</strong> Santiam Pass area, and4) higher elevation <strong>for</strong>ests near <strong>the</strong> Cascade Crest. There are approximately925 known spotted owl pair sites in this province. <strong>Owl</strong> use of habitats above5,000 feet elevation is very limited and few pairs successfully nest above 4,500feet in this province.51
Estimated acres of <strong>for</strong>est landbase:Estimated acres of suitable habitat:4,475,000 743,000Private 32.3% NPSO.3% BLMI4.1%state 1.9%BLIMV 8.8% FS 56.7%NPS 0.3%Private 1.0%FS 56.7% Unsuitable 69.3 State 0.0%BLM = U.S. Bureau of Land ManagementFS = U.S. Forest ServiceNPS = National Park ServiceSources: Mellen (pers. comm.). Neitro (pers. comm.), Johnson (pers. comm.), Bruce (pers. comm.), Starkey (pers. comm.).Greber et al. (1990).Figure 2.5a. Land base and suitable habitat, western Oregon Cascades.52Declining Populations. Based on demographic data ga<strong>the</strong>red from <strong>the</strong> H.J.Andrews study area from 1987 through 1991, populations in <strong>the</strong> centralportion of <strong>the</strong> province are declining by about 7 percent annually (lambda =0.928)(Appendix C). Additional demographic data come from <strong>the</strong> Med<strong>for</strong>dstudy area in <strong>the</strong> sou<strong>the</strong>rn part of <strong>the</strong> province. Most of <strong>the</strong> Med<strong>for</strong>d studyarea lies within <strong>the</strong> Klamath province and <strong>the</strong> remainder is within <strong>the</strong> westernCascades province. Using data pooled from both provinces within <strong>the</strong> studyarea, <strong>the</strong> annual rate of population decline is 16 percent (lambda = 0.844,Appendix C).Limited Habitat. Although <strong>the</strong> western Cascades province has a higher owldensity than in any o<strong>the</strong>r Oregon province, suitable owl habitat is limitedmainly to federal lands (Figure 2.5a). Much of <strong>the</strong> suitable habitat of federallands has been fragmented significantly in <strong>the</strong> past 40 years. For example,within areas approximately equal to <strong>the</strong> median home ranges of 383 owl-pairsites on <strong>the</strong> Willamette National Forest, 49 percent of <strong>the</strong> sites contained lessthan 40 percent owl habitat, 33 percent contained from 41 to 60 percenthabitat, and only 11 percent contained more than 60 percent habitat. No datawere available <strong>for</strong> 7 percent of <strong>the</strong> pairs (By<strong>for</strong>d, pers. comm.).Johnson (pers. comm.) assessed <strong>the</strong> amount of old-growth and mature <strong>for</strong>estwithin 70 plots (totaling 86,695 acres) located at random on Forest Serviceland within <strong>the</strong> central portion of <strong>the</strong> province. The mean amount of oldgrowthand mature <strong>for</strong>est within <strong>the</strong>se plots was 53 percent in 1990.Declining Habitat. Timber harvest from all ownerships <strong>for</strong> <strong>the</strong> period 1950 to1990 indicates an estimated annual rate of habitat loss of 1.4 percent <strong>for</strong> thisprovince (Figure 2.5b). The rate of habitat loss on federal lands is approximately1.0 percent annually.Ripple et al. (1991) assessed <strong>the</strong> changes in <strong>for</strong>est fragmentation patterns from1972 to 1987 on approximately 65,000 acres of national <strong>for</strong>est land in <strong>the</strong>
central portion of <strong>the</strong> province. They reported an 8.7 percent decrease in <strong>the</strong>amount of natural <strong>for</strong>est (as a result of timber harvest) and a concomitant 18.0percent decrease in <strong>the</strong> amount of interior habitat. The loss of interior habitat,at nearly double <strong>the</strong> rate of timber harvest, reflected <strong>the</strong> harvest of timber in acheckerboard manner during <strong>the</strong> study period.In a different study, Ripple (pers. comm.) used satellite imagery to assess <strong>the</strong>changes in <strong>the</strong> amount of closed-canopy <strong>for</strong>est and closed-canopy interior<strong>for</strong>est from 1972 to 1987 on an 866,950-acre study area in <strong>the</strong> western Cascadesprovince. During this period, <strong>the</strong> proportion of closed-canopy <strong>for</strong>est wasreduced from 71 percent to 58 percent, along with a significant reduction inclosed-canopy interior <strong>for</strong>est. In this study, closed-canopy <strong>for</strong>est was definedas stands 30 to 40 years of age or older with more than 60 percent canopyclosure, and closed-canopy interior <strong>for</strong>est was <strong>the</strong> amount remaining afterremoval of a 330-foot edge zone.Distribution of Habitat and Populations. The north-to-south distribution ofspotted owls through <strong>the</strong> central portion of this province is adequate, with <strong>the</strong>exception of <strong>the</strong> Santiam Pass area where owl sites are separated by 6 to 10miles. <strong>Owl</strong>s are scattered on BLM lands along <strong>the</strong> western portion of <strong>the</strong>province and some owl sites are isolated by intervening private lands withlimited habitat. Few owls are found above 4,500 feet and little suitable habitatexists above 5,000 feet.The <strong>for</strong>ested lands on <strong>the</strong> flanks of <strong>the</strong> western Cascades between <strong>the</strong> national<strong>for</strong>est boundaries and <strong>the</strong> Willamette Valley floor are predominantly privately5U)OnCo0U)0432- - - - - - - t. t. -:. zz* -- ' ' ' ' ' -.- 1. . . . . . . . . . . . ... ........... .. .. .... . . . 1. . . . .*.0. . . . . . . . . . . . . .. . . . . . . . .-... . .:l !1940 1950 1960 1970Year1980 1990 2000........... All ownerships_______ BLM (U.S. Bureau of Land Management)- - - - FS (U.S. Forest Service)....... ... Private*------- StateSources: Mellen (pers. comm.),Neitro (pers. comm.), Johnson(pers. comm.), Bruce (pers.comm.), Starkey (pers. comm.),Greber et al. (1990).Figure 2.5b. Trend in nor<strong>the</strong>rn spotted owl habttat, western Oregon Cascades province.53
owned and contain little suitable habitat. Although owls are present in lownumbers on some of <strong>the</strong>se lands, it is unclear whe<strong>the</strong>r <strong>the</strong> owls are selfsupportingor are a result of dispersing owls from nearby source populations.Predation and Competition. Great homed owls and nor<strong>the</strong>rn spotted owlswere surveyed in <strong>the</strong> central portion of <strong>the</strong> province in 1989 and 1990, withgreat homed owls 60 percent as numerous as spotted owls (Johnson pers.comm., Table 2.5). Barred owls are distributed throughout <strong>the</strong> province andhave been recorded at 156 locations from 1980 through 1991.Goshawk densities are moderate within this province, and most goshawks areobserved within habitats also used by nor<strong>the</strong>rn spotted owls. Goshawkpredation upon adult spotted owls has been observed (Desimone, pers. comm.).Province Isolation. Prior to development of <strong>the</strong> Portland metropolitan areaand <strong>the</strong> Willamette Valley, this province would have been connected to <strong>the</strong>Oregon Coast Range at least along <strong>the</strong> Willamette River between Wilsonvilleand <strong>the</strong> Columbia River. Ano<strong>the</strong>r possible <strong>for</strong>ested connection may haveexisted in <strong>the</strong> vicinity of Salem.There is concern that <strong>the</strong> Columbia River Gorge, plus <strong>the</strong> effects of hydroelectricdams and o<strong>the</strong>r recent human activities along <strong>the</strong> river, have created abarrier to <strong>the</strong> movement of spotted owls between <strong>the</strong> Cascade provinces inWashington and Oregon. <strong>Spotted</strong> owl habitat in this area mainly occurs on <strong>the</strong>Mt. Hood National Forest in Oregon and Gif<strong>for</strong>d Pinchot National Forest inWashington.The connection to <strong>the</strong> Coast Range province is weak, and <strong>the</strong>re is significantconcern <strong>for</strong> demographic instability and isolation of owls in <strong>the</strong> Coast Range.Habitat that would support east-to-west movements of owls between <strong>the</strong>seprovinces most likely can be achieved on BLM lands south of Eugene.Linkage to <strong>the</strong> Cascades province in Cali<strong>for</strong>nia is threatened by past logging onBLM and private land, and by natural ecological conditions that limit <strong>for</strong>estdevelopment in <strong>the</strong> area.The western and eastern Cascades provinces adjoin along <strong>the</strong> crest of <strong>the</strong>Cascades Mountains. A barrier to dispersal between <strong>the</strong>se two provinces existsalong 40 percent of <strong>the</strong>ir common border and consists of high-elevation areasthat are 3 miles or more in width, with little or no <strong>for</strong>est cover.Vulnerability to Natural Disturbance. Habitat loss due to natural disturbancesin this province is caused primarily by fire and wind. Key areas of fireconcern <strong>for</strong> this province are along <strong>the</strong> Columbia River in <strong>the</strong> Mt. Hood NationalForest (Appendix F), and <strong>the</strong> area adjacent to <strong>the</strong> Klamath province insou<strong>the</strong>rn Oregon. Although major wind events have occurred in this province(e.g., on Bull Run watershed in 1973 and 1983, Franklin and Forman 1987)most wind events occur on a smaller scale. The effects of most wind events willbe to accelerate windthrow along susceptible edges where clear-cuts and roadsborder protected <strong>for</strong>est stands. Within DCAs it is expected that, as <strong>the</strong>younger <strong>for</strong>est stands develop, and through a program of aggressive firesuppression, <strong>the</strong> loss of habitat to wind and fire can be effectively reduced.Eastern Oregon CascadesThe eastern Oregon Cascades province is a narrow band of habitat extendingnorth-to-south along <strong>the</strong> east side of <strong>the</strong> Cascade crest from <strong>the</strong> ColumbiaRiver to <strong>the</strong> Cali<strong>for</strong>nia border. Habitat suitable <strong>for</strong> owls is found in <strong>the</strong> mixedconifer zone existing between <strong>the</strong> high-elevation subalpine and mountain-54
hemlock <strong>for</strong>ests and <strong>the</strong> lower elevation lodgepole/ponderosa pine areas. Mostof <strong>the</strong> owls' range in this province is in federal and Indian ownership, although<strong>the</strong>re is some state and private land at <strong>the</strong> sou<strong>the</strong>rn end of <strong>the</strong> province.Low Populations. The population of owls in this province is very low, primarilydue to <strong>the</strong> inherently low potential <strong>for</strong> suitable habitat and due to <strong>the</strong>extent of timber harvest where habitat does exist. Only 163 pairs of owls werefound in this province based on 1987 to 1991 surveys, with 89 percent of <strong>the</strong>owl sites on federal lands. The only area in <strong>the</strong> province where owl pairs occurin moderate numbers and distribution is within <strong>the</strong> Mt. Hood National Forest.Federal lands in this province have been fairly well surveyed <strong>for</strong> owls, and <strong>the</strong>Warm Springs Reservation was surveyed in 1991. As a result of <strong>the</strong>se surveys,an estimated 80 to 90 percent of <strong>the</strong> owl sites are known in <strong>the</strong> province.Demographic in<strong>for</strong>mation <strong>for</strong> owls in this province is limited and no long-termstudies have been undertaken.Major threats to <strong>the</strong> owl population reflect viability concerns related to <strong>the</strong>generally poor distribution and low numbers of owl sites, and <strong>the</strong> inability toprovide suitable habitat conditions over <strong>the</strong> long-term (due to changes in<strong>for</strong>est-tree species composition and large fires).Limited Habitat. Because of natural limitations of <strong>the</strong> landscape it will bedifficult to achieve habitat conditions where large clusters of owls (i.e., 20 ormore pairs) can be sustained. The alternative is to provide <strong>for</strong> smaller clusters,relatively near one ano<strong>the</strong>r, where current or potential habitat exists. Fairlycontiguous (although fragmented) habitat conditions exist from <strong>the</strong> ColumbiaRiver south to <strong>the</strong> Metolius River at <strong>the</strong> sou<strong>the</strong>rn end of <strong>the</strong> Warm SpringsReservation. Current and potential habitat south of <strong>the</strong> Metolius River generallyoccurs in blocks less than 4,000 acres in size, isolated from one ano<strong>the</strong>r by4 to 25 miles.Distribution of Habitat and Populations. Most spotted owl habitat in <strong>the</strong>eastern Oregon Cascades exists on <strong>the</strong> Mt. Hood and Deschutes NationalForests, <strong>the</strong> Klamath District of <strong>the</strong> Winema National Forest, and on <strong>the</strong> WarmSprings Reservation. Based on surveys from 1987 through 1991, 70 owl pairsare known in <strong>the</strong> Mt. Hood National Forest, 16 pairs in <strong>the</strong> Warm SpringsReservation, 30 pairs in <strong>the</strong> Deschutes National Forest, and 37 pairs in <strong>the</strong>Winema National Forest. Eleven pairs are found on BLM lands west of KiamathFalls, and three pairs in Crater Lake National Park.With <strong>the</strong> exception of <strong>the</strong> Mt. Hood National Forest, habitat and owls are poorlydistributed throughout <strong>the</strong> province. Natural conditions (e.g., soils, moistureconditions), past fire history, and timber harvest have contributed to <strong>the</strong>isolated nature of habitat and owls in this province.Predation and Competition. No surveys <strong>for</strong> great homed owls, goshawks, orbarred owls have been undertaken in this province. Incidental observationssuggest that great homed owls are numerous, and that goshawks are morecommon in this province than in <strong>the</strong> o<strong>the</strong>r Oregon provinces. From 1980through 1991, barred owls have been observed at 27 locations within <strong>the</strong>province; at 17 sites on <strong>the</strong> Mt. Hood National Forest, one site on <strong>the</strong> WarmSprings Reservation, and at nine sites on <strong>the</strong> Winema National Forest.Province Isolation. Due to high-elevation subalpine and non<strong>for</strong>ested conditionsalong 40 percent of <strong>the</strong> Cascade crest, <strong>the</strong> eastern Oregon Cascadesprovince is relatively isolated from <strong>the</strong> western Cascades province. Theseconditions pose a barrier <strong>for</strong> owls in <strong>the</strong> vicinity of <strong>the</strong> Three Sisters Mountains,and from Willamette Pass south to about 25 miles south of <strong>the</strong> sou<strong>the</strong>rnboundary of Crater Lake National Park.55
Vulnerability to Natural Disturbances. The potential <strong>for</strong> large-scale loss ofowl habitat to fire is higher here than it is <strong>for</strong> any o<strong>the</strong>r Oregon province.There is a low probability that any conservation area created in <strong>the</strong> easternCascades of Oregon will avoid a stand-replacing fire over a significant portionof its landscape during <strong>the</strong> next century (Appendix F).Klamath (Oregon Portion)The Klamath province covers large portions of southwestern Oregon andnor<strong>the</strong>rn Cali<strong>for</strong>nia. The Oregon portion lies south of <strong>the</strong> Coquille River andRoseburg, and west of Med<strong>for</strong>d. Land ownership in <strong>the</strong> Oregon portion is 35percent Forest Service, 30 percent BLM, 33 percent private, and 3 percentstate (Figure 2.6a). Forest Service ownership includes <strong>the</strong> Siskiyou and partsof <strong>the</strong> Rogue and Klamath National Forests. BLM ownership includes much of<strong>the</strong> Med<strong>for</strong>d District with lesser amounts of <strong>the</strong> Roseburg and Coos BayDistricts. The Oregon portion of <strong>the</strong> province is characterized by generallymountainous terrain (e.g., <strong>the</strong> Siskiyou and Klamath Mountains), a highdiversity of <strong>for</strong>est tree species, often occurring in mixed stands, and large areasof serpentine soils, which generally are incapable of supporting <strong>for</strong>est conditions.Un<strong>for</strong>ested talus slopes are common. Threats to <strong>the</strong> owl populationinclude continued loss and fragmentation of habitat from timber harvest, amajor threat of habitat loss from fires (see Appendix F), and a declining population.Low Populations. Numbers and density of spotted owls are moderate in thisprovince, and <strong>the</strong> population generally is well distributed. Approximately 390pairs have been found in <strong>the</strong> province from 1987 through 1991. However,demographic data indicate that <strong>the</strong> owl population is in significant decline.Poor habitat conditions (due largely to serpentine soils and high elevation) andlow owl numbers occur within <strong>the</strong> Kalmiopsis Wilderness Area. Unlike <strong>the</strong>Cali<strong>for</strong>nia portion of <strong>the</strong> province, few owl sites are known on private lands.Declining Populations. Based on demographic data ga<strong>the</strong>red from 1985through 1991 in <strong>the</strong> Med<strong>for</strong>d study area (Appendix A), owls in this area areexperiencing <strong>the</strong> highest annual rate of decline (16 percent) in Oregon. Thenesting success of owl pairs varies annually within all portions of <strong>the</strong> owl'srange, but has been particularly low <strong>for</strong> this area (and <strong>for</strong> <strong>the</strong> Oregon CoastRange as well). In only 3 of <strong>the</strong> last 7 years has <strong>the</strong> percent of pairs producingyoung exceeded 50 percent (of <strong>the</strong> pairs present), with <strong>the</strong> highest being 60percent in 1986 (<strong>the</strong> lowest was 14 percent in 1987).Limited Habitat. Approximately 38 percent of <strong>the</strong> 3,102,000 acres of <strong>for</strong>estedland in this province contains habitat suitable <strong>for</strong> owls (Figure 2.6a). Thishabitat is primarily on federal lands and is extensively fragmented, due totimber harvest patterns on <strong>the</strong> checkerboard and mixed land ownerships, aswell as natural vegetation patterns.Declining Habitat. The overall estimated rate of habitat decline <strong>for</strong> all ownershipswithin <strong>the</strong> province has been 1.3 percent per year <strong>for</strong> <strong>the</strong> period of 1950through 1990. The rate of decline has accelerated in <strong>the</strong> last decade to approximately3 percent annually, primarily reflecting a continued high level ofharvest on private land and an increased level of harvest on federal lands(Figure 2.6b).Distribution of Habitat and Populations. In general, owls and owl habitatare reasonably well distributed within <strong>the</strong> province. Low owl numbers and/orpoor habitat conditions exist in <strong>the</strong> Kalmiopsis Wilderness Area, on privatelands, and within <strong>the</strong> areas of checkerboard BLM/private lands.56
1Estimated acres of <strong>for</strong>est landbase:Estimated acres of suitable habitat:4,475,000 743,000BLM 29.2%Private 31.4% %BLM 17.4% State 0.2%ES 12.7%Private 1 .3%Unsuitable 68.4%BLM = U.S. Bureau of Land ManagementFS = U.S. Forest ServiceSources: Mellen (pers. comm.), Neitro (pers. comm.), Johnson (pers. comm.). Bruce (pers. comm.), Starkey (pers. comm.).IGreber et al. (1990).Figure 2.6a. Land base and suitable habitat. Oregon Klamath provincePredation and Competition. There have been no surveys <strong>for</strong> great homedowls or goshawks, and <strong>the</strong>ir impacts on nor<strong>the</strong>rn spotted owls are poorlyunderstood in this portion of <strong>the</strong> Klamath province. From 1980 through 1991,22 barred owl locations were recorded in this province.Province Isolation. Due to <strong>the</strong> fragmented condition of <strong>the</strong> habitat in <strong>the</strong>Roseburg and Med<strong>for</strong>d areas, connectivity to <strong>the</strong> Coast Range and <strong>the</strong> westernCascades provinces is weak. An assessment of dispersal habitat, as describedby Thomas et al. (1990), found that on BLM lands, 140 of 284 (49 percent) ofquarter-townships containing one section or more of BLM lands did notcontain habitat adequate <strong>for</strong> dispersal. Of Forest Service lands within <strong>the</strong>Siskiyou National Forest, 8 of 125 quarter-townships did not contain habitatadequate <strong>for</strong> dispersal (Webb, pers. comm.). Of particular concern are BLM/private checkerboard lands that are key linkage areas between <strong>the</strong> Klamathand adjacent provinces.Vulnerability to Natural Disturbances. The potential <strong>for</strong> large-scale loss ofhabitat is high because of <strong>the</strong> regular occurrence of fire (Appendix F). Due tosteep topography and changes in vegetation, fires in this province burn withvarying intensities, and create a complex mosaic of burned, partially burned,and unburned areas. Although fires are often large (93,000 acres in <strong>the</strong> 1987Silver fire), <strong>the</strong> total amount of owl habitat actually lost in a fire usually is notgreat.6. Threats by Province within Cali<strong>for</strong>niaCali<strong>for</strong>nia CoastThe Cali<strong>for</strong>nia Coast province extends south from <strong>the</strong> Oregon border to SanFrancisco Bay and from <strong>the</strong> ocean inland to <strong>the</strong> western border of national<strong>for</strong>est lands. The coastal portion of <strong>the</strong> province encompasses <strong>the</strong> majority of<strong>the</strong> redwood <strong>for</strong>est habitat type. Inland <strong>for</strong>ests are Douglas-fir and mixed57
Douglas-fir/hardwood types, <strong>the</strong> latter often interspersed with chaparral andgrasslands. Land is predominantly in industrial and nonindustrial privateownership. Federal lands are represented by scattered small blocks of publicland and four National Park Service areas, including Redwood National Park,P.J. Reyes National Seashore, Muir Woods National Monument, and GoldenGate National Recreation Area. State lands include a state <strong>for</strong>est, and fourlarge and numerous smaller state parks.Low Populations. Population levels are relatively high, with almost one-third(370) of <strong>the</strong> known activity centers <strong>for</strong> nor<strong>the</strong>rn spotted owls in Cali<strong>for</strong>niafound in this province. About 155 sites have had verified pairs from 1986through 1990. There is an average of 2.3 known owl sites per township expectedto contain suitable owl habitat.Declining Populations. <strong>Spotted</strong> owls generally are widespread in <strong>the</strong> province,having been found in 56 percent of <strong>the</strong> townships in <strong>the</strong> province, or in71 percent of <strong>the</strong> townships where suitable habitat exists and thus where <strong>the</strong>ywould be expected to occur. One known or no owl sites have been found in 50percent of <strong>the</strong> townships where <strong>the</strong> owl would be expected to occur. More thannine sites each are known from three townships, indicating that some habitatconditions can support high densities. One township on heavily harvested,commercial redwood <strong>for</strong>estland supports at least 18 sites.Demographic in<strong>for</strong>mation indicates that owls in this area are occupying sitesand reproducing at rates similar to owls in o<strong>the</strong>r areas. Survival in<strong>for</strong>mation islimited so estimates of population stability are not possible.2500V)1)C-)L_4-0coCU)0-C200015001000500…00.............. 00. ..1940 1950 1960 1970Year…............................................................,-1980 1990 2000........... All ownerships_______ BLM (U.S. Bureau of Land Management)- - - - FS (U.S. Forest Service)0000000 Private........ ..StateSources: Mellen (pers. comm.),Neitro (pers. comm.), Johnson(pers. comm.), Bruce (pers.comm.), Starkey (pers. comm.),Greber et al. (1990).11.11 ......... I... . I I - 11 ... I............- ... 1.11- IfAFigure 2.6b. Trend in nor<strong>the</strong>rn spotted owl habitat, Klamath province (Oregon portion).58
Limited Habitat. <strong>Spotted</strong> owl habitat is expected to occur in about 79 percentof <strong>the</strong> townships in <strong>the</strong> province. There are slightly more than 2 millionacres of <strong>for</strong>estlands in this province where timber production is <strong>the</strong> mainmanagement goal.There is a long history of habitat alteration in coastal redwood <strong>for</strong>ests. Thereare approximately 1.95 million acres of redwood <strong>for</strong>estland, of which a verylarge portion (probably more than 75 percent) was historically in an old-growthcondition. There are approximately 85,000 acres of old-growth redwood <strong>for</strong>estremaining today, 21,000 acres of which are in private ownership. The vastmajority of known owls is in well-developed second-growth, usually older than50 years. There are approximately 740,000 acres of larger second-growthredwood <strong>for</strong>est in <strong>the</strong> province. Most of this <strong>for</strong>est is commercially availableand is being harvested by a variety of methods reflecting <strong>the</strong> managementphilosophies of landowners. The currently suitable owl habitat in <strong>the</strong> redwoodtimber type appears to be high quality, and most neighboring pairs are notwidely separated.Douglas-fir and Douglas-fir/hardwood <strong>for</strong>ests predominate in <strong>the</strong> timberedland inland from <strong>the</strong> redwood belt. This area occupies roughly a quarter of <strong>the</strong>province with <strong>the</strong> remaining portion being brush and oak/brush lands. Thesegenerally unsuitable lands <strong>for</strong> owls are interspersed with, and in some areasnaturally fragment, <strong>the</strong> more suitable Douglas-fir and Douglas-fir/hardwood<strong>for</strong>ests. There are no commercially available old-growth Douglas-fir or Douglas-fir/hardwood<strong>for</strong>ests in <strong>the</strong> province, but harvest occurs in <strong>the</strong> secondgrowthDouglas-fir types.Declining Habitat. Redwoods are limited geographically to <strong>the</strong> coastal portionof this province. The wood is in relatively high demand, and available oldgrowthis rare. Harvest on private lands in <strong>the</strong> north coast accelerated during<strong>the</strong> 1980s. From 1986 through 1989, <strong>the</strong> average annual acreage cut in thisarea was 102,029 acres. Approximately 83,000 of those acres, or about 4percent of <strong>the</strong> timber producing lands, were treated annually with standreplacementharvests. Protected second-growth habitat within RedwoodNational Park will provide additional habitat as <strong>the</strong>se stands mature.Distribution of Habitat and Populations. <strong>Owl</strong>s and owl habitat generallyare abundant and widespread across <strong>the</strong> nor<strong>the</strong>rn and western portions of <strong>the</strong>province where redwood and coastal Douglas-fir habitats predominate. <strong>Owl</strong>densities average 3.6 known owl sites per township where suitable owl habitatis expected to occur.In some areas of <strong>the</strong> province, owl habitat is distributed naturally in an irregularpattern. A north-to-south band from sou<strong>the</strong>astern Humboldt County tocentral Mendocino County contains a natural mix of Douglas-fir <strong>for</strong>est incanyons, hardwood <strong>for</strong>est on slopes, and grasslands on ridges. This area isrelatively unsurveyed, but <strong>the</strong> distribution of owls and <strong>the</strong>ir habitat is notcontinuous. Similar conditions, without <strong>the</strong> Douglas-fir <strong>for</strong>ests, continuesouth through Lake County. One-third of <strong>the</strong> townships in this area is notexpected to contain suitable owl habitat. On average, one known owl siteoccurs in those townships that are expected to contain suitable habitat.<strong>Owl</strong> populations in Marin County, and Napa and Sonoma Counties (21 and 27sites respectively) are isolated. Naturally occurring grasslands and hardwood/brush areas separate <strong>the</strong>se owl populations from <strong>the</strong> continuous range of <strong>the</strong>subspecies that occurs to <strong>the</strong> north and northwest. The Napa and SonomaCounty owls are 16 to 20 miles from <strong>the</strong> main body of <strong>the</strong> population inwestern Sonoma County and 32 miles from owls in <strong>the</strong> sou<strong>the</strong>rn part of <strong>the</strong>Klamath province in Lake County. The Marin County population is at least 1759
miles from <strong>the</strong> contiguous population of owls in <strong>the</strong> province to <strong>the</strong> north and27 to 31 miles from <strong>the</strong> o<strong>the</strong>r isolated population in Napa and Sonoma Countiesto <strong>the</strong> east.<strong>Owl</strong> habitat in <strong>the</strong> province is found on a greater variety of ownerships than inany o<strong>the</strong>r province of <strong>the</strong> state. Private industrial land ownerships comprise<strong>the</strong> largest single group. The multiplicity of ownerships in Marin, Napa, andSonoma Counties, along with early logging history, agricultural, and residentialland developments have resulted in extensive habitat fragmentation. Coordinationand cooperation will be necessary in achieving recovery in this province.Province Isolation. <strong>Owl</strong> habitat is contiguous along <strong>the</strong> nor<strong>the</strong>rn two-thirdsof <strong>the</strong> 220-mile boundary between <strong>the</strong> Cali<strong>for</strong>nia Coast and Cali<strong>for</strong>nia Klamathprovinces. In <strong>the</strong> sou<strong>the</strong>rn one-third, suitable habitat in both provinces isnaturally fragmented, and owl sites are at lower densities. The sou<strong>the</strong>rn end of<strong>the</strong> province is isolated from o<strong>the</strong>r provinces, although <strong>the</strong> range of <strong>the</strong> Cali<strong>for</strong>niaspotted owl extends to within 110 miles to <strong>the</strong> south (across San Francisco)and 90 miles to <strong>the</strong> east (across <strong>the</strong> Sacramento Valley).Predation and Competition. Great horned owls, red-tailed hawks, andravens occur naturally throughout <strong>the</strong> province. Natural grasslands areinterspersed throughout <strong>the</strong> province and <strong>the</strong>ir occurrence indicates a historyof contact between grassland and <strong>for</strong>est species. However, current logging isopening second-growth stands, and when <strong>for</strong>ests are limited this harvestdecreases <strong>the</strong> area available as refuge from avian predators.Barred owls were first identified in <strong>the</strong> province in 1981. Seven of <strong>the</strong> nineknown barred owl sites have been found in <strong>the</strong> last 3 years. Currently, competitionfrom barred owls in <strong>the</strong> province appears to be low, but barred owlsoccupy at least one site previously occupied by nor<strong>the</strong>rn spotted owls, and ahybrid is known to have paired with a nor<strong>the</strong>rn spotted owl (Gould pers.comm.).Vulnerability to Natural Disturbance. Fire probably is <strong>the</strong> major, shorttermdisturbance event that would affect <strong>for</strong>ests in <strong>the</strong> province (Appendix F).Much of <strong>the</strong> coastal area supports moist redwood and Douglas-fir <strong>for</strong>ests thatdo burn. However, fires are generally smaller and less frequent than those inprovinces far<strong>the</strong>r inland. In <strong>the</strong> mixed Douglas-fir/hardwood/grassland-zoneon <strong>the</strong> eastern side of <strong>the</strong> province, fire is a considerably more frequent event.Wind damage, and insect and drought problems also appear to be relativelyminor in <strong>the</strong> province.Klamath (Calli<strong>for</strong>nia Portion)The Cali<strong>for</strong>nia Klamath province is located between <strong>the</strong> Cali<strong>for</strong>nia Coastprovince and <strong>the</strong> Cali<strong>for</strong>nia Cascades province. It is a continuation of <strong>the</strong>Oregon Klamath province south to <strong>the</strong> Clear Lake Basin in <strong>the</strong> Inner CoastRange. The area is mountainous and covered primarily with Douglas-fir<strong>for</strong>ests. Mixed Douglas-fir <strong>for</strong>ests are common at lower elevations with Douglas-fir/truefir <strong>for</strong>est at higher elevations. The province primarily consists offour national <strong>for</strong>ests and includes four major wilderness areas. There are a fewparcels of o<strong>the</strong>r public lands and some private <strong>for</strong>estlands. The private andpublic lands mostly occur near <strong>the</strong> eastern edge of <strong>the</strong> province.Low Populations. <strong>Owl</strong> populations are moderate in this province, whichcontains 750 sites. There have been about 455 pairs verified from 1986through 1990. Suitable habitat contains an average density of 3.7 known owlsites per township.60
Declining Populations. <strong>Spotted</strong> owls generally are widespread in <strong>the</strong> province,having been found in 85 percent of <strong>the</strong> townships in <strong>the</strong> province and in95 percent of <strong>the</strong> townships where suitable owl habitat would be expected toexist. One or no owl sites have been found in 23 percent of <strong>the</strong> townshipswhere <strong>the</strong> owl is expected to occur. More than nine sites each have been foundin seven townships, and one township has 20 known sites. Populations in <strong>the</strong>Willow Creek study area have been decreasing by nearly 9 percent annuallyduring <strong>the</strong> last several years (Appendix C). In some areas known sites havedisappeared due to habitat modifications.Limited Habitat. There are an estimated 1,070,000 acres of suitable owlhabitat in Forest Service lands in nor<strong>the</strong>rn Cali<strong>for</strong>nia, of which 80 percent isestimated to be in <strong>the</strong> Klamath province. Additional habitat is found on privatelands which generally occur along <strong>the</strong> eastern edge of <strong>the</strong> province.Habitat generally is not highly fragmented and individual pairs normally arenot isolated or becoming isolated in <strong>the</strong> western and central parts of <strong>the</strong>province. Along <strong>the</strong> eastern edge, <strong>the</strong>re are areas of poorer soils, intrusions ofhigher-elevation areas and drier conditions, all of which result in loweramounts of suitable owl habitat. Natural fragmentation and <strong>the</strong> isolation ofindividual pairs (such that sites are more than 6 miles apart) occur at <strong>the</strong>sou<strong>the</strong>rn end of <strong>the</strong> species' range in this province. Forest is limited or absentin this area due to lower and drier conditions.Declining Habitat. There has been significant loss of habitat to clear-cuttingon national <strong>for</strong>est lands, most of which has occurred since <strong>the</strong> mid- 1940s. Areduction of 40 percent (212,000 acres to 126,200 acres) in <strong>the</strong> area of matureand old-growth, closed-canopy <strong>for</strong>est has occurred on <strong>the</strong> Six Rivers NationalForest. This occurred with an average annual harvest (1960 to 1984) of 158.6million board feet. O<strong>the</strong>r national <strong>for</strong>ests probably are undergoing a decreasein available habitat with average annual cuts of 80.2 million board feet (prior to1984) on <strong>the</strong> Mendocino National Forest and 248.0 million board feet (1974 to84) on <strong>the</strong> Shasta-Trinity National Forest.Much of <strong>the</strong> lower elevation, mixed conifer <strong>for</strong>est on private lands along <strong>the</strong>nor<strong>the</strong>ast edge of this province was cut heavily earlier in <strong>the</strong> century. Theresultant second-growth now is being cut, primarily using uneven-age managementtechniques. This has resulted in less absolute loss of suitable habitatthan clear-cutting would have, but <strong>the</strong> level of successive partial cuts thatmight cause degradation of owl habitat is not known. From 1986 through1990, <strong>the</strong> average area harvested on private lands in Glenn, Shasta, Siskiyou,Tehama, and Trinity Counties (some areas also in <strong>the</strong> Cascades province) was103,000 acres per year. An average of 41,000 acres was in stand-replacementharvest prescriptions.Distribution of Habitat and Populations. <strong>Owl</strong>s and owl habitat are presentwithin 92 percent of <strong>the</strong> townships in <strong>the</strong> province, and are found across <strong>the</strong>full range of ecological conditions that provide suitable owl habitat within <strong>the</strong>province. <strong>Owl</strong>s and owl habitat generally are well distributed throughout <strong>the</strong>western and most of <strong>the</strong> central portion of <strong>the</strong> province.The eastern and sou<strong>the</strong>rn parts of <strong>the</strong> province are drier, <strong>the</strong> <strong>for</strong>est is morefragmented, and owl densities are lower than in <strong>the</strong> western and central part of<strong>the</strong> province. The nor<strong>the</strong>astern section also contains a large, lower-elevationvalley with unsuitable owl habitat. A third of <strong>the</strong> townships in <strong>the</strong> easternsection are not expected to have owls, or have owls at low densities. <strong>Spotted</strong>owls have been found in 94 percent of <strong>the</strong> townships that would be expected tohave owls because of <strong>the</strong> presence of suitable habitat.61
In comparison, <strong>the</strong> sou<strong>the</strong>rn part of <strong>the</strong> province is typified by dry, brushcovered,south-facing slopes and <strong>for</strong>ested, north-facing slopes. <strong>Owl</strong>s occur in96 percent of <strong>the</strong> townships in <strong>the</strong> sou<strong>the</strong>rn part. Only 4 percent of <strong>the</strong>townships have more than four owl sites each, while 24 percent and 42 percentof <strong>the</strong> townships in <strong>the</strong> eastern and north/central parts of <strong>the</strong> province,respectively, have more than four known sites per township.Province Isolation. This province is located between <strong>the</strong> o<strong>the</strong>r two Cali<strong>for</strong>niaprovinces and is continuous with <strong>the</strong> Oregon Klamath province. <strong>Owl</strong>s and' habitat occur along <strong>the</strong> borders with <strong>the</strong> three o<strong>the</strong>r provinces except whereareas of natural habitat fragmentation occur along <strong>the</strong> southwest and nor<strong>the</strong>astboundaries. The Klamath province is contiguous with <strong>the</strong> Cali<strong>for</strong>nia Coastprovince <strong>for</strong> <strong>the</strong> first 115 miles south from <strong>the</strong> Oregon border. It is probablycontiguous with <strong>the</strong> same province <strong>for</strong> ano<strong>the</strong>r 105 miles but <strong>the</strong> habitat in <strong>the</strong>adjoining Cali<strong>for</strong>nia Coast province supports mostly dispersal habitat and littlebreeding/roosting habitat.The Klamath province is contiguous with <strong>the</strong> Cali<strong>for</strong>nia Cascades <strong>for</strong> about1 0 miles. However, suitable owl habitat only occurs along <strong>the</strong> mutual borderbetween <strong>the</strong> two provinces <strong>for</strong> <strong>the</strong> 55 miles south of Shasta Valley. Habita<strong>the</strong>re is not contiguous and is found as pockets of suitable habitat among areasof higher elevations, unsuitable soils, or past timber harvest. South ofRedding, <strong>the</strong> remainder of <strong>the</strong> eastern border of this province directly abutsCali<strong>for</strong>nia's Central Valley, which is not suitable habitat. Suitable habitat in<strong>the</strong> range of <strong>the</strong> Cali<strong>for</strong>nia spotted owl is 35 to 80 miles to <strong>the</strong> east in <strong>the</strong>Sierra Nevada.Predation and Competition. Great horned owls occur naturally throughout<strong>the</strong> province. Predation on spotted owls by great horned owls has been notedin field studies in <strong>the</strong> province. Additional studies will be required to determinewhe<strong>the</strong>r great horned owl numbers are increasing.Barred owls have been identified in <strong>the</strong> Klamath province during <strong>the</strong> last 8years. This number has grown dramatically in <strong>the</strong> last 3 years from 4 to 15known sites. Pairs of barred owls were found at one-third of <strong>the</strong>se sites in <strong>the</strong>last 2 years. The potential <strong>for</strong> competition may be increasing rapidly, but <strong>the</strong>effects on local spotted owls are not known.Vulnerability to Natural Disturbance. Fire is <strong>the</strong> major disturbance eventlikely in <strong>the</strong> Klamath province. This area has a history of many natural fires.However, fire suppression during <strong>the</strong> last 70 to 100 years has resulted inincreased accumulation of fuels and has made large and hot fires more likelythan was true historically. This has led to a recent history of large fires (e.g.,Hog fire on Klamath National Forest; 1987 fires on Klamath, Shasta-Trinityand Mendocino National Forests).Wind damage is a relatively small problem compared to o<strong>the</strong>r parts of <strong>the</strong>Pacific coast. Drought and drought-caused insect and disease problems are ofconcern, especially in some of <strong>the</strong> drier areas.Cali<strong>for</strong>nia Cascades62The Cali<strong>for</strong>nia Cascades province is located in <strong>the</strong> north central portion of <strong>the</strong>state, between <strong>the</strong> Oregon Cascades provinces, <strong>the</strong> Klamath province, and <strong>the</strong>range of <strong>the</strong> Cali<strong>for</strong>nia spotted owl at <strong>the</strong> north end of <strong>the</strong> Sierra Nevada.Suitable owl habitat generally is fragmented on a broad scale by <strong>the</strong> ShastaValley, Mt. Shasta, and o<strong>the</strong>r high-elevation areas of unsuitable soils, andareas of marginal, low-elevation habitats. Suitable <strong>for</strong>est habitat is mostly onnational <strong>for</strong>ests, although <strong>the</strong>re are significant blocks and checkerboard areaswhere <strong>for</strong>ests occur on mostly industrial private lands.
Low Populations. Population levels are low in this province. There are only71 known sites, or only about 6 percent of <strong>the</strong> known sites in Cali<strong>for</strong>nia. Pairshave been verified at about 35 sites from 1986 through 1990. The density ofsites found since 1970 is only 1.0 per township.Declining Populations. <strong>Owl</strong>s and owl habitat are present across a range ofecological conditions within <strong>the</strong> province, but habitat is fragmented. <strong>Owl</strong>s areknown from only 40 percent of <strong>the</strong> townships in <strong>the</strong> province and from 51percent of <strong>the</strong> townships where possibly suitable habitat exists. Even though<strong>the</strong> area is fairly well surveyed, 48 percent of <strong>the</strong> townships with owls haveonly one known owl site, and only 5 percent have more than four owl siteseach. Even where owls occur, population densities are low in <strong>the</strong> province.Demographic in<strong>for</strong>mation <strong>for</strong> owls in <strong>the</strong> study area is scarce. There is nodemographic in<strong>for</strong>mation from field studies. The only available in<strong>for</strong>mation islimited to survey and inventory work with anecdotal observations of reproduction,Forest Service monitoring sites, and private lands surveys which havebeen conducted only in <strong>the</strong> last 2 years.Limited Habitat. The Cali<strong>for</strong>nia Cascades province is small, containing onlyabout 110 townships. Twenty-three of <strong>the</strong>se townships probably do notcontain suitable owl habitat and ano<strong>the</strong>r 43 contain only marginal habitat.Habitat is mainly found on parts of <strong>the</strong> Klamath and Shasta-Trinity NationalForests and interspersed private lands. There are about 500,000 acres of landsuitable <strong>for</strong> timber harvest on <strong>the</strong> Shasta portion of <strong>the</strong> Shasta-Trinity NationalForest. About 220,000 of <strong>the</strong>se acres are in stands with crown diametersgreater than 13 feet and canopy closure greater than 40 percent. However,much of this area does not meet <strong>the</strong> Interagency Scientific Committee's (ISC)"50-11-40" standard <strong>for</strong> dispersal habitat (Thomas et al. 1990).Declining Habitat. Timber harvesting often extends over large areas, butcommonly does not involve clear-cutting. Habitat loss in this area is difficult toestimate because of <strong>the</strong> patchy distribution of habitat chosen by <strong>the</strong> owls,perhaps <strong>the</strong> result of previous tree cutting and/or thinning and <strong>the</strong> possiblylow historical levels of suitable habitat due to fire history.Distribution of Habitat and Populations. Habitat is fragmented throughout<strong>the</strong> province. Landscape-scale fragmentation is demonstrated by <strong>the</strong> divisionof <strong>the</strong> 44 townships where owls are found in six separate clusters. Suitablehabitat is fragmented on a local level and individual owl sites are often widelyseparated from nearest neighbors. This fragmentation and <strong>the</strong> isolation ofindividual sites may be natural in part and partially <strong>the</strong> result of timberharvest. There is only one area where <strong>the</strong> ISC found a block of contiguoushabitat sufficiently large to <strong>for</strong>m a habitat conservation area that would support16 sites.The eight sites north of Goosenest Mountain in <strong>the</strong> Klamath National Forestand private lands are <strong>the</strong> only isolated population in <strong>the</strong> province. Naturalbarriers (Shasta Valley, Klamath River Canyon, and a high-elevation pass)separate this area from <strong>the</strong> remainder of <strong>the</strong> province and from o<strong>the</strong>r adjacentprovinces.Province Isolation. The Cali<strong>for</strong>nia Cascades province is bordered on <strong>the</strong> westand north by <strong>the</strong> Cali<strong>for</strong>nia and Oregon Klamath provinces, <strong>the</strong> westernOregon Cascades and <strong>the</strong> eastern Oregon Cascades provinces. It abuts <strong>the</strong>range of <strong>the</strong> Cali<strong>for</strong>nia spotted owl to <strong>the</strong> sou<strong>the</strong>ast. Although <strong>the</strong> province isbounded by o<strong>the</strong>rs on three sides, it is somewhat isolated from those provinces.The Shasta Valley separates <strong>the</strong> nor<strong>the</strong>rn Cali<strong>for</strong>nia Klamath provincefrom <strong>the</strong> Goosenest section of <strong>the</strong> Cali<strong>for</strong>nia Cascades by 20 miles. The63
Sacramento River Canyon now provides a 10- to 13-mile division betweenknown owl sites in <strong>the</strong> Cali<strong>for</strong>nia Klamath and Cascades provinces. A narrowband (about 20 miles wide) of low-density owl habitat provides an obstacle toowl movement between <strong>the</strong> Cali<strong>for</strong>nia Cascades and <strong>the</strong> nor<strong>the</strong>rn SierraNevada. While <strong>the</strong>re are <strong>for</strong>ests in some of <strong>the</strong>se gaps, habitat quality and owldensities in <strong>the</strong>se areas are low. These conditions may be sufficient to ensuregenetic connection, but probably limit <strong>the</strong> amount of demographic support thatcould be provided by adjacent provinces.Predation and Competition. Great horned owls naturally occur throughout<strong>the</strong> province because of <strong>the</strong> open <strong>for</strong>est condition and <strong>the</strong> history (more than50 years) of large-scale habitat modifications in <strong>the</strong> province. Fire suppressionprobably has resulted in <strong>the</strong> exclusion of great horned owls from some <strong>for</strong>esthabitats that are now denser than <strong>the</strong>y were historically.Barred owls were first identified at two sites in <strong>the</strong> province in 1991. Thecurrent competition from barred owls is probably low, but is potentially detrimental,especially <strong>for</strong> this sparse and high-risk spotted owl population.Vulnerability to Natural Disturbance. Fire is <strong>the</strong> major natural disturbancelikely in <strong>the</strong> Cali<strong>for</strong>nia Cascades province. Fire may not be as great a problemas in <strong>the</strong> Klamath province, because of <strong>the</strong> presence of areas of naturally poorsoils and sparser vegetation. However, fire probably affected <strong>the</strong> compositionand structure of <strong>the</strong> historic <strong>for</strong>est. Fire suppression during <strong>the</strong> last 70 to 100years probably has increased vulnerability of <strong>the</strong> <strong>for</strong>est to wildfires. Winddamage is a minor problem, but drought and insect/disease problems are ofconcern.64
II.C. Current Management1. Forest ServiceHabitat of <strong>the</strong> nor<strong>the</strong>rn spotted owl is managed by many individuals, corporations,federal and nonfederal agencies, and Indian tribes. The large number ofentities involved and <strong>the</strong> diversity of statutory and regulatory authorities underwhich land is managed pose a challenge and provide opportunities <strong>for</strong> coordinatinglandscape-level conservation measures <strong>for</strong> <strong>the</strong> species. The followingsections explain federal, state, and Indian land management authoritiesthroughout <strong>the</strong> range of <strong>the</strong> nor<strong>the</strong>rn spotted owl. The sections are organizedto accommodate <strong>the</strong> specific roles played by <strong>the</strong> groups that will participate inrecovery. In each case, <strong>the</strong> intention is to show <strong>the</strong> means available to participantscarrying out <strong>the</strong> recovery plan.Management BackgroundPrior to <strong>the</strong> early 1970s, little was known about <strong>the</strong> nor<strong>the</strong>rn spotted owl innational <strong>for</strong>ests in Washington, Oregon, and Cali<strong>for</strong>nia except that it resided ina variety of <strong>for</strong>est types. Early research in Oregon and Cali<strong>for</strong>nia indicated anassociation with mature and old-growth <strong>for</strong>ests.In 1973, an interagency committee was organized, consisting of biologists from<strong>the</strong> Forest Service, BLM, FWS, Oregon Department of Fish and Wildlife, andOregon State University. The committee, known as <strong>the</strong> Oregon EndangeredSpecies Task Force, recommended that 300 acres of old-growth <strong>for</strong>est beretained around every known spotted owl nest site.During <strong>the</strong> next 3 years, research provided in<strong>for</strong>mation about spotted owlhabitat needs (Gould 1974; Forsman 1976). In November 1976, <strong>the</strong> regional<strong>for</strong>ester <strong>for</strong> <strong>the</strong> Pacific Northwest Region directed that nesting sites of spottedowls be protected on national <strong>for</strong>ests in Oregon, as prescribed by <strong>the</strong> task<strong>for</strong>ce, until biological unit management plans were developed.In 1976, <strong>the</strong> Oregon Endangered Species Task Force recommended a longrangegoal to maintain 400 pairs of spotted owls on public lands in Oregon.The task <strong>for</strong>ce spent 1977 developing objectives and management prescriptionsto meet that goal. For that 1-year period, <strong>the</strong> task <strong>for</strong>ce recommended thatinvolved agencies protect locations around nor<strong>the</strong>rn spotted owl nests andareas where spotted owls had been sighted.On November 3, 1977, <strong>the</strong> Oregon Endangered Species Task Force released itsInteragency <strong>Spotted</strong> <strong>Owl</strong> Management <strong>Plan</strong>. In <strong>the</strong> plan, national <strong>for</strong>ests inOregon were requested to support at least 290 pairs of spotted owls, <strong>the</strong>BLM was asked to support 90 pairs of spotted owls, and 20 pairs were identified<strong>for</strong> lands in o<strong>the</strong>r ownerships. Each pair of spotted owls was to be providedwith a minimum of 1,200 contiguous acres of habitat consisting of a corearea of at least 300 acres of old-growth conifer <strong>for</strong>est (to <strong>the</strong> extent it wasavailable) and an additional 900 acres, of which at least 50 percent was to bein stands more than 30 years old. Additional criteria were given <strong>for</strong> <strong>the</strong> distributionof habitat and proximity among pairs of spotted owls.65
On January 11, 1980, <strong>the</strong>re was an appeal of <strong>the</strong> decision not to prepare anenvironmental assessment or an environmental impact statement prior toadoption of <strong>the</strong> Oregon Endangered Species Task Force's <strong>Spotted</strong> <strong>Owl</strong> Management<strong>Plan</strong>. The Chief, U.S. Forest Service, Washington, D.C., upheld <strong>the</strong>decision by <strong>the</strong> regional <strong>for</strong>ester <strong>for</strong> <strong>the</strong> Pacific Northwest Region. However, <strong>the</strong>Chief directed that <strong>the</strong> Regional Guide <strong>for</strong> <strong>the</strong> Pacific Northwest Region, andaccompanying environmental impact statement include (1) a biological analysisto determine <strong>the</strong> number and distribution of spotted owls that would constitutea viable population, (2) regional management and monitoring standards, and(3) an evaluation of needed research. The Forest Service also directed that until<strong>the</strong> regional plan was approved, 290 pairs of spotted owls should be protectedon national <strong>for</strong>ests in Oregon using <strong>the</strong> guidelines in <strong>the</strong> Interagency <strong>Spotted</strong><strong>Owl</strong> Management <strong>Plan</strong>. Where necessary, adjustments were to be made totimber sales offered after October 1, 1980.In October 1980, national <strong>for</strong>ests in Washington were directed to protect, inaccordance with <strong>the</strong> Interagency <strong>Spotted</strong> <strong>Owl</strong> Management <strong>Plan</strong>, <strong>the</strong> habitat ofall confirmed spotted owl pairs, In April 1981, tentative allocations of spottedowls were assigned <strong>for</strong> <strong>the</strong> Gif<strong>for</strong>d Pinchot, Mt. Baker-Snoqualmie, Olympic,and Wenatchee National Forests. These allocations totaled 112 pairs of spottedowls.Also in 1980, <strong>the</strong> <strong>Spotted</strong> <strong>Owl</strong> Subcommittee, which replaced <strong>the</strong> task <strong>for</strong>ce,revised its <strong>Spotted</strong> <strong>Owl</strong> Management Guidelines in light of additional researchand in<strong>for</strong>mation. Results of radio-telemetry studies of spotted owls (Forsman1980) became available in December 1980. These studies indicated that <strong>the</strong>amount of suitable habitat that existed within 14 home ranges studied wasmuch greater than 300 acres. The <strong>Spotted</strong> <strong>Owl</strong> Subcommittee also workedwith o<strong>the</strong>r consultants during 1980. Dr. Michael Soule recommended protectionof a population of 500 or more pairs <strong>for</strong> genetic reasons.Based on <strong>the</strong> report from Forsman (1980) and consultation with Soule, <strong>the</strong>Oregon-Washington Interagency Wildlife Committee revised <strong>the</strong> Interagency<strong>Spotted</strong> <strong>Owl</strong> Management <strong>Plan</strong> in February 1981. The revision called <strong>for</strong> 1,000acres of old-growth habitat to be maintained <strong>for</strong> each spotted owl pair, with300 acres around <strong>the</strong> nest site, if known, and an additional 700 acres within1.5 miles of <strong>the</strong> nest site.In May 1981, <strong>the</strong> Forest Service issued <strong>the</strong> Draft Pacific Northwest Regional<strong>Plan</strong>. The plan contained direction on <strong>the</strong> number and distribution of spottedowl pairs to be evaluated in <strong>for</strong>est planning. It also included in <strong>the</strong> appendix<strong>the</strong> February 1981 revision of <strong>the</strong> Oregon Interagency <strong>Spotted</strong> <strong>Owl</strong> Management<strong>Plan</strong>.In 1982, <strong>the</strong> Forest Service, in cooperation with <strong>the</strong> BLM, initiated an Old-Growth Wildlife Research and Development Program in <strong>the</strong> Forest Service'sPacific Northwest Research Station.During 1984, more in<strong>for</strong>mation about spotted owls was published by Forsmanet al. (1984). In May of 1984, <strong>the</strong> Regional Guide <strong>for</strong> <strong>the</strong> Pacific NorthwestRegion and accompanying final environmental impact statement were published.These documents replaced <strong>the</strong> draft environmental impact statement<strong>for</strong> <strong>the</strong> regional plan. The regional guide included standards and guidelines <strong>for</strong><strong>for</strong>est-level planning of spotted owl habitat management, and directed national<strong>for</strong>ests to analyze <strong>the</strong> effects of protecting at least 375 pairs of spotted owls inOregon and Washington national <strong>for</strong>ests.66
Interim direction in <strong>the</strong> regional guide specified that until <strong>for</strong>est plans wereapproved, national <strong>for</strong>ests were to manage <strong>for</strong> <strong>the</strong> tentative regional total of 402pairs, with each pair being allocated 300 acres of old-growth habitat.In April 1984, national <strong>for</strong>ests in Oregon and Washington were directed tolocate habitat areas to maintain a well-distributed population of spotted owls.Establishment of habitat areas subsequently was considered necessary andsufficient to meet <strong>the</strong> management requirement <strong>for</strong> population viability.On October 22, 1984, <strong>the</strong> National Wildlife Federation, Oregon Wildlife Federation,Lane County Audubon Society, and Oregon Natural Resources Councilfiled an administrative appeal to <strong>the</strong> standards and guidelines <strong>for</strong> managementof nor<strong>the</strong>rn spotted owl habitat contained in <strong>the</strong> regional guide. The regionalguide was remanded to <strong>the</strong> Forest Service with direction to prepare a supplementalenvironmental impact statement.In Cali<strong>for</strong>nia, several national <strong>for</strong>ests had not yet begun by 1984 to implement<strong>the</strong> regional standards and guidelines because of delays in preparing individual<strong>for</strong>est management plans. The Cali<strong>for</strong>nia Department of Fish and Game and<strong>the</strong> Forest Service agreed that regional standards and guidelines should beimplemented be<strong>for</strong>e existing owl management options were lost. As a result, anetwork of spotted owl habitat areas was established on all western SierraNevada and northwestern Cali<strong>for</strong>nia national <strong>for</strong>ests.In January 1987, <strong>the</strong> Forest Service's Pacific Northwest and Pacific SouthwestRegions and Research Stations initiated <strong>the</strong> Nor<strong>the</strong>rn <strong>Spotted</strong> <strong>Owl</strong> Research,Development, and Application Program. This program was designed to accelerateand coordinate all Forest Service activities concerned with owl habitat andpopulation inventory, monitoring, and research. Results of <strong>the</strong> program havebeen used by <strong>the</strong> Forest Service to amend and revise direction <strong>for</strong> owl habitatmanagement.In December 1988, <strong>the</strong> Chief of <strong>the</strong> Forest Service approved an amendment to<strong>the</strong> regional guide <strong>for</strong> <strong>the</strong> national <strong>for</strong>ests in Oregon and Washington. Thisamendment adopted standards and guidelines <strong>for</strong> management of spotted owlhabitat in Washington and Oregon, initiated an accelerated research project on<strong>the</strong> owl's habitat requirements, and committed <strong>the</strong> Forest Service to revisit <strong>the</strong>decision in 5 years or sooner should new in<strong>for</strong>mation become available.On February 8, 1989, a complaint was filed in <strong>the</strong> federal District Court inSeattle by <strong>the</strong> Seattle Audubon Society and o<strong>the</strong>r environmental organizations,alleging that <strong>the</strong> Forest Service's adoption of <strong>the</strong> amendment to <strong>the</strong> RegionalGuide <strong>for</strong> <strong>the</strong> Pacific Northwest violated <strong>the</strong> National Forest Management Act(NFMA), <strong>the</strong> National Environmental Policy Act (NEPA), and <strong>the</strong> Migratory BirdTreaty Act (MBTA). The plaintiffs requested a preliminary injunction on alltimber sales containing 40 or more acres of spotted owl habitat on <strong>the</strong> 13national <strong>for</strong>ests with owls in Washington and Oregon. In March 1989, <strong>the</strong>court enjoined 163 timber sales pending fur<strong>the</strong>r hearings.Section 318 of <strong>the</strong> 1990 Interior and Related Agencies Appropriation Actaddressed <strong>the</strong> issue of <strong>the</strong> spotted owl; <strong>the</strong> Seattle Audubon Society lawsuit inparticular. The act provided additional protection <strong>for</strong> old-growth <strong>for</strong>ests andexisting designated areas managed <strong>for</strong> spotted owls.The 1990 appropriation act directed <strong>the</strong> Chief of <strong>the</strong> Forest Service to revise hisDecember 1988 decision. Fur<strong>the</strong>r, <strong>the</strong> act directed him to consider <strong>the</strong> conservationstrategy being developed by <strong>the</strong> ISC in <strong>the</strong> revised decision. 'A Conser-67
vation Strategy <strong>for</strong> <strong>the</strong> Nor<strong>the</strong>rn <strong>Spotted</strong> <strong>Owl</strong>, Report of <strong>the</strong> Interagency ScientificCommittee to Address <strong>the</strong> Conservation of <strong>the</strong> Nor<strong>the</strong>rn <strong>Spotted</strong> <strong>Owl</strong>," wasreleased in April 1990 (ISC).On September 28, 1990, <strong>the</strong> Department of Agriculture gave notice that <strong>the</strong>Forest Service was vacating <strong>the</strong> December 1988 Record of Decision regardingspotted owl management and that it would manage,". . . not inconsistent with<strong>the</strong> ISC Report."On October 22, 1990, <strong>the</strong> Seattle Audubon Society filed an amended complaintwith <strong>the</strong> federal District Court in Seattle alleging that <strong>the</strong> September 3, 1990,notice vacating <strong>the</strong> 1988 Record of Decision and <strong>the</strong> spotted owl habitat areasystem were illegal. Twelve timber sales were challenged under NFMA, NEPA,and MBTA aspects of <strong>the</strong> case, and were enjoined in December 1990.The court ruled on March 7, 1991, that listing of a species under <strong>the</strong> EndangeredSpecies Act did not relieve <strong>the</strong> Forest Service of its duty to ensure aviable population of <strong>the</strong> species. The court also held that <strong>the</strong> October 3, 1990,notice was adopted in violation of NFMA regulations. Eventually, <strong>the</strong> ForestService was enjoined from auctioning or awarding any timber sales in suitableowl habitat while <strong>the</strong> agency prepared an environmental impact statement ando<strong>the</strong>rwise complied with <strong>the</strong> court's orders.The Forest Service filed a notice of intent to issue an environmental impactstatement on May 8, 1991, and invited public comment <strong>for</strong> 3 months. Thedraft environmental impact statement was issued in September 1991. A finalenvironmental impact statement was completed and <strong>the</strong> record of decision wassigned on March 3, 1992.Applicable LawNational Forest Management Act. This is <strong>the</strong> principal law governingmanagement of <strong>the</strong> national <strong>for</strong>est system. It requires that national <strong>for</strong>estsdevelop land and resource management plans. These plans must be updatedevery 10 to 15 years. The act requires that <strong>the</strong> plans include but not be limitedto <strong>the</strong> following:1. An analysis of present and anticipated uses, demand <strong>for</strong>, and supply of <strong>the</strong>renewable resources, with consideration of <strong>the</strong> international resourcesituation, and an emphasis on pertinent supply and demand and pricerelationship trends.2. An inventory, based on in<strong>for</strong>mation developed by <strong>the</strong> Forest Service ando<strong>the</strong>r federal agencies, of present and potential renewable resources, andan evaluation of opportunities <strong>for</strong> improving <strong>the</strong>ir yield of tangible andintangible goods and services, toge<strong>the</strong>r with estimates of investment costsand direct and indirect returns to <strong>the</strong> federal government.3. A description of Forest Service programs and responsibilities in research,cooperative programs and management of <strong>the</strong> national <strong>for</strong>est system, <strong>the</strong>irinterrelationships, and <strong>the</strong> relationship of <strong>the</strong>se programs and responsibilitiesto public and private activities.4. A discussion of important policy considerations, laws, regulations, ando<strong>the</strong>r factors expected to influence and affect significantly <strong>the</strong> use, ownership,and management of <strong>for</strong>est, range, and o<strong>the</strong>r associated lands.68
Table 2.6. Estimated acres of spotted owl habitat on BLM lands in Oregon,Cali<strong>for</strong>nia, and Washington.State Nesting Roosting Total Totaland Habitat and Habitat ForestDistrict Foraging (Acres) (Acres)OregonSalem 53,300 120,335 173,665 372,799Eugene 64,381 55,983 20,364 302,125Roseburg 117,456 94,724 212,180 395,327Coos Bay 99,912 23,284 123,196 308,888Med<strong>for</strong>d 168,715 233,352 402,067 835,189Cali<strong>for</strong>niaUkiah 25,000 a 25,000 184,640WashingtonSpokaneb 600 1,500 2,100 3,000aNot yet surveyedbHedges (pers comm.)2. Bureau of Land ManagementWithin <strong>the</strong> geographic range of <strong>the</strong> nor<strong>the</strong>rn spotted owl, <strong>the</strong> Bureau of LandManagement (BLM) administers 2.4 million acres in Oregon, Washington, andCali<strong>for</strong>nia. These lands include public as well as railroad grant lands thatreverted to federal ownership pursuant to <strong>the</strong> Oregon and Cali<strong>for</strong>nia SustainedYield Act (O&C Act). The reverted grant lands comprise alternate sections in acheckerboard arrangement in <strong>the</strong> Med<strong>for</strong>d, Eugene, Coos Bay, Salem, andRoseburg districts in western Oregon. The BLM Oregon office manages <strong>the</strong>greatest amount of owl habitat, followed by <strong>the</strong> Cali<strong>for</strong>nia and Washingtonoffices, respectively (Table 2.6).Management BackgroundThe first BLM nor<strong>the</strong>rn spotted owl habitat management initiative consisted of79 areas identified <strong>for</strong> management as spotted owl habitat in an agreementwith <strong>the</strong> State of Oregon as components of <strong>the</strong> individual district office timbermanagement plans completed in 1983. Each agreement site comprised 300acres of contiguous old-growth or <strong>the</strong> next older <strong>for</strong>est surrounded by anadditional 900 acres managed to maintain at least 50 percent in stands olderthan 30 years. The approach to protection and management of <strong>the</strong> sites variedby district, but generally harvest from commercial <strong>for</strong>estland within agreementsites was prohibited and o<strong>the</strong>r resource management allocations within sitescarried harvest prohibitions as well. Later, in 1983, <strong>the</strong> BLM and OregonDepartment of Fish and Wildlife (ODFW) agreed to establish 1 1 additionalareas <strong>for</strong> spotted owl protection. The agreement was to remain in effect <strong>for</strong> 5years, but was revised in 1987 to extend <strong>the</strong> expiration date until <strong>the</strong> planningprocess <strong>for</strong> <strong>the</strong> 1990s is completed in 1992, and to add 20 more agreementsites. This action constrained timber harvest on 230,400 acres around 1 10owl locations throughout <strong>the</strong> five western Oregon BLM districts. The goal wasto maintain a well-distributed population of 90 pairs of owls on land administeredby <strong>the</strong> BLM. The actual number of sites was reduced to 109 with <strong>the</strong>69
transfer of one area to <strong>the</strong> Grand Ronde Indian Reservation through congressionalaction. This reduced <strong>the</strong> total area protected to 228,000 acres, and noreplacement area was designated.In 1989, an additional 12 agreement sites were established under instructionsto <strong>the</strong> BLM in section 318 of <strong>the</strong> Fiscal Year 1990 Interior and Related AgenciesAppropriation Act (Public Law 101 - 121). This brought <strong>the</strong> total of owl managementareas to 121, on which <strong>the</strong> BLM is deferring harvest on commercial <strong>for</strong>eststands. The guidance <strong>for</strong> establishment of <strong>the</strong>se 121 areas was based on workby Forsman and Meslow (pp. 58, 59 in Gutierrez and Carey 1985). Theyrecommended 2,200 acres of <strong>for</strong>est more than 80 years old be designated <strong>for</strong>each site within a 3-mile radius of a known activity center of a single owl orpair of owls. Actual delineation of sites resulted in <strong>the</strong> acreage varying from734 to 4,188 acres because of <strong>the</strong> range size of specific sites determined fromradio-telemetry and lack of coniferous stands more than 80 years old.Based on data collected between 1985 and 1990, <strong>the</strong> above managementprovided protection <strong>for</strong> approximately 20 percent of <strong>the</strong> known pairs of spottedowls on BLM lands. This plan was designed to provide <strong>for</strong> long-term maintenanceof one pair in each site; however, it was concluded that additional pairsor singles may live within <strong>the</strong> boundaries of <strong>the</strong> designated sites.In May 1990, <strong>the</strong> ISC released its report on a conservation strategy <strong>for</strong> <strong>the</strong>nor<strong>the</strong>rn spotted owl. In September 1990, <strong>the</strong> BLM adopted <strong>the</strong> Jamisonstrategy, (named <strong>for</strong> <strong>the</strong> BLM's Director, Cy Jamison) (Jamison 1990) whichincorporated <strong>the</strong> major elements of <strong>the</strong> ISC report and established <strong>the</strong> followingguidelines <strong>for</strong> a 2-year period:1. All current land use allocations under existing land use plans <strong>for</strong> useso<strong>the</strong>r than timber management will be continued.2. No regular green timber sales will be offered in proposed habitat conservationareas (HCA) category 1 through 4. All timber sales will be surveyedusing BLM timber sale survey protocol, and any new owl pairs within <strong>the</strong>zone requiring category 3 HCA areas will be protected as per ISC reportrecommendations.3. Salvage sales may be offered in HCAs if <strong>the</strong> action is to have no effect on<strong>the</strong> owl or its habitat, or if through consultation with <strong>the</strong> FWS <strong>the</strong> sale iscleared <strong>for</strong> harvest.4. Forest management practices, such as tree planting on previously loggedunits, seedling maintenance, site preparation, precommercial thinning,and fertilization would also be permitted in <strong>the</strong> HCAs during <strong>the</strong> 2-yearperiod.5. No regular green timber sales will be offered in <strong>the</strong> 109 spotted owlagreement areas established under <strong>the</strong> 1987 agreement between <strong>the</strong> BLMand ODFW, or in <strong>the</strong> 12 additional areas established under section 318 ofPublic Law 101 - 121. Timber salvage sales may be offered in <strong>the</strong> ODFWagreement areas only after <strong>the</strong> concurrence of <strong>the</strong> ODFW.6. In planning timber sales outside category 1 and 2 HCAs consider unitplacement, to <strong>the</strong> extent possible, to reduce or eliminate <strong>the</strong> impact on<strong>the</strong> existing habitat conditions <strong>for</strong> those <strong>for</strong>estlands which have mean dbhof at least 11 inches and a canopy closure of at least 40 percent. Theintent of this guideline is to provide dispersal habitat <strong>for</strong> owls.70
7. Prepare a preharvest/postharvest profile of <strong>the</strong> habitat conditions in <strong>the</strong><strong>for</strong>est matrix (<strong>for</strong>estlands outside category I and 2 HCAs) using quartertownshipassessment areas to describe <strong>the</strong> percentage of <strong>the</strong> area in.stands with a mean dbh of at least 11 inches and canopy cover of atleast 40 percent" condition. Include <strong>the</strong> profile narrative, figures, andmaps as part of <strong>the</strong> BLM's biological assessment package on <strong>the</strong> fiscalyear 1991 and 1992 annual timber sale plan that is submitted to <strong>the</strong>FWS <strong>for</strong> consultation.8. Comply with <strong>the</strong> provisions of <strong>the</strong> Endangered Species Act relative to <strong>the</strong>spotted owl by consulting on all actions that constitute a "may affect"situation on <strong>the</strong> species or its habitat. Implement <strong>the</strong> mandatory termsand conditions in <strong>the</strong> FWS biological opinion to minimize incidental takeof owls and habitat and, as appropriate, implement recommended conservationmeasures.The Jamison strategy remained in effect until September 11, 1991, when <strong>the</strong>U.S. District Court in Eugene, Oregon, enjoined <strong>the</strong> BLM from implementing<strong>the</strong> strategy until <strong>the</strong> BLM complies with section 7 of <strong>the</strong> Endangered SpeciesAct by submitting <strong>the</strong> strategy <strong>for</strong> consultation to <strong>the</strong> FWS. Management ofBLM lands in Oregon will be based on existing timber management plans untilcompletion of new resource management plans in 1992. This court decisiondid not affect management on BLM lands in Cali<strong>for</strong>nia or Washington.Resource Management <strong>Plan</strong>ningIn Oregon, <strong>the</strong> BLM currently is <strong>for</strong>mulating alternatives <strong>for</strong> its western Oregondistricts. Draft resource management plans and an environmental impactstatement are scheduled <strong>for</strong> completion in early 1992. The BLM is consideringfive alternatives including one that would emphasize high production of timberand o<strong>the</strong>r economically important values on all lands to contribute to communitystability: one that would emphasize protection of older <strong>for</strong>ests values suchas dispersed nonmotorized recreation opportunities and scenic resources; andone aimed at maintaining biological diversity, such as fish and wildlife habitat,recreation, and scenic resources on all lands. The BLM plans to analyze <strong>the</strong>effects of each alternative on spotted owls. The BLM, in cooperation with <strong>the</strong>Forest Service's Pacific Southwest Research Station Redwood Sciences Laboratory,is working to develop a spatially explicit life history simulator (model) <strong>for</strong><strong>the</strong> relative assessment of impacts of management scenarios on <strong>the</strong> nor<strong>the</strong>rnspotted owl.Management of spotted owl habitat in Cali<strong>for</strong>nia is confined to <strong>the</strong> UkiahDistrict office (Table 2.6). Current planning ef<strong>for</strong>ts <strong>for</strong> <strong>the</strong> Ukiah District,Arcata Resource Area, are focused on completing <strong>the</strong> record of decision <strong>for</strong> <strong>the</strong>resource management plan. The record of decision will defer any fur<strong>the</strong>r greentimber sales or disposal of lands containing old-growth habitat pending <strong>the</strong>completion of a state-initiated habitat conservation plan (HCP) <strong>for</strong> <strong>the</strong> owl. TheRedding Resource Area recently released its draft resource management planand is analyzing comments. Timber stands in <strong>the</strong> two resource areas aregenerally less than 300 acres in size and only rarely adjacent to o<strong>the</strong>r agencylands. Six tracts have been designated old-growth research natural areas orareas of critical environmental concern. The BLM Ukiah district manager is amember of <strong>the</strong> nor<strong>the</strong>rn spotted owl HCP steering committee and two BLMscientists are members of <strong>the</strong> HCP scientific committee.71
The BLM Spokane (Washington) District office manages approximately 3,000acres of <strong>for</strong>estlands within <strong>the</strong> range of <strong>the</strong> spotted owl. <strong>Owl</strong> management hasbeen limited to project clearance, surveys, and protection of suitable habitatwithin known owl activity areas. No nest sites are currently known.Present Status of Habitat and TrendThe ISC and <strong>the</strong> 1990 status review (USDI 1990) both referred to <strong>the</strong> majorfactors influencing <strong>the</strong> amount and distribution of owl habitat on BLM land.The major factors identified include scattered and checkerboard land patterns;past land management activities (primarily timber harvest): and naturaloccurrences such as <strong>for</strong>est succession, wildfire, and windstorms. This hascreated a mosaic patchwork of stands more than 80 years old as habitat <strong>for</strong>spotted owls. These stand sizes range primarily from 50 to 500 acres, withsome exceptions of 2,000 to 5,000 acres. The remainder of <strong>the</strong> landscape is inrecent clear-cuts or <strong>for</strong>est stands ranging from 5 to 80 years old. Clear-cuttingis <strong>the</strong> predominant harvest practice used by <strong>the</strong> BLM on lands in westernOregon. Both clear-cutting and selective harvesting have been used on landsin southwestern Oregon and nor<strong>the</strong>rn Cali<strong>for</strong>nia. Only limited use of silviculturalpractices has been experimented with to create or maintain spotted owlhabitat.In past years, <strong>the</strong> BLM has classified <strong>for</strong>est stands older than 80 years asspotted owl habitat, using <strong>for</strong>est age classes, size, and crown closure as <strong>the</strong>main criteria. Because <strong>the</strong>se attributes may not provide an adequate characterizationof suitable owl habitat, <strong>the</strong> BLM refined its habitat figures using<strong>for</strong>est operations inventory data combined with a quality check by resourcearea biologists. Table 2.6 illustrates spotted owl habitat on BLM lands inwestern Oregon with two habitat component levels identified representinglevels of habitat quality.BLM lands in <strong>the</strong> Ukiah District, Arcata Resource Area, consist of isolatedblocks generally 40 to 3,000 acres in size imbedded in a private landscape.The private lands have been subjected to extensive harvest during <strong>the</strong> lastdecade and contrast with <strong>the</strong> older timber stands on <strong>the</strong> adjacent public lands,where most of <strong>the</strong> remaining owl territories are found.Clear-cutting has not been practiced in <strong>the</strong> Ukiah District since 1981. Startingin 1982, <strong>the</strong> BLM has practiced <strong>the</strong> managed old-growth concept of <strong>for</strong>estlandmanagement on all timber sales. These guidelines provide <strong>for</strong> at least 10percent of <strong>the</strong> site's potential basal area to be occupied by trees that havesurvived at least two 100-year rotation cuttings. These superdominant treesprovide a base <strong>for</strong> future recruitment of snags and down debris. The structuralelements of old-growth management include 1) large trees <strong>for</strong> shade andreproduction, 2) large snags <strong>for</strong> nesting, 3) large debris <strong>for</strong> nitrogen fixationand carbon recycling, and 4) coarse woody debris in <strong>the</strong> headwater areas ofdrainages <strong>for</strong> erosion control.Estimates were made in <strong>the</strong> 1990 status review (USDI 1990) predicting <strong>the</strong> rateof decline of habitat during <strong>the</strong> next 10 to 50 years on BLM-administered land.Historic data showed a loss of approximately 475,000 acres during <strong>the</strong> last 20years. Assuming <strong>the</strong> harvest rates prior to <strong>the</strong> listing of <strong>the</strong> owl, habitat wouldhave been extremely limited within 30 years. However, since <strong>the</strong> 1990 listing,<strong>the</strong> actual timber sale level has been reduced to approximately 40 percent of72
ecent historical levels. This change is based on congressional direction andFWS biological opinions on BLM timber sales. Future figures could be reducedto even lower levels. However, BLM <strong>for</strong>estlands harvested in <strong>the</strong> late 1960sand early 1970s could be expected to begin providing limited spotted owlhabitat in <strong>the</strong> next 50 to 60 years.Inventory and MonitoringThe BLM in Oregon has been surveying its lands <strong>for</strong> spotted owls since <strong>the</strong>early 1970s. The percentage of BLM lands that have been inventoried bydistrict ranges from 50 to 90 percent. Early inventories were nei<strong>the</strong>r completenor uni<strong>for</strong>m, although data were accumulated on historic locations of owlsacross <strong>the</strong> land base. After <strong>the</strong> completion of land use plans in 1983, a comprehensivemonitoring plan was developed <strong>for</strong> Oregon and was put into operationin 1986. This has resulted in more consistent and complete data collectionamong districts. When surveys found and verified new locations, <strong>the</strong>sewere added to <strong>the</strong> list of sites to be monitored. The process is based primarilyon locating and tracking owls over time. Oregon data from <strong>the</strong> period of 1988through 1990 showed that 518 pairs were verified on BLM lands in westernOregon. Single owls or unconfirmed pairs were present at an additional 110locations during this same period. More than 60 percent of <strong>the</strong> owls foundwere in <strong>the</strong> Roseburg and Med<strong>for</strong>d Districts.The BLM also implemented an intensive banding program in 1985 to markindividual owls. Through 1990, more than 1,800 owls were banded, nearly athird of <strong>the</strong>m were juveniles. Results from <strong>the</strong> banding in<strong>for</strong>mation will provideinsights into longevity, movement, survival, and age at first breeding.Inventories of nor<strong>the</strong>rn spotted owl habitat in Cali<strong>for</strong>nia since 1977 have beenconducted as needed to survey timber harvest plans or o<strong>the</strong>r major land useactions. Complete documented survey data have been maintained only since1988. With about 25 percent of <strong>the</strong> habitat surveyed in <strong>the</strong> Ukiah District, 20pairs of owls (17 in <strong>the</strong> Arcata Resource Area and three on <strong>the</strong> Redding ResourceArea) have been detected on BLM lands in Cali<strong>for</strong>nia since 1988. Thirtypercent of known spotted owl territories (7 of 17) in <strong>the</strong> Arcata Resource Areahave been monitored continuously since 1987 by researchers from HumboldtState University, but no comprehensive monitoring program has been developedyet <strong>for</strong> Cali<strong>for</strong>nia.Applicable LawThe principal legislative mandates guiding management of <strong>the</strong>se lands arederived from <strong>the</strong> O&C Act and <strong>the</strong> Federal Land Policy and Management Act(FLPMA). The O&C Act applies exclusively to lands in western Oregon, generallyconfigured in an alternate-section checkerboard pattern. The O&C Actdirects management of <strong>the</strong>se lands <strong>for</strong> sustained-yield permanent <strong>for</strong>estproduction that contributes to economic stability of local communities andindustries. In addition, o<strong>the</strong>r management requirements are <strong>for</strong> permanenttimber supply, protection of watersheds, regulating stream flows, and providingrecreation facilities. FLPMA provides multiple-use management direction andoverall resource-management planning requirements <strong>for</strong> all lands administeredby <strong>the</strong> BLM.73
3. National Park ServiceThe following areas managed by <strong>the</strong> National Park Service (NPS) are known tocontain nor<strong>the</strong>rn spotted owls: North Cascades, Mount Rainier, and OlympicNational Parks in Washington; Crater Lake National Park and Oregon CavesNational Monument in Oregon; and Redwood National Park, Point ReyesNational Seashore, and Muir Woods National Monument in Cali<strong>for</strong>nia.Whiskeytown National Recreation Area in Cali<strong>for</strong>nia also may be occupied bynor<strong>the</strong>rn spotted owls. These areas provide up to 570,000 acres of suitablehabitat, although none has been surveyed <strong>for</strong> owls. The NPS currently has nocoordinated inventory and monitoring program <strong>for</strong> spotted owls.Management BackgroundManagement of areas of <strong>the</strong> NPS is generally compatible with that required <strong>for</strong>recovery of <strong>the</strong> nor<strong>the</strong>rn spotted owl. In fact, Barry (1990) suggested that fewenvironmental laws are more consistent with NPS objectives than <strong>the</strong> EndangeredSpecies Act. The primary purpose of <strong>the</strong> act is to preserve <strong>for</strong> futuregenerations endangered and threatened species and <strong>the</strong> ecosystems uponwhich <strong>the</strong>y depend, while <strong>the</strong> goal of <strong>the</strong> NPS is to "conserve <strong>the</strong> scenery and<strong>the</strong> natural and historic objects and <strong>the</strong> wildlife <strong>the</strong>rein and to provide <strong>for</strong> <strong>the</strong>enjoyment of <strong>the</strong> same in such manner and by such means as will leave <strong>the</strong>munimpaired <strong>for</strong> <strong>the</strong> enjoyment of future generations," (NPS Organic Act).The policy of <strong>the</strong> NPS is to manage natural resources "with a concern <strong>for</strong>fundamental ecological processes, as well as <strong>for</strong> individual species," (NPSManagement Policies 1988:4: 1) as well as 'identify and promote conservationof all federally listed threatened, endangered, or candidate species within parkboundaries and <strong>the</strong>ir critical habitats." Active management programs will beconducted as necessary to perpetuate <strong>the</strong> natural distribution and abundanceof threatened or endangered species and <strong>the</strong> ecosystems on which <strong>the</strong>y depend(NPS Management Policies 1988:4:11).Management actions will be in accordance with, and follow recovery prioritiesidentified in approved recovery plans (NPS 1991:273). Habitat manipulation,species restoration, or population augmentation are "encouraged if identifiedas appropriate in <strong>the</strong> recovery plan and if such activities would result in a morerepresentative distribution of <strong>the</strong> species within <strong>the</strong> park," (NPS 1991:274).Such management activities must "consider potential impacts on o<strong>the</strong>r nativespecies" and "significant modification of habitat and land<strong>for</strong>m is discouragedunless necessary to prevent extirpation or extinction of <strong>the</strong> species" (NPS1991:274). All management actions <strong>for</strong> endangered or threatened species willbe described and assigned priorities in <strong>the</strong> park's approved resources managementplan.Applicable lawThe general authority under which <strong>the</strong> NPS operates is <strong>the</strong> NPS Organic Act(16 USC 1), which authorizes <strong>the</strong> NPS to "regulate <strong>the</strong> use of <strong>the</strong> federal areasknown as national parks." See <strong>the</strong> statement of purpose of this act earlier inthis section.Each park also has its own enabling act. Congress has stated in <strong>the</strong> enablinglegislation of most units that <strong>the</strong>y have <strong>the</strong>ir own particular purposes andobjectives. These may be broad or very specific. For example, Crater Lake wasestablished in 1902 "as a public park or pleasure ground <strong>for</strong> <strong>the</strong> benefit of <strong>the</strong>74
people of <strong>the</strong> United States." Redwood National Park, created in 1968, wasestablished "to preserve significant examples of <strong>the</strong> primeval coastal redwood<strong>for</strong>ests and <strong>the</strong> streams and seashores with which <strong>the</strong>y are associated <strong>for</strong>purposes of public inspiration, enjoyment, and scientific study."The Endangered Species Act applies to all national park system areas as itdoes to o<strong>the</strong>r federal lands.4. Fish and Wildlife ServiceManagement BackgroundThe U.S. Fish and Wildlife Service (FWS) administers several national wildliferefuges within <strong>the</strong> range of <strong>the</strong> owl. Two refuges in Oregon and two in Washingtoncontain small parcels of suitable owl habitat. National wildlife refugesare managed in accordance with goals of preserving a natural diversity andabundance of fauna and flora on refuge lands and of preserving, restoring, andenhancing in <strong>the</strong>ir natural ecosystems all endangered and threatened speciesof animals and plants.Since <strong>the</strong> nor<strong>the</strong>rn spotted owl was proposed <strong>for</strong> listing, <strong>the</strong> FWS has conductedhundreds of conferences and consultations under section 7 of <strong>the</strong>Endangered Species Act concerning <strong>the</strong> land management activities of federalagencies within <strong>the</strong> species' range. Since publication of <strong>the</strong> proposal to designatecritical habitat, <strong>the</strong> conference process also has been available with regardto effects of federal management on <strong>the</strong> areas proposed <strong>for</strong> designation. Withfinal designation of critical habitat on January 15, 1992, consultation responsibilitieswere extended to <strong>the</strong>se areas so designated.Applicable LawThe FWS assists o<strong>the</strong>r federal agencies in fulfilling <strong>the</strong>ir obligations undersection 7 of <strong>the</strong> Endangered Species Act. The act requires agencies to undertakeprograms <strong>for</strong> <strong>the</strong> conservation of endangered and threatened species andto ensure that <strong>the</strong>ir actions are not likely to jeopardize <strong>the</strong> continued existenceof a listed species or to destroy or adversely modify its critical habitat. Agenciesmust consult with <strong>the</strong> FWS on any action that may affect a listed species.Consultation. The FWS conducts consultations at <strong>the</strong> request of an actionagency to determine whe<strong>the</strong>r actions proposed by federal agencies are likely to"jeopardize <strong>the</strong> continued existence" of threatened or endangered species, orresult in 'destruction or adverse modification" of critical habitat designated <strong>for</strong>listed species. These phrases are defined in regulations (50 CFR 402.02) asfollows:"Jeopardize <strong>the</strong> continued existence means to engage in an action thatreasonably would be expected, directly or indirectly, to reduce appreciably<strong>the</strong> likelihood of both <strong>the</strong> survival and recovery of a listed species in <strong>the</strong>wild by reducing <strong>the</strong> reproduction, numbers, or distribution of <strong>the</strong> species.""Destruction or adverse modification means a direct or indirect alterationthat appreciably diminishes <strong>the</strong> value of critical habitat <strong>for</strong> both <strong>the</strong>survival and recovery of a listed species. Such alterations include, but arenot limited to, alterations adversely modifying any of those physical orbiological features that were <strong>the</strong> basis <strong>for</strong> determining <strong>the</strong> habitat to becritical."75
The results of a consultation are summarized by <strong>the</strong> FWS in a biologicalopinion. During <strong>the</strong> consultation, <strong>the</strong> FWS estimates <strong>the</strong> amount of take oflisted species that will occur incidental to <strong>the</strong> action. If <strong>the</strong> proposed actionwould result in incidental take, <strong>the</strong>n <strong>the</strong> FWS may develop "reasonable andprudent measures" to minimize <strong>the</strong> level of take. The biological opinion stateswhe<strong>the</strong>r incidental take is authorized (assuming <strong>the</strong> reasonable and prudentmeasures are followed), and describes <strong>the</strong> permissible level of take. Thedescription of allowable take is called an incidental take statement.If <strong>the</strong> FWS concludes that <strong>the</strong> action is likely to jeopardize a species, or lead to<strong>the</strong> destruction or adverse modification of critical habitat, <strong>the</strong>n <strong>the</strong> FWSattempts to work with <strong>the</strong> action agency to develop reasonable and prudentalternatives. Reasonable and prudent alternatives are designed to allow <strong>the</strong>action to continue without jeopardizing <strong>the</strong> continued existence of <strong>the</strong> speciesor resulting in <strong>the</strong> destruction or adverse modification of critical habitat."Reasonable and prudent alternatives refer to alternative actions identifiedduring <strong>for</strong>mal consultation that can be implemented in a manner consistentwith <strong>the</strong> intended purpose of <strong>the</strong> action, that can be implementedconsistent with <strong>the</strong> scope of <strong>the</strong> federal agency's legal authority andjurisdiction, that is economically and technologically feasible, and that<strong>the</strong> director believes would avoid <strong>the</strong> likelihood of jeopardizing <strong>the</strong> continuedexistence of listed species or resulting in <strong>the</strong> destruction or adversemodification of critical habitat." (50 CFR 402.02.)Agencies are required by <strong>the</strong> Endangered Species Act to follow <strong>the</strong> provisions of<strong>the</strong> incidental take statement and to implement <strong>the</strong> reasonable and prudentmeasures. The act also requires agencies to avoid jeopardizing any listedspecies or causing destruction or adverse modification of critical habitat.Agencies may act on <strong>the</strong>ir own conclusions, however, about whe<strong>the</strong>r a proposedaction will have any of <strong>the</strong>se effects; <strong>the</strong>y do not have to accept <strong>the</strong>judgement of <strong>the</strong> FWS. There<strong>for</strong>e, once consultation is complete, agencies mayproceed with <strong>the</strong> action regardless of <strong>the</strong> outcome of <strong>the</strong> consultation as longas <strong>the</strong>y follow <strong>the</strong> provisions of <strong>the</strong> incidental take statement and <strong>the</strong> reasonableand prudent measures (if any).Fur<strong>the</strong>r consultation is not required except in <strong>the</strong> following situations:"Federal involvement or control over <strong>the</strong> action has been retained or isauthorized by law and:a) If <strong>the</strong> amount or extent of taking specified in <strong>the</strong> incidentaltake statement is exceeded;b) If new in<strong>for</strong>mation reveals effects of <strong>the</strong> action that mayaffect listed species or critical habitat in a manner or to anextent not previously considered;c) If <strong>the</strong> identified action is subsequently modified in a mannerthat causes an effect to <strong>the</strong> listed species that was notconsidered in <strong>the</strong> biological opinion; ord) If a new species is listed or critical habitat designated thatmay be affected by <strong>the</strong> identified action." (50 CFR 402.16)When a species has been proposed <strong>for</strong> listing or an area has been proposed <strong>for</strong>designation as critical habitat, a similar procedure, known as conference, isrequired. A conference results in an advisory report to <strong>the</strong> action agency, butdoes not provide an opinion regarding <strong>the</strong> likelihood of violation of section 7.The FWS also en<strong>for</strong>ces <strong>the</strong> Endangered Species Act's taking prohibitions andparticipates in conservation planning. Development of a conservation plan76
that satisfies <strong>the</strong> act's requirements can be <strong>the</strong> basis <strong>for</strong> issuance of incidentaltaking permits to nonfederal land managers.Prohibition against take. After <strong>the</strong> nor<strong>the</strong>rn spotted owl was listed as athreatened species, private timberland owners requested guidance from <strong>the</strong>FWS on how <strong>the</strong>y could harvest timber without violating <strong>the</strong> EndangeredSpecies Act. Since <strong>the</strong> only requirement of nonfederal entitites under <strong>the</strong>Endangered Species Act is <strong>the</strong> prohibition against take, <strong>the</strong> FWS issuedguidance on <strong>the</strong> measures needed to avoid taking owls. The FWS believes,however, that <strong>the</strong> "survey and circle" approach described in that guidance doesnot provide adequate long-term protection <strong>for</strong> <strong>the</strong> subspecies. In addition, <strong>the</strong>FWS is concerned about <strong>the</strong> substantial costs being incurred by landownersproviding <strong>the</strong>se protective measures. One of <strong>the</strong> goals of <strong>the</strong> <strong>Recovery</strong> Team isto develop more efficient ways by which landowners may provide equal orincreased protection <strong>for</strong> owls while incurring equal or lower economic costs.Some of <strong>the</strong> concerns about <strong>the</strong> take circles are described below.1. Biological concerns.- Although <strong>the</strong> take circles are a uni<strong>for</strong>m size within a province, <strong>the</strong>ircontribution to recovery is variable. They differ in <strong>the</strong> amount andquality of suitable habitat <strong>the</strong>y contain and in <strong>the</strong>ir placement across<strong>the</strong> landscape. Yet, <strong>the</strong> circles are protected equally, regardless of <strong>the</strong>iractual contribution to recovery.- Application of <strong>the</strong> take guidelines tends to encourage fragmentation ofhabitat. Landowners also have an incentive to cut habitat be<strong>for</strong>e anowl is found, reducing that habitat in <strong>the</strong> near term.- The amount of habitat in <strong>the</strong> take circles is not optimal <strong>for</strong> recovery of<strong>the</strong> species.- The spacing of <strong>the</strong> take circles is not optimal <strong>for</strong> contributing to recovery.The circles surround owls where <strong>the</strong>y are currently located and, insome cases, <strong>the</strong>y are spaced too far apart to allow <strong>for</strong> successfuldispersal among <strong>the</strong>m. Some circles overlap, creating clusters of pairshelpful in recovery, while o<strong>the</strong>r circles are isolated from <strong>the</strong> rest of <strong>the</strong>population by large expanses of unsuitable habitat.- The take prohibition works most effectively to protect habitat whereowls are most numerous, and does not effectively protect habitat, suchas linkages among federal lands, in areas which currently do notcontain owls.- Surveys conducted to comply with <strong>the</strong> take prohibition provide only aportion of <strong>the</strong> data required <strong>for</strong> monitoring owl recovery. Surveys aregenerally conducted in areas of planned timber harvests and, though<strong>the</strong> results contribute to <strong>the</strong> assessment of owl populations, <strong>the</strong>surveys provide little in<strong>for</strong>mation about habitat or population trends at<strong>the</strong> landscape level.2. Land management concerns.- Discovery of an owl <strong>for</strong>ces <strong>the</strong> creation of ano<strong>the</strong>r restricted harvestcircle, and may result in unexpected decline in income. This serves asa disincentive <strong>for</strong> landowners to survey or provide owl habitat.77
- Since landowners already face cutting restrictions within <strong>the</strong> takecircles, <strong>the</strong>y may hesitate to contribute what <strong>the</strong>y perceive to beadditional habitat toward conservation of <strong>the</strong> population.- Compliance with surveys and circles is costly and limits landowners'ability to plan timber harvest schedules.- Landowners are skeptical that a negotiated agreement to allow takeunder specified conditions will be as advantageous as simply complyingwith current take guidelines. Landowners also may perceive that<strong>the</strong> basis <strong>for</strong> a negotiated agreement is <strong>the</strong>ir current owl protectioncontribution, which <strong>the</strong>y may perceive as excessive.- Many landowners disagree with <strong>the</strong> FWS's interpretation of when takeis likely to occur. The recent administrative recision of <strong>the</strong> take guidelines<strong>for</strong> strictly procedural reasons has fur<strong>the</strong>r led to <strong>the</strong> perceptionthat <strong>the</strong> definition of take is unclear and uncertain. This hamperspredictability of owl protection and land management.- Mechanisms under <strong>the</strong> Endangered Species Act <strong>for</strong> authorizing takediffer <strong>for</strong> federal and nonfederal parties. Nonfederal landowners face amore arduous and lengthy process, which includes <strong>for</strong>mal publicreview, <strong>for</strong> receiving take authorizations than do federal landowners.Even when spotted owl circles are centered on federal land and <strong>the</strong>federal agency is given an incidental take permit <strong>for</strong> that owl,nonfederal landowners within that circle cannot receive permission toharvest until <strong>the</strong> landowners write protective management plans(under section 10 of <strong>the</strong> act) or until <strong>the</strong> FWS writes "special rules"allowing take under section 4(d).The success of <strong>the</strong> prohibition against take in contributing to recovery isvariable, and is dependent upon <strong>the</strong> province and existing conditions withinowl home ranges. It is also dependent upon <strong>the</strong> application of <strong>the</strong> take prohibitionguidelines by state regulators and <strong>the</strong> F'WS. Each state has a differentability and capacity to apply <strong>the</strong> take guidelines based on differences in <strong>the</strong>irregulatory frameworks.Habitat Conservation <strong>Plan</strong>s. The Endangered Species Act generally prohibits<strong>the</strong> "taking" of listed species. Take is defined in part as harm, harassment, orkilling individuals of <strong>the</strong> species. Destruction of <strong>the</strong> species' habitat whichultimately results in harm or harassment to <strong>the</strong> species may also constitute ataking under <strong>the</strong> act. Prior to 1982, <strong>the</strong> only activities that could be exemptedfrom <strong>the</strong> prohibition against take were scientific research, captive breeding,and similar conservation actions. In 1982, <strong>the</strong> act was amended to permittaking "if such taking is incidental to, and not <strong>the</strong> purpose of, <strong>the</strong> carrying outof an o<strong>the</strong>rwise lawful activity". In permitting such "incidental take," Congresshoped to reduce conflicts between listed species and private development andto encourage "creative partnerships" between <strong>the</strong> private sector and local,state, and federal agencies in <strong>the</strong> interest of endangered species and habitatconservation. An applicant <strong>for</strong> an incidental take permit must agree to instituteappropriate conservation measures <strong>for</strong> habitat maintenance, enhancement.and protection, described in a habitat conservation plan (HCP). TheFWS reviews <strong>the</strong> HCP and, be<strong>for</strong>e issuing a permit <strong>for</strong> <strong>the</strong> incidental take, mustfind that (1) <strong>the</strong> taking will be incidental; (2) <strong>the</strong> applicant will, to <strong>the</strong> maximumextent practicable, minimize and mitigate <strong>the</strong> impacts of such taking; (3)<strong>the</strong> applicant will ensure that adequate funding <strong>for</strong> <strong>the</strong> plan will be provided;(4) <strong>the</strong> taking will not appreciably reduce <strong>the</strong> likelihood of survival and recoveryof <strong>the</strong> species in <strong>the</strong> wild; and (5) o<strong>the</strong>r measures that FWS may require will bemet.78
5. State of Cali<strong>for</strong>niaRegulatory ProgramsForest Practices Act. The Forest Practices Act established a comprehensivesystem <strong>for</strong> <strong>the</strong> regulation and management of timberlands to assure thatproductivity is restored, enhanced, and maintained, and that <strong>the</strong> goal ofmaximum sustained production of high quality timber products is achievedwhile giving consideration to watershed, wildlife, recreational, and o<strong>the</strong>rimportant values related to <strong>for</strong>est ecosystems. The program applies to morethan 7 million acres of state and private timberlands.Rules adopted by <strong>the</strong> Cali<strong>for</strong>nia Board of Forestry implement <strong>the</strong> provisions of<strong>the</strong> Forest Practices Act and <strong>the</strong> requirements of o<strong>the</strong>r statutes, such as <strong>the</strong>Cali<strong>for</strong>nia Environmental Quality Act.The <strong>for</strong>est practices regulatory programs and review process <strong>for</strong> timber harvestplans (THP) have been certified by <strong>the</strong> Secretary of Resources as functionallyequivalent to environmental impact report and analysis under <strong>the</strong> Cali<strong>for</strong>niaEnvironmental Quality Act. Be<strong>for</strong>e timber harvesting may commence, <strong>the</strong>Department of Forestry and Fire Protection must review and approve a THPwhich discloses in<strong>for</strong>mation on <strong>the</strong> proposed timber harvest operation and itseffects on <strong>the</strong> environment. A timber harvest plan may not be approved asproposed if <strong>the</strong>re are feasible alternatives or mitigation measures available thatwould substantially lessen any significant adverse environmental impacts frornimplementation of <strong>the</strong> proposal.1. Silvicultural RequirementsA THP must indicate which selected silvicultural methods are appropriateto <strong>the</strong> site conditions to protect environmental values. The plan is subjectedto a review process that includes consultation with o<strong>the</strong>r departments,such as <strong>the</strong> Department of Fish and Game and Cali<strong>for</strong>nia WaterQuality Control Boards, and public review and comment.2. Sensitive Species Listing ProcessThe Cali<strong>for</strong>nia Board of Forestry identifies by regulation plant and animalspecies or subspecies that require special consideration in <strong>the</strong> review ofTHPs to avoid damage to <strong>the</strong>ir habitat areas. The process is similar to <strong>the</strong>listing process specified under <strong>the</strong> Cali<strong>for</strong>nia Endangered Species Act.The state <strong>for</strong>estry board regulations include specific requirements <strong>for</strong>protecting <strong>the</strong>se species. The nor<strong>the</strong>rn spotted owl is among <strong>the</strong> species<strong>for</strong> which <strong>the</strong>se requirements apply.3. Water Course and Lake Protection ZonesThe water course and lake protection rules ensure protection of <strong>the</strong> waterquality, beneficial uses, and biological characteristics of watercourses andlakes within timberlands. Within fixed protection zones timber operatorsare restricted or constrained (e.g., by prohibition of clear-cutting and limitson road building) to prevent discharge of materials and erosion in andaround watercourses and lakes.79
4. Cumulative Effects AssessmentThe preparation of a THP must include an assessment of potentiallysignificant cumulative impacts from <strong>the</strong> proposed timber harvest operation<strong>for</strong> a number of environmental variables. The assessment process mustindicate whe<strong>the</strong>r <strong>the</strong> proposal, when considered with <strong>the</strong> impacts of pastprojects and reasonably <strong>for</strong>eseeable future projects, would result in significantadverse environmental impacts.Evaluation of cumulative effects on biological resources includes identifyingresources of concern, such as threatened and endangered species,sensitive species, important wildlife resources such as game animals, andspecific components of wildlife habitat.Mitigation measures and o<strong>the</strong>r protection are included in THPs as neededto avoid, reduce, or offset significant adverse cumulative effects. Directand indirect effects resulting from <strong>the</strong> proposed action must be addressed.While <strong>the</strong> rule does not contain specific mitigation requirements, it doesprovide an analytical basis <strong>for</strong> requiring site-by-site protection if needed.Evaluating potential timber harvesting impacts to nor<strong>the</strong>rn spotted owls in<strong>the</strong> analysis of cumulative effects provides several benefits <strong>for</strong> owl conservation:1) <strong>the</strong> impacts of a proposed timber operation are assessed in <strong>the</strong>context of past, present, and future projects in <strong>the</strong> same area; 2) impactsare assessed on broader temporal and spatial scales than those addressedby individual THPs and an assessment limited to direct impacts; and 3) <strong>the</strong>assessment process tailors <strong>the</strong> analysis to fit unique conditions of owlpopulations and habitat, in<strong>for</strong>mation availability, and perceived thresholdof impacts.5. Specific Nor<strong>the</strong>rn <strong>Spotted</strong> <strong>Owl</strong> RulesThe state <strong>for</strong>estry board has adopted specific rules <strong>for</strong> <strong>the</strong> protection andconservation of <strong>the</strong> nor<strong>the</strong>rn spotted owl (emergency rules in August 1990:permanent rules in February 1991), which are designed to prevent take ofnor<strong>the</strong>rn spotted owls. Approval of any harvest plan that would causesignificant long-term damage to <strong>the</strong> owl must be withheld. O<strong>the</strong>r rulesrequire a THP to provide specific in<strong>for</strong>mation about owl habitat and owlswithin <strong>the</strong> proposed harvest area and adjacent areas. The Cali<strong>for</strong>niaDepartment of Forestry and Fire Protection and <strong>the</strong> Cali<strong>for</strong>nia Departmentof Fish and Game have developed a procedure whereby plans are reviewedand a determination is made whe<strong>the</strong>r <strong>the</strong> plan will result in a take. Thisprocess has <strong>the</strong> concurrence of <strong>the</strong> FWS.6. Nonindustrial Timber Management <strong>Plan</strong>As an alternative to THP review, <strong>the</strong> state <strong>for</strong>estry board has adopted rulesto permit nonindustrial <strong>for</strong>estland owners holding less than 2,500 acres tosubmit long-term management and harvesting plans. The plans arerequired to prescribe uneven-age management of <strong>the</strong> <strong>for</strong>estland. Theowner must submit management in<strong>for</strong>mation regarding silviculturalmethods, harvest scheduling, existing and future stand conditions, ando<strong>the</strong>r pertinent in<strong>for</strong>mation. Using this option, spotted owl conservationneeds can be integrated with timber harvesting and management ofnonindustrial timberlands.80Cali<strong>for</strong>nia Environmental quality Act (CEQA). The CEQA is similar to <strong>the</strong>National Environmental Policy Act; be<strong>for</strong>e state or local agencies may approve
or undertake any project that may result in significant environmental impacts.<strong>the</strong>y must review and disclose <strong>the</strong> potential impacts, adopt feasible mitigationmeasures, and adopt findings regarding <strong>the</strong> impacts of <strong>the</strong> proposed project.Cali<strong>for</strong>nia Endangered Species Act. The Cali<strong>for</strong>nia Endangered Species Actof 1984 established a process whereby <strong>the</strong> public or <strong>the</strong> Department of Fishand Game may submit a petition to <strong>the</strong> Fish and Game Commission with arecommendation to list (or delist) as threatened or endangered, any nativespecies or subspecies of plant or animal.If a species is considered a candidate <strong>for</strong> listing, restrictions on import, export,take, possession, purchase, or sale go into effect. If <strong>the</strong> species is listed,additional restrictions regarding jeopardy, consultation with Cali<strong>for</strong>nia leadagencies, required mitigation measures and commitment to conservation,protection, and enhancement go into effect. The nor<strong>the</strong>rn spotted owl is notcurrently listed as a threatened or endangered species under this act.Land ManagementState Parks. Lands within state parks are administered by <strong>the</strong> Cali<strong>for</strong>niaDepartment of Parks and Recreation to protect and perpetuate natural resourcesystems and values. Commercial resource development, includingtimber harvesting, is not permitted in state park units. There are 27 state parksystem units in <strong>the</strong> nor<strong>the</strong>rn coastal portions of <strong>the</strong> owl's range. Eighteen of<strong>the</strong> units are known to support at least one owl territory. The Department ofParks and Recreation is participating in <strong>the</strong> Cali<strong>for</strong>nia habitat conservationplan ef<strong>for</strong>ts <strong>for</strong> <strong>the</strong> nor<strong>the</strong>rn spotted owl.State Forests. The Cali<strong>for</strong>nia Department of Forestry and Fire Protectionadministers <strong>the</strong> state <strong>for</strong>est system in accordance with a management planapproved by <strong>the</strong> state <strong>for</strong>estry board. The Jackson Demonstration State Forestis within <strong>the</strong> range of <strong>the</strong> nor<strong>the</strong>rn spotted owl. It encompasses 50,000 acresthat are used <strong>for</strong> demonstration and research experiments addressing fish andwildlife conservation needs, watershed protection measures, recreational usesand commercial timber harvesting. The state <strong>for</strong>est is completing a spotted owland small mammal survey. Harvesting operations fall under <strong>the</strong> Forest PracticesAct and must comply with all <strong>for</strong>est practices rules, including thoseprescribing protection <strong>for</strong> nor<strong>the</strong>rn spotted owls under that act.Protectionfrom Fire. The Cali<strong>for</strong>nia Department of Forestry and Fire Protectionhas primary responsibility <strong>for</strong> fire prevention and protection <strong>for</strong> <strong>the</strong> 32million acres of state-responsibility lands. The department is respondingaggressively to growing fire risks associated with prolonged drought and <strong>the</strong>movement of a significantly larger number of people to rural Cali<strong>for</strong>nia. Thedepartment is particularly aware of <strong>the</strong> need to reduce <strong>the</strong> risk of large, catastrophicfires, such as those likely to affect conservation measures <strong>for</strong> <strong>the</strong>nor<strong>the</strong>rn spotted owl.Forestry Assistance. A number of <strong>for</strong>estry assistance programs <strong>for</strong> privatelandowners is coordinated through <strong>the</strong> Department of Forestry and FireProtection, including <strong>the</strong> Cali<strong>for</strong>nia Forest Improvement Program and <strong>the</strong>Federal Forest Improvement Program. These programs share costs of treeplanting and <strong>for</strong>est management on nonindustrial <strong>for</strong>estland ownerships.These programs benefit <strong>the</strong> nor<strong>the</strong>rn spotted owl by providing ano<strong>the</strong>r meansof establishing habitat over time on lands that might o<strong>the</strong>rwise not be restoredor might be converted to non<strong>for</strong>est uses.81
Assessment, <strong>Plan</strong>ning, and MonitoringTimberland Task Force. The Timberland Task Force was established inJanuary 1990, pursuant to legislative direction (Assembly Bill 1580) to developa long-term, more comprehensive, process <strong>for</strong> addressing wildlife issues in <strong>the</strong>context of <strong>for</strong>estland management. The Timberland Task Force is charged withdeveloping a coordinated base of scientific in<strong>for</strong>mation <strong>for</strong> analyzing cumulativeimpacts on <strong>the</strong> biological diversity of <strong>for</strong>estland ecosystems, evaluating timberlandhabitat <strong>for</strong> its contribution to <strong>the</strong> overall maintenance of specific wildlifespecies, contracting <strong>for</strong> studies to validate wildlife models and develop mitigation,and identifying critical habitat areas and species of special status. Thetask <strong>for</strong>ce includes representatives from state and federal agencies.The task <strong>for</strong>ce will report its recommendations to <strong>the</strong> governor and Cali<strong>for</strong>nialegislature in 1992. The coordinated database will be used in reviewing individualtimber harvest plans with regard to <strong>the</strong>ir cumulative impacts on wildlife.The database will include geographic in<strong>for</strong>mation system (GIS) analysis ofvegetation and habitat on <strong>for</strong>estlands (a pilot vegetation/habitat mappingproject covering approximately 6 million acres within <strong>the</strong> range of <strong>the</strong> nor<strong>the</strong>rnspotted owl will be completed in early 1992) and linkage with <strong>the</strong> state'sWildlife Habitat Relationships Database (WHR) to relate vegetation growth andyield models to possible land management options.Developing from <strong>the</strong> initial work of <strong>the</strong> Timberland Task Force, a memorandumof understanding establishing an executive council to set guiding principlesand policies regarding statewide ef<strong>for</strong>ts to conserve biological diversity wassigned on September 19, 1991. This memorandum will provide <strong>the</strong> long-termframework <strong>for</strong> developing a statewide strategy to conserve biological diversityand coordinate implementation through regional and local institutions.The Statewide Executive Council, chaired by <strong>the</strong> Resources Agency Secretaryand consisting of state and federal agencies, will set statewide goals <strong>for</strong> <strong>the</strong>protection of biological diversity, and will encourage and assist <strong>the</strong> establishmentof bioregional councils to achieve protection of biological diversity. Underthis umbrella, a Klamath bioregion project addressing <strong>the</strong> range of <strong>the</strong> nor<strong>the</strong>rnspotted owl in Cali<strong>for</strong>nia is developing, and will build on <strong>the</strong> state habitatconservation plan.Habitat Conservation <strong>Plan</strong>s. The Cali<strong>for</strong>nia Board of Forestry and FireProtection initiated <strong>the</strong> state's habitat conservation planning (HCP) <strong>for</strong> <strong>the</strong>nor<strong>the</strong>rn spotted owl in November 1990, anticipating a future application <strong>for</strong>an incidental take permit under <strong>the</strong> federal Endangered Species Act. Thisef<strong>for</strong>t is in addition to <strong>the</strong> adoption of rules to ensure that timber harvesting onstate and private lands in Cali<strong>for</strong>nia would not result in a take of nor<strong>the</strong>rnspotted owls.The HCP and <strong>the</strong> associated environmental impact report/environmentalimpact statement are being developed under <strong>the</strong> guidance of a broadly basedsteering committee appointed by <strong>the</strong> state <strong>for</strong>estry board.The steering committee operates under a set of objectives intended to promotedevelopment of a plan that fully meets <strong>the</strong> requirements of <strong>the</strong> federal EndangeredSpecies Act while also limiting effects on private landowners and economicimpacts.The steering committee and a scientific committee currently are evaluatingeight options, which resulted from extensive public scoping ef<strong>for</strong>ts and repre-82
6. State of Oregonsent a range of levels of protection <strong>for</strong> <strong>the</strong> owl. The alternatives have beendeveloped with <strong>the</strong> assumption that a comprehensive owl conservation strategy,such as <strong>the</strong> ISC proposal, would be implemented on federal lands. A draftHCP and associated environmental review documents are expected to beavailable <strong>for</strong> public review by May 1992.Forest and Rangeland Resources Assessment Program. The Forest andRangeland Resources Assessment Program (FRRAP) was established in 1978.The charge of <strong>the</strong> program is to describe and analyze <strong>the</strong> current conditions ofCali<strong>for</strong>nia's <strong>for</strong>est and range resources base and to anticipate emerging managementproblems that require public or private action. The FRRAP is involvedin a number of ef<strong>for</strong>ts related to spotted owl conservation, including long-termmonitoring of <strong>for</strong>estland condition through periodic mapping; development of astatewide geographic in<strong>for</strong>mation system <strong>for</strong> assessing impacts, uses, andtrends; development and use of long-term timber harvest simulators that alsotrack impacts on wildlife habitat; and economic impact estimation. The FRRAPprovides primary staff to <strong>the</strong> Timberland Task Force and HCP ef<strong>for</strong>ts.Cali<strong>for</strong>nia Natural Diversity Data Base. The Department of Fish and Gamemaintains <strong>the</strong> Cali<strong>for</strong>nia Natural Diversity Data Base, a computerized inventoryof <strong>the</strong> locations and condition of endangered, threatened, and rare animaland plant taxa, as well as significant terrestrial and aquatic plant communitieswhich was developed in cooperation with The Nature Conservancy. Projectproponents and agencies consult <strong>the</strong> data base during project developmentand during <strong>the</strong> environmental review of various land management activitiesunder <strong>the</strong> provisions of CEQA. Detailed nor<strong>the</strong>rn spotted owl sighting in<strong>for</strong>mationis maintained in an associated data base that is accessed on a "need toknow" basis.Natural Community Conservation <strong>Plan</strong>ning. Recent Cali<strong>for</strong>nia legislationhas established <strong>the</strong> natural community conservation planning (NCCP) processto meet <strong>the</strong> needs of threatened and endangered species and to provide protection<strong>for</strong> significant areas that support natural ecosystems and biologicaldiversity. A memorandum of understanding signed on December 4, 1991,between <strong>the</strong> FWS and <strong>the</strong> State of Cali<strong>for</strong>nia (Resources Agency and Departmentof Fish and Game) provides <strong>for</strong> sharing data and cooperatively developingan NCCP pilot program in sou<strong>the</strong>rn Cali<strong>for</strong>nia.Oregon has regulatory programs, technical assistance programs, land managementobjectives, and research that are aimed at conservation ef<strong>for</strong>ts <strong>for</strong> <strong>the</strong>nor<strong>the</strong>rn spotted owl.Regulatory ProgramsForest Practices. The Forest Practices Act (FPA) was enacted to assure <strong>the</strong>continuous growing and harvesting of <strong>for</strong>est tree species while protecting soil,air, wildlife, and water resources on 10.1 million acres of private, state, andcounty <strong>for</strong>estlands. It regulates commercial <strong>for</strong>est operations to ensure <strong>for</strong>estpractices that maintain and enhance <strong>the</strong> benefits of all <strong>for</strong>est resources.Under <strong>the</strong> FPA, threatened and endangered fish and wildlife species are inventoried.This resource inventory will be used to in<strong>for</strong>m <strong>for</strong>est landowners of <strong>the</strong>ir obligationto protect <strong>the</strong> owl; fur<strong>the</strong>rmore, it may help local government protect some naturalresource sites in compliance with Oregon's land use laws.83
<strong>Spotted</strong> owl nesting sites and activity centers are protected under <strong>the</strong> FPArules. Proposed and ongoing <strong>for</strong>est operations within 1 mile of a spotted owlnest site or activity center must obtain approval of a written plan from <strong>the</strong>Oregon Department of Forestry be<strong>for</strong>e proceeding. Harvest operations mustleave a core area comprising 70 acres of <strong>the</strong> best available habitat in <strong>the</strong>vicinity of a nest site. The Oregon Department of Fish and Wildlife (ODFW)provides site-specific assessment and advice to landowners when owl sites areidentified on nonfederal lands. Overall, <strong>for</strong>est practices that would significantlyreduce suitable habitat in <strong>the</strong> core area are not allowed. Forest practices thatwould disturb owl nesting behavior and possibly result in nest failure must notbe carried out during <strong>the</strong> breeding season. In addition to complying with <strong>the</strong>provisions of <strong>the</strong> FPA, landowners also must comply with <strong>the</strong> federal EndangeredSpecies Act.Oregon Endangered Species Act. The nor<strong>the</strong>rn spotted owl is listed as athreatened species under Oregon's Endangered Species Act. This act authorizes<strong>the</strong> Oregon Fish and Wildlife Commission to conduct research, census,law en<strong>for</strong>cement, propagation, transplantation, and habitat acquisition andmaintenance <strong>for</strong> listed species. Agencies must consult with <strong>the</strong> ODFW be<strong>for</strong>etaking any action that may harm owls on state-owned lands.Statewide Land-Use <strong>Plan</strong>ning Program. The State of Oregon has anextensive program <strong>for</strong> land use planning. While it is not <strong>the</strong> first or onlystatewide planning ef<strong>for</strong>t, it is one of <strong>the</strong> most comprehensive. The programhas many aims and objectives, but <strong>the</strong> most important ones relating to protectionof threatened and endangered species are contained in Goal 4 (ForestLands) and Goal 5 (Open Spaces, Scenic and Historic Areas, and NaturalResources) of <strong>the</strong> program.Land ManagementDepartment of Forest Land Management. The Oregon Department ofForestry is responsible <strong>for</strong> <strong>the</strong> management of nearly 786,000 acres of <strong>for</strong>estlandto secure <strong>the</strong> greatest permanent value to <strong>the</strong> state. Production of timberon a sustained-yield basis is established as <strong>the</strong> primary goal, but due considerationmust be given to all o<strong>the</strong>r appropriate uses of <strong>the</strong> land.Of <strong>the</strong> 786,000 acres managed, 654,000 acres are Oregon Board of Forestrylands (county trust lands) and 132,000 are Common School lands. Aside fromtimber harvesting, <strong>the</strong> state <strong>for</strong>ester is authorized to permit o<strong>the</strong>r <strong>for</strong>est usessuch as recreation, watersheds, and fish and wildlife conservation. Thoselands which, in <strong>the</strong> opinion of <strong>the</strong> state <strong>for</strong>ester, have exceptional scenicand/or fish or wildlife habitat values, and on which commercial <strong>for</strong>est managementwould significantly degrade those values, are classified as 'conservancy."Twenty-six thousand acres of Oregon <strong>for</strong>estland are classified as conservancyand reserved from timber management. Ano<strong>the</strong>r 24,000 acres of state <strong>for</strong>estlandare classified as noncommercial (not capable of sustaining timber harvesting)and also are withdrawn from timber harvesting.84Land Acquisition, Sale, and Exchange. The Oregon Board of Forestryacquired title to lands during <strong>the</strong> 1930s and 1940s from counties that had<strong>for</strong>eclosed on <strong>the</strong> lands <strong>for</strong> nonpayment of taxes. There is an implicit trustarrangement with <strong>the</strong> counties requiring payment to <strong>the</strong> counties of a share of<strong>the</strong> revenues generated by <strong>the</strong> land-management activities conducted on <strong>the</strong>selands. More than two-thirds of <strong>the</strong>se lands are in <strong>the</strong> Tillamook State Forest.located primarily in Clatsop and Tillamook Counties. The county court or boardof county commissioners of any county in which such land is situated also mustapprove exchanges; only after this approval may <strong>the</strong> exchange be consummated.
ResearchUnder Oregon law, <strong>the</strong> primary objectives <strong>for</strong> managing Oregon Board ofForestry lands are to 1) generate revenue <strong>for</strong> county governments and localtaxing districts; 2) make raw materials available on a sustained-yield basis tohelp meet demands <strong>for</strong> <strong>for</strong>est products; 3) obtain <strong>the</strong> greatest permanent value<strong>for</strong> Oregon: 4) provide community stability; 5) encourage efficiency in harvestingand processing: 6) encourage full economic utilization of <strong>the</strong> <strong>for</strong>est resource;and 7) provide employment.The State Land Board holds title to <strong>the</strong> Common School lands. About twothirdsof <strong>the</strong> acreage are located within <strong>the</strong> Elliot State Forest in Coos andDouglas Counties, with <strong>the</strong> <strong>the</strong> balance scattered in 30 o<strong>the</strong>r counties. Thestate <strong>for</strong>ester manages <strong>the</strong> Common School lands under a contract with <strong>the</strong>State Land Board. The primary objective <strong>for</strong> <strong>the</strong> management of <strong>the</strong>se lands isto generate income <strong>for</strong> <strong>the</strong> Common School Fund consistent with sound landand timber management practices. The State Land Board and <strong>the</strong> OregonBoard of Forestry each are required separately to approve exchanges byresolution.Forestry Assistance. This program helps Oregon's private <strong>for</strong>est landownersmeet <strong>the</strong>ir resource management objectives. This includes increasing <strong>for</strong>estgrowth and harvest potential to help ensure future supplies of timber ando<strong>the</strong>r <strong>for</strong>est products, promoting <strong>for</strong>est health, and enhancing and protectingfish and wildlife, soil, air, water, recreation, and aes<strong>the</strong>tics. Technical adviceon applying <strong>the</strong> principles of integrated pest management, minimizing diseasemortality and growth loss, <strong>for</strong>est management, and wildlife enhancement isprovided upon request to private <strong>for</strong>est landowners.O<strong>the</strong>r Public Forestlands. Oregon's state parks include 74,000 acres of<strong>for</strong>estland withdrawn from timber production. Some of Oregon's parks,including Silver Falls and Saddle Mountain State Parks, provide suitablehabitat <strong>for</strong> nor<strong>the</strong>rn spotted owls. Several of <strong>the</strong> coastal state parks adjacentto federal lands may provide additional habitat.The ODFW owns 30,000 acres of <strong>for</strong>estland devoted to producing wildlifehabitat. County and municipal governments also have withdrawn 36,000acres of <strong>the</strong>ir 146,000-acre timberland base.Wild and Scenic Rivers. The federal Wild and Scenic Rivers Act designated40 rivers in Oregon <strong>for</strong> inclusion in this system. Additional segments of <strong>the</strong>seand o<strong>the</strong>r rivers are protected by <strong>the</strong> Oregon Scenic Waterways Act, administeredby <strong>the</strong> Oregon Parks and Recreation Department. The Oregon ScenicWaterways Act protects <strong>the</strong> character of <strong>the</strong> rivers <strong>for</strong> fish, wildlife, and recreation.Governor's Watershed Enhancement Board. The Governor's WatershedEnhancement Board provides technical assistance and grants <strong>for</strong> projects thatfocus on improvements to streams and upland areas of watersheds. Theseimprovements, such as <strong>the</strong> enhancement of riparian areas, also may providesome owl habitat.Oregon Department of Fish and Wildlife is engaged in a project to assess<strong>the</strong> viability of nor<strong>the</strong>rn spotted owl pairs on state-owned lands. Researchersare banding owls to track <strong>the</strong>m over time. The focus of <strong>the</strong> study is spotted owlturnover and reproductive rates.85
Coastal Oregon Productivity Enhancement (COPE) Program is a cooperativeresearch ef<strong>for</strong>t among several groups, including <strong>the</strong> Forest Service's PacificNorthwest Experiment Station and <strong>the</strong> College of Forestry at Oregon StateUniversity. Among <strong>the</strong> goals of <strong>the</strong> COPE program are conducting large-scaleoperational testing of <strong>for</strong>est management strategies, developing methods toassess <strong>the</strong> effect of various riparian and re<strong>for</strong>estation management systems onwater, timber, and wildlife, and making scientific in<strong>for</strong>mation more accessibleto <strong>for</strong>est managers in <strong>the</strong> region. The COPE program currently has proposalsto study several nontraditional silvicultural methods <strong>for</strong> simultaneouslyproducing timber and wildlife values.Oregon State University's College of Forestry's research <strong>for</strong>est is being usedby a group of researchers to conduct a study entitled New Perspectives<strong>for</strong>Management of Timber and Mature-Forest Wildlife in Douglas-fir Forests. Researchersare examining different silvicultural systems that might enable<strong>for</strong>esters to manipulate stands to produce <strong>the</strong> kind of habitat needed byinterior-<strong>for</strong>est species like <strong>the</strong> spotted owl.7. State of WashingtonExisting programs in Washington contributing to or having <strong>the</strong> potential tocontribute to owl conservation include <strong>for</strong>est practices and land use regulations,management of state-owned lands, land acquisition, research, andvarious landowner assistance or incentive programs. In <strong>the</strong> past 2 years,considerable ef<strong>for</strong>ts have been made that have benefitted spotted owls throughadministration of <strong>for</strong>est practices regulations and cooperative planning <strong>for</strong>certain state-owned lands.Regulatory ProgramsState Forest Practices Act and Regulations. The Forest Practices Act andits implementing regulations are intended to af<strong>for</strong>d protection to <strong>for</strong>est soils,fisheries, wildlife, water quantity and quality, air quality, recreation, and scenicbeauty, coincident with maintenance of a viable <strong>for</strong>est products industry. Theregulations, administered by <strong>the</strong> regulatory branch of <strong>the</strong> Department ofNatural Resources, apply to 12 million acres of state and private land.Timber harvest, road construction, and chemical spray on "lands known tocontain a breeding pair or <strong>the</strong> nest or breeding grounds" of a federally listedspecies, or within <strong>the</strong> federally designated critical habitat of such species aresubject to review under <strong>the</strong> State Environmental Policy Act (SEPA). "Landsknown to contain" currently is interpreted to include all occupied suitablehabitat subject to federal prohibitions on taking.SEPA review entails in<strong>for</strong>mation ga<strong>the</strong>ring, including owl surveys, and findingsas to significant adverse environmental impacts. Surveying protocols andinterpretation of results are provided by <strong>the</strong> Washington Department of Wildlife,which also maintains a data base documenting locations of all known owlsites in Washington.Substantive <strong>for</strong>est practice permit decisions under SEPA require a balancebetween avoiding or mitigating identified adverse impacts and maintaining aviable <strong>for</strong>est products industry. There<strong>for</strong>e, while state permit decisions currentlyreflect <strong>the</strong> biological thinking that was embodied in take guidelinesadopted by <strong>the</strong> FWS, decisions may diverge from those guidelines in somerespects. Never<strong>the</strong>less, state permittees are not relieved of any responsibilities86
<strong>the</strong>y may have under federal law. Several hundred permit applications wereaffected in some way during 1990 by Washington regulatory requirementsrelated to <strong>the</strong> nor<strong>the</strong>rn spotted owl. The regulations also provide protection tonontimber resources, including wildlife habitat, within designated riparianareas.Washington Environmental Policy Act. This law is similar to <strong>the</strong> NationalEnvironmental Policy Act. Implementing regulations require environmentalanalysis and public review, and set substantive environmental goals <strong>for</strong> allagencies.Local Zoning and Land Use Control. Local government permits are required<strong>for</strong> land use conversion, clearing and grading, and building construction.Permits generally are subject to SEPA analysis.Wildlife Laws. Pursuant to Washington's wildlife laws, <strong>the</strong> state WildlifeCommission may by rule designate a species of wildlife as endangered. Huntingof or trafficking in endangered wildlife species is prohibited. The nor<strong>the</strong>rnspotted owl is listed as endangered under Washington law.Land ManagementState Lands-Federally Granted Trusts. These lands were granted toWashington by <strong>the</strong> federal government to be managed in trust <strong>for</strong> <strong>the</strong> financialbenefit of schools and o<strong>the</strong>r legally designated beneficiaries. About 1.3 millionacres of <strong>for</strong>estland are currently in this ownership. Common law requires <strong>the</strong>state, acting through <strong>the</strong> Department of Natural Resources, to exercise <strong>the</strong>same prudence a private person would exercise in managing his or her ownland. Case law requires undivided loyalty to <strong>the</strong> trust beneficiaries. Forestedtrust lands are managed on a sustained-yield basis. Trust lands are subject to<strong>the</strong> same regulatory requirements as those of o<strong>the</strong>r landowners. Beyondregulatory requirements, wildlife habitat objectives are incorporated intomanagement, consistent with trust requirements.State Lands-Forest Board. State statute created this state ownership ofapproximately 620,000 acres. These lands, mostly second-growth, are dedicatedto perpetuate <strong>the</strong> <strong>for</strong>est resource. Revenues from management benefitcounty junior taxing districts and <strong>the</strong> state general fund. Case law indicatesthat <strong>the</strong> state has a trust relationship to county beneficiaries.Commission on Old-Growth Alternatives. In June 1989, this broad-basedcitizens' commission made consensus recommendations to <strong>the</strong> Department ofNatural Resources on management of old-growth <strong>for</strong>est on state lands on <strong>the</strong>western Olympic Peninsula. Recommendations included a 15-year harvestdeferral on 15,000 acres of <strong>the</strong> most critical owl habitat, acquisition from <strong>the</strong>trusts of 3,000 acres of land with high ecological value, creation of a 260,000-acre experimental <strong>for</strong>est and a <strong>for</strong>est research center, and calculation of asustained-yield level <strong>for</strong> <strong>the</strong>se lands distinct from o<strong>the</strong>r state lands. Theseproposals are in various stages of consideration and implementation.Industrial Lands. This is <strong>the</strong> largest nonfederal <strong>for</strong>estland ownership categoryin Washington, responsible <strong>for</strong> more than half of <strong>the</strong> total state timbersupply in recent years. Although managed to provide economic returns,industrial lands are subject to <strong>the</strong> state <strong>for</strong>est practices regulations describedearlier. In some cases, relatively large contiguous ownership blocks areconducive to effective voluntary management <strong>for</strong> some nontimber values,87
including wildlife. In o<strong>the</strong>r cases, scattered or checkerboard ownership withfederal lands complicates management.Nonindustrial Private. Nonindustrial lands comprise almost a quarter of <strong>the</strong><strong>for</strong>estland ownership in Washington. These lands may or may not be managedprimarily <strong>for</strong> timber. Because of <strong>the</strong>ir location close to human populations,management of <strong>the</strong>se lands has important effects on supply of nontimbervalues. However, due to <strong>the</strong>ir small size and generally young timber, opportunities<strong>for</strong> management of <strong>the</strong>se lands to promote owl conservation are limited.Land AcquisitionWashington Wildlife and Recreation Coalition. Created in 1988 as acoalition of citizen groups, this organization lobbies <strong>the</strong> state legislature <strong>for</strong>funds to bring high priority habitat and park lands into public ownership. Todate, $113 million have been appropriated <strong>for</strong> <strong>the</strong>se purposes.Trust Land Purchase Program. In 1989-90, <strong>the</strong> Washington legislatureappropriated approximately $150 million in state general funds to purchaseenvironmentally sensitive state trust lands. When completed, <strong>the</strong>se purchaseswill bring about 60,000 acres into conservancy management. The value of <strong>the</strong>timber (usually about 90 percent) goes to <strong>the</strong> same trust accounts as doestimber sale revenue. The land value goes to purchase replacement trust lands.O<strong>the</strong>r Preserved Lands. Several hundred thousand acres of state lands aremanaged in a preserve status as natural area preserves, state parks, wildlifeareas, and under related designations. Periodically additional lands are addedto <strong>the</strong>se categories. Some of <strong>the</strong>se lands may contribute to owl habitat, but <strong>for</strong><strong>the</strong> most part, <strong>the</strong>y are of small individual size.Assistance ProgramsWashington provides a number of programs of technical and financial assistanceto small-acreage <strong>for</strong>est landowners to encourage improved managementof lands <strong>for</strong> a variety of objectives, including timber supply, watershed protection,and wildlife habitat. In <strong>the</strong> future, additional funds are expected to beavailable to address a broader range of resource objectives.Incentive ProgramsResearchSeveral programs of state and local government currently provide a variety oftax and o<strong>the</strong>r incentives <strong>for</strong> land management that promote open space,farmland preservation, and o<strong>the</strong>r resource objectives. These programs maycontribute incidentally to owl conservation, but would need expansion anddirection to make more substantive and intentional contributions.The Department of Natural Resources and <strong>the</strong> Department of Wildlife conductand participate in research programs concerned with <strong>the</strong> spotted owl. For <strong>the</strong>most part, <strong>the</strong>se research programs are funded and led by federal resourceagencies.88
8. Indian LandIndian reservation lands have been set aside <strong>for</strong> <strong>the</strong> exclusive use and benefitof Indian people pursuant to treaties, statutes, and executive orders. Inaddition, Indians retain treaty-secured cultural, economic, and hunting andfishing rights within lands ceded to <strong>the</strong> United States. Indian Reservationlands are held in trust by <strong>the</strong> United States, with <strong>the</strong> Secretary of <strong>the</strong> Interiorhaving <strong>the</strong> principal responsibility <strong>for</strong> maintaining that trust. Each reservationis governed by a sovereign tribal government. Tribal governments have among<strong>the</strong>ir many sovereign powers <strong>the</strong> right to regulate <strong>the</strong> uses of land and resourceswithin <strong>the</strong>ir reservation boundaries, including <strong>the</strong> use and managementof fisheries and wildlife resources and habitat.Indian people revere all lands, <strong>for</strong>ests, and wildlife. They have managed <strong>the</strong>irlands prudently <strong>for</strong> centuries. They recognize <strong>the</strong> environmental, cultural, andspiritual values of those lands, as well as <strong>the</strong> economic values and <strong>the</strong> importanceof appropriate <strong>for</strong>estland management to wildlife. They have taken andwill continue to take measures to protect reservation wildlife populations,including <strong>the</strong> spotted owl. Given this historical perspective, <strong>the</strong> Tribes arevoluntarily managing portions of <strong>the</strong>ir reservation trust lands in a mannerconsistent with <strong>the</strong> nor<strong>the</strong>rn spotted owl recovery ef<strong>for</strong>t. These voluntarycontributions are made because <strong>the</strong> protection of all species - includingspotted owls - is ingrained in Indian culture.Within <strong>the</strong> range of <strong>the</strong> nor<strong>the</strong>rn spotted owl, <strong>the</strong>re are six Indian reservationsthat contain nor<strong>the</strong>rn spotted owl activity centers: <strong>the</strong> Yakima Indian Reservation,located in <strong>the</strong> eastern Washington Cascades province: <strong>the</strong> QuinaultIndian Reservation, located in <strong>the</strong> Washington's Olympic Peninsula province:<strong>the</strong> Warm Springs Indian Reservation, located in <strong>the</strong> eastern Oregon Cascadesprovince; <strong>the</strong> Grand Ronde Indian Reservation, located in <strong>the</strong> Oregon Coastprovince; <strong>the</strong> Hoopa Valley Indian Reservation, located in <strong>the</strong> Klamath provinceof Cali<strong>for</strong>nia and <strong>the</strong> Round Valley Indian Reservation located in <strong>the</strong> Cali<strong>for</strong>niaCoast province. The following accounts of contributions to owl recovery wereprovided by <strong>the</strong> respective Tribes.Yakima Indian Reservation, WashingtonTimber harvests on <strong>the</strong> Yakima Indian Reservation are done almost exclusivelyunder uneven-aged management prescriptions. This reduces impacts tosuitable owl habitat while allowing harvesting to proceed. The reservationcontains approximately 500,000 acres of <strong>for</strong>ested habitat, of which about 50percent (250,000 acres) currently is classified as suitable owl habitat. Typically,<strong>the</strong> nor<strong>the</strong>rn spotted owl habitat on <strong>the</strong> Yakima Indian Reservation lieswithin a band approximately 30 miles (north to south) by 25 miles wide. Thisband starts near <strong>the</strong> Cascade crest at elevations below 5,000 feet and extendseast until it reaches pure ponderosa pine timber stands. Within that habitat<strong>the</strong>re is an existing block of 60,000 acres of prime suitable habitat that is inTribally designated reserve status. To date only about 25 percent of <strong>the</strong> totalsuitable habitat and less than 5 percent of <strong>the</strong> reserved area habitat have beensurveyed <strong>for</strong> owls. Twenty-four activity centers have been located during 1989-1991 owl surveys. At a minimum <strong>the</strong> tribal biologists estimate a total of atleast 50 nesting sites will be found when surveys of all owl habitat have beencompleted.The Yakima Indian Nation has a large, effective, fisheries and wildlife staff thatreviews all on-reservation activities that may have environmental impacts.89
Currently, <strong>the</strong> Yakima Indian Nation employs 14 full-time biologists andwildlife technicians on nor<strong>the</strong>rn spotted owl inventory, monitoring, and habitatutilization studies. Data from <strong>the</strong>se studies will yield valuable insights into <strong>the</strong>compatibility of uneven-aged <strong>for</strong>est management techniques in maintainingspotted owl habitat suitability.Quinault Indian Reservation, WashingtonUnder <strong>the</strong> Indian Allotment Act <strong>the</strong> 208,000-acre reservation was allotted toindividual Indians in 40- and 80-acre parcels. In order to obtain quick cashmany of <strong>the</strong> allottees ei<strong>the</strong>r obtained fee patents and sold <strong>the</strong> land to non-Indian timber interests or demanded that <strong>the</strong>ir timber be harvested at anaccelerated rate. By 1987 <strong>the</strong> Quinault Indian Nation owned less than 15,000acres of its 208,000-acre reservation. By 1991 this ownership had increased tonearly 54,000 acres. The Nation's aggressive reacquisition of its reservationwas enhanced by <strong>the</strong> passage of Public Law 100-638. This law returned aportion of <strong>the</strong> nor<strong>the</strong>rn boundary of <strong>the</strong> reservation to <strong>the</strong> Nation because of aprevious survey error (12,000 acres of actual ownership and 5,400 acres along<strong>the</strong> eastern boundary of <strong>the</strong> reservation in which 45 percent of <strong>the</strong> revenuesare pledged to <strong>the</strong> Nation). A prime stipulation in P.L. 100-638 was thatrevenues generated from <strong>the</strong> harvest of timber from <strong>the</strong> north boundary areamust be used by <strong>the</strong> Nation <strong>for</strong> consolidating land ownership within <strong>the</strong>Quinault Reservation. This Act is proving to be very successful and will enable<strong>the</strong> Nation, in <strong>the</strong> long term, to better manage wildlife and fisheries throughout<strong>the</strong> reservation.<strong>Spotted</strong> owl surveys have been completed on all suitable habitat within <strong>the</strong>reservation. Only one activity center has been located. This center is in <strong>the</strong>north boundary area. Harvest within this area will be adjusted to protect thisactivity center core as long as it remains occupied. This activity center isadjacent to <strong>the</strong> Olympic National Park, which provides <strong>the</strong> majority of suitablehabitat in <strong>the</strong> area.It should be noted that <strong>the</strong> Quinault River valley (approximately 50 squaremiles on <strong>the</strong> reservation) and <strong>the</strong> river's many tributaries <strong>for</strong>m <strong>the</strong> mostimportant reservation resource to <strong>the</strong> Quinault people. Preservation andconservation of five species of salmon, two species of trout, and o<strong>the</strong>rs alwayswill be a main Quinault objective. All o<strong>the</strong>r wildlife in this area also are consideredin <strong>the</strong> management scheme. Because <strong>the</strong> Quinault Reservation originallywas allotted to individual Indians in 40- and 80-acre parcels, management of<strong>the</strong> area as a single unit historically has been difficult. To protect this resource,<strong>the</strong> Quinault Nation has placed a high priority on consolidation of <strong>the</strong>river valley into Tribal ownership through land purchase. With consolidatedownership, <strong>the</strong> Tribe will effect a more consistent and improved riparian zonemanagement. The valley will continue to offer wildlife and fish protection as<strong>the</strong> primary management objective.Warm Springs Indian Reservation, OregonCurrently, 40 percent of <strong>the</strong> habitat suitable <strong>for</strong> nor<strong>the</strong>rn spotted owls hasbeen surveyed on <strong>the</strong> Warm Springs Indian Reservation. Seventeen activitycenters have been located, primarily in <strong>the</strong> northwest portion of <strong>the</strong> Reservation.90The Confederated Tribes of Warm Springs voluntarily have acknowledged <strong>the</strong>designation of 18,722 acres to be managed <strong>for</strong> owls as a 'Warm SpringsSpecial Habitat Preservation Area" in <strong>the</strong> sou<strong>the</strong>rn end of <strong>the</strong> Reservation.
This area is a portion of one of several larger Tribal conditional use areas,which are limited-entry set-asides. The primary function of this area is toserve as a connecting corridor and habitat expansion between two designatedconservation areas (DCAs) on <strong>the</strong> Deschutes National Forest.On a short-term basis, o<strong>the</strong>r suitable owl habitat will be managed to maintainsome owl activity centers primarily centered on and around <strong>the</strong> 60,549 acres ofTribal conditional use areas, including <strong>the</strong> area discussed above. Additionalrestricted land use occurs on riparian zone 'A" lands, which consist of 21,086acres where timber harvest is not allowed and two extensive managementzones; one zone contains 7,224 acres where timber harvest is not allowed, anda second zone contains 7,418 acres of 200+-year extended age harvest rotationunder uneven-aged management prescriptions. All <strong>the</strong>se set-aside or specialmanagement areas contain suitable owl habitat. All <strong>the</strong>se special managementareas consist of 96,277 acres of <strong>for</strong>ested land or 25 percent of <strong>the</strong> ConfederatedTribes' total <strong>for</strong>est resource.On a long-term basis, <strong>the</strong> Tribes will mesh owl protection into <strong>the</strong>ir overallwildlife management plan in such a manner as to contain all <strong>the</strong> necessities ofowl survival.Grand Ronde Indian Reservation, OregonThe entire reservation has been surveyed and only small amounts of suitablenor<strong>the</strong>rn spotted owl habitat exists. All of this suitable habitat is in secondgrowthstands with <strong>the</strong> majority of <strong>the</strong> area located on <strong>the</strong> eastern part of <strong>the</strong>Reservation in <strong>the</strong> Coast Creek drainage. The Coast Creek drainage has beenoccupied by a successfully breeding owl pair since 1974. An additional residentbird may reside on <strong>the</strong> western part of <strong>the</strong> Reservation. Spring 1992calling will determine if <strong>the</strong> bird found this year is a resident bird. Much of <strong>the</strong>surrounding Forest Service and BLM timber stands in <strong>the</strong> Coast Creek area arenow or are approaching suitable habitat conditions <strong>for</strong> nor<strong>the</strong>rn spotted owls.The enabling legislation establishing <strong>the</strong> Grand Ronde Indian Reservation hasas its principal purpose to provide economic and cultural stability <strong>for</strong> <strong>the</strong>restored Grand Ronde Tribe. One of <strong>the</strong> terms of <strong>the</strong> Grand Ronde ReservationAct provides that, beginning September 1988 and <strong>for</strong> <strong>the</strong> following 20 years, 30percent of all timber revenue is to be set aside <strong>for</strong> economic developmentprimarily in Yamhill, Polk, and Tillamook Counties. Given <strong>the</strong> above situations,<strong>the</strong> Tribe and U.S. Bureau of Indian Affairs have conducted on-<strong>the</strong>groundsurveys with <strong>the</strong> FWS to explore alternatives that will provide protection<strong>for</strong> nor<strong>the</strong>rn spotted owls and allow a metered harvest of timber from <strong>the</strong>Coast Creek area. This agreed upon action was begun in 1991, and willcontinue as long as necessary.Hoopa (Hupa) Valley Indian Reservation, Cali<strong>for</strong>nia<strong>Owl</strong> surveys have located 27 activity centers within <strong>the</strong> reservation. Voluntaryconsultation (meeting section 7 requirements) with <strong>the</strong> FWS has been and willcontinue to be completed prior to timber harvests.Approximately 6,000 acres of <strong>the</strong> total 88,000 acres of <strong>the</strong> reservation areinherently unsuitable <strong>for</strong> nor<strong>the</strong>rn spotted owls (natural prairies, urban areas,water bodies, etc.). Of <strong>the</strong> remaining 82,000 acres, approximately 39 percentis designated as reserves, cultural sites, stream zones or as <strong>the</strong> Hoopa ValleyWild and Scenic River view shed (Valley View Shed) along <strong>the</strong> Trinity River,91
where timber harvest is limited to partial cutting. The Valley View Shed isapproximately 2 miles wide (17,000 acres) and serves specifically as a viewshed to <strong>the</strong> Trinity River but also effectively serves to connect DCAs on ForestService land north and south of <strong>the</strong> reservation.The principal protection provided to wildlife and fish species on <strong>the</strong> reservationis <strong>the</strong> maintenance of stream protection zones which are up to 400 feet wide.Stream protection zones include 4,700 acres. The Tribe is concerned with <strong>the</strong>protection of threatened and endangered species of fish: wildlife and plants;and also culturally important species such as, chinook and coho stocks,lampreys, fishers, pileated woodpeckers, acorn woodpeckers, bald eagles,ospreys, Port Or<strong>for</strong>d cedars, and o<strong>the</strong>rs.Round Valley Indian Reservation (Covelo IndianCommunity), Cali<strong>for</strong>niaA wildlife management survey has been initiated to survey all wildlife specieson <strong>the</strong> Round Valley Indian Reservation. A spotted owl survey was conductedin <strong>the</strong> 1991 season. Within <strong>the</strong> 30,000-acre reservation a survey was conductedon land recently purchased -11,304 acres purchased with a timbercutting right easement where conifers more than 11 inches in diameter remain<strong>the</strong> property of <strong>the</strong> prior landowner. This resource area had one spotted owlactivity center. If harvest is not undertaken under <strong>the</strong> easement and after acomplete survey of <strong>the</strong> reservation has been done, <strong>the</strong> Tribe will reevaluate itsmanagement to provide protection <strong>for</strong> this activity center.The Tribe has a new Fish and Wildlife Program that works in conjunction with<strong>the</strong> Natural Resource Program to manage and protect its wildlife resourceswithin <strong>the</strong> reservation. For now, <strong>the</strong> Tribe will manage <strong>for</strong> <strong>the</strong> nor<strong>the</strong>rn spottedowl and continue to inventory this species habitat and will develop its ownmanagement plan.92
Chapter III<strong>Recovery</strong>93
III.A. <strong>Recovery</strong> Objective and Delisting CriteriaThe objective of <strong>the</strong> recovery plan is delisting of <strong>the</strong> nor<strong>the</strong>rn spotted owlthroughout its range. The major threats to <strong>the</strong> subspecies, identified in <strong>the</strong>listing decision (55 FR 26114), were that suitable habitat was unprotected anddecreasing throughout <strong>the</strong> range. Evidence was presented that some owlpopulations already were declining as a result. Delisting should not be considereduntil adequate suitable habitat has been protected. In addition, evidenceshould be available that owl populations are stable or increasing and areunlikely to become threatened again in <strong>the</strong> <strong>for</strong>eseeable future.Four criteria are described here that must be met be<strong>for</strong>e delisting is considered.The criteria were designed to provide a basis <strong>for</strong> consideration of delisting,not <strong>for</strong> automatic delisting. The final decision about delisting should bemade only after thorough review of all relevant in<strong>for</strong>mation by <strong>the</strong> FWS.Delisting should not be considered in any part of <strong>the</strong> range <strong>for</strong> a minimum of8 years. In most parts of <strong>the</strong> range, habitat and populations still are declining.Declines are expected to continue even after recovery recommendations areimplemented. There<strong>for</strong>e, in most parts of <strong>the</strong> range delisting probably will notbe appropriate <strong>for</strong> substantially more than 8 years.The recovery plan provides numerous specific recommendations that <strong>the</strong><strong>Recovery</strong> Team believes must be implemented to achieve <strong>the</strong> conditions underwhich delisting would be appropriate (section III.C.4.). The <strong>Recovery</strong> Teamrecognizes, however, that new in<strong>for</strong>mation may become available permitting<strong>the</strong> refinement and modification of <strong>the</strong>se recommendations. The <strong>Recovery</strong>Team believes that <strong>the</strong> delisting criteria should not be modified (with <strong>the</strong>possible exception of criterion no. 2) even if specific recommendations change.Delisting may be considered <strong>for</strong> all or part of <strong>the</strong> range. The borders of <strong>the</strong>area being considered <strong>for</strong> delisting should follow <strong>the</strong> borders of <strong>the</strong> physiographicprovinces shown in Figure 2.2. "Area," in <strong>the</strong> delisting criteria descriptionsrefers to <strong>the</strong> area being considered <strong>for</strong> delisting.1. <strong>Owl</strong> populations and owl habitat in <strong>the</strong> area havebeen monitored with a scientifically credible monitoringplan <strong>for</strong> <strong>the</strong> preceding 8 or more consecutive years.A rangewide sampling plan should be instituted to monitor <strong>the</strong> progress ofrecovery. The plan should be designed using existing in<strong>for</strong>mation, shouldprovide in<strong>for</strong>mation to modify <strong>the</strong> recovery plan as appropriate, and shouldserve as <strong>the</strong> basis <strong>for</strong> delisting once populations have recovered. Appendix Adescribes such a plan and indicates that collecting <strong>the</strong> needed data can bedone at a reasonable cost. Appendix A also provides additional details about<strong>the</strong> specific requirements <strong>the</strong> sampling plan should meet, contains technicalsuggestions <strong>for</strong> efficient sampling methods, and explains <strong>the</strong> basis <strong>for</strong> <strong>the</strong><strong>Recovery</strong> Team's conclusion that data should be available <strong>for</strong> a minimum of 8years be<strong>for</strong>e delisting is considered.95
2. The population has been stable or increasing duringat least <strong>the</strong> last 8 years, as indicated by both densityestimates and demographic analyses, in all parts of <strong>the</strong>area that would be considered significant under <strong>the</strong>Endangered Species Act.Delisting a threatened population while it is declining would be difficult tojustify. This is particularly true with nor<strong>the</strong>rn spotted owls because evidencethat populations were declining was one of <strong>the</strong> major reasons <strong>for</strong> listing <strong>the</strong>subspecies. These statements apply to <strong>the</strong> total population in <strong>the</strong> area beingconsidered <strong>for</strong> delisting, or to any subpopulation that would be considered''significant," and thus would qualify <strong>for</strong> protection under <strong>the</strong> EndangeredSpecies Act. The <strong>Recovery</strong> Team recognizes, however, that suitable habitat in<strong>the</strong> matrix-and owl populations-are likely to decline, and several decadesmay be required be<strong>for</strong>e populations stabilize completely, even if recovery isproceeding as anticipated. The <strong>Recovery</strong> Team believes that delisting eventuallymight be appropriate if <strong>the</strong> populations in protected areas were stable orincreasing, even if <strong>the</strong> overall population still was declining slightly. Thecriteria <strong>for</strong> delisting under <strong>the</strong>se conditions are difficult to specify precisely atthis time, and doing so may be unnecessary if habitat protection in <strong>the</strong> matrixis integrated successfully with o<strong>the</strong>r <strong>for</strong>est activities (section III.B.2.). For <strong>the</strong>sereasons, <strong>the</strong> <strong>Recovery</strong> Team has not attempted to specify <strong>the</strong> exact criteria <strong>for</strong>delisting while <strong>the</strong> population still is declining at a small rate.State-of-<strong>the</strong>-art methods should be used to estimate population trends. Methodsthat would be appropriate at present are described in Appendices A and C.3. Regulatory mechanisms or land management commitmentshave been implemented that provide <strong>for</strong> adequatelong-term protection of breeding, <strong>for</strong>aging, anddispersal habitat, as described in section III.C.4., recoverygoals and strategies <strong>for</strong> each province.Delisting would be followed by loss of protection under <strong>the</strong> Endangered SpeciesAct. Adequate protection through alternate means is essential be<strong>for</strong>e delisting.For example, management plans <strong>for</strong> federal land should provide adequateassurances of habitat protection prior to consideration of delisting. The <strong>for</strong>m of<strong>the</strong>se regulations and commitments should be determined during <strong>the</strong> comingyears and will vary across <strong>the</strong> range. The <strong>Recovery</strong> Team <strong>the</strong>re<strong>for</strong>e has notattempted to specify <strong>the</strong> <strong>for</strong>m of <strong>the</strong> protection precisely. Reasonable assurancemust exist that <strong>the</strong> conditions which have brought about populationstability will be maintained, or, if necessary, improved during <strong>the</strong> <strong>for</strong>eseeablefuture.96
4. The population is unlikely to need protection under<strong>the</strong> Endangered Species Act during <strong>the</strong> <strong>for</strong>eseeable future.Populations that are temporarily stable but likely to decline again in <strong>the</strong><strong>for</strong>eseeable future cannot be considered recovered and should not be delisted.Detailed analyses of <strong>the</strong> likelihood that <strong>the</strong> population will remain stable orincrease must be carried out be<strong>for</strong>e delisting. The analyses should includeobserved and anticipated effects of a) fluctuations in abundance, fecundity,and survivorship; b) movements by birds within <strong>the</strong> area and to or fromsurrounding areas; c) changes in habitat including ones due to catastrophicevents: d) loss of genetic diversity; and e) any o<strong>the</strong>r threats to <strong>the</strong> populationwhose effects might be significant. These analyses are particularly important<strong>for</strong> small populations.97
III.B. Principles Followed in Developing <strong>the</strong> <strong>Plan</strong>1. Strategic PrinciplesAdequate assurance of recovery must be provided.Secretary Lujan's letter directed <strong>the</strong> <strong>Recovery</strong> Team to prepare a plan whichwould "bring <strong>the</strong> owl to <strong>the</strong> point at which it will no longer need <strong>the</strong> protectionof <strong>the</strong> Endangered Species Act." The directive to <strong>the</strong> <strong>Recovery</strong> Team recognized<strong>the</strong> "biological imperative" in <strong>the</strong> Endangered Species Act. No plan would beacceptable unless it provided adequate assurance that recovery would beachieved. Proposals <strong>for</strong> recovery were evaluated first to determine whe<strong>the</strong>r<strong>the</strong>y provided adequate assurance of recovery. This evaluation was madewithout regard to economic implications of <strong>the</strong> proposal, and all proposalswere required to meet this biological imperative prior to being given fur<strong>the</strong>rconsideration.The plan should minimize social and economic costs.The <strong>Recovery</strong> Team attempted to develop a plan which, while meeting <strong>the</strong>requirement of achieving recovery, would recognize and try to reduce <strong>the</strong>overall cost and would distribute this cost in an equitable manner across <strong>the</strong>region. For example, <strong>the</strong> <strong>Recovery</strong> Team made an intensive ef<strong>for</strong>t to placeDCAs in locations where timber yield already was reduced (e.g., national parks,wilderness areas); ef<strong>for</strong>ts were made to distribute DCAs in a way that reducedadverse effects on timber-dependent communities; and analyses were carriedout to identify activities within DCAs that might produce economic returnswithout reducing <strong>the</strong> assurance that recovery would occur.The plan should be comprehensive.Secretary Lujan directed <strong>the</strong> <strong>Recovery</strong> Team to develop a plan that "will serveas a guide to future federal, state and private activities affecting <strong>the</strong> owl."These activities will include research, monitoring, habitat protection, developmentof conservation plans, and numerous o<strong>the</strong>r ef<strong>for</strong>ts to bring about recovery.The <strong>Recovery</strong> Team attempted to integrate all of <strong>the</strong>se activities into asingle, well-coordinated plan <strong>for</strong> achieving recovery using all tools availableunder <strong>the</strong> Endangered Species Act.All contributions to recovery should be recognized.Important contributions to recovery are being made on nonfederal land and onfederal land outside of DCAs. Some of <strong>the</strong>se contributions are required <strong>for</strong>recovery, but o<strong>the</strong>rs may provide higher levels of protection than are needed toassure recovery. These measures should not be required, and if <strong>the</strong>y arecontributed voluntarily, <strong>the</strong>n <strong>the</strong> possibility of requiring less contribution fromo<strong>the</strong>r sources should be investigated. This approach is consistent with <strong>the</strong>goal of minimizing <strong>the</strong> cost of recovery, and may be particularly important asan incentive <strong>for</strong> nonfederal landowners to find owls and develop long-termconservation programs <strong>for</strong> <strong>the</strong>m.99
Needs of o<strong>the</strong>r species should be considered.Secretary Lujan directed <strong>the</strong> <strong>Recovery</strong> Team to consider "effects on o<strong>the</strong>rthreatened and endangered species and those species which might be listed in<strong>the</strong> future." The <strong>Recovery</strong> Team attempted to identify <strong>the</strong>se species and <strong>the</strong>requirements of a select group of priority species. Ef<strong>for</strong>ts <strong>the</strong>n were made toensure that <strong>the</strong> recovery plan provided this protection to <strong>the</strong> maximum extentpractical without increasing <strong>the</strong> overall cost. The plan also contains additionalin<strong>for</strong>mation on <strong>the</strong> status of <strong>the</strong>se species. The <strong>Recovery</strong> Team believes thatlandowners and managers may want to consider <strong>the</strong>se o<strong>the</strong>r species in anef<strong>for</strong>t to reduce <strong>the</strong> long-term costs of protecting species in <strong>the</strong>se ecosystems.The plan should be responsive to new in<strong>for</strong>mation.2. Biological PrinciplesAs new in<strong>for</strong>mation is produced by <strong>the</strong> monitoring and research program, moreefficient ways to bring about recovery may be developed. New data mayindicate that DCAs need to be larger or smaller; modification of <strong>the</strong> monitoringprogram may be required; improved silvicultural methods may be demonstratedto create and maintain owl habitat, or <strong>for</strong> integrating timber productionwith owl protection; and new, more effective administrative procedures may bedevised. The <strong>Recovery</strong> Team wants to encourage <strong>the</strong> development and implementationof <strong>the</strong>se improvements. Specific recommendations are included <strong>for</strong>revising <strong>the</strong> plan periodically and <strong>for</strong> assuring that proposed modifications to<strong>the</strong> plan are considered fully and implemented as appropriate.This recovery plan is based on biological principles that are accepted widely byconservation biologists. The application of <strong>the</strong>se principles to nor<strong>the</strong>rn spottedowls first was described in <strong>the</strong> Conservation Strategy of <strong>the</strong> Interagency ScientificCommittee (Thomas et al. 1990). The most important of <strong>the</strong>se principlesare that 1) species are more secure from extinction if habitat and local populationsare distributed across <strong>the</strong>ir entire range, 2) providing <strong>for</strong> species in largehabitat blocks is superior to providing small blocks; and 3) movement ofindividuals throughout <strong>the</strong> landscape is vital to <strong>the</strong> maintenance of all localpopulations within <strong>the</strong> range. A summary of <strong>the</strong> reasons behind each of <strong>the</strong>seprinciples and <strong>the</strong>ir application to nor<strong>the</strong>rn spotted owls follows.The risk of local or widespread extirpation of nor<strong>the</strong>rnspotted owls will be reduced by managing<strong>for</strong> owls across<strong>the</strong>ir entire range and <strong>the</strong> variety of ecological conditionswithin that range.Four primary reasons can be cited <strong>for</strong> <strong>the</strong> importance of maintaining <strong>the</strong> fullrange of <strong>the</strong> species. First, any significant range reduction most likely wouldreduce <strong>the</strong> total number of local populations in <strong>the</strong> species' metapopulation.The security of <strong>the</strong> metapopulation is related directly to <strong>the</strong> number of localpopulations. A reduction in local populations increases <strong>the</strong> risk of extinction <strong>for</strong><strong>the</strong> whole metapopulation. Second, a reduction in range also would reduce <strong>the</strong>overall range of environments occupied by <strong>the</strong> species, making <strong>the</strong> species morevulnerable to environmental stochasticity. Habitats at different elevations, indifferent <strong>for</strong>est types, in different ownerships, and in different parts of <strong>the</strong> owl'sgeographic range may act as refugia <strong>for</strong> <strong>the</strong> species in <strong>the</strong> face of catastrophes,rapid environmental change, chronic degradation of habitat from causes suchas <strong>for</strong>est diseases, or un<strong>for</strong>seen changes in interactions among species. Populationsdistributed across <strong>the</strong> geographic and ecological conditions within <strong>the</strong>range provide a higher likelihood that <strong>the</strong> subspecies will survive such events.100
For <strong>the</strong>se two reasons, Thomas et al. (1990) concluded that species welldistributedacross <strong>the</strong>ir range are less prone to extinction than species confinedto smaller portions of <strong>the</strong>ir range. Third, range reduction around <strong>the</strong>fringes of a species' geographic or elevational range could have serious consequencesbecause <strong>the</strong>se areas are often <strong>the</strong> sites of <strong>the</strong> most rapid adaptationswithin a species. Eliminating <strong>the</strong> fringes of <strong>the</strong> range might reduce <strong>the</strong> evolutionarycapability of <strong>the</strong> species. Fourth, <strong>the</strong> elimination of <strong>the</strong> geographic orelevational fringe portions of a species' range might be considered unwise in<strong>the</strong> face of possible widespread climatic changes, especially where <strong>the</strong> directionand magnitude of those changes are uncertain. For example, some scientistsbelieve that global warming could result in some local cooling points in <strong>the</strong>Pacific Northwest ra<strong>the</strong>r than a universal warming effect (Smith 1990). If <strong>the</strong>climate cooled, it could place increasing importance on <strong>the</strong> sou<strong>the</strong>rn parts of<strong>the</strong> range and on low elevation habitats. If <strong>the</strong> climate warmed, it could placeincreasing importance on <strong>the</strong> nor<strong>the</strong>rn extent of <strong>the</strong> range.Emphasis should be placed on management<strong>for</strong> clusters,or local population centers, of owls in large habitat blocksra<strong>the</strong>r than <strong>for</strong> individual pairs.Empirical evidence and modeling show that clusters of 15 to 20 breeding pairshave much higher persistence rates than small, isolated clusters. Theseclusters, or local population centers, can be defined as groups of breeding owlswhere pairs have overlapping or nearly overlapping territories. The evidenceand rationale supporting this principle are described in detail in Thomas et al.(1990).One of <strong>the</strong> advantages of local population clusters is that <strong>the</strong>y can provide <strong>for</strong> apopulation structure that can sustain itself <strong>for</strong> many generations. This contrastswith extremely small local populations, composed of two or fewer pairs,that are highly susceptible to local extinction (Diamond 1984). In order torealize this advantage, <strong>the</strong> local populations must be large enough to holdmultiple breeding pairs, and also support juveniles, subadults, and "floaters."Floaters are nonbreeding individuals without established territories. It isthought that <strong>the</strong>y serve as ready replacements <strong>for</strong> birds that die or vacate <strong>the</strong>irterritories <strong>for</strong> o<strong>the</strong>r reasons (Thomas et al. 1990). This ready replacement ofbirds in breeding territories should help maintain <strong>the</strong> populations within <strong>the</strong>local population centers.Within each local population center, it is critical to provide <strong>for</strong> stable or improvinghabitat conditions. This will reverse <strong>the</strong> trend of increasing fragmentationof habitat which has been experienced in most areas across <strong>the</strong> range. Fragmentationof habitat is associated with lowered spotted owl densities, decreasedproductivity of spotted owl populations (Bart and Forsman 1992),increasing susceptibility of <strong>for</strong>est stands to windthrow, decreasing success ofjuvenile dispersal, and possibly increased competition with barred owls andpredation by great horned owls (Thomas et al. 1990).For a strategy based on local populations to be successful, those local populationsmust be capable of acting as sources of surplus owls <strong>for</strong> <strong>the</strong> species'metapopulation. A source area is one that has a positive rate of populationincrease and is capable of contributing individuals to <strong>the</strong> metapopulation.Local populations might cease to act as sources if <strong>the</strong>y are too small or if <strong>the</strong>yoccupy highly fragmented habitat (Thomas et al. 1990). It is important to notethat each local population does not have to act as a source each year. It isexpected that <strong>the</strong>re will be some variation across populations and across years,and that a portion of <strong>the</strong> local populations would not act as sources in some101
years. The strategy of managing <strong>for</strong> many local populations within <strong>the</strong>metapopulation should allow maintenance of a nondeclining trend in <strong>the</strong>metapopulation despite this variation.The management <strong>for</strong> local populations within <strong>the</strong> metapopulation also shouldbe designed to reduce <strong>the</strong> risk of local or widespread extirpation of owl populationsdue to catastrophic destruction of habitat. Such destruction could resultfrom natural causes including windthrow, fire, flooding, insects, diseases,volcanic action, or climatic change. The risk to <strong>the</strong> overall population fromlarge-scale disturbances is reduced by distributing local population centersacross <strong>the</strong> species' range, and by providing redundancy of habitats. Additionalsecurity from catastrophic loss can be provided by reducing <strong>the</strong> risk withinlocal population centers. The risk of catastrophic loss within a given populationcenter can be influenced by <strong>the</strong> size, configuration, and management ofthat center. Larger areas are less susceptible to complete elimination from fireand windthrow. The likelihood of fire, and <strong>the</strong> likely impacts of fire, can bereduced through management of fuels both within <strong>the</strong> population center and in<strong>the</strong> surrounding <strong>for</strong>est matrix. In some ecological conditions, <strong>the</strong> risk ofserious insect and disease losses may be reduced through appropriate management.Habitat conditions and spacing between local populationsmust provide<strong>for</strong> survival and movement of nor<strong>the</strong>rn spottedowls.Metapopulations are sets of local populations that are linked by dispersingindividuals. While each local population might be subject to extirpation over<strong>the</strong> long term, individuals dispersing among <strong>the</strong> areas help to reestablish localpopulations after severe local declines or extirpations. The interbreedingprovided by dispersing individuals also provides insurance against deleteriouseffects of inbreeding. To allow <strong>for</strong> movement of nor<strong>the</strong>rn spotted owls amongsource areas, those areas must be spaced appropriately; <strong>the</strong>re must be redundantlinkages among areas; and <strong>the</strong> intervening habitat must provide <strong>the</strong>dispersal needs of adults and juveniles.Studies of dispersing juvenile owls (Miller 1989, Gutierrez et al. 1985) indicatethat <strong>the</strong>ir initial movements have a strong random component. The probabilityof a juvenile finding suitable habitat is related to <strong>the</strong> amount of suitablehabitat in <strong>the</strong> landscape around its natal area and <strong>the</strong> distance of that habitatfrom its starting point. Increasing <strong>the</strong> number of blocks of suitable habitatwithin <strong>the</strong> dispersal distance of any given local population center will increase<strong>the</strong> chance <strong>for</strong> success of dispersing juveniles. Also, having each block within<strong>the</strong> dispersal distance of two or more o<strong>the</strong>r blocks allows <strong>the</strong> system of localpopulation centers to retain connectivity even if a given local population iseliminated. In this case, that population center can be reoccupied by owlscoming from two or more o<strong>the</strong>r centers.The connecting zones among local population centers must contain habitatthat will allow movement of juvenile and adult dispersers and provide <strong>for</strong> basiclife needs during <strong>the</strong> dispersal period. Key elements <strong>for</strong> survival includeroosting opportunities, protection from predators, and adequate <strong>for</strong>agingopportunities (Thomas et al. 1990).102
3. Integration of Strategic and Biological PrinciplesThe nor<strong>the</strong>rn spotted owl has been placed at risk by management actions thathave seriously depleted its habitat. The habitat conditions that would be best<strong>for</strong> support of an owl population would be similar to those that existed be<strong>for</strong>etimber harvesting began. However, recreating such habitat conditions wouldnot be feasible. Ef<strong>for</strong>ts to restore habitat conditions in any part of <strong>the</strong> rangewould have large economic effects, and those economic consequences <strong>for</strong>cedifficult biological choices in <strong>the</strong> design of a recovery strategy. The strategydeveloped here places large blocks of habitat on federal land off-limits toregular timber harvesting and should provide a reasonable assurance ofsuccess of recovering <strong>the</strong> nor<strong>the</strong>rn spotted owl. However, it required considerationof many compromises in conservation area size and spacing and <strong>the</strong>structure of intervening <strong>for</strong>ests. Such compromises are inevitable in a strategythat calls <strong>for</strong> blocks of superior habitat distributed within a landscape of lowerquality habitat. The situation <strong>for</strong> owls could be made more secure if favorablehabitat conditions could be spread more evenly across <strong>the</strong> landscape. Such asolution might be possible if it can be demonstrated that silvicultural techniquescan create and maintain suitable habitat conditions while harvestingtimber. The <strong>Recovery</strong> Team supports <strong>the</strong> change over time toward such asolution when supported by appropriate data.103
't0
III.C. The <strong>Recovery</strong> <strong>Plan</strong>1. OverviewThe recovery plan strategy is based on <strong>the</strong> principles stated in section III.B.The plan has three main components: establishing designated conservationareas (DCAs) on federal lands; managing <strong>the</strong> remaining federal land, referred toas <strong>the</strong> matrix: and encouraging contributions from nonfederal lands.Federal LandsThe network of DCAs follows guidelines developed by Thomas et al. (1990).The DCAs provide <strong>for</strong> local population centers, or clusters, of reproductivepairs. It is anticipated that birth and survival rates in <strong>the</strong>se clusters normallywill equal or exceed death rates, allowing <strong>the</strong> clusters to serve as source areas<strong>for</strong> owls. The clusters are arranged across <strong>the</strong> federal landscape to meet, asnearly as possible, <strong>the</strong> principle that nor<strong>the</strong>rn spotted owls should be recoveredacross <strong>the</strong>ir entire range and <strong>the</strong> full variety of ecological conditionswithin that range.DCAs will be managed to improve owl habitat. Thinning and o<strong>the</strong>r silviculturalpractices will be used to accelerate development of suitable habitat in areasthat are currently unsuitable. Such management, however, will be used onlywhere existing and new studies and data indicate that <strong>the</strong> development ofsuitable conditions could be accelerated. Salvage of dead trees in standsaffected by large-scale disturbances also may take place, but only where thatsalvage will have a positive or neutral effect on owl habitat. Additional managementactivities are recommended in DCAs where <strong>the</strong>re is significant risk oflarge-scale habitat destruction by fire, wind, insects, or disease. Detailedguidelines <strong>for</strong> management in DCAs are in section III.C.2.Outside <strong>the</strong> DCAs, it is recommended that federal <strong>for</strong>estlands be managed toallow dispersal of owls among DCAs. These <strong>for</strong>ests are called <strong>the</strong> matrix,following <strong>the</strong> terminology established by Thomas et al. (1990). Dispersal ofowls among DCAs is important to replace owls that die and to avoid loss ofgenetic diversity. This is important under normal circumstances, when individualowls die, and unusual circumstances, when <strong>the</strong>re is large-scale disruptionof <strong>the</strong> population.Federal matrix lands also will provide habitat to supplement DCAs in areaswhere existing conditions preclude achievement of <strong>the</strong> goals <strong>for</strong> size andspacing of DCAs. These areas of additional habitat are called reserved pairareas. Specific criteria were used to determine where <strong>the</strong>y should be delineated(section III.C.2.).In <strong>the</strong> eastern Washington Cascades, large-scale habitat disturbances arelikely, due to fire and insect outbreaks. These disturbances are a significantthreat to <strong>the</strong> sparse spotted owl population in that area. To reduce <strong>the</strong> risk,<strong>the</strong> plan recommends providing habitat <strong>for</strong> additional owl pairs and territorialsingle owls outside of DCAs. The plan also recommends managing <strong>the</strong>se areasto reduce risk of fire and insect damage.105
Finally, <strong>the</strong> plan recommends maintaining residual habitat areas aroundexisting owl pairs and territorial singles. These small areas will help maintainoptions to provide <strong>for</strong> owls throughout <strong>the</strong> landscape in <strong>the</strong> future.A broader array of management practices will be used in <strong>the</strong> matrix than in <strong>the</strong>DCAs. The timing and location of management practices will be designed toachieve desired conditions through time. Details of matrix management are insection III.C.2.Nonfederal LandsIn many areas throughout <strong>the</strong> owl's range, federal lands are not adequate toprovide recovery. In <strong>the</strong>se areas, nonfederal actions are needed. Currently,primary nonfederal action is providing habitat <strong>for</strong> existing owl pairs to avoidtake of those owls as defined by <strong>the</strong> Endangered Species Act. A variety ofnonfederal contributions is envisioned in this plan (section III.C.4), and manycontributions may be made in lieu of take provisions. These actions aretermed protective management and may include: 1) helping to meet objectives<strong>for</strong> DCAs where nonfederal lands are mixed with federal lands; 2) providing <strong>for</strong>clusters of breeding pairs on nonfederal lands; 3) providing habitat <strong>for</strong> individualowl pairs; and 4) providing dispersal habitat.Evolution of <strong>the</strong> StrategyThe recovery strategy should evolve as more in<strong>for</strong>mation is collected on owlsand <strong>the</strong>ir habitat. The monitoring and research program is designed to providethat in<strong>for</strong>mation. The recovery plan recommends establishing an interagencygroup to coordinate this gradual refinement and modification of <strong>the</strong> recoveryplan strategy, and it recommends maintaining <strong>the</strong> <strong>Recovery</strong> Team to fulfill thisfunction until such a group is established.Organization of This ChapterAll facets of <strong>the</strong> proposed recovery plan are discussed in <strong>the</strong> following sections.Section III.C.2. reviews management on federal lands. It discusses <strong>the</strong> delineationof DCAs: criteria used to determine where matrix prescriptions should beapplied; and specific management recommendations <strong>for</strong> <strong>the</strong> DCAs and <strong>the</strong>matrix. Section III.C.3. discusses implementation strategies and tools <strong>for</strong>federal and nonfederal lands, and a proposed implementation schedule.Section III.C.4. presents a comprehensive discussion of recovery goals <strong>for</strong> alllands in each physiographic province. It also describes how those goals mightbe implemented on nonfederal lands. Section III.C.5. describes coordinationef<strong>for</strong>ts that will be needed to make <strong>the</strong> recovery plan successful. SectionIII.C.6. outlines <strong>the</strong> monitoring and research program that will be needed toimprove <strong>the</strong> plan over time and to provide in<strong>for</strong>mation <strong>for</strong> delisting.106
III.C.2. Management Guidelines <strong>for</strong> Federal LandsDesignated Conservation AreasDelineation of DCAsThe DCAs recommended on federal lands in this plan were derived from <strong>the</strong>habitat conservation areas (HCAs) proposed by Thomas et al. (1990). Theobjective of <strong>the</strong> original HCA network was to establish habitat areas largeenough to support 20 pairs of owls with contiguous or nearly contiguous homeranges. The 20-pair goal was based on empirical evidence and on simulationmodeling which showed that clusters of 20 interacting pairs were likely topersist <strong>for</strong> at least 100 years. These areas were to be spaced a maximum of 12miles apart, edge-to-edge. The spacing guideline was developed to ensure thatjuvenile owls, dispersing from <strong>the</strong>ir birthplace, would be able to find suitablehabitat <strong>for</strong> nesting. Two-thirds of <strong>the</strong> juvenile owls studied at <strong>the</strong> time of <strong>the</strong>ISC report had moved at least 12 miles. HCAs were as circular as possible tominimize <strong>the</strong> perimeter-to-area ratio.The 20-pair HCAs were termed category 1 HCAs. Where 20-pair areas couldnot be established, Thomas et al. (1990) recommended smaller areas capableof supporting two to 19 pairs. These smaller areas were termed category 2HCAs. The draft recovery plan adopts this convention <strong>for</strong> category 1 andcategory 2 DCAs. However, some of <strong>the</strong> category 2 DCAs have <strong>the</strong> capability ofsupporting only a single pair of owls.Thomas et al. (1990) used median annual home range size and density in<strong>for</strong>mationto determine <strong>the</strong> appropriate size <strong>for</strong> <strong>the</strong> category 1 HCAs. HCAs weredelineated to include <strong>the</strong> best available habitat and greatest number of knownpairs or territorial singles. This process was done iteratively to achieve <strong>the</strong> bestcombination of habitat, known owls, and HCA shape. Where category 2 HCAswere delineated because <strong>the</strong>re was no opportunity to create category 1 HCAs,<strong>the</strong>se smaller areas were spaced at a maximum distance of 7 miles. Approximately80 percent ofjuveniles that have been studied with radio transmittershave traveled at least this far (Thomas et al. 1990).The HCA network was modified slightly in <strong>the</strong> draft recovery plan using updatedinventories of owls and habitat (see Appendix I). Size and spacingcriteria were not changed. Boundaries were altered to improve <strong>the</strong> biologicaland/or economic efficiency of <strong>the</strong> system. The resulting DCAs are summarizedin Tables J. 1 through J. 11 in Appendix J.There were 196 DCAs identified <strong>for</strong> <strong>the</strong> DCA network, with 56 satisfying <strong>the</strong>criteria <strong>for</strong> category 1 status. The remaining 140 areas are category 2 DCAs.To determine which DCAs met <strong>the</strong> criteria <strong>for</strong> category 1 status, <strong>the</strong> futurecapability of a DCA to support owl pairs on federal lands in <strong>the</strong> DCA wascalculated. This figure was determined by assuming that 80 percent of <strong>the</strong>land within <strong>the</strong> DCA would become suitable owl habitat over time. The actualcalculation is explained in Appendix J. In a few cases, where federal landscould support more than 15 pairs but not 20 pairs, <strong>the</strong> presence of existing owlpairs on nonfederal lands provided <strong>the</strong> basis <strong>for</strong> accepting DCAs as category 1.107
A total of 1,181 pairs of owls has been located on federal lands in <strong>the</strong>se DCAswithin <strong>the</strong> last 5 years. This represents 48 percent of <strong>the</strong> 2,460 pairs of owlslocated on all federal lands during that period. The percent of owls included inDCAs by state is 81 percent in Washington, 39 percent in Oregon, and 54percent in Cali<strong>for</strong>nia. Differing percentages among <strong>the</strong> states result from <strong>the</strong>differences in current population levels and distribution of owls. The DCAscontain approximately 7.5 million acres of federal land including approximately3.5 million acres of nesting, roosting, and <strong>for</strong>aging (NRF) habitat. This representsabout 48 percent of all NRF habitat on federal land. The percent ofhabitat included in DCAs by state is 55 percent in Washington, 44 percent inOregon, and 43 percent in Cali<strong>for</strong>nia. A summary of <strong>the</strong> DCA network ispresented in Figures 3.1 and 3.6. The DCA network is illustrated on <strong>the</strong> mapsincluded with <strong>the</strong> recovery plan, and it is discussed fur<strong>the</strong>r in section III.C.4.Additional pairs of owls on federal lands will be protected by matrix managementprescriptions. See sections III.C.2. and III.C.4.Management of DCAsEffective management of <strong>the</strong> DCAs is necessary to achieve recovery. Thissection describes <strong>the</strong> management guidelines that will govern activities onfederal lands in DCAs. These guidelines apply to <strong>the</strong> owl's entire range. Theymust be refined and use province-specific in<strong>for</strong>mation be<strong>for</strong>e <strong>the</strong>y can beapplied to projects. It is recommended that interagency groups be establishedto develop this province-specific guidance. Implementation of <strong>the</strong> guidelineswill be accomplished by preparing management plans <strong>for</strong> individual DCAs.The recommended components <strong>for</strong> DCA management plans are describedbriefly in this section and in more detail in Appendix E.The DCA management guidelines have several key objectives. First, <strong>the</strong>y allownatural successional processes to continue operating in areas of currentlysuitable habitat. They focus silvicultural activities within DCAs on developingsuitable habitat conditions <strong>for</strong> owls where those conditions now do not exist.Ano<strong>the</strong>r objective is to maintain or reestablish suitable conditions in areasbeing considered <strong>for</strong> salvage operations. Finally, maintaining currently suitablehabitat conditions is an important consideration in areas where <strong>the</strong>re issignificant threat of large-scale disturbances (i.e., mixed conifer <strong>for</strong>ests in <strong>the</strong>eastern Cascades). Some <strong>for</strong>est management activities which meet <strong>the</strong>seobjectives also may yield commercial wood products, but such products shouldnot be part of <strong>the</strong> programmed timber harvest. In addition, <strong>the</strong> DCA managementplanning process will allow o<strong>the</strong>r ongoing activities to continue withinDCAs where <strong>the</strong>y are compatible with owl recovery.The recovery plan recommends <strong>the</strong> preparation and approval of a managementplan <strong>for</strong> each DCA be<strong>for</strong>e design and implementation of habitat manipulationactivities. Land management agencies may choose to develop <strong>the</strong>se plans ascomponents of legally mandated plans (e.g., <strong>for</strong>est or resource managementplans), or as stand-alone plans. Agencies are strongly encouraged to developprovince-based planning guidelines as a basis <strong>for</strong> preparing plans. DCAmanagement plans will serve as overview documents that provide a framework<strong>for</strong> carrying out specific activities. Individual plans should include: 1) ahistory and inventory of overall owl and habitat condition; 2) a description ofo<strong>the</strong>r resources and land uses; and 3) criteria <strong>for</strong> determining appropriatetreatments <strong>for</strong> specific owl needs and on-<strong>the</strong>-ground conditions within <strong>the</strong>DCA, consistent with <strong>the</strong> recommendations in this section and o<strong>the</strong>r applicableguidance. Individual DCA plans should contain oversight, monitoring, andevaluation components to help assure that activities are carried out as intendedand achieve desired results. Interdisciplinary teams that includewildlife biologists, silviculturists, <strong>for</strong>est ecologists, fire scientists, <strong>for</strong>est ento-108
<strong>Owl</strong> pairs400-_g ~~~~~350-Known owlsin <strong>the</strong> Washingtonprovinces-_in Washington .DAs 50-Nonfederal landFederal landAcres (thousands)Figure 3.1. Total known owl pairs in <strong>the</strong> Washington provinces and in DCAswithin <strong>the</strong> provinces.- ---........................ILII ~~~10,000--Total acresin <strong>the</strong> Washington 000provinces6,000-4,000-Acres in DCAs in 2,000<strong>the</strong> Washingtonprovinces 0Nonfederal land' Federal land NRF habitat 2Figure 3.2. Acres in <strong>the</strong> Washington provinces and in DCAs within <strong>the</strong> provinces.'Management of nonfederal lands within <strong>the</strong> perimeter of designated conservation areas is discussed in <strong>the</strong> narrative2 NRF habitat = nesting, roosting, and <strong>for</strong>aging habitat. This in<strong>for</strong>mation is available only <strong>for</strong> federal land.109
DKnown owlsin <strong>the</strong> OregonprovincesKnown owlsin Oregon DCAs<strong>Owl</strong> p, airs1,80(3O _1,6011,4011,20101,00 0_80 Un)O--60400.-1020nNonfederal landP IiI ."Federal landFigure 3.3. Total known owl pairs in <strong>the</strong> Oregon provinces and in DCAswithin <strong>the</strong> provinces..1 ...................... I.-I-I -I/Acres (thousands)12,000-_ E_D~~~~~~~~~~~~~~~~~~~~~~~~~~~~~~~~~~~~~~~~~~~~~~~~~~~10,000- L =Total acresin <strong>the</strong> Oregonprovinces 6,000-4,000-Acres in DCAs2,0in <strong>the</strong> Oregonprovinces 0E~~~~~~~~200 .... ..L.Nonfederal land' Federal land NRF habitat 2Figure 3.4. Acres in <strong>the</strong> Oregon provinces and in DCAs within <strong>the</strong> provinces.'Management of nonfederal lands within <strong>the</strong> perimeter of designated conservation areas is discussed in <strong>the</strong> narrative2 NRF habitat = nesting, roosting, and <strong>for</strong>aging habitat. This in<strong>for</strong>mation is available only <strong>for</strong> federal land.110
_f<strong>Owl</strong> pairsm1111 400- l _LJ ~~~~350- -Known owls 35 -in <strong>the</strong> Cali<strong>for</strong>niaprovinces300_l250-_150Known owlsin Cali<strong>for</strong>nia DCAs 1000 E ENonfederal landFederal landFigure 3.5. Total known owl pairs in <strong>the</strong> Cali<strong>for</strong>nia provinces and in DCAswithin <strong>the</strong> provinces.I - I .............I... I- - ................. I... -....... I- , -....... 11 ............... -1-- - .-...... I/IAcres (thousands)a _, ,vvv _ Ann_ __LiTotal acresin <strong>the</strong> Cali<strong>for</strong>niaprovincesI1.6, 0 0 - _ 3~Figure 3.6. Acres in <strong>the</strong> Cali<strong>for</strong>nia provinces and in DCAs within <strong>the</strong> provinces.'Management of nonfederal lands within <strong>the</strong> perimeter of designated conservation areas is discussed in <strong>the</strong> narrative2 NRF habitat = nesting, roosting, and <strong>for</strong>aging habitat. This in<strong>for</strong>mation is available only <strong>for</strong> federal land.11111I I I - -- -l- -l- ,.... .. I - I I I 11 I'll, I450-200-50-7,000-5,000-4,000-3,000-2,000-3,000-2,000-Acres in DCAsin <strong>the</strong> Cali<strong>for</strong>nia1, 0 0 0 -l=provinces , _If -AON-Nonfederal land' Federal land NRF habit,tat2111
mologists, and representatives of o<strong>the</strong>r appropriate disciplines should write <strong>the</strong>individual DCA plans, and be involved in oversight actions after implementation.More detailed guidance <strong>for</strong> DCA management plan preparation is inAppendix E.The recommended DCA management guidelines and planning process arecompatible with federal agency mandates and management frameworks. Since<strong>the</strong> recovery plan recommends that DCAs on certain federal lands be designatedas critical habitat (see section III.C.3), <strong>the</strong> guidelines should be used by<strong>the</strong> FWS as <strong>the</strong> basis <strong>for</strong> adverse modification determinations <strong>for</strong> those landsunder section 7 of <strong>the</strong> Endangered Species Act. Accordingly, after a DCAmanagement plan is prepared by a federal land management agency, submitted<strong>for</strong> <strong>for</strong>mal consultation, and approved by <strong>the</strong> FWS, it is expected thatproposed activities would proceed. Agencies must provide <strong>for</strong> plan revisionswithin reasonable time frames (e.g., <strong>the</strong> normal agency planning cycle) toincorporate new in<strong>for</strong>mation and in cases involving major disturbances (e.g., asignificant fire). In <strong>the</strong> interim period after agency implementation of <strong>the</strong>recovery plan but be<strong>for</strong>e <strong>the</strong> preparation of individual DCA management plans,any proposed activity must be submitted <strong>for</strong> consultation on a case-by-casebasis. Finally, since <strong>the</strong> guidelines apply to federal lands in DCAs, managementplanning in areas of mixed ownership will necessitate approaches thatare tailored to <strong>the</strong> specific situations involved. For example, interagencycoordination will be needed to ensure effective monitoring and to manage risksof large-scale disturbances. In addition, coordinated planning will help ensurethat maximum benefit is derived from <strong>the</strong> contributions by all landowners.Guidelines<strong>for</strong> Silviculture. The primary objective of silvicultural activities inDCAs is to improve habitat in stands with currently unsuitable conditions.Consequently, activities are encouraged if empirical in<strong>for</strong>mation and modelingprovide a high level of confidence that <strong>the</strong> development of suitable habitatconditions will be accelerated. Specific examples of appropriate silviculturalactivities are in Appendix G. General guidelines <strong>for</strong> silvicultural activitiesfollow.1. To safeguard <strong>the</strong> conservation benefits of DCAs, silvicultural activitiesshould be directed at stand types that owls consistently avoid, as documentedin habitat selection studies. Accordingly, activities should bedirected at stands that: 1) are even-sized with an average diameter (treeof average basal area) of 11 inches dbh or less, excluding large trees from<strong>the</strong> previous stand, if any; 2) show no significant development of amultiple-canopy tree structure; and 3) were regenerated following previousharvest activity. Activities in o<strong>the</strong>r types of stands can be consideredon a case-by-case basis, particularly where those stands are stockedheavily and not being used by owls. Examples may include stands thatwere planted following catastrophic fires or stands previously dominatedby conifers that converted to hardwoods following harvest. Well-documentedjustification is required be<strong>for</strong>e such activities would be allowed.2. Activities must maintain or reduce risk of large-scale natural disturbance.For example, activities would not be implemented if <strong>the</strong>y significantlyincrease <strong>the</strong> risk of windthrow in a stand.3. To promote habitat suitability, thinning operations will leave some treesas snags and o<strong>the</strong>rs as down wood. In addition, some trees may beremoved <strong>for</strong> commercial or fuel hazard reasons.1124. Key attributes of <strong>for</strong>ests inhabited by <strong>the</strong> nor<strong>the</strong>rn spotted owl are <strong>the</strong>irdiversity and variability on individual sites and from site to site. Topromote diversity and variability, a wide range of silvicultural practiceswill be applied, as opposed to reliance on a limited variety of techniques.
5. Activities that comply with <strong>the</strong>se guidelines should provide positiverecovery benefits as demonstrated in Appendix G. Actual implementationexperience, however, is not extensive. A modest rate of implementation isprudent and will provide <strong>the</strong> opportunity to assess and refine activities.Acreage to be manipulated by silvicultural activities will be limited to 5percent of <strong>the</strong> total area in any DCA within <strong>the</strong> initial 5-year period of <strong>the</strong>recovery plan, unless actions concerning large-scale disturbances (asdescribed later) explicitly are justified.6. Some habitat modification activities in DCAs will generate enough revenueto pay <strong>for</strong> <strong>the</strong>mselves. O<strong>the</strong>rs will not and need to be supported byappropriated funds. Since <strong>the</strong> purpose of silvicultural activities in DCAsis to advance recovery, it is not appropriate to conduct only activities thatgenerate a commercial return and ignore <strong>the</strong> needs of stands that cannotbe treated commercially. A balance will be maintained between activitiesin young stands that produce no commercial return and in somewhatolder stands that have <strong>the</strong> potential to produce commercial products.7. <strong>Owl</strong> habitat needs increasingly are well defined. However, all species donot derive comparable benefits through actions designed to improve owlhabitat. To <strong>the</strong> extent feasible, habitat requirements of o<strong>the</strong>r listed orcandidate species also will be considered in planning silvicultural activities.Guidelines<strong>for</strong> Salvage. 'Salvage" is defined as <strong>the</strong> removal of trees from anarea following a stand-replacing event which may result from wind, fire, insectinfestation, or disease. In certain circumstances, salvage operations in DCAsmay be compatible with recovery objectives while providing removal of merchantablewood. For example, salvage could help promote regeneration whereexcessive amounts of coarse woody debris interfere with seedling growth.However, it is important to recognize that tree mortality is a natural processwithin a <strong>for</strong>est ecosystem. Dead, diseased, and damaged trees are key componentsof stand structure and assist in meeting owl needs. Accordingly, toprovide development of suitable owl habitat, DCA management planning mustacknowledge <strong>the</strong> considerable value of leaving dead trees in <strong>the</strong> <strong>for</strong>est as wellas <strong>the</strong> benefits from salvage activities. General guidelines <strong>for</strong> salvage follow.1. The potential <strong>for</strong> benefit from salvage is greatest when stand-replacingevents are involved. Salvage in disturbed sites of less than 10 acres is notappropriate because small <strong>for</strong>est openings are an important component ofold-growth <strong>for</strong>ests. In addition, salvage will occur only in stands in whichdisturbance has reduced canopy closure to less than 40 percent, asstands with more closure are likely to provide dispersal habitat <strong>for</strong> owls.2. Surviving trees will provide a significant residual of larger trees in <strong>the</strong>developing stand. In addition, defects caused by fire in trees may acceleratedevelopment of structural characteristics suitable <strong>for</strong> owls. Also,those trees which eventually die will provide additional snags. Consequently,standing live trees will be retained, including those scorched butlikely to survive. Inspection of <strong>the</strong> cambium layer can provide an indicationof potential tree mortality. All trees that may live should be retained.3. Snags provide a variety of habitat benefits <strong>for</strong> owls. Accordingly, wheredisturbance events leave snags, management will focus on retaining allsnags likely to persist <strong>for</strong> 100 years. During this period, <strong>the</strong> stand doesnot o<strong>the</strong>rwise contribute significant quantities of large diameter snags ordown logs. Snags from <strong>the</strong> original stand may be an important componentof flying squirrel habitat as <strong>for</strong>ests develop after fire. Although <strong>the</strong>reis some uncertainty concerning <strong>the</strong> optimum density of snags to beprovided <strong>for</strong> squirrels, management to provide maximum benefit likely <strong>for</strong>113
this prey species is an appropriate strategy <strong>for</strong> DCAs. There<strong>for</strong>e, snagslarger than 20-inch dbh will be retained.This guideline may need to be refined <strong>for</strong> application in some physiographicprovinces. However, retention of all stems larger than 20-inchdbh is likely to provide <strong>the</strong> highest probability of long-term retention ofsnags throughout <strong>the</strong> owl's range. Management planning in areas suchas nor<strong>the</strong>rn Cali<strong>for</strong>nia may require specific guidance <strong>for</strong> hardwood snagretention, and to provide habitat <strong>for</strong> woodrats, a prey species. In allareas, however, <strong>the</strong> primary focus should be on long-term planning.4. Coarse woody debris (CWD) biomass (i.e., snags and down logs) provideshabitat <strong>for</strong> organisms that are important food of several owl prey species,as well as having o<strong>the</strong>r habitat-enhancing characteristics. In <strong>the</strong> first 100years after a stand-replacing disturbance, <strong>the</strong> amount of CWD added by<strong>the</strong> new stand is not significant, so retaining remnant CWD from <strong>the</strong>previous stand during this time is important. Following a stand-replacingdisturbance, management will provide <strong>for</strong> CWD quantities in <strong>the</strong> newstand which, after 100 years, would be similar to amounts in naturallyregenerated stands at that age. As in <strong>the</strong> case of snags, province-levelspecifications must be provided <strong>for</strong> this guideline. Since decay rates andbiomass naturally remaining at 100 years undoubtedly will vary amongprovinces and <strong>for</strong>est types, <strong>the</strong> specifications also will vary.5. Some salvage that does not meet <strong>the</strong> preceding guidelines will be allowedwhen salvage is essential to reduce <strong>the</strong> risk of fire or insect damage tosuitable owl habitat. This circumstance is most likely to occur in <strong>the</strong>eastern Oregon and eastern Washington Cascades and Cali<strong>for</strong>nia Cascadesprovinces, and somewhat less likely in <strong>the</strong> Oregon and Cali<strong>for</strong>niaKlamath provinces. It is important to understand that some risk associatedwith fire and insects is acceptable because <strong>the</strong>y are natural <strong>for</strong>cesinfluencing <strong>for</strong>est development where owls occur. Consequently, salvageto reduce such risks should be minimal, and considered as an exceptionalpractice.6. Small-scale removal of snags and logs may be necessary to reducehazards to humans along roads and trails and in or adjacent to campgrounds.Where materials must be removed from <strong>the</strong> site, as in a campground,a salvage sale is appropriate. In o<strong>the</strong>r areas, such as alongroads, leaving material on site should be considered. Also, material willbe left where available CWD is inadequate.7. Where green trees, snags, and logs are present following disturbance, <strong>the</strong>above green tree and snag guidelines (discussed earlier in this section)will be applied first, and completely satisfied where possible. The biomassleft in snags can be credited toward <strong>the</strong> amount of CWD biomass neededto achieve management objectives.8. Since remnant CWD may be relatively small after disturbances in youngerstands, diameter and biomass retention guidelines should be consistentwith silvicultural programs designed to regenerate suitable owl habitat.9. Logs present on <strong>the</strong> <strong>for</strong>est floor be<strong>for</strong>e a disturbance event provide habitatbenefits which are likely to continue. It seldom will be appropriate toremove <strong>the</strong>m. In addition, <strong>the</strong>se logs will not be credited toward objectives<strong>for</strong> CWD retention developed after a disturbance event.10. The CWD retained will approximate <strong>the</strong> species composition of <strong>the</strong>original stand, to help replicate preexisting suitable habitat conditions.114
The following section contains an example of <strong>the</strong> application of salvage guidelinesin <strong>the</strong> Douglas-fir/Western Hemlock Zone of <strong>the</strong> western Oregon andWashington Cascades. The example shows how specific guidelines would bedeveloped <strong>for</strong> an area where an old-growth <strong>for</strong>est stand suffered catastrophicdisturbance.Applying Salvage Guidelines in Western Washington and OregonThis example is developed <strong>for</strong> salvage of a hypo<strong>the</strong>tical stand that suffered astand-replacing fire. Prior to <strong>the</strong> fire, <strong>the</strong> stand would have been classified asold-growth. Live tree densities <strong>for</strong> <strong>the</strong> original stand are in Table 3.1Snag RetentionSnag decomposition rates are related inversely to diameter. Equationsdeveloped by McComb and Ohmann (pers. comm.) predict that in westernWashington and Oregon <strong>the</strong> probability of snags less than 20-inch dbhpersisting <strong>for</strong> 100 years is near zero. Above this diameter, probabilities ofsnag survival increase rapidly <strong>for</strong> western hemlock and Douglas-fir.Snags more than 20-inch dbh are especially important <strong>for</strong> cavity-nestingbirds. Nelson (1989) found significant selection by cavity-nesters <strong>for</strong> snagsof this size. Smaller snags were not selected. Carey et al. (1991) andLundquist and Mariani (1991) also found greater use of larger snags. Sinceflying squirrels, an owl prey species, are secondary cavity users, management<strong>for</strong> higher densities of primary cavity-nesters will benefit squirrels and,indirectly, owls. Retention of all snags more than 20-inch dbh will maximize<strong>the</strong> number of residual snags available to flying squirrels, while providingimportant habitat <strong>for</strong> bird species responsible <strong>for</strong> <strong>the</strong> excavation of cavitiesused by squirrels.Application of <strong>the</strong> guidelines <strong>for</strong> salvage to an old-growth <strong>for</strong>est in <strong>the</strong>Oregon Cascades will provide retention of an average of 17 Douglas-fir and 9hemlock snags per acre based on mean live-tree densities (Table 3.1) <strong>for</strong>those <strong>for</strong>ests (Spies pers. comm.). Because of <strong>the</strong> diversity of initial diameters,predicting snag population survivorship is complex. However, projectionsbased on decay rate constants of Harmon et al. (1986) suggest thatabout two Douglas-fir snags per acre will remain in 100 years. The equationsof McComb and Ohmann (pers. comm.) predict that as many as four tosix Douglas-fir and one hemlock snags per acre may persist. These estimatesare within <strong>the</strong> range of densities commonly found in naturally regeneratedstands at that age (Carey et al. 1991, Huff et al. 1991, Spies andFranklin 1991).Table 3.1. Live tree densities in example old-growth western hemlock/Douglas-firstand prior to stand-replacing fire.Stem Density per Acre by Size Class2 to 4 inches 4 to 20 inches 20 to 40 inches 40 to 60 inches 60 inches+Douglas-fir 10 17 8 7 2Westernhemlock 23 33 8 1 0115
After 100 years residual snags will be well decayed and about half will bemore than 15 feet tall (Spies and Franklin 1991). Not all snags will havecavities <strong>for</strong> flying squirrels. In mature <strong>for</strong>ests (80 to 195 years old) inwestern Oregon and Washington, an average of 8 percent of snags morethan 20-inch dbh contained natural cavities and 24 percent had excavatedcavities (Spies and Franklin 1991). Even if natural and excavated cavitieswere in different snags, only about 30 percent of all snags would havecavities, and post-fire retention of all snags more than 20-inch dbh may onlyprovide one or two residual snags per acre with cavities. It is prudentinitially to retain maximum numbers of large snags to provide <strong>for</strong> long-termneeds of cavity-nesters, including flying squirrels.In this scenario, approximately 17 Douglas-fir and 44 hemlock stems peracre between 4- and 20-inch dbh would be available <strong>for</strong> salvage. Thevolume probably would be similar to that removed during commercialthinning. Application of <strong>the</strong> snag guideline provides <strong>for</strong> maximum densitiesof snags at 100 years, while allowing removal of smaller diameter stemswhich would not persist.Log RetentionIn <strong>the</strong> western Oregon Cascades and Oregon Coast Range, most naturallyregenerated conifer <strong>for</strong>ests contain 9 to 18 tons per acre of down logs at 100years of age (Spies et al. 1988). Assuming a 3 percent annual decay rate(Spies et al. 1988) <strong>for</strong> 100 years, about 180 tons per acre of CWD need to beretained to provide this quantity. There<strong>for</strong>e, approximately 50 to 75 percentof <strong>the</strong> original standing biomass of 270 to 360 tons per acre (Spies et al.1988) must remain on <strong>the</strong> site. Down logs with diameters greater than 20inches should be retained selectively. These larger logs will decay relativelyslowly and provide habitat <strong>for</strong> <strong>for</strong>est floor mammals during a relatively longtime period (Carey and Raphael pers. comm.).If regeneration is delayed, significantly greater amounts of CWD must beretained to compensate <strong>for</strong> delaying CWD production by <strong>the</strong> new stand 100years hence. Thus, when areas are salvaged, it is extremely important toregenerate new stands as quickly as possible.If green trees, snags, and logs are on site following <strong>the</strong> disturbance, guidelinesto retain all green trees and all snags with diameters greater than 20inches will be applied first. The guideline <strong>for</strong> logs will reflect <strong>the</strong> amount ofbiomass left in <strong>the</strong> <strong>for</strong>m of snags since this standing material eventually willbecome available as CWD. For example, if snags were estimated to provide90 tons per acre, this amount will be deducted from <strong>the</strong> 180 tons per acrerequired to be left as logs.In any case, where <strong>the</strong> combined biomass of snags and logs greater than 20inches in diameter do not meet retention objectives (e.g., 180 tons per acrein western Oregon and Washington Cascades), additional logs and/or snagsof smaller diameter will be retained.Guidelines to Reduce Riskss of Large-Scale Disturbance. Large-scaledisturbances are natural events, such as fire, that can eliminate owl habitat onhundreds or thousands of acres. Certain risk management activities, if properlyplanned and implemented, may reduce <strong>the</strong> probability of <strong>the</strong>se majorstand-replacing events. There is considerable risk of such events in DCAs in<strong>the</strong> eastern Oregon and eastern Washington Cascades and <strong>the</strong> Cali<strong>for</strong>niaCascades provinces and a lesser risk in <strong>the</strong> Oregon and Cali<strong>for</strong>nia Klamathprovinces (as documented in Appendix F). Elevated risk levels are attributed to116
changes in <strong>the</strong> characteristics and distribution of <strong>the</strong> mixed conifer <strong>for</strong>estsresulting from fire protection. These <strong>for</strong>ests have had repeated insect infestationsand are susceptible to major fires. Risk reduction ef<strong>for</strong>ts are encouragedwhere <strong>the</strong>y are consistent with <strong>the</strong> overall recommendations in this section.Silvicultural ef<strong>for</strong>ts will focus on currently unsuitable habitat in DCAs toaccelerate development of suitable conditions <strong>for</strong> owls while making <strong>the</strong> futurestand less susceptible to natural disturbances. Salvage activities will focus on<strong>the</strong> reduction of insect, disease, and fire threats. Treatments will be designedto provide effective fuel breaks wherever possible. However, <strong>the</strong> scale ofsalvage and o<strong>the</strong>r treatments must not result in erosion of currently suitableowl habitat.Guidelines<strong>for</strong> Coordination of O<strong>the</strong>r Multiple-Use Activities. A variety ofactivities currently occur in DCAs or may be proposed in <strong>the</strong> future. Thehighest priority of DCA management is to meet owl needs and promote recovery,and all activities will be evaluated in that regard. The type and extent ofmultiple-use activities will vary among DCAs, and will be reflected in DCAmanagement plans. It will be necessary to modify or eliminate activities thatpose adverse impacts, and impose seasonal or o<strong>the</strong>r appropriate restrictions onsome o<strong>the</strong>r proposed actions. This may require <strong>the</strong> revision of managementguidelines, procedures, or regulations governing <strong>the</strong>se multiple-use activities.Assessment of all multiple-use activities within one-quarter mile of <strong>the</strong> knownowl activity centers, to determine <strong>the</strong>ir effects on owl reproductive success, willbe included in DCA management plans. Between March 1 and September 1 ofeach year, activities which may disrupt owl breeding will be prohibited under<strong>the</strong> management plan.The following guidelines address activities most likely to require attention inDCA management plans.1. Road Construction and Maintenance. Transportation needs must beassessed <strong>for</strong> <strong>the</strong> DCA itself and <strong>for</strong> adjacent areas. The assessmentshould consider all existing and phmnned activities within <strong>the</strong> DCA.Access to nonfederal lands through DCAs will be considered and existingrights-of-way agreements must be recognized as valid existing rights. Adetermination will be made if existing roads are needed or if closure andrehabilitation is appropriate. Future needs of road access <strong>for</strong> fire protectionmust be considered when identifying roads <strong>for</strong> closure and rehabilitation.Road construction in DCAs <strong>for</strong> silvicultural, salvage, and o<strong>the</strong>r activitiesgenerally is not recommended, unless potential owl habitat benefitsclearly exceed potential costs of habitat impairment. If new roads arenecessary to execute a practice that is o<strong>the</strong>rwise in accordance with <strong>the</strong>seguidelines and an approved DCA management plan, <strong>the</strong>y will be kept to aminimum, be of a temporary nature, be of <strong>the</strong> lowest standard possible toaccomplish <strong>the</strong> intended purpose, and be routed through unsuitablehabitat where possible. Where economically feasible, aerial loggingsystems will be used instead of new road construction.New road construction through DCAs may be necessary to accessnonfederal lands. In <strong>the</strong>se cases, alternate routes that avoid <strong>the</strong> DCAshould be considered. If roads must be routed through a DCA, <strong>the</strong>y willbe designed and located to have <strong>the</strong> least impact on owls and owl habitat.New roads will not be constructed through suitable owl habitat unless noo<strong>the</strong>r feasible alternatives exist.117
2. Fuelwood Ga<strong>the</strong>ring. If allowed, fuelwood ga<strong>the</strong>ring will be restricted toexisting cull decks, blowdown blocking roads, or green trees marked bysilviculturists to thin overstocked unsuitable habitat. These areas will bemapped during preparation of <strong>the</strong> DCA management plan and mitigationrecommendations will be included.3. Mining. The impacts of proposed mining actions should be assessed,and mineral activity permits will include appropriate conditions (e.g.,seasonal or o<strong>the</strong>r restrictions) related to all phases of mineral activity.4. Developments. In general, construction or development of new facilitiesthat may adversely affect owl habitat or reproductive success will notoccur within DCAs. Proposals that address public needs or providesignificant public benefits, such as powerlines, pipelines, or o<strong>the</strong>r publicworks projects, will be reviewed on a case-by-case basis and may beapproved when adverse effects can be minimized and mitigated. Wheneverpossible, such projects should be anticipated and addressed in DCAmanagement plans.5. Trail Development. New trail construction will be planned to have <strong>the</strong>least possible adverse effect on owls. Trails will be located at least onequartermile from owl activity centers and o<strong>the</strong>rwise avoid adverse modificationof suitable owl habitat.6. Land Exchanges. Land exchanges in DCAs will be considered when <strong>the</strong>ywill ei<strong>the</strong>r promote owl recovery or provide owl benefits equal to currentconditions at a lower cost.7. Habitat Improvement Projects. Projects designed to improve conditions<strong>for</strong> fish, wildlife, watershed, range, or recreation will be considered if <strong>the</strong>yprovide owl habitat benefits or enhance <strong>the</strong> likelihood of reproductivesuccess. O<strong>the</strong>r projects will be considered if <strong>the</strong>ir effect on owls or owlhabitat is negligible. These may include small projects required <strong>for</strong>recovery of o<strong>the</strong>r threatened or endangered species. In all cases, appropriateproject management will be provided. For example, watershedrehabilitation projects, such as felling trees along streams, will be coordinatedwith a wildlife biologist and include seasonal restrictions.8. Range Facilities. Range-related facilities that do not affect owls or owlhabitat adversely will be developed in coordination with wildlife biologists.Existing grazing activities which have an adverse effect on owl habitat orowl use of <strong>the</strong> area will be modified.9. Fire Suppression and Prevention. Fuels management within <strong>the</strong> DCAwill be in accordance with guidelines <strong>for</strong> reducing risks of large-scaledisturbances. <strong>Plan</strong>s <strong>for</strong> wildfire suppression will emphasize maintainingowl habitat within <strong>the</strong> DCA. During actual fire suppression activities, aresource specialist familiar with <strong>the</strong> area and <strong>the</strong> DCA management planwill be included to assure that habitat damage is minimized.10. Christmas Tree Sales. Christmas tree sales will be allowed in areaswhere trees are removed in accordance with <strong>the</strong> objective of accelerating<strong>the</strong> development of suitable habitat conditions in areas that currently areunsuitable. The guidelines <strong>for</strong> silvicultural activities will be used asappropriate.11. Minor Forest Products. Minor commercial uses, such as <strong>the</strong> collectionof ferns, mosses, and mushrooms, generally will be allowed. Where <strong>the</strong>seactivities are extensive (e.g., collection of Pacific yew bark), it will be118
appropriate to evaluate whe<strong>the</strong>r <strong>the</strong>y have significant effects on owlhabitat. Restrictions may be appropriate in some cases.12. Recreational Uses. Dispersed recreational uses, including hunting,generally are consistent with <strong>the</strong> objectives of DCAs, except as specificallynoted elsewhere in <strong>the</strong> draft recovery plan.13. Research. A variety of wildlife and o<strong>the</strong>r research activities (e.g., waterquality) may be proposed in DCAs. These activities must be assessed todetermine if <strong>the</strong>y are consistent with DCA management guidelines. Ifagencies address <strong>the</strong> range of <strong>the</strong>se activities explicitly in DCA managementplans, disruption of existing research or disincentives <strong>for</strong> proposedresearch may be avoided, particularly in <strong>the</strong> case of small and widelydispersed experimental <strong>for</strong>estlands.14. Rights-of-Way, Contracted Rights, Easements. Existing and proposedagreements will be evaluated and revised where feasible. In some cases,preexisting agreements may pose legal issues or raise o<strong>the</strong>r concerns thatrequire consideration in <strong>the</strong> DCA management plan.b. O<strong>the</strong>r Federal LandsFor <strong>the</strong> purposes of <strong>the</strong> recovery plan, <strong>the</strong> "matrix" is defined as lands within<strong>the</strong> range of nor<strong>the</strong>rn spotted owls which are outside DCAs. This discussion isspecific to federal matrix lands. <strong>Recovery</strong> contributions from nonfederal matrixlands are described in section III.C.4.Federal matrix lands will make several essential contributions to recovery.Their most basic function is to help maintain adequate habitat conditions toallow movement of owls among DCAs. As described in section III.B., thisinterchange among DCAs is necessary to allow functioning of <strong>the</strong> whole spottedowl population. The second function of <strong>the</strong> matrix is to maintain reproductiveowl pairs, where possible, in areas where DCAs cannot fully meet <strong>the</strong> criteria(section III.C.2) established by <strong>the</strong> recovery plan. These pairs will help supplementDCAs where owl populations or habitat are deficient until those deficienciescan be corrected. In some cases, population deficiencies in DCAs may notbe corrected <strong>for</strong> a long period of time and owl pairs in <strong>the</strong> matrix will remain apart of <strong>the</strong> recovery strategy <strong>for</strong> <strong>the</strong> <strong>for</strong>eseeable future. In o<strong>the</strong>r areas, <strong>the</strong>matrix will be required to support pairs of breeding owls as a safeguard against<strong>the</strong> possibility of large-scale loss of habitat in DCAs from fire, insects, anddisease. Finally, <strong>the</strong> matrix will contain areas of nesting habitat that willpreserve options to reestablish owls throughout <strong>the</strong> landscape.Since habitat conditions and owl populations vary across <strong>the</strong> range, specificobjectives <strong>for</strong> matrix <strong>for</strong>ests also will vary. Four matrix management prescriptionshave been identified. Criteria were developed to determine where <strong>the</strong>seprescriptions will be applied. Those criteria and <strong>the</strong> implementation guidelinesare described in this section. The province narratives (section III.C.4) identify<strong>the</strong> locations where <strong>the</strong> prescriptions will be applied and <strong>the</strong> approximateacreages involved.Recommendations <strong>for</strong> federal matrix management provide <strong>for</strong> a broader mix ofactivities than <strong>the</strong> recommendations <strong>for</strong> <strong>the</strong> DCAs. It is expected that a widevariety of commercial timber activities will occur within <strong>the</strong> matrix, with <strong>the</strong>irtiming and location designed to meet <strong>the</strong> conditions specified <strong>for</strong> <strong>the</strong> matrix.For several matrix management prescriptions, <strong>the</strong> acres on which habitat goalsare met may shift through time. For o<strong>the</strong>r prescriptions, such as <strong>the</strong> reservedpair areas, tighter controls on activities are recommended.119
The application of prescriptions A, B, and C is essential to achieve recovery.Prescription D is recommended as a supplement to prescription A and couldspeed recovery of <strong>the</strong> species while providing benefits to o<strong>the</strong>r species.PRESCRIPTION A -CENTERMAINTAIN DISPERSAL HABITAT AND ACTIVITYManagement objectiveProvide habitat to support dispersing owls and maintain residual habitatareas that protect activity centers<strong>for</strong> pairs and territorial singles in <strong>the</strong>matrix. The o<strong>the</strong>r matrix prescriptions are supplemental to this minimumrequirement.Discussion. The minimum role of <strong>the</strong> matrix is to provide habitat conditionsadequate to assure at least short-term survival of a significant proportion ofdispersing owls (see sections II.A. and III.B.) To achieve species recovery, <strong>the</strong>matrix must play this role. The matrix also must protect a given number ofowl activity centers referred to as residual habitat areas. The size requirement<strong>for</strong> residual habitat areas is based on in<strong>for</strong>mation about home ranges usedduring <strong>the</strong> breeding season. These areas will not meet long-term needs of owls.However, <strong>the</strong>y will provide areas of high-quality habitat <strong>for</strong> dispersing owls,prevent <strong>the</strong> direct elimination of nesting areas, and provide cores of suitablehabitat to preserve future options <strong>for</strong> managing owls in <strong>the</strong> matrix. Given <strong>the</strong>recovery objective to reestablish owls throughout <strong>the</strong> landscape, providingresidual habitat areas is essential.Criterion <strong>for</strong> applying prescriptionManagement to achieve <strong>the</strong>se minimum matrix objectives will be practiced onfederal lands throughout <strong>the</strong> range of <strong>the</strong> owl where <strong>for</strong>ests are sufficientlyproductive to attain <strong>the</strong> conditions specified.Management guidelines<strong>for</strong> prescription AI .The number of residual habitat areas to be provided is based on densitiesof owl pairs observed in study areas. These target densities vary byprovince where appropriate (Table 3.2).Table 3.2. Density of residual habitat areasPhysiographic ProvinceAreasPer TownshipOlympic Peninsula 4Western Washington Cascades 6Eastern Washington Cascades 6Western Oregon Cascades 8Eastern Oregon Cascades 6Oregon Coast RangeKlamath (Oregon and Cali<strong>for</strong>nia)810Cali<strong>for</strong>nia Coast RangeCali<strong>for</strong>nia Cascades106120
2. Residual habitat areas will be provided <strong>for</strong> all known and newly discoveredpairs and territorial singles up to this density.3. Each residual habitat area will include a minimum of 100 acres of suitablehabitat as close to <strong>the</strong> nest site or activity center as possible. This isintended to preserve an intensively used portion of <strong>the</strong> breeding seasonhome range. Timber management within this area is not appropriate.Management around <strong>the</strong> area will be designed to reduce <strong>the</strong> risks ofnatural and human-caused disturbance.4. At least 50 percent of <strong>the</strong> federal <strong>for</strong>est matrix outside of <strong>the</strong> DCAs will bemanaged to provide stands of trees that average at least 11 inches dbhand have at least 40 percent canopy closure. This guideline will beapplied on each quarter-township, and will be calculated based on <strong>the</strong>amount of federal land within that quarter-township. Calculation shouldbe made separately <strong>for</strong> lands managed by each of <strong>the</strong> federal agencies.All <strong>for</strong>ested land that is capable of attaining <strong>the</strong> 1 -inch dbh standardand <strong>the</strong> 40 percent canopy closure standard will be included in <strong>the</strong>calculation. Hardwoods may be included in meeting <strong>the</strong> canopy closureguideline, but excluded from <strong>the</strong> diameter calculation where <strong>the</strong>y normallydo not attain that size. Canopy contribution will be counted only<strong>for</strong> evergreen hardwoods. There should be reasonable flying space under<strong>the</strong> hardwood canopy (i.e., 6 or more feet between <strong>the</strong> bottom of <strong>the</strong>hardwood canopy and <strong>the</strong> top of <strong>the</strong> shrub layer). Reserved pair areas(see matrix prescription B), managed pair areas (see matrix prescriptionC), and residual habitat areas may be included in <strong>the</strong> calculation.In general, a stand meets <strong>the</strong> guideline if <strong>the</strong> tree of average basal area isat least 11 inches dbh and <strong>the</strong> total canopy closure is more than 40percent. However, where <strong>the</strong>re is much variation in dbh, <strong>the</strong> intent isthat 40 percent canopy closure be contributed by trees which meet <strong>the</strong>1 -inch dbh standard.PRESCRIPTION B -SUPPLEMENT DCA NETWORKManagement objectiveProvide habitat (reserved pair areas)<strong>for</strong> pairs and territorial singles in <strong>the</strong>matrix to supplement <strong>the</strong> DCA network where <strong>the</strong> network is deficientbecause itfails to meet: 1) spacing criteria; 2) criteria<strong>for</strong> existing habitatacreage: and/or 3) criteria <strong>for</strong> ei<strong>the</strong>r existing pairs orfuture pairs.Discussion. Existing habitat and landownership conditions make it impossibleto implement a fully adequate network of DCAs across <strong>the</strong> owl's entire range.At numerous locations <strong>the</strong> existing distribution of habitat and/or owls necessitateddeviation from <strong>the</strong> size, spacing, or owl numbers criteria (section III.C.2).Where <strong>the</strong>se deficiencies are significant, it is important to supplement <strong>the</strong>DCAs by maintaining additional suitable habitat and owl locations in <strong>the</strong>matrix. This rein<strong>for</strong>cement of <strong>the</strong> matrix population will improve stability of<strong>the</strong> owl population in <strong>the</strong> DCA and provide additional assurance of dispersalsuccess across <strong>the</strong> matrix.Criteria <strong>for</strong> applying prescriptionReserved pair areas will be established where any of <strong>the</strong> following conditionsoccur:Category 1 DCAs contain less than 15 currently known pairs and territorialsingles, or have a current expected capability to support fewer than 20 pairs of121
owls. (Refer to tables in section III.C.4, <strong>for</strong> identification of <strong>the</strong>se areas.) Seemanagement guidelines 1 and 2 (later in this section) <strong>for</strong> actions to be taken in<strong>the</strong>se cases.Category 1 DCAs are more than 12 miles apart, or category 2 DCAs are morethan 7 miles apart. If category 2 DCAs are relatively large (i.e., 10 pairs), <strong>the</strong>nit may be appropriate to modify this criterion to allow greater distances than 7miles. See management guideline 3 <strong>for</strong> action to be taken in this case.O<strong>the</strong>r areas are identified on a case-by-case basis. These could include areaswhere 1) only small category 2 DCAs (i.e., two-pair areas) could be delineatedor 2) where overall owl densities in <strong>the</strong> DCA network fail to meet densities thatwould be obtained if all guidelines (section III.C.2) <strong>for</strong> <strong>the</strong> DCA network werefully met. See management guideline 3 <strong>for</strong> action to be taken in this case.Management guidelines <strong>for</strong> prescription B (assumes implementation ofprescription A)1. In areas where DCAs do not currently contain sufficient owl pairs andterritorial singles, provide reserved pair areas <strong>for</strong> matrix pairs or territorialsingles to increase to 15 <strong>the</strong> total known owl activity centers associatedwith a given category 1 DCA. The standard here is set at 15 known pairsor territorial singles ra<strong>the</strong>r than 20 because some pair sites in a DCAmight not be occupied at any given point in time. This value was derivedfrom a table of expected occupancy of areas given different numbers ofinteracting pair sites and different amounts of suitable habitat in <strong>the</strong> area(Voss and Noon pers. comm.).2. Where category 1 DCAs contain inadequate suitable habitat to support atleast 20 owl pairs, reserved pair areas will be established so that <strong>the</strong> totalamount of habitat associated with a given category 1 DCA is adequate tosupport 20 owl pairs.3. For areas that do not meet <strong>the</strong> distribution distance criterion, or o<strong>the</strong>rspecial emphasis areas, provide enough reserved pair areas so that <strong>the</strong>total pair density at least equals that which would be obtained if allguidelines <strong>for</strong> <strong>the</strong> DCA network were met. This density is two pairs pertownship.4. To identify reserved pair areas, search <strong>for</strong> pairs and habitat that are asclose as possible to <strong>the</strong> DCAs.5. For each reserved pair area, delineate an area surrounding <strong>the</strong> activitycenter with an acreage at least equal to <strong>the</strong> median home range size <strong>for</strong>pairs. Use data from <strong>the</strong> study area that is most similar to <strong>the</strong> site beingconsidered (Table 2.1). This area will be delineated to encompass asmuch suitable habitat as possible, and that habitat will be as close to <strong>the</strong>acti-vity center as possible. Reserve all suitable habitat within that areafrom timber harvest. If this habitat acreage does not at least equal <strong>the</strong>median amount found <strong>for</strong> pairs in <strong>the</strong> province (Table 2.2), additionalhabitat must be provided from 1) <strong>the</strong> next best habitat available within<strong>the</strong> home range area, or 2) additional habitat outside <strong>the</strong> home rangearea.6. Within <strong>the</strong>se reserved pair areas, allow <strong>for</strong> management of currentlyunsuitable areas consistent with DCA management guidelines.7. Wherever located, reserved pair areas will count toward <strong>the</strong> residualhabitat area densities <strong>for</strong> prescription A. Residual habitat areas whichare not required as reserved pair areas will continue to be managed underprescription A.122
PRESCRIPTION C -REDUCE THREAT FROM DISTURBANCEManagement objectiveIn addition to <strong>the</strong> minimum requirements of prescription A, provide habitat(managed pair areas)<strong>for</strong> pairs and territorial singles in <strong>the</strong> matrix tosupplement DCA populations in areas where <strong>the</strong>re is significant threat oflarge-scale disturbance in DCAs.Discussion. The probability of large-scale disturbances in DCAs in differentprovinces across <strong>the</strong> range of <strong>the</strong> owl was assessed by Agee and Edmonds(Appendix F). In <strong>the</strong> Oregon and Cali<strong>for</strong>nia Klamath provinces and <strong>the</strong> easternCascades provinces of Oregon and Washington, <strong>the</strong>re is significant probabilityof large-scale disturbances to <strong>the</strong> majority of DCAs due to insects, diseases,and fires.Several factors help to compensate <strong>for</strong> this potential threat to <strong>the</strong> DCA network.First, design of <strong>the</strong> DCA network helps to buffer owl populations againstcatastrophic loss in any individual DCA. Second, as noted in section III.C.2.and Appendix F, some <strong>for</strong>ms of active management (e.g., fuels management)may help to reduce <strong>the</strong> risk of large-scale disturbance within <strong>the</strong> DCAs. Finally,prescription C calls <strong>for</strong> innovative management to be used within <strong>the</strong>matrix to help provide <strong>for</strong> breeding owls in <strong>the</strong>se managed <strong>for</strong>ests. This willreduce <strong>the</strong> dependence of owl populations on <strong>the</strong> DCA habitat.Criterion <strong>for</strong> applying prescriptionFor application of this prescription, an area must lie within high-risk portionsof provinces identified by Agee and Edmonds (Appendix F) as having a lowprobability of long-term maintenance under a strategy where habitat is notmanaged but is protected from fire. This prescription will be applied immediatelyto <strong>the</strong> eastern Washington Cascades province because <strong>the</strong> spotted owlpopulation in that province is at high risk from large-scale disturbance and isessential to support <strong>the</strong> overall owl population in Washington. Application ofthis prescription to <strong>the</strong> eastern Oregon Cascades, <strong>the</strong> Cali<strong>for</strong>nia Cascades, and<strong>the</strong> Oregon and Cali<strong>for</strong>nia Klamath provinces also should be considered but isnot included as an immediate recommendation.Management guidelines<strong>for</strong> prescription C (assumes <strong>the</strong> implementation ofprescription A)1. For all pair or territorial single activity centers identified under prescriptionA, provide additional suitable habitat in an area approximating <strong>the</strong>size of a pair home range surrounding <strong>the</strong> activity center.The size of this area will be determined from median home range data<strong>for</strong> <strong>the</strong> province (Table 2.1). Use data from <strong>the</strong> study area that is mostsimilar to <strong>the</strong> site being considered. The amount of suitable habitatwithin this area will approximate <strong>the</strong> median amount observed withinpair home ranges <strong>for</strong> that same study area (Table 2.2).2. This habitat may be maintained through time using various managementtechniques. Some uncertainty will be accepted in <strong>the</strong> use ofmanagement to provide habitat in <strong>the</strong>se areas. Management will bedesigned to provide suitable habitat conditions and to alleviate <strong>the</strong><strong>for</strong>est conditions leading to significant threat of large-scale disturbance.Refer to Appendix G <strong>for</strong> examples of management techniques useful inproviding <strong>for</strong> suitable habitat conditions through time.123
PRESCRIPTION D -RETAIN OWLS IN MANAGED LANDSCAPEManagement objectiveIn addition to <strong>the</strong> minimum requirement of prescription A, use a combinationof silvicultural manipulations and habitat reserves to permanentlysupport owl pairs and territorial singles. This is recommended in order to:1) reduce <strong>the</strong> overall decline in population; 2) move toward total landscapemanagement<strong>for</strong> owls; 3) provide opportunities to experiment with spec fichabitat management techniques, and 4) provide benefits <strong>for</strong> o<strong>the</strong>r species.While prescriptions A, B, and C are essential <strong>for</strong> recovery, prescription D isrecommended to speed recovery but is not considered essentiaLDiscussion. The long-term goal of <strong>the</strong> recovery plan is to move from a landscapecomposed of protected areas and matrix toward a landscape whereconditions provide <strong>for</strong> a more continuous distribution of owls. Un<strong>for</strong>tunately,many of <strong>the</strong> actions that might be taken in <strong>the</strong> short-term could impede ra<strong>the</strong>rthan promote achievement of this goal. Effective pursuit of <strong>the</strong> goal requiresthree management commitments. First, some active <strong>for</strong>ms of management incurrently unsuitable younger stands within <strong>the</strong> DCAs should begin. Second,such techniques also should be applied in unsuitable habitat in <strong>the</strong> matrix tofacilitate <strong>the</strong> development of suitable habitat in <strong>the</strong> matrix. Finally, <strong>the</strong>re mustbe ef<strong>for</strong>ts to retain owls and suitable habitat in <strong>the</strong> matrix and to begin experimentingwith active <strong>for</strong>ms of management that will sustain habitat over time.Such management could include uneven-aged silviculture and management onlong rotations. The latter two actions to support owls in <strong>the</strong> matrix will have avariety of benefits, including slowing <strong>the</strong> expected rate of overall owl populationdecline and possible benefits to o<strong>the</strong>r species (see Appendix D).Application of this prescription may be particularly beneficial in several instances.It may be useful in areas where owls exist at relatively high densitieswell-distributed over <strong>the</strong> landscape. An example of such an area is <strong>the</strong> westernOregon Cascades province. Implementation of <strong>the</strong> DCA strategy in this provincewithout additional measures in <strong>the</strong> matrix could result in a significantdecline in <strong>the</strong> owl population. Such a decline would retard progress towardrecovery.Conversely, it may be beneficial to retain owls in <strong>the</strong> matrix in areas where <strong>the</strong>population outside DCAs is sparse. In such cases, removal of <strong>the</strong> few remainingowls from <strong>the</strong> matrix also seriously will impede <strong>the</strong> long-term goal tomanage <strong>for</strong> owls across <strong>the</strong> landscape.In addition, it would be useful to apply <strong>the</strong> prescription where it can benefito<strong>the</strong>r species in <strong>the</strong> following categories:1. Federally listed species or candidates <strong>for</strong> listing known to be associatedwith older <strong>for</strong>ests.2. Species with restricted ranges and associations with older <strong>for</strong>estswhere <strong>the</strong>ir ranges are not substantially included in existing DCAs.Criterion <strong>for</strong> applying prescriptionThis prescription could be applied in any part of <strong>the</strong> matrix.Management guidelines <strong>for</strong> prescription D (assumes <strong>the</strong> implementation ofprescription A)1241. Provide managed pair areas in an area approximating <strong>the</strong> size of a pairhome range surrounding <strong>the</strong> activity center. The size of this area and
amount of suitable habitat should be determined from home range data<strong>for</strong> study sites most similar to <strong>the</strong> site being considered (Tables 2.1 and2.2). This habitat may be maintained through time using various managementtechniques. Some uncertainty will be accepted in <strong>the</strong> use ofmanagement to provide habitat in <strong>the</strong>se areas. This habitat is not arequirement of recovery.2. As an alternative, habitat may be provided and distributed throughout<strong>the</strong> matrix area ra<strong>the</strong>r than focused on owl activity centers. For example,<strong>the</strong> objective <strong>for</strong> matrix management could be to maintain 10 percentsuperior habitat and 20 percent marginal habitat (Thomas et al. 1990) in<strong>the</strong> matrix at all times. A combination of habitat retention and habitatmanagement could be used to achieve <strong>the</strong> objective, with existing allocationscontributing where <strong>the</strong>y provide appropriate conditions. Under thisalternative, residual habitat areas still would be a requirement. The acresin residual habitat areas will contribute to <strong>the</strong> total that is to be maintainedas superior habitat.125
126
III.C.3. ImplementationFederal landsFederal agency planning.Federal agencies should review <strong>the</strong> draft recovery plan to determine if it providesadequate assurance of recovery and can be implemented in an efficientmanner. The <strong>Recovery</strong> Team will review agency comments on <strong>the</strong> draft planand will work with <strong>the</strong> agencies to incorporate <strong>the</strong>ir comments in <strong>the</strong> finalrecovery plan.The recovery plan was prepared under <strong>the</strong> assumption that agency activitiessubmitted <strong>for</strong> consultation after January 1, 1993, will be consistent with itsrecommendations. Actions in areas of special concern should be made consistentwith <strong>the</strong> recovery plan as soon as <strong>the</strong> final plan is approved. If agenciesact inconsistently with <strong>the</strong> recovery plan <strong>for</strong> an extended period, reductions inowl populations and in <strong>the</strong> amount and quality of owl habitat could haveresults that were not anticipated during <strong>the</strong> plan's development. Such reductionsmight require a reevaluation of <strong>the</strong> recovery plan to determine whe<strong>the</strong>r itwould still provide sufficient assurance of recovery.After <strong>the</strong> final recovery plan is approved, federal agencies, <strong>the</strong> states, and <strong>the</strong>private sector will need advice and assistance on various aspects of implementation.The recovery plan recommends <strong>the</strong> establishment of a coordinatinggroup to carry out <strong>the</strong>se functions (see section III.C.5.). The group should beestablished upon approval of <strong>the</strong> final recovery plan or as soon <strong>the</strong>reafter asfeasible. The <strong>Recovery</strong> Team should remain in existence to provide advice andnecessary support until <strong>the</strong> coordinating group is established.Implementation of <strong>the</strong> recovery plan will require that agencies with authorityover <strong>for</strong>estlands comply with o<strong>the</strong>r legal mandates in addition to <strong>the</strong> EndangeredSpecies Act. The BLM must implement <strong>the</strong> recovery plan in a mannerconsistent with <strong>the</strong> Federal Land Policy and Management Act (FLPMA) andNational Environmental Policy Act (NEPA). The Forest Service must implement<strong>the</strong> plan in a manner consistent with <strong>the</strong> National Forest Management Act(NFMA) and NEPA. Full implementation of <strong>the</strong> recovery plan should be completedwithin 5 years. The anticipated schedule <strong>for</strong> implementation is outlinedin section III.C.3.Critical Habitat Designation.The recovery plan recommends that federal lands in DCAs, o<strong>the</strong>r than nationalparks and wilderness areas, be designated as critical habitat <strong>for</strong> <strong>the</strong> nor<strong>the</strong>rnspotted owl. The <strong>Recovery</strong> Team does not recommend designation of any o<strong>the</strong>rareas as critical habitat at this time. If progress toward reaching recoverygoals does not proceed as quickly as anticipated, <strong>the</strong>n designation of additionalcritical habitat may become appropriate in <strong>the</strong> future. The FWS should initiateef<strong>for</strong>ts to revise designated critical habitat as soon as <strong>the</strong> recovery plan isapproved.127
DCA Management <strong>Plan</strong>s.The recovery plan recommends that management plans be prepared <strong>for</strong> eachdesignated conservation area (DCA). These plans are an essential componentof <strong>the</strong> ef<strong>for</strong>t to implement recovery, as <strong>the</strong>y will provide a framework andobjectives <strong>for</strong> carrying out specific activities, monitoring <strong>the</strong>ir progress, andevaluating contributions toward recovery. The <strong>Recovery</strong> Team <strong>the</strong>re<strong>for</strong>erecommends that <strong>the</strong> Forest Service, <strong>the</strong> BLM, and <strong>the</strong> National Park Serviceinitiate ef<strong>for</strong>ts to prepare <strong>the</strong>se plans at an early date. Where practicable,plans <strong>for</strong> areas of concern should be given priority. Guidelines <strong>for</strong> preparationof <strong>the</strong>se plans are contained in section III.C.2. and Appendix E. The suggestedcoordinating group would provide fur<strong>the</strong>r guidance upon request from <strong>the</strong>agencies.Consultation with <strong>the</strong> FWS.At <strong>the</strong> request of <strong>the</strong> FWS, <strong>the</strong> <strong>Recovery</strong> Team has considered some of <strong>the</strong>issues that must be addressed during consultation.1. Programmatic consultation.Federal agencies may consult with <strong>the</strong> FWS on site-specific actions, suchas proposed timber sales, or on programmatic actions, such as a proposed<strong>for</strong>est plan. In a programmatic review, <strong>the</strong> FWS considers impacts of aseries of proposed actions that subsequently may be carried out during aperiod of several years. This approach is far more appropriate than attemptingto evaluate <strong>the</strong> effects of each separate action. Programmaticreview also is beneficial <strong>for</strong> <strong>the</strong> land management agencies because onceconsultation is complete, activities taken in accordance with <strong>the</strong> proposedprogram and <strong>the</strong> biological opinion may occur without fur<strong>the</strong>r FWS review(unless new in<strong>for</strong>mation is discovered that warrants reinitiation of consultation).Programmatic consultation also increases efficiency, <strong>the</strong>rebyenabling <strong>the</strong> FWS to increase <strong>the</strong> technical assistance it provides to agencies.Consequently, <strong>the</strong> recovery plan recommends that consultationsrelated to implementation of <strong>the</strong> recovery plan be carried out on a programmatic,ra<strong>the</strong>r than site-specific, basis.Agency proposals to adopt <strong>the</strong> final recovery plan would be appropriate <strong>for</strong>consultation and would facilitate programmatic review of activities affecting<strong>the</strong> owl. "Adopt," in this context, means making a <strong>for</strong>mal commitment in arecord of decision of o<strong>the</strong>r similar document 1) to establish DCAs in amanner consistent with <strong>the</strong> recovery plan's recommendations, and 2) tofollow <strong>the</strong> guidelines <strong>for</strong> managing <strong>the</strong> DCAs and <strong>the</strong> matrix. Such adocument would provide an adequate basis <strong>for</strong> completion of consultationon activities in <strong>the</strong> matrix. Specifying impacts in DCAs in sufficient detailto complete consultation may be difficult until a DCA management plan isapproved. Consultation should be initiated prior to any action in DCAsthat might affect nor<strong>the</strong>rn spotted owls until a DCA management plan hasbeen approved and section 7 consultation on <strong>the</strong> plan has been completed.2. Rate at which take may occur without compromising recovery.128The recovery plan includes several components designed to ensure thatincidental take does not occur too rapidly in <strong>the</strong> matrix. Reserved pairareas and managed pair areas will be established in <strong>the</strong> matrix, an intensivemonitoring program will be initiated, and <strong>the</strong> recovery plan will bereviewed and revised periodically. The planning processes in <strong>the</strong> federalagencies also restrict <strong>the</strong> rate at which habitat, and thus owl populations,will disappear in <strong>the</strong> matrix. These measures should provide adequateconstraints on <strong>the</strong> rate at which incidental take occurs.
3. Activities that may result in destruction or adverse modification of criticalhabitat.The recovery plan establishes guidelines <strong>for</strong> <strong>the</strong> management of DCAs and<strong>the</strong> preparation of DCA management plans. The <strong>Recovery</strong> Team recommendsthat <strong>the</strong> FWS use <strong>the</strong>se guidelines in determining whe<strong>the</strong>r proposals<strong>for</strong> actions within DCAs, or <strong>for</strong> adoption of DCA management plans,would result in <strong>the</strong> destruction or adverse modification of critical habitat.The recovery plan recommends that critical habitat be revised to con<strong>for</strong>mwith DCA boundaries, and recommends, in <strong>the</strong> interim, that <strong>the</strong> FWSutilize <strong>the</strong> matrix management prescriptions (section III.C.2.) in analyzing<strong>the</strong> impact of actions in critical habitat outside of DCAs.4. Relationship between agency actions.The <strong>Recovery</strong> Team considered <strong>the</strong> potential relationship between <strong>the</strong>actions of different agencies. Clearly, recovery will be achieved morerapidly and effectively if all agencies comply with <strong>the</strong> recovery plan in atimely manner. Substantial lack of compliance could delay or precluderecovery. Agency actions that do not comply with <strong>the</strong> recovery plan will berequired to individually satisfy <strong>the</strong> mandate of section 7 consultation interms of adverse modification of critical habitat or jeopardy to <strong>the</strong> species.However, <strong>the</strong> accumulated impacts of actions not consistent with <strong>the</strong>recovery plan could eventually necessitate redesign of <strong>the</strong> recovery plan ina particular area. This may result in greater restrictions on timber harvestactivities, including those of agencies that have complied with <strong>the</strong> recoveryplan.Past and current actions of each agency affect o<strong>the</strong>r agencies throughimpacts on <strong>the</strong> rangewide habitat condition and spotted owl populations.Impacts of actions that may affect spotted owls are evaluated in light ofthis baseline condition. However, due to location and ownership patterns,<strong>the</strong> recovery plan envisions little opportunity to substitute greater contributionsfrom one agency <strong>for</strong> lesser contributions from ano<strong>the</strong>r. This isparticularly true in <strong>the</strong> case of DCAs, but also applies to <strong>the</strong> matrix.Consequently, <strong>the</strong> recovery plan generally anticipates that, during <strong>the</strong> nextfew years, actions proposed by one agency are unlikely to significantlyaffect <strong>the</strong> outcome of consultations on actions proposed by o<strong>the</strong>r agencies.Nonfederal landsThe explicit federal duties described in <strong>the</strong> Endangered Species Act, combinedwith <strong>the</strong> concentration of nor<strong>the</strong>rn spotted owls on lands administered by <strong>the</strong>Forest Service and BLM, give <strong>the</strong> federal government a dominant role inproviding <strong>for</strong> recovery of <strong>the</strong> species. Nonfederal lands, however, compriseimportant portions of <strong>the</strong> spotted owl's range where federal contributions aloneare not sufficient to meet recovery goals. <strong>Recovery</strong> goals <strong>for</strong> each provincecontain objectives <strong>for</strong> nonfederal lands, although <strong>the</strong> amount and type ofcontribution vary (see section IIl.C.4.).Current protection af<strong>for</strong>ded spotted owls on nonfederal lands derives from <strong>the</strong>Endangered Species Act's prohibition against <strong>the</strong> taking of listed species. TheFWS developed biological guidance in July 1990 <strong>for</strong> reducing <strong>the</strong> risk ofviolating <strong>the</strong> take prohibition. The guidance recommends that landownerssurvey <strong>for</strong> spotted owls prior to timber harvest and avoid reducing habitatbelow prescribed amounts within circles around nests or activity centers(Section II.C.). This protection applies unless effective alternate measures areimplemented through habitat conservation planning (under section 10 of <strong>the</strong>129
Endangered Species Act) or through regulations adopted in compliance withsection 4(d) of <strong>the</strong> act.Several measures are available to achieve recovery through alternatives thatwould be more effective than maintenance of <strong>the</strong> current take circles (see tools<strong>for</strong> implementing recovery on nonfederal lands in this section). <strong>Recovery</strong> goalimplementation likely will differ by state due to <strong>the</strong> variations in <strong>the</strong> degree offederal ownership by province, states' authorities, and availability of in<strong>for</strong>mationabout <strong>the</strong> owls. Protective management, which encourages creativeapproaches to recovery goal implementation, is a likely alternative to maintenanceof take circles. States, landowners, <strong>the</strong> FWS would negotiate with statewildlife agencies and o<strong>the</strong>r interested parties to develop a plan to improvespecies protection and landowners' ability to manage <strong>the</strong>ir land. The EndangeredSpecies Act allows protective management to serve as <strong>the</strong> basis <strong>for</strong> ei<strong>the</strong>rconservation plans (section 10 of <strong>the</strong> Endangered Species Act) or special rules(section 4(d)).Incentives to Participate in Protective Management.Biologists, landowners, communities, and government agencies share severalincentives to participate in protective management:1. Managementflexibility<strong>for</strong> owl protection and timber harvest planning.A plan could tailor protection to fit <strong>the</strong> owl population's long-term habitatrequirements, with less emphasis on short-term protection of individualsand pairs. Long-term protection could be adjusted across <strong>the</strong> landscape toimprove <strong>the</strong> configuration of owl habitat blocks and to complement reserveson federal lands more effectively. The FWS could authorize anincreased level of take if assurances were provided by landowners thatlong-term, effective mitigation ef<strong>for</strong>ts would be implemented providing <strong>the</strong>needed level of support <strong>for</strong> recovery. Measures such as designatingcertain areas to be protected or instituting FWS-approved habitat managementplans might be more attractive to landowners than continuing takecircles and annual surveys.2. Certainty of owl protection and timber harvest planning.Landowners would manage <strong>for</strong> long-term owl habitat needs, providing abetter guarantee of habitat than <strong>the</strong> transient and potentially vulnerablecircles (see section II.C.). Landowners <strong>the</strong>n could plan timber harvestbased on <strong>the</strong> certainty of knowing which areas would be affected by owlprotection.3. Cost reduction of owl protection.Perhaps <strong>the</strong> most compelling incentive <strong>for</strong> landowners to participate in analternative conservation program is a significant reduction of <strong>the</strong> costs ofowl protection <strong>the</strong>y now incur including: a) maintenance of habitat withincurrent take circles; b) conducting annual owl surveys; and c) administrativecosts associated with compliance with state <strong>for</strong>est practices regulationsprotecting listed species (see section II.C. <strong>for</strong> description of each state'sregulations).4. Authorizing incidental take in exchange <strong>for</strong> implementing conservationmeasures identified in <strong>the</strong> recovery plan.Consistent with <strong>the</strong> Endangered Species Act, landowners could be authorizeda level of incidental take through <strong>the</strong> HCP or 4(d) process if <strong>the</strong>y are130
found to exceed protection called <strong>for</strong> in <strong>the</strong> conservation objectives, allowing<strong>the</strong>m to plan future timber harvests (see section II.C.).5. Relaxation of owl conservation requirements on federal lands in response toincreased ef<strong>for</strong>ts on nonfederal lands.Some nonfederal landowners are more willing to contribute to owl recoveryif <strong>the</strong>y see that <strong>the</strong>ir ef<strong>for</strong>ts can lead to a reduction of conservation requiredon federal lands.Guidelines<strong>for</strong> protective management.1. Protective management should provide <strong>for</strong> <strong>the</strong> identified recovery objectives<strong>for</strong> nonfederal lands while placing <strong>the</strong> minimum burden on landownersnecessary to achieve those conservation objectives.2. Explicit goals <strong>for</strong> nonfederal lands should describe when recovery would bereached and how a landowner's ef<strong>for</strong>ts would contribute to overall recovery.Protective management should be based on <strong>the</strong> recovery plan's identificationof <strong>the</strong> amount, spatial and temporal configuration, and function of <strong>the</strong>necessary habitat; and <strong>the</strong> target number of individuals and populationtrends required to meet delisting goals. The protective management planshould describe <strong>the</strong> specific implementation actions needed to implement<strong>the</strong> recovery plan's provincial goals.3. Incentives, ra<strong>the</strong>r than disincentives, should be provided <strong>for</strong> finding owls,when consistent with <strong>the</strong> Endangered Species Act. Possible incentivesinclude: a) landowner flexibility in where <strong>the</strong>y protect habitat, b) reductionof total area required <strong>for</strong> protection, c) off-site mitigation <strong>for</strong> owl protection,or d) relaxation of restrictions on adjacent federal lands. Based on <strong>the</strong>recovery plan's description of contribution from nonfederal lands, landownerscould be authorized some amount of incidental take where conservationmeasures had been implemented.4. A protective management plan should explain <strong>the</strong> variation in owl protectionrequirements based on biological and physiographic distinctions and<strong>the</strong> degree of federal conservation by province, so that <strong>the</strong> public willunderstand <strong>the</strong> basis <strong>for</strong> differences in federal and state owl protectionregulations.5. Protective management plans should start with <strong>the</strong> recovery plan's assessmentof <strong>the</strong> take prohibition.The protective management plan should be based on <strong>the</strong> recovery plan'sgeneral assessment of <strong>the</strong> amount and rate of incidental take that can beallowed on nonfederal lands where conservation mechanisms are being putinto place to accomplish recovery goals <strong>for</strong> a province. The protectivemanagement plan should identify where implementation of provincerecovery objectives cannot allow incidental take. Where possible, <strong>the</strong>allowable amount and rate should be identified. The <strong>for</strong>m and pattern oflandowner contribution to recovery can be negotiated. If areas are identifiedwhere protection of individual owls is not essential <strong>for</strong> conservation,incidental take could be permitted with minimal mitigation required. Theprotection of owls beyond <strong>the</strong> level needed could be considered as mitigation<strong>for</strong> impacts on owls in o<strong>the</strong>r nearby areas.Land purchase and exchange should be considered <strong>for</strong> nonfederal areasessential to recovery that do not have take prohibitions to serve as anincentive to negotiate conservation with landowners.131
6. Costs to landowners should be reduced.The protective management plan should identify and analyze <strong>the</strong> cost ofconservation options, and encourage selection of <strong>the</strong> lowest cost option.The protective management plan should minimize <strong>the</strong> cost of owl protection<strong>for</strong> small acreage landowners who are less able than <strong>the</strong>ir neighborswith larger acreages to negotiate owl protection. Take circles may cover asubstantial portion of <strong>the</strong>ir land, often <strong>for</strong> owls on adjacent ownerships,disproportionately restricting access to <strong>the</strong>ir small holdings. The conservationplan could recommend that <strong>the</strong>se landowners contribute to conservationin an alternative manner.The cost of protective management itself should be paid in such a way thatlandowners' incentive of cost reduction is not eliminated. If landowners arerequired to bear <strong>the</strong> full cost of protective management, <strong>the</strong>y may find that<strong>the</strong> planning costs outweigh savings from changes in take prohibitions.For instance, state wildlife agencies could be funded to help landownerswrite <strong>the</strong> plans.7. The protective management plan should recognize <strong>the</strong> role of state regulators.The plan should acknowledge <strong>the</strong> extent to which states have <strong>the</strong>authority to: a) en<strong>for</strong>ce an agreement between <strong>the</strong> FWS and landowners;and b) con<strong>for</strong>m state regulatory measures to <strong>the</strong> requirements of <strong>the</strong> plan.States also may have requirements independent of take prohibitions thatshould be assessed in <strong>the</strong> plan.8. The feasibility and timing of implementation, such as <strong>the</strong> development ofnew state rules, legislative actions, board/commission approval of rules,and availability of funding, should be assessed.Habitat Conservation <strong>Plan</strong>s. Habitat conservation plans (HCPs) (see SectionII.C.4.) provide an excellent opportunity <strong>for</strong> nonfederal landowners to participatein <strong>the</strong> development of protective management plans. Cali<strong>for</strong>nia has beendeveloping HCPs <strong>for</strong> nor<strong>the</strong>rn spotted owls during <strong>the</strong> past few years. A fewcompanies have developed HCPs and signficiant progress has been made ondeveloping a statewide HCP. These ef<strong>for</strong>ts should be assisted and encouragedby <strong>the</strong> <strong>Recovery</strong> Team.Regulations under section 4(d) of <strong>the</strong> Endangered Species Act.For endangered animals, section 9 of <strong>the</strong> act directly prescribes prohibitionsagainst taking. Take is defined broadly under <strong>the</strong> act as "harass, harm,pursue, hunt, shoot, wound, kill, trap, capture, or collect, or attempt to engagein any such conduct." For threatened animals, section 4(d) of <strong>the</strong> act directs<strong>the</strong> Secretary to adopt "such regulations as he deems necessary and advisableto provide <strong>for</strong> <strong>the</strong> conservation of such species." The regulations applied <strong>for</strong> athreatened species may adopt any or all of <strong>the</strong> prohibitions applied by section 9<strong>for</strong> endangered species. Since 1975, general regulations (50 CFR 17.31) haveapplied <strong>the</strong> full range of taking prohibitions <strong>for</strong> threatened animal species, butalso have provided <strong>for</strong> <strong>the</strong> alternative of adopting special rules <strong>for</strong> particularspecies as necessary and advisable. The FWS has adopted special rules <strong>for</strong>more than 30 species.132Potentially, <strong>the</strong> special rule mechanism could provide great flexibility to applytaking prohibitions <strong>for</strong> <strong>the</strong> owl in those ways most likely to promote its conservation.A well-crafted special rule framework could incorporate many of <strong>the</strong>characteristics of a habitat conservation plan. Any set of rules adopted wouldhave to pass <strong>the</strong> test of being necessary and advisable to promote <strong>the</strong> owl'sconservation and would be subjected to public review in a rulemaking process.
These requirements would tend to ensure that special rules would permit takeonly when a more effective program (that provided long-term assurance thatrecovery would occur) had been implemented.As envisioned by <strong>the</strong> <strong>Recovery</strong> Team, one possible role <strong>for</strong> federal special ruleswould be to ratify owl protection measures implemented under state authorities.For example, a state would adopt regulations governing <strong>the</strong> harvest of owlhabitat on nonfederal lands including measures aimed at maintaining currentlyunoccupied habitat in some areas and possibly o<strong>the</strong>r measures aimed atdeveloping owl habitat in areas where it does not now exist or is in shortsupply. In areas where nonfederal contributions to recovery do not requireabsolute prohibition of taking, restrictions on harvest might be substantiallyless than those that now apply under federal regulations. Federal rules might<strong>the</strong>n prohibit deliberate, nonincidental taking and taking in violation of stateregulation. The owl would gain benefits not available under <strong>the</strong> general takingprohibition in areas that now have no owls, and landowners would be relievedof some of <strong>the</strong> current taking restrictions within occupied owl habitat.Ano<strong>the</strong>r possible arrangement can be imagined that, <strong>for</strong> instance, would placemore of <strong>the</strong> substantial restrictions within <strong>the</strong> federal rules or would allowvarious means of off-site mitigation <strong>for</strong> harvest under state regulations. Closecooperation between <strong>the</strong> FWS and <strong>the</strong> states would be necessary in <strong>the</strong> planningof any such arrangement to ensure that state regulatory authorities wereadequate <strong>for</strong> implementation and that any regulation adopted would satisfy <strong>the</strong>standards of <strong>the</strong> Endangered Species Act. The adoption of federal regulationsalso would be subject to review under NEPA and Executive Order 12291, whichrequires assessments of <strong>the</strong> impacts of federal rules.Building a climate<strong>for</strong> negotiating protective management.Landowners are not required by <strong>the</strong> Endangered Species Act to contribute anyspotted owl protection beyond <strong>the</strong>ir obligation to refrain from taking owls. Ifspotted owl recovery depends in part on conservation ef<strong>for</strong>ts on nonfederallands, a climate <strong>for</strong> negotiation between landowners, <strong>the</strong> states, and <strong>the</strong> FWSmust be created.Although spotted owl recovery would be enhanced by replacing <strong>the</strong> short-termprotection of individual owls with long-term conservation ef<strong>for</strong>ts consistentwith recovery objectives, such protection ef<strong>for</strong>ts will not be initiated unlesslandowners see that it is to <strong>the</strong>ir benefit to participate in protective management.Section 10 of <strong>the</strong> Endangered Species Act allows nonfederal landowners todevelop habitat conservation plans (HCPs) as a condition <strong>for</strong> issuance ofincidental taking permit. ection 4(d) of <strong>the</strong> act is an alternative conservationtool, which allows <strong>the</strong> FWS to promulgate special rules" <strong>for</strong> <strong>the</strong> protection ofthreatened species. The FWS has indicated it will consider writing such rulesif <strong>the</strong> states or landowners develop conservation or protective managementplans. Rules also could provide interim management direction while an HCP isbeing developed.In Cali<strong>for</strong>nia, several landowners, <strong>for</strong>estry associations, environmental interests,and scientists currently participate in habitat protective managementef<strong>for</strong>ts with <strong>the</strong> state, FWS, Forest Service, and BLM. A few Cali<strong>for</strong>nia companiesare working directly with <strong>the</strong> FWS to develop <strong>the</strong>ir own habitat conservationplans that are expected to be consistent with <strong>the</strong> statewide plan. Thestatewide HCP is expected to be completed by 1993, at <strong>the</strong> earliest, underscoring<strong>the</strong> need to establish and maintain a positive climate <strong>for</strong> negotiation (seesection II.C.).133
The real or perceived disincentives to protective management cause delay inimplementation of improved protection <strong>for</strong> <strong>the</strong> species. With each year ofprotective management delay, habitat is cut outside take circles, reducingoptions <strong>for</strong> recovery. After several years of take circle management, habitat onnonfederal lands may be found only inside those circles.Expediency of plan development, approval, and implementation may be <strong>the</strong>most important criterion <strong>for</strong> successful protective management. Some HCPshave been completed in 6 to 12 months but o<strong>the</strong>rs have taken substantiallylonger to complete. Available mechanisms to achieve recovery objectives onnonfederal lands should be streamlined to achieve <strong>the</strong> same conservation goalin a more efficient and less costly manner.A process<strong>for</strong> incorporating implementation tools intoprotective management.77Tefollowing scenario presumes that <strong>the</strong> FWS finds that <strong>the</strong> approach identified<strong>for</strong> nonfederal lands is consistent with <strong>the</strong> intent of sections 4, 9, and 10 of <strong>the</strong>Endangered Species Act (Le., consistent with <strong>the</strong> conservation of <strong>the</strong> owl), andthat <strong>the</strong> states indicate <strong>the</strong>ir willingness to support <strong>the</strong> recovery plan and <strong>the</strong>approach <strong>for</strong> compliance under <strong>the</strong> Endangered Species Act on nonfederal landsthrough appropriate state laws.1. States and <strong>the</strong> FWS would develop a detailed implementation strategy <strong>for</strong><strong>the</strong> use of nonregulatory mechanisms, such as land acquisition, to contributeto recovery goals. (see Tools <strong>for</strong> implementing recovery on nonfederallands in this section.)2. The FWS, states, and landowners agree on a regulatory program as follows:a. Specific landowner contributions that would allow specified levels ofincidental take to occur would be identified and agreements made toimplement <strong>the</strong>m.b. Means <strong>for</strong> ensuring and monitoring implementation of <strong>the</strong> agreementsare identified and put in place.c. State and/or landowners incorporate 1 and 2 (above) into protectivemanagement plans, <strong>for</strong>ming <strong>the</strong> basis of ei<strong>the</strong>r a section 10 permit or asection 4(d) rule.d. The FWS pursues <strong>the</strong> appropriate action, including public review,which authorizes incidental take and ensures implementation of <strong>the</strong>alternative protective management plan. The states may requireadditional measures above those identified in <strong>the</strong> recovery plan orunder <strong>the</strong> FWS's take guidelines.Tools <strong>for</strong> implementing recovery on nonfederal lands.The <strong>Recovery</strong> Team evaluated <strong>the</strong> availability and effectiveness of severalmechanisms <strong>for</strong> implementation of <strong>the</strong> recovery objectives <strong>for</strong> nonfederal land,identified in section III.C.4. These mechanisms are elements of a comprehensiveapproach to owl conservation. Any one or a combination of <strong>the</strong>se may beacceptable. This list may not be all inclusive; o<strong>the</strong>r equally valid ideas mayexist. Anticipated implementation of <strong>the</strong> biological objectives varies by provinceowing to differences in <strong>the</strong> proportion of federal ownership, state authorities,and availability of in<strong>for</strong>mation about spotted owls.134
Implementation tools are defined as:1. Existing reserves. State, county, or local parks, known conservationeasements, or o<strong>the</strong>r areas that have binding, en<strong>for</strong>ceable restrictions on<strong>the</strong> level of timber harvest and o<strong>the</strong>r <strong>for</strong>est management activities that arelikely to alter <strong>the</strong> amount of suitable owl habitat. Existing reserves mustbe evaluated on 1) <strong>the</strong> level of current habitat within <strong>the</strong>m, 2) size, 3)number, 4) spacing, and 5) timing of future habitat achieving owl suitabilitycharacteristics.2. Private voluntary actions. Actions that are not required by statute orregulation, but that landowners voluntarily undertake. Actions caninclude, <strong>for</strong> example, long-term management plans, commitments to longrotations per uneven-aged management, or easements. Such actions mustbe evaluated on 1) how binding <strong>the</strong> actions are over time, 2) effectiveness inproviding <strong>the</strong> conservation measures (number of owls, amount and configurationof habitat) stated in <strong>the</strong> recovery objective, 3) timing of <strong>the</strong>contribution of suitable habitat, and 4) how attractive <strong>the</strong>y are to landownersto undertake.3. Forest practices statute and regulations. Statutes and rules en<strong>for</strong>ced bystate or local government that require certain practices be used or certainhabitat conditions be maintained. Depending on <strong>the</strong> definition of differenttypes of owl habitat, <strong>the</strong>se requirements can contribute to certain habitatobjectives. Statutes and regulations must be evaluated on 1) currentrequirements <strong>for</strong> <strong>the</strong> provision of conservation measures detailed in <strong>the</strong>recovery objective, 2) whe<strong>the</strong>r current state statutes authorize promulgationand en<strong>for</strong>cement of additional regulations, and 3) ability, ease, andtiming requirements of passing new state legislation.4. Prohibition on taking. Refers to <strong>the</strong> Endangered Species Act prohibition oftake of individuals, as implemented and en<strong>for</strong>ced by <strong>the</strong> FWS. The relativeease of implementing an option will be increased to <strong>the</strong> extent that protectionof individuals (on a case-by-case approach) implements <strong>the</strong> conservationmeasures in a recovery objective. The current take prohibition doesnot provide a long-term contribution to recovery. The success of <strong>the</strong>prohibition in contributing to recovery is variable, and dependent upon <strong>the</strong>province and existing conditions within owl home ranges. Application oftake prohibition guidelines must be evaluated <strong>for</strong> consistency of results,fairness, uni<strong>for</strong>mity of en<strong>for</strong>cement, and adequacy of protection.5. Landscape management as a basis<strong>for</strong> modifying <strong>the</strong> take prohibition.Refers to providing suitable habitat adequate to meet <strong>the</strong> conservationobjective, without necessarily focusing on <strong>the</strong> location of individuals orpairs. Landscape management may provide a basis <strong>for</strong> allowing an increasedlevel of take. The potential role of landscape management mustbe assessed relative to <strong>the</strong> current number of known owl sites contributingto recovery objectives and <strong>the</strong> current burden of surveys (see ProtectiveManagement Guidelines, point #5). The Endangered Species Act providesmechanisms <strong>for</strong> landscape habitat management, including <strong>the</strong> habitatconservation plan (HCP) or section 4(d) rules.6. Critical habitat. See description under Federal Implementation in sectionIII.C.7. Land exchange. Exchanging public land (fee title) <strong>for</strong> state and privatelands to secure a particular location and/or management. This tool mustbe evaluated on 1) <strong>the</strong> availability of public land of equal value <strong>for</strong> exchange,2) <strong>the</strong> ownership of <strong>the</strong> public land (federal, state, county), 3) <strong>the</strong>135
authority of <strong>the</strong> public body to enter into land exchanges, 4) <strong>the</strong> change inpublic timber supply as a result of <strong>the</strong> exchange, 5) effect on local taxbase, 6) <strong>the</strong> willingness of nonfederal landowners to enter into exchanges,and 7) <strong>the</strong> timing of <strong>the</strong> exchange.8. Purchase. Purchase of fee title of private or state lands <strong>for</strong> reasons similarto land exchange. Purchase must be evaluated on 1) <strong>the</strong> authority of <strong>the</strong>public sector to purchase private or state land, 2) <strong>the</strong> availability ofresources <strong>for</strong> public purchase, 3) <strong>the</strong> willingness of <strong>the</strong> nonfederal partiesto sell, 4) <strong>the</strong> change in public timber supply as a result of <strong>the</strong> purchase,5) effect on local tax base, 6) <strong>the</strong> timing of <strong>the</strong> purchase, 7) whe<strong>the</strong>rpurchase is of both land or timber or whe<strong>the</strong>r some harvest rights areretained by seller.9. Timber rights trade. Ra<strong>the</strong>r than purchasing or exchanging land, federaland nonfederal parties exchange timber cutting rights without alteringland ownership. This should be evaluated in <strong>the</strong> same way as landpurchase or exchange. Legal technicalities may need to be addressed.10. Conservation easements, mitigation banks, purchase or transfer of developmentor harvest rights. A number of 'market-oriented" tools are available<strong>for</strong> protective management. These tools are characterized by beingvoluntary, ra<strong>the</strong>r than mandatory, and allow all parties involved to base<strong>the</strong>ir decisions on <strong>the</strong> likely costs and benefits <strong>the</strong>y will incur. Theavailability of <strong>the</strong>se tools increases <strong>the</strong> options <strong>for</strong> efficiently meetingconservation goals.A conservation easement is dedicated <strong>for</strong> conservation purposes, such asopen space or wildlife habitat. The landowner is compensated <strong>for</strong> placingland in an easement, often through preferential property tax treatment.The feasibility of conservation easements must be evaluated in terms of 1)<strong>the</strong> availability of suitable areas <strong>for</strong> easements, 2) <strong>the</strong> ability to administer<strong>the</strong> easements, such as <strong>the</strong> existence of land trusts, and 3) <strong>the</strong> relativebenefits that a landowner could expect from entering into a conservationeasement.Mitigation banking is an offsite mitigation tool intended to compensate <strong>for</strong>habitat losses associated with future timber harvesting or o<strong>the</strong>r activities.Credits must be established (e.g., acres of owl habitat) prior to timberharvesting. The intent of mitigation banking is to develop a surplus ofsecured habitat be<strong>for</strong>e timber harvesting proceeds in existing suitablehabitat to minimize <strong>the</strong> lag time between losses from timber harvestingand replacement from mitigation. Mitigation banking can consolidatemitigation measures from numerous small habitat losses and provide alarger off-site mitigation area.The feasibility of mitigation banks must be evaluated based on 1) <strong>the</strong>availability of suitable sites <strong>for</strong> mitigation banks that would not have beenprotected o<strong>the</strong>rwise, 2) <strong>the</strong> ability to establish appropriate measure ofcredits, 3) <strong>the</strong> institutional ability to administer <strong>the</strong> banks and monitor<strong>the</strong>ir effectiveness.Transfer of development or harvest rights is ano<strong>the</strong>r mechanism to allowhigher levels of activity, such as timber harvesting, on location (destinationor sink) by transferring unused rights from ano<strong>the</strong>r location (source),<strong>the</strong>reby reducing <strong>the</strong> potential level of activities in <strong>the</strong> source location.Purchase of such rights can be used to lower <strong>the</strong> overall potential level oftimber harvesting in an area by not transferring <strong>the</strong>m to ano<strong>the</strong>r location.136
The feasibility of transfer or purchase of rights must be evaluated against1) biological constraints regarding habitat quality, quantity, and location,2) availability of institutional means to evaluate, monitor, and keepaccount of <strong>the</strong> trades, and 3) transactions costs to landowners andadministering agencies. Any trades would have to be carefully andconservatively structured owing to <strong>the</strong> uncertainty about <strong>the</strong>ir biologicaland social and economic effects.Implementation ScenarioIn section III.C.3., <strong>the</strong> recovery plan assumes that federal agency implementationwill occur in phases during <strong>the</strong> next 5 years. An approach to recoveryplan implementation that is feasible and prompt might occur in three broadphases. The first phase, which should take less than 1 year, involves completionof a federal and nonfederal review of its recommendations to determineorganization-specific actions needed to achieve consistency; e.g., <strong>for</strong>est andresource management plan revisions, and to carry out interim managementwhich serves as an appropriate "bridge" to full implementation. The secondphase, which likely will require up to 2 years, involves completing <strong>the</strong>se generalresource management planning activities, preparing <strong>the</strong> more specific DCAmanagement plans recommended in <strong>the</strong> recovery plan, and adopting researchand monitoring strategies, and initiating related on-<strong>the</strong>-ground managementactions. The third phase includes fur<strong>the</strong>r refinements of management activities,including monitoring and research, that characterize full-scale implementation,and <strong>the</strong> development of in<strong>for</strong>mation <strong>for</strong> use in reviewing and, as necessary,revising <strong>the</strong> recovery plan.The following outline briefly describes this phased implementation strategy. Itlists anticipated activities in each phase of federal action agency (Forest Service,BLM, National Park Service), nonfederal entities, and <strong>the</strong> FWS. Some of<strong>the</strong> actions specified in each phase are interdependent, and it is assumed that<strong>the</strong>y may proceed ei<strong>the</strong>r concurrently or sequentially, as necessary.Phase 1 (May 1992 - May 1993)1. Federal action agencies:* Review <strong>the</strong> recovery plan to determine management requirements neededto achieve consistency with recovery plan recommendations and takeprohibitions as required by FLPMA, NFMA, NEPA, and any o<strong>the</strong>r applicablemandates (e.g., <strong>for</strong>est plan and regional guide revision or amendment).* By January 1993, adopt <strong>the</strong> recovery plan and implement interimmanagement to assure maximum consistency with recovery plan recommendationspending completion of <strong>the</strong> above management requirements.2. States:* Review <strong>the</strong> recovery plan to determine how to implement its recommendationsunder current authorities and initiate necessary actions (e.g., HCPdevelopment), in cooperation with private landowners as appropriate.* Assess <strong>the</strong> feasibility of o<strong>the</strong>r actions to promote recovery plan implementation.3. U.S. Fish and Wildlife Service:* Promulgate a critical habitat rule to reflect recovery plan recommendations,and use it in conjunction with <strong>the</strong> DCA management guidelines as<strong>the</strong> basis <strong>for</strong> adverse modification determinations.137
* Use <strong>the</strong> recovery plan's recommendations <strong>for</strong> <strong>the</strong> federal matrix lands as<strong>the</strong> basis <strong>for</strong> section 7 consultation and consider issuing programmatic 'nojeopardy" biological opinions (including incidental take statements) <strong>for</strong>agency plans that are consistent with those recommendations.* Establish <strong>the</strong> coordinating group recommended in <strong>the</strong> recovery plan toprovide implementation advice and assistance.* Issue guidance to states and private landowners to help <strong>the</strong>m in preparingHCPs.* Assess <strong>the</strong> desirability of promulgating a special rule under section 4(d)of <strong>the</strong> Endangered Species Act.Phase 2 (May 1993 - May 1995)1 . Federal action agencies:* Complete actions needed to assure full adoption of recovery plan recommendationsin accordance with <strong>the</strong>ir legal mandates.* Adopt monitoring and research strategies.* Prepare DCA management plans, consult with <strong>the</strong> FWS, and implementrequired actions including silvicultural treatments to enhance owl habitat.2. States:* Continue ef<strong>for</strong>ts to implement recovery plan recommendations <strong>for</strong>nonfederal lands, including HCP development.* Coordinate with federal agencies and <strong>the</strong> private sector on monitoringand research ef<strong>for</strong>ts.3. U.S. Fish and Wildlife Service:* Consult on DCA plans submitted by action agencies and considerissuing programmatic "no adverse modification" biological opinions to coverfuture actions carried out consistent with those plans.* Provide advice and assistance on all aspects of recovery plan implementationas required, in conjunction with <strong>the</strong> coordinating group.* Assess progress toward recovery plan implementation and provideappropriate recommendations.* Complete promulgation of a special rule.Phase 3 (May 1995 - May 1997)1. Federal action agencies:* Complete planning requirements and be in "full implementation" regardingprogram operations, as well as monitoring and research.* Report on <strong>the</strong> results of recovery plan implementation during <strong>the</strong> first 5years.138
2. States:* Continue to implement <strong>the</strong> recovery plan's recommendations, especiallythose designed to provide fur<strong>the</strong>r incentives <strong>for</strong> owl and habitat conservation.3. Fish and Wildlife Service:* Devote primary ef<strong>for</strong>ts to providing advice and assistance on owl recovery,as opposed to regulatory operations, if federal agencies are in <strong>the</strong> "fullimplementation" phase.* With assistance from <strong>the</strong> coordinating group, provide guidance to federalaction agencies, states, and private landowners on <strong>the</strong> process and in<strong>for</strong>mationrequirements <strong>for</strong> recovery plan review after its initial implementationphase, so that review can begin promptly in May 1997, and revisioncompleted in a time frame that enables it to serve as a basis <strong>for</strong> agencydecadal planning.139
140
III.C.4. <strong>Recovery</strong> Goals and Strategies <strong>for</strong> Each ProvinceOverviewRecommendations made in this section are specific to physiographic provincesbased on <strong>the</strong> classification of Franklin and Dymess (1973) and Bailey(1966)(Figure 2.2.). Physiographic provinces are determined by <strong>the</strong> geophysicallandscape characteristics and climate that influence <strong>the</strong> vegetation. Forpractical application in <strong>the</strong> recovery plan, physiographic provinces weremodified based on state boundaries, current spotted owl distributions, andland ownership patterns, all of which influence <strong>the</strong> potential <strong>for</strong> managementrecommendations.The status of spotted owls in each province and recommendations <strong>for</strong> recoveryare summarized in this section. <strong>Recovery</strong> goals <strong>for</strong> each province are based on<strong>the</strong> status of spotted owls, threats to <strong>the</strong> population (section II.B.), and <strong>the</strong>recovery plan objective (section III.A.). These goals are intended to alleviate <strong>the</strong>primary threats in each province. Recommendations <strong>for</strong> federal and nonfederalland reflect <strong>the</strong> obligations of different ownerships under <strong>the</strong> EndangeredSpecies Act. Indian lands are identified, but presented as nei<strong>the</strong>r federal nornonfederal lands; contributions from Indian lands are described in sectionII.C.8.<strong>Recovery</strong> strategies and recommendations in this section describe areas andactions by land managers that are necessary <strong>for</strong> spotted owl recovery. Theseinclude <strong>the</strong> DCAs and matrix management areas on federal land, and areas ofspecial management emphasis on nonfederal lands.Federal landsThe primary recovery strategy on federal lands is <strong>the</strong> establishment andappropriate management of DCAs, as described in section III.C.2., includingdesignation of DCAs as critical habitat. DCAs are illustrated on maps providedwith <strong>the</strong> draft recovery plan (Maps 1 through 3). Recommended DCA boundariesare delineated, but it is anticipated that during <strong>the</strong> response period to <strong>the</strong>draft, local land managers will suggest boundary changes to improve owlhabitat management. Such proposed changes will be evaluated by <strong>the</strong> <strong>Recovery</strong>Team and incorporated into <strong>the</strong> final recovery plan, as appropriate.In <strong>the</strong> province narratives, category 1 and 2 DCAs are listed, including approximateacreages and owl numbers. Detailed in<strong>for</strong>mation on individual DCAs isin Appendix J.Federal matrix lands connecting <strong>the</strong> DCAs will be managed <strong>for</strong> dispersalhabitat and also include areas that require management <strong>for</strong> reserved pairareas, managed pair areas, and residual habitat areas (see section III.C.2. <strong>for</strong> adescription of matrix prescriptions).Nonfederal landsMost of <strong>the</strong> spotted owl recovery ef<strong>for</strong>t will be on federal lands. However, whererecovery cannot be met solely on federal lands, recommendations are made <strong>for</strong>nonfederal lands. These recommendations include <strong>the</strong> following terms:141
Supplemental pair areas - Habitat delineated <strong>for</strong> pairs or territorialsingle spotted owls on nonfederal lands. Such habitat is managed orreserved, depending on agreements made. These areas are intended tosupplement population deficiencies in <strong>the</strong> federal DCA network. The sizeof <strong>the</strong>se areas will vary by province.Nortfederal clusters - Habitat provided to support a localized cluster ofsupplemental spotted owl pair areas intended to contribute to owl populationneeds as described in <strong>the</strong> province narratives.Protective management - Measures taken by nonfederal entities toconserve spotted owls and/or <strong>the</strong>ir habitat; measures may includeparticipation in conservation planning (as defined in Endangered SpeciesAct section 10) or o<strong>the</strong>r actions that benefit owls; entities may be states,private landowners, Indian tribes, or o<strong>the</strong>rs.The biological recommendations <strong>for</strong> nonfederal lands take several <strong>for</strong>ms. Thestatus of local owl populations and habitat conditions determines whe<strong>the</strong>rrecommendations are made <strong>for</strong> specific areas, and <strong>the</strong> <strong>for</strong>m of those recommendations.The biological principles underlying <strong>the</strong>se recommendations arediscussed in section III.B.2. Specific recommendations <strong>for</strong> each province arediscussed in <strong>the</strong> province narratives. They generally can be described in one of<strong>the</strong> following ways.1. Nonfederal lands within DCAs - Provide adequate nesting, roosting, and<strong>for</strong>aging habitat, in conjunction with federal lands, to achieve <strong>the</strong> DCAs'target <strong>for</strong> owl numbers and demographic stability. This could apply tocheckerboard and non-checkerboard ownership patterns. It may include<strong>the</strong> provision of supplemental pair areas. This habitat may be ei<strong>the</strong>r managedor reserved from timber harvest, depending on <strong>the</strong> protective managementagreements <strong>for</strong> <strong>the</strong> area.2. Nonfederal population clusters - Establishing large clusters of owls isrecommended in some areas where federal lands cannot support <strong>the</strong> recoveryobjective without contribution from o<strong>the</strong>r ownerships (e.g., southwestWashington, nor<strong>the</strong>ast Oregon, and coastal Cali<strong>for</strong>nia). This would requirethat habitat be provided <strong>for</strong> a cluster of breeding owl pairs with contiguousor nearly contiguous home ranges, and <strong>for</strong> floater owls and dispersingjuveniles. Clusters would include 15 or more owl pairs to provide at leastshort-term population stability. The size of an area provided <strong>for</strong> a clusterwill depend on <strong>the</strong> current suitability and natural potential of habitat, <strong>the</strong>possibility of natural disturbance, and <strong>the</strong> type and level of <strong>for</strong>est managementproposed within <strong>the</strong> area. Clusters provide <strong>the</strong> opportunity to exploreand test hypo<strong>the</strong>ses about owl response to <strong>for</strong>est management that may notbe tested within <strong>the</strong> federal DCA network. Generally, a large cluster of owlpairs would require 30,000 to 100,000 acres of habitat managed <strong>for</strong> owls.As with supplemental pair areas, habitat <strong>for</strong> a population cluster may beei<strong>the</strong>r managed or reserved from timber harvest, depending on <strong>the</strong> protectivemanagement agreements <strong>for</strong> <strong>the</strong> area.In areas of low owl density, where goals <strong>for</strong> large clusters cannot be metfully, this recommendation may be modified to provide <strong>for</strong> smaller owlclusters. Small clusters have a lower assurance of population stability thanlarge clusters.142Alternatively, in some areas a recommendation is made <strong>for</strong> supplementalpair areas distributed across <strong>the</strong> landscape at a density lower than thatdescribed <strong>for</strong> clusters. This may provide <strong>for</strong> a self-sustaining local populationbut with considerably less long-term population stability than clusters.
3. Within dispersal distance of deficient DCAs - Where needed to meet <strong>the</strong>DCAs' target <strong>for</strong> owl numbers and demographic stability, provide supplementalpair areas. These areas are included in <strong>the</strong> areas of special managementemphasis.4. Nonfederal matrix management - In some areas, a recommendation is madeto provide <strong>for</strong> successful dispersal of owls across a relatively short distance(less than 12 miles) to provide <strong>for</strong> interaction of owls among pair areas,DCAs, or nonfederal clusters. This normally would require <strong>for</strong>aging,roosting, and dispersal habitat distributed through <strong>the</strong> landscape, or possiblyarranged in a corridor. However, nesting habitat would enhance dispersalopportunities. Nonfederal dispersal habitat will not necessarily follow<strong>the</strong> 50-11-40 rule used <strong>for</strong> federal dispersal habitat, but would be based on<strong>the</strong> long-term commitments that had been entered <strong>for</strong> <strong>the</strong> area.Since <strong>the</strong> listing of nor<strong>the</strong>rn spotted owls as a threatened species, protectionmeasures have been established to comply with Endangered Species Actrequirements on nonfederal lands (prohibition of take), through consultationwith <strong>the</strong> FWS and through various state <strong>for</strong>est practices acts. These measuresare contributing to <strong>the</strong> accomplishment of biological goals <strong>for</strong> <strong>the</strong> provinces.However, accomplishing recovery goals described in each province narrativemay require a combination of existing measures and o<strong>the</strong>r actions that wouldbe determined through <strong>the</strong> protective management process.A result of <strong>the</strong> protective management process will be a fur<strong>the</strong>r refinement ofareas where recovery contributions are required. The potential <strong>for</strong> implementationof <strong>the</strong>se recommendations <strong>for</strong> nonfederal lands is discussed in <strong>the</strong>implementation section <strong>for</strong> each of <strong>the</strong> states (section III.C.2.). That sectionalso discusses <strong>the</strong> processes that would be followed to develop more specificmanagement of owls and owl habitat on nonfederal lands. Generally, thoseprocesses would consist of states and private landowners working with <strong>the</strong>FWS to develop mechanisms under state law that would provide <strong>for</strong> owl protectionwhile concurrently modifying take prohibition standards. Ano<strong>the</strong>r possibleapproach would be to follow conservation planning under section 10 of<strong>the</strong> Endangered Species Act.When all goals <strong>for</strong> a province have been established <strong>for</strong> federal and nonfederalland and mechanisms are being put in place to accomplish those goals, aschedule should be developed to modify take prohibitions <strong>for</strong> areas where nolong-term contribution to recovery of spotted owls is required. If take prohibitionswere removed, <strong>the</strong> recommendation would be to protect <strong>the</strong> nest siteduring <strong>the</strong> breeding season. While only areas of special management emphasisare discussed, <strong>the</strong> spotted owls and habitat outside of <strong>the</strong>se areas makecontributions to current population maintenance. Until long-term recoverycommitments are in place on nonfederal lands, <strong>the</strong> contribution of <strong>the</strong>se owlsand <strong>the</strong>ir habitat is important <strong>for</strong> short-term maintenance of <strong>the</strong> owl population.Olympic Peninsula ProvinceProvince descriptionThe Olympic Peninsula is a relatively isolated province in northwest Washington,bordered on three sides by bodies of water. The central portion of <strong>the</strong>peninsula is a mountain range with high elevation ridges radiating from <strong>the</strong>central area throughout Olympic National Park and Olympic National Forest.Currently, spotted owl habitat is located generally in mid-elevational <strong>for</strong>estsalong major river systems draining <strong>the</strong> mountains.143
Numbers of owls currently are estimated between 175 and 200 pairs (111 pairsare known at this time). Productivity of <strong>the</strong> population appeared to be extremelypoor in <strong>the</strong> mid- 1980s, but was good in <strong>the</strong> 3 years prior to 199 1.Productivity in 1991 was very poor (Forsman, pers. comm.). Reasons <strong>for</strong> <strong>the</strong>sefluctuations and whe<strong>the</strong>r <strong>the</strong>re is a pattern to <strong>the</strong> fluctuations are unknown.<strong>Owl</strong>s generally occur on federal land at mid-elevations, but a smaller numberof owls resides on primarily nonfederal lands in lower elevational habitats in<strong>the</strong> western portion of <strong>the</strong> peninsula.Threats to <strong>the</strong> Olympic Peninsula spotted owl population include relatively lownumbers of owls, <strong>the</strong> significant risk of large-scale disturbances (wind and fire),and stochastic patterns of productivity. There is a significant threat to habitatfrom large-scale windstorms in <strong>the</strong> western portion of <strong>the</strong> peninsula (AppendixF). and <strong>the</strong> threat of wildfire in <strong>the</strong> east portion. These threats to habitat createa risk to owl population stability. The recovery strategy is to alleviate <strong>the</strong>selong-term threats to <strong>the</strong> population by protecting a large proportion of existingowl pairs and reestablishing connections to spotted owl populations in <strong>the</strong>Washington Cascades and northwestern Oregon. The entire Olympic Peninsulais considered an area of special management emphasis.The major Indian reservations in this province are <strong>the</strong> Makah and Quinault.The Makah Reservation is not known to include spotted owls or <strong>the</strong>ir habitat.The contributions of <strong>the</strong> Quinault Nation are described in section II.B.Biological goals and implementation onfederal landsOne large DCA is recommended on federal lands in <strong>the</strong> interior OlympicPeninsula. This includes all suitable habitat in Olympic National Park and alarge proportion of Olympic National Forest adjacent to <strong>the</strong> park. This DCA,WD-36, has four additional parcels which are separated from <strong>the</strong> body of <strong>the</strong>DCA. Ano<strong>the</strong>r recommended DCA (WD-45) is <strong>the</strong> Olympic National Parkcoastal strip, encompassing a relatively narrow strip of land from Lake Ozettesouth to <strong>the</strong> Queets River.Three small parcels of WD-36 are recommended in <strong>the</strong> Soleduck RangerDistrict. These are important a) to help maintain distribution in <strong>the</strong> westernportion of <strong>the</strong> peninsula, b) to provide demographic support to <strong>the</strong> largeinterior portion of WD-36 until <strong>the</strong> owl population meets future expectednumbers, and c) in conjunction with nonfederal lands, to support habitatconnectivity with Olympic National Park's coastal strip.Also, a parcel of WD-36 is recommended in <strong>the</strong> sou<strong>the</strong>rn portion of <strong>the</strong> HoodCanal Ranger District. This habitat parcel should be maintained to serve as anesting area <strong>for</strong> a future small cluster of spotted owls. A cluster of owls maybe needed in this area to provide <strong>for</strong> future interchange of owls between <strong>the</strong>Olympic Peninsula and <strong>the</strong> western Washington lowlands province.The large interior DCA (WD-36) is recommended <strong>for</strong> several reasons specific to<strong>the</strong> peninsula (section II.B). Historical timber harvest in Olympic NationalForest has occurred in lower elevations, removing habitat and restricting <strong>the</strong>remaining owls in <strong>the</strong> national <strong>for</strong>est to a relatively narrow band encircling <strong>the</strong>periphery of Olympic National Park. When <strong>the</strong> remaining national <strong>for</strong>esthabitat is combined with <strong>the</strong> habitat in Olympic National Park, it results in aring of habitat surrounding <strong>the</strong> high elevation area at <strong>the</strong> center of <strong>the</strong> park.The high elevation interior area does not contain habitat suitable <strong>for</strong> owls andprobably restricts dispersal.Because of this unusual configuration of habitat, a single large DCA is recommendedto help ensure connectivity within <strong>the</strong> population. A series of smaller144
DCAs, separated by dispersal habitat, would provide a lower probability ofsuccessful dispersal, given <strong>the</strong> geography of <strong>the</strong> peninsula. In addition, <strong>the</strong>large DCA will protect habitat <strong>for</strong> enough owl pairs to reduce <strong>the</strong> risk fromstochastic environmental or demographic events. This is an extremely importantconsideration on <strong>the</strong> Olympic Peninsula because <strong>the</strong> spotted owl populationhere virtually is isolated from <strong>the</strong> remainder of <strong>the</strong> owl's range (USDA1988: Thomas et al. 1990).There are 89 known pairs of owls located within federal lands in <strong>the</strong> DCAs.These represent 97 percent of all owl pairs located on federal lands in <strong>the</strong>province (Table 3.3 and Figure 3.7). The DCAs contain 70 percent of <strong>the</strong>nesting, roosting, and <strong>for</strong>aging habitat identified on federal lands in <strong>the</strong> province(Table 3.4 and Figure 3.8).Table 3.3. Summary of acreage and owl pairs <strong>for</strong> designated conservation areas(DCAs) and <strong>for</strong> all lands in <strong>the</strong> Olympic Peninsula province. (More detailed in<strong>for</strong>mation,including projected owl pairs on nonfederal land, is in Appendix J, Table J.1.)Acreage<strong>Owl</strong> PairsDCA Percent NRF Current FutureIdent. Federal Habitat Known <strong>Owl</strong>s 3 Projected ProjectedNumber Total Land 1 Federal 2 Federal Nonfed Federal 4 Federal 5WD-36 847,086 97 446,519 84 2 124 193WD-45 35,439 100 - 5 0 8 8Totals: 882,525 97 89 2 132 201Total <strong>for</strong> all lands in province: 636,839 92 19WManagement of nonfederal lands within <strong>the</strong> perimeter of designated conservation areas is discussed in <strong>the</strong> narrative.2 NRF = nesting, roosting, and <strong>for</strong>aging habitat <strong>for</strong> spotted owls. Habitat in<strong>for</strong>mation was not available <strong>for</strong> nonfederal lands.3 Numbers are pairs of spotted owls verified in a 5-year period ei<strong>the</strong>r 1986 through 1990 or 1987 through 1991.4 This is an estimate of <strong>the</strong> number of pairs of owls that <strong>the</strong> DCA would be expected to support on federal lands if <strong>the</strong> population stabilized withcurrent habitat conditions See Appendix J <strong>for</strong> fur<strong>the</strong>r details.5 This is an estimate of <strong>the</strong> number of pairs of owls that <strong>the</strong> DCA might support in <strong>the</strong> future on federal lands if habitat were recovered. SeeAppendix J <strong>for</strong> fur<strong>the</strong>r detailsTable 3.4. Summary comments on <strong>the</strong> designated conservation area (DCA) networkin <strong>the</strong> Olympic Peninsula province. (Section Ill.C.2. and Appendix I providefur<strong>the</strong>r in<strong>for</strong>mation on <strong>the</strong> criteria and process used to delineate <strong>the</strong>se areas.)DesignatedConservationAreaWD-36WD-45CommentsA DCA is recommended within and around Olympic National Park toincrease habitat connectivity among major drainages, to include habitatat a variety of elevations, and to support a potentially isolated population.It is delineated as one large area, plus four small satellite areas.This DCA lies in <strong>the</strong> coastal strip of Olympic National Park. It isexpected to support eight spotted owl pairs." I' ll- ,... I..... 11 I145
Biological goals and implementation on nonfederal landsThe overall goal <strong>for</strong> nonfederal lands on <strong>the</strong> Olympic Peninsula is to providedemographic support to <strong>the</strong> Olympic Peninsula owl population. Specificprovince objectives are to protect individual pairs and to increase habitatconnectivity between Olympic National Park's coastal strip and interior federalland.Given <strong>the</strong> current distribution of remaining owls and habitat <strong>the</strong>re are severalpossibilities to meet recovery needs. One option <strong>for</strong> providing demographicsupport is through protection of spotted owls where <strong>the</strong>y currently occurthroughout <strong>the</strong> peninsula, since remaining spotted owl habitat on nonfederalland is located close to federal land. Habitat to support small clusters of threeto four owls pairs in conjunction with protective measures on federal landwould be desirable to meet <strong>the</strong> province objectives.The recommended option is to provide demographic support and increasedhabitat connectivity in <strong>the</strong> western portion of <strong>the</strong> Olympic Peninsula, fromLake Ozette south to <strong>the</strong> Queets River and from <strong>the</strong> coast east to federalownership. Currently, <strong>the</strong>re are approximately 35 known spotted owl activitycenters located on both federal and nonfederal land in <strong>the</strong> area. Since individualowl activity centers overlap several ownerships, protective managementon nonfederal lands should be integrated and coordinated with federal lands.Long-term protective measures that increase connectivity between OlympicNational Park's coastal strip and <strong>the</strong> interior peninsula should be planned toprovide maximum overlap with needs of o<strong>the</strong>r vulnerable species (e.g., salmon,marbled murrelet, fisher, nor<strong>the</strong>rn goshawk). <strong>Plan</strong>ning should consider <strong>the</strong>need <strong>for</strong> contiguous habitat between Olympic National Park's coastal strip and<strong>the</strong> interior peninsula, as this would provide benefits to spotted owls and maybe required <strong>for</strong> o<strong>the</strong>r species associated with late successional <strong>for</strong>ests. Measuresto increase spotted owl population connectivity are recommended in oneor two locations between interior federal ownership and Olympic NationalPark's coastal strip. Currently, several areas are capable of reestablishing thisconnectivity in <strong>the</strong> <strong>for</strong>eseeable future. These areas of contiguous habitatshould be at least 1 mile wide to provide <strong>for</strong> breeding pairs of spotted owls.Long-term provisions <strong>for</strong> 20 to 30 pairs of spotted owls on all ownerships inthis area should meet province objectives <strong>for</strong> demographic support by a)maintaining owls in <strong>the</strong> western portion of <strong>the</strong> province in a range ofelevational and ecological conditions and b) increasing <strong>the</strong> likelihood of successfuldispersal between <strong>the</strong> coastal strip and <strong>the</strong> interior. Small clusters ofowl pairs are preferred to individual owl pair protection and, to <strong>the</strong> extentfeasible and practical, should be considered. Individual owl pairs should beprotected with supplemental pair areas. The amount of owl habitat should beequal to <strong>the</strong> median amount learned from research studies in <strong>the</strong> province.<strong>Owl</strong> habitat should be provided to <strong>the</strong> maximum extent possible within an areaequal to <strong>the</strong> median home range size <strong>for</strong> <strong>the</strong> province.The establishment of areas of habitat connectivity, pair protection, and/orsmall clusters dramatically would enhance dispersal capability in this area.The need <strong>for</strong> additional areas of dispersal habitat should be evaluated when<strong>the</strong>se areas have been designated.Additional in<strong>for</strong>mation would be beneficial in planning nonfederal contributionson <strong>the</strong> Olympic Peninsula. The spotted owl life history simulation modeldeveloped by Forest Service researchers (discussed in Appendix A) and demographicin<strong>for</strong>mation from on-going research could be a valuable tool in plan-146
I-<strong>Owl</strong> pairs100-_60-_50-_40-,D 9080- -Known owlsin <strong>the</strong> province 70-Known owls30-in DCAs 20-10- _E1_0-Nonfederal landFederal landFigure 3.7. Known owl pairs in <strong>the</strong> Olympic Peninsula province and in DCAswithin <strong>the</strong> province.11 I... 11 .. ...- ---...------- -- . - ... I - - I I 'll, - - ................ - 11Acres (thousands)1,600- r;~=g ~ ~~~~1,200- -Total acres 100in <strong>the</strong> province600- _h imAcres in DCAs4~~~~~00- l .. _Nonfederal land' Federal land NRF habitat 2Figure 3.8. Acres in <strong>the</strong> Olympic Peninsula province and in DCAs within <strong>the</strong> province.'Management of nonfederal lands within <strong>the</strong> perimeter of designated conservation areas is discussed in <strong>the</strong> narrative.2 NRF habitat = nesting, roosting, and <strong>for</strong>aging habitat. This in<strong>for</strong>mation is available only <strong>for</strong> federal land.I I I .1 111.11 ..... 11 I I'll - - -- ...147
ning. Also, several unsurveyed areas of potential habitat remaining on <strong>the</strong>Olympic Peninsula should be surveyed in preparation of protective managementplans.The State of Washington has proposed several voluntary actions <strong>for</strong> state trustlands in this area that can address <strong>the</strong> objectives of improving spotted owlpopulation connectivity and protecting individual owl pairs. These actionsinclude deferral of timber harvest on 15,000 acres of spotted owl habitat;transfer of 3,000 acres of ecologically sensitive land from trust to conservationstatus, with compensation; and creation of a 260,000-acre Olympic ExperimentalState Forest (all state land in <strong>the</strong> western half of <strong>the</strong> province, north of<strong>the</strong> Queets River). The recovery plan recommends that <strong>the</strong> experimental <strong>for</strong>estmeet <strong>the</strong> province recovery objectives discussed earlier and develop and testsilvicultural prescriptions aimed at improving compatibility between protectionof owl habitat and commercial <strong>for</strong>est management. Objectives of <strong>the</strong> silviculturalprescriptions could include (1) accelerating habitat development ofcurrently unsuitable habitat, (2) creating post-harvest conditions conducive torapid redevelopment of habitat, and (3) maintaining habitat suitability followingharvest. Knowledge developed through work on <strong>the</strong> experimental <strong>for</strong>estcould be useful to owl conservation over time throughout <strong>the</strong> Olympic Peninsulaand in o<strong>the</strong>r provinces.Prohibitions on take also are contributing to <strong>the</strong> province recovery objectives byprotecting known owl activity centers. However, protective management andconservation planning, as described in section III.C.3., could lead to moreefficient conservation actions and increase <strong>the</strong> feasibility of meeting <strong>the</strong> recoveryobjectives <strong>for</strong> <strong>the</strong> province. For some private landowners, it also may bepossible to negotiate contributions of land in trade <strong>for</strong> relief from take prohibition(see III.C.3.). State <strong>for</strong>est practices rules also could be used to ensureprotection of known owls, where agreed upon.Land exchange or purchase could contribute to <strong>the</strong> province objectives, but <strong>the</strong>prohibitive expense makes it appropriate only in special circumstances. Additionsof lands to Olympic National Park and/or Olympic National Forest couldhelp achieve recovery objectives.Western Washington Lowlands ProvinceProvince descriptionThe western Washington lowlands province lies in southwest Washington andconsists largely of nonfederal ownership, including major urban, industrial,and agricultural areas in Washington. It includes <strong>the</strong> Puget Trough, whichencompasses <strong>the</strong> Everett, Seattle, and Tacoma urban areas. The provinceoccupies a key position in <strong>the</strong> spotted owl range; it is <strong>the</strong> only area whereconnectivity could be reestablished with <strong>the</strong> currently isolated population ofnor<strong>the</strong>rn spotted owls on <strong>the</strong> Olympic Peninsula.The majority of <strong>for</strong>estland in this province is owned by <strong>the</strong> State of Washingtonor large industrial timber corporations. As a result of timber harvest, nor<strong>the</strong>rnspotted owls have been virtually eliminated from <strong>the</strong> province: only four activitycenters are known in <strong>the</strong> province. Major threats to <strong>the</strong> remaining owl territoriesinclude low habitat quantity, poor distribution of habitat and owls, andlocal population isolation.A contributing concern in this province is <strong>the</strong> risk to <strong>the</strong> owl population in <strong>the</strong>adjacent Olympic Peninsula. To alleviate this threat of population isolation,population connectivity should be reestablished across <strong>the</strong> Washington lowlandsprovince to both <strong>the</strong> Washington Cascades and northwestern Oregon.148
Because of <strong>the</strong> distances involved, <strong>the</strong> presence of breeding population clusterswill be necessary to provide a meaningful level of connectivity.Reestablishing population connectivity is <strong>the</strong> main recovery goal in this province.Biological goals and implementation on federal landsEssentially <strong>the</strong> only federal land in <strong>the</strong> province is <strong>the</strong> Fort Lewis MilitaryReservation which is recommended as a DCA (WD-43). No spotted owlscurrently are known to occur on <strong>the</strong>se lands and habitat is generally in young<strong>for</strong>est. Fort Lewis is in an important location to reestablish demographicinterchange between spotted owls in <strong>the</strong> Cascade Range and <strong>the</strong> OlympicPeninsula. Forestlands should be managed to develop characteristics ofspotted owl habitat.Table 3.5. Summary of acreage and owl pairs <strong>for</strong> designated conservation areas(DCAs) and <strong>for</strong> all lands in <strong>the</strong> western Washington lowlands province. (Moredetailed in<strong>for</strong>mation, including projected owl pairs on nonfederal lands, is inAppendix J, Table J.2.)Acreage<strong>Owl</strong> PairsDCA Percent NRF Current FutureIdent. Federal Habitat Known <strong>Owl</strong>s 3 Projected ProjectedNumber Total Land 1 Federal 2 Federal Nonfed Federal 4 Federal 5WD-43 81,590 97 0 0 0 0 21Total <strong>for</strong> all lands in province: 0 0 31 Management of nonfederal lands within <strong>the</strong> perimeter of designated conservation areas is discussed in <strong>the</strong> narrative.2 NRF = nesting, roosting, and <strong>for</strong>aging habitat <strong>for</strong> spotted owls. Habitat in<strong>for</strong>mation was not available <strong>for</strong> nonfederal lands.3 Numbers are pairs of spotted owls verified in a 5-year period ei<strong>the</strong>r 1986 through 1990 or 1987 through 19914 This is an estimate of <strong>the</strong> number of pairs of owls that <strong>the</strong> DCA would be expected to support on federal lands if <strong>the</strong> population stabilized withcurrent habitat conditions See Appendix J <strong>for</strong> fur<strong>the</strong>r details.5 This is an estimate of <strong>the</strong> number of pairs of owls that <strong>the</strong> DCA might support in <strong>the</strong> future on federal lands if habitat were recovered SeeAppendix J <strong>for</strong> fur<strong>the</strong>r details/Table 3.6. Summary comments on <strong>the</strong> designated conservation area (DCA)network in <strong>the</strong> western Washington lowlands province. (Section 11I.C.2. andAppendix I provide fur<strong>the</strong>r in<strong>for</strong>mation on <strong>the</strong> criteria and process used to delineate<strong>the</strong>se areas.)DesignatedConservationAreaWD-43CommentsThis DCA is located entirely on <strong>the</strong> Fort Lewis Military Reservation.Forests are generally less than 70 years old. It will improve connectivitywith <strong>the</strong> Washington Cascades and <strong>the</strong> Olympic Peninsula populations.The area has <strong>the</strong> future habitat capability to support 21 pairs ofowls...................... ................ ~ ~ ~ ~ ~ ~ ~ ~ ~149
<strong>Owl</strong> pairsKnown owlsin <strong>the</strong> province3-Known owlsin DCAs2-1-NonIederal landFederal land0-Nonfederal landFederal landFigure 3.9. Known owl pairs in <strong>the</strong> western Washington lowlands province,and in DCAs within <strong>the</strong> province.
Biological goals and implementation on nonfederal landThe low habitat quantity and poor habitat distribution requires that <strong>the</strong> entireprovince be identified as an area of special management emphasis. However,within <strong>the</strong> province <strong>the</strong>re are areas which should receive focused attention tobe most effective in achieving province objectivies. Reestablishing populationconnectivity is <strong>the</strong> main recovery objective in this province. To achieve this,both owl clusters and dispersal habitat are recommended. In <strong>the</strong> future,nonfederal lands should be managed to provide clusters of supplemental pairareas to contribute to <strong>the</strong> objective. Such clusters should be:1) designed <strong>for</strong> a minimum of 15 future spotted owl pairs,2) spaced a maximum of 12 miles apart,3) dispersal habitat should be provided between clusters with dispersalareas as continuous as feasible.There are several reasons that make <strong>the</strong> objective difficult to achieve. Since<strong>the</strong>re are few existing owl sites in this province, prohibition on take or negotiatingconservation in trade <strong>for</strong> relief from take prohibition within <strong>the</strong> province arenot feasible means of contributing to recovery. A few relatively small preservedareas exist in southwest Washington, such as <strong>the</strong> State Natural HeritageProgram lands, but <strong>the</strong>se are not adequately sized to support clusters ofbreeding pairs, or located to serve well as dispersal habitat. Provision ofbreeding habitat independent of known owl sites cannot be required undercurrent state <strong>for</strong>est practices law.To establish breeding clusters in this province, land acquisition appears to be<strong>the</strong> only effective strategy. This is because <strong>the</strong>re are limited opportunities <strong>for</strong>federal/nonfederal land exchanges in this province. But purchase of land andtimber sufficient to meet <strong>the</strong> objective would be prohibitively expensive (morethan $2 billion).To reduce this cost, purchase of bare land, or land with some timber harvestrights reserved to <strong>the</strong> seller, may be feasible (possibly reducing costs to $150million). This approach would delay achievement of <strong>the</strong> recovery objective byseveral decades because <strong>the</strong> <strong>for</strong>est would have to regrow into owl habitat.However, <strong>the</strong> continuing threat to <strong>the</strong> owl population on <strong>the</strong> Olympic Peninsula,necessitating reestablishment of connectivity, is anticipated over manydecades. Even at <strong>the</strong> lower cost, funding <strong>for</strong> this approach may be availableonly over a number of years, and would be considered along with acquisitionsto meet recovery objectives <strong>for</strong> o<strong>the</strong>r provinces in Washington.To answer <strong>the</strong> need <strong>for</strong> dispersal habitat, <strong>the</strong> only effective mechanism appearsto be a combination of incentives <strong>for</strong> landowners and <strong>for</strong>est practices regulations.New <strong>for</strong>est practices regulations would have to be developed, anddispersal habitat would have to be well defined. Achievement of <strong>the</strong> dispersalobjective probably is feasible, but would contribute to recovery only if appliedin combination with successful establishment of breeding clusters.The following recommendations are provided <strong>for</strong> recovery planning in <strong>the</strong>western Washington lowlands province:- Continue surveys of potential owl habitat.- Continue protection of remaining nor<strong>the</strong>rn spotted owls. The owls shouldbe protected with supplemental pair areas. These areas should be at leastas large as <strong>the</strong> median home range size <strong>for</strong> pairs in <strong>the</strong> neighboring OlympicPeninsula province (size in<strong>for</strong>mation from <strong>the</strong> Olympic Peninsula province isbeing used because studies have not been conducted in this province toprovide a size estimate). It is recommended that delineation and managementof <strong>the</strong>se areas follow guidelines similar to those <strong>for</strong> reserved pair areasor managed pair areas on federal lands.151
- Initiate long-range planning ef<strong>for</strong>ts to develop conservation measures <strong>for</strong> <strong>the</strong>nor<strong>the</strong>rn spotted owl.- Consider <strong>the</strong> needs of o<strong>the</strong>r species in designs <strong>for</strong> clusters.Western Washington Cascades ProvinceProvince descriptionThe western Washington Cascades province lies along <strong>the</strong> western slope of <strong>the</strong>Cascade Range, from <strong>the</strong> Columbia River to <strong>the</strong> Canadian border. Approximately197 spotted owl activity centers, including 166 confirmed pairs, occurin <strong>the</strong> province. Of <strong>the</strong>se, 179 activity centers and 150 pairs are on federalland. Significant topographic differences occur between <strong>the</strong> nor<strong>the</strong>rn andsou<strong>the</strong>rn portions of <strong>the</strong> province. The nor<strong>the</strong>rn area is dominated by highelevation mountains and ridges unsuitable <strong>for</strong> spotted owls, restricting <strong>the</strong>suitable spotted owl habitat to lower elevations. The sou<strong>the</strong>rn portion is muchless dominated by mountainous areas, and spotted owl habitat is potentiallymore continuous. However, it is still highly fragmented by past timber harvest.Threats to spotted owls in <strong>the</strong> province include low rates of reproduction in <strong>the</strong>nor<strong>the</strong>rn portion and loss of habitat throughout <strong>the</strong> province. During <strong>the</strong> past20 years <strong>the</strong> checkerboard lands in <strong>the</strong> Interstate 90 corridor and <strong>the</strong> MineralBlock in <strong>the</strong> Gif<strong>for</strong>d Pinchot National Forest have been heavily harvested. (TheMineral Block is a disjunct portion of <strong>the</strong> <strong>for</strong>est north of Highway 12 and westof Highway 17). These lands currently support low densities of spotted owls.Five areas of special management emphasis have been identified and <strong>the</strong>se arereflected in <strong>the</strong> nonfederal province objectives and recommendations.Nor<strong>the</strong>rn half of <strong>the</strong> province (north of Interstate 90). Habitat in this areais naturally fragmented because of <strong>the</strong> mountainous terrain, and <strong>the</strong>fragmentation has been worsened by timber harvest. <strong>Spotted</strong> owls and<strong>the</strong>ir habitat are now poorly distributed in this area. No large clusters ofowls currently occur here.Interstate 90 corridor. Timber harvest in this area of checkerboardownership has resulted in limited nesting, roosting, and <strong>for</strong>aging habitat.Low amounts and poor distribution of habitat in this area are seriousconcerns because <strong>the</strong>y limit opportunities <strong>for</strong> dispersal between <strong>the</strong> northand south halves of <strong>the</strong> western Washington Cascades and between <strong>the</strong>western and eastern Washington Cascades through <strong>the</strong> area ofSnoqualmie pass.The Columbia Gorge. <strong>Spotted</strong> owl populations in Oregon and Washingtonare separated by <strong>the</strong> Columbia River. The historic and current levels ofinteractions between populations in <strong>the</strong> two states are unknown, but<strong>the</strong>re has been a significant reduction in habitat in <strong>the</strong> Gorge due to bothtimber harvest and urban development.T7he Mineral Block. This area is key to <strong>the</strong> potential <strong>for</strong> populationconnectivity between <strong>the</strong> western Washington Cascades and <strong>the</strong> OlympicPeninsula. Habitat and owls in this area are limited by <strong>the</strong> pattern oftimber harvest within checkerboard ownership.Siouxon Creek. This area is located southwest of <strong>the</strong> Mt. St. HelensNational Volcanic Monument. It provides opportunities to manage <strong>for</strong>owls in lower elevation habitat on <strong>the</strong> west side of <strong>the</strong> Cascades, withpotential benefits to population connectivity with <strong>the</strong> Oregon Cascadesand <strong>the</strong> Olympic Peninsula.152
Table 3.7. Summary of acreage and owl pairs <strong>for</strong> designated conservation areas(DCAs) and <strong>for</strong> all lands in <strong>the</strong> western Washington Cascades province. (Moredetailed in<strong>for</strong>mation, including projected owl pairs on nonfederal lands, is inAppendix J, Table J.3.)Acreage<strong>Owl</strong> PairsDCA Percent NRF Current FutureIdent. Federal Habitat Known <strong>Owl</strong>s 3 Projected ProjectedNumber Total Land 1 Federal 2 Federal Nonfed Federal 4 Federal 5WD-1 153,631 96 92,280 15 1 23 41WD-2 111,756 100 83,240 14 0 25 31WD-2N 52,239 92 33,560 8 0 10 12WD-2W 16,781 96 10,040 3 0 3 2WD-3 175,414 98 103,295 16 0 23 45WD-4 133,304 82 56,001 10 2 14 30WD-8 87,945 96 44,120 6 0 11 24WD-9 104,211 98 58,248 10 0 14 28WD-10 54,737 59 14,880 4 0 5 8WD-11 12,535 99 4,830 1 0 1 1WD-17 29,740 53 7,400 1 0 3 2WD-18 27,331 92 11,880 2 0 3 5WD-19 38,404 92 19,560 1 0 7 9WD-19W 13,517 91 6,840 2 0 3 3WD-25 31,273 58 17,320 3 0 5 8WD-26 23,081 53 12,640 3 0 4 5WD-26W 14,310 100 8,720 2 0 3 3WD-27 33,360 98 16,760 4 0 5 8WD-27S 9,677 96 6,480 1 0 2 2WD-28 76,925 100 51,360 6 0 14 20WD-29 26,414 100 18,840 2 0 5 5WD-30 14,424 100 9,520 4 0 4 3WD-31 27,386 100 19,423 1 0 5 6WD-32 37,995 99 19,077 2 0 4 9WD-34 87,698 100 27,912 0 0 7 10WD-35 14,448 100 5,435 0 0 2 2Totals: 1,408,536 94 759,661 121 3 205 322Totals <strong>for</strong> all lands in province: 1,431,104 150 16'Management of nonfederal lands within <strong>the</strong> perimeter of designated conservation areas is discussed in <strong>the</strong> narrative.2 NRF = nesting, roosting, and <strong>for</strong>aging habitat <strong>for</strong> spotted owls. Habitat in<strong>for</strong>mation was not available <strong>for</strong> nonfederal lands.3 Numbers are pairs of spotted owls verified in a 5-year period ei<strong>the</strong>r 1986 through 1990 or 1987 through 1991.4 This is an estimate of <strong>the</strong> number of pairs of owls that <strong>the</strong> DCA would be expected to support on federal lands if <strong>the</strong> population stabilized withcurrent habitat conditions See Appendix J <strong>for</strong> fur<strong>the</strong>r details5 This is an estimate of <strong>the</strong> number of pairs of owls that <strong>the</strong> DCA might support in <strong>the</strong> future on federal lands if habitat were recovered. SeeAppendix J <strong>for</strong> fur<strong>the</strong>r detailsBiological goals and implementation onfederal landsThe recovery plan recommends that 26 DCAs be delineated in <strong>the</strong> province(Tables 3.7 and 3.8). Seven of <strong>the</strong>se meet <strong>the</strong> criteria <strong>for</strong> category 1 areas. TheDCAs vary in size from 9,600 to 175,000 acres, and 121 pairs of spotted owlshave been confirmed on federal lands within <strong>the</strong>ir boundaries. This representsabout 80 percent of all pairs located on federal lands within <strong>the</strong> province(Figure 3.11). The DCAs also contain approximately 53 percent of <strong>the</strong> nesting,roosting, and <strong>for</strong>aging habitat located on federal land in <strong>the</strong> province (Figure 3.12).153
Table 3.8. Summary comments on <strong>the</strong> designated conservation area (DCA) networkin <strong>the</strong> western Washington Cascades province. (Section III.C.2.a. and AppendixI provide fur<strong>the</strong>r in<strong>for</strong>mation on <strong>the</strong> criteria and process used to delineate<strong>the</strong>se areas.)DesignatedConservationAreaAreaWD-1, WD-2, WD-3WD-4, WD-8, WD-9, and WD-28WD-2N, WD-2W, WD-10, WD-11,WD-17, WD-17 throughWD-19, WD-19W, WD-25,WD-26, WD-26W, WD-27,WD-27S, WD-29 throughWD-32, WD-34, andWD-35CommentsCommentsThese are category 1 DCAs. They currently contain sufficient habitatand owl numbers to function as large clusters of interactive owl pairs.These also are cateogry 1 DCAs. However, <strong>the</strong>y are currently estmatedto contain fewer than 20 pairs of owls, each with potential to increase to20 pairs.These smaller, multipair areas were delineated in this area to addresslocal demographic, distribution, and linkage concerns. Because ofnatural habitat limitations and low population densities, <strong>the</strong>y can onlypotentially support 2 to 19 pairs of owls.11 "..' .........I ..... -... ,...-Federal matrix <strong>for</strong>ests will be managed under prescription A (section III.C.2). naddition, four areas have been identified where <strong>the</strong> establishment of reservedpair areas is needed to compensate <strong>for</strong> deficiencies in <strong>the</strong> DCA network. Tenreserved pair areas are needed in <strong>the</strong> Interstate 90 corridor area north of Mt.Rainier (between DCAs WD-4 and WD-17); eight are needed between DCAsWD-25 and WD-19; and four are recommended north of Darrington (amongDCAs WD-9, WD-28 and WD-30).Biological goals and implementation on nonfederal landsSpecific recommendations <strong>for</strong> nonfederal contributions are described in <strong>the</strong>following sections <strong>for</strong> each of <strong>the</strong> areas of special management emphasis.Nor<strong>the</strong>m half of <strong>the</strong> province (north of Interstate 90). The primary recommendation<strong>for</strong> nonfederal land in this area is to provide dispersal habitatbetween WD-8 and DCAs to <strong>the</strong> north, east, and south. Such habitatshould provide dispersal <strong>for</strong> <strong>the</strong> maximum number of juvenile owlsdispersing from adjacent DCAs. Protective management could contributeto <strong>the</strong> objective, as could land exchange. If new state <strong>for</strong>est practicesregulations were developed, and dispersal habitat was well defined, suchregulations also could contribute to this objective.154Interstate 90 corridor. There are several recommendations <strong>for</strong> nonfederalcontributions to recovery in this area. The first is to provide <strong>for</strong> nesting,roosting, and <strong>for</strong>aging habitat within or directly adjacent to DCAs withcheckerboard ownership. These are WD-4 and WD-17. The secondrecommendation is to provide nesting, roosting, and <strong>for</strong>aging habitat tohelp support <strong>the</strong> reserved pair areas that will be established on federalland in <strong>the</strong> checkerboard ownership between <strong>the</strong>se DCAs. Contributions
<strong>Owl</strong> pairs160140-_Known owls 120-in <strong>the</strong> province100 -80- _~~~~ ~~60 _Known owls 40in DCAs20-0.-Nonfederal land. ........Federal landFigure 3.1 1. Known owl pairs in <strong>the</strong> western Washington Cascades provinceand in DCAs within <strong>the</strong> province.Acres (thousands)4,000- _3,500- __ _I I3,000-_Total acres 2,500-in <strong>the</strong> province2,000--__0fS ~~~~~~1 000-,i_Acres in DCAs1I0 mopI_ =Nonfederal land' Federal land NRF habitat 2Figure 3.12. Acres in <strong>the</strong> western Washington Cascades province and in DCAs within <strong>the</strong> province.'Management of nonfederal lands within <strong>the</strong> perimeter of designated conservation areas is discussed in <strong>the</strong> narrative.K 2 NRF habitat = nesting, roosting, and <strong>for</strong>aging habitat. This in<strong>for</strong>mation is available only <strong>for</strong> federal land.. ...... . - - I . .... .. .. .. .. .. .....- --- - -.......- .- 111 I'll, I - I155
from nonfederal lands are needed to support <strong>the</strong>se 10 sites becausesufficient habitat does not occur on federal lands. These contributionsare needed until habitat in <strong>the</strong> DCA recovers. The final recommendationis to provide dispersal habitat on o<strong>the</strong>r nonfederal lands between WD-4and WD- 17.In <strong>the</strong> Interstate 90 corridor area, prohibition of take on nonfederal landscurrently is contributing to recovery. Nonfederal landowners currentlyare affected by prohibitions on take at approximately 20 owl sites in DCAsin <strong>the</strong> Interstate 90 corridor, and a smaller number of sites to <strong>the</strong> north.Not all of <strong>the</strong>se restrictions are contributing to <strong>the</strong> identified recoveryobjective. Protective management, as described in section III.C.3., couldlead to more efficient conservation measures and improve achievement ofrecovery objectives. State <strong>for</strong>est practices rules also could be used toensure implementation of agreed on protection of known owls. If <strong>the</strong>re isan adequate federal nexus, federal critical habitat designation couldprovide additional protection. The City of Seattle currently is protectingsuitable habitat within its Cedar River watershed (near WD-17). Withinthis watershed <strong>the</strong> unsuitable habitat is expected to develop into suitablehabitat over time.In this area, as in all o<strong>the</strong>r parts of Washington, known owl pairs currentlyare partially protected through federal prohibition on take. However,protection is limited to 40 percent of suitable habitat within a 1.8-mile radius of <strong>the</strong> site center. Additional habitat protection may beneeded to ensure long term survival of <strong>the</strong> pair. Additional protectedacreage could be negotiated in exchange <strong>for</strong> relief from take prohibition ono<strong>the</strong>r owls, or a larger area could be managed actively to provide protectionin <strong>the</strong> long term in exchange <strong>for</strong> reduced habitat protection in <strong>the</strong>short term (see section III.C.3.). Opportunities to negotiate will be reducedto <strong>the</strong> extent that <strong>the</strong> recovery objective already requires protectionof most currently known owl pairs. In that case, little incentive exists <strong>for</strong>landowners to make additional contributions. Land exchange or purchasemay be necessary in some cases to increase <strong>the</strong> level of protection.Columbia Gorge. The portion of <strong>the</strong> Gorge through which spotted owlsmight move between <strong>the</strong> Washington and Oregon Cascades is generallylocated between DCAs WD- 1 and OD- 1. This includes a portion of <strong>the</strong>eastern Washington Cascades province. The recommendation <strong>for</strong> <strong>the</strong>area in <strong>the</strong> western Washington Cascades is to provide protection <strong>for</strong>currently known activity centers on nonfederal land using supplementalpair areas. These owls should be protected within an area equal to <strong>the</strong>median home range size within <strong>the</strong> province. The acreage of habitatprovided should be at least <strong>the</strong> median amount of habitat used withinhome ranges. Seven pairs and single owl sites currently are located in<strong>the</strong> Columbia Gorge.An additional recommendation is to develop strategies <strong>for</strong> future recruitmentof additional habitat (Appendix G) to provide a density of four owlpairs per township in <strong>the</strong> Columbia Gorge.Current prohibitions on take are contributing to <strong>the</strong> accomplishment ofrecovery objectives in <strong>the</strong> Gorge. However, <strong>the</strong>re is little opportunity tonegotiate additional landowner contribution in exchange <strong>for</strong> relief fromtake prohibition because <strong>the</strong>re are only a small number of known owlsites: most are clustered near <strong>the</strong> national <strong>for</strong>est boundary; and most areneeded to meet <strong>the</strong> objective <strong>for</strong> pairs in <strong>the</strong> area. State <strong>for</strong>est practicesregulations can help ensure protection of known owls, and, if new regulationswere developed, could provide dispersal habitat among pairs.156
However, state regulatory protection of breeding habitat independent ofknown pairs likely would require legislative action to change <strong>the</strong> statute.Some state-protected habitat currently exists at Beacon Rock State Parkand <strong>the</strong> adjacent Natural Resource Conservation Area at Table Mountain.Land exchange or land purchase to bring additional land into publicownership <strong>for</strong> habitat protection appears necessary to meet <strong>the</strong> recoveryobjective to establish large areas of new breeding habitat. Some landacquisition is occurring in conjunction with establishment of <strong>the</strong> ColumbiaGorge National Scenic Area. However, this would be very expensive($10 million to $20 million per owl pair) and would be feasible only withsubstantial federal funding.The Mineral Block. This area is of particular importance <strong>for</strong> contributionsfrom nonfederal lands. As currently mapped, <strong>the</strong> DCA on <strong>the</strong> MineralBlock (WD- 10) has a future capability of supporting 14 pairs of spottedowls, including checkerboard nonfederal lands (Appendix J, Table J.3.).There are presently five known territories on all lands in <strong>the</strong> DCA. Contributions,in <strong>the</strong> <strong>for</strong>m of supplemental pair areas, on nonfederal land insideof, and directly adjacent to, WD-10 are recommended to increase <strong>the</strong>capability of <strong>the</strong> DCA so that it will support a minimum of 15 pairs ofspotted owls. It is also recommended that dispersal habitat be providedon nonfederal land between DCA WD- 10 and DCAs W-2N and W-3.Within WD- 10, prohibitions on take currently are contributing to <strong>the</strong>province objective of supplementing <strong>the</strong> DCA. Approximately 10 knownowl activity centers occur in and near this DCA. Protective management,as described in section III.C.3., could improve achievement of recoveryobjectives. State <strong>for</strong>est practices rules also could be used to ensureprotection of known owls, where agreed upon. However, if most or allknown owl pairs are needed to meet <strong>the</strong> DCA objective, opportunities willbe limited to use protective management to achieve o<strong>the</strong>r nonfederalcontributions. This also will reduce opportunities to gain contributions ofdispersal habitat among WD- 10 and WD-2N and WD-3. hese contributionsare extremely important to <strong>the</strong> development of stable owl subpopulationsin <strong>the</strong> province.Siouxon Creek (northwest of WD- 1). The recommendation is to provide asmall group of spotted owls (three to four pairs) in conjunction withfederal ownership as ei<strong>the</strong>r a small cluster or as supplemental pair areas.This area is important to maintain distribution within <strong>the</strong> province andprovides a potential link in establishing a second connection betweenspotted owls in Washington and Oregon across <strong>the</strong> Columbia River.Prohibition on take will help accomplish this objective. Opportunities tonegotiate more efficient contributions are limited since <strong>the</strong>re are only afew known owl sites in this area and all are needed to accomplish <strong>the</strong>objective of providing a cluster. Some voluntary action on state-ownedlands is possible but is not likely to achieve <strong>the</strong> recovery objective givencurrent management requirements <strong>for</strong> <strong>the</strong>se lands. Land acquisitionthrough purchase or exchange is possible but would require up to $100million. Less-than-fee acquisitions may have <strong>the</strong> potential to contributeto <strong>the</strong> recovery objective in this area. Achievement of <strong>the</strong> objective in <strong>the</strong>near term is feasible to a degree.157
Eastern Washington Cascades ProvinceProvince descriptionThe province is located on <strong>the</strong> east slope of <strong>the</strong> Cascade Range in Washington,from <strong>the</strong> Columbia River to <strong>the</strong> Canadian border. Approximately 162 nor<strong>the</strong>rnspotted owl activity centers have been found in <strong>the</strong> province; most are onfederal land in <strong>the</strong> central and sou<strong>the</strong>rn portion of <strong>the</strong> province. In <strong>the</strong> nor<strong>the</strong>rnportion of <strong>the</strong> province, high mountains create naturally fragmentedhabitat with low potential <strong>for</strong> development of large clusters of spotted owls. In<strong>the</strong> sou<strong>the</strong>rn portion of <strong>the</strong> province, <strong>the</strong> highest densities of owls appear to beon <strong>the</strong> Yakima Indian Reservation (recovery contributions provided by <strong>the</strong>Yakima Nation are described in section II.C.8.).Table 3.9. Summary of acreage and owl pairs <strong>for</strong> designated conservation areas(DCAs) and <strong>for</strong> all lands in <strong>the</strong> eastern Washington Cascades province. (Moredetailed in<strong>for</strong>mation, including projected owl pairs on nonfederal lands, is in AppendixJ, Table J.4.)Acreage<strong>Owl</strong> PairsDCA Percent NRF Current FutureIdent. Federal Habitat Known <strong>Owl</strong>s 3 Projected ProjectedNumber Total Land 1 Federal 2 Federal Nonfed Federal 4 Federal 5WD-1N 34,525 99 25,640 6 0 8 8WD-5 88,136 61 33,240 9 2 11 14WD-6 92,263 93 54,520 12 1 16 24WD-7 112,052 91 58,960 7 1 15 28WD-12 64,439 97 29,280 8 0 8 16WD-14 11,305 100 3,520 2 0 2 2WD-15 52,167 97 33,400 2 0 9 13WD-16 60,639 74 31,640 8 6 9 11WD-20 26,668 93 9,120 3 0 3 5WD-21 24,572 71 4,680 6 0 6 5WD-22 11,107 68 1,680 2 0 2 2WD-23 13,222 85 6,440 1 0 2 3WD-24 68,544 100 37,760 5 0 10 18WD-33 55,176 96 5,600 2 0 6 10WD-37 16,935 97 1,400 1 0 2 2WD-38 23,878 100 3,040 3 0 3 4WD-39 11,480 100 1,920 1 0 1 1WD-40 20,104 100 4,880 1 0 2 2WD-41 12,803 100 3,480 1 0 1 2WD-42 26,245 100 11,200 3 0 3 5WD-44 9,962 100 3,000 1 0 1 1Totals: 836,222 90 364,400 84 10 120 176Totals <strong>for</strong> all lands in province: 798,394 121 36'Management of nonfederal lands within <strong>the</strong> perimeter of designated conservation areas is discussed in <strong>the</strong> narrative.2 NRF = nesting, roosting, and <strong>for</strong>aging habitat <strong>for</strong> spotted owls Habitat in<strong>for</strong>mation was not available <strong>for</strong> nonfederal3 lands.Numbers are pairs of spotted owls verified in a 5-year period ei<strong>the</strong>r 1986 through 1990 or 1987 through 1991.4 This is an estimate of <strong>the</strong> number of pairs of owls that <strong>the</strong> DCA would be expected to support on federal lands if <strong>the</strong> population stabilized withcurrent habitat conditions. See Appendix J <strong>for</strong> fur<strong>the</strong>r details.5 This is an estimate of <strong>the</strong> number of pairs of owls that <strong>the</strong> DCA might support in <strong>the</strong> future on federal lands if habitat were recovered. SeeAppendix J <strong>for</strong> fur<strong>the</strong>r details158
ITable 3.10. Summary comments on <strong>the</strong> designated conservation area (DCA) networkin <strong>the</strong> eastern Washington Cascade province. (Section III.C.2. and Appendix Iprovide fur<strong>the</strong>r in<strong>for</strong>mation on <strong>the</strong> criteria and process used to delineate <strong>the</strong>seareas.)DesignatedConservationAreaWD-6, WD-7WD-1 N, WD-5, WD-1 2,WD-14 through WD-16,WD-20 through WD-24,WD-33, WD-37 throughWD-42, and WD-44CommentsThese are <strong>the</strong> category 1 DCAs in <strong>the</strong> province. They are currently estimatedto contain fewer than 20 pairs of owls, but each has <strong>the</strong> potential toincrease to 20 pairs.Because of natural habitat limitations and lowpopulation densities, <strong>the</strong>se remaining DCAs are allcategory 2s. They have potential capabilities tosupport from 1 to 18 pairs of owls. They weredelineated in this area to address local demographic, distribution, andlinkage concerns.General threats to spotted owls in <strong>the</strong> province include loss of habitat, habitatfragmentation, lack of stable owl populations, and high risk of large-scale fireand insect damage (Appendix F). Historically, ground fuels were decreased byfrequent fires that occurred as low intensity underburns that burned withoutkilling overstory trees. A history of fire suppression has resulted in an accumulationof fuels, especially on national <strong>for</strong>est lands. This accumulationincreases <strong>the</strong> probability of stand-replacement fires that potentially couldeliminate nor<strong>the</strong>rn spotted owl habitat from large-scale landscapes.Three areas of special management emphasis have been identified <strong>for</strong> recommendationson nonfederal lands; specific recommendations are provided tohelp alleviate threats to owls in <strong>the</strong>se areas.Biological goals and implementation on federal landsIt is recommended that two category 1 DCAs, and 19 category 2 DCAs beestablished in this province (Tables 3.6 and 3.7). They vary in size from 9,900acres to more than 112,000 acres, and include a total of 94 owl pairs of which84 are located on federal lands. These represent 69 percent of <strong>the</strong> total knownowl pairs on federal lands (Table 3.9 and Figure 3.13). The DCAs contain 46percent of <strong>the</strong> nesting, roosting, and <strong>for</strong>aging habitat on federal land (Figure3.14).The DCA recommendations <strong>for</strong> <strong>the</strong> area north of Lake Chelan (north of DCAsWD-37 and WD-38) reflect low viability of owl populations that result fromnatural and human-caused habitat fragmentation. In this area, all knownactivity centers have been delineated as small DCAs. Any future activitycenters that are located also should be added to <strong>the</strong> DCA network. The longtermrecovery objective in this area is to develop small DCAs with owl clustersof two or more pairs, since category 1 DCAs are not possible.In addition to <strong>the</strong> DCA network, threats to <strong>the</strong> owls in <strong>the</strong> province requireareas of specific matrix management recommendations. The bulk of federalmatrix land is recommended <strong>for</strong> management prescription A (see III.C.2.), but159
(<strong>Owl</strong> pairs140 - _ _ _ _ _ _ _ _ _ _ _ _ _ _ _Lii 120 -Known owlsin <strong>the</strong> province 100-80-_i. s, 60- _ I lli _ 16Known owls 40-,in DCAs20-_ |Nonfederal landFederal landFigure 3.13. Known owl pairs in <strong>the</strong> eastern Washington Cascades provinceand in DCAs within <strong>the</strong> province.Acres (thousands)3,500-3,000- _ = .Lii 2,500- _ _ _ _Total acresin <strong>the</strong> province 2,000--1,500- _XX0r7'71,000- _Acres in DCAs 500-Nonfederal land' Federal land NRF habitat 2Figure 3.14. Acres in <strong>the</strong> eastern Washington Cascades province and in DCAs within <strong>the</strong> province.'Management of nonfederal lands within <strong>the</strong> perimeter of designated conservation areas is discussed in <strong>the</strong> narrative.2 NRF habitat = nesting, roosting, and <strong>for</strong>aging habitat. This in<strong>for</strong>mation is available only <strong>for</strong> federal land.160
seven areas have been identified as needing prescription B or C. In most cases<strong>the</strong>se federal matrix prescription areas correspond with areas of special managementemphasis discussed <strong>for</strong> nonfederal lands.In <strong>the</strong> Interstate 90 corridor, reserved pair areas are required to compensate<strong>for</strong> deficiencies in <strong>the</strong> DCA network (section III.C.2.). Population deficienciesin DCAs require reserved pair areas totaling 16,643 acres and five known owlactivity centers. Habitat <strong>for</strong> <strong>the</strong>se reserved pair areas also will alleviate <strong>the</strong>threat of impaired owl dispersal through this checkerboard ownership, andshould be coordinated with nonfederal landowners.Managed pair areas (prescription C matrix management) are located on federalland within high fire-risk mixed conifer and ponderosa pine <strong>for</strong>ests of <strong>the</strong>province. Five areas are delineated where managed pair areas are recommended<strong>for</strong> all currently known spotted owls on federal land, and those discoveredin <strong>the</strong> future. These areas are:- Between WD- 1 and WD- IN: three known activity centers to be protected,- Among WD-16, WD-15, WD-12 and WD-14: seven known activity centers,- Between WD-5 and WD-6: two known activity centers,- Among WD-6, WD-21 and <strong>the</strong> eastern province boundary: three knownactivity centers,- Among WD-7, WD-21 and WD-22: four known activity centers.Based on <strong>the</strong>se known owl activity centers, a total of 19 known activity centersand 108,176 acres would be included in prescription C managed pair areas.Biological goals and implementation on nonfederal landsThree areas are identified <strong>for</strong> special management emphasis on nonfederallands. In all three cases, recommendations are made <strong>for</strong> nonfederal lands toaugment federal management in addressing threats to owl populations.In <strong>the</strong> Interstate 90 corridor area of checkerboard ownership. Habitat lossand north-to-south connectivity among DCAs are <strong>the</strong> main concerns. Itis recommended that nonfederal lands provide nesting, roosting, and<strong>for</strong>aging habitat <strong>for</strong> spotted owls within or directly adjacent to federalDCAs WD-5, WD-6, WD-7, and WD-16. It is recommended that dispersalhabitat be provided among <strong>the</strong>se DCAs. The goal is to contribute to owlpopulation stability within <strong>the</strong> DCAs. Managed suitable habitat isexpected to provide characteristics necessary <strong>for</strong> roosting and <strong>for</strong>aging,but not necessarily <strong>for</strong> nesting. Some nesting habitat may be needed in<strong>the</strong> short term, especially since <strong>the</strong> DCAs are deficient in owl pairs.Endangered Species Act prohibition of take currently is contributing to<strong>the</strong> objective of augmenting checkerboard DCAs in <strong>the</strong> Interstate 90corridor. Nonfederal landowners currently are affected by prohibitions ontake involving many owl sites in <strong>the</strong> general area identified <strong>for</strong> specialmanagement emphasis. Protective management as described in sectionIII.C.3. could lead to more efficient conservation measures and improveachievement of recovery objectives. New <strong>for</strong>estry techniques already arepracticed by some landowners in this area, and should contribute toachieving objectives within DCAs. State <strong>for</strong>est practices rules could beused to ensure protection of known owls. In some areas where <strong>the</strong>re isadequate federal nexus, federal critical habitat designation could provideprotection beyond that available through o<strong>the</strong>r means. Land exchangealso may be a useful and accepted mechanism in <strong>the</strong>se checkerboardownership areas. Land purchase may be needed <strong>for</strong> small acreagelandowners.An additional recommendation to alleviate threats in <strong>the</strong> Interstate 90corridor is to develop habitat on <strong>the</strong> L.T. Murray Wildlife Area to supporta large cluster of owl pairs (more than 20 pairs) in conjunction with161
habitat in DCA WD- 16. Approximately 20,000 acres are needed toachieve this objective. The L.T. Murray Wildlife Area is owned by <strong>the</strong>State of Washington and most of <strong>the</strong> land is dedicated to wildlife habitatuses. Although <strong>the</strong>re is little spotted owl nesting, roosting, or <strong>for</strong>aginghabitat in <strong>the</strong> area now, development of habitat over time is possible. Therecovery plan recommends that mixed conifer habitat in this area bemanaged to develop old-growth and o<strong>the</strong>r late successional <strong>for</strong>est characteristics.This will contribute to <strong>the</strong> recovery objective.Checkerboard ownership north from WD-6 and extending to area surroundingand adjacent to WD-20, WD-21, and WD-22. In this area, <strong>the</strong> concernsand recommendations are <strong>the</strong> same as described <strong>for</strong> <strong>the</strong> Interstate 90corridor.Two o<strong>the</strong>r areas of special management emphasis are nonfederal landsbetween <strong>the</strong> Yakima Indian Reservation andfederal DCAs (between WD- 12and <strong>the</strong> reservation, and between <strong>the</strong> reservation and WD-1). The recommendation<strong>for</strong> <strong>the</strong>se areas is to provide dispersal habitat. Dispersal areasshould be as continuous as feasible, and broad enough to allow a reasonablelikelihood that owls will stay within <strong>the</strong>m as <strong>the</strong>y move betweenDCAs. In <strong>the</strong> sou<strong>the</strong>rn area, this dispersal habitat will improve dispersalopportunities adjacent to <strong>the</strong> Columbia River Gorge.Much of this area is currently in uneven-age management, which in manycases provides dispersal habitat and perhaps <strong>for</strong>aging habitat. Developmentof new <strong>for</strong>estry practices and uneven-aged management mayimprove <strong>the</strong> contribution to recovery. Protective management, as describedin section III.C.3., could contribute to this objective. If new state<strong>for</strong>est practices regulations were developed, such regulations couldcontribute to this objective.Oregon Coast Range ProvinceProvince descriptionThis province covers approximately 4.5 million acres in western Oregon betweenWashington and <strong>the</strong> Oregon Klamath province. Ownership is 57 percentprivate, 30 percent federal, and 13 percent state lands. The Grand Ronde andSiletz Indian Reservations lie within <strong>the</strong> province; contributions from <strong>the</strong>seIndian lands are discussed in section II.C.8. Federal lands include <strong>the</strong> SiuslawNational Forest and portions of four BLM districts. BLM lands are distributedin a checkerboard ownership pattern through much of <strong>the</strong> province. Approximately325 nor<strong>the</strong>rn spotted owl pairs are known to occur in <strong>the</strong> province.Thirty-two percent of <strong>the</strong> pairs are in <strong>the</strong> sou<strong>the</strong>rn portion of <strong>the</strong> province,south of Highway 38 primarily on BLM lands.Severe threats to <strong>the</strong> spotted owl exist in this province including low anddeclining populations, little nesting, roosting, and <strong>for</strong>aging habitat (only 15percent of <strong>the</strong> province), poor distribution of remaining owls and owl habitat,and high levels of predators. There is poor habitat and population connectivityboth within <strong>the</strong> province and with adjoining provinces.Four areas of special emphasis have been identified. Reduced habitat and poorpopulation connectivity are problems in all four areas.Tillamook/Astoria area. Forest stands in this area are primarily youngand homogeneous due to past fires and logging. Federally owned landscomprise a small proportion of <strong>the</strong> ownership and are unlikely to makemajor contributions to recovery. Suitable habitat and owl populations areat extremely low levels.162
Middle Oregon Coast (Highway 18 to Highway 34). Ownership in this areais primarily nonfederal. Currently, nesting, roosting, and <strong>for</strong>aging habitatis limited in <strong>the</strong> recommended DCAs, due to timber harvest. Habitat tosupport dispersal among <strong>the</strong> DCAs also is limited.Eugene and Drain Corridor. Nesting, roosting, and <strong>for</strong>aging habitat hasbeen reduced and fragmented in recommended DCAs, due to timberharvest. Habitat among <strong>the</strong> DCAs between <strong>the</strong> Oregon coast and <strong>the</strong>western Oregon Cascades is highly fragmented, thus reducing its suitability<strong>for</strong> dispersal.Area south of Highway 38. Nesting, roosting, and <strong>for</strong>aging habitat islimited within recommended DCAs. Habitat <strong>for</strong> dispersal is limitedamong DCAs and between this province and <strong>the</strong> Oregon Klamath province,due to harvest patterns within areas of checkerboard ownership.Biological goals and implementation on federal landSeventeen DCAs are recommended <strong>for</strong> this province, with five DCAs meetingcategory 1 criteria (Tables 3.11 and 3.12). A total of 110 pairs of owls has beenTable 3.11. Summary of acreage and owl pairs <strong>for</strong> designated conservation areas (DCAs)and <strong>for</strong> all lands in <strong>the</strong> Oregon Coast Range province. (More detailed in<strong>for</strong>mation, includingprojected owl pairs on nonfederal lands, is in Appendix J, Table J. 5.)Acreage<strong>Owl</strong> PairsDCA Percent NRF Current FutureIdent. Federal Habitat Known <strong>Owl</strong>s 3 Projected ProjectedNumber Total Land 1 Federal 2 Federal Nonfed Federal 4 Federal 5OD-27 77,749 67 27,320 15 1 12 20OD-28 70,663 69 26,720 19 5 15 20OD-29 50,636 82 28,360 9 1 10 15OD-30 59,934 57 15,760 14 4 10 12OD-31 70,555 84 31,760 14 0 14 20OD-32 39,894 75 15,000 5 0 5 10OD-33 60,175 61 9,640 5 0 5 12OD-34 50,661 49 24,600 7 0 7 15OD-35 51,780 86 17,800 3 0 3 15OD-36 70,212 76 9,720 3 0 3 18OD-37 46,239 58 2,920 2 2 3 7OD-38 8,942 54 1,240 1 0 1 1OD-49 22,352 13 800 1 0 1 1OD-50 51,050 17 240 2 2 2 4OD-53 86,004 91 38,440 8 0 12 30OD-54 8,509 58 2,640 2 0 1 2OD-55 2,713 53 200 0 0 0 1Totals: 828,068 69 253,160 110 15 104 203Totals <strong>for</strong> all lands in province: 437,494 269 57'Management of nontederal lands within <strong>the</strong> perimeter of designated conservation areas is discussed in <strong>the</strong> narrative.2 NRF = nesting, roosting, and <strong>for</strong>aging habitat <strong>for</strong> spotted owls. Habitat in<strong>for</strong>mation was not available <strong>for</strong> nonfederal lands3 Numbers are pairs of spotted owls verified in a 5-year period ei<strong>the</strong>r 1986 through 1990 or 1987 through 1991.4 This is an estimate of <strong>the</strong> number of pairs of owls that <strong>the</strong> DCA would be expected to support on federal lands if <strong>the</strong> population stabilized with current habitat conditions SeeAppendix J <strong>for</strong> fur<strong>the</strong>r details This may be smaller than <strong>the</strong> current known number where populations are adjusting to rapidly changing habitat conditions5 This is an estimate of <strong>the</strong> number of pairs of owls that <strong>the</strong> DCA might support in <strong>the</strong> future on federal lands it habitat were recovered. See Appendix J <strong>for</strong> fur<strong>the</strong>r details.163
Table 3.12. Summary comments on <strong>the</strong> designated conservation area (DCA)network in <strong>the</strong> Oregon Coast Range province. (Section III.C.2. and Appendix Iprovide fur<strong>the</strong>r in<strong>for</strong>mation on <strong>the</strong> criteria and process used to delineate <strong>the</strong>seareas.)DesignatedConservationAreaOD-27, OD-31, OD-53OD-28OD-36OD-30 and OD-33CommentsThese category 1 DCAs currently contain fewer than 20 owl pairs, buthave a future capability of supporting more than 20 owl pairs, based onfederal habitat.This category 1 DCA currently supports more than 20 owl pairs, butrequires nonfederal contribution to do so. Future federal habitat capabilityis <strong>for</strong> 20 owl pairs.This category 1 DCA currently contains fewer than 20 owl pairs. However,it has a future capability of supporting more than 20 owl pairs witha relatively small nonfederal contribution.These are category 2 DCAs with less than 20 owl pairs, based onfederal habitat only. If significant nonfederal contributions are obtained,<strong>the</strong> areas are capable of supporting more than 20 owl pairs.located on federal lands within <strong>the</strong>se DCAs between 1986 and 1990. Thisrepresents approximately 40 percent of <strong>the</strong> 268 pairs located on all federal landduring that same period (Figure 3.15). The DCAs contain about 58 percent of<strong>the</strong> nesting, roosting, and <strong>for</strong>aging habitat identified on federal land (Figure3.16).Federal matrix management in <strong>the</strong> Oregon Range Coast province will requireprescription A and prescription B management areas. Because of <strong>the</strong> lownumber of pairs within DCAs north of Highway 38, an estimated 57 reservedpair areas (prescription B) should be established to supplement <strong>the</strong> DCAs.Three additional reserved pair areas should be established sou<strong>the</strong>ast of OD-27to supplement <strong>the</strong> population in that DCA. The remainder of <strong>the</strong> federalmatrix in this province should be managed <strong>for</strong> dispersal habitat under matrixprescription A (section III.C.2.). Residual habitat areas of 100 acres eachshould be established <strong>for</strong> all known and future-discovered activity centers upto a density of eight areas per township.With <strong>the</strong> addition of <strong>the</strong> reserved pair areas, approximately 60 percent of allknown pairs on federal lands within <strong>the</strong> province will be protected by this plan.Nearly all known pairs on federal lands north of Highway 38 will be protected.Biological goals and implementation on nonfederal land164General goals <strong>for</strong> nonfederal lands are to (1) provide nesting, roosting, and<strong>for</strong>aging habitat within federal DCAs with checkerboard ownership: (2) providedispersal habitat in all special management emphasis areas; (3) encouragecooperative management on state lands to provide nonfederal clusters of owlsand dispersal habitat among clusters; and (4) develop a cooperative habitatmanagement plan <strong>for</strong> <strong>the</strong> Elliott State Forest. Specific objectives and implementationapproaches are described later.
N<strong>Owl</strong> pairs300- _II ~~~250--Known owlsin <strong>the</strong> province 200150-_MINE 100-.Known owlsin DCAs0Nonfederal landFederal landFigure 3.15. Known owl pairs in <strong>the</strong> Oregon Coast Range province and inDCAs within <strong>the</strong> province.Acres (thousands)4,5004,000_ |lLII ~~~~1,000Acres in DCAs 5003,500-LLIII ~~3,000-Total acresin <strong>the</strong> province 2,500-2,000-1,500-Nonfederal land' Federal land NRF habitat 2Figure 3.16. Acres in <strong>the</strong> Oregon Coast Range province and in DCAs within <strong>the</strong> province.'Management of nonfederal lands within <strong>the</strong> perimeter of designated conservation areas is discussed in <strong>the</strong> narrative.2 NRF habitat = nesting, roosting, and <strong>for</strong>aging habitat. This in<strong>for</strong>mation is available only <strong>for</strong> federal land.I. .- . -....... I.- - - 11 I'll. I . - --- 11 I I - I I -- I - 165
Ttllwrnook/Astoria area. Provide supplemental pair areas to protectcurrently known and future-discovered pairs and manage <strong>for</strong> clusters ofpairs over <strong>the</strong> long term. DCA OD-50 has been recommended in thisarea, using federal lands as a basis <strong>for</strong> one of <strong>the</strong>se clusters. Providedispersal habitat among <strong>the</strong>se clusters.Achievement of recovery objectives in this area will depend largely oncontributions from nonfederal lands. Fourteen spotted owl pairs orsingles have been located in <strong>the</strong> Tillamook/Astoria area. Prohibitionagainst take of <strong>the</strong>se spotted owls and future-discovered spotted owls willmake some contribution to accomplishing objectives. Most of <strong>the</strong>se sitesare clustered on <strong>the</strong> western and nor<strong>the</strong>rn sides of <strong>the</strong> Clatsop andTillamook State Forests, where <strong>the</strong>re are mature stands that survived <strong>the</strong>multiple <strong>for</strong>est fires that occurred from <strong>the</strong> 1930s until early 1950. Thestate manages <strong>the</strong>se lands in trust <strong>for</strong> <strong>the</strong> fiduciary benefit of <strong>the</strong> localcounties. Land exchange or purchase may be necessary to meet <strong>the</strong>recovery objective to establish clusters and assure long term recovery.Middle Oregon Coast (Highway 18 to Highway 34). The province recoveryobjectives on nonfederal lands are to provide nesting, roosting, and<strong>for</strong>aging habitat in <strong>the</strong> DCAs with checkerboard ownership, and toprovide dispersal habitat among <strong>the</strong>se DCAs. The DCAs needing supplementalhabitat include OD-33, OD-37, OD-38, and OD-49. The recommendation<strong>for</strong> dispersal habitat applies to nonfederal land throughoutthis area. The objective of providing habitat within <strong>the</strong>se DCAs is to meet,in conjunction with habitat on federal land, <strong>the</strong> owl population objectives<strong>for</strong> <strong>the</strong> DCAs. Some opportunity may exist to negotiate <strong>for</strong> <strong>the</strong> bestcombinations of contributions from nonfederal landowners since <strong>the</strong>y arecurrently affected by <strong>the</strong> prohibition against taking spotted owls. Scatteredstate lands occur in this area, managed under trust <strong>for</strong> <strong>the</strong> countiesor <strong>for</strong> <strong>the</strong> State Land Board (Common School Trust). The VanDuzerCorridor along Highway 18 could provide some contribution to habitatneeds. Federal land exchange or purchase may be necessary to meet <strong>the</strong>recovery objectives.Eugene and Drain Corridor. Provide nesting, roosting, and <strong>for</strong>aginghabitat in DCAs located in checkerboard ownership, and provide dispersalhabitat among <strong>the</strong>se DCAs. These include DCAs OD-29, OD-30,OD-31, OD-54, and OD-55. Nonfederal landowners currently are affectedby <strong>the</strong> prohibition against take in this area.Area south of Highway 38. In areas of checkerboard ownership, providesuitable nesting, roosting, and <strong>for</strong>aging habitat in DCAs OD-27 and OD-28 and provide dispersal habitat among all DCAs and to <strong>the</strong> provinceboundaries. Nonfederal landowners currently are affected by <strong>the</strong> prohibitionagainst take in this area, so some opportunity exists to negotiate <strong>for</strong><strong>the</strong> best combination of contributions from <strong>the</strong>m.An additional objective is to develop a cooperative habitat managementplan <strong>for</strong> <strong>the</strong> Elliott State Forest. Thirty-eight spotted owl pairs or residentsingles have been located in this <strong>for</strong>est. As a result, <strong>the</strong> state <strong>for</strong>est iscurrently contributing to recovery due to prohibitions against take.Conservation planning as described in section III.C.3. <strong>for</strong> <strong>the</strong> Elliott StateForest could lead to more efficient conservation measures and improve<strong>the</strong> likelihood of achieving recovery objectives. State lands also areaffected by Oregon's Endangered Species Act. A conservation plan couldbe used to comply with <strong>the</strong> state's Endangered Species Act on stateownedlands. In addition, <strong>the</strong> Mill Creek and Umpqua River drainageshave been designated by <strong>the</strong> State Land Board as areas that will be166
managed <strong>for</strong> nontimber values. This management will provide somecontribution toward recovery.In general, <strong>the</strong>re are several means that can be considered <strong>for</strong> accomplishingrecovery objectives on nonfederal lands. Conservation planning (sectionIII.C.3.) could lead to more efficient conservation measures and could helpachieve some of <strong>the</strong>se recovery goals. Conservation plans on state lands couldbe used to comply with <strong>the</strong> state's Endangered Species Act on state-ownedlands and provide an incentive <strong>for</strong> conservation planning. The recovery planshould be used to help guide compliance with Oregon's Endangered SpeciesAct programs on state lands and provide an incentive <strong>for</strong> conservation planning.To <strong>the</strong> extent that <strong>the</strong> recovery plan and <strong>the</strong> state Endangered SpeciesAct programs can be made consistent, coordination between <strong>the</strong>m will beimproved.In checkerboard ownership areas where a federal nexus may exist, criticalhabitat designation could provide additional protection. Federal land exchangeor purchase might be necessary to meet <strong>the</strong> recovery objective. The OregonDepartment of Forestry is implementing a Sustainable Forestry Program onstate lands that would yield additional benefits to wildlife by providing moresnags, down material, and riparian zone protection. O<strong>the</strong>r voluntary contributionson private lands could provide additional benefits.Western Oregon Cascade ProvinceProvince descriptionThis province is <strong>the</strong> largest in Oregon (6.9 million acres), contains more documentedowl pairs (925), and has <strong>the</strong> largest acreage of nesting, roosting, and<strong>for</strong>aging habitat (approximately 1,918,000 acres). Land ownership throughout<strong>the</strong> province is mixed, with private lands generally at lower elevations. National<strong>for</strong>est land extends almost <strong>the</strong> length of <strong>the</strong> province and includes <strong>the</strong>Mt. Hood, Willamette, Umpqua, and Rogue River National Forests. BLM lands,generally occurring in checkerboard ownerships with private lands, are locatedat lower elevations on <strong>the</strong> western portion of <strong>the</strong> province. These BLM landsinclude parts of <strong>the</strong> Salem, Eugene, Roseburg, and Med<strong>for</strong>d Districts. Statelands are present in <strong>the</strong> nor<strong>the</strong>rn portion of <strong>the</strong> province in <strong>the</strong> Santiam StateForest.Habitat has been fragmented by timber harvest throughout <strong>the</strong> province.However, <strong>the</strong> fragmentation is less severe at middle elevations than at lowerelevations. Higher elevations (above 4,500 feet) are naturally unsuitable asspotted owl habitat. This landscape has resulted in current owl distributiongenerally in <strong>the</strong> mid-elevation zone. <strong>Owl</strong>s are generally distributed continuouslythrough national <strong>for</strong>est lands at <strong>the</strong>se middle elevations with <strong>the</strong> exceptionof <strong>the</strong> checkerboard ownership lands in <strong>the</strong> Santiam drainage. A few owlsoccur at lower elevations on private lands where habitat remains.As discussed in Status and Threats (section II.B.5.), owl management concernsin <strong>the</strong> province are varied. These concerns include habitat loss and fragmentation(71 percent of <strong>the</strong> province is considered unsuitable habitat due to timberharvest); declining populations; and poor population connectivity with adjacentprovinces due to checkerboard ownership, timber harvest, and <strong>the</strong> ColumbiaRiver Gorge.Two areas of special management emphasis have been identified. In each area,<strong>the</strong>re are two main concerns. The first is <strong>the</strong> pattern of checkerboard ownershipwithin DCAs. Federal lands alone in <strong>the</strong>se DCAs would be inadequate tofully meet <strong>the</strong> DCA objectives. The second main concern is poor population167
connectivity between key DCAs. This results in weak linkages between <strong>the</strong>western Oregon Cascades province and <strong>the</strong> Oregon Coast Range and Cali<strong>for</strong>niaCascades provinces. Specific concerns <strong>for</strong> <strong>the</strong>se areas of special managementemphasis follow.Area between <strong>the</strong> Oregon Coast Range and Oregon Klamath provinces and<strong>the</strong> western Oregon Cascades province (this includes OD-11, OD-12, OD-17, OD-39, OD-56, OD-57, OD-58). Dispersal habitat in this area has beenreduced and fragmented due to timber harvesting, which reduces <strong>the</strong>likelihood of successful owl dispersal. In addition, most of <strong>the</strong>se DCAsconsist of checkerboard ownership, and federal land in <strong>the</strong>se DCAs isgenerally not adequate to fully accomplish <strong>the</strong> DCA objectives.-Area south of OD-19. Several concerns exist: habitat among DCAs OD-19,OD-40, and <strong>the</strong> Cali<strong>for</strong>nia provinces has been reduced and fragmented bytimber harvest; <strong>the</strong>re is a compounding risk of habitat loss from fire(Appendix F). Also, checkerboard ownership in DCAs reduces capabilityto achieve DCA objectives solely on federal lands.Biological goals and implementation onfederal landsUsing <strong>the</strong> design criteria <strong>for</strong> <strong>the</strong> DCA network and future habitat capabilityestimates, 17 category 1 DCAs and five category 2 DCAs are recommended <strong>for</strong>this province (Tables 3.13 and 3.14). These areas currently contain 413documented owl activity centers (357 pairs and 56 territorial singles). Thepairs included on federal lands in DCAs represent approximately 41 percent ofpairs (Figure 3.17) located on federal lands in this province in <strong>the</strong> last 5 years.The DCAs contain about 42 percent of <strong>the</strong> nesting, roosting, and <strong>for</strong>aginghabitat identified on federal lands in <strong>the</strong> province (Figure 3.18). The majorityof <strong>the</strong>se DCAs are in national <strong>for</strong>ests; eight occur on BLM lands.Generally, federal matrix management will follow prescription A, with <strong>the</strong>federal landscape meeting <strong>the</strong> 50-11-40 rule and residual habitat areas establishedaround activity centers outside of DCAs, up to a density of eight areasper township. The exception to this general matrix management is <strong>the</strong> need <strong>for</strong>one reserved pair area, west of OD-19 to supplement <strong>the</strong> known pairs in thisDCA.Biological goals and implementation on nonfederal landsAs with o<strong>the</strong>r provinces, <strong>the</strong> recommendations <strong>for</strong> nonfederal lands focus on<strong>the</strong> areas of special management emphasis. These areas and concerns about<strong>the</strong>m are:Area between <strong>the</strong> /regon Coast Range and Oregon Klamath provinces and<strong>the</strong> western Oregon Cascades province (this includes OD-i 1, OD-1 2, OD-17, OD-39, OD-56, OD-57, OD-58). Within DCAs in checkerboard ownershipin <strong>the</strong> areas of special management emphasis, provide habitatsuitable <strong>for</strong> nesting, roosting, <strong>for</strong>aging, and dispersal. This will includeDCAs OD-12, OD-17, OD-39, OD-40, OD-56, OD-57, and OD-58. Theobjective of providing habitat within <strong>the</strong> DCAs is to fully meet, in conjunctionwith habitat on federal land, <strong>the</strong> objectives <strong>for</strong> <strong>the</strong> DCAs.In addition to providing nesting, roosting, and <strong>for</strong>aging habitat as needed,nonfederal lands should provide dispersal habitat among <strong>the</strong> DCAs in<strong>the</strong>se areas of special management emphasis. In <strong>the</strong> portion of <strong>the</strong>western Oregon Cascades that connects to <strong>the</strong> sou<strong>the</strong>rn Oregon Coast,dispersal habitat should generally be provided within an area that encompassesOD-1 1, OD-12, OD-58, OD-57, OD-56, and OD-39.168
Area south of OD-1 9. In <strong>the</strong> sou<strong>the</strong>rn portion of <strong>the</strong> western OregonCascades, dispersal habitat should be provided in a band that generallyconnects OD-19, OD-20, and OD-40.Currently, <strong>the</strong> federal Endangered Species Act requirements prohibiting takeare contributing to partial fulfillment of <strong>the</strong> nonfederal recommendations in <strong>the</strong>province, but some of <strong>the</strong> guidelines do not contribute effectively to <strong>the</strong> goal ofproviding dispersal habitat. Protective management (section III.C.3.) could leadto more efficient conservation measures.Federal land exchange or purchase may be necessary to meet <strong>the</strong> recoveryobjectives <strong>for</strong> nonfederal land in this province. Land exchange would beTable 3.13. Summary of acreage and owl pairs <strong>for</strong> designated conservation areas (DCAs)and <strong>for</strong> all lands in <strong>the</strong> western Oregon Cascades province. (More detailed in<strong>for</strong>mation,including projected owl pairs on nonfederal lands, is in Appendix J, Table J.6.)Acreage<strong>Owl</strong> PairsDCA Percent NRF Current FutureIdent. Federal Habitat Known <strong>Owl</strong>s 3 Projected ProjectedNumber Total Land 1 Federal 2 Federal Nonfed Federal 4 Federal 5OD-1 148,299 99 95,280 9 0 30 42OD-3 111,716 100 60,560 19 0 23 35OD-4 98,610 91 50,840 13 0 20 30OD-5 80,982 95 38,560 23 0 22 30OD-6 81,251 93 49,520 18 0 25 30OD-7 67,248 94 40,280 23 0 23 30OD-8 103,792 100 78,480 21 0 25 28OD-9 84,370 100 40,480 25 0 25 33OD-10 80,087 100 43,600 16 0 20 30OD-11 65,444 93 34,000 22 0 20 25OD-12 89,741 57 32,280 29 0 20 23OD-13 92,956 97 56,160 27 0 25 35OD-14 82,090 96 52,240 29 1 25 33OD-15 88,789 91 45,240 16 0 18 25OD-17 55,174 58 20,320 24 4 13 20OD-18 66,504 96 28,175 20 0 18 25OD-19 86,433 93 39j365 14 0 14 23OD-39 12,504 55 920 2 0 1 1OD-40 43,122 69 8,440 6 0 5 10OD-56 2,960 59 360 0 0 0 1OD-57 2,610 61 440 0 0 0 1OD-58 2,648 55 560 1 0 1 1Totals: 1,547,330 92 816,100 357 5 373 511Totals <strong>for</strong> all lands in province: 1,942,336 876 49'Management of nonfederal lands within <strong>the</strong> perimeter of designated conservation areas is discussed in <strong>the</strong> narrative.2 NRF = nesting, roosting, and <strong>for</strong>aging habitat <strong>for</strong> spotted owls. Habitat in<strong>for</strong>mation was not available <strong>for</strong> nonfederal lands.3 Numbers are pairs of spotted owls verified in a 5-year period ei<strong>the</strong>r 1986 through 1990 or 1987 through 1991.4 This is an estimate of <strong>the</strong> number of pairs of owls that <strong>the</strong> DCA would be expected to support on federal lands if <strong>the</strong> population stabilized withcurrent habitat conditions. See Appendix J <strong>for</strong> fur<strong>the</strong>r details.5 This is an estimate of <strong>the</strong> number of pairs of owls that <strong>the</strong> DCA might support in <strong>the</strong> future on federal lands if habitat were recovered. See AppendixJ <strong>for</strong> fur<strong>the</strong>r details.......... I.................. ..........................I/169
ITable 3.14. Summary comments on <strong>the</strong> designated conservation area (DCA)network in <strong>the</strong> western Oregon Cascades province. (Section III.C.2.a. and AppendixI provide fur<strong>the</strong>r in<strong>for</strong>mation on <strong>the</strong> criteria and process used to delineate<strong>the</strong>se areas.)DesignatedConservationAreaOD-5, OD-7, OD-8OD-9, OD-l1, 01-12,OD-13 and OD-14OD17 and OD-18OD-1, OD-3, OD-4OD-6, OD-10, OD-15and OD-19OD-40OD-39, OD-56, OD-57,CommentsThese category 1 DCAs each currently support20 or more pairs of owls.These category 1 DCAs each currently support 20 or more pairs of owlsbut require both federal and nonfederal land to do so. In <strong>the</strong> future, <strong>the</strong>ywill be able to support 20 pairs solely on nonfederal lands.These category 1 DCAs are currently estimated to containfewer than 20 pairs of owls. Each DCA has <strong>the</strong> potential to increaseup to 20 pairs.This DCA is recommended to provide population connectivity to <strong>the</strong>Cali<strong>for</strong>nia Cascades province. It is estimated to support 14 pairs of owlsin <strong>the</strong> future.These DCAs provide an important linkage between <strong>the</strong> western OregonCascades province and <strong>the</strong> Oregon Coast Range province.- --..... --...- ...- ........ .111.11.111,'ll" ,,..... ...,.. I - Iextremely expensive and depend on legal restrictions. In checkerboard ownershipareas where a federal nexus exists, designating <strong>the</strong> land as critical habitatmight provide additional protection.Some state lands do not lie within <strong>the</strong> areas of special management emphasis,but are contributing to more general recovery goals in <strong>the</strong> province. Thesou<strong>the</strong>rn portion of Oregon's Santiam State Forest lies between DCAs OD-4and OD-6. This state land is managed in trust <strong>for</strong> <strong>the</strong> fiduciary benefit of <strong>the</strong>local counties and currently is managed to provide <strong>for</strong> owl dispersal between<strong>the</strong>se DCAs. Voluntary contributions by <strong>the</strong> state's Sustainable ForestryProgram and private landowners could provide additional benefits. Silver FallsState Park is ano<strong>the</strong>r parcel of state land which contributes to recovery byproviding nesting, roosting, and <strong>for</strong>aging habitat.The recovery plan should be used to help guide compliance with Oregon'sEndangered Species Act programs on state lands and provide an incentive <strong>for</strong>conservation planning. To <strong>the</strong> extent that <strong>the</strong> recovery plan and <strong>the</strong> stateEndangered Species Act programs can be made consistent, coordinationbetween <strong>the</strong>m will be improved.Eastern Oregon Cascades ProvinceProvince descriptionThe eastern Oregon Cascades province extends from <strong>the</strong> Columbia River to <strong>the</strong>Cali<strong>for</strong>nia border but occupies only a narrow area between Highway 97 and <strong>the</strong>170
<strong>Owl</strong> pairs9 0 0 _ _ _ _ _ _ _ _ _ _ _ _ _ _ _ _ _ _ _ _Known owlsin <strong>the</strong> province 600- -700 - _ _ _ _ __ _ _ _500- -400-300-Known owlsin DCAs 2001000Nonfederal landFederal landrAcres (thousands)Figure 3.17. Known owl pairs in <strong>the</strong> western Oregon Cascades province andin DCAs within <strong>the</strong> province.........................................LIITotal acresin <strong>the</strong> provinceAcres in DCAsNonfederal land' Federal land NRF habitat 2Figure 3.18. Acres in <strong>the</strong> western Oregon Cascades province and in DCAs within <strong>the</strong> province.'Management of nonfederal lands within <strong>the</strong> perimeter of designated conservation areas is discussed in <strong>the</strong> narrative.,-, - " , - ,,2NJRPF Ihahitat = n~etinn rmnrtinn and fnrnninn hahitat Thic infnrmntinn is avamiahhi nnixt fnr foderni Ianrd-,,- , "- " - -- y -, -, -, I/.. 111 .1 I I 11 1 I ".1,- ,, -........ 11 - .. ..X': :,. :, :!::- ;.; :,: I1,71
crest of <strong>the</strong> Cascade Mountains. There were approximately 163 owl pairslocated in <strong>the</strong> province between 1986 and 1990, representing about 9 percentof <strong>the</strong> known state population. The province consists primarily of federal land,including parts of <strong>the</strong> Mt. Hood, Deschutes, and Winema National Forests,Crater Lake National Park, and <strong>the</strong> Lakeview District of <strong>the</strong> BLM. Nonfederalland includes private and state lands primarily south of <strong>the</strong> Winema NationalForest. This nonfederal-land includes one area of special management emphasis.The area between OD-19 and <strong>the</strong> Califomia border. The area from DCAOD- 19 to <strong>the</strong> Cali<strong>for</strong>nia border has been identified as an area <strong>for</strong> specialmanagement emphasis, where BLM, private, and state lands are intermingled.<strong>Owl</strong> habitat has been reduced and fragmented in this area,resulting in poor population connectivity with <strong>the</strong> Cali<strong>for</strong>nia Cascadesprovince. A fur<strong>the</strong>r concern is <strong>the</strong> risk of habitat loss from fire.Serious threats to <strong>the</strong> spotted owl population in <strong>the</strong> province include poordistribution as a result of low owl density and fragmented habitat, and risk ofcatastrophic habitat destruction due to wildfire (section II.B. and Appendix F).The Warm Springs Indian Reservation occurs within this province. <strong>Recovery</strong>contributions provided by <strong>the</strong> Confederated Tribes of <strong>the</strong> Warm Springs aredescribed in section II.C.8.Biological goals and implementation on federal landsOne category 1 DCA and 12 category 2 DCAs are recommended in this province(Tables 3.15. and 3.16.). Approximately 62 pairs of owls have beenlocated on federal lands in <strong>the</strong>se DCAs. This represents about 42 percent of<strong>the</strong> 146 pairs located on all federal lands in <strong>the</strong> province (Figure 3.19). Approximately26 percent of <strong>the</strong> nesting, roosting, and <strong>for</strong>aging habitat identifiedon federal lands in <strong>the</strong> province is located within <strong>the</strong> DCAs (Figure 3.20). Themajority of federal <strong>for</strong>est land outside <strong>the</strong> DCAs should be managed undermatrix prescription A (section III.C.2.). This includes establishing residualhabitat areas around activity centers in <strong>the</strong> matrix up to a maximum density ofsix areas per township. However, in <strong>the</strong> portion of <strong>the</strong> province in <strong>the</strong>Deschutes National Forest, it is recommended that reserved pair areas (matrixprescription B) be established around all currently known and future-discoveredactivity centers in <strong>the</strong> matrix.Biological goals and implementation on nonfederal landsThe recovery objective <strong>for</strong> nonfederal lands is to provide habitat to improvedispersal conditions in <strong>the</strong> area of special management emphasis.Area between OD-19 and <strong>the</strong> Califomia border. This area consists ofcheckerboard ownership, but is dominated by nonfederal lands. Nonfederalcontributions should work in conjunction with federal habitat in thisarea to provide <strong>for</strong> dispersal between <strong>the</strong> eastern Oregon Cascades and<strong>the</strong> Cali<strong>for</strong>nia Cascades. Where ecological potential exists, nestinghabitat also could be provided in this area to improve <strong>the</strong> likelihood ofdispersal among provinces. The prohibition on take is unlikely to makesubstantial contributions toward meeting <strong>the</strong>se objectives because fewowl sites are known on nonfederal lands in this area.The recovery plan should be used to help guide compliance with Oregon'sEndangered Species Act programs on state lands and provide an incentive <strong>for</strong>172
conservation planning. To <strong>the</strong> extent that <strong>the</strong> recovery plan and <strong>the</strong> stateEndangered Species Act programs can be made consistent, coordinationbetween <strong>the</strong>m will be improved.Oregon Klamath ProvinceProvince descriptionThe Klamath province starts in <strong>the</strong> sou<strong>the</strong>rn third of Oregon and extendssouth about 250 miles through most of nor<strong>the</strong>rn Cali<strong>for</strong>nia. The topography of<strong>the</strong> province is characterized by <strong>the</strong> mountainous terrain of <strong>the</strong> Klamath andSiskiyou mountains. For <strong>the</strong> purposes of <strong>the</strong> recovery plan, <strong>the</strong> Klamath hasbeen separated into <strong>the</strong> Oregon Klamath province and <strong>the</strong> Cali<strong>for</strong>nia Klamathprovince. This discussion focuses on <strong>the</strong> Oregon Klamath province.The nor<strong>the</strong>rn spotted owl population in <strong>the</strong> province is <strong>the</strong> major populationlink between <strong>the</strong> Oregon Coast Range and western Oregon Cascades provinces.It provides <strong>the</strong> primary connection between spotted owl populations in Oregonand Cali<strong>for</strong>nia. The province contains approximately 390 known pairs ofspotted owls. Approximately 360 of <strong>the</strong>se are located on federal lands. Na-Table 3.15. Summary of acreage and owl pairs <strong>for</strong> designated conservation areas (DCAs)and <strong>for</strong> all lands in <strong>the</strong> eastern Oregon Cascade province. (More detailed in<strong>for</strong>mation,including projected owl pairs on nonfederal lands, is in Appendix J, Table J.7.)Acreage<strong>Owl</strong> PairsDCA Percent NRF Current FutureIdent. Federal Habitat Known <strong>Owl</strong>s 3 Projected ProjectedNumber Total Land 1 Federal 2 Federal Nonfed Federal 4 Federal 5OD-2 74,558 99 51,200 21 0 21 26OD-41 9,855 90 4,560 1 0 1 2OD-42 20,000 100 8,520 4 0 4 5OD-43 29,367 98 7,840 5 0 5 6OD-44 16,532 100 8,560 4 0 4 4OD-45 18,256 99 4,240 1 0 1 3OD-51 28,601 99 9,320 7 0 7 7OD-59 41,858 95 20,783 13 0 13 18OD-60 3,023 100 480 1 0 1 1OD-61 3,001 100 720 1 0 1 1OD-62 2,705 100 1,400 1 0 1 1OD-63 3,013 71 800 1 0 1 1OD-64 3,063 100 520 1 0 1 1OD-65 3,028 82 760 1 0 1 1Totals: 256,860 98 119,703 62 0 62 77Totals <strong>for</strong> all lands in province: 455,156 146 17'Management of nonfederal lands within <strong>the</strong> perimeter of designated conservation areas is discussed in <strong>the</strong> narrative.2 NRF = nesting, roosting, and <strong>for</strong>aging habitat <strong>for</strong> spotted owls. Habitat in<strong>for</strong>mation was not available <strong>for</strong> nonfederal lands.3 Numbers are pairs of spotted owls verified in a 5-year period ei<strong>the</strong>r 1986 through 1990 or 1987 through 1991.4 This is an estimate of <strong>the</strong> number of pairs of owls that <strong>the</strong> DCA would be expected to support on federal lands if <strong>the</strong> population stabilized withcurrent habitat conditions. See Appendix J <strong>for</strong> fur<strong>the</strong>r details.5 This is an estimate of <strong>the</strong> number of pairs of owls that <strong>the</strong> DCA might support in <strong>the</strong> future on federal lands if habitat were recovered. SeeAppendix J <strong>for</strong> fur<strong>the</strong>r details.--..........................173
ITable 3.16. Summary comments on <strong>the</strong> designated conservation area (DCA)network in <strong>the</strong> eastern Oregon Cascades province. (Section III.C.2. and Appendix Iprovide fur<strong>the</strong>r in<strong>for</strong>mation on <strong>the</strong> criteria and process used to delineate <strong>the</strong>seareas.)DesignatedConservationAreaCommentsOD-2 This category 1 DCA, entirely on federal lands, supports more than 21owl pairs. It has a future capability of supporting 26 owl pairs.OD-41 through OD-45,OD51, andODA-59 through OD-65The scattered distribution of owls and owl habitaton <strong>the</strong> east side of <strong>the</strong> Cascades prevented delineating large DCAscapable of supporting 20 owl pairs ei<strong>the</strong>r now, or in <strong>the</strong> future.tional <strong>for</strong>ests and BLM lands compose <strong>the</strong> majority of <strong>the</strong> province. Unlike <strong>the</strong>Cali<strong>for</strong>nia Klamath province, few spotted owl activity centers are known onprivate lands, though 34 percent of <strong>the</strong> province is in private ownership. Theseprivate lands are located at lower elevations intermixed with BLM lands in acheckerboard ownership pattern. A small amount of state <strong>for</strong>est land islocated in <strong>the</strong> province, including some state land within <strong>the</strong> perimeters ofrecommended DCAs. Despite <strong>the</strong> mixed ownership in <strong>the</strong> province, mostsuitable habitat currently exists on federal lands.Serious threats to <strong>the</strong> owl population in <strong>the</strong> Oregon Klamath province includeloss and fragmentation of habitat due to timber harvest and fires (Appendix F);a declining population as demonstrated in density study areas (Appendix C);and weak population connectivity within <strong>the</strong> province and with adjacentprovinces because of poor habitat conditions in areas of checkerboard ownerships.The area of checkerboard ownership in <strong>the</strong> north and east half of this provincehas been identified as a special emphasis area <strong>for</strong> recommendations on nonfederallands.Area of checkerboard ownership in <strong>the</strong> north and east half of <strong>the</strong> province:This area is of concern because: 1) nesting, roosting, and <strong>for</strong>aging habitathas been fragmented by timber harvest in checkerboard ownership areas;2) dispersal habitat has been reduced and fragmented by timber harvest;and 3) <strong>the</strong> risk of habitat loss to fire is high.Biological goals and implementation on federal landsUsing <strong>the</strong> design criteria <strong>for</strong> <strong>the</strong> DCA network, nine DCAs are recommendedwithin this province (Tables 3.17 and 3.18). Eight of <strong>the</strong> DCAs satisfy <strong>the</strong>criteria <strong>for</strong> category 1 DCAs. Only OD-52 does not. Two of <strong>the</strong> category 1DCAs, OD-20 and OD-22, extend into Cali<strong>for</strong>nia. Conversely, part of oneCali<strong>for</strong>nia Klamath province DCA (CD-5) extends slightly into Oregon. (Thedata <strong>for</strong> <strong>the</strong>se DCAs that cross state boundaries are presented in <strong>the</strong> provincethat includes <strong>the</strong> majority of <strong>the</strong> land.)Currently <strong>the</strong>re are 115 known pairs and 67 territorial singles on federal landswithin <strong>the</strong> nine DCAs. The DCAs contain about 32 percent of <strong>the</strong> known pair174
(I<strong>Owl</strong> pairsKnown owlsin <strong>the</strong> province120-_160-100-80-_l"Effl. 60-,Known owls 4021in DCAs20v0-Nonfederal landFederal landFigure 3.19. Known owl pairs in <strong>the</strong> eastern Oregon Cascades provinceand in DCAs within <strong>the</strong> province./6Acres (thousands)Total acresin <strong>the</strong> provinceAcres in DCAsNonfederal land' Federal land NRF habitat 2Figure 3.20. Acres in <strong>the</strong> eastern Oregon Cascades province and in DCAs within <strong>the</strong> province.'Management of nonfederal lands within <strong>the</strong> perimeter of designated conservation areas is discussed in <strong>the</strong> narrative.2 NRF habitat = nesting, roosting, and <strong>for</strong>aging habitat. This in<strong>for</strong>mation is available only <strong>for</strong> federal land.. ... .. ... :..... 1.11, .. .. .. I.X V1,I 175
sites on federal lands (figure 3.21). This is a relatively low percentage of knownprotected pairs compared to o<strong>the</strong>r provinces. When habitat has recovered onfederal lands within <strong>the</strong>se DCAs, <strong>the</strong> DCAs are expected to support 205 pairsof spotted owls. The DCAs contain about 53 percent of <strong>the</strong> nesting, roosting,and <strong>for</strong>aging habitat located on federal lands in <strong>the</strong> province (Figure 3.22).Generally, federal matrix <strong>for</strong>ests should be managed under prescription A,providing dispersal habitat on lands outside of DCAs following <strong>the</strong> 50-11-40guideline. As part of this prescription, residual habitat areas of 100 acresshould be delineated around all known and future-discovered owl activitycenters in <strong>the</strong> matrix up to a maximum density of 10 areas per township.In addition to prescription A, two zones are recommended <strong>for</strong> matrix prescriptionB. Reserved pair areas will be established in <strong>the</strong>se locations to supplement<strong>the</strong> DCA network where it is deficient. Four reserved pair areas will beestablished around owl activity centers east and south of OD-21. One additionalreserved pair area will be established west of OD-20.Biological goals and implementation on nonfederal landsA large area in <strong>the</strong> province has been identified <strong>for</strong> special management emphasis.(Table 3.17. Summary of acreage and owl pairs <strong>for</strong> designated conservation areas (DCAs)and <strong>for</strong> all lands in <strong>the</strong> Oregon Klamath province. (More detailed in<strong>for</strong>mation, includingprojected owl pairs on nonfederal lands, is in Appendix J, Table J. 8.)Acreage<strong>Owl</strong> PairsDCA Percent NRF Current FutureIdent. Federal Habitat Known <strong>Owl</strong>s 3 Projected ProjectedNumber Total Land 1 Federal 2 Federal Nonfed Federal 4 Federal 5OD-16 85,379 49 21,840 23 0 17 22OD-20 65,225 94 19,400 15 0 14 23OD-21 78,086 73 28,360 13 0 11 20OD-22 67,047 96 24,560 19 0 18 23OD-23 130,447 99 52,840 7 0 22 30OD-24 74,770 93 39,760 6 0 15 22OD-25 71,133 90 37,000 16 1 20 25OD-26 86,684 52 22,160 14 7 15 15OD-52 40,654 93 21,640 2 0 13 18CD-5 Data <strong>for</strong> this DCA are displayed in <strong>the</strong> Cali<strong>for</strong>nia Klamath sectionTotals: 699,425 82 267,560 115 8 145 198Totals <strong>for</strong> all lands in province: 501,872 358 291 Management of nonfederal lands within <strong>the</strong> perimeter of designated conservation areas is discussed in <strong>the</strong> narrative.2 NRF = nesting, roosting, and <strong>for</strong>aging habitat <strong>for</strong> spotted owls. Habitat in<strong>for</strong>mation was not available <strong>for</strong> nonfederal lands.3 Numbers are pairs of spotted owls verified in a 5-year period ei<strong>the</strong>r 1986 through 1990 or 1987 through 1991.4 This is an estimate of <strong>the</strong> number of pairs of owls that <strong>the</strong> DCA would be expected to support on federal lands if <strong>the</strong> population stabilized withcurrent habitat conditions. See Appendix J <strong>for</strong> fur<strong>the</strong>r details.sThis is an estimate of <strong>the</strong> number of pairs of owls that <strong>the</strong> DCA might support in <strong>the</strong> future on federal lands if habitat were recovered. SeeAppendix J <strong>for</strong> fur<strong>the</strong>r details.\1176
Table 3.18. Summary comments on <strong>the</strong> designated conservation area (DCA)network in <strong>the</strong> Oregon Klamath province. Section 1Il.C.2.. and Appendix I providefur<strong>the</strong>r in<strong>for</strong>mation on <strong>the</strong> criteria and process used to delineate <strong>the</strong>se areas.DesignatedConservationAreaOD-16OD-20 through OD-25OD-26OD-52CommentsThis category 1 DCA currently supports more than 20 pairs of owls butrequires both federal and nonfederal lands to do so. In <strong>the</strong> future, it isprojected to be able to support at least 20 pairs solely on federal land.These category 1 DCAs currently contain fewer than 20 known pairs ofowls. Each has <strong>the</strong> potential to increase to at least 20 pairs.This DCA currently supports more than 20 known pairs of owls butrequires both federal and nonfederal lands to do so. If some nonfederalcontributions are maintained, it will continue to support at least 20 pairs.This category 2 DCA includes low elevation habitat and providesdistribution of <strong>the</strong> network into <strong>the</strong> northwest corner of <strong>the</strong> province.All checkerboard lands in <strong>the</strong> north and east portions of <strong>the</strong> province. Tworecommendations are made:1) Within <strong>the</strong> perimeter of DCAs OD-16, OD-21, and OD-26, providenesting, roosting, and <strong>for</strong>aging habitat. The objective of providing habitatwithin <strong>the</strong>se DCAs is to meet, in conjunction with habitat on federal land,<strong>the</strong> objectives <strong>for</strong> DCAs. The DCAs currently contain relatively goodnumbers of owl pairs, but nonfederal habitat is needed to perpetuate<strong>the</strong>se pairs.2) Provide dispersal habitat on nonfederal lands, especially among DCAsOD-16, OD-24, OD-25, and OD-26, and between OD-26 and OD-27 in<strong>the</strong> adjacent Oregon Coast Range province. The objective of providingthis dispersal habitat is to help meet, in conjunction with habitat onfederal land, <strong>the</strong> objectives <strong>for</strong> owl dispersal among <strong>the</strong> DCAs.Currently, Endangered Species Act requirements prohibiting take are contributingto partial fulfillment of <strong>the</strong>se nonfederal recommendations in <strong>the</strong> province.Some of <strong>the</strong> guidelines in <strong>the</strong> act do not effectively address <strong>the</strong> recommendationsby providing dispersal habitat. Conservation planning andprotective management (section III.C.3.) could lead to more efficient conservationmeasures <strong>for</strong> achieving some of <strong>the</strong>se province recovery goals.The recovery plan should be used to help guide compliance with Oregon'sEndangered Species Act programs on state lands and provide an incentive <strong>for</strong>conservation planning. To <strong>the</strong> extent that <strong>the</strong> recovery plan and <strong>the</strong> stateEndangered Species Act programs can be made consistent, coordinationbetween <strong>the</strong>m will be improved.There is very little state land within <strong>the</strong> area of special management emphasis,but on <strong>the</strong>se lands <strong>the</strong> Oregon Department of Forestry is implementing aSustainable Forestry Program on state lands that would yield additionalbenefits to wildlife by providing more snags, down material, and riparian zoneprotection.177
<strong>Owl</strong> pairsL I 350- _ _ . ...............Known owls 300- _ _ _in <strong>the</strong> province250_i200_i150,Known owls 100R 'in DCAs50-0.Nonfederal landFederal landFigure 3.21. Known owl pairs in <strong>the</strong> Oregon Klamath province and inDCAs within <strong>the</strong> province.Acres (thousands)2,500-_2,000--_fElTotal acres 150in <strong>the</strong> provinceg!1 ~~~~~~~~~~~~~~500- ........ giAcres in DCAsNonfederal land' Federal land NRF habitaFigure 3.22. Acres in <strong>the</strong> Oregon Klamath province and in DCAs within <strong>the</strong> province.'Management of nonfederal lands within <strong>the</strong> perimeter of designated conservation areas is discussed in <strong>the</strong> narrative.2 NRF habitat = nesting, roosting, and <strong>for</strong>aging habitat. This in<strong>for</strong>mation is available only <strong>for</strong> federal land.I[t2178
In checkerboard ownership areas where a federal nexus may exist, criticalhabitat designation could provide additional assurance of accomplishment ofprovince recovery objectives. Federal land exchange or purchase might benecessary to meet <strong>the</strong>se objectives in some areas.Thefollowing province narratives <strong>for</strong> Califomia are written in detail, to reflectcurrent conservation planning ef<strong>for</strong>ts. Since December 1990, CalfoUmia landowners,<strong>for</strong>estry associations, environmental interests, scientists, andfederaland state agencies have been participating in section 10 conservation planning(see section IL C.5.) Thefollowing descriptions of biological goals and implementationoptions are derived from <strong>the</strong> ongoing conservation planning ef<strong>for</strong>ts. Thenarratives also mention habitat conservation plans (HCPs) that have been, or arebeing prepared, by industrial<strong>for</strong>est owners in Califomia.Cali<strong>for</strong>nia Coast ProvinceProvince descriptionThe Cali<strong>for</strong>nia Coast province extends from <strong>the</strong> Oregon border to San FranciscoBay and from <strong>the</strong> ocean to <strong>the</strong> western border of national <strong>for</strong>est lands.The coastal portion of <strong>the</strong> province encompasses <strong>the</strong> majority of <strong>the</strong> redwood<strong>for</strong>est habitat type (Appendix B). Inland <strong>for</strong>ests are Douglas-fir and mixedDouglas-fir/hardwood types, <strong>the</strong> latter often interspersed with chaparral andgrasslands. Most <strong>for</strong>estland is in industrial or nonindustrial private ownership.Federal land in <strong>the</strong> province includes two national parks, a BLM conservationarea, and a small portion of <strong>the</strong> Six Rivers National Forest.The Round Valley Indian Reservation occurs within <strong>the</strong> Cali<strong>for</strong>nia Coast province;recovery contributions by <strong>the</strong> Covelo tribes are described in section II.C.8.Approximately 35 percent of <strong>the</strong> nor<strong>the</strong>rn spotted owl's range and 30 percent ofits known population in Cali<strong>for</strong>nia are in <strong>the</strong> Cali<strong>for</strong>nia Coast province. <strong>Owl</strong>populations are relatively high, with 450 known historic activity centers ( 11percent on federal lands): pairs have been verified at 188 of <strong>the</strong>se locationsduring <strong>the</strong> past 5 years.Major threats in <strong>the</strong> province are <strong>the</strong> rate of habitat loss, particularly in <strong>the</strong>redwood zone, <strong>the</strong> low level of suitable Douglas-fir habitat, and <strong>the</strong> isolation oftwo populations at <strong>the</strong> sou<strong>the</strong>rn end of <strong>the</strong> range of <strong>the</strong> subspecies (sectionII.B.6.).Approximately 80 percent of <strong>the</strong> known spotted owl population in <strong>the</strong> provinceis on nonfederal lands. If those owls were extirpated, <strong>the</strong> remaining populationson federal lands would be too small and scattered to be self-sustaining.The spotted owl populations on federal lands south of nor<strong>the</strong>rn HumboldtCounty likely would be extirpated, and this loss in turn would affect populationsin <strong>the</strong> sou<strong>the</strong>rn end of <strong>the</strong> adjoining Cali<strong>for</strong>nia Klamath province, whereowl density and amount of habitat are already low.Biological goals and implementation onfederal landsLack of federal land ownership in this province limits <strong>the</strong> recovery potential.As a result, no category 1 DCAs can be delineated in <strong>the</strong> province. However,28 category 2 DCAs are recommended (Table 3.19., Table 3.20.). The largerDCAs are in national parks; <strong>the</strong> remaining DCAs are in <strong>the</strong> BLM conservationarea and o<strong>the</strong>r BLM land. BLM parcels are included in smaller category 2179
DCAs, often combined with adjacent state park lands. Eleven of <strong>the</strong>se parcelsmight be consolidated into three groups, one of which could be a category 1DCA. The DCAs contain approximately 50 percent of <strong>the</strong> owl pairs known tooccur on federal lands in <strong>the</strong> province (Figure 3.23).Table 3.19. Summary of acreage and owl pairs <strong>for</strong> designated conservation areas(DCAs) and <strong>for</strong> all lands in <strong>the</strong> Cali<strong>for</strong>nia Coast province. (More detailed in<strong>for</strong>mation,including projected owl pairs on nonfederal lands, is in Appendix J, Table J.9.)Acreage<strong>Owl</strong> PairsDCA Percent NRF Current FutureIdent. Federal Habitat Known <strong>Owl</strong>s 3 Projected ProjectedNumber Total Land' Federal 2 Federal Nonfed Federal 4 Federal 5CD-47 32,388 42 1 0 2 3CD-48 80,250 83 0 0 10 14CD-50 38,455 84 2 0 10 12CD-52 73,644 57 1 0 11 11CD-53 8,306 47 0 0 2 2CD-54 1,558 63 1 0 1 1CD-56 2,272 100 3 0 3 3CD-57 6,574 38 0 0 1 3CD-58 1,266 90 0 0 1 2CD-59 5,340 52 0 0 3 4CD-60 2,899 58 0 0 1 3CD-61 4,576 59 1 0 1 3CD-62 2,676 52 0 0 1 2CD-63 2,970 77 0 0 1 3CD-65 10,676 91 1 0 1 2CD-66 12,907 58 0 0 1 5CD-67 8,090 53 0 0 0 2CD-69 2,979 76 0 0 1 2CD-70 2,555 63 0 0 0 1CD-73 4,650 79 0 0 1 2CD-74 7,715 91 0 0 1 3CD-75 6,953 65 0 0 1 2CD-76 1,069 100 0 0 1 1CD-77 1,865 88 0 0 0 0CD-78 2,500 36 0 0 1 1CD-80 3,520 92 0 0 1 2CD-201 43 100 0 0 1 0CD-202 426 100 0 0 1 1OD-22 This DCA crosses state boundary; data are illustrated in Oregon Klamath province table.Totals: 329,122 69 10 0 59 90Totals <strong>for</strong> all lands in province: 20 135'Management of nonfederal lands within <strong>the</strong> perimeter of designated conservation areas is discussed in <strong>the</strong> narrative.2 NRF = nesting, roosting, and <strong>for</strong>aging habitat <strong>for</strong> spotted owls. Habitat in<strong>for</strong>mation was not available <strong>for</strong> this province.3Numbers are pairs of spotted owls verified in a 5-year period ei<strong>the</strong>r 1986 through 1990 or 1987 through 1991.4 This is an estimate of <strong>the</strong> number of pairs of owls that <strong>the</strong> DCA would be expected to support on federal lands if <strong>the</strong> population stabilized withcurrent habitat conditions. See Appendix J <strong>for</strong> fur<strong>the</strong>r details.5 This is an estimate of <strong>the</strong> number of pairs of owls that <strong>the</strong> DCA might support in <strong>the</strong> future on federal lands if habitat were recovered. SeeAppendix J <strong>for</strong> fur<strong>the</strong>r details.180
Table 3.20. Summary comments on <strong>the</strong> designated conservation area (DCA)network in <strong>the</strong> Cali<strong>for</strong>nia Coast province. (Section III.C.2. and Appendix I providefur<strong>the</strong>r in<strong>for</strong>mation on <strong>the</strong> criteria and process used to delineate <strong>the</strong>se areas.)DesignatedConservationAreaCD-47, CD-48, CD-50,and CD-52CD-53, CD-54,CD-56 through CD-63,CD-65 through CD-67,CD-69, CD-70,CD-73 through CD-78,CD-80, CD-201, andCD-202CommentsLimited federal land ownership does not provideopportunities to delineate category 1 DCAs. These category 2 areas areimportant <strong>for</strong> demographic support of <strong>the</strong> owl population in <strong>the</strong> nor<strong>the</strong>rnCali<strong>for</strong>nia Coast Range. These DCAs also provide <strong>for</strong> populationconnectivity with interior DCAs on national <strong>for</strong>est lands.Many BLM parcels in <strong>the</strong> Cali<strong>for</strong>nia Coast provinceare delineated as DCAs. Their size anddistribution limits <strong>the</strong> ability of any parcel tosupport more than five pairs. Many of <strong>the</strong>se smallDCAs may not be able to support even a single pairof owls without additional suitable habitat onsurrounding state or private lands. The value of <strong>the</strong>se areas is toconnect suitable habitats throughout <strong>the</strong> north coast area and to provideshort-term demographic support and future nesting areas in conjunctionwith suitable habitat on private lands....... ................ ...........-.... ........ -.1...I.....J:Sou<strong>the</strong>rn Del Norte and nor<strong>the</strong>rn Huwboldt Counties. Federal lands in this areahave too little habitat capability to support 20-pair clusters without supportfrom nonfederal lands. DCAs CD-47 and CD-53 are expected to maintainfewer than three pairs each, but <strong>the</strong>ir owl populations could be streng<strong>the</strong>nedby owl populations on nearby state and private lands.Sou<strong>the</strong>rn Humboldt and central Mendocino Counties. As in <strong>the</strong> rest of <strong>the</strong>province, federal land and state parks in this area are too small to support 20-pair clusters and should be supplemented by nearby lands with suitablehabitat. Also, <strong>the</strong> category 2 DCAs and <strong>the</strong> residual habitat areas in this areashould be supported by nonfederal lands to make <strong>the</strong>m consistent with size,spacing, and density criteria. Three category 2 DCAs could be upgraded tosupport 20 owl pairs by consolidation with o<strong>the</strong>r DCAs and management areason private lands. Dispersal habitat on federal and nonfederal land is neededamong areas managed <strong>for</strong> owl clusters.Biological goals on nonfederal landsMinimum rangewide recovery goals <strong>for</strong> nonfederal lands are described insection III.C.4. With <strong>the</strong> lack of federal land, additional recovery goals <strong>for</strong>nonfederal lands in <strong>the</strong> Cali<strong>for</strong>nia Coast province are to provide demographicstability and maintain nor<strong>the</strong>rn spotted owl distribution throughout <strong>the</strong>province. This can be achieved by conservation measures that result in <strong>the</strong>equivalent of 11 clusters of breeding pairs appropriately spaced throughout <strong>the</strong>province, with adequate dispersal habitat among <strong>the</strong> clusters.The continued presence of owls in this province depends upon state andprivate lands. Only 11 percent of <strong>the</strong> known owl sites in <strong>the</strong> province are onfederal lands, and <strong>the</strong>se sites alone are insufficient to maintain owls through-181
<strong>Owl</strong> pairsLiKnown owlsin <strong>the</strong> provinceEKnown owlsin DCAsNonfederal landFederal landFigure 3.23. Kriown owl pairs in <strong>the</strong> Cali<strong>for</strong>nia Coast province and inDCAs within thEae province.-...... -111.1.1- --............. .......... ................ ......................................................I ........................... -1- -I.- IAcres (thousands)6.Total acresin <strong>the</strong> provinceAcres in DCAs-1 ___ >NonTederal landa Federal land NRF habitat 2Figure 3.24. Acres in <strong>the</strong> Cali<strong>for</strong>nia Coast province and in DCAs within <strong>the</strong> province.'Management of nonfederal lands within <strong>the</strong> perimeter of designated conservation areas is discussed in <strong>the</strong> narrative.2 NRF habitat = nesting, roosting, and <strong>for</strong>aging habitat. This in<strong>for</strong>mation is not available <strong>for</strong> this province.;::.X : ::.:::::...... :.....-.................................... :.:.....:.: .....................................................:..'.:.:...::;...:182
out <strong>the</strong> province. These owl activity centers on federal lands contribute to fourof <strong>the</strong> 11 larger clusters needed to maintain <strong>the</strong> owl population throughout <strong>the</strong>province. Outside of <strong>the</strong> Redwood National Park areas, owl activity centers onfederal land will contribute no more than 11 owl pairs to any of <strong>the</strong> clusters onnonfederal lands. Also, distances among most of <strong>the</strong> DCAs on federal landsexceed current size and spacing standards, which creates more need <strong>for</strong>dispersal habitat on <strong>the</strong> intervening nonfederal land.There is not enough habitat in <strong>the</strong> DCAs in this area to support a sustainableowl population. Options exist <strong>for</strong> nonfederal lands to supplement existingDCAs, and to provide <strong>for</strong> clusters where spacing among DCAs exceeds <strong>the</strong>current standards. Supplementing DCAs and providing <strong>for</strong> clusters does notrequire reserves or set-asides of private land and can be achieved throughvoluntary actions on private lands and compliance with regulations.Del Norte and nor<strong>the</strong>rn Humboldt Counties. Nonfederal lands can be managed<strong>for</strong> nesting, roosting, and <strong>for</strong>aging habitat, <strong>for</strong> clusters or supplemental pairareas, and <strong>for</strong> dispersal habitat among owl clusters and DCAs.Central Humboldt County. A substantial population of spotted owls occurs eastand sou<strong>the</strong>ast of Eureka, but no DCAs are possible in this area. At least two20-pair clusters or equivalent supplemental pair protection would be neededon state and private lands in this area to meet recovery goals <strong>for</strong> demographicstability and distribution throughout <strong>the</strong> province. Dispersal habitat should bemaintained among areas managed <strong>for</strong> owl clusters.Sou<strong>the</strong>rn Humboldt and nor<strong>the</strong>rn Mendocino Counties. DCAs and state parksare too small in this area to hold 20-pair clusters and must rely on o<strong>the</strong>rnearby lands with suitable habitat to provide demographic support. All category2 DCAs and residual habitat areas would benefit from support bysupplemental pair areas or habitat on state and private lands, as feasible andconsistent with current size and spacing criteria. At present, approximately 25category 2 DCAs and 10 residual habitat areas in this area are on federal landand would benefit from this support. For example, three category 2 DCAs have<strong>the</strong> capability to be upgraded to support 20 owl pairs by combining <strong>the</strong>m witho<strong>the</strong>r DCAs and instituting favorable management on private lands. Fourteenowl activity centers on state park lands also would benefit from this type ofsupporting habitat. In addition to providing nesting, roosting, and <strong>for</strong>aginghabitat, dispersal habitat is needed among areas managed <strong>for</strong> owl clusters andDCAs.Sou<strong>the</strong>rn Mendocino to nor<strong>the</strong>rn Sonoma Counties. Two 20-pair owl clusters areneeded in this area to support owl populations far<strong>the</strong>r south and east inSonoma, Napa, and Marin Counties. The clusters would be best placed in <strong>the</strong>generally suitable habitat near <strong>the</strong> coast; habitat of naturally low suitability isfound west and southwest of Clear Lake. Adoption of standard spacing amongclusters would result in locating one in southwestern Mendocino County andone in northwestern Sonoma County. One state park could serve as <strong>the</strong> basis<strong>for</strong> a cluster, supported by management <strong>for</strong> additional pairs on private land.Sou<strong>the</strong>rn end of <strong>the</strong> province. <strong>Owl</strong>s in <strong>the</strong> sou<strong>the</strong>rn part of <strong>the</strong> Cali<strong>for</strong>nia Coastprovince have <strong>the</strong> highest risk of extirpation because of <strong>the</strong>ir isolation. Habitatin nor<strong>the</strong>rn Marin County, nor<strong>the</strong>astern Sonoma County, and most of LakeCounty is ei<strong>the</strong>r unsuitable, or is of low or questionable suitability. <strong>Owl</strong>s maynot disperse readily across <strong>the</strong>se areas. Three state parks in this area are largeenough to serve as <strong>the</strong> basis <strong>for</strong> three breeding clusters, if augmented byprivate lands. However, it may not be feasible to support 20 owl pairs in <strong>the</strong>sebreeding clusters. Known owl activity centers on state and private lands in<strong>the</strong>se breeding clusters should be managed conservatively to retain all owl183
nesting and roosting habitat until monitoring and research indicate that <strong>the</strong>threat of local extirpation has been diminished substantially.Implementation options on nonfederal landsSeveral options are available <strong>for</strong> achieving recovery goals on nonfederal landsin <strong>the</strong> Cali<strong>for</strong>nia Coast province. There are a number of existing reserves,including federal lands and state parks. Most of <strong>the</strong> state land in <strong>the</strong> provinceis in two parks and can be expected to provide owl habitat over <strong>the</strong> long term.Managed <strong>for</strong>ests on private lands also can provide <strong>for</strong> nesting, roosting, <strong>for</strong>aging,and dispersal habitat. The potential <strong>for</strong> finding additional owls throughsurveys is high, and may create an incentive <strong>for</strong> private landowners to developlandscape management approaches <strong>for</strong> owl conservation. At least one largeindustrial landowner is developing a habitat conservation plan (HCP), ando<strong>the</strong>r landowners have expressed interest in developing an HCP or o<strong>the</strong>rhabitat conservation measures.State <strong>for</strong>est practices rules and <strong>the</strong> state-sponsored HCP process provide o<strong>the</strong>ravenues <strong>for</strong> landscape management. Current take prohibitions do not providedirectly <strong>for</strong> adequate clustering of owl pairs or spacing of owl clusters, because<strong>the</strong> state <strong>for</strong>est practices rules place constraints on cumulative impacts,activity in riparian zones, and <strong>the</strong> size and spacing of clear-cuts. Amendmentsto <strong>the</strong> <strong>for</strong>est practices rules would be needed to require specific habitat retentionstandards, different "zonal" practices, and long-term plans. The <strong>for</strong>estpractices rules currently provide <strong>for</strong> long-term plans only on nonindustrialownership. The state-sponsored HCP program is addressing <strong>the</strong>se issues andis expected to be completed in early 1993.Land acquisition opportunities are expected to be limited because of <strong>the</strong> lack offederal lands available <strong>for</strong> exchange, lack of funding <strong>for</strong> purchase, and concernsregarding removing land from private ownership.There are potential implementation difficulties in nor<strong>the</strong>rn Marin, nor<strong>the</strong>asternSonoma, and Lake Counties because of habitat and ownership patterns. <strong>Owl</strong>conservation in this area may have to rely on take prohibitions on a case-bycasebasis. The ability to maintain owl populations is limited by poor suitabilityand distribution of habitat, numerous small ownerships, and <strong>the</strong> inabilityto manage landscapes collectively. Existing local land trusts and open-spacedistricts may provide funds <strong>for</strong> land acquisition but probably will require activeparticipation of county government through local land-use regulation.Implementation of recovery goals would be expedited if landowners were givenflexibility in <strong>the</strong> placement of clusters, although this approach may requiregreater monitoring ef<strong>for</strong>ts and conservative targets.Three options are presented <strong>for</strong> achieving recovery goals, however, o<strong>the</strong>roptions may be appropriate if <strong>the</strong>y achieve equivalent or better protection <strong>for</strong><strong>the</strong> owl. Given <strong>the</strong> variation in land ownership and specific conservation needsthroughout <strong>the</strong> province, a combination of options is likely to be implementedeventually. Each option must be evaluated by its ability to achieve recoverygoals if fully implemented.Option 1: Management of individual owl sitesThis option would build clusters of owls based on current knowledge of owlsites. Clusters would be identified in a specific location, quantity, and qualityof habitat.184
This option would provide <strong>the</strong> opportunity <strong>for</strong> timber management on privatelands that includes clusters or support DCAs and reserved pair areas whilemeeting standards <strong>for</strong> suitable habitat quality and quantity. Managing tomaintain dispersal habitat is recommended <strong>for</strong> private lands among DCAs andowl clusters on private lands. In nor<strong>the</strong>rn Marin, nor<strong>the</strong>astern Sonoma, andLake Counties, concerns about low population and connectivity to <strong>the</strong> adjacentprovince would preclude timber harvest of suitable owl habitat.Habitat requirements <strong>for</strong> individual sites could be identified by implementingminimum stand structure provisions <strong>for</strong> each habitat type within this province.On private lands, owners could manage owl habitat if safeguards ensured <strong>the</strong>maintenance of local owl populations. Safeguards could take <strong>the</strong> <strong>for</strong>m ofper<strong>for</strong>mance bonds, mitigation banks, or dedicated areas such as easements.Implementation and monitoring under this option would require substantialowl surveys. Consequently, this option, compared to o<strong>the</strong>r options, may beharder to establish because of management on a site-by-site basis. This optionwould provide landowners with <strong>the</strong> least amount of management flexibility at<strong>the</strong> site level and may raise equity issues among ownerships. Private landownerswho have conducted owl surveys on <strong>the</strong>ir lands may have a disadvantageover those who have not surveyed <strong>for</strong> owls when known owl sites are used toestablish clusters.This option, compared to <strong>the</strong> o<strong>the</strong>r two options, may be easier to monitor <strong>for</strong>compliance, and would allow site-specific management practices tailored tosite-specific conditions. The site-by-site application may make it easier toreview <strong>the</strong> impact of management practices. Protecting known nest siteswithin a larger landscape strategy of clusters and dispersal habitat maypresent lower risk to owl populations over <strong>the</strong> short term.Option 2: Management of clusters:flxed boundariesThis option would allow <strong>for</strong> management at <strong>the</strong> 20-pair cluster level, in lieu of<strong>the</strong> individual site level. Clusters would be located with fixed boundaries, andhabitat quality and quantity within <strong>the</strong> cluster would be managed to support aspecified number of owls. O<strong>the</strong>r standards (e.g., minimum habitat block size,spacing of habitat blocks) would be provided. Location of owl sites within <strong>the</strong>cluster may be more variable over time than in option 1. The cumulativeimpact of timber harvesting and o<strong>the</strong>r <strong>for</strong>est management activities on owlhabitat within <strong>the</strong> cluster would be evaluated, and mitigation measures couldbe proposed to offset <strong>the</strong> impacts. <strong>Owl</strong> clusters in <strong>the</strong> sou<strong>the</strong>rn extreme of <strong>the</strong>province would be managed to retain all suitable habitat.Habitat standards and safeguards would be similar to those in option 1. Sincefixed boundaries <strong>for</strong> supporting DCAs and clusters on private lands are recommended,implementation could rely on known existing owl sites or additionalowl survey work. Once cluster areas are established, monitoring habitatconditions over time would be more important than individual owl surveys.This option would provide greater flexibility to landowners than does option 1and allow <strong>for</strong> local management options.This option also would require a higher level of habitat monitoring and perhapsgreater amounts of habitat than would option 1, because <strong>the</strong> status of owlpairs is not stressed. If long-term monitoring determines that <strong>for</strong>est managementachieves expected results in owl populations, a longer time or greaterconservation action may be required to correct <strong>the</strong> strategy.185
Option 3: Management of clusters: general boundariesThis option would allow greater flexibility to private landowners in meetingrecovery objectives because <strong>the</strong> boundaries of areas managed <strong>for</strong> owl clustersare generalized. Each cluster would have a designated general size, based on<strong>the</strong> numbers of owls it should contain and <strong>the</strong> home range size that would benecessary <strong>for</strong> owls in that province. Only a general location would be specifiedto meet spacing guidelines; <strong>the</strong> location of <strong>the</strong> perimeter would not be fixed.Guidelines would be based on maintaining owl pairs in clusters ra<strong>the</strong>r thanmaintaining isolated owl pairs or individuals. Landowners would determinewhere owls would occur within clusters. An owl cluster within a singlelandownership would be managed by <strong>the</strong> landowner. An owl cluster thatencompasses land owned by several landowners would be managed through acoordinated resource management plan agreed upon by all landowners. <strong>Owl</strong>sin <strong>the</strong> extreme sou<strong>the</strong>rn portion of <strong>the</strong> range would be managed in enlargedclusters with no removal of owl nesting and roosting habitat.This option would provide <strong>the</strong> landowner with <strong>the</strong> greatest number of optionsin land management and would require minimal owl surveys. <strong>Owl</strong> surveyscould be limited to those required to estimate population trends <strong>for</strong> <strong>the</strong> province.The option also could serve as <strong>the</strong> framework <strong>for</strong> a more generalized,landscape-based habitat conservation strategy that could consider o<strong>the</strong>rspecies, biological diversity, and ecosystems.This option would require substantial management planning by landowners toensure that recovery goals will be achieved and maintained. Habitat monitoringwould be <strong>the</strong> paramount concern and would be <strong>the</strong> responsibility of landownersand implementing agencies. This strategy also would carry a higherrisk of declines in owl populations during <strong>the</strong> short term or delays in meetingrecovery goals, since many of <strong>the</strong> relationships between owls and <strong>for</strong>est managementover <strong>the</strong> long term are unclear at this time and have not been tested.Achieving recovery goals <strong>for</strong> <strong>the</strong> province will require strong coordinationamong large and small private landowners, <strong>the</strong> state, and <strong>the</strong> state <strong>for</strong>estpractices rules. In many areas <strong>the</strong> need <strong>for</strong> BLM participation will be highbecause of <strong>the</strong> numerous small BLM parcels adjacent to state and privatelands. In Marin, Sonoma, and Napa Counties, coordination with local andcounty governments may be critical to maintain owls on private lands and touse zoning to help maintain owl habitat. Coordination in managing owls inthis province is underway in <strong>the</strong> <strong>for</strong>m of a state-sponsored habitat conservationplan (HCP) <strong>for</strong> <strong>the</strong> nor<strong>the</strong>rn spotted owl in Cali<strong>for</strong>nia.Cali<strong>for</strong>nia Klamath ProvinceProvince descriptionThe Cali<strong>for</strong>nia Klamath province is located between <strong>the</strong> Cali<strong>for</strong>nia Coast and<strong>the</strong> Cali<strong>for</strong>nia Cascades provinces. It is a continuation of <strong>the</strong> Oregon Klamathprovince, south to <strong>the</strong> Clear Lake Basin in <strong>the</strong> inner Coast Range. The area ismountainous and covered primarily with Douglas-fir <strong>for</strong>ests. Mixed Douglasfir<strong>for</strong>ests are common at lower elevations with Douglas-fir/true fir <strong>for</strong>ests athigher elevations. The province land ownership is dominated by four national<strong>for</strong>ests, but includes a few parcels of BLM lands near <strong>the</strong> eastern border.There are some private <strong>for</strong>estlands, also near <strong>the</strong> eastern edge of <strong>the</strong> province.The Hoopa Indian Reservation occurs within <strong>the</strong> Cali<strong>for</strong>nia Klamath province;recovery contributions of <strong>the</strong> Hoopa Tribe are described in section II.C.8.186
There are 950 historic owl activity centers in <strong>the</strong> Cali<strong>for</strong>nia Klamath province,88 percent of which are on federal lands. During <strong>the</strong> 1986-90 period, pairs ofowls were identified at 455 of <strong>the</strong>se sites. Eighty-eight percent of <strong>the</strong>se pairactivity centers occur on federal lands.The major threats to <strong>the</strong> nor<strong>the</strong>rn spotted owl population in this province arisefrom reduction in suitable habitat and resulting loss of owls caused by timberharvesting during <strong>the</strong> last 40 years. Catastrophic fires occur within <strong>the</strong>province and have <strong>the</strong> potential to destroy <strong>for</strong>ested areas large enough tosupport a 20-pair cluster.<strong>Spotted</strong> owls in this province are important to maintain genetic contact between<strong>the</strong> nor<strong>the</strong>rn spotted owl and Cali<strong>for</strong>nia spotted owl subspecies. Geneticcontact is thought to be important because of <strong>the</strong> low numbers and scattereddistribution of owls in <strong>the</strong> Cali<strong>for</strong>nia Cascades province, and recommendedDCAs reflect that concern.Biological goals and implementation on federal landsFourteen category 1 and 19 category 2 DCAs are recommended in <strong>the</strong> province(Tables 3.21 and 3.22). All category 1 DCAs occur in <strong>the</strong> western and nor<strong>the</strong>rnpart of <strong>the</strong> province, providing <strong>the</strong> demographic stability <strong>for</strong> owl populations in<strong>the</strong> province. The category 1 DCAs include little state or private land; <strong>the</strong>senonfederal lands support few owls and are not essential <strong>for</strong> demographicstability. Large DCAs in <strong>the</strong> nor<strong>the</strong>rn and western portions of <strong>the</strong> provincehave better natural site conditions and higher known owl populations than do<strong>the</strong> eastern and sou<strong>the</strong>rn portions of <strong>the</strong> province. The presence of <strong>the</strong>sesDCAs reduces <strong>the</strong> need <strong>for</strong> contributions from state and private land in <strong>the</strong>western portion of <strong>the</strong> province.Category 2 DCAs are common along <strong>the</strong> eastern edge and <strong>the</strong> sou<strong>the</strong>rn end of<strong>the</strong> province. Twelve reserved pair areas will be needed in <strong>the</strong> sou<strong>the</strong>rn end of<strong>the</strong> province where category 2 DCAs are deficient in suitable habitat, and along<strong>the</strong> eastern edge of <strong>the</strong> province where spacing requirements among DCAscannot be met.The DCAs contain 52 percent of <strong>the</strong> owl pairs and 41 percent of <strong>the</strong> nesting,roosting, and <strong>for</strong>aging habitat on federal land in <strong>the</strong> province (Figures 3.25 and3.26).Outside of <strong>the</strong> DCAs, federal lands should be managed under matrix prescriptionA.Biological goals and implementation options onnonfederal landsScientific goals <strong>for</strong> nonfederal lands in <strong>the</strong> province are to provide <strong>for</strong> localdemographic support and maintain distribution across <strong>the</strong> province andbetween this province and <strong>the</strong> Cali<strong>for</strong>nia Cascades province. Given <strong>the</strong> dominanceof federal land ownership in <strong>the</strong> province, <strong>the</strong>re is no need <strong>for</strong> localpopulation clusters on state and private lands in <strong>the</strong> western zone. <strong>Recovery</strong>will be enhanced by supporting existing DCAs in <strong>the</strong> eastern and sou<strong>the</strong>rnzones with additional pairs from private lands, and by managing <strong>for</strong> a newcluster on state, private, and BLM lands in eastern Trinity County.Achieving <strong>the</strong> recovery goals <strong>for</strong> nonfederal lands in this province wouldcontribute substantial support to <strong>the</strong> demographic stability of owl populationswithin <strong>the</strong> province, and increase <strong>the</strong> likelihood of more rapid recovery. Dispersalsinks, which negatively affect overall population stability, could result if187
Table 3.21. Summary of acreage and owl pairs <strong>for</strong> designated conservation areas(DCAs) and <strong>for</strong> all lands in <strong>the</strong> Cali<strong>for</strong>nia Klamath province. (More detailed in<strong>for</strong>mation,including projected owl pairs on nonfederal land is in Appendix J, Table J.10.)Acreage<strong>Owl</strong> PairsDCA Percent NRF Current FutureIdent. Federal Habitat Known <strong>Owl</strong>s 3 Projected ProjectedNumber Total Land 1 Federal 2 Federal Nonfed Federal 4 Federal 5CD-1 104,956 99 42,240 7 0 27 28CD-2 55,596 99 26,040 9 0 21 23CD-3 38,032 95 14,200 27 0 28 25CD-4 62,989 95 35,840 16 0 22 25CD-5 83,065 100 14,960 8 0 25 29CD-6 47,559 100 13,000 10 0 20 22CD-7 14,171 96 1,840 7 0 6 8CD-8 140,630 100 71,280 23 0 42 44CD-9 6,299 100 2,120 1 0 2 2CD-10 56,011 95 17,520 13 0 21 23CD-11E 97,567 98 27,600 9 0 22 24CD-11W 95,908 99 44,320 12 0 26 28CD-12 54,928 95 17,400 8 0 21 23CD-13 43,795 91 24,080 7 0 16 20CD-14 30,042 91 4,040 4 0 5 7CD-15 112,694 98 34,480 12 0 29 31CD-16 66,371 98 13,680 6 0 22 24CD-17 33,597 97 6,000 3 0 6 7CD-18 50,221 97 8,600 2 0 9 14CD-19 27,563 88 5,520 4 0 5 6CD-20 9,758 93 1,880 4 0 3 3CD-21 25,743 98 5,440 2 0 5 7CD-23 7,145 99 2,760 2 0 4 4CD-24 3,383 100 1,360 1 0 1 1CD-25 4,218 99 1,680 1 0 1 1CD-26 1,716 54 360 1 0 1 1CD-27 2,262 83 480 1 0 1 1CD-29 23,613 95 4,960 2 0 6 7CD-30 13,187 85 3,000 1 0 3 4CD-31 40,191 78 7,840 3 0 8 15CD-32 9,811 71 2,280 3 1 2 3CD-33 4,133 96 760 0 0 0 2CD-34 3,138 78 240 1 0 1 2OD-20 This DCA crosses state boundary; data are illustrated in Oregon Klamath province table.Totals: 1,370,292 96 457,800 210 1 411 464Totals <strong>for</strong> all lands in province: 1,105,550 403 52'Management of nonfederal lands within <strong>the</strong> perimeter of designated conservation areas is discussed in <strong>the</strong> narrative.2 NRF = nesting, roosting, and <strong>for</strong>aging habitat <strong>for</strong> spotted owls. Habitat in<strong>for</strong>mation was not available <strong>for</strong> nonfederal lands.3Numbers are pairs of spotted owls verified in a 5-year period ei<strong>the</strong>r 1986 through 1990 or 1987 through 1991.4 This is an estimate of <strong>the</strong> number of pairs of owls that <strong>the</strong> DCA would be expected to support on federal lands if <strong>the</strong> population stabilized withcurrent habitat conditions. See Appendix J <strong>for</strong> fur<strong>the</strong>r details.5 This is an estimate of <strong>the</strong> number of pairs of owls that <strong>the</strong> DCA might support in <strong>the</strong> future on federal lands if habitat were recovered. SeeAppendix J <strong>for</strong> fur<strong>the</strong>r details.VI 38
Table 3.22. Summary comments on <strong>the</strong> designated conservation area (DCA)network in <strong>the</strong> Cali<strong>for</strong>nia Klamath province. (Section III.C.2. and Appendix Iprovide fur<strong>the</strong>r in<strong>for</strong>mation on <strong>the</strong> criteria and process used to delineate <strong>the</strong>seareas.)DesignatedConservationAreaAreaCD-3 and CD-8,CD-1, CD-2, CD-4CD-5, CD-6, CD-10,CD-1IE, CD-11W, CD-12CD-13, CD-15, and CD-16CD-7, CD-9CD-14, and CD-17through CD-21CD-23 through CD-27,CD-32 through CD-34CD-29 and CD-30CommentscommentsThese category 1 DCAs each currently support 20 or more pairs of owls.These category 1 DCAs currently support fewer than 20 known pairs ofowls. With <strong>the</strong> exception of CD-1 3, <strong>the</strong>y all have <strong>the</strong> current potentialto support at least 20 pairs. All of <strong>the</strong>m have <strong>the</strong> future potential tosupport at least 20 pairs.These DCAs do not support 20 pairs. CD-9 provides connectivityaround a high-elevation wilderness area. DC-7 provides connectivity toDCAs fa<strong>the</strong>r east.This drier and naturally fragmented habitat will support from 3 to 15pairs in <strong>the</strong> future.Because of <strong>the</strong> naturally fragmented landscape, larger multipair DCAsare not possible. These DCAs provide connectivity to DCAs to <strong>the</strong> westand provide <strong>the</strong> link between <strong>the</strong> ranges of <strong>the</strong> nor<strong>the</strong>rn spotted owl and<strong>the</strong> Cali<strong>for</strong>nia spotted owl in <strong>the</strong> Sierra Nevada.No opportunities exist to support Category 1 DCAs. DCAs are delineatedwhere owls are currently known, future habitat opportunitiesoccur, and where <strong>the</strong> only demographic support <strong>for</strong> this local populationis possible. Suitable habitat is not uni<strong>for</strong>mly distributed over this regionbecause of moisture and soil conditions.II/1- ......I.......................... ..........- ...............- .... - ......................... 11. 1 .1nonfederal lands are not managed to support <strong>the</strong> federal conservation ef<strong>for</strong>ts.Increases in demographic support assist in maintaining <strong>the</strong> linkage between<strong>the</strong> Cali<strong>for</strong>nia Klamath and <strong>the</strong> Cali<strong>for</strong>nia Cascades provinces, and supportpopulations in <strong>the</strong> adjacent Cali<strong>for</strong>nia Cascades province as well. his linkagecould be crucial to maintaining <strong>the</strong> owl population in <strong>the</strong> Cali<strong>for</strong>nia Cascadesprovince. Maintaining strong populations of <strong>the</strong> nor<strong>the</strong>rn spotted owl in <strong>the</strong>Cali<strong>for</strong>nia Klamath and Cascades provinces also would help maintain <strong>the</strong>linkage to <strong>the</strong> Cali<strong>for</strong>nia spotted owl.Western zone: No additional owl clusters or DCA support <strong>for</strong> owls are neededon state and private lands in <strong>the</strong> western part of <strong>the</strong> province, o<strong>the</strong>r thanmanagement <strong>for</strong> dispersal. DCAs on federal land should be consolidatedthrough <strong>the</strong> inclusion of inholdings.Eastern and sou<strong>the</strong>rn zones: The eastern and sou<strong>the</strong>rn parts of <strong>the</strong> provinceare drier and support a lower known population of owls, reflected by <strong>the</strong> lack ofcategory 1 DCAs. At least six category 2 DCAs and three reserved pair areascould be supported with currently known sites on state and private lands.Although this probably would not result in upgrading to category 1, it wouldincrease <strong>the</strong> stability of <strong>the</strong> relatively small owl populations in <strong>the</strong>se clusters.189
<strong>Owl</strong> pairs -Known owlsin <strong>the</strong> provinceKnown owlsin DCAsNonfederal landFederal landFigure 3.25. Known owl pairs in <strong>the</strong> Cali<strong>for</strong>nia Klamath province and inDCAs within <strong>the</strong> province.< I.............................................................. 11 .... I......-....... ............ ..........................-Acres (thousands)4,500- _ _4,000. -LiTotal acresin <strong>the</strong> province3,500.- _________________3,000- _2,500-_2,000- . .....g ~~~1,000- ,,lF.Xii*::::-,,_Acres in DCAsNonfederal land 1 Federal land NRF habitaFigure 3.26. Acres in <strong>the</strong> Cali<strong>for</strong>nia Klamath province and in DCAs within <strong>the</strong> province.'Management of nonfederal lands within <strong>the</strong> perimeter of designated conservation areas is discussed in <strong>the</strong> narrative.2 NRF habitat = nesting, roosting, and <strong>for</strong>aging habitat. This in<strong>for</strong>mation is available only <strong>for</strong> federal land.t 2I I'll, I ........... ... I 1.1", 11 ",.... 1 .- 1. 111 .I 11.1.111, I I ... I ...I................- ...................190
Managing <strong>for</strong> a new cluster on state, private, and BLM lands in eastern TrinityCounty would enhance recovery. This cluster would provide stronger demographicsupport in this part of <strong>the</strong> province and better connectivity across <strong>the</strong>sou<strong>the</strong>rn end of <strong>the</strong> Trinity Alps to <strong>the</strong> Cali<strong>for</strong>nia Cascades province.Implementation options on nonfederal landsNumerous alternatives exist <strong>for</strong> achieving recovery goals on nonfederal lands in<strong>the</strong> Cali<strong>for</strong>nia Kiamath province. There are substantial reserves of publiclands, and <strong>the</strong> recommendations <strong>for</strong> federal DCAs incorporate most of <strong>the</strong>m.One large private timberland owner has committed to a management planincorporating extensive owl surveys to ensure that owls will not be taken as aresult of <strong>the</strong> landowner's timber operations. A number of o<strong>the</strong>r timberlandowners in <strong>the</strong> province voluntarily practice partial entry or uneven-age managementwhich lessens impact to owl habitat. O<strong>the</strong>r timberland owners haveexpressed an interest in developing comprehensive owl management plans <strong>for</strong><strong>the</strong>ir ownerships, in compliance with <strong>the</strong> current state <strong>for</strong>est practices rules.The large number of owl sites in <strong>the</strong> area is an incentive <strong>for</strong> developing <strong>the</strong>seplans, as is <strong>the</strong> state-sponsored HCP, which could benefit smaller acreagelandowners in <strong>the</strong> province.Forest practices rules would have to be amended to require specific habitatretention standards, different practices in different 'zones," and long-termplans. Forest practices rules currently provide <strong>for</strong> long-term plans on nonindustrialownerships only. The state-sponsored habitat conservation plan (HCP)is underway and addressing <strong>the</strong>se issues. The HCP is expected to be completedin early 1993.The extensive checkerboard ownership pattern in <strong>the</strong> province offers greaterflexibility to explore land exchanges.Land acquisition is likely to be less attractive, since many of <strong>the</strong> timberlandowners also own processing facilities that depend on a stable timber base.The feasibility and likelihood of early implementation of actions to achieve <strong>the</strong>recovery goals will increase if landowners are given greater flexibility to designateareas <strong>for</strong> maintaining nesting, roosting, and <strong>for</strong>aging habitat <strong>for</strong> supportingDCAs, but this may require greater ef<strong>for</strong>t in monitoring and establishmentof more stringent initial objectives.Four options are presented <strong>for</strong> achieving recovery goals. The options are notexhaustive, and o<strong>the</strong>r options may be appropriate if <strong>the</strong>y achieve equivalent orbetter protection <strong>for</strong> <strong>the</strong> owl. O<strong>the</strong>r options might provide <strong>for</strong> more generallandscape level habitat management, protection <strong>for</strong> o<strong>the</strong>r species and longtermmanagement. Given <strong>the</strong> differences in land ownership and specificconservation needs throughout <strong>the</strong> province, it is possible that some combinationof <strong>the</strong> options eventually will be implemented. All options must be evaluatedbased on <strong>the</strong> likelihood that <strong>the</strong>y will achieve recovery goals when fullyimplemented.Option 1: Management of owl sites adjacent tofederal DCAsThis option would consolidate DCAs on federal land through <strong>the</strong> inclusion ofinholdings in <strong>the</strong> western zone. Inholdings would be managed to create andmaintain suitable owl habitat. The option would offer nonfederal support tocategory 2 DCAs and reserved pair areas in <strong>the</strong> eastern and sou<strong>the</strong>rn zones,using sites less than, or equal to, 3 miles from <strong>the</strong> current DCA boundary, andall sites within <strong>the</strong> DCA boundary. Sites used <strong>for</strong> supporting federal areaswould have specified locations (e.g., confine site location to a specific drainage191
and to within 0.5 miles of <strong>the</strong> activity center), and rules that would ensure that<strong>the</strong> appropriate quantity and quality of habitat be maintained. Dispersalhabitat also would be designated throughout <strong>the</strong> province. A 20-pair cluster ineastern Trinity County would be managed with fixed boundaries and locationsof sites.Extensive surveying <strong>for</strong> owls would be necessary to implement this option andmonitor it over time. Fixed boundaries and site locations increase <strong>the</strong> certaintyduring <strong>the</strong> short term that owls will be found, but may raise issues of equitybetween landowners. Unless <strong>the</strong> area has been extensively surveyed, <strong>the</strong> useof existing known sites as <strong>the</strong> basis <strong>for</strong> restricting management may effectivelypenalize those owners who have conducted surveys and are engaged in activeresearch. This option limits <strong>the</strong> flexibility of landowners with <strong>the</strong> responsibilityof providing <strong>for</strong> owl sites.Option 2: Management of owl sites at <strong>the</strong> watershed levelThis option would provide a management strategy to maintain dispersalhabitat on private inholdings within federal DCAs in <strong>the</strong> western zone, butwould create incentives <strong>for</strong> consolidating <strong>the</strong> inholdings with DCA management.It would provide nonfederal support <strong>for</strong> category 2 DCAs and reservedpair areas in <strong>the</strong> eastern and sou<strong>the</strong>rn zone, using lands within <strong>the</strong> generalwatershed areas containing <strong>the</strong> DCA. Sites would be distributed based onknown owl occurrence. <strong>Owl</strong> sites within <strong>the</strong> major watersheds currentlyencompassed by <strong>the</strong> DCA would be recommended to provide support <strong>for</strong> <strong>the</strong>DCA. These sites would be managed to ensure that <strong>the</strong> appropriate quantityand quality of suitable habitat would be maintained and that <strong>the</strong> locationwould be maintained (e.g., similar to current state <strong>for</strong>est practices rulesregarding take, and confine <strong>the</strong> site activity center to a 3,000-acre area withina specific drainage). Dispersal habitat would be maintained throughout <strong>the</strong>province. A cluster of 10 pairs is an objective <strong>for</strong> eastern Trinity County.This option provides somewhat more flexibility to private landowners. It is stillbased on managing <strong>for</strong> individual activity centers, so extensive owl surveyswould be required. The location of sites is more flexible than under option 1,and fewer sites are likely to be required throughout <strong>the</strong> province. Higher risksmay be associated with maintaining only dispersal habitat on inholdingswithin DCAs in <strong>the</strong> western zone. Implementing this option, which is based oncurrently known activity centers, may effectively penalize landowners who havesurveyed extensively <strong>for</strong> owls, unless <strong>the</strong> area has been extensively surveyed.Option 3: Management of all known owl sitesThis option would maintain dispersal habitat on private inholdings withinDCAs in <strong>the</strong> western zone, but would create incentives <strong>for</strong> consolidating <strong>the</strong>inholdings with DCA management. Nonfederal land would support category 2DCAs and reserved pair areas in <strong>the</strong> eastern and sou<strong>the</strong>rn zone, using allknown sites. Habitat requirements <strong>for</strong> individual activity centers could beidentified and managed by implementing minimum stand structure provisions<strong>for</strong> each habitat type within province. Additionally, guidelines would beprovided at <strong>the</strong> cluster level to maintain such characteristics as <strong>the</strong> percentageof suitable habitat in <strong>the</strong> cluster, <strong>the</strong> minimum stand size and distribution ofthat suitable habitat, and <strong>the</strong> presence of high-value habitat at <strong>the</strong> activitycenter. Dispersal habitat would be designated throughout <strong>the</strong> province.This option also would include establishing a new cluster on state, private, andBLM lands in nor<strong>the</strong>astern Trinity County. This cluster has <strong>the</strong> potential <strong>for</strong>20 activity centers. Habitat would be provided by prescriptive managementrules controlling <strong>the</strong> quantity and quality of habitat to be maintained. It would192
confine site location to a specific drainage and would be within 0.5 miles of <strong>the</strong>activity center.This option would provide <strong>the</strong> best demographic support <strong>for</strong> <strong>the</strong> populations in<strong>the</strong>se areas where habitat conditions preclude maintaining large enoughclusters to provide a good chance of maintaining a viable population over time.Over time this might result in <strong>for</strong>ming larger clusters than currently possibleand in increasing local population stability.This option would require extensive owl surveys to identify owl sites and tomonitor implementation. The option creates a disincentive to locate owl sitesand an incentive to harvest suitable but unoccupied habitat. Managementstrategies <strong>for</strong> areas where spatial distribution of known locations do not.match" with needs to support DCAs.Option 4: Landscape-based habitat managementThis option would require maintaining dispersal habitat on inholdings withinDCA boundaries in <strong>the</strong> western zone, but would provide incentives <strong>for</strong> maintainingnesting, <strong>for</strong>aging, and roosting habitat. Category 2 DCAs and reservedpair areas in <strong>the</strong> eastern and sou<strong>the</strong>rn zones would be supported by providingsuitable habitat in areas within major watersheds included within DCA boundaries.Specific location of suitable habitat <strong>for</strong> activity centers would not bespecified, but quantity and quality would be ensured at <strong>the</strong> watershed level.Suitable habitat to support 10 pairs of owls would be maintained in easternTrinity County, using existing federal lands as <strong>the</strong> basis. Specific owl sitelocations and cluster boundaries would not be designated.This option provides greater flexibility to <strong>the</strong> private landowner. It would notrequire owl surveys to <strong>the</strong> extent of o<strong>the</strong>r options. The option provides incentives<strong>for</strong> landowners to participate in landscape level management, and tolocate owls or manage habitat in desirable locations.Coordination. Land ownership is dominated by <strong>the</strong> national <strong>for</strong>ests. Privatelands in <strong>the</strong> province are primarily large industrial <strong>for</strong>est holdings. BLM landsconstitute a small but relatively important portion of <strong>the</strong> area where managementof a cluster is proposed among multiple owners.This option requires coordination between large industrial <strong>for</strong>est landownersand <strong>the</strong> state and its <strong>for</strong>est practices regulation mechanism. A state-sponsoredhabitat conservation plan (HCP) <strong>for</strong> <strong>the</strong> nor<strong>the</strong>rn spotted owl in Cali<strong>for</strong>nia isbeing drafted that will provide <strong>the</strong> coordination necessary to accomplishmanagement suggested by this option.Cali<strong>for</strong>nia Cascades ProvinceProvince descriptionThe Cali<strong>for</strong>nia Cascades province is located in <strong>the</strong> center of <strong>the</strong> north end of<strong>the</strong> state, between <strong>the</strong> Oregon Cascades province, <strong>the</strong> Klamath provinces, and<strong>the</strong> range of <strong>the</strong> Cali<strong>for</strong>nia spotted owl at <strong>the</strong> north end of <strong>the</strong> Sierra Nevada.Suitable owl habitat generally is fragmented on a broad scale by <strong>the</strong> ShastaValley, Mt. Shasta, and o<strong>the</strong>r high elevation areas, areas of unsuitable soils,and areas of marginal, low elevation habitats. Suitable <strong>for</strong>est habitat is predominatelyon two national <strong>for</strong>ests although <strong>the</strong>re are significant blocks andcheckerboard ownership areas where <strong>for</strong>ests occur on mostly industrial privatelands. This area <strong>for</strong>ms <strong>the</strong> linkage between <strong>the</strong> range of <strong>the</strong> nor<strong>the</strong>rn spottedowl and <strong>the</strong> range of <strong>the</strong> Cali<strong>for</strong>nia spotted owl.193
<strong>Spotted</strong> owls have been found at 86 sites in <strong>the</strong> province; pairs have beenverified at 34 of <strong>the</strong>se in <strong>the</strong> last 5 years.The major threats to this nor<strong>the</strong>rn spotted owl population are its low numbersand density, and <strong>the</strong> fragmentation of <strong>the</strong> habitat that keeps pairs from aggregatingand <strong>for</strong>ming stable demographic units. Also, habitat conditions tend toisolate <strong>the</strong> populations inside <strong>the</strong> province from one ano<strong>the</strong>r and from populationsin neighboring provinces.Low population numbers, low amounts of suitable habitat, and poorly distributedsuitable habitat limit <strong>the</strong> contribution to recovery that historically andnaturally can be expected from <strong>the</strong> Cali<strong>for</strong>nia Cascades province. The populationis at high risk <strong>for</strong> local and even province-wide extinction.Minimum rangewide recovery goals <strong>for</strong> nonfederal lands are described insection III.C.4. Additional goals <strong>for</strong> nonfederal lands in <strong>the</strong> province are toprovide substantial demographic support to DCAs, maintain owl distribution,maintain <strong>the</strong> connection between nor<strong>the</strong>rn spotted owls and Cali<strong>for</strong>nia spottedowls, and maintain all known and future sites on nonfederal lands.The objectives <strong>for</strong> this province are considered important to maintaining <strong>the</strong>link between <strong>the</strong> two subspecies of <strong>the</strong> spotted owl in Cali<strong>for</strong>nia. Providinglocal demographic stability to <strong>the</strong> province, with owls well distributed, isnecessary to maintain <strong>the</strong> link. The value of <strong>the</strong> contact may be <strong>the</strong> geneticinterchange between <strong>the</strong> two subspecies. This exchange is not likely if <strong>the</strong>reare no nor<strong>the</strong>rn spotted owls between <strong>the</strong> Sacramento River (north of Redding)and <strong>the</strong> Cali<strong>for</strong>nia spotted owls at <strong>the</strong> northwest edge of Lassen NationalForest.However, <strong>the</strong> nor<strong>the</strong>rn spotted owl population and habitat conditions in thisarea are such that <strong>the</strong> likelihood of achieving a province population size with arelatively low risk of extinction is not great. This, coupled with <strong>the</strong> lack ofin<strong>for</strong>mation on <strong>the</strong> nor<strong>the</strong>rn spotted owl's historical occupancy of <strong>the</strong> provinceand <strong>the</strong> small population size, reduce <strong>the</strong> importance of <strong>the</strong> owls in thisprovince to <strong>the</strong> rangewide preservation of <strong>the</strong> nor<strong>the</strong>rn spotted owl subspecies.Biological goals and implementation onfederal landsTwenty-three DCAs are recommended in <strong>the</strong> province (Table 3.23). Because<strong>the</strong> owl population in <strong>the</strong> province is small and dispersed, none of <strong>the</strong>se willlikely contain 20 or more pairs of owls and only one of <strong>the</strong> category 2 DCAs willlikely contain more than ten pairs. Two reserved pair areas are recommendedin <strong>the</strong> province between CD-108 and CD-109. The DCAs contain 92 percent of<strong>the</strong> owl pairs and 61 percent of <strong>the</strong> nesting, roosting, and <strong>for</strong>aging habitatknown on federal lands in <strong>the</strong> province (Figures 3.27 and 3.28).Remaining federal lands in this province should be managed under matrixprescription B.Biological goals on nonfederal landsUnless owls on state and private lands are managed to complement <strong>the</strong> owlpopulation on federal lands, <strong>the</strong> benefits of conservation ef<strong>for</strong>ts on federallands will be limited and <strong>the</strong> link between <strong>the</strong> two subspecies will likely be lostover time.194
Implementation options on nonfederal landsBecause of <strong>the</strong> particular threats to <strong>the</strong> nor<strong>the</strong>rn spotted owl in <strong>the</strong> Cali<strong>for</strong>niaCascades province, relatively few options are available <strong>for</strong> achieving recoverygoals. Although a number of tools are available, conservation over <strong>the</strong> shortterm must focus on individual owl sites to offset <strong>the</strong> low population levels andpoor distribution of suitable habitat.Achieving recovery goals in this province will be potentially difficult. Existingreserves and DCAs may not have sufficient amounts of suitable habitat within<strong>the</strong>m. Currently practiced partial entry and uneven-aged management may beamenable to modification to provide suitable habitat, and <strong>the</strong>re is <strong>the</strong> possibil-Table 3.23. Summary of acreage and owl pairs <strong>for</strong> designated conservation areas (DCAs)and <strong>for</strong> all lands in <strong>the</strong> Cali<strong>for</strong>nia Cascades province. (More detailed in<strong>for</strong>mation, includingprojected owl pairs on nonfederal lands, is in Appendix J, Table J.1 1.)Acreage<strong>Owl</strong> PairsDCA Percent NRF Current FutureIdent. Federal Habitat Known <strong>Owl</strong>s 3 Projected ProjectedNumber Total Land 1 Federal 2 Federal Nonfed Federal 4 Federal 5CD-28 41,356 83 5,240 7 0 5 7CD-35 13,992 95 2,160 0 0 1 2CD-36 2,133 98 1,040 0 0 0 0CD-37 5,710 99 240 1 0 1 2CD-38 9,982 96 2,560 0 0 1 3CD-39 3,722 99 880 0 0 0 0CD-40 2,419 91 640 1 0 1 1CD-41 3,600 87 1,200 1 0 1 1CD-42 70,985 91 22,920 5 0 10 12CD-43 14,442 94 1,120 2 0 3 4CD-44 11,095 94 2,920 2 0 2 3CD-45 38,644 55 3,840 1 0 4 5CD-101 1,913 93 - 0 0 1 1CD-102 3,032 93 400 0 0 1 1CD-103 2,699 98 40 1 0 1 1CD-104 2,881 47 440 0 0 1 1CD-105 1,267 88 240 0 0 1 1CD-106 1,994 100 800 0 0 1 1CD-107 2,880 96 2,240 1 0 1 1CD-108 2,560 97 240 1 0 1 1CD-109 1,910 88 200 0 0 0 0CD-110 2,881 100 640 0 0 1 1CD-111 2,881 90 320 0 0 1 1Totals: 244,978 85 50,320 23 0 39 50Totals <strong>for</strong> all lands in province: 82,240 25 9'Management of nonfederal lands within <strong>the</strong> perimeter of designated conservation areas is discussed in <strong>the</strong> narrative.2 NRF = nesting, roosting, and <strong>for</strong>aging habitat <strong>for</strong> spotted owls. Habitat in<strong>for</strong>mation was not available <strong>for</strong> nonfederal lands.3 Numbers are pairs of spotted owls verified in a 5-year period ei<strong>the</strong>r 1986 through 1990 or 1987 through 1991.4 This is an estimate of <strong>the</strong> number of pairs of owls that <strong>the</strong> DCA would be expected to support on federal lands if <strong>the</strong> population stabilized withcurrent habitat conditions.5 This is an estimate of <strong>the</strong> number of pairs of owls that <strong>the</strong> DCA might support in <strong>the</strong> future on federal lands if habitat were recovered. SeeAppendix J <strong>for</strong> fur<strong>the</strong>r details.Dash (-) = data not available............................................, , ... , , . Fry95
ITable 3.24. Summary comments on <strong>the</strong> designated conservation area (DCA)network in <strong>the</strong> Cali<strong>for</strong>nia Cascades province. (Section III.C.2. and Appendix Iprovide fur<strong>the</strong>r in<strong>for</strong>mation on <strong>the</strong> criteria and process used to delineate <strong>the</strong>seareas.)DesignatedConservationAreaCD-35 through CD-41,CD-101 through CD-1l1CD-28, CD-42 throughCD-45CommentsBecause of <strong>the</strong> naturally fragmented landscape,larger multipair DCAs are not possible. These DCAs provide connectivityto DCAs to <strong>the</strong> west and provide <strong>the</strong> link between <strong>the</strong> range of <strong>the</strong>nor<strong>the</strong>rn spotted owl and <strong>the</strong> Cali<strong>for</strong>nia spotted owl in <strong>the</strong> Sierra Nevada.No opportunities exist to support category 1 DCAs.DCAs are delineated where owls are currently known, where futurehabitat opportunities occur, and where <strong>the</strong> only demographic support <strong>for</strong>this local population is possible. Suitable habitat is not uni<strong>for</strong>mlydistributed over this region because of moisture and soil conditions.< .......................................................................... ity of individual HCP or no-take plans. The scarcity of owls may not makelandscape management attractive to landowners, especially if few owl sites aredetected through no-take surveys. Forest practice rules do not provide <strong>for</strong>permanent protection of nest sites if <strong>the</strong>y become unoccupied, and <strong>the</strong> ruleswould have to be amended. Habitat on state and private land could be obtainedby purchase or land exchange. There is some potential <strong>for</strong> land acquisition,due to checkerboard ownership, but land acquisition likely would alterradically timber supply access among different owners. Land purchase is likelyto be expensive, and landowners are likely to be concerned about removingland from private ownership, given <strong>the</strong> need <strong>for</strong> a timber base to supply existingmills.Short-term deferral of harvest, until a long-term management strategy with lowrisk to <strong>the</strong> population can be drafted, might be accomplished through taxexemptions or habitat conservation easements, but <strong>the</strong> institutional mechanisms<strong>for</strong> accomplishing this are not yet developed.One option is presented <strong>for</strong> achieving recovery goals. O<strong>the</strong>r options may beappropriate if <strong>the</strong>y achieve equivalent or better protection <strong>for</strong> <strong>the</strong> owl. Alloptions must be evaluated based on <strong>the</strong> likelihood that <strong>the</strong>y will achieverecovery goals when fully implemented.Option 1: Manage existing owl sites to establish clustersThis option would include all currently known owl sites on nonfederal lands,and any new sites found in <strong>the</strong> next few years of intensive surveys, as supplementalpair areas. This would increase <strong>the</strong> demographic stability of <strong>the</strong>province over <strong>the</strong> short term. In <strong>the</strong> short term, existing suitable habitat wouldbe retained, even if a site becomes unoccupied. Attempts should be made tocombine sites on federal, state, and private lands into clusters of mutuallysupporting owl pairs. Future evaluation would have to be made to determine iflarger clusters could be designated and maintained in a pattern that wouldprovide a lower risk of future local extinction. Combining with o<strong>the</strong>r sites maynot be feasible <strong>for</strong> some areas that will remain as reserved pair areas due to196
<strong>Owl</strong> pairsKnown owlsin <strong>the</strong> provinceLii 20-25-15-10-Known owlsin DCAs50-Nonfederal landFederal landFigure 3.27. Known owl pairs in <strong>the</strong> Cali<strong>for</strong>nia Cascades province and inDCAs within <strong>the</strong> province.Acres (thousands)1,600- __I_.1 ,400--[ ~~~~~1,200-_ - ]> .Total acresin <strong>the</strong> province800 -v-|*Bg ~~~~~400- i* sIT1i-&t1600 - .B *Z*:BBf;-|Acres in DCAs 200- i °:Nonfederal land' Federal land NRF habitat 2Figure 3.28. Acres in <strong>the</strong> Cali<strong>for</strong>nia Cascades province and in DCAs within <strong>the</strong> province.'Management of nonfederal lands within <strong>the</strong> perimeter of designated conservation areas is discussed in <strong>the</strong> narrative.2 NRF habitat = nesting, roosting, and <strong>for</strong>aging habitat. This in<strong>for</strong>mation is available only <strong>for</strong> federal land.197
<strong>the</strong>ir distance from o<strong>the</strong>r sites. Areas within clusters that do not have owlsshould be evaluated <strong>for</strong> <strong>the</strong>ir potential habitat suitability. If <strong>the</strong>se areas cansupport owl habitat, measures (i.e., prescriptions <strong>for</strong> certain habitat qualityand quantity, time schedule <strong>for</strong> growth, stand management requirements, andpotential management options) should be drafted to guide creation of owlhabitat. Dispersal habitat should be maintained throughout <strong>the</strong> province.Management of <strong>the</strong>se clusters will be a mixture of practices because of <strong>the</strong> mixof ownerships. All sites on state and private lands need to be managed in aconservative manner to provide support <strong>for</strong> DCAs and individual owl pairsoccurring outside <strong>the</strong> DCAs. Tools <strong>for</strong> implementation include regulations thatprovide <strong>for</strong> <strong>the</strong> quality and quantity of owl habitat to be maintained.This option provides limited flexibility to private landowners, but it does allow<strong>for</strong> some conservative management of existing suitable habitat. Extensive owlsurveys will be necessary. Attempts to combine individual sites to <strong>for</strong>m mutuallysupporting clusters will enhance recovery. This option provides littleincentive <strong>for</strong> landowners to participate in landscape management or go beyondcon<strong>for</strong>mity with existing rules governing take.Coordinatton. Forestland ownership in this province is dominated by national<strong>for</strong>ests and large, private, industrial landowners. Only small amounts of o<strong>the</strong>rownerships would be involved in maintaining local owl populations.This option requires strong coordination among federal land managementagencies and private landowners, and <strong>the</strong> state through its <strong>for</strong>est practicesregulation mechanism. This process is ongoing and is being streng<strong>the</strong>ned by<strong>the</strong> drafting of a habitat conservation plan (HCP) by <strong>the</strong> state. This planshould assure that both suitable owl habitat and owls occur in <strong>the</strong> samegeneral area on both sides of <strong>the</strong> boundary between <strong>the</strong> two spotted owlsubspecies.198
C,.,5. CoordinationNeed<strong>for</strong> CoordinationImplementation of <strong>the</strong> nor<strong>the</strong>rn spotted owl recovery plan will require a level ofef<strong>for</strong>t that is without precedent in o<strong>the</strong>r attempts to recover species. Therecovery plan will necessitate actions over several decades at a minimum,including long-term commitments of funding and personnel from a variety ofgovernmental entities and <strong>the</strong> private sector. Activities will encompass a largeand varied geographic area, and involve intensive monitoring, evaluation,research, and management tasks. Although <strong>the</strong>se activities will be integratedwith ongoing ef<strong>for</strong>ts in wildlife management, <strong>for</strong>estry, and silviculture to asignificant extent, <strong>the</strong>y have distinct objectives that address <strong>the</strong> recovery plan'sdelisting criteria. Also, <strong>the</strong> recovery plan will require periodic updating toreflect new scientific knowledge and <strong>the</strong> results of monitoring and evaluations.Efficient and effective implementation of <strong>the</strong> recovery plan will require mechanismsto coordinate <strong>the</strong> wide variety of activities by <strong>the</strong> participating entities.In <strong>the</strong> short term, <strong>the</strong> <strong>Recovery</strong> Team should be maintained to provide thatcoordination function. Federal agencies (National Park Service, Bureau ofIndian Affairs, Fish and Wildlife Service, Bureau of Land Management, ForestService) and state government agencies need to be involved in <strong>the</strong> coordinationand implementation of <strong>the</strong> recovery plan. In particular, <strong>the</strong> FWS must play amajor role in assuring that <strong>the</strong> plan is implemented. This will require <strong>the</strong>FWS's commitment with respect to <strong>the</strong> consultation process and o<strong>the</strong>r areas.In addition, <strong>the</strong> scope and breadth of coordination clearly will require establishinga group to help facilitate recovery during <strong>the</strong> lengthy time frame contemplatedin <strong>the</strong> plan.Coordinating GroupThe <strong>Recovery</strong> Team recommends a coordinating group be established to guiderecovery activities over <strong>the</strong> long term. The coordinating group should be basedregionally and explicitly constituted to facilitate interdisciplinary and managerialcommunication among action agencies, states, and <strong>the</strong> private sector inaddressing <strong>the</strong> biological, <strong>for</strong>estry, and policy issues associated with recovery.This can be accomplished by including persons with technical expertise asmembers or, if members are management officials, by assuring <strong>the</strong> group'saccess to technical personnel. Each participant should determine an appropriatemeans of liaison with <strong>the</strong> group. For example, agencies could establish<strong>the</strong>ir own recovery implementation teams or regional advisory bodies.Scope and functions. The coordinating group must be structured and itsfunctions defined to avoid potential conflicts with <strong>the</strong> statutory mandates of<strong>the</strong> agencies involved. There<strong>for</strong>e, <strong>the</strong> <strong>Recovery</strong> Team explicitly recommends nodirect regulatory function <strong>for</strong> <strong>the</strong> group. This is to avoid creating <strong>the</strong> potential<strong>for</strong> confusion and duplication of ef<strong>for</strong>t of <strong>the</strong> FWS's section 7 consultationresponsibilities under <strong>the</strong> Endangered Species Act, as well as <strong>the</strong> land managementplanning and operational mandates of action agencies. The <strong>Recovery</strong>Team recommends that <strong>the</strong> group be chartered to address <strong>the</strong> areas outlinedin this section. These areas encompass broad policy and programmaticconcerns that are critical to progress in <strong>the</strong> recovery ef<strong>for</strong>t and ultimately toachieve delisting.199
* Recommend population and habitat monitoring standards and guidelines;provide technical advice to agencies in <strong>the</strong>ir implementation; and reviewresults to assess progress.* Provide a <strong>for</strong>um to coordinate research agendas of <strong>the</strong> various entitiesinvolved in recovery to assure that <strong>the</strong> plan's recommendations are addressedadequately and to maximize <strong>the</strong> value of <strong>the</strong> in<strong>for</strong>mation produced.* Facilitate data base consistency in <strong>the</strong> development and maintenance oftechnical in<strong>for</strong>mation (particularly with respect to geographic in<strong>for</strong>mationsystems) and in monitoring and research activities, to maximize <strong>the</strong> validityand reliability of results, and to assure efficient use of funds and personnel.* Review research results and make recommendations concerning managementpractices in areas such as silviculture to promote <strong>the</strong> adoption ofdesired actions in on-<strong>the</strong>-ground operations.* Recommend recovery plan revisions based on <strong>the</strong> results of scientificresearch, monitoring, and <strong>the</strong> documented results of program operations.* Promote dissemination of technical assistance to federal and state agencies,and to nonfederal parties, as appropriate, concerning issues related torecovery such as DCA management plan development and habitat manipulation.* Assess policies, programs, plans, environmental impact statements, andregional guides with respect to <strong>the</strong>ir potential consistency with recoveryobjectives and provide recommendations <strong>for</strong> agency consideration.* Promote effective communication and coordination among <strong>the</strong> variousfederal and nonfederal entities involved in recovery.Organization and membership. The <strong>Recovery</strong> Team recommends <strong>the</strong>coordinating group's scope and functions be determined be<strong>for</strong>e organizationalissues are addressed. The <strong>Recovery</strong> Team believes a variety of organizationaloptions is available. Regardless of <strong>the</strong> arrangement chosen, however, <strong>the</strong>group's charter should be explicit to clearly establish its role. In addition, <strong>the</strong><strong>Recovery</strong> Team believes membership should comprise federal and nonfederalentities, including <strong>the</strong> private sector. Accordingly, <strong>the</strong> group may requirechartering under <strong>the</strong> Federal Advisory Committee Act.200
III. --C.6. Monitoring and ResearchThe primary objectives of <strong>the</strong> monitoring and research program are to determinewhe<strong>the</strong>r implementation of <strong>the</strong> plan is on track, determine if implementationis producing expected effects, improve <strong>the</strong> plan over time, and, ultimately,determine when it is time to begin delisting procedures. Monitoring andresearch are intended to support <strong>the</strong> objective of this recovery plan, to providestabilization and recovery of <strong>the</strong> nor<strong>the</strong>rn spotted owl population with <strong>the</strong>lowest possible economic and social costs. The plan incorporates <strong>the</strong> considerabledata available on nor<strong>the</strong>rn spotted owls, one of <strong>the</strong> best researched owlsin <strong>the</strong> world (see section II.A). These data give <strong>the</strong> <strong>Recovery</strong> Team reasonableassurance that <strong>the</strong> plan will succeed in its objective of recovering nor<strong>the</strong>rnspotted owls. However, <strong>the</strong> <strong>Recovery</strong> Team is equally certain <strong>the</strong>re is considerableroom <strong>for</strong> refining and improving <strong>the</strong> plan and knowledge of owls. Forexample, <strong>the</strong> monitoring and research program may allow refinement ofrecommendations on types and amounts of dispersal habitat. Ongoing researchprograms which focus on ecological relationships and populationdynamics of owls will provide considerable new in<strong>for</strong>mation in <strong>the</strong> next severalyears. In addition, ongoing management will create a landscape different from<strong>the</strong> one in which owls have been observed to date, which will expand knowledgeof owl ecology in a variety of habitat settings. For <strong>the</strong>se reasons, <strong>the</strong><strong>Recovery</strong> Team expects <strong>the</strong> monitoring and research program will providein<strong>for</strong>mation that can be used to improve <strong>the</strong> recovery plan over -time. Improvementsmay allow increased security of <strong>the</strong> owl population and reduction of <strong>the</strong>economic cost of recovery. In addition, <strong>the</strong> monitoring and research programwill provide in<strong>for</strong>mation needed to determine when delisting of owl populationswill be appropriate.Significant monitoring and research ef<strong>for</strong>ts directed at nor<strong>the</strong>rn spotted owlshave been in place <strong>for</strong> many years. These are described in Thomas et al.(1990) and USDA (1988). The ideas and recommendations presented in thissection of <strong>the</strong> recovery plan repeat some aspects of those ongoing programsand build on o<strong>the</strong>rs. It was assumed that much of what is recommended canbe implemented using existing organizational structures. However, someadditional structure to provide overall coordination will be necessary <strong>for</strong> <strong>the</strong>recovery plan (see section III.C.5).Functions of <strong>the</strong> Monitoring and Research ProgramTo be effective, <strong>the</strong> monitoring and research program must be designed carefullyto answer specific questions about owls and <strong>the</strong>ir responses to landscapescreated by management and natural events. The program can be organizedinto two basic categories: 1) in<strong>for</strong>mation needed to consider delisting of <strong>the</strong>species; and 2) in<strong>for</strong>mation needed <strong>for</strong> adaptive management under <strong>the</strong> recoveryplan. While <strong>the</strong>re is some overlap between <strong>the</strong>se categories, <strong>the</strong>y serve as auseful framework <strong>for</strong> discussing monitoring and research ef<strong>for</strong>ts.Adaptive ManagementThe objective of <strong>the</strong> recovery plan is delisting of <strong>the</strong> nor<strong>the</strong>rn spotted owlthroughout its range. However, <strong>the</strong> decision to delist may be years or decades201
away in some or all of <strong>the</strong> range. During that time, <strong>the</strong> monitoring and researchprogram will have a vital function producing <strong>the</strong> in<strong>for</strong>mation needed <strong>for</strong>changing and improving <strong>the</strong> implementation of <strong>the</strong> recovery plan. The processof using such in<strong>for</strong>mation to refine management over time has been <strong>for</strong>malizedas adaptive management (Holling 1978, Walters 1986). In this recovery plan,<strong>the</strong> objective of adaptive management is to improve <strong>the</strong> biological and economicefficiency of <strong>the</strong> plan while maintaining or increasing <strong>the</strong> level of protection <strong>for</strong>owls over time.Successful use of adaptive management requires a carefully planned structureof monitoring, research, management reviews, and management refinement.The questions to be answered by monitoring and research must be designedspecifically to provide in<strong>for</strong>mation needed by management, and <strong>the</strong>re should becheckpoints or trigger points that would initiate technical or administrativereviews, possibly resulting in management changes. As part of this structure,it is helpful to divide questions into three categories:* Implementation questions - Was management direction implemented asspecified?* Effectiveness questions - Did <strong>the</strong> actions have <strong>the</strong> effects projected in <strong>the</strong>recovery plan?* Validation/research questions - Are critical assumptions used in building<strong>the</strong> recovery plan correct?All three categories of in<strong>for</strong>mation must be collected <strong>for</strong> adaptive managementto be effective. Implementation monitoring assures that implementing mechanismsare operating correctly and provides <strong>the</strong> basis <strong>for</strong> oversight. It is necessaryto know that <strong>the</strong> plan was implemented correctly be<strong>for</strong>e effectivenessmonitoring can be meaningful. Effectiveness monitoring provides <strong>the</strong> basis <strong>for</strong>determining if <strong>the</strong> primary effects predicted <strong>for</strong> <strong>the</strong> plan are occurring (e.g., ishabitat becoming less fragmented within DCAs?). It provides <strong>the</strong> basis <strong>for</strong>deciding if some change is needed should <strong>the</strong> plan produce outcomes differentfrom predictions. Validation monitoring and research provide in<strong>for</strong>mationneeded to determine if <strong>the</strong> key underlying assumptions of <strong>the</strong> plan are correct(e.g., that reproductive success of owls is related to <strong>the</strong> level of fragmentation ofhabitat). Validation monitoring is extremely important because it tells if achange in <strong>the</strong> recovery plan is necessary and what type of change might beappropriate. Without validation monitoring, it is possible to know that achange is needed but not know what type of change would be appropriate.Validation monitoring clearly represents a blend of scientific research andmonitoring and is successful only when aimed at specific management questions.The most important implementation, effectiveness, and validation monitoringquestions follow.Implementation monitoring questions.1. Are DCAs being established on <strong>the</strong> ground following maps and guidelinesfrom <strong>the</strong> recovery plan?2. Are activities inside DCAs being implemented according to guidelinescontained in <strong>the</strong> recovery plan? Have <strong>the</strong> land-managing agencies producedspecific plans and guidance <strong>for</strong> activities in each of <strong>the</strong> DCAs?3. Are matrix management guidelines being followed?Effectiveness monitoring questions.Habitat responses.1. Do DCAs contain <strong>the</strong> target numbers of total acres and habitat acres?2. Are activities inside DCAs producing <strong>the</strong> predicted <strong>for</strong>est structure overtime?202
3. Are activities in stands in <strong>the</strong> <strong>for</strong>est matrix producing <strong>the</strong> predicted <strong>for</strong>eststructure over time?4. Are desired landscape conditions being maintained over time in <strong>the</strong> matrix?5. Are habitat trends and causes of those trends as predicted?<strong>Owl</strong> population responses.1. Do DCAs provide <strong>for</strong> predicted numbers of breeding owl pairs?a. Does each DCA provide <strong>for</strong> <strong>the</strong> predicted number?b. What proportion of DCAs falls above and below <strong>the</strong> predicted number?2. Are owls moving successfully among DCAs?3. Is <strong>the</strong> trend in numbers inside and outside <strong>the</strong> DCAs as predicted?4. Are owls using created habitats inside and outside DCAs? What specificstructural conditions are being used by owls and <strong>for</strong> what functions?Validation monitoring/research questions.Dispersal studies.1. How well do various habitat conditions provide <strong>for</strong> dispersal of owls?2. How well do various spacing distances among DCAs provide <strong>for</strong> dispersal ofowls?3. What is <strong>the</strong> type of use and relative degree of use of various habitat conditionsby dispersing owls?<strong>Spotted</strong> owl ecological relationships and population dynamics.1. What is <strong>the</strong> range of <strong>for</strong>est structural conditions used by owls? How doowls use those conditions and what is <strong>the</strong> relative degree of use?2. What are <strong>the</strong> specific stand features that influence <strong>the</strong> type and degree ofowl use? These may include <strong>for</strong>est structure, species composition, amountand distribution of coarse woody debris, and number and distribution ofsnags.3. How are owl reproductive success and survivorship related to habitatconditions, amount, distribution, and rate of change?4. How are owl reproductive success and survivorship related to local populationsize?<strong>Owl</strong> habitat relationships and management.1. What is <strong>the</strong> influence of various management practices on <strong>for</strong>est standcomposition and structure?2. How do individual owls respond to management practices and resultingstand conditions within home ranges?3. How do owl populations respond to management practices and resultingstand conditions within landscapes composed of multiple home ranges?4. What are efficient and repeatable techniques <strong>for</strong> assessing habitat conditionsat <strong>the</strong> stand and landscape scale?Economics.1. What are <strong>the</strong> costs and returns of various silvicultural practices that couldbe used to develop or sustain suitable habitat conditions?2. How would various types of incentive systems operate to encourage landownercontribution to recovery?<strong>Owl</strong> prey; prey relationships; and competitive relationships.1. How do owl diets influence owl survivorship and reproductive success?2. What are <strong>the</strong> patterns of abundance of principal prey species? How are<strong>the</strong>y related to habitat conditions?3. How do prey species respond to management practices and resulting standconditions within owl home ranges?203
4. What are <strong>the</strong> population dynamics patterns of principal prey species, andhow are <strong>the</strong>y influenced by habitat?5. What are movement and dispersal patterns of prey species?6. How do different habitat conditions affect competitive relationships betweenbarred owls and spotted owls?To facilitate <strong>the</strong> validation monitoring/research needed <strong>for</strong> adaptive management,<strong>the</strong> <strong>Recovery</strong> Team recommends that additional research areas be set-upnear established demographic study areas within <strong>the</strong> federal matrix. Thedemographic study areas are described later. One research area per provincewould be desirable, and its area should be equivalent to its companion demographicstudy area. The <strong>Recovery</strong> Team recommends that <strong>the</strong>se research areashave as <strong>the</strong>ir goal replicated experiments to evaluate 1) <strong>the</strong> response of owls totimber harvest, 2) <strong>the</strong> utility of various silvicultural prescriptions in producinghabitat <strong>for</strong> owls, 3) emigration and immigration rates in response to a changinglandscape, and 4) <strong>the</strong> demographic response of <strong>the</strong> owl population within <strong>the</strong>area. Experiments in <strong>the</strong>se research areas can occur in currently suitablehabitat, and will contribute to <strong>the</strong> objective of <strong>the</strong> recovery plan to delist <strong>the</strong>owl across its range and to achieve <strong>for</strong>est silviculture that is compatible withowls across <strong>the</strong> landscape. Inferences regarding <strong>the</strong> compatibility of timberharvest with owls can be achieved only through <strong>the</strong> execution of controlled,replicated experiments. It is essential that <strong>the</strong> principle investigators of <strong>the</strong>companion demography and experimental research areas agree to full cooperationbe<strong>for</strong>e establishing <strong>the</strong> research protocol on <strong>the</strong> experimental areas.The <strong>Recovery</strong> Team also recommends that research continue on <strong>the</strong> YakimaIndian Nation land and on private land throughout <strong>the</strong> range of <strong>the</strong> owl.Ongoing research on Yakima land is a unique study of owl population responsesto a <strong>for</strong>ested landscape that has been managed through an unevenagedsilvicultural regime.Adaptive Management ProceduresTo realize <strong>the</strong> objectives of <strong>the</strong> monitoring and research program, <strong>the</strong>re mustbe a process in place that will guide how <strong>the</strong> results of <strong>the</strong> program will beused. This process must include agreement on specific monitoring and researchresults that will trigger review and possible revision of <strong>the</strong> recoveryplan. Such reviews could take place as part of a review cycle <strong>for</strong> <strong>the</strong> recoveryplan or at any o<strong>the</strong>r time. The <strong>Recovery</strong> Team strongly recommends that suchtrigger points be developed <strong>for</strong> at least <strong>the</strong> following potential actions:1. Determine when it would be appropriate to modify DCA boundaries basedon owl numbers or suitable habitat availability that fall below or aboveprojections.If numbers of owls or amounts of suitable habitat are found to be abovepredicted levels in one or more DCAs, it may be appropriate to ei<strong>the</strong>r reduce<strong>the</strong> size of those DCAs or to allow greater flexibility of management within <strong>the</strong>m(see <strong>the</strong> next potential action). However, it first should be determined that <strong>the</strong>high populations are not <strong>the</strong> result of "packing" phenomena Thomas et al.1990) and that <strong>the</strong> proposed management has been demonstrated to producedesired habitat conditions <strong>for</strong> owls. Review of any individual DCA should bedone within <strong>the</strong> context of an entire province to ensure that a key source areais not weakened. If one or more DCAs are below objective levels, it may benecessary to modify DCA boundaries and possibly increase <strong>the</strong>ir size or <strong>the</strong>quality of habitat within <strong>the</strong> DCA boundary. In this case, it first should bedetermined that <strong>the</strong> low numbers of owls are not related to short-term demographicresponses. Finally, it may be appropriate to eliminate DCA boundaries204
when <strong>the</strong> population of owls in <strong>the</strong> matrix is at <strong>the</strong> level of those found in <strong>the</strong>DCA, <strong>the</strong>ir demographic rates are similar to those in DCAs, and <strong>for</strong>est managementhas been demonstrated to be compatible with <strong>the</strong> owls.2. Determine when it would be appropriate to broaden management recommendationswithin DCAs based on 1) achievement of stable, self-sustainingnumbers of owls or amounts of suitable habitat that exceed predictions, 2)demonstrated success of management activities in providing <strong>for</strong> owls, or 3)demonstrated need to reduce likelihood of large-scale disturbances.The recovery plan recommends that some <strong>for</strong>ms of salvage be allowed withinDCAs and that some limited attempts begin to use management to improvehabitat and to decrease <strong>the</strong> risk of disturbance. Monitoring both <strong>the</strong> implementationand effectiveness of <strong>the</strong>se activities is crucial because <strong>the</strong>y willinfluence <strong>the</strong> capability of <strong>the</strong> DCAs to support owls. As monitoring adds toknowledge about <strong>the</strong> use of management practices in DCAs, it may be useful toincrease and broaden application of those practices. If management is demonstratedto be useful in developing younger, currently unsuitable stands, <strong>the</strong>use of such management should be encouraged beyond <strong>the</strong> levels establishedin this plan. If management is shown to be useful in older stands, recommendationsmay be broadened to include those stands. If owl numbers oramounts of suitable habitat exceed predictions, it may be useful to define acore area of <strong>the</strong> DCA that would continue to be managed under current guidelinesand additional areas that would be managed with fewer restrictions on<strong>the</strong> use of silviculture, salvage, and o<strong>the</strong>r management options. Finally, if <strong>the</strong>ability to maintain suitable habitat while reducing <strong>the</strong> risk of large-scaledisturbance is demonstrated, such activities should be encouraged withinDCAs that are at high risk.3. Determine when it would be appropriate to end special management <strong>for</strong>reserved pair areas based on improved conditions in individual DCAs orgroups of DCAs.The recovery plan recommends that additional pair areas be established where<strong>the</strong> DCA system is currently deficient. If those deficiencies are corrected, itmay be appropriate to modify management within those pair areas.4. Determine when it would be appropriate to supplement or modify <strong>the</strong> DCAsystem based on unexpectedly poor per<strong>for</strong>mance of owl populations (i.e.,survival rates, fecundity rates, and immigration rates).The monitoring and research program will provide data on <strong>the</strong> populationdynamics of owls within <strong>the</strong> DCA system. If it becomes clear that populationsare not replacing <strong>the</strong>mselves within <strong>the</strong>se areas, or that immigration is notoccurring as expected among areas, one of <strong>the</strong> following actions may be appropriate:a. Modify DCAs where possible to include any contiguous areas of highowl concentrations and habitat with low levels of fragmentation.b. Add new DCAs to <strong>the</strong> system, emphasizing areas of high owl concentrationand high quality habitat.c. Add new DCAs to <strong>the</strong> system with <strong>the</strong> primary objective of reducing <strong>the</strong>dispersal distance among DCAs.d. Modify <strong>the</strong> recommendations <strong>for</strong> management within DCAs.5. Determine when it would be appropriate to modify matrix managementrecommendations based on impending isolation of DCA subpopulationsdetermined through unexpectedly low rates of movement among DCAs.205
If <strong>the</strong> monitoring and research program shows unexpectedly low rates ofmovement among DCAs, or provides new knowledge of limited dispersal of owlsin various <strong>for</strong>est types, it may be necessary to ei<strong>the</strong>r supplement <strong>the</strong> DCAsystem (see earlier recommendation) or change <strong>the</strong> management of <strong>the</strong> matrix.6. Determine when it would be appropriate to modify matrix managementrecommendations based on in<strong>for</strong>mation that owls disperse successfullythrough habitats of smaller trees and lower canopy closure.If <strong>the</strong> monitoring and research program shows high rates of successful dispersalthrough <strong>for</strong>ests with small trees and/or low quality habitat, it may beappropriate to relax recommendations <strong>for</strong> dispersal habitat.Primary In<strong>for</strong>mation Needed<strong>for</strong> Delisting Nor<strong>the</strong>rn<strong>Spotted</strong> <strong>Owl</strong> PopulationsThe criteria <strong>for</strong> delisting are explained in section III.A. They are 1) that owlpopulations and habitat be monitored with a scientifically credible plan, 2) that<strong>the</strong> population be stable or increasing, 3) that commitments be in place toprovide long-term protection of habitat, and 4) that in<strong>for</strong>mation from a varietyof sources indicates that <strong>the</strong> population will not need renewed protection under<strong>the</strong> Endangered Species Act. The following section describes <strong>the</strong> hypo<strong>the</strong>sesthat must be tested to satisfy delisting criteria 2 and 4 and <strong>the</strong> specific in<strong>for</strong>mationthat must be collected to test those hypo<strong>the</strong>ses.Delisting Criterion 2: The population has been stable or increasingduring at least <strong>the</strong> last 8 years, as indicated by both density estrimatesand denographic analyses, in all parts of <strong>the</strong> area that would be consideredsignificant under <strong>the</strong> Endangered Species Act.Hypo<strong>the</strong>sis 1The change in total number of territorial owls over time is greater thanor equal to zero.In<strong>for</strong>mation needed to test hypo<strong>the</strong>sis 1An estimate or index of <strong>the</strong> number of territorial owls repeated over timeis needed. At a minimum, <strong>the</strong>re must be an adequate estimate made<strong>for</strong> each physiographic province. Estimates over smaller geographicareas should be made if those areas would be considered significantunder <strong>the</strong> Endangered Species Act. Within <strong>the</strong> provinces, <strong>the</strong> estimateshould be stratified into DCAs and <strong>for</strong>estlands outside DCAs. Theseseparate estimates <strong>the</strong>n must be combined into a single estimate <strong>for</strong> <strong>the</strong>entire province.Hypo<strong>the</strong>sis 2The finite rate of increase of owl populations is greater than or equal to zeroas determined from estimates over time of demographic parameters.In<strong>for</strong>mation needed to test hypo<strong>the</strong>sis 2Estimates over time of age-specific or stage-specific survival andreproduction rates, including age at first and last reproduction, arerequired. Estimates should be made <strong>for</strong> at least one subpopulationwithin each physiographic province, with <strong>the</strong> subpopulation sufficientlylarge to produce statistically reliable estimates of <strong>the</strong> demographicparameters. Estimates <strong>for</strong> additional subpopulations may be necessary tofully represent <strong>the</strong> range of ecological conditions within each province.206
(Delisting Criterion 4: The population is unlikely to need protectionunder <strong>the</strong> Endangered Species Act during <strong>the</strong><strong>for</strong>eseeablefuture.Hypo<strong>the</strong>sis 1Long-term demographic projections, that include <strong>the</strong> effects offluctuations in abundance, fecundity, and survivorship, indicatethat <strong>the</strong>re is a high probability of persistence of <strong>the</strong> population <strong>for</strong>100 years.In<strong>for</strong>mation needed to test hypo<strong>the</strong>sis 1The data collected to answer questions about population anddemographic trends over time can be used in a modeling context torespond to this hypo<strong>the</strong>sis. It is important to emphasize that, within<strong>the</strong> context of metapopulation dynamics, some DCA subpopulationsmay decline <strong>for</strong> a variety of reasons (e.g., catastrophic events,random demographic events) even when <strong>the</strong> metapopulation isstable. There<strong>for</strong>e, delisting could occur in <strong>the</strong> province if <strong>the</strong>metapopulation as a whole were stable even though some DCAswould not be contributing fully <strong>for</strong> short periods.Hypo<strong>the</strong>sis 2There are sufficient immigrants per generation among DCAs tomaintain demographic stability and genetic diversity.In<strong>for</strong>mation needed to test hypo<strong>the</strong>sis 2Data are necessary <strong>for</strong> <strong>the</strong> number of immigrants per generationinto DCAs. These data can be collected best in conjunction with <strong>the</strong>studies of demographic rates.Hypo<strong>the</strong>sis 3Changes in amount and distribution of nor<strong>the</strong>rn spotted owl habitatoccur at expected rates and result from expected causes.In<strong>for</strong>mation needed to test hypo<strong>the</strong>sis 3Estimates over time of amounts and distribution of various classesof habitat are needed. These estimates must account <strong>for</strong> <strong>the</strong> developmentof suitable conditions on some areas and <strong>the</strong> loss of suitableconditions on o<strong>the</strong>rs.-11- - -l- -- -- -----...I.........I... ............I.....-......- ... ......................_ 1 ............................ ................ ........................... _-- - ....The <strong>Recovery</strong> Team makes <strong>the</strong> following recommendations <strong>for</strong> study areas andtechniques <strong>for</strong> collection of in<strong>for</strong>mation needed <strong>for</strong> delisting.Demography. Demographic study areas will provide in<strong>for</strong>mation on demographic(i.e., vital) rates (e.g., age-specific, stage-specific rates of fecundity andsurvival, age at first and last reproduction) and <strong>the</strong> occurrence of immigration.These are large areas, tens to hundreds of square miles, where as many owlsas possible are banded. Banding is done on adult, subadult, and juvenile owls.<strong>Owl</strong>s are observed on an annual basis on territorial sites, and young areobserved annually on nest sites. These observations are used to determineage-specific or stage-specific fecundity and mortality rates. Procedures <strong>for</strong>developing some of <strong>the</strong>se estimates are explained fur<strong>the</strong>r in Appendices A andC. There are currently seven demographic study areas which should <strong>for</strong>m <strong>the</strong>basis <strong>for</strong> assessments of demographic trends within <strong>the</strong>ir respective provinces.These study areas are located in <strong>the</strong> following provinces: Olympic Peninsula;eastern Washington Cascades; western Oregon Cascades; Oregon Coast; andCali<strong>for</strong>nia Coast. An additional demographic area should be established in <strong>the</strong>western Washington Cascades. Three provinces - western Washington207
lowlands, eastern Oregon Cascades, eastern Cali<strong>for</strong>nia Cascades - currentlycannot support demographic studies equivalent to those found in <strong>the</strong> o<strong>the</strong>rprovinces because of low owl numbers. Density and demographic studiescould be initiated in <strong>the</strong>se provinces when <strong>the</strong>ir owl populations have increasedto <strong>the</strong> point that delisting can be considered.General recommendations <strong>for</strong> demographic studies are as follows:1. Maintain existing demographic study areas. Since owls are long-livedanimals, long duration population studies will be necessary to estimatepopulation trends. Assessment of annual changes in vital rates is necessaryto draw appropriate inferences from <strong>the</strong> study. The most cost-effectiveway to evaluate owl populations is to continue <strong>the</strong> demographic studies.The longer a study has existed <strong>the</strong> more valuable it is <strong>for</strong> assessing trendsin demography.2. Expand demographic study areas to include larger areas that will encompassowls within several DCAs and <strong>the</strong> province matrix. This will allowsome estimation of immigration into DCAs. While this will not allow anabsolute estimate of <strong>the</strong> number of immigrants, it will provide evidencethat immigration is occurring and it will provide estimates of <strong>the</strong> sources of<strong>the</strong> immigrants and distances traveled. Such large study areas encompassing<strong>the</strong> demography study areas also would improve <strong>the</strong> analysis ofregional trends in demography.3. Monitor demographic trends in both <strong>the</strong> matrix and <strong>the</strong> DCA networkwithin each province. Franklin and Gutierrez (unpub. data) indicate thatindividual owl pairs monitored throughout <strong>the</strong> Cali<strong>for</strong>nia Kiamath provincehave <strong>the</strong> same (i.e., not statistically different) vital rates as a population ofcontiguous owls in <strong>the</strong> Willow Creek demographic study area. The cost <strong>for</strong>this monitoring is minimal and could be conducted in conjunction with <strong>the</strong>current demographic studies (Appendix A).<strong>Owl</strong> population trends. Numerical trends of owls should be monitored in <strong>the</strong>matrix and DCA network within each province. Several methods have beendeveloped to estimate numerical and density estimates <strong>for</strong> owls includingtransect sampling (Forsman et al. 1977), capture-recapture models, empiricalestimation, quadrat sampling (Franklin et al. 1990b), and catch per unit ef<strong>for</strong>tmodels (Ward et al. 1991). Additional sampling procedures are presented inAppendix A.Population Modeling. Ma<strong>the</strong>matical modeling is a powerful tool <strong>for</strong> assessingpopulation dynamics. The <strong>Recovery</strong> Team recommends that <strong>the</strong> developmentof models, such as those produced by scientists at <strong>the</strong> Forest Service RedwoodSciences Laboratory, continue.CoordinationThe monitoring and research ef<strong>for</strong>t must be coordinated among <strong>the</strong> responsiblefederal agencies and state agencies, and private interests, including universities.This coordination should be part of <strong>the</strong> function of <strong>the</strong> coordinating groupestablished during <strong>the</strong> implementation of this plan (see section III.C.5). Thecoordinating group will help ensure that all required parts of <strong>the</strong> monitoringprogram are conducted; that monitoring designs are coordinated amongagencies and landowners: that <strong>the</strong> monitoring proceeds according to design;that monitoring reports are prepared and reviewed on an established schedule;that periodic reviews are made to see if management adjustments are neededor desirable: and that recommended research activities are coordinated amongagencies so that research is efficient and representative of <strong>the</strong> entire range of<strong>the</strong> subspecies.208
Chapter IVImplementation Schedule209
210
IV.The narrative and implementation schedule that follow outline actions andestimated costs <strong>for</strong> <strong>the</strong> recovery program. This chapter is a guide <strong>for</strong> meeting<strong>the</strong> objective discussed in <strong>the</strong> plan. The schedule indicates task priorities, tasknumbers, task descriptions, duration of tasks, <strong>the</strong> responsible agencies, andlastly, estimated costs. These actions, when accomplished, should bring about<strong>the</strong> recovery of <strong>the</strong> species and protect its habitat. It should be noted that <strong>the</strong>estimated monetary needs <strong>for</strong> all parties involved in recovery are identified and<strong>the</strong>re<strong>for</strong>e, this reflects <strong>the</strong> total estimated financial requirements <strong>for</strong> <strong>the</strong>implementation of <strong>the</strong> plan <strong>for</strong> recovery of this species. This section summarizesonly direct agency costs of achieving recovery. Indirect costs such as lostemployment are discussed in Appendix H.1993 Estimated Funding AmountsBLM:FS:BIA:FWS:NPS:$7,000,000; including research, inventory, monitoring, habitat improvementsurvey and studies, and o<strong>the</strong>r necessary related ef<strong>for</strong>ts, as well as funds in <strong>the</strong>wildlife habitat program.$8,917,000 (est.) including research ($2,917,000), and management($6,000,000).$1,700,000, including surveys, biological assessments and consultation,design, implementation, and monitoring of special silvicultural and harvestmethods.$2,760,000, including funding to support <strong>the</strong> recovery team, evaluate anddesignate critical habitat, public in<strong>for</strong>mation, consultation, education, lawen<strong>for</strong>cement, and research.$1,500,000, including intensive surveys to establish baseline population,monitoring, demographic and habitat studies, habitat use, and programcoordination.NOTE Priorities on implementation schedule are assigned as follows:Priority 1 - An action that must be taken to prevent extinction or to prevent<strong>the</strong> species from declining irreversibly in <strong>the</strong> <strong>for</strong>eseeable future.Priority 2 - An action that must be taken to prevent a significant decline inspecies population/habitat quality or some o<strong>the</strong>r significant negative impactshort of extinction.Priority 3 - All o<strong>the</strong>r actions necessary to meet <strong>the</strong> recovery objective.Key to Acronyms used in Implementation ScheduleBIA - USDI Bureau of Indian AffairsBLM - USDI Bureau of Land ManagementFS - USDA Forest ServiceFWS - USDI Fish and Wildlife ServiceNPS - USDI National Park ServiceRT - <strong>Recovery</strong> Team (or <strong>the</strong> coordinating group recommended in <strong>the</strong> plan)SA - State AgencyUNIV - University (Humboldt State, Oregon State, Washington State, etc.)211
Stepdown Outline1. Management Tasks.11. Review recovery plan.12. Establish coordination group.13. Implement recommendations regarding DCAs.131. Establish DCAs.132. Prepare guidelines <strong>for</strong> activities in DCAs.133. Prepare DCA management plans.1331. Prepare demonstration plans.1332. Prepare remainder of plans.1333. Implement DCA plans.14. Manage <strong>the</strong> federal matrix.141. Implement Prescription A.1411. Establish residual habitat areas.1412. Implement residual area management guidelines.1413. Implement "50-11-40" guideline.142. Implement Prescription B.1421. Establish reserve pair areas.1422. Implement reserve pair management guidelines.143. Implement Prescription C.1431. Establish managed pair areas.1432. Implement managed pair guidelines.144. Implement Prescription D as appropriate.1441. Evaluate potential contribution of Prescription D to recovery.1442. Implement Prescription D where it will contribute to recovery.15. Manage non-Federal lands.151. Establish measurable goals.152. Develop plans to meet goals.2. Regulatory mechanisms.21. Propose <strong>for</strong>mal adoption of <strong>the</strong> recovery plan.22. Revise existing regulatory measures as appropriate.221. Revise critical habitat boundaries to follow DCA boundaries.222. Revise or amend land management plans.23. En<strong>for</strong>ce taking prohibition.24. Publish regulations interpreting taking prohibitions.25. Advise owners and managers of land.251. Provide guidance on programmatic consultation.252. Conduct consultations regarding federal actions.253. Provide technical assistance to non-federal landowners.2531. Assist States in developing protective management plans.2532. Assist private landowners in developing Habitat Conservation <strong>Plan</strong>s.2533. Assist with spotted owl studies and surveys.2534. Evaluate potential usefulness of special rules.3. Land Acquisition.31. Evaluate opportunities <strong>for</strong> land exchange, easement, or purchase.32. Acquire land or interest in land through exchange, easement, or purchase.4. Research and Monitoring.41. Maintain and refine GIS.42. Implement monitoring program.421. Agree on objectives and methods.422. Conduct roadside surveys.4221. Design surveys.4222. Carry out surveys.212
423. Monitor activity sites.4231. Estimate sample size.4232. Carry out monitoring.424. Study demographic analyses.425. Study population models.426. Develop early warning methods.43. Study habitat suitability.431. Standardize habitat measurements.432. Prepare habitat maps <strong>for</strong> demographic study areas.433. Study suitability in selected areas.4331. Study Cali<strong>for</strong>nia coast.4332. Study eastern Cali<strong>for</strong>nia.4333. Study eastern Cascades.434. Evaluate suitability of selected habitats.4341. Evaluate young plantations with remnant larger trees.4342. Evaluate stands managed with selective harvest.4343. Evaluate areas in which salvage is economically feasible.44. Conduct demographic studies.441. Continue well-established studies.442. Consider need <strong>for</strong> additional studies.443. Initiate new studies as appropriate.5. Review and Evaluation.51. Prepare reports.511. Prepare annual progress reports.512. Prepare 5-year evaluation report.52. Review recovery plan and revise as appropriate.213
Table 4.1 Abbreviated Cost TableThe following table identifies estimated costs by broad category from <strong>the</strong>stepdown outline <strong>for</strong> <strong>the</strong> federal agencies. More detailed cost estimates willbe incorporated into <strong>the</strong> implementation schedule be<strong>for</strong>e approval of <strong>the</strong> finalrecovery plan.Estimated Cost (x1000)Cost Category Agency FY93 FY94 FY951. ManagementTasksBLMBIAFWSFSNPS4,1004258002,2307010,800251,0003,80010012,000251,0004,2001002. RegulatoryMechanismsBLMBIAFWSFS5903251,2601,6901,5003251,5002,8007501300'1,200'50013. Land Acquisition 24. Research andMonitoringBLMBIAFWSFSNPS2,1009006004,7271,4005,2509006007,9001,5005,2509006008,2001,6005. Review andEvaluationBLMBIAFWSFSNPS210501002703050050100500505005010080050TotalsBLMBIAFWSFSNPS7,0001,7002,7608,9171,50018,0501,7003,20015,0001,65018,5001,6752,90013,7001,7501 Reduced regulatory expenditures in FY 95 are based on <strong>the</strong> expectation that programmatic consultationwill be instituted2 Costs in <strong>the</strong> this category cannot be estimated pending completion of agency management plans_I/214
Table 4.2. Implementation ScheduleResp. PartyCost Est.Task Task Duration FWS (X$1 000)Priority Task No. (years) Reg. Prog. O<strong>the</strong>r 1993 -94 -951111111112Establish DCAsEstablish residualImplement 50-11-40Establish reservepair areasImplement reservepair managementguidelinesEstablish managedpair areasImplement managedpair guidelinesPropose <strong>for</strong>maladoption of planEn<strong>for</strong>ce takingprohibitionEstablish coordinationgroup222Implement residualarea guidelinesEstablish nonfederalgoalsDevelop nonfederalplans1412151152cont.122233Revise or amendfederal plansReview and reviseplanReview planPrepare DCAguidelines3 Prepare demoplans131 21411 11413 cont.142114221431143221 1 1 FWE23 cont.12 1222152 111 1132 11331 13 Prepare remaining1332 2plans1 LE1 FWE1 FWEFSBLMNPSFSBLMFSBLMFSBLMFSBLMFSBLMFSBLMFSBLMNPSFSBLMNIPSCAORWAFSBLMCAORCAORWAFSBLMFSBLMNPSFSBLMNPSFSBLMNPScontinues-215
continued-TaskPriorityResp. PartyCost Est.Task Duration FWS (X$1000)Task No. (years) Reg. Prog. O<strong>the</strong>r 1993 -94 -95i3i3333333333333333Implement DCAplansEvaluateprescription DImplementprescription Das appropriateRevise criticalhabitat boundariesPublish takeProvide guidanceon programmaticconsultationConductconsultationAssist states inplanningAssist privateplanningAssist withstudies andsurveysEvaluate specialrulesEvaluateacquisitionopportunitiesAcquire land asMaintain GISAgree on objectivesand methods <strong>for</strong>monitoringDesign roadsidesurveysCarry out roadsidesurveys1333 cont.14411442 cont.221 1 FWE242512522531111cont.cont.2532 cont.2533 cont.1 FWE1 FWE1 FWE1 FWE FSBLMNPS1 FWE1 FWE1 FWE2534 1 1 FWE3132414214221 2cont.14222 cont.1 FWEFSBLMNPSFSBLMNPSFSBLMFSBLMNPSCAORWAFSBLMNPSCAORWARTRTFSBLMNPSCAORWARTFSBLMNPSCA50 50 50continues-216
continued-TaskPriorityTask DurationTask No. (years)Resp. PartyFWSReg. Prog. O<strong>the</strong>rCost Est.(X$1 000)1993 -94 -95333333333333333Estimate sampleCarry outmonitoringStudy demographicanalysesStudy populationmodelsDevelop earlywarning methodsStandardizehabitatmeasurementsPrepare habitatmapsStudy habitatsuitabilityin selected areasStudy suitabilityof selectedhabitatsContinue willowcreek studyContinue RoseburgConsider newdemography studiesInitiate newdemography studiesPrepare annualreportsPrepare 5-yearreport4231 14232 cont.424425426431432BLM43343444114412442BLM44351151233cont.12331cont.cont.11 FWEORWARTRTFSBLMNPSCAORWARTFSBLMRTFSBLMNPSRTRTRTFSRTFSBLMRTFSBLMRTES2 1RTFSBLMFSBLMNPSBIACAORWAFSBLMNPSBIACAOFIWA.111.11,11,111............... ---.......... ---- .., - I217
218
Chapter VConsideration of O<strong>the</strong>r Species7
220
v.The nor<strong>the</strong>rn spotted owl is associated with older coniferous <strong>for</strong>ests in <strong>the</strong>Pacific Northwest (Forsman et al. 1984, Thomas et al. 1990), and optimalhabitat <strong>for</strong> <strong>the</strong> species can be found in <strong>for</strong>ests older than 200 years. Becauseof this association and <strong>the</strong> large home ranges of spotted owls, which vary from1,000 to 10,000 acres from Cali<strong>for</strong>nia to Washington, <strong>the</strong> species often hasbeen used as a symbol of older <strong>for</strong>est ecosystems. In addressing <strong>the</strong> conservationof <strong>the</strong> owl, it became apparent that its range overlaps <strong>the</strong> ranges of manyo<strong>the</strong>r species, some of which are listed or are candidates <strong>for</strong> listing. There<strong>for</strong>e,it is reasonable to consider <strong>the</strong> conservation needs of o<strong>the</strong>r species when thoseneeds can be accomplished at little or no additional cost to owl conservation.The outcome of such an ef<strong>for</strong>t is likely to be a more efficient and effectiveconservation strategy <strong>for</strong> older <strong>for</strong>est ecosystems in <strong>the</strong> region. It is alsoimportant <strong>for</strong> <strong>the</strong> recovery plan to avoid actions <strong>for</strong> owl conservation that mighthave adverse effects on o<strong>the</strong>r species. There<strong>for</strong>e, <strong>the</strong> <strong>Recovery</strong> Team wascharged with considering o<strong>the</strong>r species and older <strong>for</strong>est ecosystems in developinga recovery plan <strong>for</strong> <strong>the</strong> nor<strong>the</strong>rn spotted owl.The request to consider o<strong>the</strong>r species in <strong>the</strong> recovery plan <strong>for</strong> <strong>the</strong> owl camefrom Secretary of <strong>the</strong> Interior Manuel Lujan, who wrote "There are o<strong>the</strong>r <strong>for</strong>estecosystem species that may be candidates <strong>for</strong> listing under <strong>the</strong> EndangeredSpecies Act which may benefit from any recovery plan <strong>for</strong> <strong>the</strong> nor<strong>the</strong>rn spottedowl. To <strong>the</strong> extent possible, <strong>the</strong> team should assess <strong>the</strong> relative benefits to<strong>the</strong>se species from <strong>the</strong> implementation of various recovery options." As aresult, <strong>the</strong> O<strong>the</strong>r Species and Ecosystems Committee of <strong>the</strong> <strong>Recovery</strong> Teamwas <strong>for</strong>med to address this directive. A principle of <strong>the</strong> committee has beenthat <strong>the</strong> plan should take advantage of opportunities to benefit o<strong>the</strong>r specieswhere possible and not impact <strong>the</strong>m negatively with a recovery strategy <strong>for</strong> <strong>the</strong>owl.This ef<strong>for</strong>t is important because conservation ef<strong>for</strong>ts <strong>for</strong> each species will be toocostly and time consuming, and a species-by-species approach is not likely tocapture all <strong>the</strong> structural parts and functional relationships of older coniferous<strong>for</strong>ests.The List of Species ConsideredThe O<strong>the</strong>r Species and Ecosystems Committee considered all plants andanimals that are associated with coniferous <strong>for</strong>ests within <strong>the</strong> range of <strong>the</strong>nor<strong>the</strong>rn spotted owl. However, <strong>the</strong> committee emphasized threatened orendangered species, candidates <strong>for</strong> federal listing, state sensitive species, andspecies associated with older <strong>for</strong>ests. The committee developed a list of speciesby conducting a series of meetings; visiting with numerous scientists: acquiringlists of federal threatened and endangered species, state sensitive species,and old-growth associated species (Ruggiero et al. 1991); and reviewing reportsand published literature. The O<strong>the</strong>r Species and Ecosystems Committeesponsored a 2-day workshop to discuss <strong>the</strong> ecology and management needs ofpriority species. The administrative record <strong>for</strong> <strong>the</strong> <strong>Recovery</strong> Team provides adetailed description of <strong>the</strong>se activities (see Tables D. 1 through D.3 of <strong>the</strong>record): and Appendix D provides a more detailed description of <strong>the</strong> approach,<strong>the</strong> list of species, and <strong>the</strong> ecology of riparian ecosystems and priority species.Brown (1985:37) listed 460 species of birds, mammals, and amphibians thatinhabit plant communities west of <strong>the</strong> crest of <strong>the</strong> Cascade Mountains inOregon and Washington. A large number of plant species occur in this region,221
and <strong>the</strong> number of invertebrate animals is believed to be large, but cannot beestimated accurately because many of <strong>the</strong> arthropods (Lattin pers. comm.) andmolluscs (Frest and Johannes 1991) have not been surveyed or describedadequately. The biota of coniferous <strong>for</strong>ests in <strong>the</strong> Pacific Northwest is extremelyrich in numbers of species and possesses numerous species that occuronly in <strong>the</strong> region (endemic) and are unique among <strong>the</strong>ir taxonomic relatives(see Appendix D).Species considered <strong>for</strong> incorporation into <strong>the</strong> recovery plan <strong>for</strong> <strong>the</strong> owl include361 species of plants and animals (Table 5. 1). Of those, five are listed federallyas threatened or endangered, 155 are candidates <strong>for</strong> listing, and approximately100 are species of special concern in one or more of <strong>the</strong> three states. Approximately100 of <strong>the</strong> species are narrowly or broadly endemic to <strong>the</strong> PacificNorthwest, and 194 are associated with older <strong>for</strong>ests. In addition, <strong>the</strong> 28 fishspecies include approximately 766 stocks that are considered at risk (Nehlsenet al. 199 1), and many of <strong>the</strong>se may become candidates <strong>for</strong> federal listing in <strong>the</strong>future. The large number of candidates <strong>for</strong> federal listing, species of specialconcern, endemic species, and older <strong>for</strong>est associates (Table 5. 1) in <strong>the</strong> PacificNorthwest emphasizes <strong>the</strong> importance of considering o<strong>the</strong>r species in <strong>the</strong> owlrecovery plan. The large number of species associated with rivers, creeks,ponds, and marshes and <strong>the</strong>ir associated vegetation (riparian areas) plus <strong>the</strong>number of fish stocks at risk, are indicative of <strong>the</strong> importance of consideringriparian ecosystems. Most riparian ecosystems west of <strong>the</strong> crest of <strong>the</strong> CascadeMountains in Oregon, Washington, and in northwest Cali<strong>for</strong>nia areassociated with coniferous <strong>for</strong>ests, used by nor<strong>the</strong>rn spotted owls <strong>for</strong> nesting or<strong>for</strong>aging (see Appendix D), and influenced by land use practices. The individualspecies considered by <strong>the</strong> committee, plus <strong>the</strong>ir status and associationwith riparian areas and older <strong>for</strong>ests, are listed in Appendix D, Tables D. 1through D.8.From <strong>the</strong> large list of species, <strong>the</strong> committee identified 18 priority species(marbled murrelet, bald eagle, goshawk, marten, fisher, grizzly bear, gray wolf,Oregon slender salamander, Siskiyou Mountain salamander, Larch MountainTable 5.1. Summary of 361 plants and animals considered in <strong>the</strong> recoveprocess <strong>for</strong> <strong>the</strong> nor<strong>the</strong>rn spotted owl (from Appendix D: Tables D.1-D.83.planningFederally Candidate State Species Endemica Older RiparianListed <strong>for</strong> Listing Listed of Special Forest AssociateConcernAssociateBirds (23) 1 2 4 8 4 20 3Mammals (18) 2 2 3 9 8 12 4Amphibiansb (23) 0 7 3 16 20 12 12Fish (28) 1 7 3 25 N/A N/A 28Molluscs (58) 0 10 1 29 47 43 45Insects (59) 0 34 0 ? ? 23 34Vascular <strong>Plan</strong>ts (146) 1 93 16 42 23 76 6Fungi and Lichens (8) 0 0 ? 2 ? 8 0Total (N=361) 5 155 30 131 102 194 132aLocally or broadly endemic.blncludes two reptiles, <strong>the</strong> sharptail snake and western pond turtle.N/A = not applicable? = unknown, undetermined/222
salamander, Del Norte salamander, Pacific giant salamander, Cope's giantsalamander, Olympic salamander (four species), tailed frog); a larger list ofriparian-associated species including fishes, amphibians, mammals, insects,and molluscs: and a list of five species preyed upon by <strong>the</strong> owl (flying squirrel,bushy-tailed woodrat, dusky-footed woodrat, red tree vole, and western redbackedvole). Of <strong>the</strong>se species, <strong>the</strong> marbled murrelet and <strong>the</strong> numerous fishstocks were assigned <strong>the</strong> highest priority because of <strong>the</strong> proposal to list <strong>the</strong>marbled murrelet as a threatened species and because <strong>the</strong> numerous fishstocks are considered' at risk. The threatened or endangered species were notassigned as muchr importance because <strong>the</strong> committee assumed that <strong>the</strong>irmanagement is sufficiently addressed in recovery plans <strong>for</strong> each of <strong>the</strong> species.Benefits of <strong>the</strong> <strong>Plan</strong> to O<strong>the</strong>r SpeciesThis section describes <strong>the</strong> benefits that o<strong>the</strong>r species will derive from <strong>the</strong>recovery plan <strong>for</strong> <strong>the</strong> nor<strong>the</strong>rn spotted owl. Many of <strong>the</strong>se benefits cannot bequantified adequately until surveys of <strong>the</strong> DCAs <strong>for</strong> o<strong>the</strong>r species have beenconducted. However, some reasonably accurate statements can made.Designated Conservation Areas (DCAs)The size, spacing, and management of DCAs will provide considerable benefits<strong>for</strong> o<strong>the</strong>r species throughout <strong>the</strong> owl's range, particularly species associatedwith older <strong>for</strong>ests. As a result of DCA placement, benefits to o<strong>the</strong>r species willbe attained with little or no additional cost. For example, two category 2 DCAswere established in <strong>the</strong> Mt. Baker-Snoqualmie National Forest to include sevenpairs of owls and a wild and scenic river corridor along <strong>the</strong> South Fork of <strong>the</strong>Stillaguamish River. These DCAs also include marbled murrelet locations andimportant stream sections <strong>for</strong> native fishes. The additional area was offset byreductions in <strong>the</strong> size of <strong>the</strong> habitat conservation areas (HCAs) recommendedby <strong>the</strong> ISC report (Thomas et al. 1990). In Oregon, a DCA was established in<strong>the</strong> Suislaw National Forest (Lincoln County) along <strong>the</strong> coastal area near Rock,Cummins, and Tenmile Creeks. This DCA includes eight owl pairs and eightsingle owls as well as 60 sites <strong>for</strong> marbled murrelets and three streams withfish stocks at risk. This addition also was offset by reductions in <strong>the</strong> size oftwo of <strong>the</strong> HCAs that were recommended by <strong>the</strong> ISC report.The benefit of DCAs to priority species can be quantified by totaling <strong>the</strong> numberof occurrences (occupied nest sites <strong>for</strong> birds, trap locations or observations<strong>for</strong> mammals) of <strong>the</strong>se species within DCAs <strong>for</strong> each province (Table 5.2). TheDCA network incorporates a total of 486 known sites of priority species across<strong>the</strong> range of <strong>the</strong> owl, including 227 occupied murrelet sites, 122 goshawk nestsites, 60 marten sites, 37 fisher sites, and 40 bald eagle nest sites. The DCAsalso include 2,047 miles of streams with stocks of fish that are considered atrisk. The greatest benefits to fish will be achieved in <strong>the</strong> Klamath physiographicprovince and <strong>the</strong> Oregon Coast Range where 696 and 267 miles ofstreams, respectively, were included in DCAs. The greatest benefits to o<strong>the</strong>rspecies will be achieved <strong>for</strong> marbled murrelets in <strong>the</strong> Oregon Coast Rangewhere 146 occupied sites are included in DCAs. Forty-seven goshawk sites in<strong>the</strong> western Washington Cascades and 32 murrelet sites on <strong>the</strong> OlympicPeninsula were included in DCAs. These are known sites and probably do notrepresent all sites <strong>for</strong> <strong>the</strong>se species in DCAs. Inclusion of <strong>the</strong>se sites in DCAs,along with <strong>the</strong> conservation of older <strong>for</strong>ests <strong>for</strong> owl habitat, will provide significantbenefits to <strong>the</strong>se species within <strong>the</strong> range of <strong>the</strong> spotted owl.Management guidelines <strong>for</strong> DCAs on federal lands are key elements of <strong>the</strong>recovery plan (see section III.C.2.). These guidelines focus on <strong>the</strong> maintenanceof suitable habitat <strong>for</strong> owls and development of suitable habitat in stands223
Table 5.2. Numbers of o<strong>the</strong>r species locations and miles of streams (with fishstocks at risk) in designated conservation areas (DCAs) <strong>for</strong> <strong>the</strong> nor<strong>the</strong>rn spottedowl summarized by physiographic province.SpeciesProvinceBaldaEagle Fisherb Goshawka Martenb MurreletcMiles ofStreamCali<strong>for</strong>niaCascades 3085N/A80Cali<strong>for</strong>niaCoastRange000017184Klamath(Oregon and Cali<strong>for</strong>nia)2 1820141 1696Eastern OregonCascades3187N/A32Western OregonCascades42118N/A232OregonCoastRange8100146267OlympicPeninsula9612032202Eastern WashingtonCascades1 2167N/A136Western WashingtonCascades7 7471919203Western WashingtonLowlands3 0 002 13Total in DCAs 40Total in Range 1,07037107122256602192273672,047aLocations are nest sites.bLocations are sightings or trap records.CLocations are nest sites and areas that have been repeatedly used by murrelets.N/A = not applicable; murrelets occur less than 50 miles from <strong>the</strong> Pacific Ocean.- (dash) = data not available.I I I I I'll - - , - I I I .11 I ....- .....I........ 1.11.11,11,111,111, -224
currently unsuitable. The guidelines specify <strong>the</strong> kinds of silvicultural activitiesand salvage that may occur within DCAs, and <strong>the</strong>y suggest ways of managingto limit large-scale disturbance (fire, wind) of habitat in some of <strong>the</strong> provinces.All of <strong>the</strong>se guidelines are designed to protect and enhance owl habitat. As aresult of adhering to <strong>the</strong> management guidelines, <strong>for</strong>est areas within <strong>the</strong> DCAswill provide habitat <strong>for</strong> a wide array of o<strong>the</strong>r species.Management guidelines <strong>for</strong> salvage within DCAs are designed to retain coursewoody debris (snags and down logs) after large-scale disturbances. Thismanagement will contribute to <strong>the</strong> habitat requirements of a number of cavitydwellers including cavity-nesting birds and flying squirrels through retention ofcoarse woody debris. These guidelines also will promote suitable conditions <strong>for</strong>arthropods, salamanders, fungi, and small mammals that use <strong>the</strong>se habitatfeatures.Management in <strong>the</strong> Forest MatrixRecommendations <strong>for</strong> management of <strong>the</strong> <strong>for</strong>estlands outside of DCAs (<strong>for</strong>estmatrix) on federal lands are designed to provide habitat <strong>for</strong> dispersing juvenileowls and <strong>for</strong> pairs and territorial singles, where <strong>the</strong> DCA network is deficient or<strong>the</strong>re is a risk of large-scale disturbance (see section III.C.2.). Management of<strong>the</strong> matrix <strong>for</strong> dispersing owls only is not likely to provide <strong>the</strong> necessary habitat<strong>for</strong> many species associated with older <strong>for</strong>ests. However, <strong>the</strong> matrix on federalland outside of DCAs also will be managed to protect residual habitat areas,reserved pair areas, and managed pair areas, which will provide habitat <strong>for</strong>o<strong>the</strong>r species associated with older <strong>for</strong>ests. Habitat around managed pairareas may be maintained through time using various management techniques,and <strong>the</strong>re is some uncertainty about what benefits it will provide to o<strong>the</strong>rspecies. However, if some of <strong>the</strong>se management techniques include longerrotations and uneven-aged management with a goal of providing large trees,snags, and coarse woody debris, <strong>the</strong>se areas will be used by a number ofspecies. The Yakima Indian Reservation and private lands in nor<strong>the</strong>rn Cali<strong>for</strong>niapresent opportunities to evaluate this type of management in mixed-conifer<strong>for</strong>ests. Un<strong>for</strong>tunately, this type of management has been conducted in fewareas in <strong>the</strong> Douglas-fir/hemlock <strong>for</strong>ests of western Oregon and Washington.Fur<strong>the</strong>r Surveys, Inventory, and ResearchThe committee also identified species within <strong>the</strong> range of <strong>the</strong> nor<strong>the</strong>rn spottedowl <strong>for</strong> which little is known or fur<strong>the</strong>r review would be appropriate. Thecommittee developed four criteria <strong>for</strong> evaluating each species' current statusincluding:1. Possession of an extremely restricted geographic range.2. A federal classification as a category 2 or 3 species <strong>for</strong> listing.3. Designation as a species of special concern or sensitive species in oneor more states.4. Lack of in<strong>for</strong>mation on distribution and or population numbers.The committee also emphasized species that are endemic to <strong>the</strong> Pacific Northwestand associated with older <strong>for</strong>ests. The species suggested <strong>for</strong> fur<strong>the</strong>rreview include:Birds: goshawk, Vaux's swift, white-headed woodpecker, black-backedwoodpecker, pigmy owl.Mammals: fisher, marten, red tree vole (two species), white-footed vole,<strong>for</strong>est deer mouse, long-legged myotis, fringed myotis.225
Amphibians and Reptiles: Larch Mountain salamander, Van Dyke'ssalamander, Oregon slender salamander, Siskiyou Mountain salamander,Del Norte salamander, Dunn's salamander, Olympic salamander(four species), Pacific giant salamander, Cope's giant salamander, tailedfrog, sharptail snake, western pond turtle.Fishes: bull trout, coastal sea run cutthroat, tidewater goby.The <strong>Recovery</strong> Team suggests additional surveys, inventory, and research <strong>for</strong><strong>the</strong>se species, based on what is known about <strong>the</strong>ir current status (see AppendixD tables).Arthropods and molluscs are two major groups of organisms in <strong>the</strong> region <strong>for</strong>which <strong>the</strong>re is little in<strong>for</strong>mation and a great need <strong>for</strong> status reviews, surveys,and research. Nei<strong>the</strong>r group has been surveyed adequately throughout <strong>the</strong>range of <strong>the</strong> nor<strong>the</strong>rn spotted owl, and many species are not described ornamed. Any assessment of <strong>the</strong>ir status will require considerable ef<strong>for</strong>t andshould be approached through broad-scale inventories aimed at assessingspecies composition and distribution. In addition, surveys of <strong>the</strong> amphibiansin <strong>the</strong> Pacific Northwest currently are inadequate to assess <strong>the</strong> status of manyof <strong>the</strong>ir populations. This is particularly important, because many of <strong>the</strong>amphibians have restricted distributions, limited dispersal capabilities, andhigh genetic variability, which are characteristics of species that become rareand eventually are listed as threatened or endangered. Much of <strong>the</strong> existingin<strong>for</strong>mation on <strong>the</strong> abundance of amphibians in different ages of coniferous<strong>for</strong>ests is presented by Ruggiero et al. (1991), and o<strong>the</strong>r limited studies on thissubject.The amount of research that has been conducted on <strong>the</strong> major groups o<strong>for</strong>ganisms considered here varies widely. Although <strong>the</strong>re are numerouspublications on birds, mammals, and fishes in <strong>for</strong>ested landscapes in <strong>the</strong>Pacific Northwest (see Appendix D), <strong>the</strong>re is much less in<strong>for</strong>mation on molluscsand arthropods. In<strong>for</strong>mation is lacking on distributions, abundance, andhabitat relationships of amphibians, because <strong>the</strong>y are not surveyed easily. TheForest Service's "Old-Growth Forest Wildlife Habitat Research Program" publishedby Ruggiero et al. (1991) presents an extensive data base on birds,mammals, amphibians, and plants in unmanaged <strong>for</strong>ests of <strong>the</strong> Pacific Northwest.These studies provide a valuable in<strong>for</strong>mation base on <strong>the</strong> abundanceand habitat relationships of <strong>the</strong>se groups of organisms in young, mature, andold-growth <strong>for</strong>ests. However, similar in<strong>for</strong>mation is needed on intensivelymanaged <strong>for</strong>ests at rotation age. In addition, in<strong>for</strong>mation is needed on <strong>the</strong>response of plants and animals to various silvicultural prescriptions includingselective harvests, uneven-aged management, long rotations, green tree retention,and snag management in <strong>the</strong>se <strong>for</strong>ests.There is a lack of in<strong>for</strong>mation on <strong>the</strong> taxonomy, distribution, and abundance ofarthropods in different <strong>for</strong>est types throughout <strong>the</strong> Pacific Northwest. Accordingto scientists at Oregon State University (Lattin and Moldenke pers. comm.),many of <strong>the</strong>se organisms have not been described or named, and little isknown about <strong>the</strong>ir distribution or abundance across <strong>the</strong> landscape and indifferent <strong>for</strong>est conditions. Likewise, definitive in<strong>for</strong>mation on <strong>the</strong> distributionand abundance of molluscs in different <strong>for</strong>est types is lacking, and many of<strong>the</strong>se species are sensitive to land use practices that alter <strong>the</strong> microclimatesupon which <strong>the</strong>y depend (Frest and Johannes 1991). Similar statements canbe made about salamanders (Beatty et al. 1991).226Among <strong>the</strong> birds and mammals, several species are large and very mobile, andwere not sampled adequately by <strong>the</strong> sampling designs of Ruggiero et al. (1991),nor have <strong>the</strong>y been studied intensively elsewhere. More in<strong>for</strong>mation is neededabout <strong>the</strong>ir abundance and habitat relationships in various <strong>for</strong>est types and
<strong>the</strong>ir response to different silvicultural treatment. These species include <strong>the</strong>marbled murrelet, goshawk, Vaux's swift, fisher, marten, and wolverine. O<strong>the</strong>rspecies, like <strong>the</strong> red tree vole, white-footed vole, and <strong>for</strong>est deer mouse areei<strong>the</strong>r rare or have behavioral traits that make <strong>the</strong>m particularly difficult tostudy. These species should be <strong>the</strong> focus of fur<strong>the</strong>r study, ei<strong>the</strong>r individuallyor in community studies.A number of o<strong>the</strong>r important research areas probably could be identified.However, <strong>the</strong> intent here is to highlight some obvious gaps in <strong>the</strong> in<strong>for</strong>mationbase on <strong>the</strong> relationship of plants and animals to different <strong>for</strong>est conditionsthroughout <strong>the</strong> Pacific Northwest. A more complete list of research topicscould be developed by a group dedicated to this purpose.227
228
Chapter VILiterature Cited229
230
Adamcik, R. S., and L. B. Keith. 1978. Regional movements and mortalityofgreat homed owls in relation to snowshoe hare fluctuations.Canadian Field Naturalist 92:228-234.Advanced Sciences, Inc. 1989. Population monitoring of <strong>the</strong> nor<strong>the</strong>rnspotted owl on coastal Sierra Pacific Industries timberlands.Unpublished report, Sierra Pacific Industries, Redding, Cali<strong>for</strong>nia.Agee, J. K. 1991a. Fire history of Douglas-fir <strong>for</strong>ests in <strong>the</strong> PacificNorthwest. Pages 25-33 In L.F. Ruggiero, K.B. Avory, A.B.Carey, and M.H. Huff, eds. Wildlife and vegetation ofunmanaged Douglas-fir <strong>for</strong>ests. USDA Forest Service, PacificNorthwest Forest and Range Experimental Station GeneralTechnical Report PNW-GTR-285. Portland, Oregon.Agee, J. K. 1991 b. Evaluation ofcatastrophic habitat loss <strong>for</strong> spotted owls:Olympic Peninsula. Unpublished report, Nor<strong>the</strong>rn <strong>Spotted</strong><strong>Owl</strong> <strong>Recovery</strong> Team, USDI Fish and Wildlife Service, Portland,Oregon.Allen, H. L., K. R. Dixon, and K. L. Knutsen. 1989. Cooperativeadministrative study to monitor spotted owl managementareas in national <strong>for</strong>ests in Washington. Washington Departmentof Wildlife, Olympia, Washington.American Omithologist's Union. 1957. Check-list of North Americanbirds. Fifth edition. The Lord Baltimore Press, Baltimore,Maryland.Anthony, J. L. and E. B. Cummins. 1989. 1988-1989 Hoh-Clearwaterspotted owl inventory project. Unpublished report, WashingtonDepartment Natural Resources and Washington Departmentof Wildlife, Olympia, Washington.Azuma, D., J. Baldwin, and B. R. Noon. 1990. Estimating occupancy ofspotted owl habitat areas and adjusting<strong>for</strong>bias. USDA ForestService, Pacific Southwest Forest and Range ExperimentalStation General Technical Report PSW-GTR-124, Berkeley,Cali<strong>for</strong>nia.Bailey, H. 1966. Geology of nor<strong>the</strong>rn Cali<strong>for</strong>nia. Cali<strong>for</strong>nia Division ofMines and Geology, Bulletin 190, San Francisco, Cali<strong>for</strong>nia.Barrowclough, G. F. 1980. Gene flow, effective population sizes, andgenetic variance components in birds. Evolution 34:789-798.Barrowelough, G. F., and S. L. Coats. 1985. The demography andpopulation genetics of owls with special reference to <strong>the</strong>conservation of <strong>the</strong> spotted owl (Strix occidentalis). Pages 74-85 In R. J. Gutierrez and A. B. Carey, eds. Ecology andmanagement of <strong>the</strong> spotted owl in <strong>the</strong> Pacific Northwest.Pacific Northwest Forest and Range Experimental Station,General Technical Report PNW- 185, Portland, Oregon.Barrowclough, G. F., and R. J. Gutierrez. 1990. Genetic variation anddifferentiation in <strong>the</strong> spotted owl (Strtx occidentalis). Auk107:737-744.231
Barrows, C. W. 1980. Feeding ecology of <strong>the</strong> spotted owl in Cali<strong>for</strong>nia.Journal of Raptor Research 14:73-78.Barrows, C. W. 1981. Roost selection by spotted owls: an adaptation toheat stress. Condor 83:302-309.Barrows, C. W. 1985. Breeding success relative to fluctuations in diet <strong>for</strong>spotted owls in Cali<strong>for</strong>nia. Pages 50-54 In R. J. Gutierrez andA. B. Carey. eds. Ecology and management of <strong>the</strong> spotted owlin <strong>the</strong> Pacific Northwest. Pacific Northwest Forest and RangeExperimental Station General Technical Report PNW-185,Portland, Oregon.Barrows, C. W. 1987. Diet shifts in breeding and non-breeding spottedowls. Journal of Raptor Research 21:95-97.Barrows, C., and K. Barrows. 1978. Roost characteristics and behavioral<strong>the</strong>rmoregulation in <strong>the</strong> spotted owl. Western Birds 9:1-8.Barrows, C. W., P. H. Bloom, C. T. Collins. 1982. Sexual differences in tailbarring of spotted owls. North American Bird Bander 7:138-139.Bart, J., and E. D. Forsman. 1990. Surveys of nor<strong>the</strong>rn spotted owls onpublic lands. Unpublished report. Ohio Cooperative Fish andWildlife Research Unit, Ohio State University, Columbus,Ohio. In Press.Bart, J., and E. D. Forsman. 1992. Dependence of nor<strong>the</strong>rn spotted owlson old-growth <strong>for</strong>ests. Conservation Biology. In Press.Beak Consultants. 1989. Survey of spotted owls on managed <strong>for</strong>estlandsin interior nor<strong>the</strong>rn Cali<strong>for</strong>nia. Unpublished report, SierraPacific Industries, Redding, Cali<strong>for</strong>nia.Beatty, J.J., A.R. Blaustein, and R.M. Storm. 1991. The biology ofamphibians and reptiles. Unpublished report, Nor<strong>the</strong>rn<strong>Spotted</strong> <strong>Owl</strong> <strong>Recovery</strong> Team, USDI Fish and Wildlife Service,Portland, Oregon.Bendire, C. E. 1892. Life histories of North American birds with specialreference to <strong>the</strong>ir breeding habits and eggs. U.S. NationalMuseum Bulletin 1, Washington, D.C.Bent, A. C. 1938. Life histories of North American birds of prey, Part 2.U.S. National Museum Bulletin 170, Washington D.C.Bjorklund, J., and D. Drummond. 1987. Nesting and habitat survey ofendangered, threatened, and sensitive raptor species in <strong>the</strong>Ross Lake Drainage, Washington State, 1987. Unpublishedreport, USDI National Park Service.Blakesley, J. A., A. B. Franklin, and R. J. Gutierrez. 1990. Sexualdimorphism in nor<strong>the</strong>rn spotted owls from northwest Cali<strong>for</strong>nia.Journal of Field Ornithology 61:320-327.Blakesley, J. A., A. B. Franklin, and R. J. Gutierrez. In Press. <strong>Spotted</strong> owlroost and nest site selection in northwest Cali<strong>for</strong>nia. Journalof Wildlife Management.232
Booth, D. E. 1991. Estimating prelogging old-growth in <strong>the</strong> PacificNorthwest. Journal of Forestry 89:25-29.Boyce, M. S. 1987. A review of <strong>the</strong> U.S. Forest Service's viability analysis<strong>for</strong> <strong>the</strong> spotted owl. Unpublished report, National Council of<strong>the</strong> Paper Industry <strong>for</strong> Air and Stream Improvement, Incorporated,Corvallis, Oregon.Brown, E. R. 1985. Management of wildlife and fish habitats in <strong>for</strong>estsofwestern Oregon and Washington, ed. USDA Forest Service,publication no. R6-F&WL-192, Portland, Oregon.Buchanan, J. B. 1991. <strong>Spotted</strong> owl nest site characteristics in mixedconifer <strong>for</strong>ests of <strong>the</strong> eastern Cascade Mountains, Washington.M.S. <strong>the</strong>sis, University of Washington, Seattle, Washington.Brown, J.1989. Arcata redwood spotted owls survey. Unpublishedreport, Arcata Redwood Company, Arcata, Cali<strong>for</strong>nia.Call, D. R.1989. Home range and habitat use by spotted owls in <strong>the</strong>central Sierra Nevada. M. S. <strong>the</strong>sis, Humboldt State University,Arcata, Cali<strong>for</strong>nia.Carey, A. B. 1985. The scientific basis <strong>for</strong> spotted owl management. Pages100- 114 In R. J. Gutierrez and A. B. Carey, eds. Ecology andmanagement of <strong>the</strong> spotted owl in <strong>the</strong> Pacific Northwest.USDA Forest Service, Pacific Northwest Forest and RangeExperimental Station, General Technical Report PNW-GTR-185. Portland, Oregon.Carey, A. B., S. P. Horton, and J. A. Reid. 1989. Optimal sampling <strong>for</strong>radiotelemetry studies of spotted owl habitat and home range.USDA Forest Service, Pacific Northwest Forest and RangeExperimental Station, Resource Paper PNW-RP-416. Portland,Oregon.Carey, A. B., J. A. Reid, and S. P. Horton. 1990. <strong>Spotted</strong> owl home rangeand habitat use in sou<strong>the</strong>rn Oregon coast ranges. Journal ofWildlife Management 54:11-17.Carey, A. B., M. M. Hardt, S. P. Horton, and B. L. Biswell. 1991. SpringBird Communities in <strong>the</strong> Oregon Coast Range. Pages 123-142In L.F. Ruggiero, K. B. Auory, A.B. Carey, and M. H. Huff, eds.Wildlife and vegetation of unmanaged Douglas-fir <strong>for</strong>ests.USDA Forest Service, Pacific Northwest Forest and RangeExperimental Station, General Technical Report PNW-GTR-285.Caughley, G. 1977. Analysis of vertebrate populations. John Wiley Sons,New York, New York.Chavez-Leon, G. 1989. Characteristics of fragmented habitats used by<strong>the</strong> nor<strong>the</strong>rn spotted owl (Strix occidentalis caurina) in northwesternCali<strong>for</strong>nia. M.S. <strong>the</strong>sis, Humboldt State University,Arcata, Cali<strong>for</strong>nia.233
Clark, R. J., D. G. Smith, and L. H. Kelso. 1978. Working bibliographyof owls of <strong>the</strong> world: with summaries of current taxonomy anddistributional status. Technical Bulletin No. 1, Raptor In<strong>for</strong>mationCenter, National Wildlife Federation, Washington,D.C.Cody, M. L. 1974. Competition and <strong>the</strong> structure of bird communities.Monograph in Population Biology 7, Princeton UniversityPress, Princeton, New Jersey.Cracraft, J. 1981. Toward a phylogenetic classification of <strong>the</strong> recent birdsof <strong>the</strong> world (class Aves). Auk 98:681-714.Diamond, J. M. 1984. Normal extinctions of isolated populations. Pages191-246 In M. H. Nitecke, ed. Extinctions. University ofChicago Press, Chicago.Dawson, W. R., J. D. Ligon, J. R. Murphy, J. P. Myers, D. Simberloff, andJ. Verner. 1987. Report of <strong>the</strong> scientific advisory panel on <strong>the</strong>spotted owl. Condor 89:205-229.Diller, L. 1989. Status of <strong>the</strong> nor<strong>the</strong>rn spotted owl in managed <strong>for</strong>ests onSimpson redwood land in nor<strong>the</strong>rn Cali<strong>for</strong>nia. Unpublishedreport, Simpson Redwood Company, Arcata, Cali<strong>for</strong>nia.Dixon K. R., and T. C. Juelson. 1987. The political economy of <strong>the</strong> spottedowl in Oregon. Ecology 68:772-776.Doak, D. 1989. <strong>Spotted</strong> owls and old-growth logging in <strong>the</strong> PacificNorthwest. Conservation Biology 3:389-396.Dunbar, D. L., B. P. Booth, E. D. Forsman, A. E. He<strong>the</strong>rington, and D. W.Wilson. 1990. Status of <strong>the</strong> nor<strong>the</strong>rn spotted owl (Strtxoccidentaltis) and barred owl (Strix varia) in southwesternBritish Columbia. Unpublished manuscript.Dunn. H. H. 1901. The spotted owl (Symium occidentale). Oologist18:165-167.Earhart, C. N., and N. K. Johnson. 1970. Size dimorphism and food habitsof North American owls. Condor 72:251-264.Fitton, S. D. 1991. Vocal learning and call structure of male nor<strong>the</strong>rnspotted owls in northwestern Cali<strong>for</strong>nia. M.S. <strong>the</strong>sis, HumboldtState University, Arcata, Cali<strong>for</strong>nia.Fitton, S. D., and R. J. Gutierrez. 1991. Vocal learning and call structureof male nor<strong>the</strong>rn spotted owls in northwestern Cali<strong>for</strong>nia.Unpublished manuscript.Fitzpatrick, J. W. 1975. A record of allopreening in <strong>the</strong> barred owl. Auk92:598-599.Forsman, E. D. 1976. A preliminary investigation of <strong>the</strong> spotted owl inOregon. M.S. <strong>the</strong>sis, Oregon State University, Corvallis, Oregon.Forsman, E. D. 1980. Habitat utilization by spotted owl in <strong>the</strong> westcentralCascades of Oregon. Ph.D. <strong>the</strong>sis, Oregon StateUniversity, Corvallis, Oregon.234
Forsman, E. D. 1981. Molt of <strong>the</strong> spotted owl. Auk 98:735-742.Forsman, E. D. 1983. Methods and materials <strong>for</strong> locating and studyingspotted owls. USDA Forest Service, Pacific Northwest Forestand Range Experimental Station General Technical ReportPNW-GTR-162, Portland, Oregon.Forsman, E. D. 1984. An annotated bibliography of literature on <strong>the</strong>spotted owl. British Columbia Provincial Museum. Vancouver,British Columbia, Canada.Forsman, E. D. 1986. <strong>Spotted</strong> owls in young <strong>for</strong>est-additional surveys in<strong>the</strong> nor<strong>the</strong>rn Coast Range of Oregon. Unpublished report,Oregon Department of Fish and Wildlife, Portland, Oregon.Forsman, E. D. 1988a. The spotted owl: literature review. Appendix CIn U.S. Forest Service Final supplement to <strong>the</strong> environmentalimpact statement <strong>for</strong> an amendment to <strong>the</strong> Pacific Northwestregional guide. Vols. 1 and 2. USDA Forest Service, PacificNorthwest Region, Portland, Oregon.Forsman, E. D. 1988b. A survey of spotted owls in young <strong>for</strong>ests in <strong>the</strong>nor<strong>the</strong>rn Coast Range of Oregon. Murrelet 69:65-68.Forsman, E. D., and E. C. Meslow. 1985. Old-growth <strong>for</strong>est retention <strong>for</strong>spotted owls-how much do <strong>the</strong>y need? Pages 58-59 InGutierrez, R. J., and A. B. Carey, eds. Ecology and managementof <strong>the</strong> spotted owl in <strong>the</strong> Pacific Nowthwest. PacificNorthwest Forest and Range Experiement Station. GeneralTechnical Report PNW-185, Portland, Oregon.Forsman, E. D., and H. M. Wight. 1979. Allopreening in owls: what areits functions? Auk 96:525-53 1.Forsman, E. D., C. R. Bruce, M. A. Walter, and E. C. Meslow. 1987. Acurrent assessment of <strong>the</strong> nor<strong>the</strong>rn spotted owl population inOregon. Murrelet 68:51-54.Forsman, E. D., E. C. Meslow, and M. J. Strub. 1977. <strong>Spotted</strong> owlabundance in young versus old-growth <strong>for</strong>ests. OregonWildlife Society Bulletin 5:43-47.Forsman, E. D., E. C. Meslow, and H. M. Wight. 1984. Distribution andbiology of <strong>the</strong> spotted owl in Oregon. Wildlife Monographs87:1-64.Foster, C. C., E.D. Forsman, E. C. Meslow, G. S. Miller, J. A. Reid, F. F.Wagner, A. B. Carey, and J. B. Lint. 1992. Survival andreproduction of radio-marked adult spotted owls. Journal ofWildlife Management 56:91-95.Frankel, 0. H., and M. E. Soul_. 1981. Conservation and Evolution.Cambridge University Press, Cambridge, England.Franklin, A. B. In Press. Population regulation in nor<strong>the</strong>rn spotted owls:<strong>the</strong>oretical implications <strong>for</strong> management. In D. McCulloughand R. Barrett, eds. Wildlife 2001: Populations, ElsevierPress, Essex, England.235
Franklin, A. B., J. A. Blakesley, and R. J. Gutierrez. 1990a. Populationecology of <strong>the</strong> nor<strong>the</strong>rn spotted owl (Strtx occidentalis caurina)in northwestern Cali<strong>for</strong>nia. Unpublished report, Cali<strong>for</strong>niaDepartment of Fish and Game, Sacramento, Cali<strong>for</strong>nia.Franklin, A. B., J. P. Ward, R. J. Gutierrez, and G. I. Gould, Jr. 1990b.Density of nor<strong>the</strong>rn spotted owls in northwest Cali<strong>for</strong>nia.Journal of Wildlife Management 54: 1-10.Franklin, J. F., and C. T. Dyrness. 1973. Natural vegetation of Oregon andWashington. USDA Forest Service, Pacific Northwest Forestand Range Experimental Station, General Technical ReportPNW-GTR-8, Portland, Oregon.Franklin, J. F., and R. T. T. Forman. 1987. Creating landscape patternsby <strong>for</strong>est cutting: ecological consequences and principles.Landscape Ecology 1(1):5-18.Fredrickson, R. J., L. S. Mills, B. B. Moorehead. 1989. <strong>Spotted</strong> owl surveysin <strong>the</strong> Olympic National Park. Unpublished report, USDINational Park Service, Port Angeles, Washington.Frest, T.J. and E.J. Johannes. 1991. Present and potential candidatemolluscs occurring within <strong>the</strong> range of <strong>the</strong> nor<strong>the</strong>rn spottedowl. Unpublished report, Nor<strong>the</strong>rn <strong>Spotted</strong> <strong>Owl</strong> <strong>Recovery</strong>Team, USDI Fish and Wildlife Service, Portland, Oregon.Ganey, J. L. 1990. Calling behavior of spotted owls in nor<strong>the</strong>rn Arizona.Condor 92:485-490.GAO (GeneralAccountingOffice). 1989. Endangered species: spotted owlpetition evaluation beset by problems. U.S. General AccountingOffice RCED 89-79.Gore, J. F., B. S. Mulder, and J. A. Bottoerff. 1987. The nor<strong>the</strong>rn spottedowl status review. Unpublished report, USDI Fish andWildlife Service, Region 1, Portland, Oregon.Gould, G. I., Jr. 1974. The status of <strong>the</strong> spotted owl in Cali<strong>for</strong>nia.Cali<strong>for</strong>nia Department of Fish and Game, Sacramento, Cali<strong>for</strong>nia,Report Number 74-6.Gould, G. I., Jr. 1974. The sou<strong>the</strong>rn range limits of <strong>the</strong> nor<strong>the</strong>rn spottedowl. Unpublished paper, Cali<strong>for</strong>nia Department Fish andGame, Nongame Section, Sacramento, Cali<strong>for</strong>nia.Greber, B. J., K. N. Johnson, and G. Lettman. 1990. Conservation plans<strong>for</strong> <strong>the</strong> nor<strong>the</strong>rn spotted owl and o<strong>the</strong>r <strong>for</strong>est managementproposals in Oregon: <strong>the</strong> economics of changing timberavailability. Forest Research Laboratory, Oregon Statc University,Corvallis, Oregon.Green, E. J. 1991. Statistical critique of 1990 status review, nor<strong>the</strong>rnspotted owl. Technical Bulletin 91-09, American ForestResources Alliance, Washington, D.C.236
Greenwood, P. J. 1980. Mating systems, philopatry and dispersal in birdsand mammals. Animal Behavior 28:1140-1162.Greiner, E. C., G. F. Bennett, E. M. White, and R. F. Coombs. 1975.Distribution of <strong>the</strong> avian hematozoa of North America. CanadianJournal of Zoology 53:1762-1787.Grinnell, J., and A. H. Miller. 1944. The distribution of <strong>the</strong> birds ofCali<strong>for</strong>nia. Pacific Coast Avifauna 27.Gup, T. 1990. <strong>Owl</strong> vs. man. Time 135(26):56-63.Gutierrez, R. J. 1985. An overview of recent research on <strong>the</strong> spotted owl.Pages 39-49 In R. J. Gutierrez and A. B. Carey, eds. USDAForest Service, Pacific Northwest Forest and Range ExperimentalStation, General Technical Report PNW-GTR-185,Portland, Oregon.Gutierrez, R. J. 1989. Hematozoa from <strong>the</strong> spotted owl. Journal of WildlifeDiseases 25:614-618.Gutierrez, R. J., and A. B. Carey, eds. 1985. Ecology and managementof <strong>the</strong> spotted owl in <strong>the</strong> Pacific Northwest. USDA ForestService, Pacific Northwest Forest and Range ExperimentalStation, General Technical Report PNW-GTR-185, Portland,Oregon.Gutierrez, R. J., and J. Pritchard. 1990. Distribution, density, and agestructure of spotted owls on two sou<strong>the</strong>rn Cali<strong>for</strong>nia habitatislands. Condor 92:491-495.Gutierrez, R. J., A. B. Franklin, W. LaHaye, V. J. Meretsky, and J. P. Ward.1985. Juvenile spotted owl dispersal in northwestern Cali<strong>for</strong>nia:preliminary results. Pages 60-65 In R. J. Gutierrez andA. B. Carey, eds. Ecology and management of <strong>the</strong> spotted owlin <strong>the</strong> Pacific Northwest. USDA Forest Service, Pacific NorthwestForest and Range Experimental Station, General TechnicalReport PNW-GTR- 185, Portland, Oregon.Gutierrez, R. J., D. M. Solis, Jr., and C. Sisco. 1984. Habitat ecology of<strong>the</strong> spotted owl in northwestern Cali<strong>for</strong>nia: implications <strong>for</strong>management. Pages 368-373 In Proceedings of <strong>the</strong> Conventionof <strong>the</strong> Society of American Foresters, Portland, Oregon.Gutierrez, R. J., J. P. Ward, A. B. Franklin, and W. S. LaHaye. InPreparation. Dispersal ecology of juvenile nor<strong>the</strong>rn spottedowls.Hamer, T. E. 1988. Home range size of <strong>the</strong> nor<strong>the</strong>rn barred owl andnor<strong>the</strong>rn spotted owl in western Washington. M.S. <strong>the</strong>sis,Western Washington University, Bellingham, Washington.Hamer, T. E., S. G. Seim, and K. R. Dixon. 1989. Nor<strong>the</strong>rn spotted owland nor<strong>the</strong>rn barred owl habitat use and home range size inWashington. Unpublished report, Washington Departmentof Wildlife, Olympia, Washington.237
Harestad, A. S., and F. L. Bunnell. 1979. Home range and body weight--a reevaluation. Ecology 60:389-402.Harmon, M. E., J. F. Franklin, F. J. Swanson, P. Sollins, S. V. Gregory, J.D. Lattin, N. H. Anderson, S. P. Cline, N. G. Aumen, J. R.Sedell, G. W. Lienkaemper, K. Cromack, and K. W. Cummins.1986. Ecology of coarse woody debris in temperate ecosystems.Advances in Ecological Research 15:133-275.Hays, D. W., H. L. Allen, and L. H. Egtvedt. 1989. <strong>Spotted</strong> owl surveys ofrandomly selected transects in Washington. Unpublishedreport, Washington Department of Wildlife, Wildlife Management,Nongame, Olympia, Washington.Heinrichs, J. 1983. The winged snail darter. Journal of Forestry 81:212-214.Henderson, J. A. 1990. Trends in amount of old-growth <strong>for</strong>est <strong>for</strong> <strong>the</strong> last1000 years in western Oregon and Washington. Unpublishedreport. U.S. Forest Service.Hoberg, E. P., G. S. Miller, E. Wallner-Pendleton, and 0. R. Hedstrom.1989. Helminth parasites of nor<strong>the</strong>rn spotted owls (Strixoccidentals cauwna) from Oregon Journal ofWildlife Diseases25:246-251.Holling, C.S., ed. 1978. Adaptive environmental assessment andmanagement. John Wiley and Sons, New York, New York.Huff, M. H., D. A. Manual andJ. A. Putera. 1991. Winterbird communitiesin <strong>the</strong> sou<strong>the</strong>rn Washington Cascade Range. Pages 207-218In L.F. Ruggiero, K. B. Avory, A. B. Carey, and M. H. Huff, eds.Wildlife and vegetation of unmanaged Douglas-fir <strong>for</strong>ests.USDA Forest Service, Pacific Northwest Forest and RangeExperimental Station, General Technical Report PNW-GTR-285.Irwin, L. L., J. B. Buchanan, andT. L. Fleming. 1989a. 1989 spotted owlsurveys in wilderness areas of Wenatchee National Forest,North Cascades National Park, and Okanogan National Forest.Unpublished report, National Council of <strong>the</strong> PaperIndustry <strong>for</strong> Air and Stream Improvement, Corvallis, Oregon.Irwin, L. L., T. L. Fleming, S. M. Speich, and J. B. Buchanan. 1989b.<strong>Spotted</strong> owl presence in managed <strong>for</strong>ests of southwesternWashington. Unpublished report, National Council of <strong>the</strong>Paper Industry <strong>for</strong> Air and Stream Improvement, Corvallis,Oregon.Irwin, L. L., S. Self, and L. Smith. 1989b. Status of nor<strong>the</strong>rn spotted owlson managed <strong>for</strong>estlands in nor<strong>the</strong>rn Cali<strong>for</strong>nia. Unpublishedreport, Timber Association of Cali<strong>for</strong>nia, Sacramento, Cali<strong>for</strong>nia.Johnsgard, P. A. 1970. A summary of intergeneric New World quailhybrids, and a new intergeneric hybrid combination. Condor72:85-88.Johnsgard, P. A. 1988. North American owls: biology and natural history.Smithsonian Institution Press, Washington, D.C.238
Kerns, S. J. 1989. Occurrence of spotted owls in managed timber standson lands of <strong>the</strong> Pacific Lumber Company. Unpublished report,Wildland Resource Managers and Pacific Lumber Company,Scotia, Cali<strong>for</strong>nia.Kerns, S. J. 1989a. Occurrence of spotted owls in managed timber standson lands of<strong>the</strong> Pacific Lumber Company. Unpublished report.Wildland Resource Managers and Pacific Lumber Company,Scotia, Cali<strong>for</strong>nia.Kerns, S. J. 1989b. Occurrence of spotted owls in managed timber standson lands of<strong>the</strong> Pacific Lumber Company. Unpublished report.Wildland Resource Managers and Pacific Lumber Company,Scotia, Cali<strong>for</strong>nia.Konishi, M. 1973. How <strong>the</strong> owl tracks its prey. American Scientist 61:414-424.Kroodsma, D. E. 1982. Learning and <strong>the</strong> ontogeny of sound signals inbirds. Pages 1-23 In D. E. Kroodsman, ed. Acoustic communicationin birds. Academic Press, New York, NewYork.LaHaye, W. S. 1988. Nest site selection and nesting habitat of <strong>the</strong> nor<strong>the</strong>rnspotted owl (Strb< occtdentalis caurina) in northwestern Cali<strong>for</strong>nia.M.S. <strong>the</strong>sis, Humboldt State University, Arcata.Cali<strong>for</strong>nia.LaHaye, W. S., R. J. Gutierrez, and D. R. Call. In Press. Demography ofaninsularpopulation of spotted owls (Strixoccidentais). InD.McCullough and R. Barrett, eds. Wildlife 2001:populations,Elsevier Press, Essex, England.Lande, R. 1985. Report on <strong>the</strong> demography and survival of <strong>the</strong> nor<strong>the</strong>rnspotted owl. Unpublished report, Department of Biology,University of Chicago, Chicago, Illinois.Lande, R. 1988. Demographic models of <strong>the</strong> nor<strong>the</strong>rn spotted owl.Oecologia 75:601-607.Lamberson, R. H., and S. Brooks. 1991. An examination of <strong>the</strong> highdensity of nor<strong>the</strong>rn spotted owls in northwestern Cali<strong>for</strong>nia.Unpublished report, Department of Math, Humboldt StateUniversity, Arcata, Cali<strong>for</strong>nia.Lamberson, R. H., R. McKelvey, B. R. Noon, and C. Voss. In Press. Theeffects of varying dispersal capabilities on <strong>the</strong> populationdynamics of <strong>the</strong> nor<strong>the</strong>rn spotted owl. Conservation Biology.Laymon, S. D. 1988. The ecology of <strong>the</strong> spotted owl in <strong>the</strong> central SierraNevada, Cali<strong>for</strong>nia. Ph.D. <strong>the</strong>sis, University of Cali<strong>for</strong>nia,Berkeley, Cali<strong>for</strong>nia.Laymon, S. D. 1991. Diurnal <strong>for</strong>aging by spotted owls. Wilson Bulletin103:138-140.Lindstedt, S. L., B. J. Miller, and S. Buskirk. 1986. Home range, time, andbody size in mammals. Ecology 67:413-418.239
Lundquist, R. W. and J. M. Mariani. 1991. Nesting habitat andabundance of snag-dependent birds in <strong>the</strong> sou<strong>the</strong>rn WashingtonCascade Range. Pages 221-240 In L. F. Ruggiero, K.B. Auory, A. B. Carey, and M. H. Huff, eds. Wildlife andvegetation of unmanaged Douglas-fir <strong>for</strong>ests. USDA ForestService, Pacific Northwest Forest and Range ExperimentalStation, General Technical Report PNW-GTR-285.Lutz, D. W. 1992. Population ecology of <strong>the</strong> spotted owl in <strong>the</strong> centralSierra Nevada, Cali<strong>for</strong>nia. M.S. <strong>the</strong>sis, Humboldt StateUniversity, Arcata, Cali<strong>for</strong>nia.Marcot, B. G., and R. Holthausen. 1987. Analyzing population viabilityof <strong>the</strong> spotted owl in <strong>the</strong> Pacific Northwest. Transactions of <strong>the</strong>NorthAmericanWildlife Natural Resources Conference 52:333-347.Marshall, J. T. 1942. Food and habitat of <strong>the</strong> spotted owl. Condor 44:66-67.Marshall, J. T. 1957. Birds ofpine-oakwoodland in sou<strong>the</strong>mArizona andadjacent Mexico. Pacific Coast Avifauna 32:1-125.Martin, G. R. 1986. Sensory capacity and <strong>the</strong> nocturnal habitat of owls.Ibis 128:266-277.Max, T. A., R. A. Souter, and K. A. O'Halloran. 1990. Statistical estimators<strong>for</strong> monitoring spotted owls in Oregon and Washington.USDA Forest Service, Pacific Northwest Forest and RangeExperimental Station, Research Paper PNW-RP-420. Portland,Oregon.Mayr, E., and L. L. Short. 1970. Species taxa of North American Birds,a contribution to comparative systematics. Publications of <strong>the</strong>Nuttall Ornithology Club No. 9.Merriam, C. H. 1898. Symium occidentale caurinum, a new owl from <strong>the</strong>Puget Sound region. Auk 15:39-40.Meyer, J. S., L. L. Irwin, and M. S. Boyce. 1990. Influence of habitatfragmentation on spotted owl site selection, site occupancy,and reproduction on Bureau of Land Management lands inwestern Oregon. Unpublished report, National Council of <strong>the</strong>Paper Industry <strong>for</strong> Air and Stream Improvement, Incorporated,Corvallis, Oregon.Miller, G. S. 1989. Dispersal ofjuvenile nor<strong>the</strong>rn spotted owls in westernOregon. M.S. <strong>the</strong>sis, Oregon State University, Corvallis,Oregon.Miller, G. S., and E. C. Meslow. 1985. Dispersal data <strong>for</strong>juvenile spottedowls: <strong>the</strong> problem of small sample size. Pages 69-73 InGutierrez, R. J., and A. B. Carey, eds. Ecology and managementof spotted owls in <strong>the</strong> Pacific Northwest. USDA ForestService, Pacific Northwest Forest and Range ExperimentalStation, General Technical Report PNW-GTR- 185, Portland,Oregon.Miller, G. S., K. Nelson, and W. C. Wright. 1985. Two-year-old femalespotted owl breeds successfully. Western Birds. 16:69-73.240
Moen, C., A. B. Franklin, and R. J. Gutierrez. 1991. Age determinationin nor<strong>the</strong>rn spotted owls. Wildlife Society Bulletin 19:489-493.Morrison, P. H. 1990. Ancient <strong>for</strong>est on <strong>the</strong> Olympic National Forest-Analysis from a historical and landscape perspective. TheWilderness Society, Seattle, Washington.Morton, E. S. 1975. Ecological sources of selection on avian sounds.American Naturalist 109:17-34.Mulder, B.S., J. A. Bottorff, S.M. Chambers, J.J. Dowhan, A. Farmer, K.Franzreb, J. F. Gore, E. C. Meslow, J. D. Nichols, M. Scott, M.L. Shaffer, and S. R. Wilbur. 1989. The nor<strong>the</strong>rn spotted owl:A Status review supplement. USDI Fish and Wildlife Service,Region 1, Portland, Oregon.Muller; H. C. 1986. The evolution of reversed sexual dimorphism in owls:an empirical analysis of possible selective factors. WilsonBulletin 98:387-406.Murphy, D.D., and B. R. Noon. In Press. Integrating scientific methodswith habitat conservation planning: reserve design <strong>for</strong> <strong>the</strong>nor<strong>the</strong>rn spotted owl. Ecological Applications.Nehlsen, W., J. E. Williams, and J. A. Lichatowich. 1991. Pacific salmonat <strong>the</strong> crossroads: stocks at risk in Cali<strong>for</strong>nia, Oregon, Idaho,and Washington. Fisheries 16:4-2 1.Nelson, E. W. 1903. Descriptions of new birds from sou<strong>the</strong>rn Mexico.Proceedings of Biological Society Washington 16:151-159.Nelson, S. K. 1989. Habitat use and densities of cavity-nesting birds in<strong>the</strong> Oregon Coast Ranges. M.S. <strong>the</strong>sis. Oregon State University,Corvallis, Oregon.Nero, R. W. 1980. The great gray owl: phantom of <strong>the</strong> nor<strong>the</strong>rn <strong>for</strong>est.Smithsonian Institution Press, Washington, D.C.Nero, R. W., R. J. Clark, R. J. Knapton, and R. H. Hamre, eds. 1987.Biology and conservation of nor<strong>the</strong>rn <strong>for</strong>est owls. USDAForest Service, Rocky Mountain Forest and Range ExperimentalStation, General Technical Report RM-GTR- 142, FortCollins, Colorado.Noon, B. R., and C. M. Biles. 1990. Ma<strong>the</strong>matical demography of spottedowls in <strong>the</strong> Pacific Northwest. Journal ofWildlife Management54:18-27.Oberholser, H. C. 1915. Critical notes on <strong>the</strong> subspecies of <strong>the</strong> spottedowl, Strix occidentalts (Xantus). Proceedings of <strong>the</strong> U.S.National Museum 49:251-257.ODFW (Oregon Department of Fish and Wildlife). 1991. <strong>Spotted</strong> owldatabase. Oregon Department of Fish and Wildlife, Salem,Oregon.241
O'Halloran, K. 1989. <strong>Spotted</strong> owl inventory and monitoring: Annualreport <strong>for</strong> 1989. Unpublished report, USDA Forest Service,Pacific Northwest Region, Portland, Oregon.Old-growth Definition Task Group. 1986. Interim definitions <strong>for</strong> oldgrowthDouglas-fir and mixed-conifer <strong>for</strong>ests in <strong>the</strong> PacificNorthwest and Cali<strong>for</strong>nia. USDA Forest Service, PacificNorthwest Forest and Range Experimental Station, ResearchNote PNW-447, Portland, Oregon.Paton, P. W. C., C. J. Zabel, B. Bingham, H. Sakai, and C. Ogden. 1990.Examination of home range size and habitat use of <strong>the</strong> spottedowl in <strong>the</strong> Klamath Province. Unpublished report, USDAForest Service, Pacific Southwest Forest and Range ExperimentalStation, Arcata, Cali<strong>for</strong>nia.Paton, P. W. C., C. J. Zabel, D. L. Neal, G. N. Steger, N. G. Tilghman, andB. R. Noon. 1991. Effects of radio tags on spotted owls.Journal of Wildlife Management 55:617-622.Payne, R. S. 1971. Acoustic location of prey by barn owls (Tyto alba).Journal of Experimental Biology 54:535-573.Peek, J. M. 1986. A review of wildlife management. Prentice-Hall,Englewood Cliffs, New Jersey.Pious, M.1989. The nor<strong>the</strong>rn spotted owl in second-growth <strong>for</strong>ests ofMendocino County, Cali<strong>for</strong>nia. Unpublished report, LouisianaPacific and Georgia Pacific Corporations. Samoa, Cali<strong>for</strong>nia.Randi, E., G. Fusco, R. Lorenzini, and F. Spina. 1991. Allorzymedivergence and pylogenetic relationships within <strong>the</strong>strigi<strong>for</strong>mes. Condor 93:295-301.Reich, R. M. 1991. Statistical review of <strong>the</strong> 1990 status review of <strong>the</strong>nor<strong>the</strong>rn spotted owl, StruK occidentalis caurina TechnicalBulletin 91-10. American Forest Resources Alliance, Washington,D.C.Richards, J. E. 1989. <strong>Spotted</strong> owl food habits and prey availability on <strong>the</strong>east slope of <strong>the</strong> Washington Cascades. M.S. <strong>the</strong>sis, ColoradoState University, Ft. Collins, Colorado.Ripple, W. J., D. H. Johnson, K. T. Hershey, and E. C. Meslow. 1990.Forest fragmentation near spotted owl nest sites in westernOregon. Unpublished report, Oregon Cooperative WildlifeResearch Unit, Oregon State University, Corvallis, Oregon.Ripple, W. J., D. H. Johnson, K. T. Hershey, and E. C. Meslow. 1991. Oldgrowthand mature <strong>for</strong>ests near spotted owl nests in westernOregon. Journal of Wildlife Management 55:316-318.Ruggiero, L.F., K.B.Aubry,A.B. Carey, andM.H. Huff. 1991. Wildlifeandvegetation of unmanaged Douglas-fir <strong>for</strong>ests. USDA ForestService, Pacific Northwest Forest and Range ExperimentalStation, General Technical Report PNW-GTR-285.242
Ruggiero, L. F., K. B. Aubry, R. S. Holthausen, J. W. Thomas, B. G. Marcot,and E. C. Meslow. 1988. Ecological dependency: <strong>the</strong> conceptand its implications <strong>for</strong> research and management. Transactionsof <strong>the</strong> North American Wildlife and Natural ResourcesConference 53:115-126.Rusch, D. H., E. C. Meslow, P. D. Doerr, and L. B. Keith. 1972. Responseof great homed owl populations to changing prey densities.Journal of Wildlife Management 36:282-296.Saurola, P. 1989. Ural <strong>Owl</strong>. Pages 327-345. In 1. Newton, ed. Lifetimereproductive success in birds. Academic Press, London.Schoener, T. 1969. Sizes of feeding territories among birds. Ecology49:123-141.Shaffer, M.1985. The metapopulation and species conservation: <strong>the</strong>special case of <strong>the</strong> nor<strong>the</strong>rn spotted owl. Pages 86-99 In R. J.Gutierrez and A. B. Carey, eds. Ecology and management of<strong>the</strong> spotted owl in <strong>the</strong> Pacific Northwest. USDA Forest Service,Pacific Northwest Forest and Range Experimental Station,General Technical Report PNW-GTR- 185, Portland, Oregon.Shaffer, M. 1987. Minimum viable populations: coping with uncertainty.Pages 68-86 In M. Soule ed. Viable populations <strong>for</strong> conservation.Cambridge University Press, Cambridge, Great Britain.Sheriff, S. L. 1991. Statistical review of <strong>the</strong> 1990 status review: nor<strong>the</strong>rnspotted owl. Technical Bulletin 91-08, American ForestResource Alliance, Washington, D.C.Short, L. L. 1965. Hybridizationin<strong>the</strong> flickers (Colaptes) of NorthAmerica.Bulletin American Museum Natural History 129:309-428.Short, L. L. 1972. Hybridization, taxonomy and avian evolution. Annalsof <strong>the</strong> Missouri Botanical Gardens 59:447-453.Sibley, G. C., J. E. Ahlquist, and B. L. Monroe. 1988. A classification of<strong>the</strong> living birds of <strong>the</strong> world based on DNA-DNA hybridizationstudies. Auk 105:409-423.Simberloff, D. 1987. The spotted owl fracas: mixing academic, applied,and political ecology. Ecology 68:766-772.Simon-Jackson, T. 1989. <strong>Spotted</strong> owl inventory and monitoring program:Annual Report <strong>for</strong> 1989. Unpublished report, USDA ForestService, Pacific Southwest Region, San Francisco, Cali<strong>for</strong>nia.Sisco, C. L. 1990. Seasonal home range and habitat ecology of spottedowls in northwestern Cali<strong>for</strong>nia. M.S. <strong>the</strong>sis, Humboldt StateUniversity, Arcata, Cali<strong>for</strong>nia.Sisco, C., and R. J. Gutierrez. 1984. Winter ecology of radio-taggedspotted owls on Six Rivers National Forest, Humboldt County,Cali<strong>for</strong>nia. Unpublished report, Six Rivers National Forest,Eureka, Cali<strong>for</strong>nia.Smith, J. B. 1990. From global to regional climate change: relativeknowns and unknowns about global warming. Fisheries15(6):2-6.243
Solis, D. M. 1980. Habitat use by nor<strong>the</strong>rn spotted owls. Unpublishedreport. Six Rivers National Forest, Eureka, Cali<strong>for</strong>niaSolis, D. M. 1983. Summer habitat ecology of spotted owls in northwesternCali<strong>for</strong>nia. M.S. <strong>the</strong>sis, Humboldt State University,Arcata, Cali<strong>for</strong>nia.Solis, D. M. and R. J. Gutierrez. 1990. Summer habitat ecology of spottedowls in northwestern Cali<strong>for</strong>nia. Condor 92:739-748.Sonerud, D. M., R. Solhein, and K. Prestrud. 1988. Dispersal ofTengmalm's <strong>Owl</strong> Aegoliusfiunereus in relation to prey availabilityand nesting success. Ornis Scandinavica 19:175-181.Sou<strong>the</strong>rn, H. N. 1970. The natural control of a population of tawny owls(Strix aluco). Journal of Zoology 162:197-285.SOW (<strong>Spotted</strong> <strong>Owl</strong> Subgroup). 1991. A multi-resource strategy <strong>for</strong>conservation of <strong>the</strong> nor<strong>the</strong>rn spotted owl. Unpublishedreport, <strong>Spotted</strong> <strong>Owl</strong> Subgroup, National Forest ProductsAssociation and American Forestry Council, Washington,D.C.Spies, T. A. and J. F. Franklin. 1991. The structure of natural young,mature, and old-growth Douglas-fir <strong>for</strong>ests in Oregon andWashington. Pages 91-121 In L.F. Ruggiero, K. B. Auory, A.B. Carey, and M. H. Huff. 1991. Wildlife and vegetation ofunmanaged Douglas-fir <strong>for</strong>ests. USDA Forest Service, PacificNorthwest Forest and Range Experimental Station, GeneralTechnical Report PNW-GTR-285, Portland, Oregon.Spies, T. A., J. F. Franklin, and T. B. Thomas. 1988. Coarsewoody debrisin Douglas-fir <strong>for</strong>ests of western Oregon and Washington.Ecology 69:1689-1702.Taylor, A. L., and E. D. Forsman. 1976. Recent range expansion of <strong>the</strong>barred owl in western North America, including <strong>the</strong> firstrecords <strong>for</strong> Oregon. Condor 78:560-561.Teensma, P. D. A., J. T. Rienstra and M. A. Yelter. 1991. Preliminaryreconstruction and analysis of change in <strong>for</strong>est stand ageclasses of <strong>the</strong> Oregon Coast Range from 1850 to 1940. USDIBureau of Land Management, Oregon State Office, Technicalnote T/N OR-9, Portland, Oregon.Thomas, J. W., E. D. Forsman, J. B. Lint, E. C. Meslow, B. R Noon, andJ. Verner. 1990. A conservation strategy <strong>for</strong> <strong>the</strong> nor<strong>the</strong>rnspotted owl. Interagency Scientific Committee to Address <strong>the</strong>Conservation of <strong>the</strong> Nor<strong>the</strong>m <strong>Spotted</strong> <strong>Owl</strong>. USDA ForestService, USDI Bureau of Land Management, Fish and WildlifeService, and National Park Service. Portland, Oregon. U.S.Government Printing Office 791-171/20026, Washington,D.C.Thrailkill, J. A., and E. C. Meslow. 1990. Home range size and habitatutilization of nor<strong>the</strong>rn spotted owls in <strong>the</strong> Wolf Creek Studyarea, Eugene BLM District, Oregon. Unpublished report.Oregon Cooperative Wildlife Research Unit, Oregon StateUniversity, Corvallis, Oregon.244
Thrailkill, J., and M. A. Bias. 1989. Diet of breeding and nonbreedingCali<strong>for</strong>nia spotted owls. Journal of Raptor Research 23:39-41.USDA. 1984a. Regional guide <strong>for</strong> <strong>the</strong> Pacific Northwest Region (40 CFR1506.4). USDA Forest Service, Pacific Northwest Region,Portland, Oregon.USDA. 1984b. Regional guide <strong>for</strong> <strong>the</strong> Pacific Southwest Region (40 CFR1506.4). USDA Forest Service. Pacific Southwest Region, SanFrancisco, Cali<strong>for</strong>nia.USDA. 1988. Final supplement to <strong>the</strong> environmental impact statement<strong>for</strong> an amendment to <strong>the</strong> Pacific Northwest regional guide. 2Volumes. USDA Forest Service, Portland, Oregon.USDA. 1991. Draft environmental impact statement on management <strong>for</strong><strong>the</strong> nor<strong>the</strong>rn spotted owl in <strong>the</strong> national <strong>for</strong>ests. USDA ForestService, Portland, Oregon.USDI. 1990. Endangered and threatened wildlife and plants; determinationof threatened status <strong>for</strong> <strong>the</strong> nor<strong>the</strong>rn spotted owl. FederalRegister 55:26114-26194.USDI. 199 la. Response to draft USFS Environmental Impact Statement.USDI Fish and Wildlife Service, Portland, Oregon.Van Home, B. 1983. Density as a misleading indicator of habitat quality.Journal of Wildlife Management 47:893-901.Vincent, R. E. 1990. The extension of <strong>the</strong> range of <strong>the</strong> barred owl intoOregon and potential <strong>for</strong> interaction with <strong>the</strong> spotted owl.Unpublished report, Association of 0 and C Counties, Salem,Oregon.Walters, C. J. 1986. Adaptive management of renewable resources.MacMillan Publishing Company, New York.Ward, J. P.1990. <strong>Spotted</strong> owl reproduction and prey abundance innorthwest Cali<strong>for</strong>nia. M.S. <strong>the</strong>sis, Humboldt State University,Arcata, Cali<strong>for</strong>nia.Ward, J. P., A. B. Franklin, and R. J. Gutierrez. 1991. Using search timeand regression to estimate abundance of territorial spottedowls. Ecological Applications 1:207-214.WDW (Washington Department of Wildlife). 1991. Nongame DataSystems, Interagency <strong>Spotted</strong> <strong>Owl</strong> Database, Olympia, Washington.Wiens, J. A. 1989. The ecology of bird communities, Vol. 2. CambridgeStudies in Ecology. Cambridge University Press, New York.Xantus, J. 1859. Catalogue of birds collected in <strong>the</strong> vicinity of FortTejon,Cali<strong>for</strong>nia with a description of a new species of SymiumnProceedings of <strong>the</strong> Philadelphia Academy of Natural Science.245
Young, K. D., A. B. Franklin, and J. P. Ward. 1991. Infestations ofnor<strong>the</strong>rn spotted owls by Hippoboscid flies in northwesternCali<strong>for</strong>nia. Unpublished report.Zabel, C. J., B. B. Bingham, K. McKelvey, and B. R. Noon. 1991. Homerange size and habitat use patterns of nor<strong>the</strong>rn spotted owlsin northwestern Cali<strong>for</strong>nia and southwestern Oregon. Unpublishedreport, Pacific Southwest Forest and Range ExperimentalStation, Arcata, Cali<strong>for</strong>nia.246
Appendix ARecommendations <strong>for</strong>Population MonitoringJonathan Bart and Douglas S. Robson247
248
6tZ6LZ palls anlWJollISL.Z. suoTsnlouoJLz ............ suue Apnjs aiqduiounp z~ljo aloubLZ .......................................... sotpnls Jaqjo£Z ... sapnslll'4TOuusLILZ .sKAons ap!spBo169Z ............................ umjlfojd WiuljojTuow QAjsuaqalduuoz) V89Z ............ spoqllU W OA!SUOul dAlOOV9Z. suofsnl[ouon09% .............. lp XZAxns prjq WUjpZaYDLS?.Z ........... Suo.le.n.uls naonduuoo9............................ siuatuaunbat zjs aldiues.. .Ze... id Wuiduws aoq4 uWIsouz z .......................................................... .sAa mnS ap speoISZ..................................4UD ..UOTqnpo lul19Z ~ ~ ~ ~ ~ ~ ................................................... ~ ~ ~ paiqs u ~ o
250
AbstractIntroductionThis appendix discusses methods <strong>for</strong> estimating or predicting populationtrends. Four approaches are discussed: roadside surveys of territorial birds,demographic analyses, population projections, and two "early warning" methods.Strengths, weaknesses, and requirements of each approach are discussed.The overall monitoring ef<strong>for</strong>t could be divided into five programs: 1)roadside surveys, 2) monitoring of activity sites, 3) transmitter studies, 4) o<strong>the</strong>rstudies, and 5) coordination. Computer simulations and analyses of data from<strong>the</strong> Fish and Wildlife Service Breeding Bird Survey both suggest that a minimumof 8 years, and probably at least 10 years, of survey data probably will berequired to obtain reliable estimates of long-term population trends. Delisting<strong>the</strong>re<strong>for</strong>e should not be considered until at least 8 years of survey data havebeen collected. Preliminary estimates of sample size requirements suggest thatan adequate sample of <strong>the</strong> roadside surveys could be obtained with less than 1person-year of ef<strong>for</strong>t per state, and that approximately 5 person-years per statemight be an appropriate level of ef<strong>for</strong>t <strong>for</strong> <strong>the</strong> program to monitor activity sites.These estimates do not include <strong>the</strong> costs of monitoring remote areas in wildernessesand national parks or continuation of <strong>the</strong> density studies, although<strong>the</strong>se ef<strong>for</strong>ts are regarded as essential if <strong>the</strong> monitoring ef<strong>for</strong>t is to succeed.The program to monitor activity sites probably can be reduced or terminatedafter several years. The estimates in this appendix will need review andrefinement, and are intended mainly as an incentive <strong>for</strong> fur<strong>the</strong>r discussion andto provide reassurance that <strong>the</strong> monitoring program can be carried out at areasonable cost.The sections in <strong>the</strong> body of <strong>the</strong> recovery plan on delisting criteria (section III.A.)and research and monitoring (section III.C.6.) identify many questions whichshould be addressed during <strong>the</strong> next several years. For example, more shouldbe learned about what habitats, and how much of each, should be maintainedin DCAs; proposals <strong>for</strong> modifying <strong>the</strong> recovery plan should be <strong>for</strong>mulated andevaluated; and, at some time in <strong>the</strong> future, consideration should be given todelisting <strong>the</strong> nor<strong>the</strong>rn spotted owl. In most of <strong>the</strong>se issues, a need exists ei<strong>the</strong>r1) to estimate population trends, 2) to compare population trends in differentenvironments, or, 3) to understand <strong>the</strong> factors that determine populationtrends. For some objectives, primary attention may be given to a single determinantof population trend (e.g., predation rates, productivity), but <strong>the</strong> overallgoal of <strong>the</strong> recovery ef<strong>for</strong>t is to identify conditions under which owls will have ahigh probability of persisting, and predictions about persistence are difficult tomake when only one factor that determines trends has been studied. Thus,monitoring or predicting population trends is one of <strong>the</strong> most fundamentalobjectives in <strong>the</strong> recovery plan.This appendix discusses ways to estimate or predict population trends. Fourgeneral approaches are distinguished (Table A. 1). First, roadside surveysinvolve counts of territorial birds present in an area. An index (e.g., call count)method may be used to estimate trends, or surveyors may attempt to find allterritorial birds in a study area in which case absolute densities and trends ofterritorial birds can be estimated. Second, measurement of demographic ratesinvolves estimating birth, death, and movement rates. Losses (deaths, emigrants)and gains (births, immigrants) are <strong>the</strong>n estimated and compared toinfer how <strong>the</strong> number of birds changed during <strong>the</strong> study period. This methodpermits inferences about trends in <strong>the</strong> total population, including nonterritorialindividuals. Third, population projections involve finding secondary factors,such as habitat parameters, that can be measured and used to predict demo-251
Table A.1. General approaches <strong>for</strong> estimating or predicting population trends.1. Counts of territorial birdsa. Trends in abundanceb. Absolute abundance2. Measurement of demographic ratesa. Territorial birdsb. Nonterritorial birds3. Population projections4. Early warning methodsa. Age ratios among first-time territory holdersb. Replacement times <strong>for</strong> territorial birdsRoadside Surveysgraphic rates and population trends. Development of this approach couldhelp researchers predict <strong>the</strong> effects of particular management strategies andmight reduce <strong>the</strong> cost of monitoring populations by using habitat variables as apartial substitute <strong>for</strong> owl population variables. Fourth, two miscellaneous'early waming" methods <strong>for</strong> detecting a change in <strong>the</strong> number of territorialbirds are described in this appendix. Nei<strong>the</strong>r method permits estimation oftrends, but <strong>the</strong> data required could be collected relatively easily and wouldprovide advance warning of imminent population declines in areas not wellsurveyed by <strong>the</strong> more sophisticated methods.In <strong>the</strong> later sections, we describe each approach including its strengths andweaknesses and key research or design topics that should be investigated indeveloping <strong>the</strong> approach. We <strong>the</strong>n identify overlap in <strong>the</strong> data needed <strong>for</strong> eachapproach and use this analysis as a basis <strong>for</strong> suggesting that <strong>the</strong> monitoringef<strong>for</strong>t be divided into five programs. In a final section we provide preliminarysample size guidelines and estimate <strong>the</strong> amount of time needed be<strong>for</strong>e delistingshould be considered.We appreciate <strong>the</strong> help of <strong>the</strong> FWS Breeding Bird Survey program in providingdata on short notice. Earlier drafts of this appendix were reviewed by RobertAnthony, R. J. Gutierrez, Jesefa O'Malley, Edward Starkey, and Jerry Verner.One way to monitor owl populations is by counting all <strong>the</strong> owls in an area, orby using some of type of index method that, while not revealing actual abundance,provides a reliable estimate of trends in abundance. We refer to <strong>the</strong>seas roadside surveys, although counts might actually be made from trails rathrthan roads. <strong>Owl</strong> surveys routinely are made by nighttime or daytime calls.Un<strong>for</strong>tunately, nonterritorial birds seldom respond to <strong>the</strong> calls, thus thismethod only monitors <strong>the</strong> territorial population. Concern exists, that <strong>the</strong>overall population might be changing, and in particular that it might bedeclining, but territorial birds that died might be quickly replaced bynonterritorial birds. As a result, <strong>the</strong>re might be little or no change in <strong>the</strong>252
number of territorial birds even though <strong>the</strong> overall population was declining.Eventually, of course, <strong>the</strong> nonterritorial population would disappear and <strong>the</strong>territorial population would begin declining, but <strong>the</strong> true population declinecould be masked <strong>for</strong> many years if only territorial birds were being surveyed(Franklin In Press).Upper limits exist on <strong>the</strong> proportion of all birds that can be nonterritorial. Theproportion is higher with high fecundity and juvenile survivorship. To investigatethis issue, we prepared a computer simulation in which <strong>the</strong> demographicrates could be varied, and <strong>the</strong> nonterritorial population was allowed to reachequilibrium levels. With productivity (defined as number of female fledglingsproduced per territorial female per year) of 0.4, and survival rates of 70 percentin <strong>the</strong> first year and 90 percent <strong>the</strong>reafter, <strong>the</strong> model predicts populationstability when about two-thirds of <strong>the</strong> individuals are floaters. With lowersurvival or productivity rates, <strong>the</strong> proportion is smaller. For example, withfirst-year productivity of 0.25, subsequent productivity of 0.35, first-yearsurvival of 50 percent, second-year survival of 80 percent, and subsequentsurvivorship of 90 percent, <strong>the</strong> model predicts stability when about one-third of<strong>the</strong> individuals are nonterritorial.Suppose that 60 percent of <strong>the</strong> owls in a population were floaters (i.e.,nonterritorial), and <strong>the</strong> overall population began declining. If floaters immediatelyfilled all vacancies in territories, <strong>the</strong>n <strong>the</strong> population would decline by 60percent be<strong>for</strong>e any decline in <strong>the</strong> territorial population occurred. Even withra<strong>the</strong>r sharp, and perhaps irreversible, declines, an overall decline in populationsize of 60 percent would take many years. For example, if <strong>the</strong> populationdeclined 5 percent per year, <strong>the</strong>n 18 years would be required be<strong>for</strong>e <strong>the</strong> territorialpopulation began declining. This example, while extreme, indicates <strong>the</strong>pitfalls of basing conclusions about population trends solely on programs thatmonitor <strong>the</strong> territorial population.Despite <strong>the</strong>se problems, surveying territorial birds is an important componentof a monitoring program <strong>for</strong> several reasons. First, if declines in <strong>the</strong> territorialpopulation occur, <strong>the</strong>n we can be reasonably certain that <strong>the</strong> overall populationis declining. Thus, decline of <strong>the</strong> territorial population does provide evidenceof an overall decline even though <strong>the</strong> obverse is not true. Second, whileit is possible that replacement of vacancies in territories by floaters might maska population decline, this would only occur if floaters search <strong>for</strong> vacancies overa ra<strong>the</strong>r wide area. For example, if each nonterritorial bird fills any vacancy ina three-territory area, <strong>the</strong>n if <strong>the</strong> population declines, some vacancies soon willbegin to occur in areas where no nonterritorial birds of <strong>the</strong> same sex arepresent. Thus, <strong>the</strong> territorial population will decline, though at a slower ratethan <strong>the</strong> overall decline. Third, this hypo<strong>the</strong>tical problem caused by floatersonly occurs if a substantial floater population exists: many areas may haveonly a few floaters, in which case surveys of territorial birds might faithfullyreflect population trends. For <strong>the</strong>se reasons, surveying territorial birds shouldbe an important component of <strong>the</strong> monitoring program <strong>for</strong> spotted owls, eventhough it should not be <strong>the</strong> only method used to estimate trends.Design of <strong>the</strong> sampling programSeveral issues must be considered in designing <strong>the</strong> roadside survey program.We discuss some of <strong>the</strong>se in this section. Throughout, we assume <strong>the</strong> purposeis to estimate trends in <strong>the</strong> territorial population, roughly defined as thosebirds that respond (or might respond) to owl calls.An initial issue is whe<strong>the</strong>r <strong>the</strong> survey should be designed to provide census orindex data. One possible design involves saturating each of several areas withsurvey stations and visiting each one many times, <strong>the</strong>reby obtaining a nearly253
complete count of <strong>the</strong> territorial birds within <strong>the</strong> study area. The results mightbe thought of as "plot-type data" because within each study area all, or nearlyall birds, are detected. Alternatively, "index methods" might be used in whichno attempt was made to count all birds in any area. Results would be expressedas birds recorded per station or some o<strong>the</strong>r measure of ef<strong>for</strong>t, andinvestigators would assume that this measure had an approximately constantrelationship to true density in <strong>the</strong> surveyed area. Under this assumption,changes in <strong>the</strong> index reflect changes in <strong>the</strong> population being surveyed. Thoroughsurveys give data less susceptible to substantial bias, but cost muchmore to collect. Index data are far less expensive to collect but may give biasedestimates of temporal trends if detection rates change through time. Manyareas, several of considerable size, probably will be searched thoroughly <strong>for</strong>territorial birds each year regardless of whe<strong>the</strong>r index or plot-type methods areused in <strong>the</strong> monitoring program. These data provides a basis <strong>for</strong> "calibrating"<strong>the</strong> index data by using a technique known as double-sampling. We describethis method below.A double-sampling approach <strong>for</strong> monitoring territorial spotted owls mightproceed as follows. First, areas to be searched thoroughly would be selectedand delineated on maps. The main criterion <strong>for</strong> selecting <strong>the</strong>se areas would beavailability of surveyors willing to search <strong>the</strong> areas thoroughly (defined, <strong>for</strong>example, as searching to protocol). The areas could be large (e.g., demographicstudy areas) or small (e.g., single patches of old-growth) and would not have tobe selected randomly, though random selection might be advantageous insome cases. Presence of a spotted owl within <strong>the</strong> area would be defined asoccurring when <strong>the</strong> bird's activity center was within <strong>the</strong> thoroughly searchedarea. The assumption would be made that such searches constituted censusesof <strong>the</strong> territorial birds in <strong>the</strong> areas. The results would provide "truedensities" <strong>for</strong> each area. Of course, in reality some owls would be missed, butsuch errors would have little effect on <strong>the</strong> estimate of trend if fewer than 10percent of <strong>the</strong> birds were missed and this figure did not vary greatly amongyears. The thoroughly searched areas would be regarded as one stratum.The next step in developing <strong>the</strong> program would be <strong>the</strong> delineation of additionalstrata. Strata could be defined to include DCAs and o<strong>the</strong>r high-interest areas,areas in which density is anticipated to be high, areas in which density isanticipated to be low, etc. The strata would not have to be contiguous; thusone stratum might consist of all <strong>the</strong> areas dominated by old-growth, ano<strong>the</strong>rstratum might consist of all <strong>the</strong> areas with moderate amounts of old-growth,and so on.Survey routes <strong>the</strong>n would be selected using a well-defined random selectionplan. For example, starting points <strong>for</strong> routes could be selected randomly and<strong>the</strong>n <strong>the</strong> route could be laid out following predetermined rules. Efficiency (e.g.,precision <strong>for</strong> a given amount of labor) would be maximized by (a) maximizing<strong>the</strong> number of different stations visited, and within this constraint, (bM maximizing<strong>the</strong> number of owls recorded. These principles suggest that eachstation should be visited at most once a year and that surveys should beconducted at a time and in a way that maximizes <strong>the</strong> number of owls recordedper hour of surveyor ef<strong>for</strong>t. Sampling intensity could vary among <strong>the</strong>se strataso that more stations were located within areas of high interest, easy access, orhigh density. Sampling intensity in <strong>the</strong>se strata could be detennined subjectively,or <strong>the</strong>y could be determined with <strong>for</strong>mulas <strong>for</strong> maximizing statisticalefficiency.Each year, some or all of <strong>the</strong> randomly selected routes in <strong>the</strong>se aditional stratawould be visited and a random selection of stations (or routes) would be visiteda single time in <strong>the</strong> censused stratum. Subsequent work would reveal <strong>the</strong>actual densities in <strong>the</strong> thoroughly searched areas, and <strong>the</strong>se densities would254
e used to calculate <strong>the</strong> ratio (result with <strong>the</strong> rapid method/actual density).This ratio <strong>the</strong>n would be used to 'calibrate" <strong>the</strong> index. One problem with thisapproach is that in double-sampling methods, <strong>the</strong> sample of sites searchedthoroughly is usually a random sample from <strong>the</strong> entire population. Thispermits unbiased estimation of actual densities. In <strong>the</strong> case of spotted owls,<strong>the</strong> thoroughly searched areas have not been randomly selected. This may notcause serious problems, and even if problems do arise various ways can befound <strong>for</strong> resolving <strong>the</strong>m. The issue, however, needs to be addressed be<strong>for</strong>e <strong>the</strong>final design is determined.Ano<strong>the</strong>r design question is whe<strong>the</strong>r all routes should be visited every year orwhe<strong>the</strong>r some of <strong>the</strong> routes should be visited less frequently to increase <strong>the</strong>total number of routes included in <strong>the</strong> monitoring program. Visiting some of<strong>the</strong> routes less frequently than each year may be useful when <strong>the</strong> trend issmall and when high within-site autocorrelation in successive years exists. Anillustration of <strong>the</strong> design is shown in Table A.2 where some of <strong>the</strong> sites arevisited only every third year while o<strong>the</strong>rs are visited annually; such a designfalls into <strong>the</strong> class known as "lattice sampling designs' (Yates 1960).Formulas to estimate variance are available <strong>for</strong> <strong>the</strong>se designs, and preliminaryexploration of <strong>the</strong>ir implications <strong>for</strong> <strong>the</strong> roadside surveys suggests that <strong>the</strong>sedesigns offer improved precision in trend estimation, and power in testing <strong>for</strong>trends, when compared to <strong>the</strong> design in which every site is visited every year.For example, in one simulation, a population declining at an annual rate of 3.4percent was surveyed <strong>for</strong> 8 years. The simulation reports <strong>the</strong> probability ofdetecting this negative trend (i.e., power) with different numbers of stationsvisited per year and with different proportions of <strong>the</strong> stations visited only everyfourth year. The results (Table A.3) showed that power increased as <strong>the</strong> numberof stations visited only every fourth year increased. With 600 stationsvisited per year, power was 66 percent when all stations were visited each yearand increased to 75 percent when all stations were visited every fourth year.The potential value of <strong>the</strong> lattice design is also evident by comparing samplesizes required to achieve a given level of power. For example, power was about<strong>the</strong> same with 800 stations, all visited on a 4-year schedule, as with 1,000stations all visited each year. Thus, <strong>the</strong> lattice design, in this case, wouldpermit a 20 percent reduction in <strong>the</strong> number of stations surveyed per yearwithout any loss in power to detect <strong>the</strong> trend. Note, however, that <strong>the</strong> latticedesign in this case would require <strong>the</strong> identification of 3,200 stations, ra<strong>the</strong>rthan <strong>the</strong> 1,000 stations needed if all stations were visited each year.The relative efficiency of <strong>the</strong> lattice design was even greater with longer surveyintervals. For example, in ano<strong>the</strong>r simulation involving a 12-year surveyinterval <strong>for</strong> a population declining at an annual rate of 3.7 percent, 1,000Table A.2. Example of a lattice design in which four sets of routes are visited eachyear, one annually and <strong>the</strong> rest every third year.Set 1 2 3 4 5 6 7 8 9 10 11 121 X X X X X X X X X X X X2 X X X X3 X X X X
Table A.3. Powera <strong>for</strong> various designs of <strong>the</strong> roadside surveys.Number ofStationsProportion of Stations Surveyed Every Fourth YearbSurveyedper Year 0.00 0.20 0.40 0.60 0.80 1.00200 0.32 0.33 0.34 0.35 0.37 0.38400 0.51 0.53 0.54 0.56 0.58 0.60600 0.66 0.68 0.69 0.71 0.73 0.75800 0.77 0.78 0.80 0.81 0.83 0.851,000 0.84 0.86 0.87 0.88 0.90 0.91probability of detecting <strong>the</strong> trend. In <strong>the</strong>se simulations, <strong>the</strong> average proportional cThe change in <strong>the</strong> population was -3.4 percent per year.9 The remaining stations were surveyed every year., .... ... .. .. ................ ............ ~~~~~~~~~~~~~~~~~~......... ...........256stations were required <strong>for</strong> 80 percent power when all stations were visited eachyear, but only 370 stations were required <strong>for</strong> <strong>the</strong> same power when all stationswere visited at 4-year intervals. The lattice design thus requires that moreroutes be selected, but permits a smaller number to be surveyed in each year(to achieve a given power) than a design in which each route is surveyed eachyear.The decision on whe<strong>the</strong>r to adopt a lattice design can be postponed until <strong>the</strong>second year of monitoring. At that time, a decision must be made to revisitevery route surveyed in <strong>the</strong> first year or to temporarily drop some routes andintroduce a corresponding set of new routes. If <strong>the</strong> new set were spatiallyinterpenetrating with those that were dropped, <strong>the</strong>n <strong>the</strong> logistics of <strong>the</strong> programwould not be compromised by this tactic and <strong>the</strong> geographic dispersionof <strong>the</strong> sample would remain essentially <strong>the</strong> same. (Such a spatially interpenetratingdesign on a 4-year cycle is being implemented by <strong>the</strong> U.S. EnvironmentalProtection Agency in its newly instituted Environmental Monitoring andAssessment Program, EMAP.)Sample size requirementsSample size includes <strong>the</strong> number of stations (or routes) monitored per year and<strong>the</strong> number of years during which monitoring continues. Many factors affectsample size requirements. Among <strong>the</strong> most important are <strong>the</strong> sampling designused to collect <strong>the</strong> data, <strong>the</strong> desired level of precision or power, and <strong>the</strong> degreeto which <strong>the</strong> true trend con<strong>for</strong>ms to <strong>the</strong> statistical (e.g., linear) model. Atpresent, many of <strong>the</strong> factors needed to estimate sample size requirements <strong>for</strong><strong>the</strong> roadside survey method are unknown. As a result, our analyses arepreliminary and undoubtedly will be altered as more in<strong>for</strong>mation is obtained.Despite <strong>the</strong>se problems, <strong>the</strong> analyses provide an indication of approximatesample size requirements which will be useful in deciding on <strong>the</strong> initial specifications<strong>for</strong> <strong>the</strong> monitoring program.Two analyses of sample size requirements are presented. The first is based ona series of computer simulations in which statistical methods were used tocreate data sets with known underlying trends. Estimates of <strong>the</strong>se trends <strong>the</strong>nwere calculated and compared to <strong>the</strong> known, true values. The process wasrepeated with different parameter sets to investigate sample size requirementsand identify factors that affect <strong>the</strong>m. This analysis permitted a detailed investigationof sample size requirements but required an assumption that <strong>the</strong>computer model was realistic. For <strong>the</strong> second analysis, we obtained data from
<strong>the</strong> FWS Breeding Bird Survey on population trends in several species ofhawks and owls. We calculated long-term trends and <strong>the</strong>n estimated <strong>the</strong>number of years required to obtain reliable estimates of <strong>the</strong>se trends. Thisanalysis provides much less detailed results but involves real, ra<strong>the</strong>r thansimulated, data. Each analysis provides useful in<strong>for</strong>mation, but even incombination <strong>the</strong>y provide only preliminary estimates of <strong>the</strong> sample sizes thatwill be necessary to obtain reliable estimates of long-term trends in spotted owlpopulations.Computer simulations: This investigation required specification of anautocorrelation model describing <strong>the</strong> process by which <strong>the</strong> survey data wouldbe obtained. The specific autocorrelation structure of <strong>the</strong> model is not critical,so an analytically tractable Markov chain model was used. The model insimplest <strong>for</strong>m is defined by <strong>the</strong> probability 4 that a site is initially occupied, <strong>the</strong>probability p that a site occupied in one year will be occupied <strong>the</strong> next year,and <strong>the</strong> probability r that a site not occupied in one year will be occupied <strong>the</strong>next year. These define a Markov chain on <strong>the</strong> two states of nature, " 1" <strong>for</strong>occupied and "0" <strong>for</strong> unoccupied, as shown below.Transition probability matrixConditionInitialprobability Condition 1 0f 1 p i-p1-f 0 r I-rThe expected proportion of occupied sites converges to a limiting value, r/( I -p+r), independent of <strong>the</strong> initial fraction 4 of occupied sites, so if <strong>the</strong> initialoccupancy rate is less than this equilibrium value <strong>the</strong>n an upward trendoccurs. As an illustration of this phenomenon <strong>the</strong> trend over an 8-year periodwas calculated <strong>for</strong> <strong>the</strong> case p=0.9 and r=0.01 giving a limiting value of .01 /.1 1= .090909 <strong>for</strong> <strong>the</strong> fraction occupied after a large number of years. The initialfraction was chosen to be 30 percent smaller than this; namely, f = .070 (TableA.4). During <strong>the</strong> 8-year interval, this fraction increased 17 percent to 0.082,which is equivalent to an annual, proportional, or multiplicative, change of1.019626 (i.e., 1.0196268 = 1.17). In <strong>the</strong> analyses below, we would describesuch a change by stating that <strong>the</strong> population grew at an average annual rate of1.96 percent.Detectability bias and noise were introduced into <strong>the</strong> model by assuming thatan occupant is detected with probability d, and "detection" is independent fromsite to site and year to year. Only "false negatives" are allowed: i.e., a true 0 isalways recorded as 0 while a true 1 is sometimes (with probability 1 -d) recordedas 0. This has <strong>the</strong> effect of i) reducing <strong>the</strong> expected slope by <strong>the</strong> factord, ii) reducing <strong>the</strong> variance by <strong>the</strong> factor d 2 but iii) adding a noise variancecomponent:d(I-d)ac 2 awhere c denotes <strong>the</strong> contrast year-coefficients and "a" denotes <strong>the</strong> yearlyexpected true-occupancy per site; i.e.,Expected sample slope = dyca.Stochasticity in <strong>the</strong> transition probabilities p and r was introduced as randommultiplicative effects. A year-specific, site-specific p became a product of a257
Table A.4. Illustration of a Markov chain approach toward stochastic equilibriumwhen r/(1-p+r) is 30 percent higher than <strong>the</strong> initial fraction 4.YearExpectedOccupancy1 0.0699302 0.0722383 0.0742924 0.0761205 0.0777466 0.0791947 0.0804838 0.081630random year factor a, say, and a random site component x, say, thus, p=a-rwhere a is common to all sites that year and T is common to all years at thatsite. Randomness in r was introduced by assuming that r/p is a randomvariable 0, 0
population changes of less than 3 percent and number of owls recorded per100 stations of less than 10, power never reached 80 percent even when 1,000stations were visited per year, all replaced annually (power was about 79percent in this case). Higher absolute trends, or numbers of birds reported per100 stations did push power above 0.80. For example, surveying 1,000stations per year and recording 6.5 birds per 100 stations, when <strong>the</strong> populationwas declining 4.1 percent per year, produced power equal to 80 percentwhen 30 percent of <strong>the</strong> stations were replaced annually and 85 percent whenall <strong>the</strong> stations were replaced annually. Despite <strong>the</strong>se examples, in general, itwas expensive, and sometimes virtually impossible, to achieve power of 80percent with only 8 years of monitoring data.With 12 years of data, many more situations were found in which power wasabove 80 percent, sometimes by a substantial margin. For example, with a 2.5percent decline per year, and 6.2 birds recorded per 100 stations, power was0.82 with 1,000 stations, all replaced annually. With 10 birds recorded per100 stations, power exceeded 80 percent if 70 percent of 800 stations, or all of600 stations, were replaced annually. With larger trends, smaller sampleswere sufficient. For example, with a 3.6 percent decline per year and 7.7 birdsrecorded per 100 stations, power exceeded 80 percent if 60 percent of 600stations, or all of just 400 stations, were replaced annually. By contrast, ifnone of <strong>the</strong> stations was replaced, <strong>the</strong>n 1,000 per year were necessary toachieve power of 80 percent.Results from <strong>the</strong> simulations were analyzed with a general linear modelsprogram in which power was <strong>the</strong> dependent variable. The simplest equationwith moderately high explanatory power was:power = -1.18 + 0.04stns + 0.18chg + 0.04recs + 0.05yrs + 0.l6replwhere stnschgrecsyrsrepl= number of stations surveyed per year in 1OOs(e.g., 800 stations per year was coded as 8)= annual percent change per year (e.g., if <strong>the</strong> populationincreased or decreased 3.2 percent each year <strong>the</strong>n chgwas 3.2)= average number of birds recorded per 100 stations= interval length in years= fraction of <strong>the</strong> stations on a 4-year cycleThe r 2 <strong>for</strong> this equation was 0.87. All variables were highly significant. Slightimprovement was obtained by applying a square root trans<strong>for</strong>mation to severalof <strong>the</strong> variables and including a few interaction terms but <strong>the</strong> gain (r 2 equaled0.92 in <strong>the</strong> best model) did not seem worth <strong>the</strong> increased difficulty in interpreting<strong>the</strong> model. Adding detection rate and presence of random effects did notimprove <strong>the</strong> fit of <strong>the</strong> model. The standard deviation and coefficient of variationof <strong>the</strong> residuals were 0.08 and 16 percent respectively indicating that <strong>the</strong>model revealed general trends, but did not make individual predictions verywell.The coefficients above, however, describe <strong>the</strong> general relationship between <strong>the</strong>variables and power. The general trend was to obtain an increase in power ofabout 0.04 <strong>for</strong> each of <strong>the</strong> following:1. Increasing <strong>the</strong> number of stations per year by 100.2. Increasing <strong>the</strong> annual trend by 0.25 percent (e.g., from 3 percent to3.25 percent).3. Increasing <strong>the</strong> number of birds recorded per 100 stations by 1.4. Increasing <strong>the</strong> number of years on which <strong>the</strong> estimate was based by 1.5. Putting an additional 25 percent of <strong>the</strong> stations on a 4-year cycle.259
Obviously, <strong>the</strong>se statements hold only <strong>for</strong> powers well below 1.0 and <strong>for</strong>appropriate ranges of <strong>the</strong> variables, and as noted above, <strong>the</strong> specific predictionsof <strong>the</strong> regression model were often in error by 0.08 to 0. 1O or even more.None<strong>the</strong>less, <strong>the</strong> conclusions above provide at least a rough guideline to <strong>the</strong>ways that power is affected by altering <strong>the</strong> variables.This analysis suggests that a minimum of 8 years probably will be required <strong>for</strong>80 percent probability of detecting trends in owl populations unless suchtrends exceed 3 percent and more than 10 owls are recorded per 100 stations.Such a program probably would require that more than 1,000 stations bevisited per year. If 12 years of data are available to estimate trends, <strong>the</strong>n 600stations per year, if visited on a 4-year cycle, might be sufficient to detectannual trends in <strong>the</strong> 2 to 3 percent range, particularly if eight or more birdsare recorded per 100 stations. Obviously <strong>the</strong>se conclusions are based on <strong>the</strong>assumptions inherent in <strong>the</strong> model, and <strong>the</strong>se assumptions can be refined andimproved as data from <strong>the</strong> monitoring program are collected. Fur<strong>the</strong>rmore, itmust be remembered that <strong>the</strong>se surveys do not detect trends in <strong>the</strong> totalpopulation; <strong>the</strong>y provide in<strong>for</strong>mation only about <strong>the</strong> territorial population.Breeding Bird Survey data: Breeding Bird Survey data from a 25-year period(1966-1990) <strong>for</strong> hawks and owls were used as a surrogate <strong>for</strong> long-term spot-Table A.5. Description of data sets used to estimate number of years required toobtain reliable estimates of long-term trends.Average AverageState or Number Birds per Percent Autocor-Species Province Years Routes Route Change relationa4Turkey vulture Florida 1966-90 22 5.2 -1.4 1.99Maryland 1966-90 43 4.7 3.3 2.03Ohio 1966-89 24 1.5 3.1 1.50Oklahoma 1967-90 23 4.0 0.2 1.25+Black vulture Alabama 1966-90 28 2.1 2.1 2.56Florida 1966-90 21 4.7 0.1 1.78Red-tailed hawk Kansas 1967-90 29 2.1 1.1 2.07Oklahoma 1970-90 23 1.6 3.1 2.00Wisconsin 1966-90 57 0.7 4.3 2.18Red-shouldered hawk Florida 1971-90 23 2.0 0.9 3.01American kestrel New York 1974-90 46 1.4 -1.6 2.42Ohio 1974-90 24 1.3 1.4 2.38Ontario, Canada 1968-90 25 1.0 3.0 1.73Osprey Florida 1966-85 20 1.0 6.9 2.17Great horned owl Kansas 1967-90 29 0.7 2.2 2.48aBased on Durbin-Watson test with a = 0 05;1 = autocorrelation present260
ted owl data. We used <strong>the</strong> following procedure to select several data sets, eachconsisting of <strong>the</strong> results <strong>for</strong> one species within one state or physiographicprovince. We asked <strong>the</strong> FWS <strong>for</strong> up to five data sets per species, each having30 or more routes surveyed per year. They provided us with 31 data sets. We<strong>the</strong>n discarded routes covered in fewer than 20 of <strong>the</strong> 25 years (inclusion ofpoorly covered routes can seriously bias trend estimates), and we discardeddata sets in which this reduced <strong>the</strong> number of routes below 20. This processproduced 15 data sets <strong>for</strong> analysis.The 15 data sets included seven species and nine states or provinces(Table A.5). We calculated <strong>the</strong> mean number of birds per route recorded eachyear and plotted <strong>the</strong>se means. Periods during which <strong>the</strong> long-term trends wereapproximately linear <strong>the</strong>n were delineated by eye, and <strong>the</strong>se intervals wereused in <strong>the</strong> analysis. Most intervals were 20 or more years but two intervalswere 17 years. The average number of routes per year (during <strong>the</strong> intervalsused from each data set) varied from 20 to 57: <strong>the</strong> average number of birds perroute varied from 0.7 to 5.2. The magnitude of each annual trend (referred tolater as lambda, X) was calculated using <strong>the</strong> same procedure as in <strong>the</strong> computeranalyses described earlier (i.e., a X of -1 percent meant that <strong>the</strong> populationdeclined at an average annual rate of about 1 percent during <strong>the</strong> interval).The trends varied from 1.6 percent to 6.9 percent (Table A.5) and had anaverage value of 2.0 percent. Autocorrelation, as indicated by <strong>the</strong> Durbin-Watson test, was absent in all but one data set.To determine how many years were needed to obtain reliable estimates of <strong>the</strong>long-term trends, we selected all possible sets of k sequential years (k = 3 to15) from each period in each data set, calculated <strong>the</strong> estimated percent changeper year and stored <strong>the</strong> error (estimated trend - true trend (i.e., X- X). The datawere summarized by determining <strong>the</strong> minimum interval length such that 80percent of <strong>the</strong> errors were less than 0.02, less than 0.03, and less than 0.04.The rationale <strong>for</strong> this procedure was that <strong>the</strong> main source of concern in usingthis survey method is that <strong>the</strong> true trends not be seriously over-estimated.Our analyses give estimates of <strong>the</strong> sample size requirements when 'serious" isdefined as 0.02, 0.03, or 0.04, and <strong>the</strong> probability of avoiding this error is 80percent.The procedure is illustrated with data from red-tailed hawks in Wisconsin(Figure A. 1, Table A.6). This data set showed an increasing trend throughout<strong>the</strong> 25-year period. The average annual change was 4.5 percent or 0.045. In<strong>the</strong> 25-year interval, <strong>the</strong>re are 23 different intervals of 3 years each. Anestimate of <strong>the</strong> "true," long-term trend (0.045) was calculated from each of<strong>the</strong>se samples. Row one of Table A.6 indicates that 57 percent of <strong>the</strong>se estimateswere less than 0.02 higher than <strong>the</strong> true value (i.e., 57 percent were lessthan 0.065); 57 percent were less than 0.03 higher than <strong>the</strong> true value, and 61percent were less than 0.04 higher than <strong>the</strong> true value. At <strong>the</strong> opposite extreme,91 percent of <strong>the</strong> estimates based on 15-year intervals were less than0.02 higher than <strong>the</strong> true value and all of <strong>the</strong>se estimates were less than 0.04higher than <strong>the</strong> true value.Results such as <strong>the</strong>se were compiled <strong>for</strong> each data set. We <strong>the</strong>n estimated <strong>the</strong>minimum number of years needed <strong>for</strong> 80 percent probability that <strong>the</strong> error,X, was less than 0.02, less than 0.03, and less than 0.04 <strong>for</strong> each data set(Table A.7). The results indicated that a minimum of 8 years was required <strong>for</strong>80 percent confidence that errors in estimating trend were less than 0.02.With acceptable errors of 0.03 and 0.04, <strong>the</strong> corresponding figures wereapproximately 7 years and 6 years respectively.There is little basis, at present, <strong>for</strong> deciding which of our data sets most closelyresemble <strong>the</strong> data that will be collected <strong>for</strong> spotted owls. We studied <strong>the</strong>261
Table A.6. Reliability of trend estimates <strong>for</strong> red-tailed hawks in Wisconsin as afunction of interval Iengtha.NumberPercent of samples Inof Years which <strong>the</strong> error ( JX~ was:In Sample
analyses to determine effects of sample size, outliers, and autocorrelation butwere unable, with this small sample size, to reach definitive conclusions. Evenif we had, it would probably be difficult to predict <strong>the</strong> <strong>for</strong>m of <strong>the</strong> spotted owldata set. For example, survey data on diurnal raptors such as <strong>the</strong> red-tailedhawk that inhabits open landscapes might be considerably different fromsurvey data <strong>for</strong> spotted owls. The analysis of Breeding Bird Survey datasuggests that obtaining "reliable" estimates might take 7 years to more than 15years, depending on one's definition of reliable and features of <strong>the</strong> data set.The analysis, while necessarily crude at present, provides no support <strong>for</strong>imagining that reliable estimates of trend could be obtained in fewer than 7 or8 years.Conclusions: We caution that <strong>the</strong>se estimates provide only crude approximationsof <strong>the</strong> sample size requirements, especially concerning number of yearsrequired <strong>for</strong> reliable trend estimates. As noted earlier, accuracy, <strong>for</strong> a givennumber of years of survey data, depends on many factors, none of which iswell known at present <strong>for</strong> spotted owls. The analyses discussed earlier suggestthat a minimum of 8 years probably will be required to obtain trend estimatesreliable enough to be of any practical use, and <strong>the</strong> time certainly could bemuch longer, particularly if "bad years" have a pronounced effect on trends orif trends exhibit significant nonlinearity.ITable A.7. Number of years required to obtain reliable estimates of long-term trendsfrom sample Breeding Bird Survey data sets.Approximate, minimumnumber of years <strong>for</strong> 80 percentprobability that ( X- X) was:Species State c0.02 15 9 8Maryland 12 7 6Ohio 15 15 5Oklahoma 1 10 9Black vulture Alabama >15 13 10Florida 10 10 10Red-tailed hawk Kansas 8 7 4Oklahoma 14 8 7Wisconsin 5 13 6Red-shouldered hawk Florida 8 7 6American kestrel New York 8 6 5Ohio 8 8 8Ontario, Canada 13 10 8Osprey Florida 9 8 7Great horned owl Kansas 14 11 9aX. X-= estimate of trend minus true trend.I . 111.1 ...I... I.- 1. I.. I I . .. - - - 11- 1- - -.. .1.111 I1263
Demographic AnalysisAs noted earlier, one problem with estimating population trends based oncounts of owls is that nonterritorial owls are essentially undetectable, so <strong>the</strong>overall population could be declining even if <strong>the</strong> counts did not indicate anydecline. One way around this problem is to use estimates of birth and deathrates to deduce whe<strong>the</strong>r <strong>the</strong> population is increasing or decreasing. Thisapproach may avoid <strong>the</strong> problem of not being able to detect floaters, and it has<strong>the</strong> added advantage of providing insight into what factors might be responsible<strong>for</strong> population declines. For example, in comparing two areas, one with astable population and one with a declining population, we might, by estimatingdemographic rates, learn that owl populations in <strong>the</strong> two areas had similarrates of productivity and juvenile survivorship, but that <strong>the</strong> declining populationhad a lower adult survival rate. This provides more in<strong>for</strong>mation than wewould obtain simply by monitoring territorial populations.As a simple example of <strong>the</strong> approach, suppose we consider two consecutiveyears, beginning at <strong>the</strong> start of <strong>the</strong> breeding season (i.e., be<strong>for</strong>e any eggs havebeen laid). Let N. = <strong>the</strong> number of birds alive at <strong>the</strong> start of year 1, and N2 =<strong>the</strong> number of birds alive at <strong>the</strong> start of year 2. Then, we may write,N 2 = NiSa + Nifsi(M)where sa= proportion of <strong>the</strong> N. birds that survive until <strong>the</strong> start of year 2f = average number of young fledged per bird alive at <strong>the</strong> start of year 1s, = proportion of <strong>the</strong> young fledged during year 1 that survive until <strong>the</strong>start of year 2.Eq. (1) contains no assumptions; it is simply a way of expressing <strong>the</strong> empiricalrelationship between N2 and N.. Given eq. (1), we can also writeN2IN, = Sa + fsJ (1)so if we could estimate sa, f, and sY, we could estimate N 2 /N,, <strong>the</strong> proportionalamount by which population size changed between year 1 and 2 (e.g., if N 2 /N.= 0.95, <strong>the</strong>n <strong>the</strong> population declined 5 percent between <strong>the</strong> start of year 1 and<strong>the</strong> start of year 2).Now suppose we wish to estimate <strong>the</strong> average change <strong>for</strong> several pairs of years.We may write eq. (1) in <strong>the</strong> more general <strong>for</strong>m(t indicates year), and <strong>the</strong>re<strong>for</strong>e,NIVl = Nts + Nftsj,Nt+, =s5t+frSflThe average annual change (with n pairs of years) is thus1 E Nt =n) (2)= S;+- I ,ftst264
Now, if f, and sy are uncorrelated (which will be true if <strong>the</strong>y vary independentlyof each o<strong>the</strong>r), <strong>the</strong>n1 Jsfl=f sj (3)in which caseave. -N_ a (4)so if we measured sa, f, and sJ <strong>for</strong> several years (and if <strong>the</strong> correlation between ftand s,, was sufficiently close to zero) <strong>the</strong>n <strong>the</strong> average change among years (x)could be calculated as in equation (4).Several practical problems arise in estimating x <strong>for</strong> owls from demographicrates. Most of <strong>the</strong>se problems are related to <strong>the</strong> fact that nonterritorial birds,and a few territorial ones, usually are missed during <strong>the</strong> surveys at <strong>the</strong> start ofeach year. Survival rates can be estimated from telemetry data but obtaining alarge enough sample is difficult. As a result, capture-recapture methods mustbe used to estimate <strong>the</strong> survival rates.Three common problems encountered in estimating population trends fromdemographic rates are described here. We discuss <strong>the</strong>m with reference to <strong>the</strong>simple equation <strong>for</strong> X described earlier, but note that in reality more complexequations generally must be used. Eq. 4, however, will suffice <strong>for</strong> illustrating<strong>the</strong> problems and providing a general indication of how much error <strong>the</strong>seproblems may cause in estimating X. Be<strong>for</strong>e discussing <strong>the</strong> three problems, itmay be helpful to define <strong>the</strong> terms above in more detail. We define <strong>the</strong>se termsusing all birds (i.e., males and females) whereas demographic analyses areusually based solely on females.Oft =no. fledglings produced in year tN.Satno. of <strong>the</strong> N. still alive at <strong>the</strong> start of year t+ 1N.no. of <strong>the</strong> ft still alive at <strong>the</strong> start of year t+ 1sitft1. Overestimation off.Nt includes all birds alive at <strong>the</strong> start of year t, but <strong>the</strong> number of fledglings per pairusually is estimated solely from territorial birds. Thus, N. is underestimated andIt is usually overestimated unless <strong>the</strong>re are no floaters. One way to investigate thisproblem is by replacing f with fgpg where pg is <strong>the</strong> proportion of birds alive at<strong>the</strong> start of <strong>the</strong> year that are territorial and fg is <strong>the</strong> average number offledglings per territorial bird. Omitting jig is equivalent to assuming that itequals 1.0. If it is less than 1.0, but is omitted, <strong>the</strong>n population change isoverestimated by <strong>the</strong> quantity f-s(1 - Pg). For example, with f = sJ = 0.3 and Pg= 0.7, <strong>the</strong> error would be 0.027, so if population change was actually 0.975,265
<strong>the</strong> estimate (using <strong>the</strong> simple equation above and ignoring sampling error)would be 1.002. No one knows <strong>the</strong> true value <strong>for</strong> P but 0.7 is reasonableand serves to indicate <strong>the</strong> potential seriousness of t~his source of error.2. Underestimation of 9YSome birds born in year t, leave <strong>the</strong> study area but survive until <strong>the</strong> start ofyear t+ 1. They usually are counted as having died which causes sj, to beunderestimated. The significance of this problem depends on how manyjuveniles emigrate (and survive), which in turn depends on <strong>the</strong> size of <strong>the</strong>study area, intensity of searches outside <strong>the</strong> study area, and dispersaldistances. If a proportion of <strong>the</strong> juveniles, pie, emigrates from <strong>the</strong> study areabut survives at <strong>the</strong> same rate as those juveniles that remain within <strong>the</strong>study area, <strong>the</strong>n s is underestimated (aside from sampling error) by pje, andX is underestimated by fSpA.. For example, if 20 percent of <strong>the</strong> juvenilesleave <strong>the</strong> study area (Pie = 0.2) and f = -§J = 0.3, <strong>the</strong>n <strong>the</strong> error is 0.018. If<strong>the</strong> true X was 1.00, <strong>the</strong> estimate (aside from sampling error) would be0.982. Detailed studies that would permit estimation of p,, <strong>for</strong> real studyareas have not yet been carried out.3. Temporary emigration.Population ProjectionsBecause nonterritorial birds are seldom detected, young birds typically"disappear" <strong>for</strong> a few years and <strong>the</strong>n reappear when <strong>the</strong>y gain territories.The capture probabilities vary in exactly <strong>the</strong> way <strong>the</strong>y would if <strong>the</strong> birdstemporarily left <strong>the</strong> study area and <strong>the</strong>n returned to it as adults. Suchbehavior violates <strong>the</strong> assumptions of capture-recapture models, and isknown in capture-recapture literature as <strong>the</strong> problem of "temporary emigration."The problem is complex because its effects on <strong>the</strong> capture-recaptureestimates are difficult to assess. Balser (1981) showed that emigration bysome juveniles, who return to <strong>the</strong> study area as adults, causes over-estimationof <strong>the</strong> juvenile survival rate. The process with spotted owls is somewhatdifferent because <strong>the</strong> period of temporary emigration (i.e., period duringwhich <strong>the</strong> birds are nonterritorial) may last a few years into <strong>the</strong> adult ageclasses. Presumably, however, <strong>the</strong> behavior causes survival rates, particularlyof juveniles, to be overestimated. As a result, X would also be overestimated.Despite <strong>the</strong>se possible problems, measurement of demographic rates andcalculation of trends from <strong>the</strong>m, offer <strong>the</strong> only way at present to estimatetrends in <strong>the</strong> whole population (i.e., both territorial and nonterritorial individuals)within a study area.Use of <strong>the</strong>se methods is illustrated in Appendix C which describes analyses ofdata from five demographic study areas. The studies provided data from 5 to 7years and from approximately 300 to 700 birds. The confidence intervals <strong>for</strong> Xvaried from approximately 0.04 to 0.09. These levels of precision were sufficientto show that <strong>the</strong> populations studied were declining, however considerablymore data would be required to detect trends of 2 to 4 percent per year.Various difficulties with <strong>the</strong> direct counts and demographic analyses as ameans of estimating population trends have been identified earlier in thisappendix. One additional problem with <strong>the</strong>se methods is that <strong>the</strong>y apply onlyto <strong>the</strong> area and period of time actually monitored. No rigorous basis is provided<strong>for</strong> predicting trends in <strong>the</strong> future or trends that would occur in hypo<strong>the</strong>ticalsituations (e.g., under a proposed management plan). The simplest266
ment of interest (e.g., <strong>the</strong> entire range). The model contains in<strong>for</strong>mation about<strong>the</strong> environment, including <strong>the</strong> initial location of owls, and a series of rulesgoverning births, deaths, and movements. These rules are used in a stochasticsimulation of births, deaths, and movements during a year. At <strong>the</strong> end of <strong>the</strong>year, <strong>the</strong> locations of all owls are again recorded, and <strong>the</strong>n <strong>the</strong>y are used <strong>for</strong><strong>the</strong> second year of <strong>the</strong> simulation. This process is repeated <strong>for</strong> as long a periodas <strong>the</strong> user desires. The model permits up to six cell types, three age classes,and two sexes, with possibly different demographic rates. The rules <strong>for</strong> movementsby juveniles and adults are flexible and permit simulation of a widevariety of behaviors. Additional details are contained in McKelvey (1991).The <strong>Recovery</strong> Team convened an advisory committee of biologists to providerecommendations on <strong>the</strong> use of <strong>the</strong> landscape model. The committee compileddata of value in determining <strong>the</strong> parameters required by <strong>the</strong> model and maderecommendations about certain structural changes. The advisory committeehas not finalized recommendations, but intends to do so during <strong>the</strong> coming fewmonths. Preliminary recommendations have been developed <strong>for</strong> habitat-specificproductivity, juvenile survival rates, and adult survival rates <strong>for</strong> Washingtonand Oregon west of <strong>the</strong> Pacific crest and north of <strong>the</strong> Klamath provinces. Themodel appears powerful, flexible, and capable of realistic simulations. Considerablework is needed, however, to make <strong>the</strong> model operational. The followingin<strong>for</strong>mation is of particular importance:1. Habitat specific productivity and survival.Preliminary estimates are available <strong>for</strong> portions of <strong>the</strong> range, but in o<strong>the</strong>rportions we do not have definitions <strong>for</strong> cell types. The needed in<strong>for</strong>mationcould be collected using two general approaches. First, home ranges ofbirds being monitored <strong>for</strong> productivity and adult survival should be assignedto cell types so that a sample <strong>for</strong> each type could be obtained. Second,intensive studies of transmittered birds should be made to improve ourunderstanding of habitat types that are used and avoided. Study shouldalso be made of <strong>the</strong> particular values to owls provided by each stand type.Much work of this sort has been done in western Oregon and Washington,but similar studies are needed (and in some cases are in progress) in environmentseast of <strong>the</strong> Cascades crest, in Cali<strong>for</strong>nia, and in <strong>the</strong> OregonKlamath province. Habitats of particular interest should be selected <strong>for</strong><strong>the</strong>se studies.2. Effects of habitat on movements by dispersing juveniles.This topic has received little study but is critical <strong>for</strong> <strong>the</strong> evaluation of <strong>the</strong>recommended DCA network. Intensive monitoring of dispersing juveniles isneeded to reveal how <strong>the</strong>ir movements and survivorship are affected by <strong>the</strong>configuration of habitat in <strong>the</strong> landscape <strong>the</strong>y pass through, how widely <strong>the</strong>ysearch <strong>for</strong> territories during dispersal, whe<strong>the</strong>r <strong>the</strong>y settle in <strong>the</strong> first availableplace, and how far <strong>the</strong>y travel if vacancies are not available. Closemonitoring of a relatively small number of birds (ra<strong>the</strong>r than occasionallocation of a larger sample) is needed. Monitoring such a sample of dispersingbirds, and analysis of <strong>the</strong> habitats and resident owls in <strong>the</strong>ir path, wouldprovide a far better basis than we have at present <strong>for</strong> deciding on <strong>the</strong> valuesof <strong>the</strong> movement parameters in <strong>the</strong> landscape model. Such studies might becarried out in <strong>the</strong> density areas where <strong>the</strong> locations of o<strong>the</strong>r owls are alreadywell known.3. Behavior of nonterritorial adultsNonterritorial adults may buffer <strong>the</strong> population against loss of breedingadults if <strong>the</strong> floaters rapidly fill vacancies (Franklin In Press). At present,267
however, we know little about <strong>the</strong> behavior of <strong>the</strong>se nonterritorial birds, sodetermining <strong>the</strong>ir importance in maintaining stable populations is difficult.Monitoring a small sample of birds, perhaps followed continuously afterbeing banded as fledglings, could provide much of <strong>the</strong> needed in<strong>for</strong>mation.The critical question is how widely and continuously <strong>the</strong>y search <strong>for</strong> vacanciesin territories. O<strong>the</strong>r issues, such as how <strong>the</strong>ir survival rates compare toterritorial adults, should also be investigated.As this in<strong>for</strong>mation is obtained, it will be important to challenge <strong>the</strong> model withtests to reveal <strong>the</strong> reliability of its predictions. For example, predictions by <strong>the</strong>model of how dispersing juveniles will move across real landscapes can becompared with actual movements by transmittered birds. The environment in1950, when public land was largely covered by old-growth and presumably hadra<strong>the</strong>r continuous populations of owls, can be reproduced in <strong>the</strong> computer and<strong>the</strong>n altered during a 40-year simulation to resemble its current state. Distributionof owls at <strong>the</strong> end of <strong>the</strong> simulation <strong>the</strong>n can be compared to actualdistribution. O<strong>the</strong>r tests of this sort can be carried out, to increase our knowledgeof what <strong>the</strong> model can, and cannot, reveal about owl trends. Three broadoutcomes of this work might be distinguished: <strong>the</strong> model may not make anyreliable predictions, it may permit an "ordering" of trends under differentproposals, or it may permit estimates of trends of sufficient accuracy to beuseful. It is too early <strong>for</strong> confidence about how well <strong>the</strong> landscape model willper<strong>for</strong>m, but it appears to have a better chance of predicting order, and perhapsabsolute trends, than any o<strong>the</strong>r approach <strong>for</strong> modeling populationdynamics of spotted owls.Early Warning MethodsTwo o<strong>the</strong>r methods <strong>for</strong> making inferences about population trends warrantconsideration. Nei<strong>the</strong>r will provide reliable estimates of trends, but both mayprovide an "early warning" that population declines are imminent.The first method is monitoring <strong>the</strong> age of first-time territory holders. Therationale of <strong>the</strong> method is that if <strong>the</strong> nonterritorial population is large, <strong>the</strong>nmany of <strong>the</strong> first-time territory holders probably will not be young (1- or 2-yearold)birds. However, if all adults hold territories <strong>the</strong>n all first-time territoryholders must be young birds (unless adults move after establishing a territorywhich is thought to be uncommon). These facts suggest that as <strong>the</strong>nonterritorial population declines, <strong>the</strong> proportion of first-time territory holdersthat are young birds eventually must increase to 1.0. Accordingly, monitoringthis proportion might provide a basis <strong>for</strong> crude inferences about <strong>the</strong>nonterritorial population. If <strong>the</strong> ratio was 1.0 in one population and 0.3 inano<strong>the</strong>r, we might reasonably infer that <strong>the</strong> first population had morenonterritorial birds, and if <strong>the</strong> proportion began increasing, we might suspectthat <strong>the</strong> overall population was declining even if <strong>the</strong> number of territorial birdsremained stable.The exact relationship between <strong>the</strong> proportion of first-time territory holdersthat are young and ei<strong>the</strong>r <strong>the</strong> size of <strong>the</strong> nonterritorial population or <strong>the</strong> rate ofpopulation change appears complex and difficult to model. Computer simulations,however, can be used to indicate general trends. We have prepared sucha simulation and used it to investigate <strong>the</strong> behavior of this age ratio. Ifnonterritorial birds are assumed to have wide 'knowledge" of vacancies, andparticularly if older birds are assumed to have a competitive advantage infilling vacancies, <strong>the</strong>n <strong>the</strong> age ratio, in a population undergoing overall decline,remains ra<strong>the</strong>r constant until only a year or two be<strong>for</strong>e a decline begins in <strong>the</strong>territorial population. If each floater only fills vacancies occurring within asmall area <strong>the</strong>n <strong>the</strong> proportion drifts upwards much more slowly as population268
size declines. In <strong>the</strong> <strong>for</strong>mer case, <strong>the</strong> age ratio would be of little value as anearly warning sign, whereas in <strong>the</strong> latter case it could be of significant help.Ages of first time breeders should be obtained <strong>for</strong> a series of populations, and<strong>the</strong> behavior of nonterritorial birds should be studied so that computer simulationscan be made more realistic. The age ratio usually are obtained in <strong>the</strong>course of monitoring adult survival rates so this in<strong>for</strong>mation can be obtainedwith little or no extra cost.The second early warning method is <strong>the</strong> time that vacancies in <strong>the</strong> territorialpopulation remain unfilled. Much <strong>the</strong> same argument as was made earlier canbe applied to this variable. If a large nonterritorial population exists, <strong>the</strong>n onewould expect replacement times to be short, whereas eventually, as <strong>the</strong> populationdeclines, some vacancies will not be filled at all. Thus, <strong>the</strong> replacementtime should increase gradually as a population declines. Also, if nonterritorialbirds search widely <strong>for</strong> vacancies, <strong>the</strong>n <strong>the</strong> upward trend in replacement timemight not begin until nearly all nonterritorial birds had disappeared, whereas if<strong>the</strong>y search only locally, <strong>the</strong> upward trend might begin much sooner. Thisissue could be investigated to some extent by recording replacement times andtracking <strong>the</strong> change in <strong>the</strong>ir average value as a population changes in size.Empirical in<strong>for</strong>mation about <strong>the</strong> behavior of nonterritorial birds, however, alsowould be of great value in understanding this variable and using its behaviorto make inferences about population trends. This method would probably onlywork when some vacancies remain unfilled <strong>for</strong> at least a year.A Comprehensive Monitoring ProgramThis section contains preliminary recommendations <strong>for</strong> a comprehensivemonitoring program. The suggestions will need review and refinement, butenough in<strong>for</strong>mation exists to develop <strong>the</strong> general outlines <strong>for</strong> <strong>the</strong> program.Considerable overlap exists (Table A.8) in <strong>the</strong> in<strong>for</strong>mation needed by fourapproaches to estimate trends described earlier. For example, <strong>the</strong> "Demographicrates" approach and <strong>the</strong> "Population modeling" approach requirein<strong>for</strong>mation on productivity and adult survival rates, and in<strong>for</strong>mation on <strong>the</strong>behavior of nonterritorial birds will be useful in population modeling and in <strong>the</strong>early warning approaches. Study of Table A.8 suggests that <strong>the</strong> monitoringef<strong>for</strong>t might be subdivided into five programs (Table A.9).The first program is <strong>the</strong> roadside surveys <strong>for</strong> territorial birds. Details of thisapproach have been described previously. The second program, activity sitemonitoring, would provide much of <strong>the</strong> in<strong>for</strong>mation needed <strong>for</strong> demographicanalyses and population projections. The difference in requirements of <strong>the</strong>setwo approaches is that demographic analyses require that sites be selectedrandomly and habitat in<strong>for</strong>mation is not required, whereas population projectionsrequire that sites be selected in different habitats and habitat in<strong>for</strong>mationis required. These differences can be accommodated by stratifying <strong>the</strong> rangeinto habitat types and selecting sites randomly within each stratum. Specifichabitat in<strong>for</strong>mation about <strong>the</strong> sites also should be collected. In<strong>for</strong>mationcollected at <strong>the</strong>se sites (age ratios and replacements times) will provide much of<strong>the</strong> data needed <strong>for</strong> <strong>the</strong> two early warning methods. The third program is aseries of transmitter studies. Studies are needed of dispersing juveniles andterritorial and nonterritorial adults. As noted earlier, intensive monitoring isneeded in some of <strong>the</strong>se studies, even if this means that <strong>the</strong> sample size mustbe ra<strong>the</strong>r small. The fourth program includes miscellaneous studies that donot fit easily into <strong>the</strong> categories discussed earlier, and <strong>the</strong> fifth program iscoordination of <strong>the</strong> first four ef<strong>for</strong>ts.269
Table A.8. Summary of in<strong>for</strong>mation needed <strong>for</strong> different approaches to estimating orpredicting population trends.1. Direct counts (in<strong>for</strong>mation needed rangewide)a. Responses/stationon roadside surveysb. Actual density in several areasc. Responses on rapid survey in censused areas2. Demographic analyses (in<strong>for</strong>mation needed rangewide)a. Productivityb. Juvenile survivorshipc. Adult survivorship3. Population projections (in<strong>for</strong>mation needed from selected areas)a. Productivity in relationship to habitat typesb. Detailed data on juvenile dispersalc. Juvenile survivorship in relationship to landscape typesd. Adult survivorship in relationship to habitat typee. In<strong>for</strong>mation on behavior of nonterritorial adults4. Early warning methods (in<strong>for</strong>mation needed rangewide)a. Ages of first-time territory holdersb. Replacement timesV c. In<strong>for</strong>mation on behavior of nonterritorial adultsTable A.9. Proposed programs <strong>for</strong> collecting in<strong>for</strong>mation needed to estimate orpredict population trends.1. Roadside surveysa. Estimate variance componentsb. Evaluate possibility of "road bias"c. Develop double-sampling approachd. Identify domains to study2. Activity site monitoringa. Decide on stratification procedureb. Develop program <strong>for</strong> recording habitat in<strong>for</strong>mationc. Provide training programs <strong>for</strong> participants3. Transmitter studiesa. Study juvenile survivalb. Estimate natal dispersal distancesc. Evaluate definition of "dispersal habitat"d. Study behavior of floaterse. Investigate effects of habitat on territorial birds4. O<strong>the</strong>r studiesa. Investigate age ratios of first-time breedersb. Evaluate capture-recapture estimatesc. Continue investigation of landscape model5. Coordinationa. Obtain commitments to carry out <strong>the</strong> programb. Organize centralized system <strong>for</strong> data processingc. Assess <strong>the</strong> role of <strong>the</strong> GIS270
Each program is discussed briefly here. We review what in<strong>for</strong>mation is needed,how much has been learned already, and what work should receive highestpriority in <strong>the</strong> next few years. Much of this work is already in progress (thoughin most cases <strong>for</strong> purposes o<strong>the</strong>r than <strong>the</strong> development of a comprehensivemonitoring program). As noted earlier, <strong>the</strong>se suggestions are preliminary andwill need considerable discussion and refinement.Estimating or predicting population trends is <strong>the</strong> main objective of <strong>the</strong>semonitoring programs, but <strong>the</strong> in<strong>for</strong>mation <strong>the</strong>y provide also could be useful ino<strong>the</strong>r aspects of <strong>the</strong> recovery program. For example, <strong>the</strong> roadside surveyscould provide indications of relative abundance in young landscapes with andwithout remnant old-growth stands or individual trees. This in<strong>for</strong>mation couldbe useful to silviculturalists studying ways to accelerate development of suitablehabitat. In <strong>the</strong> following discussion, we attempt to identify some of <strong>the</strong>seobjectives and suggest how <strong>the</strong> monitoring program can be designed to helpachieve <strong>the</strong>m as well as achieve <strong>the</strong> primary goal of estimating or predictingpopulation trends.Roadside surveysA great deal of ef<strong>for</strong>t already has been expended in developing techniques <strong>for</strong>calling owls, and <strong>the</strong>se studies provided an excellent basis <strong>for</strong> designing <strong>the</strong>roadside survey. Little if any additional field work may be needed, but severalanalyses, discussed here, are needed.1. Estimate variance components from samples of survey data.The computer program described earlier would provide more reliable predictionsof power if estimates were available of <strong>the</strong> average number of birdsrecorded per station, and if <strong>the</strong> covariance structure in <strong>the</strong> data set wasbetter defined, in different environments and portions of <strong>the</strong> range. Thedata needed <strong>for</strong> such analyses already have been collected, <strong>for</strong> example by<strong>the</strong> Forest Service monitoring programs and within <strong>the</strong> density study areas.2. Estimate "road bias" and ways that it can be reduced.As noted in <strong>the</strong> description of roadside surveys, <strong>the</strong> savings in labor realizedfrom restricting <strong>the</strong> surveys to roads (except in roadless areas such aswilderness areas) are so great that this approach probably should be followedin most areas. Numerous possibilities exist, however, <strong>for</strong> such arestriction to cause bias in trend estimates. For example, habitat is probablymore fragmented near roads, may be more fragmented than far fromroads, and population trends might <strong>the</strong>re<strong>for</strong>e be different along roads and in<strong>the</strong> entire region. These possibilities can be assessed best by using <strong>the</strong>geographic in<strong>for</strong>mation system (GIS) developed by <strong>the</strong> <strong>Recovery</strong> Team. Itmay be possible to stratify <strong>the</strong> range (e.g., into categories based on fragmentation)and to consider that within strata <strong>the</strong> roadside stations constitute arandom sample.3. Development of <strong>the</strong> double-sampling approach.Completion of <strong>the</strong> two tasks just discussed will provide <strong>the</strong> basis <strong>for</strong> finaldevelopment of <strong>the</strong> double-sampling approach suggested <strong>for</strong> <strong>the</strong> roadsidesurveys. Estimates will be available of numbers of birds likely to be recordedper station in different strata and how <strong>the</strong>se numbers will varythrough space and time. This in<strong>for</strong>mation can be used to develop morerealistic <strong>for</strong>mulas and simulations <strong>for</strong> estimating power and sample sizerequirements, and <strong>for</strong> suggesting allocation of ef<strong>for</strong>t among different strata.The result probably will be a program somewhat like <strong>the</strong> one used earlier to271
predict <strong>the</strong> power achieved by different designs given numbers recorded perstation, number of stations per year, and so on. The new programs wouldbe similar, but would include <strong>the</strong> benefits gained from stratification anddouble-sampling.4. What "domains" to obtain estimates <strong>for</strong>?The term domain refers to a portion of a sampled population about whichinferences are desired. A domain might consist of a certain province, DCAsof a certain type, or a certain environment. Domains may be redefined indifferent analyses; <strong>the</strong>y do not all have to be identified be<strong>for</strong>e <strong>the</strong> analysesare conducted, and in reality, new domains are nearly always defined as <strong>the</strong>analysis proceeds. Much of <strong>the</strong> "art" in sampling involves trying to maximize<strong>the</strong> number of new domains of interest that can be constructed andstudied after <strong>the</strong> data have been collected. The process, however, obviouslyis easier if <strong>the</strong> domains are specified during design of <strong>the</strong> sampling program.For spotted owls, domains of interest include provinces, states, DCAs,federal land outside of DCAs, and several different environments. Thetentative list of domains to be studied in <strong>the</strong> monitoring program should bedeveloped and used in making final sample size decisions.Activity site monitoringFor this sampling program, <strong>the</strong> owl's range (including <strong>the</strong> demographic areas)would be subdivided into strata as in <strong>the</strong> roadside survey program. The stratacould be different but <strong>the</strong>re might be considerable advantage to having <strong>the</strong>same strata in <strong>the</strong> two programs. The sample size within each stratum wouldbe determined, and areas would be chosen randomly (except <strong>for</strong> "censused"strata). The selected areas would be surveyed to identify all activity sites, andone or more sites would be selected randomly. These sites would be surveyed<strong>for</strong> some minimum number of years. Surveys would be conducted according toan approved protocol and <strong>the</strong> birds present at each site in each year would bebanded so that turnovers could be identified. Productivity (number of fledglingsproduced) would be recorded, as would age of first-time territory holdersand replacement times. Habitat in<strong>for</strong>mation also should be collected about <strong>the</strong>activity site and surrounding area.The major tasks needed <strong>for</strong> initiation and refinement of this program include<strong>the</strong> following:1. Decide on stratification procedure and sample size requirements.Most of <strong>the</strong> comments made earlier about designing <strong>the</strong> roadside surveysapply to this program as well. Existing data on productivity, turnover rate,age ratios, and replacement times should be studied to obtain advanceestimates of <strong>the</strong> parameter values and <strong>the</strong> covariance structure of <strong>the</strong> data.The possibility of roadside bias should be investigated. Domains of interestshould be identified in advance, as much as possible, and <strong>the</strong> design shouldstrive to accommodate <strong>the</strong> new domains that undoubtedly will be identifiedafter analysis begins. Domains <strong>for</strong> <strong>the</strong> activity site monitoring may bedefined using ei<strong>the</strong>r landscape features or features of <strong>the</strong> habitat in <strong>the</strong>immediate vicinity of <strong>the</strong> activity site.2. Develop a program <strong>for</strong> recording habitat in<strong>for</strong>mation about <strong>the</strong> activity site.Standardized methods should be developed <strong>for</strong> collecting data on <strong>the</strong> habitatat <strong>the</strong> nest site and in <strong>the</strong> nearby areas. This work will involve decidingwhat areas around each site should be characterized, and what in<strong>for</strong>mationshould be collected. The in<strong>for</strong>mation should serve <strong>the</strong> purposes of biologists272
studying how demographic rates vary in different habitats and ofsilviculturalists studying ways to develop or maintain suitable habitat.Consideration should also be given to collecting in<strong>for</strong>mation about habitat<strong>for</strong> o<strong>the</strong>r species.3. Ensure that potential participants in <strong>the</strong> program have an opportunity tolearn capture and banding techniques and obtain required permits.Training programs and assistance in obtaining required permits should beprovided <strong>for</strong> potential participants in <strong>the</strong> program.Transmitter studiesAs noted earlier, studies are needed of dispersing juveniles and territorial andnonterritorial adults. The in<strong>for</strong>mation provided by <strong>the</strong> studies will be useful indemographic analyses, populations projections, and in <strong>the</strong> ef<strong>for</strong>ts to modelpopulation dynamics, and in <strong>the</strong> 'o<strong>the</strong>r methods" described earlier. Thefollowing investigations are particularly important.1. Estimate juvenile survival and investigate <strong>the</strong> factors that affect it.As described in <strong>the</strong> section on demographic rates, biased estimates ofjuvenile survivorship, caused by emigration or nonterritorial status, areamong <strong>the</strong> most troublesome problems in <strong>the</strong> estimation of trends based ondemographic analyses. New, lightweight transmitters appear to offer <strong>the</strong>potential <strong>for</strong> estimating juvenile survival rates by following individuals birds(ra<strong>the</strong>r than via capture-recapture studies). One major study using thisapproach is underway in <strong>the</strong> Olympic Peninsula, and o<strong>the</strong>r similar ef<strong>for</strong>tswould be valuable.2. Estimate natal dispersal distances and <strong>the</strong> factors affecting <strong>the</strong>m.Natal dispersal distances, <strong>the</strong> straight-line distance between <strong>the</strong> birthplaceand area of permanent settlement, provide a second way to evaluate <strong>the</strong>demographic estimates (by permitting an estimate of emigration rates), andwill be of great help in evaluating <strong>the</strong> recommended DCA system. Dispersaldistances of more than 100 juvenile spotted owls that survived to becometerritorial adults were collected recently. Study of this data set will aid ourunderstanding of dispersal.3. Evaluate and improve <strong>the</strong> definition of 'dispersal habitat."The 50-11-40 rule is currently being used to define dispersal habitat, butbiologists agree that more in<strong>for</strong>mation is needed about dispersal habitat.The 50-11-40 rule probably applies better in some parts of <strong>the</strong> range than ino<strong>the</strong>rs, o<strong>the</strong>r values <strong>for</strong> <strong>the</strong> three parameters might provide suitable dispersalhabitat <strong>the</strong>reby giving managers a range of alternatives, and anentirely different definition of dispersal habitat (e.g., amount of old-growthremaining in <strong>the</strong> landscape) might be useful and appropriate in some cases.Understanding <strong>the</strong> requirements <strong>for</strong> successful dispersal probably willrequire intensive monitoring to determine what habitats are used, and <strong>for</strong>what purposes, by dispersing juveniles.4. Study movements and behavior of floaters.This issue is critical in modeling population dynamics and in using <strong>the</strong>change in age ratio of first-time breeders as an early warning of imminentpopulation decline. Perhaps <strong>the</strong> biggest obstacle in <strong>the</strong>se studies is developingways to capture nonterritorial birds so that transmitters can be at-273
O<strong>the</strong>r studiestached. If dispersing juveniles can be followed <strong>for</strong> long enough, some of<strong>the</strong>m will be come floaters and possibly could be studied. Presumably <strong>the</strong>ywill be dispersed over a wide area, however, and <strong>the</strong>re is some questionabout how many times <strong>the</strong>y can be recaptured to replace transmitters.O<strong>the</strong>r techniques may be needed.5. Investigate how habitat affects survival and productivity of territorial birds.This in<strong>for</strong>mation is needed <strong>for</strong> population projections, to define home rangerequirements, and to improve our ability to develop or maintain suitablehabitat <strong>for</strong> owls. A great deal of in<strong>for</strong>mation of this type has been collectedin Washington and Oregon west of <strong>the</strong> Pacific crest and north of <strong>the</strong> Klamathprovince, and studies are underway, or have been completed recently,on <strong>the</strong> eastside of <strong>the</strong> Cascades, in <strong>the</strong> nor<strong>the</strong>rn Klamath province, and inwestern Cali<strong>for</strong>nia. Additional work is needed in <strong>the</strong> western part of <strong>the</strong>Klamath province and in <strong>the</strong> Cali<strong>for</strong>nia Cascades. The results of <strong>the</strong>sestudies should be compiled and reviewed be<strong>for</strong>e decisions about additionalwork are made.A few studies that do not fit conveniently into <strong>the</strong> previously discussed categoriesalso should be carried out. Most have been mentioned in <strong>the</strong> earlier partsof this appendix but <strong>the</strong>y are reiterated here briefly.1. Investigate age ratio of first-time breeders.The possible use of this parameter as an early warning sign of imminentpopulation decline has been discussed. Ef<strong>for</strong>ts should be made to estimatethis parameter from field studies and to understand how well it mightindicate impending population declines through computer simulations.2. Assess effects of small sample size on capture-recapture estimates.Possible biases in <strong>the</strong> capture-recapture estimates were mentioned earlierand are described in more detail in Appendix C. An additional concern isthat capture-recapture estimates are known to suffer from small samplebiases. These biases can be significant even with samples of several hundredindividuals. The biases should be investigated through computersimulations to provide insights into <strong>the</strong>ir direction and possible magnitude.3. Continue investigation of <strong>the</strong> landscape model.Several of <strong>the</strong> projects discussed earlier will provide data and insights ofvalue in developing <strong>the</strong> landscape model. These data, along with currentlyavailable in<strong>for</strong>mation, should be used to address <strong>the</strong> issues identified in <strong>the</strong>discussion of <strong>the</strong> landscape model. Determining whe<strong>the</strong>r <strong>the</strong> model faithfullyreproduces patterns known to occur (e.g., dispersal patterns exhibitedby transmittered birds, long-term population declines) is particularly important.CoordinationA clear need exists <strong>for</strong> coordination and integration of <strong>the</strong> results from <strong>the</strong>sestudies. If different survey methods, different sampling techniques, anddifferent ways of describing habitat are employed by field workers, <strong>the</strong>n <strong>the</strong>overall recovery ef<strong>for</strong>t will be far less efficient in providing <strong>the</strong> in<strong>for</strong>mationneeded to refine <strong>the</strong> recovery plan and eventually delist <strong>the</strong> subspecies. The274
coordination ef<strong>for</strong>t must ensure that methods are standardized and thatrangewide sampling plans are followed. However, it must be recognized thatdifferent investigators have different objectives, and <strong>the</strong>se may require differentfield methods and analyses. A few specific tasks, designed to accomplish thiscoordination, while not conflicting with <strong>the</strong> separate objectives of individualinvestigators, are identified below.1. Obtain commitments to carry out <strong>the</strong> proposed surveys.The monitoring program proposed here can succeed only if <strong>the</strong> major federaland state agencies, and some of <strong>the</strong> major private landowners, agree toparticipate. The <strong>Recovery</strong> Team has convened a committee of agency andprivate biologists to develop <strong>the</strong> monitoring ef<strong>for</strong>t. Representatives to thiscommittee should be <strong>for</strong>mally appointed and authorized to represent <strong>the</strong>iragencies and companies in making commitments to <strong>the</strong> monitoring program.Long-term commitments will be particularly important.2. Organize a centralized system <strong>for</strong> obtaining and analyzing <strong>the</strong> surveyresults.Coordination of <strong>the</strong> monitoring ef<strong>for</strong>t will require numerous logistic ef<strong>for</strong>tssuch as preparing data <strong>for</strong>ms and mailing lists, entering data, preparing andrunning analytic programs, filling data requests, and preparing reports. The<strong>Recovery</strong> Team should take initial responsibility <strong>for</strong> this coordination andshould sponsor a study to determine how long-term assurance of effectivecoordination can best be assured.3. Assess <strong>the</strong> role of <strong>the</strong> GIS in <strong>the</strong> monitoring program.Many examples of contributions that <strong>the</strong> GIS could make to <strong>the</strong> monitoringprogram have been described. Obtaining GIS products, however, has oftenbeen difficult. The problems should be studied and resolved to <strong>the</strong> extentpractical. The <strong>Recovery</strong> Team has arranged <strong>for</strong> assistance from U.S. GeologicalSurvey in assessing GIS needs and capabilities, and additional ef<strong>for</strong>tsof this type should be made.Role of <strong>the</strong> demographic study areasThe demographic studies will play an essential role in <strong>the</strong> monitoring ef<strong>for</strong>t aswell as providing o<strong>the</strong>r critical in<strong>for</strong>mation not directly related to monitoring.They will provide <strong>the</strong> data needed to "calibrate" <strong>the</strong> roadside survey andprevent biases due to changing detection rates, <strong>the</strong>y may provide <strong>the</strong> bestestimates of juvenile survival, and how it varies in different habitats, and <strong>the</strong>ymight be excellent sites <strong>for</strong> <strong>the</strong> transmitter studies. We assume that <strong>the</strong>y willbe continued and in some cases expanded. Consideration should be given totrans<strong>for</strong>ming <strong>the</strong>m from owl studies into ecosystem study areas.Sample size guidelinesEstimating sample size requirements is difficult until goals and design specificationshave been determined more precisely. A few preliminary guidelines canbe given <strong>for</strong> sample size requirements and allocation of ef<strong>for</strong>t among <strong>the</strong>various approaches discussed earlier.Reasons <strong>for</strong> estimating trends can be divided into two broad categories: refinementof <strong>the</strong> recovery program and consideration of delisting (or upgrading toendangered status). Refinement of <strong>the</strong> recovery program will require numerousdifferent estimates and studies, and estimating sample sizes <strong>for</strong> all of <strong>the</strong>m is275
impractical at present. We describe components of a monitoring plan that webelieve would provide <strong>the</strong> data needed to estimate trends ei<strong>the</strong>r <strong>for</strong> considerationof delisting or to gain assurance that serious declines would be detected.One step in such an analysis is estimating <strong>the</strong> magnitude of fluctuations thatmight be expected in spotted owl populations that were stable and 'healthy."No data <strong>for</strong> such calculations are available <strong>for</strong> spotted owls, but <strong>the</strong> estimatesare important because we would not expect trends to be exactly zero, even if apopulation were fully recovered. In any given period, a population probablywould be increasing or decreasing slightly and would have roughly a 50percent chance of declining slightly. Thus, some ef<strong>for</strong>t must be made tounderstand <strong>the</strong> magnitude of trend that might be considered normal and toincorporate this in<strong>for</strong>mation into sample size guidelines <strong>for</strong> <strong>the</strong> monitoringprogram.We examined <strong>the</strong> Breeding Bird Survey data sets described earlier to helpdetermine natural levels of variation in populations that are stable or close tostable. Four of <strong>the</strong> fifteen populations showed positive and negative trendsduring <strong>the</strong> 25-year period. We estimated both trends in <strong>the</strong>se cases, obtaininga total of 19 trends. Five were negative and 14 were positive. About half (42percent) of <strong>the</strong> absolute trends exceeded 3 percent per year and two-thirdsexceeded 2 percent per year. The preponderance of positive values may havebeen caused by a slight overall increase in <strong>the</strong>se populations at <strong>the</strong> regional ornational level (Droege, pers. comm.) or perhaps by a general increase in surveyorskill (Peterjohn, pers. comm.). If we subtract 2 percent from all values,<strong>the</strong>n 9 of <strong>the</strong> 19 trends (i.e., about hall) are negative and half are positive. Inthis case, 37 percent of <strong>the</strong> absolute trends exceeds 3 percent per year and 42percent exceeds 2 percent per year. These results suggest that average annualchanges, over periods of up to 25 years in statewide populations of raptors, arecommonly as large as 2.5 percent or 3 percent. Smaller populations probablyexhibit somewhat stronger fluctuations, so annual changes in a single provinceof 3.5 to 4 percent may be common.A second factor to consider in developing sample size guidelines is <strong>the</strong> cost ofobtaining <strong>the</strong> estimate. Estimated sample sizes <strong>for</strong> detecting trends of 2percent, 2.5 percent, and 3.5 percent, with ei<strong>the</strong>r 8 or 12 years of data, arepresented in Table A. 10. They were computed initially from <strong>the</strong> general regressionequation described earlier and were modified by inspecting tables of actualpower as calculated by <strong>the</strong> computer simulations. The regression equationand <strong>the</strong> results in Table A. 10 suggest that detecting a trend in 8 years takes500 to 700 more stations per year than detecting <strong>the</strong> same trend in 12 years(compare adjacent columns in Table A. 10). This guideline holds only if <strong>the</strong>trend during <strong>the</strong> 8-year period is linear. If trends are nonlinear <strong>the</strong>n 8 yearsmay be insufficient <strong>for</strong> estimating trends regardless of how many stations arevisited per year. If 12 years of data are available <strong>for</strong> <strong>the</strong> estimate, <strong>the</strong>n detectingtrends of 2.5 percent would require approximately 800 stations (dependingon number of owls recorded per 100 stations), and detecting trends of 3.5percent would require approximately 300 stations per year. Similar calculationshave not been carried out yet <strong>for</strong> <strong>the</strong> demographic analyses, but <strong>the</strong>confidence intervals <strong>for</strong> <strong>the</strong> estimated trend, based on 5 to 7 years of data,varied from 0.04 to 0.09 suggesting that 10 or more years would be required todetect trends as small as 2.5 percent, and longer might be needed if substantialyear effects were present.A final factor worth considering in developing sample size guideline is how <strong>the</strong>estimate of trend will be combined with o<strong>the</strong>r in<strong>for</strong>mation in determiningwhe<strong>the</strong>r populations should be delisted. We believe that conclusions about <strong>the</strong>long-term stability of <strong>the</strong> population should not depend solely, or even primarily,on empirical estimates of trend. On <strong>the</strong> contrary, <strong>the</strong>se data probably276
should play a minor role, compared to ef<strong>for</strong>ts based more on understanding <strong>the</strong>causes of trends (i.e., population modeling). We believe <strong>the</strong> latter ef<strong>for</strong>ts willprovide a more reliable and cost-effective way to estimate or predict trends.The points discussed previously provide a basis <strong>for</strong> recommending sample sizeguidelines <strong>for</strong> <strong>the</strong> roadside surveys and demographic studies. Obviously, <strong>the</strong>initial choice may need revision as new in<strong>for</strong>mation becomes available. Weassume that 10 years of data will be available, and that both <strong>the</strong> roadsidesurveys and <strong>the</strong> demographic analyses should have an 80 percent chance ofdetecting annual changes of 2.5 percent at <strong>the</strong> statewide level or 3.5 percent at<strong>the</strong> province level. The analysis discussed earlier suggests that changes ofsmaller magnitude probably would be expensive to detect and hard to interpretsince such changes may occur commonly in healthy populations. At present,such a guideline would lead to recommending that <strong>the</strong> roadside survey includevisits to approximately 750 stations per year in each of <strong>the</strong> three states.Assuming that 15 stations are visited per person-day, <strong>the</strong> fieldwork wouldrequire 50 person-days per state or 10 to 15 days per province, a modestexpenditure of ef<strong>for</strong>t that easily could be continued <strong>for</strong> many years. As notedearlier, detailed calculations have not been carried out yet <strong>for</strong> <strong>the</strong> demographicapproach, but continuation of <strong>the</strong> density study area programs probably willprovide <strong>the</strong> required statistical power.Developing sample size guidelines <strong>for</strong> activity site monitoring is more difficultbecause <strong>the</strong> data collected during this work will be used <strong>for</strong> several purposes:demographic analyses, population projections, age ratios and replacementtimes. Objectives <strong>for</strong> <strong>the</strong>se projects need to be specified be<strong>for</strong>e detailed samplesize guidelines are developed <strong>for</strong> <strong>the</strong> activity site monitoring, but a few preliminarycalculations may be helpful. Monitoring <strong>the</strong> sites will take several visitsper season. If a total of 5 person-days were required per site, roughly 40 sitescould be visited per-person year of ef<strong>for</strong>t. Thus 5 person-years of ef<strong>for</strong>t, <strong>for</strong>example, probably would be sufficient to monitor about 200 sites per year.Most of <strong>the</strong> parameters estimated in <strong>the</strong> 'activity site monitoring" program areproportions or can be treated as proportions to obtain approximate sample sizerequirements. In most cases, interest probably will center on comparing twoproportions; e.g., productivity or turnover rates in two habitats. The standarderror of a difference between two proportions depends on <strong>the</strong> proportions and,if data are collected in more than one year, on how much <strong>the</strong> difference betweenproportions varies among years. For this example, we will assume thatTable A.1 0. Preliminary estimates of <strong>the</strong> number of stations that must be visited peryear to have an 80 percent chance of detecting trends.Average number of birds recorded per 100 survey stations:8 10Trend 8 years 12 years 8 years 12 years2.0 percent - 1,150 1,400 8502.5 percent 1,400 900 1,200 550\ 3.5 percent 1,000 360 800 250277
Conclusions<strong>the</strong> year effect can be ignored, and that <strong>for</strong>mulas appropriate with simplerandom sampling are used in <strong>the</strong> analyses.Little difference occurs in sample size requirements if <strong>the</strong> proportions arebetween approximately 0.3 and 0.7. Productivity (which can probably bemodeled as a proportion since production of two female fledglings by a pair isreasonably rare) and <strong>the</strong> age ratio of first-time breeders are both probably in<strong>the</strong> 0.3 to 0.7 range. Suppose sites were visited <strong>for</strong> 5 years. The number ofsites per group per year and associated 90 percent confidence intervals <strong>for</strong>estimated differences are approximately as follows: 50 sites, 0.09; 100 sites,0.06: 200 sites, 0.044; and 400 sites, 0.03 1. For example, if 100 sites in eachof two groups were each visited <strong>for</strong> 5 years, <strong>the</strong>n <strong>the</strong> confidence interval <strong>for</strong> <strong>the</strong>difference would be approximately 0.044. Average productivities of 0.30 and0.35, would be significantly different. In general, <strong>the</strong> sample size required todetect differences among groups would probably vary from 50 to 200 dependingon <strong>the</strong> level of precision required. For estimating or comparing adultsurvival rates, a larger sample might be needed because, while <strong>the</strong> standarderror is smaller with large probabilities, <strong>the</strong> difference one might wish to detectalso would be smaller.The brief analysis just discussed suggests that a reasonable target <strong>for</strong> <strong>the</strong>activity site monitoring program would be 200 sites per year in each state (40to 60 sites per province). We-assume that <strong>the</strong>se would be in addition to sites in<strong>the</strong> density study areas. Such a program would permit numerous investigationsof how productivity, adult survival, age ratios, and replacement timesvaried across habitats or o<strong>the</strong>r environmental features, across <strong>the</strong> range, andthrough time. The results would be of great value in developing <strong>the</strong> populationmodeling approach, <strong>the</strong>y would probably be useful in <strong>the</strong> capture-recaptureestimates, and <strong>the</strong>y would provide confidence that populations were healthy orhelp identify problems if any occurred. The cost, 5 person-years per state <strong>for</strong> 5years, seems acceptable in light of current expenditures <strong>for</strong> monitoring activities.We stress again, however, that <strong>the</strong>se are 'order of magnitude" estimatesintended solely to give a first impression of how large <strong>the</strong> sample sizes shouldbe. More detailed estimates can be provided after detailed objectives, and somepreliminary results, are available.Sample size guidelines <strong>for</strong> <strong>the</strong> o<strong>the</strong>r studies and cannot be provided until <strong>the</strong>specific objectives and methods have been identified.The analyses and recommendations in this appendix are intended to provide aframework and a starting place <strong>for</strong> designing <strong>the</strong> monitoring program. Ourmain goal has been to demonstrate that such a program could be useful andcould satisfy <strong>the</strong> requirement in <strong>the</strong> Delisting Criteria <strong>for</strong> a "scientificallycredible sampling plan" at acceptable costs. Even if our estimates turn out tobe low, it seems clear that <strong>the</strong> monitoring program described could be carriedout at costs substantially less than those currently being incurred <strong>for</strong> spottedowl monitoring programs.278
Literature CitedBalser, J.P. 1981. Confidence interval estimation and tests <strong>for</strong> temporaryoutmigration in tag-recapture studies. Unpublished PhD Dissertation CornellUniversity, Ithaca, New York.Franklin, A. B. In press. Population regulation in nor<strong>the</strong>rn spotted owls:<strong>the</strong>oretical implications <strong>for</strong> management. In D. McCullough and R. Barrett. ed.Wildlife 2001: Populations. Elsevier Press, Essex, England.McKelvey, K. 1991. A spatially explicit life-history simulator <strong>for</strong> <strong>the</strong> nor<strong>the</strong>rnspotted owl. USDA Forest Service, Pacific Southwest Forest and RangeExperiment Station.Thomas, J.W., E.D. Forsman, J.B. Lint, E.C. Meslow, B.R. Noon, and J.Verner. 1990. A conservation strategy <strong>for</strong> <strong>the</strong> nor<strong>the</strong>rn spotted owl. Report of<strong>the</strong> Interagency Scientific Committee to address <strong>the</strong> conservation of <strong>the</strong> nor<strong>the</strong>rnspotted owl. Forest Service, Fish and Wildlife Service, Bureau of LandManagement, and National Park Service, Portland, Oregon, U.S. GovernmentPrinting Office. 1990-791-171/20026.Yates, R. 1960. Sampling methods <strong>for</strong> censuses and surveys. 3rd ed.London:Charles Griffin and Company.279
280
Appendix BSuitable Habitat <strong>for</strong> Nor<strong>the</strong>rn <strong>Spotted</strong><strong>Owl</strong>s: An UpdateJonantan Bart and Susan Eamst281
282
Table of ContentsAbstract .............................................. 285Studies of Habitat Suitability .............................................. 285Types of in<strong>for</strong>mation collected .............................................. 286Use of <strong>the</strong> in<strong>for</strong>mation .............................................. 288Recent Literature .............................................. 290Cali<strong>for</strong>nia .............................................. 291Oregon and Washington .............................................. 293Structural Features of Sites Used by <strong>Owl</strong>s .............................................. 294Results .............................................. 294Discussion .............................................. 297Amount of Habitat in Home Ranges .............................................. 302Results .............................................. 302Discussion .............................................. 303Habitat Selection <strong>for</strong> Roosting and Foraging .............................................. 304Results .............................................. 305Discussion .............................................. 307Abundance of <strong>Owl</strong>s in Different Habitats .............................................. 307Results .............................................. 308Discussion .............................................. 308Demographic Rates in Different Habitats .............................................. 309Results .............................................. 309Discussion .............................................. 310Recommendations <strong>for</strong> Future Research .............................................. 312Standardize habitat measurements .............................................. 312Prepare habitat maps <strong>for</strong> demographic study areas ............................ 312Give high priority to studying selected areas ...................................... 312Give high priority to studying selected habitats .................................. 313Study functions and ways of developing understory ........................... 313Literature Cited .............................................. 315283
284
AbstractThis appendix discusses <strong>the</strong> use of in<strong>for</strong>mation on habitat suitability in <strong>the</strong>recovery program. In<strong>for</strong>mation on habitat suitability is divided into six categories:structural features of sites used by owls, amount of habitat in homeranges, habitat selection <strong>for</strong> roosting and <strong>for</strong>aging, abundance of owls indifferent habitats, demographic rates in different habits, and functional studiesof resources needed by owls. Our current knowledge about each of <strong>the</strong>se areasis summarized, emphasizing knowledge obtained since <strong>the</strong> review by Thomaset al. (1990). New in<strong>for</strong>mation provides a clearer description of habitats usedby owls and suggests that, as predicted by Thomas et al. (1990), a wider rangeof habitats may be suitable <strong>for</strong> owls in Cali<strong>for</strong>nia than in Oregon and Washingtonwest of <strong>the</strong> Cascade crest. New evidence also suggests that adult survivalrates decline with decreasing amount of old-growth near to <strong>the</strong> nest. Thisfinding is important because of <strong>the</strong> extreme sensitivity of population viability toadult survival rates. Recommendations <strong>for</strong> future work include standardizinghabitat measurements, preparing habitat maps <strong>for</strong> <strong>the</strong> demographic studyareas, and emphasizing new research in several specific areas or habitats.This appendix summarizes in<strong>for</strong>mation from habitat studies on nor<strong>the</strong>rnspotted owls. Thomas et al. (1990) should be consulted <strong>for</strong> a comprehensivereview of this topic: this appendix emphasizes studies which have appearedsince Thomas et al. (1990). We discuss how habitat in<strong>for</strong>mation will be used in<strong>the</strong> recovery program, review <strong>the</strong> state of our knowledge about suitable habitat<strong>for</strong> nor<strong>the</strong>rn spotted owls, and offer tentative suggestions about priorities <strong>for</strong>future research on habitat requirements of owls.We were assisted in <strong>the</strong> preparation of this report by Gary Benson, RandyDettmers, Jeff Grenier, David Johnson, Jo Ellen Richards, Kristin Schmidt,and David Solis, each of whom analyzed studies and data bases describinghabitat relationship of spotted owls in a portion of <strong>the</strong> owl's range. Reports byBenson (1991a,b) and Grenier (1991) are included in <strong>the</strong> administrative recordof <strong>the</strong> <strong>Recovery</strong> Team. Bruce Bingham, Mark Boyce, Jennifer Blakesley,Charlie Brown, Joe Buchanan, Lowell Diller, Lee Folliard, Eric Forsman, AlanFranklin, Rocky Gutierrez, Tom Hamer, Larry Irwin, Steve Kerns, KevinMcKelvey, Joe Meyer, Barry Noon, Malcolm Pious, Steve Self, and Cindy Zabelprovided us original summaries and analyses of <strong>the</strong>ir data or pre-publicationmanuscripts. Previous drafts of <strong>the</strong> manuscript were reviewed by Bob Anthony,Edie Asrow, Gary Benson, Bruce Bingham, Lowell Diller, Alan Franklin,Rocky Gutierrez, Richard Holthausen, Bruce Marcot, and Steve Self.Studies of Habitat SuitabilityHabitat suitability might be defined qualitatively as <strong>the</strong> degree to which a givenhabitat provides <strong>the</strong> resources owls need to survive, reproduce, and dispersesuccessfully. No single definition captures all of <strong>the</strong> ways of measuring habitatsuitability. For example, consider a study to determine <strong>the</strong> suitability of aparticular habitat <strong>for</strong> <strong>for</strong>aging. Suitability might be assessed as <strong>the</strong> amountthat <strong>for</strong>aging birds use <strong>the</strong> habitat, by capture rates per unit of time spenthunting in <strong>the</strong> habitat, by susceptibility to predators of owls <strong>for</strong>aging in <strong>the</strong>habitat, or by time required <strong>for</strong> <strong>the</strong> prey population to rebound after beingdepleted. Each of <strong>the</strong>se measures would provide useful in<strong>for</strong>mation and couldlegitimately be considered an aspect of habitat suitability. Habitat suitability isthus best considered an area of study, ra<strong>the</strong>r than a specific parameter. In aspecific context, however, more precise definitions of habitat suitability may bereasonable. Fur<strong>the</strong>rmore, it is certainly possible to measure habitat featuresor attributes that have little or no relationship to <strong>the</strong> habitat's suitability <strong>for</strong>285
owls. Consequently, <strong>the</strong> issue of whe<strong>the</strong>r a study has used good measures ofsuitability is important, even though we usually cannot provide a precise,quantitative definition of suitability.In<strong>for</strong>mation from studies of habitat suitability will be useful in many parts of<strong>the</strong> recovery program. For example, habitats supporting self-sustaining owlpopulations should be identified and described, proposed conservation programsmust be evaluated, models of owl population dynamics must haverealistic descriptions of habitat relationships, and <strong>the</strong> structure of habitats thatmanagers will attempt to develop and maintain must be described. In thissection, we discuss <strong>the</strong> types of in<strong>for</strong>mation needed <strong>for</strong> <strong>the</strong>se assessments andpredictions, and provide a brief evaluation of <strong>the</strong> ways in which each kind ofin<strong>for</strong>mation will be most useful in <strong>the</strong> recovery program.Types of in<strong>for</strong>mation collectedStudies of habitat suitability <strong>for</strong> owls may be divided into six broad categories:1. Structural features of utilized habitats2. Amount of suitable habitat in home ranges3. Habitat selection <strong>for</strong> roosting and <strong>for</strong>aging4. Abundance of owls in different habitats5. Demographic rates of owls in different habitats6. Studies of specific resources needed by owlsStudies describing structural features of utilized habitats present quantitativemeasurements of <strong>the</strong> habitats used by spotted owls <strong>for</strong> roosting and <strong>for</strong>aging.Variables reported frequently include dbh, canopy cover, and tree speciescomposition. These variables, and o<strong>the</strong>rs, may be reported <strong>for</strong> all trees or <strong>for</strong>overstory and understory. Separate analyses may be carried out <strong>for</strong> differentactivities such as nesting, roosting, and <strong>for</strong>aging, or <strong>for</strong> different periods suchas breeding and non-breeding. Measures of central tendency (e.g., mean,median), variability (e.g., range, standard deviation), and precision (e.g.,standard error, coefficient of variation) usually are presented <strong>for</strong> each variablemeasured.Studies estimating <strong>the</strong> amount of habitat in home ranges generally haveemployed telemetry methods and <strong>the</strong> "minimum convex polygon" approach todelineate home ranges (see Thomas et al. 1990:193). A few studies havecalculated <strong>the</strong> amount of habitat within some distance (e.g., 1.3 or 2.1 miles) of<strong>the</strong> nest. Lehmkuhl and Raphael (1991) investigated <strong>the</strong> use of this method on<strong>the</strong> Olympic Peninsula and found that it gave generally satisfactory results <strong>for</strong>habitat assessment. The habitats usually have been defined using size classes(e.g., old-growth, mature, pole, etc.) or age classes (e.g., more than 200 years,120 to 200 years, etc.). Combinations of variables (e.g., mean dbh more than21 inches and canopy cover more than 70 percent) have been used to definecategories in a few studies.Habitat selection <strong>for</strong> roosting and <strong>for</strong>aging has been assessed using telemetrymethods to define home range borders and identify specific sites used by<strong>for</strong>aging or roosting birds. Investigators <strong>the</strong>n compare <strong>the</strong> proportion of <strong>the</strong>locations in a habitat with <strong>the</strong> proportion of <strong>the</strong> home range covered by <strong>the</strong>habitat. Statistical analyses usually have been employed to determine whichhabitats (if any) were used significantly more often than would be expected iflocations were distributed randomly with respect to <strong>the</strong> habitat types. Habitatsused significantly more often than expected often are referred to as 'preferred"and habitats used significantly less often than expected under <strong>the</strong> randomdistribution hypo<strong>the</strong>sis often are referred to as 'avoided." There is no implicationof a state of mind, as is usually true when <strong>the</strong>se words are used to de-286
scribe human actions. Fur<strong>the</strong>rmore, results of <strong>the</strong> "use-availability" analysisprovide no evidence that <strong>the</strong> features used to categorize habitats had any directinfluence on owls; <strong>the</strong> features may have been correlates, ra<strong>the</strong>r than causes,of <strong>the</strong> preferences. White and Garrott (1990) provide a good discussion of useavailabilityanalyses.Studies of owl abundance in different habitats usually have employed indexmethods or intensive surveys to estimate relative or absolute abundance in twoor more habitats. Few nonterritorial birds are detected on <strong>the</strong>se surveys, so"abundance" means abundance of territorial birds, not all birds. This issue isdiscussed in more detail in Appendix A. The sample units in <strong>the</strong>se studiesgenerally have been survey stations, circles, or landscapes. Survey stationsare assigned to <strong>the</strong> habitat category in which <strong>the</strong> station is located. Circlesand landscapes generally are assigned to habitat categories based on <strong>the</strong>proportion of <strong>the</strong> sample unit covered by a particular habitat. For example, <strong>the</strong>habitat categories might be defined using percent of <strong>the</strong> sample unit covered by"older <strong>for</strong>est" (e.g., stands more than 80 years old). The categories might be 0to 20 percent, 21 to 40 percent, 41 to 60 percent, and more than 60 percent.Alternatively, <strong>the</strong> habitat type may be regarded as a continuous variable (e.g.,percent older <strong>for</strong>est). In ei<strong>the</strong>r case, <strong>the</strong> investigation would provide in<strong>for</strong>mationon <strong>the</strong> relationship between percent older <strong>for</strong>est and abundance.Studies of owl demographic rates in different habitats generally have measuredone or more of <strong>the</strong> following variables: proportion of territories with pairs,number of young fledged per pair-year, turnover rates of territorial adults.survival rates of adults, survival rates of juveniles. Turnover rates are definedas <strong>the</strong> proportion of adults disappearing from territories each year. Most of<strong>the</strong>se analyses have been similar to studies of abundance except that <strong>the</strong>sample units have been pairs or territories (ra<strong>the</strong>r than plots) and demographicrates ra<strong>the</strong>r than abundance have been measured <strong>for</strong> each sample unit. Thedefinition of habitat categories has followed <strong>the</strong> same process as in studies ofabundance. A few studies (see Appendix C) have used estimates of birth anddeath rates, as well as rates of immigration and emigration, to calculate <strong>the</strong>rate at which population size changed during <strong>the</strong> study.Studies of <strong>the</strong> specific resources needed by owls have investigated diet, preybase, nest sites, and home range size and composition. The objective in <strong>the</strong>sestudies is to identify <strong>the</strong> resources needed by owls <strong>for</strong> specific activities and tounderstand <strong>the</strong> processes that determine how well a particular habitat supplies<strong>the</strong>se resources. These studies provide insights about <strong>the</strong> causes, ra<strong>the</strong>rthan just correlates, of habitat suitability. The studies are reviewed in sectionII.A. of <strong>the</strong> recovery plan and are <strong>the</strong>re<strong>for</strong>e not reviewed in this appendix.It may be useful to recognize that <strong>the</strong> studies mentioned above provide descriptive,correlational, and functional in<strong>for</strong>mation about habitat relationships ofspotted owls. Measurements of structural features and amounts of habitatprovide descriptive in<strong>for</strong>mation about <strong>the</strong> environments where owls are found.Studies of habitat selection, density, and demographic rates provide correlationsbetween habitat features or categories and measures of suitability (e.g.,use, density, or demographic rates). These studies do not necessarily identify<strong>the</strong> features of importance to owls, so extrapolation to o<strong>the</strong>r environments maynot be warranted. Studies of <strong>the</strong> specific resources needed by owls, however,help supply this understanding of causal relationships between habitat featuresand owl viability and thus greatly improve <strong>the</strong> reliability of assessmentsand predictions.287
Use of <strong>the</strong> in<strong>for</strong>mationAssessments and predictions about <strong>the</strong> suitability of habitats <strong>for</strong> owls generallyinvolve three steps:1. Define habitats and habitat categories.2. Determine suitability of each habitat category.3. Evaluate basis <strong>for</strong> extrapolating findings to o<strong>the</strong>r populations.The six types of in<strong>for</strong>mation identified earlier play different roles in <strong>the</strong>se threesteps (Table B. 1). Descriptive in<strong>for</strong>mation about <strong>the</strong> structure of utilized sitesand amounts of habitat within home ranges are particularly helpful in defininghabitat categories. Knowing <strong>the</strong> amount of habitat present in home rangesalso provides some indication of which landscapes provide suitable conditions.Correlational in<strong>for</strong>mation provided by studies of which habitats are preferred<strong>for</strong> roosting and <strong>for</strong>aging, and by studies of density and demographic rates, aremost useful in measuring <strong>the</strong> suitability of existing habitats. Correlationalstudies also provide some assistance in defining new habitats and decidinghow much <strong>the</strong> results can be extrapolated to o<strong>the</strong>r populations of interest.Functional studies, in which causes are identified and distinguished fromcorrelates, provide a good basis <strong>for</strong> measuring suitability and an excellent basisboth <strong>for</strong> defining new habitat categories and <strong>for</strong> evaluating whe<strong>the</strong>r, or howwell, <strong>the</strong> results of studies can be extrapolated to o<strong>the</strong>r populations. A fewexamples illustrating <strong>the</strong>se generalizations and showing how studies of habitatsuitability complement and rein<strong>for</strong>ce each o<strong>the</strong>r are given later. More detaileddiscussions of how each type of in<strong>for</strong>mation can be used in <strong>the</strong> recoveryprogram are provided in subsequent sections.Early surveys <strong>for</strong> owls revealed that density was high in areas with plentifulold-growth and low elsewhere. These descriptive and correlational results weresupplemented by functional studies that sought to identify <strong>the</strong> specific resourcesneeded by owls that were present in old-growth and absent in o<strong>the</strong>rareas. The results of <strong>the</strong> correlative and functional studies convinced mostinvestigators that densities would remain low outside of old-growth. Since oldgrowthwas expected to decline in abundance, this led to <strong>the</strong> prediction thatoverall populations would decline. In this example, <strong>the</strong> parameter indicatinghabitat suitability was abundance, and <strong>the</strong> habitat categories were old-growthand o<strong>the</strong>r. The critical assumption on which <strong>the</strong> prediction was based wasthat density would remain low outside of old-growth areas.The landscape model discussed in Appendix A permits <strong>the</strong> definition of up tosix habitat types, and <strong>the</strong> specification of various "rules" that define behaviorand success of owls within each type. These rules are assumed to remain <strong>the</strong>same within each type through time. The parameters are thus <strong>the</strong> demographicrates and o<strong>the</strong>r rules followed by <strong>the</strong> model, and <strong>the</strong> habitats aredefined by <strong>the</strong> investigator. Both correlative and functional studies are neededto define <strong>the</strong> habitat types, estimate parameter values within <strong>the</strong>m, andevaluate <strong>the</strong> assumption that parameter values will be similar in study areasand areas about which inferences are made using <strong>the</strong> landscape model.<strong>Owl</strong>s are sometimes present in areas where most of <strong>the</strong> trees are fairly young(e.g., 50 to 80 years old), but some older and larger trees are present (e.g.,Thomas 1990:184). This leads to <strong>the</strong> hypo<strong>the</strong>sis that if some large trees wereleft during harvest, density of owls might increase substantially when <strong>the</strong>regenerating stand reached an age of 50 to 80 years. In this prediction <strong>the</strong>habitat is 50 to 80-year-old stands with remnant large trees, <strong>the</strong> parameterindicating suitability is density, and <strong>the</strong> primary assumption is that density infuture habitats of this type will be similar to <strong>the</strong> existing habitats that havebeen studied. Descriptive and correlational studies were useful in developing288
Table B.1. Roles and relative importance of different kinds of in<strong>for</strong>mation abouthabitat suitability in making assessments and predictions about owl viabilitya.Step In Making Assessments or PredictionsMeasure of Define Measure Evaluate BasisHabitat Habitat Habitat <strong>for</strong>Suitability Categories Suitability ExtrapolationStructuralFeatures ofUtilizedHabitats XXX XAmounts ofHabitat inHome Ranges X XXPreference <strong>for</strong>Roosting andForaging XX XAbundance of<strong>Owl</strong>s inDifferentHabitats XX XDemographicRates inDifferentHabitats XXX XXStudies ofSpecificResources XXX XX XXXa XXX = most important; e= east important................... - - I I ....... - 1.11- 1- 1- 1.11 ..... 11 I .......... I -............." I'll - - ....... S~~~~~~~~~~~~~~~<strong>the</strong> hypo<strong>the</strong>sis that retaining large trees creates suitable habitats. Functionalstudies are needed, however, to reveal whe<strong>the</strong>r large trees cause <strong>the</strong> highdensity of owls (compared to existing stands without large trees) or whe<strong>the</strong>r <strong>the</strong>large trees are simply correlates of some o<strong>the</strong>r feature that occurs in <strong>the</strong>existing habitats but might not occur as a result of <strong>the</strong> silvicultural manipulation.Much of <strong>the</strong> ef<strong>for</strong>t in <strong>the</strong> recovery program will be devoted to identifying habitatsthat are "suitable" <strong>for</strong> owls at <strong>the</strong> stand, territory, and landscape level. Alltypes of habitat study have contributions to make in this ef<strong>for</strong>t. Suppose, <strong>for</strong>example, that we have defined a habitat, call it Type A, that we believe mightprovide all of <strong>the</strong> resources needed by owls to maintain viable populations.We would first define <strong>the</strong> habitat using structural measures such as averagedbh, canopy cover, and presence of a hardwood understory. We would <strong>the</strong>nuse several types of in<strong>for</strong>mation to evaluate <strong>the</strong> hypo<strong>the</strong>sis that Type A habitatwas suitable <strong>for</strong> owls.289
Recent LiteratureWe might begin by examining <strong>the</strong> data from utilized habitats. Finding thatutilized habitats frequently met our definition of Type A habitat, and that homeranges consistently contained large amounts of Type A habitat, would support<strong>the</strong> hypo<strong>the</strong>sis. We would also examine data from correlational analyses. Thehabitat categories would be Type A and o<strong>the</strong>r. Strong preference <strong>for</strong> Type Astands would tend to support our hypo<strong>the</strong>sis, as would a finding that densityand demographic rates were higher in circles, landscapes, and territories withhigh amounts of Type A habitat. Results from functional studies would beuseful in determining whe<strong>the</strong>r <strong>the</strong> specific features of importance to owls werehighly correlated with <strong>the</strong> elements in our definition of Type A habitat and if<strong>the</strong>y were, whe<strong>the</strong>r this was likely to be true in o<strong>the</strong>r environments to which wemight wish to extrapolate our findings. We would not expect that all <strong>the</strong>se testsand analyses to support <strong>the</strong> predictions, but if few of <strong>the</strong>m did, <strong>the</strong>n we probablywould discard or substantially modify <strong>the</strong> definition of Type A habitat andstart again. If most of <strong>the</strong> predictions were verified, <strong>the</strong>n we would tend to feelthat a good definition of suitable habitat had been developed.A process very much like that above has been carried out in evaluating <strong>the</strong>hypo<strong>the</strong>sis that older (i.e., mature and old-growth) <strong>for</strong>ests provide suitablehabitat <strong>for</strong> owls. Descriptions of utilized habitat have shown that nesting,roosting, and <strong>for</strong>aging owls usually are found in older stands and <strong>the</strong> structuralfeatures of <strong>the</strong>se stands has been described in quantitative terms. Comparisonof stands have shown that owls exhibit a strong preference <strong>for</strong> olderstands <strong>for</strong> roosting and <strong>for</strong>aging. Reproductive success has been shown to behigher <strong>for</strong> pairs having more older <strong>for</strong>est in or near <strong>the</strong>ir home ranges. Densityand adult turnover rates also have been shown to be positively correlated withamount of older <strong>for</strong>est in <strong>the</strong> landscape. Several hypo<strong>the</strong>ses about <strong>the</strong> possiblefunctions of older <strong>for</strong>est in supporting owls have been generated, and evidencesupporting some of <strong>the</strong>m has been reported. Thus, while no one piece ofevidence would (or should) provide high confidence that older <strong>for</strong>est providessuitable habitat <strong>for</strong> owl populations, taken toge<strong>the</strong>r <strong>the</strong>se studies do providesuch confidence. This of course does not mean that older <strong>for</strong>est is <strong>the</strong> onlyhabitat that provides suitable habitat, but hypo<strong>the</strong>ses predicting that o<strong>the</strong>rhabitats also provide suitable habitat must be evaluated in <strong>the</strong> same comprehensiveway that <strong>the</strong> hypo<strong>the</strong>sis about older <strong>for</strong>est has been evaluated.As <strong>the</strong> previous examples indicate, <strong>the</strong> results from descriptive, correlational,and functional studies are best used in combination, ra<strong>the</strong>r than in isolation.Descriptive in<strong>for</strong>mation is most useful <strong>for</strong> defining habitat categories; correlationalin<strong>for</strong>mation at <strong>the</strong> stand, home range, and landscape level is most useful<strong>for</strong> measuring suitability of specific habitats; functional in<strong>for</strong>mation is particularlyuseful <strong>for</strong> identifying <strong>the</strong> specific resources of value to owls and thusproviding insights about how widely results can be extrapolated to o<strong>the</strong>rpopulations. In<strong>for</strong>mation from any single type of study would provide a poorbasis <strong>for</strong> assessments or predictions about habitat suitability: taken toge<strong>the</strong>r,however, <strong>the</strong>y provide an excellent basis <strong>for</strong> such analyses. Subsequentsections explore in more detail <strong>the</strong> ways that each type of in<strong>for</strong>mation contributesto analyses of habitat suitability.Thomas et al. (1990) provided a thorough review of <strong>the</strong> literature, includingmany pre-publication reports, available at <strong>the</strong> time of <strong>the</strong>ir report. Our discussionof habitat suitability is based largely on <strong>the</strong>ir review. Several reports haveappeared since <strong>the</strong>ir study, and we have conducted new analyses of a fewtopics. The new studies, or studies from which we have extracted originaldata, are described briefly in <strong>the</strong> following section.290
Cali<strong>for</strong>niaAsrow (1983) sampled <strong>the</strong> vegetation of four occupied spotted owl managementareas (SOMAs) in old-growth Douglas-fir/white fir <strong>for</strong>ests on <strong>the</strong> Scott RiverRanger District of <strong>the</strong> Klamath National Forest. <strong>Owl</strong> presence was documentedusing a combination of night and day surveys during <strong>the</strong> 1983 breedingseason. Vegetation was sampled on six variable-radius plots in each SOMA.One plot was centered on <strong>the</strong> location of <strong>the</strong> bird; o<strong>the</strong>r plots were placed 132feet from <strong>the</strong> central plot and equal distances from each o<strong>the</strong>r.Bingham (1991) described stands used by 20 radio-transmittered owls <strong>for</strong>roosting and <strong>for</strong>aging in Douglas-fir/tanoak/madrone <strong>for</strong>ests on <strong>the</strong> Mad RiverRanger District (Six Rivers National Forest) in <strong>the</strong> Klamath province. Utilizedstands were defined as those with more than 3 telemetry locations. Data weresummarized separately <strong>for</strong> roosting stands (based on daytime locations) and<strong>for</strong>aging stands (based on nighttime locations) in <strong>the</strong> breeding and nonbreedingseason. Vegetation was sampled on 3 to 8 0.25-acre plots per stand. Theauthor presented <strong>the</strong> data as means <strong>for</strong> each of three vegetation classes(defined on <strong>the</strong> basis of a cluster analysis): <strong>the</strong> data presented in this appendixare' <strong>the</strong> means of <strong>the</strong>se three classes, weighted by sample sizes.Blakesley et al. (1992) recorded 421 owl locations, including 79 nest sites,during <strong>the</strong> breeding seasons of 1985 to 1989 in <strong>the</strong> Willow Creek study area innorthwest Cali<strong>for</strong>nia. Stand types were defined by dominant vegetation (conifers,hardwoods, unvegetated), mean dbh, elevation, aspect, position (lower,middle, or upper third), and slope.Chavez-Leon (1989) measured habitat structure in 14 stands used by owlsduring 1987 and 1988 in <strong>the</strong> Klamath province (Humboldt and MendocinoCounties) in northwestern Cali<strong>for</strong>nia. Pairs occupied nine and 10 sites in 1987and 1988, respectively: nesting pairs occupied five and three sites in 1987 and1988, respectively. Twelve of <strong>the</strong> 14 sites were in typical Douglas-fir/tanoak/madrone <strong>for</strong>ests, and two were in redwoods. The landscape was highly fragmented:stands used by owls sometimes were fragmented and varied in sizefrom 49 to 642 acres. Habitat structure was measured on five or more variable-radiusplots randomly placed within each stand. Chavez-Leon excludedsome plots in calculating mean densities and basal areas, but we used all plots<strong>for</strong> our analysis.Folliard and Reese (1991) measured 30 nest sites and nest stands during 1990in second-growth redwood/Douglas-fir <strong>for</strong>ests of <strong>the</strong> Cali<strong>for</strong>nia Coast province(Humboldt and Del Norte Counties). Plots were circular and covered 0.18 acres(radius = 50 feet). Nest-site plots were centered on <strong>the</strong> nest but did not include<strong>the</strong> nest tree in measures of density and basal area. Four or five plots weredistributed randomly within 0.5 miles of <strong>the</strong> nest and in <strong>the</strong> nest stand.Jimerson et al. (1991a) quantified <strong>the</strong> structure of old-growth Douglas-fir/tanoak/madrone stands in SAF 234 (i.e., Society of American Foresters <strong>for</strong>esttype 234) in <strong>the</strong> Klamath province. Data were collected on <strong>the</strong> Six Rivers,Siskiyou, and Klamath (western half National Forests, and <strong>the</strong> Nor<strong>the</strong>rnCali<strong>for</strong>nia Coast Range Preserve. Vegetation was sampled on three variableradiusplots in each old-growth stand. Bingham and Sawyer (1991) presenteda summary of this in<strong>for</strong>mation.Jimerson et al. (1991b) quantified <strong>the</strong> structure of old-growth Pacific Douglasfir<strong>for</strong>ests stands in SAF 229 in <strong>the</strong> Klamath province. Data were collected on<strong>the</strong> western half of <strong>the</strong> Klamath and Six Rivers National Forests. Vegetationwas sampled on three variable-radius plots in each old-growth stand.291
Kerms (1989) measured habitat structure at one roost site in each of 10 homeranges in redwood <strong>for</strong>ests of <strong>the</strong> Cali<strong>for</strong>nia Coast province (Humboldt County).The roost stands were in second-growth with few snags or old-growth treesremaining. Roost stands were considered "used" if an owl was present on morethan one daytime visit; owls were present in most used stands during two orthree daytime visits. <strong>Owl</strong> use was documented in 1988, and vegetation wassampled in 1989. One 0.5-acre vegetation plot was centered on <strong>the</strong> roost treeor, <strong>for</strong> smaller stands, in <strong>the</strong> stand (Kerns pers. comm.).LaHaye (1988) measured habitat structure in six nest sites and stands inredwood <strong>for</strong>ests of <strong>the</strong> Cali<strong>for</strong>nia Coast province and in 38 nest sites andstands in <strong>the</strong> Klamath province (32 in Douglas-fir/tanoak/madrone <strong>for</strong>ests,and six in mixed conifer <strong>for</strong>ests of incense cedar/sugar pine/black oak). Thenests were widely distributed throughout <strong>the</strong> owl's geographic range in Cali<strong>for</strong>nia.Nest stands contained patches of remnant older trees that had escapedfires and o<strong>the</strong>r natural catastrophes, and in which <strong>the</strong> nests were usuallylocated. The nest site was characterized by one plot centered at <strong>the</strong> nest treeand four plots located 75 feet from <strong>the</strong> nest tree and at equal distances fromeach o<strong>the</strong>r. Nest stands were characterized by plots at several distances from<strong>the</strong> nest. We used <strong>the</strong> data from four plots 450 feet from <strong>the</strong> nest tree and fourplots 600 to 4500 feet from <strong>the</strong> nest. All plots were of variable radius.Pious (1989) measured habitat structure on seven nest sites and 22 roost sitesin coastal redwood <strong>for</strong>ests of <strong>the</strong> Cali<strong>for</strong>nia Coast province in MendocinoCounty. The sites were in second-growth stands in a landscape lacking anyextensive, unharvested stands more than 200 years old. The location of roostsites was determined April-July 1989 through a series of nighttime callingsurveys and daytime visits: <strong>the</strong> roosts were on 22 home ranges (Pious pers.comm.). Nest sites were described using two 0.17-acre strips placed perpendicularto one ano<strong>the</strong>r and each centered at <strong>the</strong> nest. Nest stands and rooststands were described using two or three plots: each plot was a 0.25-acre strip,randomly placed within each stand.Self and Brown (pers. comm.) described habitat structure on 21 nest sites in<strong>the</strong> Klamath province, in nor<strong>the</strong>entral Cali<strong>for</strong>nia. Most of <strong>the</strong> sites were locatedduring <strong>the</strong> preparation of timber sales, and thus <strong>the</strong> surveys were concentratedin dense stands with large trees, ra<strong>the</strong>r than being fully representative of <strong>the</strong>landscape. The nests were in second-growth stands of Douglas-fir or Klamathmixed conifers (white fir, Douglas-fir, ponderosa pine, incense-cedar, andsugar pine). Most areas were under even-aged management regimes composedof a mixture of partial harvest techniques (selective, seed tree, shelterwood,thinning). All but one of <strong>the</strong> areas studied had some clear-cut regenerationharvests during <strong>the</strong> previous 10 years. Within-stand diversity was generallyhigh due to <strong>the</strong> history of partial harvesting. Nest sites were described usingtwo 0.17-acre strips centered on <strong>the</strong> nest tree.Simpson Timber Company (1991) published a draft habitat conservation plancontaining results of <strong>the</strong>ir owl monitoring and research program. Surveys todetermine owl abundance, distribution, and reproductive success have beencarried out annually on Simpson's land in <strong>the</strong> Cali<strong>for</strong>nia Coast province since1989.Sisco and Gutierrez (1984) and Sisco (1990) characterized <strong>the</strong> winter (October-February) roosting and <strong>for</strong>aging sites of five radio-transmittered owls duringfall 1982 and winter 1983 on <strong>the</strong> Six Rivers National Forest (Humboldt County,Cali<strong>for</strong>nia) in <strong>the</strong> Klamath province. Most home ranges were in Douglas-fir/tanoak/madrone <strong>for</strong>ests, although parts of some home ranges at higherelevations were in montane <strong>for</strong>est (white fir, ponderosa pine, sugar pine, andincense cedar). Most roosting and <strong>for</strong>aging stands were unmanaged, although292
<strong>the</strong> landscape and home ranges contained some stands under even-agedmanagement. Roosting sites were visually located; sites with more than 5nighttime telemetry locations were considered intensively used <strong>for</strong>aging sites.Twenty-seven roost sites and 200 <strong>for</strong>aging sites were characterized. Vegetationwas sampled within a circular 0.1-acre plot centered on <strong>the</strong> roost tree or<strong>for</strong>aging location.Solis (1983) and Solis and Gutifrrez (1990) characterized roosting and <strong>for</strong>agingsites of 10 radio-transmittered owls during <strong>the</strong> breeding seasons (February toSeptember) of 1980 and 1981 on <strong>the</strong> Six Rivers National Forest (HumboldtCounty, Cali<strong>for</strong>nia) in <strong>the</strong> Klamath province. Six of <strong>the</strong> owls were also studiedby Sisco (1990). Fifty visually-located roost sites and 398 <strong>for</strong>aging sites werecharacterized. The habitat and sampling methods were identical to those ofSisco (1990).Zabel et al. (1991) studied habitat use by spotted owls during <strong>the</strong> breeding andnonbreeding seasons in <strong>the</strong> Six Rivers and Klamath National Forests. Standtypes were defined by dominant vegetation (conifers, hardwoods,nonvegetated), mean dbh, elevation, aspect, position (lower, middle, or upperthird), and slope.Oregon and WashingtonAllen et al. (1989) described stands used by 18 radio-transmittered owls innine spotted owl management areas on <strong>the</strong> Gif<strong>for</strong>d-Pinchot, Mt. Baker-Snoqualmie, and Olympic National Forests. Douglas-fir, western hemlock, andPacific silver fir were <strong>the</strong> major overstory trees. Vegetation was sampled at 436intensively-used sites (i.e., sites with clusters of locations). At each site, 25measurements were recorded using <strong>the</strong> point-center-quarter method. Most of<strong>the</strong> sites were in small stands of old-growth.Benson (199 lb) described stands used by six radio-transmittered owls inmixed conifer <strong>for</strong>ests on <strong>the</strong> Wenatchee National Forest (Cle Elum RangerDistrict). Intensively used stands (those with three or more telemetry locations)within 0.5 miles of <strong>the</strong> nest were sampled with three to nine plots distributeduni<strong>for</strong>mly in <strong>the</strong> stand. Each plot contained a variable-radius plot, a 0.20-acrecircular plot, a 0.5-acre rectangular plot, and a line transect.Buchanan (1991) characterized 62 nest sites and surrounding nest standsthroughout <strong>the</strong> eastern Washington Cascades. Most of <strong>the</strong> nests were on <strong>the</strong>Wenatchee and Okanogan National Forests; a few were on private land. The<strong>for</strong>ests were dominated by Douglas-fir and grand fir, with some ponderosapine, western larch, western red cedar, and western hemlock, and with littlehardwood understory. Median nest stand age was 130 years. Most young andmature stands contained remnant old-growth trees. Young had fledged atmost of <strong>the</strong> nests within <strong>the</strong> previous four years, and only four nests had norecord of successful nesting. Nest sites were described using a single 0.25-acreplot, and 4 0.1 -acre plots, located within 110 feet of <strong>the</strong> nest tree. Nest standswere described using a single plot randomly placed within 1,300 feet of <strong>the</strong>nest tree.Carey et al. (1991) conducted surveys <strong>for</strong> spotted owls (and o<strong>the</strong>r species) in 8young stands (40-72 years), 10 mature stands (80-120 years), and 29 oldgrowthstands (200-525 years) in <strong>the</strong> sou<strong>the</strong>rn Oregon Coast Range province.Surveys were conducted during April, May, or June in 1985 and 1986. Thestands were visited approximately 7 times in each year. Average stand sizewas about 70 acres.293
Hamer (pers. comm.) described 11 nest sites in Mt. Baker-Snoqualmie NationalForest. Nest sites were described using a circular, 0.5-acre plot centered on<strong>the</strong> nest tree.Meyer et al. (1992) studied relationships between habitat quality and variousdemographic measures on BLM land in sou<strong>the</strong>rn Oregon and <strong>the</strong> borderbetween <strong>the</strong> Klamath and Oregon Coast provinces. They selected 50 nest sitesthat each had been visited at least four times in each of 5 years. Habitats weredefined using age and o<strong>the</strong>r features. Amounts of each habitat within 2.1miles of <strong>the</strong> nest were measured. Several o<strong>the</strong>r variables (e.g., elevation,fragmentation indices) were also recorded.Spies et al. (1988) quantified <strong>the</strong> stand structure in 85 old-growth Douglas-firstands in <strong>the</strong> western Washington Cascades, western Oregon Cascades, andOregon Coast Range provinces. Most study sites were in <strong>the</strong> Western HemlockZone and <strong>the</strong> lower elevation of <strong>the</strong> Pacific Silver Fir Zone; some sites were in<strong>the</strong> Mixed Conifer Zone and <strong>the</strong> Sitka Spruce Zone. Douglas-fir was <strong>the</strong>dominant species in all stands, although western hemlock was codominant insome stands. During 1983-1984, vegetation was sampled in five nestedcircular plots per stand, spaced 325 feet or 490 feet apart depending on standsize (range 10 to 50 acres). Nested plots included 0.1-acre, 0.25-acre, and 0.5-acre plots.Structural Features of Sites Used by <strong>Owl</strong>sResultsRelatively few descriptions of stand structure at owl sites were reported byThomas et al. (1990). In <strong>the</strong> past 2 years, however, several new studies haveappeared. We tabulated this in<strong>for</strong>mation from studies in <strong>the</strong> Thomas et al.(1990) as well as from <strong>the</strong> more recent reports. Most studies recorded measurementsat specific sites, as determined by radio-telemetry methods or byvisually locating <strong>the</strong> bird. A few studies also recorded measurements fromlocations placed randomly with <strong>the</strong> stand. We refer to <strong>the</strong> latter as standmeasurements; all o<strong>the</strong>r data in <strong>the</strong> tables are from specific sites used by owls.We report average values from each study <strong>for</strong> abundance of trees by size class(all trees and hardwood understory), canopy cover, and abundance of snags.Where possible, results are presented separately <strong>for</strong> nesting, roosting, and<strong>for</strong>aging and <strong>for</strong> breeding and nonbreeding seasons. We emphasize that <strong>the</strong>range in values in our tables is not <strong>the</strong> range of average values on individualterritories. <strong>Owl</strong>s occurred in a much broader range of conditions than <strong>the</strong>range of values in our tables.Many of <strong>the</strong> studies reported indicators of variability (e.g., ranges, standarddeviations), but in most cases <strong>the</strong>y were difficult to interpret because <strong>the</strong>ydepend strongly on plot sizes and sample sizes. The range (or standard deviation)of values from small plots generally will be larger than <strong>the</strong> range (orstandard deviation) from large plots in <strong>the</strong> same area. Fur<strong>the</strong>rmore, manyinvestigators combined plots across home ranges in calculating <strong>the</strong>ir measuresof variability. The parameter (i.e., quantity of interest), in this case is difficultto describe in biological terms. We <strong>the</strong>re<strong>for</strong>e report only <strong>the</strong> average valuesfrom each study, while recognizing that in<strong>for</strong>mation on variability also wouldbe of value.294Klamath and Cali<strong>for</strong>nia Coast provinces: Average canopy cover was 80percent or more in all studies (Table B.2). The average number of trees/acre,by size class, also was quite consistent except <strong>for</strong> large (more than 36 inches
dbh) trees that varied in density from four to 14 per acre (Table B.2). No majordifferences were apparent between sites used <strong>for</strong> nests and sites used <strong>for</strong>roosting or <strong>for</strong>aging. Old-growth stands may have had slightly smaller averagecanopy cover than stands used by owls, however more detailed studies arenecessary to reach firm conclusions.Hardwoods comprised a large proportion of <strong>the</strong> trees less than 21 inches indbh and a smaller proportion of <strong>the</strong> larger trees (fable B.3). Snags were rare in<strong>the</strong> studies in managed <strong>for</strong>ests in <strong>the</strong> Cali<strong>for</strong>nia Coast province (Folliard andReese 1991, Pious 1989, Kerns 1989) (Table B.4). In <strong>the</strong> Klamath province,snags in stands used by owls occurred at average densities similar to densitiesin old-growth stands. The average density of logs appeared to be similar in <strong>the</strong>Cali<strong>for</strong>nia Coast and Klamath provinces.Three studies compared habitats used by roosting and <strong>for</strong>aging nor<strong>the</strong>rnspotted owls (fable B.5). The studies provided data on canopy cover, size classdistributions of live trees, canopy closure, and numbers of snags. No differencesin <strong>the</strong> habitats used <strong>for</strong> roosting and <strong>for</strong>aging were detectable in <strong>the</strong>sestructural features. One study (Pious 1989) provided habitat data <strong>for</strong> bothnesting and roosting/<strong>for</strong>aging (fable B.6), and no differences were detectable in<strong>the</strong> average number of large trees, canopy closure, or density of logs. Moresmall trees were present in roosting sites than in nesting sites.LaHaye (1988), Folliard and Reese (1991), and Pious (1989) compared measurementsfrom nest sites and from throughout <strong>the</strong> nest stand Cfable B.7).Average canopy closure, percent of trees that were hardwoods, and <strong>the</strong> densitiesof small and medium-sized trees were about <strong>the</strong> same in <strong>the</strong> stand and atnest sites. In <strong>the</strong> first two studies, fewer large trees were present, on average,in <strong>the</strong> stands than at nest sites. These data suggest that <strong>the</strong> owls in <strong>the</strong>sestudies selected average sites within stands except that utilized sites had morelarge (more than 36 inches dbh) trees.ITable B.2. Habitats used by nor<strong>the</strong>rn spottd owls in <strong>the</strong> Klamath and Cali<strong>for</strong>niaCoast provinces. Values are <strong>the</strong> means from each study.Roosting Nesting,Nest and roosting, Old-Feature Value sites Roosting <strong>for</strong>aging <strong>for</strong>aging growthCanopy 8 1 a 8 6 b 84bclosure % 92c 9 3 d 8 4 e 8 0 f 9 1 9 8 0 h 9 5i 84i 65-801Trees/ac 5-10" 81C 6 9 d 8 7 e 9 2 f 959 12 4 h 100i 7 5kby dbh 11 -20" 51 65 37 39 36 42 60 -class 21-25" 23 19 17 18 15 14 14 ->35" 7 4 8 7 14 11 5 13aLaHaye (1988) (average of values <strong>for</strong> Klamath and Cali<strong>for</strong>nia Coast provinces)bplous (1989)CFolliard and Reese (1991), and Diller and Folliard, (pers. comm.)dSelf, (pers. comm.)eBingham (1991) (Non-breeding season)gSolis (1983)hSsco (1990)iChavez-Leon (1989)JAsrow (1983)kKerns (1989) (Categories provided were 4-9' and 'old-growth." Most of <strong>the</strong> old-growth trees were >36' dbh.)Bingham and Sawyer (1991)..... - - - - I........... --.-- - , -I ..... I...................-295
Table B.3. Percent hardwoods in <strong>the</strong> understory (based on density) by dbh class atsites used by nor<strong>the</strong>rn spotted owls in Cali<strong>for</strong>nia.Approx. Nest Roosting/Province DBH (in) Site Roosting and <strong>for</strong>aging ForagingCali<strong>for</strong>nia Coast 5-10 63a11-20 5020-35 1835 011-24 51 b24-3636605-16 78c 68c16 13 175-16 43d16 13Klamath 5-10 31e 86f 739 92g 68f 61911-20 32 70 66 83 49 4421-35 19 22 43 44 17 2735 17 0 8 4 6 45-10 - 58i 62i 91 56' 62i11-20 77b 30 30 8 28 3121-35 30 10 9 2 8 935 0 3 4 0 3 4aFolliard and Reese, (1991): Diller and Folliard, (pers. comm.)bLaHaye (1988) (intervals were 11-24", 25-36", and 36")CPious (1989)dKerns (1989)eSelf (1991)fSolis (1983)9Sisco and Guit6rrez (1984); Sisco (1990)hChavez-Leon (1989)'Bingham et al (1991)lAsrow (1983) (intervals were 1-10-, 11-17", 18-29" and 30")O<strong>the</strong>r provinces: Fewer studies providing quantitative descriptions of utilizedhabitat are available from o<strong>the</strong>r provinces. Studies in <strong>the</strong> western WashingtonCascades, Oregon Coast range, and Olympic Peninsula revealed approximatelysimilar results <strong>for</strong> nest sites, roosting or <strong>for</strong>aging sites, and sites in old-growthstands, except that more large trees were found in <strong>the</strong> Olympic Peninsula thanin <strong>the</strong> o<strong>the</strong>r areas studied (Table B.8). In <strong>the</strong> eastern Washington Cascades,fewer large and medium-sized trees occurred in nest sites, nest stands, and<strong>for</strong>aging sites than in <strong>the</strong> o<strong>the</strong>r provinces.Maximum tree height was 103 feet in plots used <strong>for</strong> roosting and <strong>for</strong>aging in<strong>the</strong> eastern Washington Cascades (Benson 199 lb). Spies et al. (1991) reportedmaximum tree heights in old-growth stands of 198 feet in <strong>the</strong> Oregon Coastprovince, 184 feet in <strong>the</strong> western Oregon Cascades, and 168 feet in <strong>the</strong> westernWashington Cascades. Maximum tree heights have not been reported <strong>for</strong>stands used by owls in <strong>the</strong>se provinces.Total canopy closure averaged 83 percent <strong>for</strong> 11 nest sites in <strong>the</strong> westernWashington Cascades (Hamer). In <strong>the</strong> eastern Washington Cascades, totalcanopy cover averaged 75 percent in 62 nest sites and 72 percent in <strong>the</strong> standswithin which <strong>the</strong> nest were found (Buchanan 1991). In <strong>the</strong> same province,296
Table B.4. Abundance of snags and logs in habitats used by nor<strong>the</strong>rn spotted owlsin <strong>the</strong> Klamath and Cali<strong>for</strong>nia Coast provinces.Nest Nest Roostl OldFeature Province Inches Site Stand Roost Forage Forage GrwothSnags: Cali<strong>for</strong>nia Coast >5 Oa Oa 1 b 3ano./ac. by -ok -okdbh classKlamath >5 22c1 6 d 1 ge 1 6 9 1 9 d 18e 1 7 h 2130' 33 f 34 f 35!>20 5d 2g 3d 2 h 4i2' 2' 2f 310-10 20111-18 2>18 4Logs: no. ac Cali<strong>for</strong>nia Coast >10 59a 456 53a 47 bby diameterat large end Klamath >10 55c 29f 31' 32l>20 10 8 35f 12h 23'10 8apious (1989)bKerns (1989)CSelf, (pers. comm.)dSolis (1983)esisco and Guilerrez (1984)fBingham et al. (1991)gChavez-Leon (1989)hJimerson et al (1991a)'Jimerson et al. (1991b)JAsrow (1983)kDiller and Folliard, (pers. comm.)Discussiontotal canopy cover in roosting and <strong>for</strong>aging sites averaged 47 percent in sixhome ranges (Benson 199 lb).Only a few studies have reported snag densities (Table B.9) but densitiesappeared to be approximately similar in nest sites, nest stands, <strong>for</strong>aging androosting sites, and old-growth stands, except that fewer medium and largesnags were present in <strong>the</strong> eastern Washington Cascades province.Log densities were similar in nest sites and old-growth sites in <strong>the</strong> westernWashington Cascades (Hamer pers. comm., Spies et al. 1988).Hardwoods were rare or absent in utilized sites in <strong>the</strong> western WashingtonCascades, Olympic Peninsula, and eastern Washington Cascades (Allen et al.1989, Forsman and Benson pers. comm., Hamer pers. comm.).The main results of this analysis were as follows. Average canopy cover washigh (more than 80 percent) in all studies except those in <strong>the</strong> eastern WashingtonCascades where average cover was lower at nest sites and much lower atroosting and <strong>for</strong>aging sites. The average number of trees/acre by dbh classwas fairly consistent among studies, except that fewer large trees occurred in<strong>the</strong> eastern Cascades (in both Washington and Cali<strong>for</strong>nia) and in <strong>the</strong> western297
Table B.5. Comparison of habitats used by nor<strong>the</strong>rn spotted owls <strong>for</strong> roosting and<strong>for</strong>aging in <strong>the</strong> Klamath Province of Cali<strong>for</strong>nia.Sisco &Structural Gulterrez Bingham et al.feature Solis (1983) (1984) (1991)Value Roost- Forag- Roost- Forag- Roost- Forag-Ing Ing Ing Ing Ing" Ing"Trees/ac 5-20" 128 133 196 135 87 92 86 93by dbh 20-35" 15 15 13 14 37 39 38 35class >35" 16 12 10 11 17 18 18 178 7 8 7.CanopyClosure % 93 88 - - 83 85 84 80Snags/acby dbh >5" 16 19 19 18 30 33 34 35class >20 5 3 - -'First column is <strong>for</strong> breeding seasons, second column is <strong>for</strong> non-breeding season.Table B.6. Comparison of habitats used by nor<strong>the</strong>rnspotted owls <strong>for</strong> nesting and roosting in <strong>the</strong> Coastal Provinceof Cali<strong>for</strong>nia.Structuralfeature Value Nesting RoostingTrees/ac by 4-16" 140 229dbh class >16" 61 52CanopyClosure Percent 86 84Logs/ac>10" atlarge end 59 53Source. Pious (1989).2'
iTable B.7. Comparison of structural features at nest sites and throughout neststands used by nor<strong>the</strong>rn spotted owls.A. Klamath and Cali<strong>for</strong>nia Coast provinces(data from LaHaye 1988)Sturctural Nest Nestfeature Value site standCanopyClosure % 81 74Trees per 11-24" 63 42acre 25-36" 17 3by dbh >36" 6 1classBasal area ofsnags by dbh >15" 23 14aft2acB. Cali<strong>for</strong>nia Coast (data from Folliard andReese 1991, and Diller and Folliard, pers.comm.)Structural Nest Nestfeature Value site standCanopyClosure% 92 94B. continued-Structural Nest Nestfeature Value site stand% of live 16"871406419378 5813 7Trees peracreby dbhclass5-10"11 -20"21-36">36"81 13651 5723 187 2continues-No. of snagsper acre 0part of <strong>the</strong> Klamath province in Cali<strong>for</strong>nia. In all studies, <strong>the</strong> average numberof trees decreased as diameter increased (i.e., in <strong>the</strong> 'reversed J" patterndiscussed in Appendix G). The hardwood understory was well-developed inutilized sites in Cali<strong>for</strong>nia but was essentially absent in utilized sites elsewhere.Average snag density in utilized sites was similar to average snag density inold-growth sites except in <strong>the</strong> Cali<strong>for</strong>nia Coast province where few snagsoccurred in utilized sites. Average values were similar <strong>for</strong> nesting, roosting,and <strong>for</strong>aging sites. No major differences were apparent between averagevalues <strong>for</strong> sites and <strong>for</strong> stands containing <strong>the</strong> sites.Review of Tables B.2 through B.9 indicates that in<strong>for</strong>mation from Cali<strong>for</strong>nia ismuch more complete than in<strong>for</strong>mation from Oregon and Washington. Thework by Allen et al. (1989) on roosting and <strong>for</strong>aging sites in <strong>the</strong> OlympicPeninsula and western Washington Cascades provinces and by Buchanan(1991) on nest sites in <strong>the</strong> eastern Washington Cascades are <strong>the</strong> only extensivestudies yet reported. Additional in<strong>for</strong>mation <strong>for</strong> Oregon and Washington willbe available soon from studies currently in progress. Studies in <strong>the</strong> OregonKlamath, Oregon Coast Range, and eastern Oregon Cascades provinces alsowould be valuable.299
Table B.8. Tree density (number of trees per acre) by dbh class in Oregon andWashington provinces.dbh Nest Nest Roost/ Old-Province (inches) site stand Forage Forage GrowthOregon 3-9 54aCoast 10-19 25Range 20-39 17240 12Western 3-9 6 2aOregon 10-19 33Cascades 20-39 21Ž40 12Western 4-12 58b 94c 115dWashington 12-20 31 52 60Cascades 20-35 23 41 42>35 10 23 143-9 64a10-19 3420-39 27>39 10Olympic 4-12 89ePeninsula 12-20 3320-35 36>35 33Eastern 4-13 129f 117fWashington 13-23 35 29Cascades 23-33 16 10>33 2 36- 9 5999-21 5921-32 13>32 3a Spies (1991)b Hamer (1988) (dbh class definitions differed slightly those given; second size class was 11.20")c Allen et al. (1989) (Mt. Baker-Snoqualmie National Forest)d Allen et al. (1989) (Gif<strong>for</strong>d-Pinchot National Forest)e Allen et al (1989) (Olympic National Forest)Buchanan (1991) and (pers comm.)9 Benson (1991b)I300
ITable B.9. Snag density (number of snags per acre) by dbh class in Oregon andWashington provinces.dbh Nest Nest Roost/ Old-Province (inches) Site Stand Forage GrowthOregon >0 1 6 aCoastRange >20 7Western >0 25aOregonCascades >20 11Western >0 30aWashington >4 42b 33C 41 dCascades >20 18 7 7 15Olympic >4 25 ePeninsula >20 10Eastern 4-13 1 f 13fWashington 14-23 4 6Cascades >23 2 2>10 59>20 1a Spies et al. (1988)b Hamer (1988)C Allen et al. (1988) (Mt Baker-Snoqualmie National Forest)d Allen et al. (1989) (Gif<strong>for</strong>d-Pinchot National Forest)e Allen et al (1989) (Olympic National Forest)f Buchanan (1991)9 Benson (1991b).~~~~~~~~~~~~~~~~~~~~~~~~~~~~~~~~~~~~........../This type of in<strong>for</strong>mation is particularly useful in defining habitat categories.These ef<strong>for</strong>ts, however, must proceed with caution. For example, <strong>the</strong> resultssuggest that utilized sites studied to date tend to have trees of several differentdiameters (including some large trees), high canopy cover, and dominance byconifers, and that a hardwood understory is usually present in Cali<strong>for</strong>nia butis not present in Washington and most of Oregon. As we have stressed, however,<strong>the</strong>se generalizations describe average values in <strong>the</strong> study; <strong>the</strong>y do notnecessarily describe <strong>the</strong> features present at each site. Thus, birds might usesome sites with a few large trees and few o<strong>the</strong>r trees but use o<strong>the</strong>r sites with nolarge trees but many smaller trees. This differential use might occur within orbetween home ranges. In ei<strong>the</strong>r cases, <strong>the</strong> study-wide averages would be asreported earlier. Bingham (pers. comm.) has suggested that <strong>the</strong> values inTable B. 10 may characterize utilized sites in mature stands but may notcharacterize utilized sites in old-growth stands very well. This suggestioncould be investigated by comparing results <strong>for</strong> home ranges dominated by oldgrowthstands with home ranges dominated by mature stands.Improved descriptions of utilized sites might be obtained by defining a habitatcategory using several habitat variables. For example, we might examine <strong>the</strong>study-wide averages reported in Tables B.2 through B.9 and <strong>the</strong>n define ahabitat category as including stands with canopy cover exceeding 80 percent301
and numbers of trees, and percent of <strong>the</strong>m that were hardwoods, as shown inTable B. 10. We could <strong>the</strong>n determine which fraction of <strong>the</strong> utilized sites ineach study were in this category and which fraction were not.In analyses of this sort, <strong>the</strong> parameter of interest must be specified with care,and <strong>the</strong> estimation procedure must take proper account of <strong>the</strong> field methodsused to collect <strong>the</strong> data. The definition of 'site" could have a substantial effecton <strong>the</strong> outcome of <strong>the</strong> study. Suppose, <strong>for</strong> example, that <strong>the</strong> acre centered onutilized sites always con<strong>for</strong>med to <strong>the</strong> description in Table B. 10. If a few smallplots were placed within <strong>the</strong> acre surrounding each site and means per plotwere calculated, <strong>the</strong>n many sample values would not con<strong>for</strong>m to <strong>the</strong> descriptionsin Table B. 10 due solely to sampling error. This is a nontrivial problem(i.e., <strong>the</strong> errors could be quite substantial), and obtaining unbiased estimatesof <strong>the</strong> proportion of acres meeting <strong>the</strong> definition would be a difficult statisticaltask. The analysis would be much simpler if plots and sites were defined to be<strong>the</strong> same size. Different studies, however, have used different numbers andsizes of plots so such an analysis cannot be per<strong>for</strong>med using existing data.In<strong>for</strong>mation on <strong>the</strong> structure of utilized sites also will be of value in guidingsilvicultural ef<strong>for</strong>ts to develop or maintain suitable habitat and in minimizingadverse effects of harvest in <strong>the</strong> matrix. All of <strong>the</strong> cautions discussed earlierapply to such ef<strong>for</strong>ts, and it must remembered that <strong>the</strong>se structural measurementsprovide little in<strong>for</strong>mation about whe<strong>the</strong>r <strong>the</strong> sites provide suitablehabitat because <strong>the</strong>y do not relate structure to reproductive success of <strong>the</strong>owls. Even less basis is provided by <strong>the</strong>se data <strong>for</strong> deciding whe<strong>the</strong>r o<strong>the</strong>renvironments sharing some of <strong>the</strong> structural features might be suitable.None<strong>the</strong>less, data on structure of utilized stands are an important first step indesigning silvicultural programs that will be effective in helping protect owls.Amount of Habitat in Home RangesResultsThomas et al. (1990) reviewed studies reporting territory or home range size,and amount of older <strong>for</strong>est within home ranges. This in<strong>for</strong>mation is presentedin section II of this plan (Tables 2.1 and 2.2) and will not be repeated here, butresults from a few o<strong>the</strong>r recent studies are presented.Several recent studies in Cali<strong>for</strong>nia provide additional in<strong>for</strong>mation on <strong>the</strong>amount of one or more types of habitat within home ranges or circles centeredon <strong>the</strong> nest or activity sites. These studies report <strong>the</strong> acreage within territoriescovered by stands with large (more than 21" dbh) trees. Solis and Gutierrez(1990) found that eight summer home ranges in <strong>the</strong> Willow Creek study area(Six Rivers National Forest) contained a mean of 481 acres (range: 208 to 979)of this habitat. Zabel et al. (1991) reported that annual home ranges containedan average of approximately 900 acres of this habitat in <strong>the</strong> Six Rivers NationalForest (Mad River District, 10 owls), 1,400 acres of this habitat in <strong>the</strong> KlamathNational Forest (Ukonom District, nine owls), and 1,600 acres of this habitat in<strong>the</strong> Siskiyou National Forest (Chetco District, two owls). Self and Brown pers.comm.) reported that 21 pairs of owls had a mean of 503 acres of stands inwhich <strong>the</strong> mean dbh was more than 24 inches within 1.3 miles of <strong>the</strong>ir nest.Home ranges were not mapped by Self and Brown, but <strong>the</strong> home rangesstudied by Solis and Gutierrez (1990) were almost entirely within 1.3 miles of<strong>the</strong> nests, so <strong>the</strong> home ranges studied by Self and Brown probably had lessthan 503 acres. Not all nests studied by Self and Brown were in this habitattype and some home ranges contained no acres of this type.302
__-_ __- ------ - -Table B.10. Average values <strong>for</strong> characteristics of sites used by nor<strong>the</strong>rn spottedowls in <strong>the</strong> Cali<strong>for</strong>nia Coast and Klamath provinces.dbh Number of Percent of understory(inches) trees per acre trees that are hardwoods5.0 - 10.9 270 60-8011.0 - 20.9 Ž40 45-6521.0 - 35.9 Ž15 10-40Ž36 Ž2 0-10Table B.1 1. Relative use of stands with different tree sizes by transmittered nor<strong>the</strong>rnspotted owls in <strong>the</strong> Klamath Province of Cali<strong>for</strong>nia".Average dbhSeason Averages per bird >21" 5-21" c5" OpenBreeding % of territory 42 31 27 -(Mar-Sept) % of locations 84 14 2 -% of locations/acreb 30 6 0.4 -Non-breeding % of territory 45 30 11 2(Oct-Feb) % of locations 56 30 11 2% location/acreb 16 8 8 8'Data from Solis (1983) and Sisco and Guiterrez (1984).t (% of locations in habitat Yx")/(number of acres of habitat X)DiscussionStudies summarized in Thomas et al. (1990:195) show that considerablevariation exists within provinces in <strong>the</strong> amount of older <strong>for</strong>est in annual homeranges. The ratio maximum:minimum amount was 15.4 in Cali<strong>for</strong>nia, 3.5 in<strong>the</strong> Oregon Klamath province, 5.7 in <strong>the</strong> Oregon Coast Range, 10.7 in <strong>the</strong>western Washington Cascades, and 3.0 in <strong>the</strong> Olympic Peninsula. In Cali<strong>for</strong>nia,some of <strong>the</strong> nests studied by Self and Brown (pers. comm.) had virtuallyno stands with mean dbh more than 24 inches.Several explanations <strong>for</strong> <strong>the</strong> large variation in amount of older <strong>for</strong>est withinhome ranges are possible, and <strong>the</strong>y have different implications <strong>for</strong> <strong>the</strong> recoveryprogram. In general, <strong>the</strong> variation does not cause too much concern abouthow well DCAs will function, but -does cause considerable concern aboutguidelines <strong>for</strong> avoiding 'take" that suggest preserving amounts of habitataround individual pairs that equal <strong>the</strong> median amounts that have been recordedin home ranges. This point is illustrated <strong>the</strong> by following hypo<strong>the</strong>ses toexplain <strong>the</strong> high degree of variation observed in amount of habitat within homeranges.1. <strong>Owl</strong>s with more older <strong>for</strong>est had higher fitness.303
Under this hypo<strong>the</strong>sis, owl fitness is a function of <strong>the</strong> quantity of habitat. Itis possible that only those owls with <strong>the</strong> most older <strong>for</strong>est reproduce andsurvive at replacement rates (or higher). In such a case, preserving <strong>the</strong>median amount of older <strong>for</strong>est around single pairs might not permit any of<strong>the</strong> pairs to survive and reproduce at replacement rates. In contrast, using<strong>the</strong> median amount to decide how large a DCA should be would be appropriate.Some home ranges would be larger than <strong>the</strong> median, some would besmaller, but <strong>the</strong> cluster as a whole reasonably could be expected to sustainitself.2. Quality of <strong>the</strong> older <strong>for</strong>est varies (e.g., in density of prey and growth rate ofprey populations).Under this hypo<strong>the</strong>sis, <strong>the</strong> amount of habitat needed to support a pair ofowls varies among home ranges. In some areas, 1,000 acres of older <strong>for</strong>estmight be needed <strong>for</strong> owls to survive and reproduce at replacement levels; ino<strong>the</strong>r areas, 2,000 acres might be needed. If owls actually use <strong>the</strong> amount<strong>the</strong>y need, and we preserve <strong>the</strong> median amount around individual pairs,<strong>the</strong>n only half <strong>the</strong> pairs will be provided with <strong>the</strong> amount of habitat <strong>the</strong>yneed <strong>for</strong> replacement levels of productivity and survival. As in <strong>the</strong> firsthypo<strong>the</strong>sis, this is not too serious in designing DCAs because <strong>the</strong> owls willdelineate home ranges to take account of <strong>the</strong> variability in habitat quality.3. The definition of older <strong>for</strong>est includes unsuitable habitat and/or excludessuitable habitat.Under this hypo<strong>the</strong>sis, <strong>the</strong> definition of suitable habitat is a poor predictor ofreal habitat suitability. For example, fragmentation or number of canopylayers might affect quality of habitat but might not be parts of <strong>the</strong> definitionof suitable habitat. In this case, defining older <strong>for</strong>est as any mature or oldgrowthstand might lead to preserving ei<strong>the</strong>r more or less than <strong>the</strong> amountof habitat needed by owls to survive and reproduce at replacement levels. IfDCAs are placed where owls are present and viable, <strong>the</strong>n <strong>the</strong> poor knowledgeof what actually constitutes suitable habitat would be much lessserious.These examples are intended to emphasize that <strong>the</strong> large variation in amountof older <strong>for</strong>est within home ranges raises concerns about our current ability todecide which habitat, and how much of it, should be protected around individualpairs to ensure that <strong>the</strong>y can survive and reproduce at replacementlevels. The uncertainty is less serious <strong>for</strong> construction of <strong>the</strong> DCAs, particularlybecause <strong>the</strong>y are generally constructed around known pairs.Considering <strong>the</strong> large variation in amount of habitat within home ranges, <strong>the</strong>reis some question about <strong>the</strong> value of additional studies that report this figureunless <strong>the</strong>se studies also provide in<strong>for</strong>mation about how <strong>the</strong> habitat is used orhow successful <strong>the</strong> owls in <strong>the</strong> home ranges are. Future work should probablycombine estimates of home range size and amounts of older <strong>for</strong>est present withmore detailed stand descriptions, measures of viability, and functional studiesto examine how different stands are used.Habitat Selection <strong>for</strong> Roosting and ForagingThomas et al. (1990:143-170) reviewed <strong>the</strong> literature on use of habitats,categorized by successional stage, <strong>for</strong> roosting and <strong>for</strong>aging. In Oregon andWashington, west of <strong>the</strong> Cascade crest, old-growth stands were consistentlypreferred <strong>for</strong> both activities. Results were mixed <strong>for</strong> mature stands. Youngstands, pole stands, and o<strong>the</strong>r stands were consistently avoided. Old-growth304
Resultsstands were defined as being more than 200 years old in most studies. Maturestands in most of <strong>the</strong> studies were 80 to 200 years old and even-aged (or had'few canopy layers"), and had mean diameters of approximately 21 to 39inches. More recent work is summarized in <strong>the</strong> following sections.Several recent studies in Cali<strong>for</strong>nia have analyzed habitats defined by meandbh of <strong>the</strong> stand. Some of <strong>the</strong>se studies have used <strong>the</strong> following definitions:seedlings and saplings: less than 5 inches; pole timber: 5 to 10.9 inches; smalltimber 11 to 21 inches; mature and old-growth: more than 21 inches. O<strong>the</strong>rstudies have combined <strong>the</strong> two middle categories and have defined <strong>the</strong> followingcategories, referred to as seral stages: early successional (less than 5inches), mid successional (5 to 21 inches), and late successional (more than 21inches).Solis and Gutierrez (1990) and Blakesley et al. (1992) studied habitat use byowls during <strong>the</strong> breeding season at <strong>the</strong> Willow Creek study area. The sevenbirds studied by Solis and Gutierrez showed a clear preference <strong>for</strong> mature andold-growth stands (Table B. 1 1); 84 percent of <strong>the</strong> locations were in largediameter(more than 21 inches dbh) stands and small-diameter (less than 5inches) stands were almost never used. Blakesley et al. (1992) found thatvirtually all roost locations were in <strong>the</strong> 11 to 21 -inch dbh and more than 21 -inch dbh categories, and <strong>the</strong> number of locations per acre of habitat was nearlytwice as high in <strong>the</strong> more than 21-inch stands as in <strong>the</strong> smaller stands.During <strong>the</strong> nonbreeding season, <strong>the</strong> situation was more complex. Sisco (1990)found little or no preference <strong>for</strong> particular stands (Table B. 1). Only 56 percentof <strong>the</strong> observations were in mature and old-growth stands, and smalldiameter stands were used roughly in proportion to <strong>the</strong>ir abundance. Asshown in Tables B.2 through B.5, however, <strong>the</strong> average structural features ofsites used by <strong>the</strong>se birds were similar in <strong>the</strong> breeding and nonbreeding seasons.It thus appears that during <strong>the</strong> nonbreeding season, <strong>the</strong> owls usedstands roughly in proportion to <strong>the</strong>ir availability but <strong>the</strong>y selected sites within<strong>the</strong>se stands that had larger-diameter trees. Blakesley et al. (1992) noted that<strong>the</strong> 11 to 21-inch dbh stands in this study area have resulted from naturalprocesses and are more variable than plantations of <strong>the</strong> same mean diameter.This study should not be taken as indicating that 11 to 21-inch dbh plantationsin this area would provide adequate habitat <strong>for</strong> owls during <strong>the</strong>nonbreeding season.Solis (1983) and Solis and Gutierrez (1990) also presented data on use ofhabitats categorized by overstory and understory canopy coverage. Stands inwhich both <strong>the</strong> overstory and understory canopy cover exceeded 70 percenthad more use than stands with a less well-developed overstory and much moreuse than stands with a poorly developed overstory and understory (Table B. 12).These birds thus concentrated <strong>the</strong>ir activities in stands having high canopycoverage in <strong>the</strong> overstory and understory.Zabel et al. (1991), working on <strong>the</strong> Six Rivers and Klamath National Forests,found only slight tendencies by owls on ei<strong>the</strong>r <strong>for</strong>est to select particular standtypes, categorized by ei<strong>the</strong>r mean dbh or canopy cover (Table B. 13). Only half<strong>the</strong> owls showed significant selection <strong>for</strong> any habitat (i.e., chi-square analysisrejected <strong>the</strong> hypo<strong>the</strong>sis of random distribution), and patterns of use variedbetween owls. In <strong>the</strong> Klamath National Forest, owls showed slight preference<strong>for</strong> 21 to 36-inches trees, but no preference <strong>for</strong> trees more than 36 inches. In<strong>the</strong> Six Rivers National Forest owls showed no preference <strong>for</strong> 21 to 36-inchestrees and slight preference <strong>for</strong> more than 36 inches trees. Stands were alsodivided into those that did and did not meet <strong>the</strong> Forest Service definition of305
suitable habitat <strong>for</strong> that region (more than 21 inches dbh, more than 20percent dominant canopy cover, and more than 70 percent total canopy cover).A use-availability analysis showed that 69 percent of <strong>the</strong> owls showed significantpreference <strong>for</strong> suitable habitat during <strong>the</strong> breeding season and 39 percentdid so during <strong>the</strong> nonbreeding season. The authors concluded that habitatpreferences were exhibited <strong>for</strong> stands with large trees and high canopy cover,but that <strong>the</strong> preferences were weaker in this study than in o<strong>the</strong>r studies.An example in which owls may not have avoided more open areas is providedby Kerns (1989) who studied radio-transmittered birds in managed stands in<strong>the</strong> Cali<strong>for</strong>nia Coast province. He monitored three birds during <strong>the</strong> breedingseason, obtaining 94, 95, and 151 locations. Habitat in <strong>the</strong> area used by eachTable B.12. Relative use by nor<strong>the</strong>rn spotted owls of stands with different over- andunder-story canopy coveragea-Canopy cover No. of No. Obsns.observa- No. of per 100Over- Under tions acres acresstory -story41-70% 41-70% 314 1568 20.00.40% 41-70% 88 1363 6.50-40% 0-40% 89 3191 2.8--Data from Solis (1983).I/11 I -...... 111.111,11, .......... - --- - -- - - , I ....... 1.111,111, .............. ......... I..Table B.13. Habitat selection by spotted owls in <strong>the</strong> Klamath and Six Rivers NationalI Forests (source: Zabel et al. 1991).Klamath Nat'l Forest(Ukonum District)aSix Rivers Nat'l Forest(Mad River District)b%of %of %of %ofVariable Value Study area Locations Study area LocationsMean dbh 36" 24 23 31 39Canopy
Discussionbird varied considerably in canopy closure. The density of locations <strong>for</strong> onebird ("Bill") was higher in areas with higher canopy closure; one bird ("Luke")did not appear to discriminate on <strong>the</strong> basis of canopy cover; and <strong>the</strong> third bird("Betsy") used thinned, and thus more open, stands more than unthinned,more closed stands. Kerns (1989) reported that brush rabbits comprised 33percent of <strong>the</strong> prey (by biomass) of <strong>the</strong> owls he studied. (By contrast, thisspecies comprised less than 1 percent of <strong>the</strong> biomass in <strong>the</strong> diet of <strong>the</strong> birdsstudied by Solis 1983.) Possibly, birds feeding heavily on brush rabbits do notshow a strong preference <strong>for</strong> stands with dense canopies, but more data areneeded to resolve this question.A few studies have investigated preferences <strong>for</strong> o<strong>the</strong>r habitat features.Blakesley et al. (1992) found that roosting occurred more often at elevations of1,000 to 3,000 feet than would be expected if sites were distributed randomlywith respect to elevation. In contrast, Zabel et al. (1991) found that lowelevations were preferred at both of <strong>the</strong> <strong>for</strong>ests <strong>the</strong>y studied during bothseasons. Blakesley et al. (1992) found that owls avoided gentle slopes buto<strong>the</strong>r slopes were used in proportion to <strong>the</strong>ir availability. Zabel et al. (1991)found no preferences <strong>for</strong> slope. Blakesley et al. (1992) did not detect anypreferences by owls <strong>for</strong> a particular aspect, and detected a preference <strong>for</strong>roosting on <strong>the</strong> lower third of slopes. Thus, in general, preferences <strong>for</strong> <strong>the</strong>sefeatures were ei<strong>the</strong>r weak or inconsistent among sites.Recent results indicate that <strong>the</strong> pattern of habitat selection in Cali<strong>for</strong>nia ismore complex than that in Oregon and Washington north of <strong>the</strong> Klamathprovince and west of <strong>the</strong> Cascade crest. The 11 to 21 -inch diameter categoryused in <strong>the</strong>se stands corresponds roughly to <strong>the</strong> "young" category in Thomas etal. (1990). In <strong>the</strong> studies Thomas et al. (1990) reviewed, this size class wasavoided by 55 percent of 130 birds and only preferred by 3 percent of <strong>the</strong>m.Solis and Gutierrez (1990) found similar patterns, but Blakesley et al. (1992)and Zabel et al. (1991) found little or no tendency to avoid this size class. Thework of Sisco (1990) is particularly interesting. The birds he studied showedfew preferences <strong>for</strong> habitat defined by mean diameter, but <strong>the</strong>y selected sites<strong>for</strong> roosting and <strong>for</strong>aging that were similar to sites in old-growth stands.The analyses employing canopy cover as well as tree diameter suggested thatboth of <strong>the</strong>se variables may be important in determining preferred habitat inCali<strong>for</strong>nia. Results from <strong>the</strong> work of Solis (1983) summarized in Table B. 12suggested that both overstory and understory canopy cover were positivelycorrelated with use by owls, as does <strong>the</strong> report by Zabel et al. (1991) in whichowls generally preferred habitats meeting <strong>the</strong> Forest Service's definition ofsuitable habitat.Additional use-availability analyses employing different habitat definitions, andfunctional studies of <strong>the</strong> specific resources provided by <strong>the</strong>se habitats, shouldimprove our ability to discern highly preferred and avoided habitats in Cali<strong>for</strong>nia.Studies from <strong>the</strong> Cali<strong>for</strong>nia Coast province, <strong>the</strong> Cali<strong>for</strong>nia Cascades, and<strong>the</strong> eastside of <strong>the</strong> Cascades are also needed.Abundance of <strong>Owl</strong>s in Different HabitatsThomas et al. (1990) concluded that in most parts of <strong>the</strong> range density wasextremely low in landscapes dominated by stands less than 80 years old andlacking old-growth, and that density increased with <strong>the</strong> amount of old-growthpresent in a landscape or study plot. Thomas et al. (1990) also noted thatrecent studies in Cali<strong>for</strong>nia "strongly suggest that suitable and even superior307
ResultsDiscussionspotted owl habitat can develop faster in coastal <strong>for</strong>est of redwood and mixedredwood and Douglas-fir" (p. 185) and that "<strong>the</strong> full range of suitable habitats<strong>for</strong> spotted owls in Cali<strong>for</strong>nia has not yet been determined" (p. 166). Reportsappearing since Thomas et al. (1990) are described in <strong>the</strong> following section.Carey et al. (1991) found spotted owls only in old-growth stands during a studyin <strong>the</strong> sou<strong>the</strong>rn Oregon Coast Range. Three owls were recorded in 1985, andsix were recorded in 1986. The results showed a statistically significanttendency <strong>for</strong> abundance to increase with stand age, but sample sizes wereinadequate to test <strong>the</strong> null hypo<strong>the</strong>sis that abundance is equal in mature andold-growth stands.Blakesley et al. (1992) found 79 nest sites in stands of 11 to 21 inches or morethan 21 inches and no nests in o<strong>the</strong>r habitats. Nest densities per acre werevirtually identical in <strong>the</strong> two habitats. Sites also were characterized by elevation,position, aspect, and slope. Elevations less than 1,000 feet were avoidedand nests were concentrated in <strong>the</strong> lower third of slopes. No preferences werefound <strong>for</strong> aspect or slope.Meyer et al. (1992) reported that <strong>the</strong> amount of mature and old-growth <strong>for</strong>estin circles at owl sites was higher than <strong>the</strong> amount in randomly placed sites, afinding that is consistent with previous work. However, when individualsuccessional stages were analyzed, only <strong>the</strong> amount of old-growth habitat wassignificantly greater at owl sites than at randomly placed sites.We analyzed <strong>the</strong> data provided by Self and Brown (pers. comm.) to investigaterelative densities of nests in different habitats. We defined <strong>the</strong> study area as all<strong>the</strong> land within 1.3 miles of <strong>the</strong> nests and recorded <strong>the</strong> amounts of differenthabitats in this area, and <strong>the</strong> number of nests per square mile of each habitattype. This type of analysis should not be used to estimate density of nests (orowls) in a given habitat across <strong>the</strong> entire landscape. For example, if a habitatwere highly preferred <strong>for</strong> nesting and occurred only in scattered patches, <strong>the</strong>n<strong>the</strong> process discussed previously would substantially underestimate truedensity. The analysis probably does provide a valid indication of relativepreference, however, especially when substantial differences in density occurbetween habitats. In <strong>the</strong> data from Self and Brown (pers. comm.) nests wereconcentrated in <strong>the</strong> stands with <strong>the</strong> largest trees and densest canopy (TableB. 14). Density was next highest in stands with smaller trees but dense canopies,and was lower in stands with more open canopies and ei<strong>the</strong>r large ormedium size trees. The study also suggested that montane <strong>for</strong>est types werenot as preferred as Douglas-fir or mixed conifer types. Solis (1983:33, 41) alsocommented that <strong>the</strong> owls he studied seemed to avoid montane <strong>for</strong>est types.The suggestion by Thomas et al. (1990) that more work was needed on habitatsuitability in Cali<strong>for</strong>nia is supported by <strong>the</strong> recent results reported earlier.Findings by Blakesley et al. (1992) and Self and Brown (pers. comm.) thatnests were almost equally common in stands with mean tree diameters of 11 to21 inches and more than 21 inches provides a sharp contrast to results fromOregon and Washington. It is also noteworthy that in <strong>the</strong> study by Self andBrown (pers. comm.) density varied much more with canopy cover than it didwith tree diameter (Table B. 14). The structural features of nest sites in Cali<strong>for</strong>nia(Table B.2) show a remarkable similarity to <strong>the</strong> structure of old-growthsites and nest sites elsewhere in <strong>the</strong> range. This suggests that owls in Cali<strong>for</strong>niaare selecting sites with large trees even when <strong>the</strong> mean diameter in <strong>the</strong>308
Table B.14. Habitata within 1.3 miles of 21 nor<strong>the</strong>rn spotted owl nests on managedlands in <strong>the</strong> eastern Klamath province (Self and Brown, pers. comm.).IAverage Canopy Area Number Nests perDiameter Cover (m, 2 ) of nests m1 2>24" >60% 12.26 10 0.8211-24" >60% 4.94 3 0.61>24" 40-60% 4.23 1 0.2411-24" 40-60% 36.12 7 0.21a Area covered by stands of Douglas-fir with an understory of tanoak and madrone or by stands of Klamath mixed conifers (white fir, Douglas-fir,ponderosa pine, incense cedar, and sugar pine with an understory of oak and maple).. .stand is well below <strong>the</strong> mean in old-growth stands. This hypo<strong>the</strong>sis should beinvestigated carefully because it has important implications <strong>for</strong> <strong>the</strong> design ofstrategies to protect owls in managed <strong>for</strong>estlands.The combination of density (and demographic) data and structural features at<strong>the</strong> nest site and in <strong>the</strong> nest stand provides a powerful data set <strong>for</strong> analyzinghabitat preferences. Similar in<strong>for</strong>mation from o<strong>the</strong>r parts of Cali<strong>for</strong>nia, and on<strong>the</strong> east side of <strong>the</strong> Cascades will be particularly useful in <strong>the</strong> future.Demographic Rates in Different HabitatsResultsThomas et al. (1990) reported that proportion of territories with pairs andreproductive success declined as <strong>the</strong> amount of old-growth declined. Thisconclusion was based both on Forest Service monitoring data and on landscapestudies. Results appearing since Thomas et al. (1990) are described in<strong>the</strong> next section.Meyer et al. (1992) did not find any consistent relationships between <strong>the</strong>number of years that sites were occupied by owls and various measures of<strong>for</strong>est fragmentation.We reanalyzed <strong>the</strong> data from Meyer et al. (1992) to determine whe<strong>the</strong>r turnoverof adults varied with <strong>the</strong> amount of older <strong>for</strong>est (i.e., more than 120 years)present in <strong>the</strong> circle. Persistence of adults was defined as <strong>the</strong> probability thata bird present in a circle at <strong>the</strong> start of a year would be found at <strong>the</strong> site <strong>the</strong>next year, given that <strong>the</strong> site was revisited in <strong>the</strong> following year. The consensusamong spotted owl biologists is that adults rarely change breeding sites (Lintpers. comm., Franklin pers. comm., Gutierrez pers. comm., Miller pers. comm.,Wagner pers. comm.). For example, in <strong>the</strong> Andrews study area in <strong>the</strong> westernOregon Cascades, during 305 pair-years, divorce and settlement elsewhereoccurred in, at most, four cases and was never established with certainty(Swindle and DeStefano pers. comm.). Persistence, as measured above,probably indicates adult survivorship, although we believe this issue needsfur<strong>the</strong>r study. We obtained data from <strong>the</strong> 50 circles studied by Meyer et al.(1992), and Johnson (pers. comm.) supplied us with similar owl and habitat309
__Discussiondata from 41 sites in <strong>the</strong> Andrews study area. We did not have individualidentification on <strong>the</strong> birds from <strong>the</strong> Meyer et al. (1992) study so disappearancesthat were replaced be<strong>for</strong>e <strong>the</strong> start of <strong>the</strong> next season would not have beendetected. We did have individual identification <strong>for</strong> <strong>the</strong> birds on <strong>the</strong> AndrewsForest and more accurate estimates of turnover rates.We analyzed <strong>the</strong> two data sets separately and in combination. In all threeanalyses, persistence increased with habitat quality. The increase was significantin <strong>the</strong> BLM data set, not significant in <strong>the</strong> Andrews data set, and highlysignificant in <strong>the</strong> combined data set (Figure B. 1, Table B. 15). Nei<strong>the</strong>r <strong>the</strong>slopes nor <strong>the</strong> intercepts in <strong>the</strong> two data sets differed significantly (or close tosignificantly). In <strong>the</strong> combined data set, <strong>the</strong>re was no evidence of nonlinearity.Heteroscedasticity (i.e., unequal variances) was evident but this causes no biasin <strong>the</strong> estimate of slope.Simpson Timber Company (1991) reported that 0.72 young per pair wereproduced by 50 owl pairs in 1990 and that 0.63 young per pair were producedby 92 pairs in 1991; 68 percent of <strong>the</strong> new recruits in 1991 were adults, and:<strong>the</strong> turnover rate between 1990 and 1991 was 15 percent; three of 19 birdswere found elsewhere and had moved ra<strong>the</strong>r than died. These values weresimilar to <strong>the</strong> values obtained nearby in <strong>the</strong> Willow Creek study area.The evidence suggesting that adult survivorship varies with amount of older<strong>for</strong>est in <strong>the</strong> home range is important because population viability is highlysensitive to adult survival rates. Obtaining more in<strong>for</strong>mation of this sort shouldbe a high priority <strong>for</strong> <strong>the</strong> future.Results from Simpson Timber Company suggesting that rates of reproductionand adult survival are similar on Simpson's land and at Willow Creek areencouraging. The next few years should provide a good indication of howsimilar long-term reproduction and survival rates are at <strong>the</strong>se two sites andprovide a good basis <strong>for</strong> developing conservation programs on private land inthis area. Identifying <strong>the</strong> key habitat features and analyzing whe<strong>the</strong>r <strong>the</strong>y willremain present in <strong>the</strong> future should be a high priority in this study.Table B.1 5. Regression analysis of occupancy data from <strong>the</strong> Andrews ExperimentalForest and <strong>the</strong> BLM in Oregon.Regression Equation Standard LevelNumber (h = proportion of Error ofof area covered by of <strong>the</strong> Signi-Study Nests suitable habitat) Slope ficanceBLM 50 0.58 + 0.40h 0.18 -0.03AndrewsExperimentalForest 41 0.75 + 0.19h 0.18 -0.30Combineddata set 91 0.63 + 0.39h 0.12 -0.005310
1.0 x xx x x 0 )OOQOX xx 0 OXO 000 x 0o0 0 0o0 000.8 H- x0xx00 00xxx xx xx xo x ox 00 0 0 000 0xxo 0 0x x x0.6 1-x x o xgC,)0 0 0C) 0.4xxAndrews Experimental Forest 0Andrews Experimental Forest °Oregon Cascades Province0.2XBLM land in sou<strong>the</strong>rn Oregon x0.00.0 0.2 0.4 0.6 0.8 1.0Proportion Suitable HabitatFigure B. 1. Relationship between annual adult survival rates and proportion of <strong>the</strong> area within 1.3 miles of <strong>the</strong> activity center covered by older <strong>for</strong>est.
Recommendations <strong>for</strong> Future ResearchWe conclude with brief recommendations about priorities <strong>for</strong> future research.These suggestions should be discussed in detail by spotted owl biologists and<strong>the</strong> agencies that will carry out much of <strong>the</strong> work. The <strong>Recovery</strong> Team shouldhelp facilitate <strong>the</strong> discussion and ensure that all groups involved in owl conservationparticipate in developing <strong>the</strong> research priorities. The following discussionis intended to help meet that objective.Several suggestions <strong>for</strong> future research are included in Appendix A, some ofwhich involve studies of habitat suitability (e.g., study of dispersal habitat and<strong>the</strong> behavior of dispersing juveniles, and development of <strong>the</strong> landscape model).Those studies are not repeated here.Standardize habitat measurementsA clear need exists to standardize measurements used to describe habitat at<strong>the</strong> stand and landscape level. For example, <strong>the</strong> in<strong>for</strong>mation on stand structureat utilized sites (e.g., Tables B.2 through B.5) would be more useful if <strong>the</strong>same variables had been measured by all investigators. A draft protocol <strong>for</strong>sampling vegetation in spotted owl habitats developed by Bingham (pers.comm.) might serve as <strong>the</strong> basis <strong>for</strong> developing such standards.Prepare habitat maps<strong>for</strong> demographic study areasDetailed habitat maps are not yet available <strong>for</strong> all demographic study areas.Completing <strong>the</strong>se maps and integrating <strong>the</strong> habitat and owl data in a geographicin<strong>for</strong>mation system should be a high priority <strong>for</strong> <strong>the</strong> next few years.The resulting in<strong>for</strong>mation would be of great value in all four types of habitatsuitability studies described earlier.Give high priority to studying selected areasMore in<strong>for</strong>mation on <strong>the</strong> four issues described earlier is needed <strong>for</strong> certaingeographic areas. A few of <strong>the</strong>se are described here.Cali<strong>for</strong>nia Coast: As previously noted, preliminary results suggest that owldensity is particularly high on parts of Simpson Timber Company land,suggesting that <strong>the</strong> Cali<strong>for</strong>nia Coast province could be of great value in <strong>the</strong>owl recovery program. At present, however, we know little of habitat use orsuitability in this province. More in<strong>for</strong>mation on all aspects of habitatsuitability is being collected by Simpson and o<strong>the</strong>r private landowners.These ef<strong>for</strong>ts should be encouraged. Particular ef<strong>for</strong>t should be made toidentify <strong>the</strong> specific features that determine <strong>the</strong> suitability of 45 to 55-yearoldstands <strong>for</strong> owls and owl prey. Such in<strong>for</strong>mation will be critical in determininghow to manage <strong>the</strong>se stands in <strong>the</strong> future so that <strong>the</strong>y will providesuitable habitat <strong>for</strong> owls.Eastern Cali<strong>for</strong>nia: Little is known at present of what habitats are used byowls in <strong>the</strong>se areas. Telemetry studies and continued estimation of demographicrates would greatly improve our knowledge of habitat requirements.The work begun by Self and Brown (pers. comm.) should be continued.Banding <strong>the</strong> birds on <strong>the</strong>se study sites should be a particularly high priority.East Cascades (Oregon and Washington): Preliminary evidence summarizedin Thomas et al. (1990) and Buchanan (1991) indicated that owls insome of this region are abundant and are using a wide variety of habitat312
types. Work in Washington is continuing and should receive high priority.Use of habitat by radio-transmittered birds and adult turnover rates will beof particular interest.Give high priority to studying selected habitatsMore in<strong>for</strong>mation on <strong>the</strong> four issues previously described is needed <strong>for</strong> certainhabitats. A few of <strong>the</strong>se are described here.10 to 20-inch dbh plantations with remnant larger trees: As noted inThomas et al. (1990), many sites are known where owls occur in youngstands with remnant large trees. This finding suggests that leaving a fewlarge trees at harvest might cause sites to become suitable <strong>for</strong> owls muchsooner than <strong>the</strong>y would o<strong>the</strong>rwise. With rotation ages of 60 to 80 years,such sites might never be suitable <strong>for</strong> owls if no trees are left, but mightprovide some useful habitat <strong>for</strong> a few decades prior to harvest if large treeshad been left at <strong>the</strong> previous harvest. This possibility is encouraging, but atpresent we know little of what makes existing sites valuable <strong>for</strong> owls. It isthus possible that leaving a few large trees will have little beneficial effect onowls, or that <strong>the</strong> benefits could be obtained in o<strong>the</strong>r, less expensive ways.Studies are <strong>the</strong>re<strong>for</strong>e needed to identify <strong>the</strong> specific resources (e.g., owl prey)provided by existing sites with young stands and remnant larger trees.Stands managed with selective harvest: Much of <strong>the</strong> east side <strong>for</strong>est andKlamath province is managed with selective harvest regimes. At present wehave little in<strong>for</strong>mation on <strong>the</strong> suitability of <strong>the</strong>se habitats <strong>for</strong> owls. Telemetrystudies are needed to determine relative use by owls of partially harvestedand unharvested old-growth stands. Functional studies evaluatingabundance and availability of prey would also be useful in helping usunderstand <strong>the</strong> current potential value to owls of selectively harvested sites.Areas where salvage is economicallyfeasible: Little in<strong>for</strong>mation isavailable at present to help guide <strong>the</strong> development of policies on how muchsalvage should be permitted in DCAs or o<strong>the</strong>r owl protection areas. Morein<strong>for</strong>mation is needed about use by owls of such areas <strong>for</strong> <strong>for</strong>aging andabout <strong>the</strong> effects of <strong>the</strong> harvestable snags and logs in accelerating return of<strong>the</strong> stand to suitable habitat <strong>for</strong> owls.Study functions and ways of developing understoryAppendix G discusses silvicultural methods <strong>for</strong> accelerating <strong>the</strong> development ofsuitable habitat, and places particular emphasis on producing stands with <strong>the</strong>"reversed J" size-class distribution of trees (i.e., <strong>the</strong> number of trees decreasesas <strong>the</strong> diameter increases). At present, however, we know little about why owlsfrequent stands with well-developed understories, and we lack detailed silviculturalstudies showing how this understory can best be developed in differentregions and conditions. Both of <strong>the</strong>se issues should be studied.313
314
Literature CitedAllen, H.L., K.R. Dixon, and K.L. Knutson. 1989. Cooperative administrativestudy to monitor spotted owl management areas in national <strong>for</strong>ests inWashington. Final Report. 165 pp.Asrow, E. 1983. Scott River Ranger District spotted owl habitat analysisproject. USDA Forest Service, Klamath National Forest. December 1983.Benson, G. 199 la. Stand-level in<strong>for</strong>mation <strong>for</strong> spotted owl habitat, WenatcheeNational Forest. Unpublished manuscript. Administrative record <strong>for</strong> <strong>the</strong>Nor<strong>the</strong>rn <strong>Spotted</strong> <strong>Owl</strong> <strong>Recovery</strong> Team, U.S. Fish and Wildlife Service, Portland,Oregon.Benson, G. 1991b. Characterization of spotted owl habitat in Washington,Oregon, and nor<strong>the</strong>rn Cali<strong>for</strong>nia. Unpublished manuscript. Administrativerecord <strong>for</strong> <strong>the</strong> Nor<strong>the</strong>rn <strong>Spotted</strong> <strong>Owl</strong> <strong>Recovery</strong> Team, U.S. Fish and WildlifeService, Portland, Oregon.Bingham, B. 1991. Stand level characteristics of nor<strong>the</strong>rn spotted owl habitatson <strong>the</strong> Mad River District of Six Rivers National Forest. Unpublishedmanuscript.Bingham, B.B. and J.O. Sawyer. 1991. Distinctive features and definitions ofyoung, mature, and old-growth Douglas-fir/hardwood <strong>for</strong>ests. Pp. 363-377in Ruggiero, L.F., K.B. Aubry, A.B. Carey, and M.H. Huff, Wildlife andvegetation of unmanaged Douglas-fir <strong>for</strong>ests. USDA General TechnicalReport PNW-GTR-285.Blakesley, J.A., A.B. Franklin, and R.G. Gutierrez. 1992. <strong>Spotted</strong> owl roostand nest site selection in northwestern Cali<strong>for</strong>nia. Journal of WildlifeManagement 56:ln press.Buchanan, J.B. 1991. <strong>Spotted</strong> owl nest site characteristics in mixed conifer<strong>for</strong>ests of <strong>the</strong> Eastern Cascade Mountains, Washington. M.S. <strong>the</strong>sis, Universityof Washington. Unpublished. 140 pp.Carey, A.B., M.M. Hardt, S.P. Horton, and B.L. Biswell. 1991. Spring birdcommunities in <strong>the</strong> Oregon Coast Range. Pp. 122-142 in Wildlife andvegetation of unmanaged Douglas-fir <strong>for</strong>ests. USDA Forest Service, PacificNorthwest Research Station, General Technical Report PNW-GTRR-285. 533PP.Chavez-Leon, G. 1989 Characteristics of fragmented habitats used by <strong>the</strong>nor<strong>the</strong>rn spotted owl (StrLx occidentalis caurnna) in northwestern Cali<strong>for</strong>nia.M.S. <strong>the</strong>sis, Humboldt State University, Arcata, Cali<strong>for</strong>nia. Unpublished. 60PP.Folliard, L.B. and Reese, K.P. 1991. Nest site characteristics of nor<strong>the</strong>rnspotted owls in second-growth <strong>for</strong>ests of northwest Cali<strong>for</strong>nia. Annualreport <strong>for</strong> 1990. Unpublished manuscript. 24 pp.Grenier, J. 1991. Review of in<strong>for</strong>mation on structure of old-growth stands andold-growth stands used by spotted owls in western Oregon and Washington.Unpublished manuscript. Administrative record <strong>for</strong> <strong>the</strong> Nor<strong>the</strong>rn <strong>Spotted</strong><strong>Owl</strong> <strong>Recovery</strong> Team, U.S. Fish and Wildlife Service, Portland, Oregon.315
Hamer, T. 1988. Home range size of <strong>the</strong> nor<strong>the</strong>rn barred owl and nor<strong>the</strong>rnspotted owl in western Washington. M.S. <strong>the</strong>sis. University of Washington,Seattle, Washington. 86 pp.Jimerson, T., Bingham, B.B., Solis, D., MacMeeken, S. 1991a. Draft ecologicaldefinition <strong>for</strong> old-growth Douglas-fir/tanoak/madrone (Society of AmericanForester's type 234). Unpublished manuscript.Jimerson, T., Bingham, B.B., Solis, D., Macmeeken, S. 1991b. Draft ecologicaldefinition <strong>for</strong> old-growth Pacific Douglas-fir (Society of AmericanForester's type 229). Unpublished manuscript.Kems, S.J. 1989. Occurrence of spotted owls in managed timber stands onlands of The Pacific Lumber Company. Progress report July 1, 1989.Unpublished manuscript.LaHaye, W.S. 1988. Nest site selection and nesting habitat of <strong>the</strong> nor<strong>the</strong>rnspotted owl (St-x occidentalis caurina) in northwest Cali<strong>for</strong>nia. M.S. <strong>the</strong>sis.Humboldt State University, Arcata, Cali<strong>for</strong>nia. 111 pp.Lehmkuhl, J.F. and M.G. Raphael. 1992. Habitat pattern around spotted owllocations on <strong>the</strong> Olympic Peninsula, Washington. Journal of Wildlife Management.In Press.Meyer, J.S., L.L. Irwin, and M.S. Boyce. 1992. Influence of habitat fragmentationon spotted owl site location, site occupancy, and reproductive status inwestern Oregon. Progress report, January 31, 1992. Unpublished manuscript.Pious, M. 1989. The nor<strong>the</strong>rn spotted owl in managed, second- growth coastalredwood <strong>for</strong>ests, Mendocino County, Cali<strong>for</strong>nia. Preliminary results. Unpublishedmanuscript.Simpson Timber Company. 1991. Draft habitat conservation plan <strong>for</strong> <strong>the</strong>nor<strong>the</strong>rn spotted owl. Unpublished report. Simpson Timber Company,Arcata, Cali<strong>for</strong>nia. 205 pp.Sisco, C.L. and Gutierrez, R.J. 1984. Winter ecology of radio- tagged spottedowls on <strong>the</strong> Six Rivers National Forest, Humboldt Co., Cali<strong>for</strong>nia. USDAForest Service. Unpublished Technical Final Report on file Six RiversNational Forest, Eureka, Cali<strong>for</strong>nia. 138 pp.Sisco, C.L. 1990. Seasonal home range and habitat ecology of spotted owls innorthwestern Cali<strong>for</strong>nia. M.S. <strong>the</strong>sis. Humboldt State University, Arcata,Cali<strong>for</strong>nia. 81 pp.Solis, D.M., Jr. 1983. Summer habitat ecology of spotted owls in northwesternCali<strong>for</strong>nia. M.S. <strong>the</strong>sis. Humboldt State University, Arcata, Cali<strong>for</strong>nia. 168PP.Solis, D.M. Jr. and R.J. Gutifrrez. 1990. Summer habitat ecology of nor<strong>the</strong>rnspotted owls in northwestern Cali<strong>for</strong>nia. Condor 92:739-748.Spies, T.A., J.F. Franklin, and T.B. Thomas. 1988. Coarse woody debris inDouglas-fir <strong>for</strong>ests of western Oregon and Washington. Ecology 68:1689-1702.316Thomas, J.W., E.D. Forsman, J.B. Lint, E.C. Meslow, B.R. Noon, J. Verner.1990. A conservation strategy <strong>for</strong> <strong>the</strong> nor<strong>the</strong>rn spotted owl. U.S. GovernmentPrinting Office 1990-791-171/20026. 427 pp.
Van Home, B. 1983. Density as a misleading indicator of habitat quality.Journal of Wildlife Management 47:893-901.White, G.C. and R. A. Garrott. 1990. Analysis of wildlife radio-tracking data.Academic Press. New York, New York. 383 pp.Zabel, C.J., B.B. Bingham, K. McKelvey, and B.R. Noon. 1991. Home rangesize and habitat use patterns of nor<strong>the</strong>rn spotted owls in northwesternCali<strong>for</strong>nia and southwestern Oregon. Unpublished manuscript.317
318
Appendix CDemographic Analysis of Nor<strong>the</strong>rn<strong>Spotted</strong> <strong>Owl</strong> PopulationsDavid R. AndersonKenneth P. BurnhmnColorado Cooperative Fish and Wildlife Resource UnitColorado State University319
320
1. IntroductionThe 1990 Status Review Nor<strong>the</strong>rn <strong>Spotted</strong> <strong>Owl</strong> (USDI 1990) provided estimatesof <strong>the</strong> rate of population change <strong>for</strong> populations of nor<strong>the</strong>rn spotted owls innor<strong>the</strong>rn Cali<strong>for</strong>nia (Willow Creek and surrounding regional study area) andsou<strong>the</strong>rn Oregon (<strong>the</strong> Roseburg study area). The population of resident femaleowls in <strong>the</strong>se areas was shown to be declining at a significant rate. By <strong>the</strong> fallof 1991, <strong>the</strong>re were 2 additional years of capture-recapture data on <strong>the</strong>se twopopulations, and three new areas (Med<strong>for</strong>d in sou<strong>the</strong>rn Oregon, H.J. Andrewsnear Corvallis, Oregon, and <strong>the</strong> Olympic Peninsula in northwestern Washington)had sufficient years of capture-recapture data to warrant an intensiveanalysis (Table C. 1). More than 2,000 owls had been marked and <strong>the</strong>resighting probability <strong>for</strong> adult females was approximately 0.8 to 0.9 percent.This appendix provides estimates of <strong>the</strong> rate of population change of resident,territorial females in <strong>the</strong>se five large study areas. Analysis methods (e.g.,model building, model selection, tests of model fit, parameter estimation, andinference procedures concerning <strong>the</strong> rate of population change) are those usedin USDI (1990) with some extensions. The key references on methodology areBurnham and Anderson (In Press) and Lebreton et al. In Press). The analysesof data were done during September-October 1991, during two intensiveworkshops held in Fort Collins, Colorado. The analyses were completed by sixbiologists working on <strong>the</strong> nor<strong>the</strong>rn spotted owl-two French scientists, twoprofessors from Colorado State University with special expertise in <strong>the</strong> analysisof capture-recapture data, and two U.S. Fish and Wildlife Service employeesfrom <strong>the</strong> Colorado Cooperative Fish and Wildlife Research Unit.2. Results and DiscussionTwo parameters are of critical interest; A = finite (i.e., annual) rate of change in<strong>the</strong> size of <strong>the</strong> population of females, and $ = annual probability of survival ofadult females. Maximum likelihood estimates of <strong>the</strong>se parameters are shownas A and $, respectively, along with estimates of <strong>the</strong>ir precision (i.e., se (A) ande ($)). If <strong>the</strong> number of resident females is 'stationary," <strong>the</strong>n X = 1, while if <strong>the</strong>population is declining, <strong>the</strong>n X < 1. Thus, <strong>the</strong>re is interest in testing <strong>the</strong> nullhypo<strong>the</strong>sis Ho: X < 1 against <strong>the</strong> alternative hypo<strong>the</strong>sis Ha: X < 1. Proper estimationof X answers <strong>the</strong> critical question, "Have <strong>the</strong> resident, territorial femalesreplaced <strong>the</strong>mselves?"/Table C.1. Summary in<strong>for</strong>mation on <strong>the</strong> five demographic study areas.TotalApproximate Size Years of IndividualsName of Study Area Marking MarkedNorthwest Cali<strong>for</strong>nia 4,000 1985-91 400H.J. Andrews (western Oregon) 116 1987-91 358Med<strong>for</strong>d (southwestern Oregon) 4,050 1985-91 703Roseburg (southwestern Oregon) 1,700 1985-91 589Olympic Peninsula (northwestern Washington) 965 1987-91 302321
Parameter Estimates<strong>for</strong> Individual Study AreasThe estimation of X was based on <strong>the</strong> Leslie-Lefkovitch approach summarizedin USDI (1990). Under this method, estimates of age-specific survival andfecundity are needed <strong>for</strong> <strong>the</strong> female component of <strong>the</strong> population. Modelselection <strong>for</strong> <strong>the</strong> estimation of survival probabilities relied on <strong>the</strong> AkaikeIn<strong>for</strong>mation Criterion (AIC), however some use of likelihood ratio tests wasmade. Data from <strong>the</strong> five study areas supported only two age-classes <strong>for</strong>annual survival estimates Uuvenile and all older classes = 'adults"). Estimatesof <strong>the</strong>se parameters and measures of <strong>the</strong>ir precision are presented in TableC.2.Estimates of age-specific fecundity of females also followed <strong>the</strong> procedures inUSDI (1990), and <strong>the</strong>se are summarized in Table C.3. with a measure of <strong>the</strong>precision of <strong>the</strong> estimates.Estimates of X, computed from <strong>the</strong> estimates in Tables C.2. and C.3., estimatedprecision, and test statistics related to <strong>the</strong> null hypo<strong>the</strong>sis (above) appear inTable C.4. While <strong>the</strong>re are several potential biases in <strong>the</strong>se estimates, it isclear from Table C.4. that <strong>the</strong> population of resident, territorial females hasdeclined in each of <strong>the</strong> five study areas. The simple average of <strong>the</strong> estimateswas X = 0.9022 which indicates a rate of decline of approximately 10 percentper year during 1985-199 1. Thus, <strong>the</strong> resident population was not replacingitself in any of <strong>the</strong> five large study areas. This is a critical finding. In eachcase, X is significantly less than 1 (see test statistics and P-values in TableC.4.). No statistical inference is made concerning x prior to <strong>the</strong>se years ofstudy or in <strong>the</strong> future. These estimates of X represent a 5- or 6-year "snapshot"of <strong>the</strong> average annual change in <strong>the</strong> female component of <strong>the</strong>se five populations.The t-test is based on <strong>the</strong> empirical variance among <strong>the</strong> five independentestima es of X, while <strong>the</strong> z-test is based on <strong>the</strong> <strong>the</strong>oretical standard error of X(i.e., IF var(,) /5). The t-test allows <strong>for</strong> significant variation in X within <strong>the</strong> fivestudy areas, however, a test <strong>for</strong> such variation was not significant (K2=5.1409,4 df, P=0.2731, (see Burnham et al. 1987:264-269). The estimated standardTable C.2. Estimates of age-specific annual survival rates <strong>for</strong> female nor<strong>the</strong>rnspotted owls.Study Area First Year All Later YearsV322hid SC 0 J) $j se($J)Northwest Cali<strong>for</strong>nia 0.1946 0.0509 0.8507 0.0224H.J. Andrews (western Oregon) 0.3112 0.1033 0.8365 0.0312Med<strong>for</strong>d (southwestern Oregon) 0.2002 0.0513 0.7854 0.0258Roseburg (southwestern Oregon)a 0.2829 0.0366 0.8583 0.0131Olympic Peninsula (northwestern Washington)a 0.0707 0.0282 0.8603 0.02641. . - - - ---...- - 11 .......................... 1.. ..- ..-------.....a No sex-specific differences in adult survival were detectable, thus, <strong>the</strong> estimate of adult female survival includes adult males.
Table C.3. Estimates of age-specific fecundity (b) <strong>for</strong> female nor<strong>the</strong>rn spotted owls(number of juvenile females/female of age x).Subadult 1 (12 mos.) Subadult 2 (24 mos.) Adult (36 mos.)Study Area (6i) se(b 1 ) (62) ie(62) (6) se(b)Northwest Cali<strong>for</strong>nia 0.1154 0.0576 0.2286 0.0659 0.3576 0.0245H.J. Andrews (western Oregon) 0.1430 0.0780 0.1430 0.0780 0.3270 0.0500Med<strong>for</strong>d (southwestern Oregon) 0.1110 0.0386 0.1110 0.0386 0.3233 0.4880Roseburg (southwestern Oregon)a 0.0938 0.0547 0.0938 0.0547 0.3304 0.0385Olympic Peninsula 0.1000 0.0667 0.1000 0.0667 0.3327 0.0784(northwestern Washington)a* Year-specific differences in (b).b ___~~~~~~~~~~~~~~~~~~~~~~~~~~~~~~~~........., ., ... ....error of <strong>the</strong> true x across <strong>the</strong> five study areas (cJ was 0.0267 (95 percentconfidence interval is 0.0 to 0. 1073). Both tests indicate a strong rejection of<strong>the</strong> null hypo<strong>the</strong>sis, and one must conclude that <strong>the</strong>se populations are declining.Capture-recapture methods allow estimates, of <strong>the</strong> number of new entries into<strong>the</strong> population of resident, territorial females (standard Jolly-Seber estimates,see USDI(1990:35-36)). Estimates of this quantity, averaged over years, areTable C.4. Estimates of <strong>the</strong> finite rate of annual population change (X) <strong>for</strong> femalenor<strong>the</strong>rn spotted owls in five independent study areas throughout <strong>the</strong>ir range. Alsoshown are test statistics and P values <strong>for</strong> <strong>the</strong> test of <strong>the</strong> null hypo<strong>the</strong>sis that X > 1vs.X< 1.A~~~~~~~~~~~~~~~~~~~~~~~~~~~~~~~~~~~~~~~~~~~~~Study Area s(e) t or z PNorthwest Cali<strong>for</strong>nia 0.9153 0.0433 -1.9561 0.0252H.J. Andrews (western Oregon) 0.9276 0.0437 -1.6567 0.0488Med<strong>for</strong>d (southwestern Oregon) 0.8444 0.0304 -5.1184 0.0000Roseburg (southwestern Oregon) 0.9405 0.0182 -3.2692 0.0005Olympic Peninsula (northwestern Washington) 0.8828 0.0280 -4.1857 0.0000Simple average and t-test 0.9021 0.0173 -5/7532 0.0024Simple average and z-test 0.9021 0.0153 -6.4155 0.0000323
provided in Table C. 5. Study of <strong>the</strong> results of <strong>the</strong>se analyses indicated thatstatistically significant immigration had occurred each year in all five studyareas. The estimates of <strong>the</strong> number of new entries (BA) provide insight intohow populations in each area have been augmented by immigration fromoutside <strong>the</strong> study areas. These findings are consistent with those in <strong>the</strong> 1990Status Review (USDI).b. Meta-analysisThe majority of <strong>the</strong> capture-recapture data comes from adult birds (i.e.,nonjuveniles) and <strong>the</strong>re<strong>for</strong>e a sophisticated attempt was made to model andunderstand <strong>the</strong>se data <strong>for</strong> each of <strong>the</strong> five study areas. Models of capturerecapturedata must properly treat two types of parameters; conditionalsurvival probabilities (4) and conditional recapture probabilities (p) and how<strong>the</strong>se vary across study areas (g). Age was not a factor in this analysis as onlyadults were treated, and sex was not a factor as only females were of particularinterest. For <strong>the</strong>oretical reasons, much of <strong>the</strong> analysis was done on logit(o) andlogit(p), where, in general, logit(O) = log&(0/(1-0)). The parameters R and p mightvary by year (t), and models were derived to allow <strong>for</strong> this effect. Time (t) inyears was considered in two ways. First, <strong>the</strong> notation t denoted any significantvariability in 4 or p over years. Second, T was used to denote a linear trend intime in ei<strong>the</strong>r logit(o) or logit(p). Thus, a model allowing survival probabilitiesto vary across areas (g) and recapture probabilities to vary across years wasdenoted as (.g'PT).More complex models allowed several effects to be considered in a likelihoodframework. An asterisk (*) denoted independent factors (e.g., g*t indicated thatyear-dependent parameters were incorporated in a model separately <strong>for</strong> eachstudy area). Models employing a logit-linear structure were denoted by a "+"(e.g., g+t would indicate a model whereby study area was indexed by dummyvariables, and parameters across time would be parallel on a logit scale) (seeHosmer and Lemeshow 1989). In all models, a log-likelihood (log,(L)) was usedas <strong>the</strong> basis <strong>for</strong> statistical inference and estimation of model parameters wasbased on Maximum Likelihood methods. The model selection method (AIC)was objective: neighboring models were explored using likelihood ratio tests.Table C.5. Estimates of <strong>the</strong> average annual number of new entries (B) into <strong>the</strong> adultpopulation and <strong>the</strong> estimated average population size (S) of nor<strong>the</strong>rn spotted<strong>Owl</strong>s.aStudy Area B e() N se(N)Northwest Cali<strong>for</strong>nia 14.76 0.84 49.71 2.46H.J. Andrews (western Oregon) 15.57 1.48 60.06 4.15Med<strong>for</strong>d (southwestern Oregon) 54.97 3.26 91.80 7.87Roseburg (southwestern Oregon) - 36.69 2.21 99.68 7.57Olympic Peninsula (northwestern Washington) 24.44 1.06 51.20 3.56a The estimates of a and 1l and measures of precision were made using program JOLLY (see Pollock et al. 1990).324
ABiases in AUsing <strong>the</strong> conventions above, ei<strong>the</strong>r ( or p could be modelled in eight ways, g*t,g+t, t g*T, g+T, T, g or <strong>the</strong> null case, denoted -. Combinations of <strong>the</strong>se eightstructures <strong>for</strong> o and p lead to 64 models of <strong>the</strong> five data sets on adult females.Table C.6. presents <strong>the</strong> number of model parameters, -2log&(L), and AIC <strong>for</strong>each of <strong>the</strong> models considered.While <strong>the</strong> AIC-selected model was (OT'Pg J)' some neighboring models weretested to allow a deeper understanding of <strong>the</strong> data. These tests retain a verygeneral model structure <strong>for</strong> <strong>the</strong> recapture probabilities. Three tests were ofparticular interest:Test 1. (o(pg vs. (0tpg T) x 2 = 11.9666, 5 df, P = 0.035.Here, one concludes that <strong>the</strong>re is significant year-specificity in adultfemale survival.Test 2. (O.Pgr) vs. (OTPg.p'). X 2 = 4.930, 1 df, P = 0.026.Here, one concludes that <strong>the</strong>re is a significant linear trend in logit(O).Test 3. (OT, Pg.T) VS. (0t, Pg'r), X 2 = 7.036, 4 df, P = 0.134.Here, one concludes that <strong>the</strong>re is no reason to use four additionalparameters to let R vary by year, when a linear trend is satisfactory.Finally, a Wald test (2-sided) of <strong>the</strong> significance of <strong>the</strong> slope in <strong>the</strong> relationshipbetween logit(O) vs. T is,z = -2.287, P = 0.011. Thus, one concludes that <strong>the</strong> slope is significant.This comprehensive analysis indicated a decreasing trend in annual adultfemale survival rate <strong>for</strong> <strong>the</strong> populations in <strong>the</strong> five study areas (Table C.7.).This finding is important because X is critically influenced by <strong>the</strong> adult femalesurvival (i.e., juvenile survival and fecundity are relatively less important in<strong>the</strong>ir influence on X). Because <strong>the</strong> evidence strongly indicates that R decreasedduring <strong>the</strong> 1985-91 period, one must infer that X also decreased over thisperiod. That is, <strong>the</strong> rate of population decline was accelerating during <strong>the</strong>study period.Estimates of juvenile survival have been contentious because estimates arebiased low if some juveniles leave <strong>the</strong> study area, survive a full year, and neverreturn to <strong>the</strong> study area. To <strong>the</strong> extent that <strong>the</strong>se three events happen, juvenilesurvival is underestimated, and estimates of X are too low (i.e., <strong>the</strong> truevalue of X is probably larger than estimated).Two approaches were employed to obtain more reasonable estimates of juvenilesurvival, 0,. First, <strong>the</strong> maximum estimate ofjuvenile survival from <strong>the</strong> fivestudy areas (4, = 0.311, sse = 0.103) was used (cases 1 and 2 in Table C.8.).Second, data on juvenile survival from <strong>the</strong> best production year <strong>for</strong> <strong>the</strong> Med<strong>for</strong>dand Roseburg areas were pooled to obtain a maximum estimate (4, = 0.3065,se = 0.0764) and this was used (cases 3 and 4, in Table C.8.). The Med<strong>for</strong>dand Roseburg areas are large in size and adjacent to each o<strong>the</strong>r. Thus, <strong>the</strong>number of dispersing juveniles that survived and never returned is minimizedin this approach. In each of <strong>the</strong> four cases, an attempt was made to use arealistic estimate of juvenile survival as one of <strong>the</strong> estimates affecting A. Cases1 and 3 allowed adult female survival to decline, while Cases 2 and 4 used anestimate of <strong>the</strong> average adult female survival from <strong>the</strong> pooled data. Table C.2.provides estimates of X = 1. In each of <strong>the</strong> four cases, <strong>the</strong>re was strong statisticalevidence of a declining population.325
Table C.6. Summary of statistics related to model selection, based on 64 models. Foreach model <strong>the</strong> three table entries are number of model parameters, -2-loge(L), andAIC. The best model is indicated by <strong>the</strong> box.Recapture Rate, pSurvivalRate g*t G+t t g*T g+T T gg9t 47 36 31 36 32 28 31 271664.54 1681.92 1700.07 1674.01 1683.27 1701.75 1686.76 1705.231758.54 1753.92 1762.07 1746.01 1747.27 1757.35 1748.76 1759.23g+l 36 20 16 20 16 12 15 111672.76 1694.44 1713.53 1689.23 1698.32 1715.82 1703.48 1719.621744.76 1734.44 1745.53 1729.23 1730.32 1739.82 1733.48 1741.61t 31 16 11 16 12 8 11 71673.82 1702.36 1721.30 1691.92 1705.49 1722.69 1708.83 1725.851735.82 1734.36 1743.30 1723.92 1729.49 1738.69 1730.83 1739.85g*T 36 20 16 20 16 12 15 111674.09 1696.88 1714.06 1690.32 1698.65 1717.14 1701.63 1720.151746.09 1736.88 1746.06 1730.32 1730.65 1741.14 1731.63 1742.15g+T 32 16 12 16 12 8 11 71677.43 1705.04 1719.75 1696.17 1706.46 1723.24 1710.89 1726.141741.43 1737.04 1743.75 1728.17 1730.46 1739.24 1732.89 1740.14T 28 12 8 7 12 7 8 4 7 31678.54 1711.22 1725.85 1 1698.96 I 1714.22 1730.82 1716.35 1732.831734.54 1735.22 1741.85 1722 96L II1730.22 1738.82 1730.35 1738.83g 31 15 11 15 11 7 10 61678.39 1708.71 1721.44 1701.81 1714.77 1729.76 1715.12 1729.901740.39 1738.71 1743.44 1731.81 1736.77 1743.76 1735.12 1741.90- 27 11 7 11 7 3 6 21679.11 1712.14 1726.42 1703.89 1719.31 1735.57 1719.33 1735.601733.11 1734.14 1750.42 1725.89 1733.31 1741.57 1731.33 1739.60An additional perspective concerning this source of potential bias can begained by examining <strong>the</strong> value <strong>for</strong> juvenile survival necessary to <strong>for</strong>ce X = 1(with <strong>the</strong> same adult survival and fecundity values). The large increases inestimated juvenile survival, shown here, seem unfounded.Study $'IX = 1 % increaseNorthwest Cali<strong>for</strong>nia 0.49 151H.J. Andrews 0.60 93Med<strong>for</strong>d 0.89 345Roseburg 0.53 87Olympic Peninsula 0.52 6323'26Average 0.61 190
In summary, even with optimistic assumptions about juvenile survival rates,<strong>the</strong> best in<strong>for</strong>mation suggests that <strong>the</strong> population of resident, ternitorial owlshas declined, on average, at an estimated rate of 7.5 percent each year during<strong>the</strong> 1985-91 period and that this rate of decline probably has accelerated inrecent years.Senescence is ano<strong>the</strong>r potential problem: unaccounted <strong>for</strong> senescence leads tooverestimation of X. Likewise, it seems clear that fecundity is overestimatedeach year and this overestimation is more severe in years of poor production.K Table C.7. Estimates of average adult female survival (¢) \during 1985-91 <strong>for</strong> <strong>the</strong> nor<strong>the</strong>rn spotted owl, based on <strong>the</strong>best model out of 64 <strong>for</strong> <strong>the</strong> pooling of data across <strong>the</strong> fivestudy areas.Year ie( 0)1985-86 0.8880 0.02421986-87 0.8727 0.02021987-88 0.8556 0.01571988-89 0.8367 0.01241989-90 0.8158 0.01461990-91 0.7929 0.0231!Table C.8. Estimates of <strong>the</strong> finite rate of annual population change (x) <strong>for</strong> <strong>the</strong> nor<strong>the</strong>rnspotted owl obtained by pooling all <strong>the</strong> data across <strong>the</strong> five study areas. Cases(explained in <strong>the</strong> text) make differing assumptions about juvenile survival rates.A~~~~~~~~~~~~~~~~~~~~~~~~~~~~~~~~~~~~~~~~~~~~~Case Years Female xae(X) cJz PSurvivalRatea~~~~~~~~~~~~~~~~~~~~~~~~~~~~~~~~~~~~~~~~~~~~~~~~~~~~~1 1985-86 Declining Omax1a 0.9813 0.0373 -0.4879 0.31281 1990-91 Declining Omaxia 0.8857 0.0362 -3.1575 0.00082 1985-91 Constant Omaxl 0.9259 0.0312 -2.3750 0.00883 1985-86 Declining Omax 2 b 0.9805 0.0322 -0.6056 0.27243 1990-91 Declining Omax2b 0.8844 0.0312 -3.7051 0.00014 1985-91 Constant Omax2 0.9246 0.0251 -3.0040 0.0013a The survival rate of juveniles was used <strong>for</strong> <strong>the</strong> area with <strong>the</strong> highest survival rate.The year with <strong>the</strong> highest survival was used <strong>for</strong> <strong>the</strong> Med<strong>for</strong>d and Roseburg areas, thus <strong>the</strong> emigration was lowest.- . _ . ................................................. ,, , ............. . ..... ,327
3. ConclusionsThis source of bias in x also tends to overestimate X.Sandland and Kirkwood (1981) noted that <strong>the</strong> recapture probabilities can becorrelated and this leads to biases in <strong>the</strong> estimate of survival. This effect wastested, but no evidence of this effect was found. This effect is a minor problemwhen recapture probabilities are so high (i.e., 0.80-0.90).Populations of resident, territorial females in all five large study areas havedeclined significantly, at an estimated average rate of 7.5 percent per yearduring <strong>the</strong> 1985-91 period. The parameter most important in X is <strong>the</strong> annualsurvival rate of adult females and this parameter has decreased significantlyduring <strong>the</strong> 1985-91 period. Thus, <strong>the</strong> rate of population decline has probablyaccelerated.4. Literature CitedBurnham, K.P., and D.R. Anderson. In Press. Data-based selection of anappropriate model: The key to modem data analysis. Transaction of <strong>the</strong>2001: Wildlife Populations Symposium. l5pp.Hosmer, D.W., and S. Lemeshow, Jr. 1989. Applied logistic regression. JohnWiley and Sons, Inc. New York. 328 pp.Lebreton, J.D., K.P. Burnham, J. Clobert, and D.R. Anderson. In Press.Modeling survival and testing biological hypo<strong>the</strong>ses using marked animals:A unified approach with case studies. Ecological Monograph.Pollock, K.H., J.D. Nichols, C. Brownie, and J.E. Hines. 1990. Statisticalinference <strong>for</strong> capture-recapture experiments. Wildlife Monograph.107:97 pp.Sandland, R.L., and P. Kirkwood. 1981. Estimation of survival in markedpopulations with possibly dependent sighting probabilities. Biometrika68:531-541.USDI. 1990. Endangered and threatened wildlife and plants; determination ofthreatened status <strong>for</strong> <strong>the</strong> nor<strong>the</strong>rn spotted owl. Federal Register55:26114-26194.328
Appendix DConsideration of O<strong>the</strong>r Speciesand Ecosystem Concerns
330
I££S8£ ........................... SUOqDM OSS-V PD}Wq)7 PUD rMo4SM 179-M"PNt8sc....................................... NMA14SOO W;)TA:JON.suoipDaosso .£jupqvq punD frbos- ij 1 ImnN£8£ '. ' X Pf l~We pleq'gZ8 SS.nD So ~dSDq koUD .''-o JO A2OIO33SC .............................. pUO sIID-SSD 18£~~~~~~~~~~~~~~~~3squaipuIno ''a s!aSW ari-plsMl AUyd ID sPaff- aq~ 32 g1°£L£'''(lw 6.Z .. I 4 4S-fI P SatNq UOS sMsasom O-n-PuDrfO wns jooio z89zsjo 'p''''''''''' a~pq-pa ~n69£---------------'-----------------. SZaqSU~ ;aATIN pue StU3a1SAS03 Tuuydrd jo AgoloD289£....... podsu pou offid p.1......no 6DuD89.. salon paajq-pa89£.. . .. .... sH pu sqqD89£*----------------*-----*---*-*-*- .................................... S7Dpt OOAL9£ ------. ------ * J---*-* fS9lnfb 6uifiLJ WU14JJONL9S.. Ai-d Imo paoiodS99£ *...................... sufl-sAsoz2 jsaio, 43PpO Jo sqaMA pooq 3nbtufl99 . s.... sAsoo2 ueuedTH pue savetoossv lsaioA 'apo 'A'd IdO Jo A°1°Tgb79£.fue~uttnS9S .su.SUaq3! pue T unf9S£ ................................................. slueld xelnosuASS. .-..----........------..--- ..-- ....... sajuIqiaaAuj laupO pue spodoitPVz£. saMdaH pue sui!q~tlduiVOb£ ---.----- sm A3dS polupossV Isaio, japlo pue 'aAT1iSuOS Ol'ePIpueoPpaliUuepu2 PUe P3uazWlI4LJo ISI-I Ztl2l6.£ .-sa4ejquiassV pue soa~dS 4YpouY jo uorpuz)UTnuzpl.......... .£soa~adS iatpo jo SI, aqtp ludopAoaq... .££qooddV au,.suwa}sAsoaS .CueuudT>JI9£. saTiadS iojuxpuj ue se pAO panodS uWatwoNb££ ---.. stuaisAso3a lsaoj iJaplo jo uor~duzsaaS4Um4UOo jo ;Iqel
Gray Wolf ....................................... 386Distribution ....................................... 386Status ....................................... 386Natural history and habitat associations ....................................... 386Grizzly Bear ....................................... 387Distribution ....................................... 387Status ....................................... 387Natural History and Habitat Associations ....................................... 387Fisher ....................................... 388Distribution ....................................... 388Status ....................................... 388Natural history and habitat associations ....................................... 388Marten ....................................... 389Distribution ....................................... 389Status ....................................... 390Natural history and habitat associations ....................................... 390Amphibians ....................................... 391Del Norte Salamander ....................................... 392Distribution and habitat ....................................... 392Ecology and management ....................................... 392Siskiyou Mountain Salamander ....................................... 392Distribution and habitat ....................................... 392Ecology and management ....................................... 392Larch Mountain Salamander ....................................... 393Distribution and habitat ....................................... 393Ecology and management ....................................... 393Oregon Slender Salamander ....................................... 393Distribution and habitat ....................................... 393Ecology and management ....................................... 394Giant Salamanders ....................................... 394Distribution and habitat ....................................... 394Ecology and management ....................................... 394Olympic Salamanders ....................................... 395Range and habitat ....................................... 395Ecology and management ....................................... 395Tailed Frog ....................................... 396Distribution and habitat ....................................... 396Ecology and management ....................................... 396Summary and Conclusions ....................................... 397Literature Cited ....................................... 399332
IntroductionMore than 450 species of birds, mammals, and amphibians occur in <strong>for</strong>estswest of <strong>the</strong> crest of <strong>the</strong> Cascade Mountains in Oregon and Washington (Brown1985:37), as well as 178 species of freshwater and anadromous fishes. Thenumber of plant species in this area is also large and <strong>the</strong> number of invertebratespecies is large, but cannot be determined accurately because manyarthropods and molluscs have not been described and named (J. Lattin,Oregon State University; T. Frest, Deixis Consultants, pers. comm.). However,more than 3,400 species of arthropods have been reported from <strong>the</strong> H.J.Andrews Experimental Forest in <strong>the</strong> Oregon Cascade Mountains (Parsons et al.1991). The Cascades region is about three times richer in mammalian speciesand about twice as rich in species of breeding birds as <strong>the</strong> coniferous <strong>for</strong>ests of<strong>the</strong> coastal plains of <strong>the</strong> sou<strong>the</strong>astern United States (Harris 1984:45). Thishigh species richness reflects a great diversity of communities, ranging fromestuarine to freshwater, from coastal to montane, and from prairie to temperaterain <strong>for</strong>est. Of <strong>the</strong> higher vertebrates (those o<strong>the</strong>r than fishes), about 58percent are birds, 30 percent are mammals, 7 percent are amphibians, and 5percent are reptiles (Harris 1984:47). In addition to <strong>the</strong> high species richnessof mammals and birds, many unique faunal types are endemic to <strong>the</strong> PacificNorthwest. For example, <strong>the</strong> genus Phenacomys (Arborimus: tree voles) occursonly in western Oregon and northwestern Cali<strong>for</strong>nia, and <strong>the</strong> region has morespecies of mammalian insectivores than any o<strong>the</strong>r part of temperate NorthAmerica. Numerous species are narrowly or broadly endemic to westernOregon and Washington and northwestern Cali<strong>for</strong>nia. The region also containsseveral unique species, such as <strong>the</strong> tailed frog, one of <strong>the</strong> most primitive extantamphibians, which has been essentially unchanged in <strong>the</strong> fossil record <strong>for</strong>millions of years. Although <strong>the</strong> amphibians are not as rich in species as <strong>the</strong>birds and mammals, most of <strong>the</strong> species are narrowly or broadly endemic to<strong>the</strong> Pacific Northwest (e.g., Oregon slender salamander, Siskiyou Mountainsalamander) (Bury et al. 1991). In addition, <strong>the</strong>re is evidence of a decline ofamphibian populations in many parts of <strong>the</strong> world (Blaustein and Wake 1990).The number of amphibians that are associated closely with streams (Bury1988) and <strong>the</strong> many dwindling fish stocks (Nehlsen et al. 1991) exemplify <strong>the</strong>importance of riparian ecosystems in coniferous <strong>for</strong>ests.The nor<strong>the</strong>rn spotted owl is associated with older <strong>for</strong>est ecosystems in <strong>the</strong>Pacific Northwest (Forsman et al. 1984, Thomas et al. 1990), and optimalhabitat <strong>for</strong> <strong>the</strong> species usually is found in old-growth <strong>for</strong>ests that are morethan 200 years old. Because of its association with older coniferous <strong>for</strong>ests,<strong>the</strong> spotted owl has been used as an indicator species <strong>for</strong> older <strong>for</strong>est ecosystems.The owl is well-suited <strong>for</strong> this role in many respects because of itspreference <strong>for</strong> mature or old-growth <strong>for</strong>ests and its large home range size thatvaries from 1,000 to 10,000 acres from Cali<strong>for</strong>nia to nor<strong>the</strong>rn Washington(Thomas et al. 1990:194). The amount of mature and old-growth <strong>for</strong>est withina pair's home range also varies considerably from north to south (Thomas et al.1990:195). The species' preferred habitat <strong>for</strong> nesting, roosting, and <strong>for</strong>agingthroughout most of its range is old-growth coniferous <strong>for</strong>ests. However, older<strong>for</strong>ests are extremely diverse in structure and function, and it is clear that <strong>the</strong>owl can not represent all <strong>the</strong> key components of <strong>the</strong>se <strong>for</strong>ests.Secretary of <strong>the</strong> Interior Lujan's charge to <strong>the</strong> <strong>Recovery</strong> Team included <strong>the</strong>following statement: 'There are o<strong>the</strong>r <strong>for</strong>est ecosystem species that may becandidates <strong>for</strong> listing under <strong>the</strong> Endangered Species Act which may benefitfrom any recovery plan <strong>for</strong> <strong>the</strong> nor<strong>the</strong>rn spotted owl. To <strong>the</strong> extent possible,<strong>the</strong> team should assess <strong>the</strong> relative benefits to <strong>the</strong>se species from <strong>the</strong> implementationof various recovery options" (memo to <strong>the</strong> <strong>Recovery</strong> Team: February5, 1991). As a result of this directive, a committee of <strong>the</strong> <strong>Recovery</strong> Team was333
<strong>for</strong>med during <strong>the</strong> initial meeting to address this task. A working principle of<strong>the</strong> committee was that <strong>the</strong> recovery plan should take advantage of opportunitiesto benefit o<strong>the</strong>r species and ecosystem function. In <strong>the</strong> long term, a planthat adheres to this principle will be more sound ecologically and be a moreefficient and cost-effective approach than a series of conservation measuresaimed at single species.Description of Older Forest EcosystemsConiferous <strong>for</strong>ests in <strong>the</strong> Northwest succeed through three biological stages ofdevelopment: young, mature, and old-growth. Precise definition of <strong>the</strong> latterstage is difficult because characteristics are influenced by a number of variablesincluding species composition and climate. However, an interagencytask group developed interim definitions <strong>for</strong> old-growth Douglas-fir and mixedconifer <strong>for</strong>ests (USDA 1984). The task group suggested that <strong>the</strong> transition frommature <strong>for</strong>est to old-growth begins at about 175 or 200 years of age <strong>for</strong> Douglas-fir<strong>for</strong>ests, with continuing change until <strong>the</strong>se <strong>for</strong>ests are much older.Specific characteristics vary with site but include: (a) two or more species oftrees with a wide range of ages and sizes of large trees, usually Douglas-fir,with diameters 30 inches or ages older than 200 years: (b) multilayeredcanopy: (c) one to four conifer snags per acre with diameters greater than 20inches and heights greater than 15 feet; and (d) 10 to 15 tons of down logs peracre with two to four per acre having diameters greater than 24 inches andlengths greater than 50 feet. The special significance of old-growth <strong>for</strong>ests liesin <strong>the</strong> combination of characteristics <strong>the</strong>y possess, ra<strong>the</strong>r than in any uniqueattribute. This was recognized explicitly in <strong>the</strong> interim definition of old-growth<strong>for</strong>ests (USDA 1986) and <strong>the</strong> use of multiple criteria ra<strong>the</strong>r than single attributesto characterize <strong>the</strong>se <strong>for</strong>ests. Species composition and specific structuralattributes vary with location. In nor<strong>the</strong>rn Cali<strong>for</strong>nia, mixed-conifer andmixed-evergreen <strong>for</strong>ests contain Douglas-fir, white fir, sugar pine, and ponderosapine in addition to deciduous species such as tanoak, Pacific madrone,and canyon live oak. In Oregon and Washington, Douglas-fir, western hemlock,Sitka spruce, and Pacific silver fir are common.Throughout much of <strong>the</strong> region, total precipitation is high and <strong>the</strong> climate ismoderate. Within old-growth stands, <strong>the</strong> climate is especially moderate, andmany of <strong>the</strong> organisms that inhabit <strong>the</strong>se <strong>for</strong>ests cannot tolerate extreme heator dryness. The combination of mild climate and year-round food suppliesresults in a high level of plant and animal diversity.Historically, <strong>the</strong>se <strong>for</strong>ests did not extend across <strong>the</strong> landscape in an unbrokenexpanse of old-growth trees. Within <strong>the</strong> region <strong>the</strong>re are mountainous areasthat typically are dissected heavily by streams and rivers, as well as largeexpanses of less rugged terrain. Also, natural disturbances such as fire, wind,insect infestations, diseases, and volcanic eruptions created a mosaic ofdifferent-aged stands. This disturbance regime resulted in a patchy landscapeand a diverse variety of habitats <strong>for</strong> animals. Natural disturbances differedsignificantly from clear-cut harvesting of timber. Intervals between fires westof <strong>the</strong> Cascades typically were much greater than those between harvests, andfires did not result in <strong>the</strong> relatively fine-grained fragmentation of habitatsassociated with clear-cut harvesting. The amount of coarse woody debris leftafterward is <strong>the</strong> most significant difference between natural disturbance andlogging. Far more wood is removed by harvesting than by fire, which maydestroy only a few large trees and consume less than 20 percent of <strong>the</strong> coarsewoody debris (Spies and Cline 1988).Many attributes within <strong>the</strong>se <strong>for</strong>ests are important <strong>for</strong> wildlife. These <strong>for</strong>estsare dominated by exceptionally long-lived conifer trees, and, in <strong>the</strong> absence of334
disturbance, natural succession is a relatively slow process, especially duringlate seral stages. Thus, stable habitats are provided <strong>for</strong> species that cannotdisperse readily from one suitable habitat to ano<strong>the</strong>r. Large conifers alsoprovide significant horizontal and vertical complexity. Individual trees havedeep crowns, often with trunks and limbs that are de<strong>for</strong>med or scarred bywind, lightning, or mistletoe infection. Broken tree tops and irregular branchesprovide nesting habitat <strong>for</strong> many species. The understory of shade-toleranttrees, such as western hemlock, provide fur<strong>the</strong>r vertical divesity. Openingsdevelop in <strong>the</strong> canopy as a result of mortality of dominant trees. As <strong>the</strong> canopyopens, sunlight penetrates to <strong>the</strong> <strong>for</strong>est floor, and a diverse layer of shrubs and<strong>for</strong>bs develops, fur<strong>the</strong>r increasing spatial complexity of <strong>the</strong> <strong>for</strong>est.Perhaps one of <strong>the</strong> most important features of old-growth <strong>for</strong>ests is <strong>the</strong> greatquantity of dead wood <strong>the</strong>y contain. Biomass of snags and down logs reaches80 tons per acre in stands 500 years old (Spies and Cline 1988) with aboutone-third of this in snags and two-thirds in down logs (David Perry, OregonState University, pers. comm.). Snags provide shelter and nest sites <strong>for</strong> anumber of bird and mammal species. Harris and Maser (1984) suggest thatelimination of snags in a mature, unmanaged Douglas-fir <strong>for</strong>est in <strong>the</strong> CascadeMountains would reduce <strong>the</strong> number of resident wildlife species (not includingbats) from 90 to about 80. Elimination of snags and logs would reduce <strong>the</strong>number to about 60. Snags are especially important to nonmigratory birds:Mannan (1977) found that about 60 percent of bird species in Douglas-fir<strong>for</strong>ests during <strong>the</strong> winter were cavity-nesters.Down logs are important features in terrestrial and aquatic habitats. Downlogs contribute to structural diversity, provide hiding cover <strong>for</strong> small animals,and provide moist microhabitats during dry periods. Dead and decaying woodon <strong>the</strong> <strong>for</strong>est floor contain important water reserves that buffer <strong>the</strong> effects of<strong>the</strong> summer drought periods typical of <strong>the</strong> region (Perry 1991). Logs are alsoimportant elements of stream ecosystems. They provide baffles and dams thatcreate pools and backwaters, increasing diversity of habitats within <strong>the</strong>sesystems. Logs and coarse woody debris also provide food <strong>for</strong> aquatic insects,which in turn provide food <strong>for</strong> predators at higher trophic levels. Fish biomassis related closely to quantity of coarse woody debris in Northwest streams(Harmon et al. 1986). Streams in managed <strong>for</strong>ests typically contain few largelogs.There is not likely to be additional recruitment of extremely large diameter logsbecause rotation cycles are too short to permit <strong>the</strong> growth and mortality ofextremely large trees.Large numbers of terrestrial organisms also use coarse woody debris <strong>for</strong> foodand shelter. Important examples include <strong>the</strong> nor<strong>the</strong>rn flying squirrel andwestern red-backed vole. These important spotted owl prey species feed onmycorrhizal fungi, which appear to be associated with decaying logs (Maser etal. 1985, Ure and Maser 1982). O<strong>the</strong>r vertebrates that use logs includesalamanders, shrews, and marten (McComb 1991), as well as large numbers ofinvertebrates such as insects, slugs, and centipedes (Harmon et al. 1986,Parsons etal. 1991).Older <strong>for</strong>ests are productive and valuable as wildlife habitat although <strong>the</strong>irvalue in this regard often has been underestimated. Isaac (1952) referred toold-growth as "biological deserts." Norse (1990) has suggested that thismisperception was partly a result of preoccupation with game species, whichtend to be less abundant in mature <strong>for</strong>ests than in early seral environments.Because of <strong>the</strong> complex combination of characteristics required, it is doubtfulthat managed <strong>for</strong>ests with short rotations and even-aged management can335
provide habitat <strong>for</strong> <strong>the</strong> numerous species associated with older <strong>for</strong>ests. It isunlikely that a planted and even-aged, managed stand ever could simulate anold-growth system. However, habitat <strong>for</strong> many species can be provided in amanaged environment; <strong>the</strong>re<strong>for</strong>e, conservation ef<strong>for</strong>ts <strong>for</strong> many organismsassociated with older <strong>for</strong>ests, including <strong>the</strong> nor<strong>the</strong>rn spotted owl, shouldinclude a combination of reserves and managed <strong>for</strong>ests. Reserves wouldprovide true old-growth environments <strong>for</strong> those species with very narrowecological tolerance, and management practices <strong>for</strong> managed <strong>for</strong>ests could beadapted to maintain populations of less specialized species that commonly areassociated with older <strong>for</strong>ests.Nor<strong>the</strong>rn <strong>Spotted</strong> <strong>Owl</strong> as an Indicator SpeciesConcern <strong>for</strong> nor<strong>the</strong>rn spotted owls and debate over management of <strong>the</strong>irhabitat has been a persistent issue in Pacific Northwest <strong>for</strong>estry <strong>for</strong> two decades(USDA 1988, Thomas et al. 1990). However, spotted owls rarely havebeen <strong>the</strong> sole focus of this debate. Most frequently <strong>the</strong>y have been used as asymbol of general concerns about <strong>the</strong> fate of old <strong>for</strong>ests in <strong>the</strong> Pacific Northwest.The Forest Service recognized this general concern by designatingnor<strong>the</strong>rn spotted owls as a management indicator species (MIS) in <strong>the</strong> Forest<strong>Plan</strong>ning process (USDA 1984). Management <strong>for</strong> owls and o<strong>the</strong>r MIS wasadvanced as a way to adequately provide <strong>for</strong> <strong>the</strong> needs of several hundredo<strong>the</strong>r species associated with older <strong>for</strong>ests (USDA 1988).Biological indicators have been used successfully as gauges of environmentalconditions in some situations (Thomas 1972). However, <strong>the</strong> use of vertebratespecies as indicators <strong>for</strong> o<strong>the</strong>r vertebrates has proven unsuccessful in severalstudies (Mannan et al. 1984, Szaro 1986), and <strong>the</strong> concept has been questioned.The attempted uses of vertebrate indicators, and reasons <strong>for</strong> failure of<strong>the</strong> vertebrate indicator concept, were summarized by Landres et al. (1988).Vertebrates have been used as indicators of population trends and of habitatquality <strong>for</strong> o<strong>the</strong>r species. Their use as indicators of population trends <strong>for</strong> o<strong>the</strong>rspecies is likely to fail because each species responds to a different complex ofhabitat and climatic factors and is affected by interactions with o<strong>the</strong>r species.Mechanisms of population regulation also differ among species, making it evenless likely that one could indicate <strong>the</strong> population trends of ano<strong>the</strong>r. The use ofvertebrates as indicators <strong>for</strong> habitat quality <strong>for</strong> o<strong>the</strong>r species is equally problematic.The factors that influence habitat quality are similar to those thatinfluence population density. The probability is small that one species adequatelycan represent those factors <strong>for</strong> a number of o<strong>the</strong>r species.Given <strong>the</strong> likelihood that no vertebrate can adequately represent a wholecommunity of organisms, what are <strong>the</strong> potential hazards of establishing amanagement strategy based solely on habitat needs of spotted owls? First, at alandscape scale, <strong>the</strong> locations of conservation areas established to meet <strong>the</strong>needs of owls may not adequately provide <strong>for</strong> o<strong>the</strong>r species that have restrictedranges within <strong>the</strong> range of <strong>the</strong> spotted owl. Examples of this concern include<strong>the</strong> marbled murrelet, which occurs primarily in <strong>the</strong> coastal <strong>for</strong>ests, and someamphibian and mollusc species that have extremely small ranges (see sectionsbelow). These species could be missed entirely by a system of reserves established<strong>for</strong> owls. Second, <strong>the</strong> spacing of conservation areas <strong>for</strong> owls may notaccommodate movement of species that have much more limited dispersalcapabilities. Amphibians, small mammals, and most invertebrates havelimited ability to move among large established areas that are long distancesapart. Finally, at <strong>the</strong> stand level, <strong>the</strong> specific habitat conditions that aremaintained <strong>for</strong> owls may not provide habitat <strong>for</strong> o<strong>the</strong>r species. For example,336
Riparian Ecosystemssilvicultural practices in very young (less than 40 years) stands that are aimedat producing habitat structure <strong>for</strong> owls will not provide <strong>the</strong> branch structureassociated with murrelet nest sites. Ruggiero et al. (1988) stated that asmanagement becomes more tightly directed at a single species, it is less likelyto provide <strong>for</strong> o<strong>the</strong>r species. Baker and Schonewald-Cox (1986) concluded that"Incorrectly assuming that o<strong>the</strong>r species are receiving protection as a result of<strong>the</strong> protection of Ian indicator] can result in <strong>the</strong> inadvertent loss of those o<strong>the</strong>rspecies."These cautions on <strong>the</strong> use of indicators were used in several ways in <strong>the</strong>development of <strong>the</strong> recovery plan. First, in developing <strong>the</strong> overall strategy <strong>for</strong>spotted owl recovery, <strong>the</strong> <strong>Recovery</strong> Team evaluated <strong>the</strong> overlap between possiblespotted owl management areas and <strong>the</strong> ranges and locations of o<strong>the</strong>rspecies that were judged to be priorities. Second, in developing recommendations<strong>for</strong> management practices of DCAs, <strong>the</strong> <strong>Recovery</strong> Team attempted to lookbeyond <strong>the</strong> habitat attributes associated with spotted owls. Wherever possible,<strong>the</strong> <strong>Recovery</strong> Team used <strong>the</strong> structure and functioning of older <strong>for</strong>ests as abenchmark <strong>for</strong> recommendations on management activities. This insured thatthose activities would help provide habitat <strong>for</strong> o<strong>the</strong>r species and not focus sospecifically on spotted owls that o<strong>the</strong>r species were inadvertently harmed.Riparian areas are among <strong>the</strong> most ecologically important components of <strong>for</strong>estlandscapes. There are several definitions <strong>for</strong> riparian areas, but basically <strong>the</strong>yare areas where soils contain free or unbound water and are recognized byunique vegetation types adjacent to lakes, streams, rivers, ponds, marshes,seeps, or bogs. They <strong>for</strong>m boundaries between different ecosystems andprovide connectivity <strong>for</strong> interchange and dispersal <strong>for</strong> plants and animals.<strong>Spotted</strong> owls often are associated with riparian areas within <strong>the</strong>ir home ranges.Forsman (1976) first noted this relationship; he reported that all but threenests he located were within 425 yards of water. Later, Forsman et al. (1984)noted <strong>the</strong> same relationship <strong>for</strong> a larger sample of nest sites. Using radiotelemetry,Solis (1983) and Solis and Gutierrez (1990) also reported thatroosting and <strong>for</strong>aging sites were more likely to be found on <strong>the</strong> lower thirds ofslopes (i.e., near streams within <strong>the</strong>ir home ranges) than elsewhere. Finally,Blakesley et al. (In press) report a similar relationship in northwestern Cali<strong>for</strong>nia.Their study analyzed all roost and nest sites used by an entire populationof owls over a 5-year period. Thus, analysis of individual selection and populationselection have noted an association of spotted owls with riparian areas.The association of spotted owls with streams and associated vegetation is notwell understood, but <strong>the</strong>re may be several reasons <strong>for</strong> <strong>the</strong> observed relationship:1) riparian areas usually are cooler, which may facilitate <strong>the</strong>rmoregulationin <strong>the</strong> owls (Barrows and Barrows 1978; Barrows 1981); 2) riparian areasin <strong>the</strong> Pacific Northwest often are more productive areas in terms of treegrowth, and this may promote more rapid development of suitable nest sites; 3)riparian areas usually support a more diverse biota than adjacent areas,resulting in <strong>the</strong> structural diversity that is characteristic of spotted owl habitat;and 4) riparian systems are more floristically rich and consequently maysupport higher numbers and abundance of prey species.337
The ApproachA committee of <strong>the</strong> <strong>Recovery</strong> Team was <strong>for</strong>med to address concerns <strong>for</strong> o<strong>the</strong>rspecies and older <strong>for</strong>est ecosystems. The committee was composed of <strong>the</strong>following <strong>Recovery</strong> Team members and staff:Robert Anthony (Chairman)-U.S. Fish and Wildlife ServiceJonathan Bart-U.S. Fish and Wildlife ServiceCharlie Bruce-Oregon Department of Fish and WildlifeWayne Elmore-U.S. Bureau of Land ManagementJohn Fay-U.S. Fish and Wildlife ServiceRichard Holthausen-U.S. Forest ServiceDonald Knowles-U.S. Department of InteriorEdward Starkey-National Park ServiceLater in <strong>the</strong> process, Kathryn Boula, Thomas Williams, Betty Rodrick, andRosemary Stussy were hired to help with various aspects of <strong>the</strong> in<strong>for</strong>mationga<strong>the</strong>ring and writing of this section of <strong>the</strong> recovery plan. The group alsocontracted responsibilities <strong>for</strong> parts of <strong>the</strong> biota to outside scientists, including<strong>the</strong> Washington Department of Wildlife (marbled murrelets): Joseph Beatty,Oregon State University (salamanders); Andrew Blaustein, Oregon StateUniversity (toads and frogs); Terrence Frest, Deixis Consultants (molluscs):Jack Lattin, Oregon State University (invertebrates); Andrew Moldenke, OregonState University (invertebrates): Daniel Rosenburg, Redwood Sciences Lab(spotted owl prey): and Robert Storm, Oregon State University (salamanders).Developing <strong>the</strong> List of O<strong>the</strong>r SpeciesThe committee's first decision was to consider all components of <strong>the</strong> biotaassociated with older <strong>for</strong>ests and spotted owl habitat. However, <strong>the</strong> scope ofthis ef<strong>for</strong>t later was focused on species that were listed federally as threatenedor endangered, candidates <strong>for</strong> federal or state listing, state sensitive andspecies of special concern. We also included species that have been shown tobe associated with older coniferous <strong>for</strong>ests within <strong>the</strong> range of <strong>the</strong> owl. Thegeneral approach consisted of <strong>the</strong> following:1) Delineate <strong>the</strong> area of focus (i.e., <strong>the</strong> range of <strong>the</strong> nor<strong>the</strong>rn spotted owl).2) Compile a list of threatened and endangered, candidate, sensitive, andolder-<strong>for</strong>est associated species.3) Develop a short list of priority species by determining which species:a) occur within <strong>the</strong> range of <strong>the</strong> nor<strong>the</strong>rn spotted owlb) are more abundant in older <strong>for</strong>estsc) are in most need of conservation measures4) Acquire definitions and maps of important habitat <strong>for</strong> <strong>the</strong> list of priorityspecies.5) Develop a geographic in<strong>for</strong>mation system (GIS) mapping scheme tooverlay important areas of habitat <strong>for</strong> <strong>the</strong> priority species with potentialconservation areas <strong>for</strong> <strong>the</strong> spotted owl.6) Identify areas of high species richness.338
The list of species was developed in a series of meetings with more than 60biologists, o<strong>the</strong>r scientists, and managers from <strong>the</strong> Pacific Northwest who hada wide array of expertise. The committee also reviewed lists of threatened andendangered, candidate, and sensitive species from <strong>the</strong> U.S. Fish and WildlifeService, Washington Department of Wildlife, Oregon Department of Fish andWildlife, and Cali<strong>for</strong>nia Department of Fish and Game. To identify speciesassociated with older <strong>for</strong>ests, <strong>the</strong> committee reviewed <strong>the</strong> results of <strong>the</strong> ForestService's Old-Growth Wildlife Habitat Research Program (Ruggiero et al. 1991 a).A series of meetings on o<strong>the</strong>r species and ecosystem concerns was conductedby members of <strong>the</strong> committee from May through August 1991. The committeemet seven times, and members of <strong>the</strong> committee conducted more than 25meetings with outside biologists, o<strong>the</strong>r scientists, and managers in <strong>the</strong> threestates. Records of <strong>the</strong> committee's consultation with o<strong>the</strong>r individuals areincluded in <strong>the</strong> administrative record of <strong>the</strong> recovery plan.Identification of Priority Species and AssemblagesThe short list of priority species represents a consensus of <strong>the</strong> committeemembers. Highest priorities were assigned to threatened or endangeredspecies or those that are candidates <strong>for</strong> listing in at least parts of <strong>the</strong>ir geographicrange. Attention also was given to species that have restricted geographicranges or are endemic to <strong>the</strong> Pacific Northwest; species that have beendesignated as management indicator species of older <strong>for</strong>ests by <strong>the</strong> ForestService (i.e., pileated woodpecker, goshawk, fisher, marten); and spotted owlprey species (woodrats, flying squirrel, red tree vole, red-backed vole).In developing <strong>the</strong> list of species, it became apparent that riparian ecosystemsin older coniferous <strong>for</strong>ests were of particular importance and concern. Theimportance of <strong>the</strong>se ecosystems is demonstrated by <strong>the</strong> numerous species andstocks of native fishes, amphibians, molluscs, aquatic insects, small mammals,and birds that are associated with <strong>the</strong>m. In addition, spotted owls often areassociated with riparian areas.A short list of priority species was developed and concerns related to riparianecosystems were identified. Committee members reviewed numerous publications,geographic ranges, status of populations, natural history, habitat associations,and factors affecting populations and habitat. In addition, <strong>the</strong> committeesponsored a 2-day workshop on priority species and riparianecosystems to which scientists were invited to present in<strong>for</strong>mation on priorityspecies. The workshop included opportunities <strong>for</strong> questions and answers at<strong>the</strong> end of each presentation. In all, 16 speakers presented in<strong>for</strong>mation on <strong>the</strong>marbled murrelet, goshawk, bald eagle, marten, fisher, riparian ecology, nativefish, amphibians, spotted owl prey, vascular plants, fungi, and ecologicalcorridors. The entire workshop was transcribed by a court reporter <strong>for</strong> <strong>the</strong>committee. Initially, <strong>the</strong>re was a manual mapping exercise that designatedland ownerships, habitat conservation areas <strong>for</strong> <strong>the</strong> owl from <strong>the</strong> InteragencyScientific Committee (Thomas et al. 1990), critical habitat areas as proposed by<strong>the</strong> U.S. Fish and Wildlife Service, and significant old-growth areas as designatedby a congressional scientific panel (Johnson et al. 1991). Later, thisef<strong>for</strong>t was incorporated into a GIS mapping procedure that allowed moreefficient evaluation of options (see Appendix I <strong>for</strong> a description of GIS mappingmethods).339
The List of Threatened and Endangered,Candidate, Sensitive, and Older ForestAssociated SpeciesBirdsThe list of species considered in <strong>the</strong> recovery plan <strong>for</strong> <strong>the</strong> nor<strong>the</strong>rn spotted owlincludes 23 birds, 18 mammals, 23 amphibians, 28 fish, 58 molluscs, 59arthropods, and 152 plants. Of <strong>the</strong>se species, five (bald eagle, gray wolf, grizzlybear, Sacramento River winter chinook salmon, McDonald's rock cress) arefederally listed as threatened or endangered, and <strong>the</strong> marbled murrelet andseveral fish stocks are proposed <strong>for</strong> federal listing. More recently, <strong>the</strong> nor<strong>the</strong>rngoshawk has been petitioned <strong>for</strong> listing throughout <strong>the</strong> western United States.More than 100 species are listed or designated as sensitive species or speciesof special concern in one or more of <strong>the</strong> three states and could become candidates<strong>for</strong> federal listing in <strong>the</strong> future. Of <strong>the</strong> above, approximately 200 speciesof birds, mammals, amphibians, and plants are associated with or closelyassociated with older (more than 80 years) <strong>for</strong>ests (Ruggiero et al. 199 lb)."Closely associated" species are those whose abundance was statisticallysignificantly greater in one <strong>for</strong>est seral stage than ano<strong>the</strong>r. Species "associatedwith" a <strong>for</strong>est class are those found to be numerically more abundant in oneseral stage than ano<strong>the</strong>r, but differences were not statistically significant.Although many species were detected in older Douglas-fir <strong>for</strong>ests in <strong>the</strong> study,<strong>the</strong> list includes only those species <strong>for</strong> which significant statistical or ecologicalcorrelations with older Douglas-fir <strong>for</strong>ests were detected. Additional speciesoccur in older <strong>for</strong>ests that were not detected by Ruggerio et al. (1991b). Thesespecies include <strong>the</strong> bald eagle, which uses older <strong>for</strong>ests <strong>for</strong> nesting and communalroosting (Anthony et al. 1982), and <strong>the</strong> goshawk on <strong>the</strong> Olympic Peninsulain Washington (D. Hayes, Washington Department of Wildlife, Olympia,Washington, pers. comm.) and northwestern Cali<strong>for</strong>nia (Hall 1984). The list ofspecies associated with older <strong>for</strong>ests is useful in determining <strong>the</strong> number andvariety of species that might become candidates <strong>for</strong> listing as threatened orendangered if older <strong>for</strong>ests are converted to short-rotation, even-aged <strong>for</strong>ests.Twenty-three species of birds are included on <strong>the</strong> list <strong>for</strong> consideration in <strong>the</strong>recovery plan (Table D. 1). One species, <strong>the</strong> bald eagle, currently is listedfederally as threatened in Oregon and Washington and endangered in Cali<strong>for</strong>nia.The marbled murrelet has been proposed <strong>for</strong> federal listing as threatenedin all three states, and <strong>the</strong>re has been a petition <strong>for</strong> listing <strong>the</strong> goshawkthroughout <strong>the</strong> western United States. The pileated woodpecker and <strong>the</strong>white-headed woodpecker are management indicator species <strong>for</strong> <strong>the</strong> ForestService because of <strong>the</strong>ir strong association with older <strong>for</strong>ests on <strong>the</strong> west andeast sides of <strong>the</strong> Cascade Mountains, respectively. The Vaux's swift, whiteheadedwoodpecker, and chestnut-backed chickadee are broadly endemic to<strong>the</strong> Pacific Northwest, and 20 of <strong>the</strong> 23 species are associated with or stronglyassociated with older <strong>for</strong>ests in one or more of <strong>the</strong> three states (Ruggiero et al.1991). The marbled murrelet is of particular concern to <strong>the</strong> <strong>Recovery</strong> Teambecause of its strong association with older <strong>for</strong>ests <strong>for</strong> nesting and <strong>the</strong> recentproposal to list <strong>the</strong> species in Oregon, Washington, and Cali<strong>for</strong>nia. Fur<strong>the</strong>r, itsuse of older <strong>for</strong>ests <strong>for</strong> nesting is unique: marbled murrelets use large mosscoveredlimbs <strong>for</strong> nest construction, and <strong>the</strong>se structures are found only on <strong>the</strong>340
Table D.1. A list of threatened and endangered, sensitive, candidate, and oldgrowthassociated birds within <strong>the</strong> range of <strong>the</strong> nor<strong>the</strong>rn spotted owl.StatusabOld ForestState Association' Endemicd Priority RiparianSpecies Fed WA OR CA WA OR CA L B Species Associate References"Marbled murrelet PrT C SC E * * * X 5,9,12Brachyramphus marmoratusNor<strong>the</strong>rn goshawk Pet C SC SC + + + XAccipiter gentilis8,11Bald eagle E T T E . * * X X 1,2Haliaeetus leucocephalusVaux's swift C * * X 12Chaetura vauxiHarlequin duck G SR SC XHistrionicus histrionicusPileated woodpecker C SC + + + 4,12Dryocopus pileatusWhite-headed woodpecker C SC + + XPicoides albolarvatus3Black-backed woodpecker M SC + + 7Picoides articusRed-breasted sapsucker + + 10,12Sphyrapicus ruberWestern flycatcher + + 10,12Empidonax difficilisHammond's flycatcher X 13Empidonax hammondiiChestnut-backed chickadee + + + X 10,12Parus rufescensBrown creeper + + 12Certhia americanaWinter wren + + + 10,12Troglodytes troglodytesRed-breasted nuthatch + + 12Sitta canadensisHermit warbler * 10,12Dendroica occidentalisWilson warbler + + 10,12Wilsonia pusillaWarbling vireo + 10Vireo gi/vusHermit thrush 10Catharus guttatusFlammulated owl C SC + + + 6Otus flammeolusWillow flycatcher E XEmpidonax trailliNor<strong>the</strong>rn pygmy owl SU + ? 12Glaucidium gnomaGreat gray owl M SV EStrix nebulosaWA = Washington OR = Oregon CA = Cali<strong>for</strong>niaaFederal status: E = endangered, T = threatened, C = candidate, PrT = proposed threatened, Pet = petition pending.bState status: WA, C = candidate, M = monitor, X = extirpated, G = game. OR, SC = sensitive (critical), SV = sensitive (vulnerable),SR = sensitive (rare), SU = sensitive (undetermined), X = extirpated. CA, SCT = state candidate <strong>for</strong> listing as threatened, SC = species ofconcern, E = endangered. Sources (state): Califomia Department of Fish and Game (1991a). Oregon Department of Fish and Wildlife(1991). Washington Department of Wildlife (1991a and 1991b)c+ = old-growth associated, ' = close old-growth associated, ? = species not studied or data insufficient (Ruggiero et al. 1991).dEndemic: L = local, B = broadly (see Ruggiero et al. (1991) <strong>for</strong> definition and list of endemic species).eReferences: 1) Anthony et al. 1982. 2) Anthony and Isaacs 1989. 3) Bull 1990 and 4) Bull 1991, USDA Forest Service, LaGrande, Oregon,pers. comm. 5) Cummins 1991. 6) Goggans 1986. 7) Goggans et al. 1987. 8) Hayward et al. 1990. 9) Nelson 1990. 10) Raphael 1985.11) Reynolds et al. 1982 12) Ruggiero et al. 1991. 13) Sakai and Noon 1991.,,,, ,,,,,,,,,,,,,,,,,,... , ..... .. - ..........................341
Mammalsoldest trees in a stand. Eight of <strong>the</strong> species on <strong>the</strong> list belong to a group ofbirds, <strong>the</strong> cavity-nesters (pileated woodpecker, white-headed woodpecker,black-backed woodpecker, red-breasted sapsucker, chestnut-backed chickadee,winter wren, red-breasted nuthatch, and flammulated owl), that requiresnags <strong>for</strong> nesting and/or <strong>for</strong>aging. Optimal habitat <strong>for</strong> <strong>the</strong>se species is foundin old-growth <strong>for</strong>ests, where <strong>the</strong> abundance of large snags is greatest (Nelson1989, Mannan et al. 1980). Of <strong>the</strong> 23 species of birds, only three (marbledmurrelet, bald eagle, goshawk) were chosen as priority species. The committeeconcluded that <strong>the</strong> remainder of <strong>the</strong> species would benefit from a recovery planthat includes mature and old-growth <strong>for</strong>ests, and <strong>the</strong>y did not require anyspecial attention.Eighteen species of mammals are included on <strong>the</strong> list <strong>for</strong> consideration in <strong>the</strong>recovery plan (Table D.2). Two species, <strong>the</strong> gray wolf and grizzly bear, currentlyare listed federally as endangered, and <strong>the</strong> western big-eared bat is acandidate <strong>for</strong> state listing in Washington and Oregon. The marten is a managementindicator species <strong>for</strong> <strong>the</strong> Forest Service because of its association witholder <strong>for</strong>ests. The red tree voles, white-footed vole, western red-backed vole,and shrew mole are endemic to <strong>the</strong> Pacific Northwest (Figures D. 1 and D.2).Twelve of <strong>the</strong> eighteen species are associated with or strongly associated witholder <strong>for</strong>ests in one or more of <strong>the</strong> three states, and two of <strong>the</strong>se species arebats <strong>for</strong> which <strong>the</strong>re is very little in<strong>for</strong>mation. Five species are associated withriparian areas. Six species belong to a group that are prey of <strong>the</strong> nor<strong>the</strong>rnspotted owl, including <strong>the</strong> nor<strong>the</strong>rn flying squirrel, red tree voles, western redbackedvole, dusky-footed woodrat, and bushy-tailed woodrat (Thomas et al.1990, Figure D.2). As a group, <strong>the</strong>y represent <strong>the</strong> major prey species of <strong>the</strong> owlo<strong>the</strong>r than <strong>the</strong> deer mouse and snowshoe hare (Forsman et al. 1984, Thomaset al. 1990). The red tree voles, red-backed vole, and nor<strong>the</strong>rn flying squirrelare associated with older <strong>for</strong>ests throughout most of <strong>the</strong>ir range in this region(Carey 1989), with <strong>the</strong> exception of <strong>the</strong> flying squirrel in <strong>the</strong> Oregon Cascades,where Rosenberg and Anthony (1992) found similar densities in old- andsecond-growth <strong>for</strong>ests. Of <strong>the</strong> 18 species, nine were chosen as priority speciesthat would be most likely to benefit from measures taken to recover <strong>the</strong> owl.However, six of <strong>the</strong>se species are prey of <strong>the</strong> nor<strong>the</strong>rn spotted owl and werechosen solely <strong>for</strong> that reason. The only species considered likely to benefitfrom specific measures included in <strong>the</strong> recovery plan were <strong>the</strong> marten, fisher,gray wolf, and grizzly bear, and <strong>the</strong> last two occur only in nor<strong>the</strong>rn Washington.It was assumed that <strong>the</strong> remainder of <strong>the</strong> species would benefit from anyrecovery plan that conserves older <strong>for</strong>est as suitable habitat <strong>for</strong> owls.Amphibians and ReptilesTwenty-six species of amphibians and reptiles are included on <strong>the</strong> list <strong>for</strong>consideration in <strong>the</strong> recovery plan, including eight salamanders, six toads andfrogs, one snake, and one turtle (Table D.3). None of <strong>the</strong> species is listedfederally as threatened or endangered, but <strong>the</strong> western spotted frog has beenpetitioned <strong>for</strong> listing and four species of salamanders in <strong>the</strong> genus Plethodonare candidates <strong>for</strong> listing. Twelve of <strong>the</strong> species are associated with riparianareas directly and 12 with older <strong>for</strong>ests. All but three of <strong>the</strong> species are designatedas "species of special concern" in one or more of <strong>the</strong> three states. Mostof <strong>the</strong> amphibians are endemic to <strong>the</strong> Pacific Northwest (Beatty et al. 1991),and some of <strong>the</strong> species (e.g., Oregon slender, Larch Mountain, SiskiyouMountain, and Van Dyke's salamanders) have very restricted distributions(Figures D.3 - D.5). Most of <strong>the</strong> species have specific habitat requirements;342
Table D.2. A list of threatened and endangered, sensitive, candidate, and old-growthassociated mammals within <strong>the</strong> range of <strong>the</strong> nor<strong>the</strong>rn spotted owl.StatusabOld ForestState Associatlon" Endemicd Priority RiparianSpecies Fed WA OR CA WA OR CA L B species associate References*Marten G S S + + + X X 3Martes americanaFisher C2 S S SC + + + X 5Martes pennantiGray wolf E E X X XCanis lupisGrizzly bear E E X X XUrsus arctosDusky-footed woodrat SC + X X X 4Neotoma fuscipesBushy-tailed woodrat X X XNeotoma cinereaNor<strong>the</strong>rn flying squirrel SC ? + ? X 5Glaucomys sabrinusRed tree vole * X X 2,5Phenacomys longicaudusRed tree vole SC + X X 2,5Phenacomys pomoWhite-footed vole SR SC X X 1Phenacomys albipesWestern red-backed vole + X X 4,5Clethrionomys cali<strong>for</strong>nicusForest deer mouse + X X 5Peromyscus oreasSilver-haired bat + ? 5Lasionycteris noctivagansWestern big-eared bat C SC SCPlecotus townsendiiLong-legged myotis M * * ? 5Myotis volansShrew mole + + ? X 5Neurotrichus gibbsiiWoverine C2 M T TGulo guloFringed myotis M SV ? ? 5Myotis thysanodesWA = Washington OR = Oregon CA = Cali<strong>for</strong>niaaFederal status: E = endangered, T = threatened, C = candidate, C2 = category 2 candidate, U.S. Fish and Wildlife Service candidates that needadditional intormation to propose as threatened or endangered under <strong>the</strong> Endangered Species Act, PrT = proposed threatened, Pet = petition pending.bState status: WA C = candidate, M = monitor, X = extirpated, S = sensitive, G = game; OR: S = sensitive, SC = sensitive (critical), SV = sensitive(vulnerable), SR = sensitive (rare), SU = sensitive (undetermined), X = extirpated; CA: S = sensitive, SCT = state candidate <strong>for</strong> listing as threatened, SC= species of concern, E = endangered.Cali<strong>for</strong>nia Department of Fish and Game. 1991a. Oregon DepartmentofFish and Wildlife 1991. Washington Department ofWildlife (1991a and 1991b).C+ = old-growth associated, = close old-growth associated, ? = species not studied or data insufficient (see Ruggiero et al. 1991).dEndemkc: L = local, B = broadly (see Ruggiero et al. (1991) <strong>for</strong> definition and list of endemic species).eReferences: 1) Gomez 1992. 2) Johnsbn and George 1991. 3) Marshall 1991. 4) Raphael 1985. 5) Ruggiero et al. 1991."I'll, 11 I - - 11 ----- ........ 11 .............. I......................... -- - I-I.- ..................... I--- "I'll I 11 -I -...< 11343
ABBFigure D. 1. Distribution of: a) red tree voles (Phenacomys Ion gicaudus, P. porno), b) white-footed vole (P. albipes),c) <strong>for</strong>est deer mouse (Peromyscus oreas), and d) shrew mole (Neurotrichus gibbsii).344
KA. B. C.D. E. F.Figure D.2. Distribution within Washington, Oregon, and Cali<strong>for</strong>nia of <strong>the</strong> major prey species of <strong>the</strong> nor<strong>the</strong>rnspotted owl: a) nor<strong>the</strong>rn flying squirrel, b) dusky-footed woodrat, c) bushy-tailed woodrat, d) brush rabbit, e) snowshoehare, f) western red-backed vole. Adapted from Ingles (1976), with <strong>the</strong> permission of <strong>the</strong> publishers. Stan<strong>for</strong>dUniversity Press. Copyright 1947, 1954, and 1965 by <strong>the</strong> Board of Trustees of <strong>the</strong> Leland Stan<strong>for</strong>d Junior University.345
KTable D.3. A list of threatened and endangered, sensitive, candidate, and old-growthassociated reptiles and amphibians within <strong>the</strong> range of <strong>the</strong> nor<strong>the</strong>rn spotted owl.Statusa bOld ForestState Associationc Endemicd Priority RiparianSpecies Fed WA OR CA WA OR CA L B Species Associate References"Oregon slender salamanderBatrachoseps wrightiSC + X X 1,3Larch Mountain salamanderPlethodon larselliC2 C SC ' X X 1Siskiyou Mountain salamander C2 SC T X X 1Plethodon stormiDel Norte salamanderPlethodon elongatusC2 SC SC X X 1,3Van Dyke's salamanderPlethodon vandykeiC3 C + X X X 2Dunn's salamander C + ? X 3Plethodon dunniWestern red-backed salamander X 3Plethodon vehiculumBlack salamanderAneides flavipunctatusSC X 3Clouded salamander SC + + X 3Aneides ferreusEnsatina + 3Ensatina eschscholtziiPacific giant salamander + + X X X 3Dicamptodon tenebrosusCope's giant salamanderDicamptodon copei+ ? X X X 3Olympic salamander (four species) SC SC + + ' ' X X X 3Rhyacotriton spp.Northwestern salamanderAmbystoma gracile+ ? X X 3Shasta salamanderHydromantes shastaeC2 T X 1Tailed frog C SC SC + + X X X 1,3Ascaphus trueiCascades frogRana cascadaeSC SC X X 1Red-legged frog SC SC ? X X 1,3Rana auroraWestern spotted frogRana pretiosaPet C SC X 1Foothill yellow-legged frogRana boyleiSC SC ? X X 1,3Western toad X 2Bufo boreasWestern pond turtleClemmys marmorataC2 T SC SC X X 1Sharp-tailed snakeContia tenuisSC X 1WA = Washington OR = Oregon CA = Cali<strong>for</strong>nia IaFederal status: E = endangered, T = threatened, C = candidate, C2 = category 2 candidate, U S. Fish and Wildlife Service candidates that needadditional in<strong>for</strong>mation to propose as threatened or endangered under <strong>the</strong> Endangered Species Act, C3 = Taxa which have proven to be more abundant orwidespread than previously believed and/or which have no identifiable threats. This status is based only on <strong>the</strong> most recently published Candidate Noticeof Review. PrT = proposed threatened, Pet = petition pending.bState status: WA: C = candidate, M = monitor, X = extirpated, G = game. OR: SC = sensitive (critical), SV = sensitive (vulnerable),SR = sensitive (rare), SU = sensitive (undetermined), X = extirpated CA: SCT = state candidate <strong>for</strong> listing as threatened, SC = species of concern, E =endangered. Source (states): Cali<strong>for</strong>nia Department of Fish and Game (1991 a, Oregon Department of Fish and Wildlife (1991), Washington Departmentof Wildlife (1991a. and 1991 b).c+ = old-growth associated, ^ = close old-growth associated, ? = species not studied or data insufficient (see Ruggiero et al. 1991).dEndemkc: L = local, B = broadly; (see Ruggiero et al. (1991) and Beatty et al. (1991) <strong>for</strong> definition and list of endemic species).eReferences: 1) Beatty et al. (1991). 2) J Beatty, Oregon State University, Zoology Department, pers. comm. 3) Ruggiero et al. (1991)... ........ 11 1. - -......... .... .... ............ 11.1111, - - ......... - I - 11346
Del Norte SalamanderPlethodon elongatusSiskiyou Mountain SalamanderPlethodon stormiLarch Mountain SalamanderPlethodon larselliOregon Slender SalamanderBatrachoseps wrighti\ J............ 1. 11.1 I - - ............................................................................................... I-................ 1.1111Figure D.3.Geographic range of Del Norte, Siskiyou Mountain, Larch Mountain, and Oregon Slender Salamanders.347
Fishes<strong>the</strong>ir dispersal capabilities are limited; and <strong>the</strong>re is considerable geneticvariability within species. The clouded and Oregon slender salamanders areassociated closely with coarse woody debris. Populations of this group have notbeen surveyed sufficiently to assess <strong>the</strong> status of many of <strong>the</strong> species' populations.Their special natural history traits include low mobility and dependencyon moist environments <strong>for</strong> at least part of <strong>the</strong>ir life cycles. They have beenincluded as priorities among a group of riparian associates because in<strong>for</strong>mationis limited on <strong>the</strong> status of <strong>the</strong>ir populations. In addition, <strong>the</strong>re is evidence of adecline in amphibians around <strong>the</strong> world, including <strong>the</strong> Pacific Northwest(Blaustein and Wake 1990). The cause of this decline is not known, but includesloss of habitat. Bury (1983) and Corn and Bury (1989) assessed <strong>the</strong>effects of logging on <strong>the</strong> tailed frog, Oregon slender salamander, and <strong>the</strong> Pacificgiant salamander. Gomez (1992) found <strong>the</strong> tailed frog and Pacific giant salamanderin greatest numbers in riparian areas of mature and old-growth <strong>for</strong>estsin comparison to deciduous <strong>for</strong>est, pole-sized stands, and early clear-cuts.In addition to <strong>the</strong> riparian associates that are identified in Table D.3, <strong>the</strong>committee designated <strong>the</strong> Oregon slender, Larch Mountain, Siskiyou Mountain,Del Norte Pacific giant, Cope's giant, and Olympic salamanders (fourspecies), and tailed frog as priority species. Selection of <strong>the</strong>se species wasbased on <strong>the</strong>ir extremely restricted geographic range, association with older<strong>for</strong>ests, or status as candidates <strong>for</strong> federal listing. Because of <strong>the</strong>ir restrictedranges (Figures D.3 - D.5), <strong>the</strong>re was a need <strong>for</strong> some protection through minoralterations in <strong>the</strong> location of designated conservation areas.The list of fishes <strong>for</strong> consideration in <strong>the</strong> recovery plan includes 28 species inwestern Washington and Oregon and northwestern Cali<strong>for</strong>nia (Table D.4). Onestock, <strong>the</strong> Sacramento River winter chinook salmon, is listed federally asthreatened, and <strong>the</strong> rest of <strong>the</strong> species are designated as "species of specialconcern" by <strong>the</strong> states in which <strong>the</strong>y occur. Of particular concern is <strong>the</strong> largelist of streams with stocks at risk and <strong>the</strong> number of <strong>the</strong>se stocks that isconsidered at risk in Oregon, Washington, and Cali<strong>for</strong>nia (Nehlsen et al. 1991,Williams et al. 1989, Moyle et al. 1989), including 85 streams and 178 fishstocks in Cali<strong>for</strong>nia, 177 streams and 386 stocks in Oregon, and 86 streamsand 202 stocks in Washington.Molluscs'Fifty-eight species of rare and endemic molluscs occur within <strong>the</strong> range of <strong>the</strong>nor<strong>the</strong>rn spotted owl: nine are candidates <strong>for</strong> federal listing, and 29 are "speciesof special concern" (Table D.5). Of <strong>the</strong>se 58 species, <strong>the</strong> Karok land snailis a category 1 candidate <strong>for</strong> federal listing and 10 o<strong>the</strong>r species are rated ascategory 2 candidates (see Table D.5 <strong>for</strong> definition of categories). The 58species include 23 aquatic and 35 land <strong>for</strong>ms, and only one occurs in all threestates. Many of <strong>the</strong> species are endemic to only one state (Frest and Johannes1991). Dispersal capability of this group of invertebrates is low, particularly <strong>for</strong><strong>the</strong> terrestrial species. At least 43 species are considered to be old-growthassociates (T. Frest pers. comm.); 45 are riparian associates.A number of <strong>the</strong> land and freshwater molluscs (bivalve and snail) in <strong>the</strong> westcoast states have limited geographic ranges. Most of <strong>the</strong>se species are confinedto a coastal belt that extends only from <strong>the</strong> crest of <strong>the</strong> Cascades to <strong>the</strong>Pacific. Within <strong>the</strong> owl's range, <strong>the</strong>re are three distinct land snail provinces.The Oregon province extends from coastal lritish Columbia just into extremenor<strong>the</strong>rn Cali<strong>for</strong>nia; <strong>the</strong> Washington province extends east from <strong>the</strong> Cascadescrest: and <strong>the</strong> Cali<strong>for</strong>nia province is coastal from nor<strong>the</strong>rn Cali<strong>for</strong>nia.Largely extracted from in<strong>for</strong>niatiori supplied by Terrence Frest of Deixis consultatants (letter of 17 September 1991).348
Dunn's SalamanderPlethodon dunniVan Dyke's SalamanderPlethodon vandykeiTailed FrogAscaphus trueiCascades FrogRana cascadaeI 11 -......... 11. -........ 1 VFigure D.4. Geographic range of Dunn's salamander, Van Dyke's salamander, tailed frog, and Cascades frog in <strong>the</strong>Pacific Northwest.349
OlympicNorthcoastalRockyMountainSouth /coastal /CascadeOlympic SalamandersGiant SalamandersBlack SalamanderClouded SalamanderAneides flavipunctatusAneides Ferreus< )Figure D.5. Geographic range of Olympic salamanders, giant salamanders, black salamanders, and cloudedsalamanders.350
Table D.4. A list of threatened and endangered, sensitive, candidate, and"species of concern" fishes within <strong>the</strong> range of <strong>the</strong> nor<strong>the</strong>rn spotted owl.StatusabState Considered Priority RiparianSpecies Fed WA OR CA at Riskc Species AssociateBigeye marbled sculpinCottus kiama<strong>the</strong>nsis macropsBull troutSalvelinus confluentusChum salmonOncorhynchus ketaClear Lake hitchLavinia exilicauda chiCoho salmonOncorhynchus kisutchFall chinook salmonOncorhynchus tshawytschaGualala roachLavinia symmetricus parvipinnisJenny Creek suckerCatostomus rimiculus subsp.Klamath River lampreyLampetra similisMillicoma daceRhinichthys cataractae ssp.Navarro roachLavinia symmetricus navarroensisNooky (Chehalis) daceRhinichthys cataractae ssp.Olympic mudminnowNovumbra hubbsiPink salmonOncorhynchus gorbuschaPit roachLavinia symmetricus mitrulusRedband troutOncorhynchus mykiss subsp.Reticulate sculpinCottus perplexusRough sculpinCottus asperrimusRussian River tule perchHysterocarpus traskipomoSacramento splittailPogonichthys macrolepidotusSacramento River winterchinook salmonOncorhynchus tshawytschaSalish suckerCatostomus sp.Sea run cutthroat troutOncorhynchus clarki clarkiSpring chinook salmonOncorhynchus tshawytschaSCxC2 SR E x xSR x xSCSR SC XxSR SC XxSC XC2 x xSCSCSCxxxM x xCxSC XxSCxC2 SV SC X x xM SC xC2 T xSC X xC2 SC xT E XxMxxSR SCSCXXxxxxxxxxxxxcontinues-351
continued-StatusabState Considered Priority RiparianSpecies Fed WA OR CA at Rlskc Species AssociateSockeye salmon X X XOncorhynchus nerkaSummer chinook salmon X X XOncorhynchus tshawytschaSummer steelhead trout SC X X XOncorhynchus mykissTidewater goby C2 SC X XEucylogobius newberryiTomales roach SC XLavinia symmetricus subsp.Umpqua chub SR XOregonichthys kalawatsetiOregon chub PrE SR XOregonichthys crameriWinter steelhead trout X X XOncorhynchus mykissWA = Washington OR = Oregon CA = Cali<strong>for</strong>niaaFederal status: E = endangered, T = threatened, C = candidate, C2 = category 2 candidate, U.S. Fish and Wildlife Service candidatesthat need additional in<strong>for</strong>mation to propose as threatened or endangered under <strong>the</strong> Endangered Species Act. PrE = proposed endangered.Pet = petition pending.bState status: WA: C = candidate, M = monitor, X = extirpated, G = game; OR: SC = sensitive (critical), SV = sensitive (vulnerable),SR = sensitive (rare), SU = sensitive (undetermined), X = extirpated; CA: SCT = state candidate <strong>for</strong> listing as threatened, SC = species ofconcern, E = endangered Sources (states): Cali<strong>for</strong>nia Department of Fish and Game (1991a). Oregon Department of Fish and Wildlife(1991), Washington Department of Wildlife (1991a and 1991 b).CSee Moyle et al. (1989), Nehlsen et al. (1991), Williams et al. (1989).There are sizable endemic species clusters in <strong>the</strong> land snail genera Monadenta,7Tllobopsts, Megomphix, Haplotrema, Vespericola, and Hemphillto Physicalfactors limiting <strong>the</strong>ir distribution include geologic history, substrate (some arerestricted to limestone, e.g., <strong>the</strong> candidate Monadenia troglodytes, endemic to<strong>the</strong> Siskiyou Mountains and <strong>the</strong> area around Mt. Shasta), moisture requirements,and cover. In general, land snails in this region require relativelyundisturbed cover. Most thrive in lowland <strong>for</strong>ests and <strong>the</strong> areas aroundsprings. Many species seem to be associated specifically with lowland oldgrowth<strong>for</strong>ests, and most are extremely limited in distribution. The malonejumping slug, HemphillMa malonei occurs only on <strong>the</strong> slopes of Mt. Hood. Thegenus Megomphix is known only from sites in <strong>the</strong> Puget Sound region and in<strong>the</strong> Willapa Hills, of southwest Washington. In recent years, only one site hasbeen found to support Megomphix hemphilli.The delineation of freshwater mollusc provinces is similar to that of land snails.The Pacific drainage is situated similarly to <strong>the</strong> coastal land snail provinces.The Columbia drainage is a separate unit; and <strong>the</strong> Interior drainage provinceintersects <strong>the</strong> owl range in nor<strong>the</strong>rn Cali<strong>for</strong>nia. Endemic clusters are notedmost in <strong>the</strong> family Hydrobiidae and in <strong>the</strong> genus Juga. The family Lancidae ismostly coastal and occurs mainly in a few streams in southwest Oregon andnorthwest Cali<strong>for</strong>nia. Species confined to single streams or springs are notuncommon. Many small and some large taxa are restricted to particularstreams in <strong>the</strong> area such as, <strong>the</strong> Rogue and Umpqua systems in Oregon; <strong>the</strong>Klamath and upper Sacramento in Cali<strong>for</strong>nia; <strong>the</strong> lower Columbia and ColumbiaGorge in Washington and Oregon; or to one or a few coastal streams.Generally, molluscs are affected by any increase in siltation, decrease in flow,nutrient enrichment, and damming or o<strong>the</strong>r flow impediments. The rare andendemic <strong>for</strong>ms are particularly affected.352
Table D.5. A list of molluscs that are candidates <strong>for</strong> listing and are of special concernin <strong>the</strong> range of <strong>the</strong> nor<strong>the</strong>rn spotted owl.StatusaSpecies FedStateWA OR CAOld ForestbAssociationEndemlcbL BPrioritySpeciesRiparianAssociateColumbia pebblesnail C2Fluminicola columbianaShortface lanxC3Fisherola nuttalli nuttalliDalles sidebandC2Monadenia fidelis minorNo common name C2Monadenia troglodytes chaceanaShasta sidebandC2Monadenia troglodytes troglodytesWintu sidebandC2Monadenia troglodytes wintuRocky coast sideband C2Monadenia fidelis pronotisTrinity bristlesnailC2Monadenia setosaKarok hesperianC1Vespericola karokorumBarrenjugaSCJuga hemphilli hemphilliDalles jugaSCJuga hemphilli dallesensisNo common nameSCJuga hemphilli subsp.Brown jugaSCJuga (J.) n. sp. 1Tall jugaJuga (J.) n. sp. 3No common nameSCJuga (O.) n. sp. 1No common nameJuga (O.) n. sp. 2Scalloped jugaJuga (C.) actifilosaTopaz jugaJuga (C.) occataNo common nameSCAmnicola (L.) n. sp.Nerite rams-hornSCVorticifex neritoidesRotund physaSCPhyse/la columbianaVagrant pebblesnailFlumimicola semninalisHighcap lanxLanx altaKneecap lanxLanx patelloidesGreat Basin rams-hornHelisoma newberryi newberryiColumbia hesperianSCVespericola columbiana columbianaMalone jumping-slugHemphillia malonelPan<strong>the</strong>r jumping-slugSCHemphillia pan<strong>the</strong>nnaWarty jumping-slugSCHemphillia glandulosa glandulosaBurrington jumping-slugSCHemphillia barrington,Blue-gray tail-dropperSCProphysaon coeruleumPapillose tail-dropperSCProphysaon dublumSCSCSCSCSCSCSCSCSCSCSCSCSCSCSCSCSCSCSCSCTXXXXXXXXXXXXXXXXXXXXWA,ORWA,ORCACACACACACAWA,ORWA,ORWA,ORWA,ORORWAORORCAORWA,ORWA,ORWA,OROR,CAOR,CAOR,CAOR,CAWA,ORORWAWA,ORWAWA,ORWA,ORWA,ORxxxxxxxxxxxxxxxxxxxxxxxcontinues-Q rZQo;}o
continued-SpeciesColumbia sidebandMonodenia fide/is columbianaGreen sidebandMonadenia fidefis beryllicaTraveling sidebandMonadenia fiddelis celeuthiaYellow-base sidebandMonadenia fidelis ochromphalousTawny sidebandMonadenia fidelis leoninaNo common nameMonadenia fidelis klamathicaKlamath sidebandMonadenia churchiShasta chaparralTrilobopsis ropediTehama chaparralTrilobasis tehamanaShasta hesperianVespericola shastaSiskiyou hesperianVespericola sierranaLarge hesperianVespericola megasoma euthalesOregon megomphixMegomphix hemphilliWillamette floaterAnodonta wahiametensisNo common nameJuga (Oreobasis) chaceiNo common nameJuga (Oreobasis) orickensisRotund lanxLanx subrotundataNo common nameMonadenia callipeplusNo common nameMonadenia cristulataNo common nameMonadenia fidelis salmoniensisNo common nameMonadenia fidelis scottianaNo common nameMonadenia rotiferaHooded lancetoothHaplotrema voyanumOregon shoulderbandHelminthoglypta hertleiniEvening fieldslugDeroceras hesperiumCali<strong>for</strong>nia floater 02Anodonta cali<strong>for</strong>niensisStatusaStateFed WA OR CASCSCSCSCSCSCSCSCOld ForeStbAssociationXXXXXXXXXXXXXxxxxxxxxxxEndemnicb Priority RiparianL B Species AssociateWA,ORORORCACACACACACACACACAWA,ORSC SC SC xxxxxxxxxxxxxxxxxxxxxxxxxxxxxxxxxxx7xxxWA = Washington OR = Oregon CA = Cali<strong>for</strong>niaaStatus: E = endangered, T = threatened, C = candidate. C1 = cateorgy 1 candidate. taxa <strong>for</strong> which <strong>the</strong> U.S. Fish and Wildlife Service has sufficientin<strong>for</strong>mation to support a proposal to list as threatened or endangered under <strong>the</strong> Endangered Species Act. 02 = category 2 candidate, U.S Fish andWildlife Service candidates that need additional in<strong>for</strong>mation to propose as threatened or endangered under <strong>the</strong> Endangered Species Act 03 = Taxawhich have proven to be more abundant or widespread than previously believed and/or which have no identifiable threats. This status is based only on<strong>the</strong> most recent published Candidate Notice of Review SC = species of concemn (Frest and Johannes 1991).bFrest and Johannes (1991).,~L = local B = broadly354
Some examples of species with limited distribution include a largelyundescribed species cluster in Juga, restricted to a few streams in <strong>the</strong> WesternColumbia Gorge, Washington, and Oregon; <strong>the</strong> species Juga (C.) acutifilosa,known from only eight spring sites in nor<strong>the</strong>rn Cali<strong>for</strong>nia and southwestOregon; and Vorticifex neritoides and Physella columbiana, both restricted to<strong>the</strong> lower 60 miles of <strong>the</strong> Columbia River. Narrowly endemic molluscs often areassociated closely with o<strong>the</strong>r endemic groups or species. For example, endemicarthopods and molluscs frequently inhabit <strong>the</strong> same springs in <strong>the</strong>Columbia River Gorge, and Fluminicola species are associated with <strong>the</strong> JennyCreek sucker and redband trout.In land and freshwater <strong>for</strong>ms, most narrow endemics have been discoveredonly within <strong>the</strong> last decade and presumably many more will be found. Recently(spring and summer 1991), <strong>for</strong> example, a new endemic cluster of fiveFluminicola species was discovered that is restricted to two creeks and associatedsprings on <strong>the</strong> Cali<strong>for</strong>nia-Oregon border in <strong>the</strong> Siskiyou Mountains.Arthropods and O<strong>the</strong>r InvertebratesThe litter and soil of <strong>the</strong> <strong>for</strong>est floor are <strong>the</strong> site of some of <strong>the</strong> highest biologicaldiversity found anywhere. Scientists estimate that about 8,000 species ofarthropods inhabit a single study site in an Oregon old-growth <strong>for</strong>est, most of<strong>the</strong>m in <strong>the</strong> soil (J. Lattin, A. Moldenke, Oregon State University, pers. comm.).To date taxonomists have been able to identify 3,400 arthropod species at <strong>the</strong>H.J. Andrews Experimental Forest (about 45 miles east of Eugene, Oregon)(Parsons et al. 1991). Invertebrates of <strong>the</strong> <strong>for</strong>est soil are critical in determining<strong>the</strong> long-term productivity of <strong>the</strong> <strong>for</strong>est. The soil under a square yard of <strong>for</strong>estmay hold as many as 200,000 mites from a single suborder, plus tens ofthousands of o<strong>the</strong>r mites, beetles, centipedes, pseudoscorpions, springtails,and "microspiders." Most of <strong>the</strong>se species probably are undescribed. Thestructure and function of temperate <strong>for</strong>est soils may be determined by <strong>the</strong>dietary habits of <strong>the</strong> soil arthropods. They are <strong>the</strong> basic consumers of <strong>the</strong><strong>for</strong>est floor where <strong>the</strong>y ingest and process massive amounts of organic litterand debris, from large logs to bits of moss. The richness of arthropod speciesin old-growth <strong>for</strong>ests suggests a great number of different processes andfunctions, but little is known about how <strong>the</strong>se arthropods interact and survive.There are a number of species prominent in older <strong>for</strong>ests that occur infrequentlyin young <strong>for</strong>ests: fur<strong>the</strong>r study undoudtedly will reveal o<strong>the</strong>rs (A.Moldenke, Oregon State University, pers. comm.).Fifty-nine species of arthropods within <strong>the</strong> range of <strong>the</strong> nor<strong>the</strong>rn spotted owlare listed as "species of special concern" or category 2 candidate species <strong>for</strong>federal listing (Table D.6). Thirty-four species are category 2 candidate speciesand <strong>the</strong> remainder are designated "species of special concern". Thirty-four of<strong>the</strong> species are aquatic and 25 are terrestrial <strong>for</strong>ms. Twenty-two of <strong>the</strong> speciesare endemic to Oregon; six to Cali<strong>for</strong>nia, and none is found in all three states.This list is not exhaustive, but is representative.Several significant points can be made about <strong>the</strong> arthropods as a group thatare relevant to <strong>the</strong> recovery plan <strong>for</strong> spotted owls. First, many species areflightless, which means that <strong>the</strong>ir dispersal capabilities are limited. Second,<strong>the</strong> flightless condition is believed to reflect habitat stability and permanenceover a long time period. Some old <strong>for</strong>est associates have highly disjunctdistributions and are found only in undisturbed <strong>for</strong>ests. They share similardistribution patterns on <strong>the</strong> west side of <strong>the</strong> Cascade Mountains from BritishColumbia south to sou<strong>the</strong>rn Oregon and nor<strong>the</strong>rn Cali<strong>for</strong>nia (i.e., <strong>the</strong>y are355
endemic to <strong>the</strong> Pacific Northwest). Many of <strong>the</strong> species native to this regionhave not been described or named, and <strong>the</strong> number of known species probablyrepresents less than half of <strong>the</strong> estimated species (J. Lattin, Oregon StateUniversity, pers. comm.).Twenty-three species of terrestrial arthropods, most of which are wingless andflightless, are considered to be old-growth associates (J. Lattin, Oregon StateUniversity, pers. comm.). Camel crickets of <strong>the</strong> genus Prtstoceuthophilus andTropidischia xanthostoma are found in old-growth <strong>for</strong>ests in <strong>the</strong> hemlock andsilver-fir zones, and <strong>the</strong>y occur on <strong>the</strong> <strong>for</strong>est floor under logs and debris. Somespecies in this group of older-<strong>for</strong>est associates belong to very small genera andare considered rare, including Boreostolis americanus, Metrius contractus,Promecognathus laevissimus, Zacotus mna<strong>the</strong>wsti and Lobosoma honidun. Allof <strong>the</strong>se species belong to genera that have only one or two described speciesand are often relics of past geologic history. One unique predator-prey relationshipexists in this group between <strong>the</strong> prey species Harpaphe haydenianaand <strong>the</strong> predator Promecognathus laevisstnus. H. haydeniana is a distinctivelymarked millipede that is a very important shredder of litter and, <strong>the</strong>re<strong>for</strong>e, aninitiator of nutrient cycling. The species is marked brightly and produceshydrocyanic gas when disturbed. The production of cyanide is a deterrent tomost predators except P. laevissimus, which is specialized <strong>for</strong> feeding on thismillipede by its tolerance of cyanide gas. P. laevissimus is a terrestrial groundbeetle found in mature <strong>for</strong>ests on <strong>the</strong> west side of <strong>the</strong> Cascade Mountains.There are also 17 species of insects from 13 families (Table D.7) that areassociated with coarse woody debris in western coniferous <strong>for</strong>ests (J. Lattin,Oregon State University, pers. comm.). The decomposition of coarse woodydebris is a slow process in a natural ecosystem, and in <strong>the</strong> Pacific Northwestmany hundreds of invertebrate species have evolved to utilize logs <strong>for</strong> food orhabitat (Schowalter et al. 1991, Parsons et al. 1991, Moldenke, unpublisheddata). Though many of <strong>the</strong>se species may have similar ecologic roles, <strong>the</strong>natural process is not understood enough to know whe<strong>the</strong>r some or many areredundant <strong>for</strong> system function. However, <strong>the</strong> diversity of species itself may bea useful management tool to detect changes in <strong>the</strong> effects that logs may beexerting on <strong>the</strong> old-growth system.Vascular <strong>Plan</strong>tsOne hundred and <strong>for</strong>ty-four species of vascular plants that occur within <strong>the</strong>range of <strong>the</strong> nor<strong>the</strong>rn spotted owl are older-<strong>for</strong>est associates or are listed as"species of special concern" by one or more of <strong>the</strong> three states (Table D.8).Seventy-six of <strong>the</strong> species on <strong>the</strong> list are associated with older <strong>for</strong>est ecosystems(Ruggiero et al. 199 lb). These plants include several species that havegenerated significant interest including <strong>the</strong> Pacific yew and Port Or<strong>for</strong>d cedar.The Pacific yew especially is of interest because of <strong>the</strong> chemical taxol, whichcan be extracted from yew bark and is being tested as an anti-cancer drug.Port Or<strong>for</strong>d cedar occurs only in a restricted area of northwestern Cali<strong>for</strong>niaand southwestern Oregon and is susceptible to root disease. No opportunitieswere identified specifically to provide measures to benefit <strong>the</strong>se species, butmanagement of habitat <strong>for</strong> owls is likely to provide <strong>the</strong>m with habitat support.Fungi and LichensThe list of fungi and lichens contains eight species. These species were identifiedas older-<strong>for</strong>est associates by Ruggiero et al. (1991b), and of <strong>the</strong>se, two arespecies of special concern in one or more of <strong>the</strong> three states. Lichens of <strong>the</strong>356
Table D.6. List of threatened, endangered, candidate, sensitive, or older-<strong>for</strong>estassociated arthropods in <strong>the</strong> range of <strong>the</strong> nor<strong>the</strong>rn spotted owla.StatusbState Old Forest RiparlanSpecies Fed WA OR CA Associate AssociateInsectsOrthoptera:Boonacris alticolaXPristoceuthophilus celatusXPristoceuthophilus cercalisXPristoceuthophilus sargentaeXTropidischia xanthostomaXHemiptera:Boreostolis americanusXPlinthisus longisetosusXThylochromus nitidulusXEurychilopterella sp.XPhytocoris nobilisXPithanus maerkeliiXPolymerus castellaeniXVanduzeenia borealisXAcalypta lillianisXAcalypta saundersiXDerephysia foliaceaXColeoptera:Cychrus tuberculatusXMetrius contractusXPromecognathus laevissimusXZacotus ma<strong>the</strong>wsiiXOmus dejeaniXLobosoma horridumXAcneus beeri C2 XAcneus bumelliC2Cicindela columbicaXPterostichus rothiPlecoptera:Nemoura wahkeena C2 XSolperia fenderi C2 XTrichoptera:Eobrachycentrus gelidae C2 XAgapetus denningi C2 XHomoplecta schuhi C2 XOchrotrichia alsea C2 XLepidostoma goedeni C2 XApatania tavaia C2 XFarula davisi C2 XFarula jewetti C2 XFarula reaperi C2 XLimnephilus alconura C2 XLimnephilus atereus C2 XNeothremma andersoni C2 XOligophlebodes mostbento C2 XPhilocasca oron C2 XDolophilodes oregona C2 XTinodes siskyou C2 XRhyacophila ambilis C2 Xcontinues-357
------continued-SpeciesRhyacophila colonusRhyacophila fendediRhyacophila haddockiRhyacophila fineataRhyacophila mosanaRhyacophila unipunctataDesmona bethulaCryptochia shastaGoeracea ore gonaNeothremma genellaNeothremma siskyouOchrotrichia vertreesiAbellan hydropsycheDiplopoda:Harpaphe haydenianaStatusbStateFed WA OR CAC202C202C202C202C11C202C202Old ForestAssociatexRiparianAssociateWA = Washington OR = Oregon CA = Cali<strong>for</strong>niaFederal status: C = candidate, C 1 = category 1 candidate, taxa <strong>for</strong> which <strong>the</strong> U.S. Fish and Wildlife Service has sufficient in<strong>for</strong>mation tosupport a proposal to list as threatened or endangered under <strong>the</strong> Endangered Species Act. C2 = category 2 candidate, U.S. Fish andWildlife Service candidates that need additional in<strong>for</strong>mation to propose as threatened or endangered under <strong>the</strong> Endangered Species Act.alni<strong>for</strong>mation from J D. Lattin, Oregon State University, Administrative Record.xxxxxxxxxxxx/Table 0.7. Insects associated with course woody debris in western OregonCascades.Feeding StageSpecies Habitatsa In 1ogb Recorded Hosts/Habltatsc ReferencedBuprestis aurulenta L. Xylo Imm Psme, Abies, Pinus, Picea 1Leptura obliterata Hald. Xylo 1mm Psme, Tshe, Abies, Picea, Pinus, Sequ. 1,4Spondylis upi<strong>for</strong>mis Mann. Xylo 1mm roots of pine or fir ? 4Silvanus bidentatus F. Pred-Scav? Ad+Imm subcortical 3Cossonus ponderosai VanD. Xylo? Ad+lmm under bark of Pinus 1,3Pissodes piperi Hopkins Xylo? 1mm Abies; root crown of damaged trees 1Platycerus orgeonensis Westw. Xylo Ad?+lmnm rotting Quercus, Acer, Alnus,Fraxinus 1Psme, Abies, Tshe 1Platypus wilsoniSwaine Xylo-Fung Ad+lmmnDendroctonus pseudotsugae Hopk. Xylo Ad+ImmGnathotrichus retusus (LeC.) Xylo-Fung Ad+lmmPsme, Tshe, Larix; under barkPsme, Pinus, Picea, Alnus,2Trypodendron lineat urn (01.) Xylo-Fung Ad+lmmPopulus; in sapwoodPsme, Abies, Tshe, Picea, Pinus, Thpl;2in saipwood 1,2Ostomna ferruginea L. Fung Ad+Imm Fung-Polyporaceae under bark 3Medetera aidrichii Wheeler Pred 1mm Prey-bark beetles and woodborers 1Xylophagus cinctus DeGeer Pred 1mm under barkCamponotus spp. Pred-Scav? Ad+lmm mine wood of various conifers 1Urocerus albicornis (F.) Xylo-Fung 1mm Abies, Psme, Tshe, Thpl, Pinus, Picea 1Zootermopsis angusticollis(Hagen) Xylo Ad+lmm many kinds of wood 1aXylo = feeds on wood. Pred = predaceous. Fung = fungi. Scav = scavenger.bAd = adult. 1mm = immature.CTsme = Pseudotsuga menzeisf,~ Thpl = Thuya plicata, Tshe = Tsuga heterophylla, Sequ = Sequoia.dSee J. D. Lattin, Administrative Record.358
I- ITable D.8. A list of candidate, sensitive, and old-growth associated plantswithin <strong>the</strong> range of <strong>the</strong> nor<strong>the</strong>rn spotted owl.StatusabOld ForestState Assoclationc Endemicd Priority RiparianSpecies Fed WA OR CA WA OR CA L B Species Associate ReferenceseVascular <strong>Plan</strong>ts:Pacific yewTaxus brevifoliaPort Or<strong>for</strong>d cedarChamaecyparis lawsonianaCommon pipsissiwaChimaphilia umbellataThin-leaved huckleberryVaccinium membranaceumFringed pine-sapPleuricospora fimbriolataClackamas corydalisCorydalis aquae-gelidaeBoreal bedstrawGalium kamtschaticumSpleenwort-leaved goldthreadCoptis asplenifoliaWenatchee larkspurDelphinium viridescensClustered lady's slipperCypripedium fasciculatumOregon checker-mallowSidalcea oregana calvaPink fawn lilyErythronium revolutumPine broomrapeOrobanche pinorumPinefootPityopis cali<strong>for</strong>niaTwin flowerLinnaea borealisRattlesnake plantainGoodyera oblongifoliaWild gingerAsarum hartwegiiVanilla leafAchlys triphyllaQueen's cupClintonia unifloraPurple coral-rootCorallorhiza mertensianaBunch berryCornus canadensisInside-out flowerVancouveria hexandraWaldo rock cressArabis aculeolataMcDonald's rock cressArabis macdonaldianaPreston Peak rock cressArabis serpentinicolaKlamath manzanitaArctostaphylos klama<strong>the</strong>nsisBastard kentophytaAstragalus tegetarioidesBensoniellaBensoniella oreganaGreen's mariposa lillyCalochortus greeneiThe Cedars globe-lillyCalochortus raicheiSiskiyou mariposa lillyCalochortus persistensx 2+ + x x+ +1,22? ?S +C2 T CxS+xS + xE +-T CTSSC3+ ++ xx+? ? + X+ + I?+++ ? ++ +*+ ?xx1,2221,221,2222+ + x 1,2xE E xC2xC2C2 C xC2 C RC2 CC2C2Rcontinues-____ 359
continued-SpeciesFed3tatusa bStateWA OR CAOld ForestAssociationcWA OR CAEndemicd Priority RiparianL B Species Associate ReferenceseSwamp harebellC2Campanula cali<strong>for</strong>nicaWilkin's harebellC3Campanula wilkinsianaPurple toothwartC2Cardamine gemmataPallid birds-beakC2Cordylanthus tenus pallescensMt. Eddy drabaC2Draba carnosulaSiskiyou willow herbC3Epilobium siskiyouenseTrinity buckwheatC2Eriogonum alpinumKlamath Mt. buckwheat C3Eriogonum hirtellumWaldo buckwheatC3Eriogonum pendulumUmpqua green gentian C2Frasera umpquaensisScott Mt. bedstrawC3Galium serpenticum scotticumMendocino gentianC2Gentiana setigeraBoggs Lake hedge-hyssop C2Gratiola heterosepala* Henderson's horkelia C2Horkelia hendersonliPickering's ivesiaC2Ivesia pickeringiiTwo-flowered lathyrusC2Lathyrus biflorusHeckner's lewisiaC3Lewisia cotyledon heckneriStebbin's lewisiaC2Lewisia stebbinsiiHowell's (Mt. Tedoc) linanthus C2Linanthus nuttallii howelliiPeck's lomatiumC3Lomatium peckianumAnthony Peak lupineC2Lupinus antoninusThe Lassics lupineC2Lupinus constanceiStebbin's madiaC3Madia sebbinsiiEgg Lake (Pigmy) monkey flowerC2Mimulus pygmaeusThe Lassics sandwortC2Minuartia decumbensScott Mt. (Trinity) phacelia C2Phacelia dalesianaScott Valley phaceliaC2Phacelia greeneiYreka phloxC1Phlox hirsutaLassen County bluegrass C2Poa fibrataSmall-headed sanguisorbaSanguisorba officinalis microcephalaTracy's sanicleC2Sanicula trayciPale yellow stonecropC3Sedum laxum flavidumApplegate stonecropC2Sedum oblanceolatumCanyon Creek stonecrop C2Sedum obtusatum paradisumSmall star-fruited stonecrop C2Sedum radiatum depauperatumCCCCCCCCEEEXXXXXXXXXXXXXcontinues-360
Red Mountain catchfly C1 E XSilene campanulata campanulataShort-petaled campion C3Silene invisaSomes Bar campionSilene marmorensis -C2Howell's jewelflowerStreptanthus howe/lliC3 XHowell's tauschia C2 CTauschia howe/lliTrail plant + + 1,2Adenocaulon bicolorSugar stick ? ? + 11,2Allotropa virgataDogbane + 1Apocynum pumilumGround cone + 1Boschniakia strobilaceaBromegrass + 1Bromus orcuttianusHareball + 1Campanula prenanthoidesPipsissewa + 1Chimaphila menziesiiGoldthread + + 1,2Coptis laciniataHazelnut + 1Corylus comutaFairy bell + 1Disporum hookeriShield fern + 1Dryopteris argutaPhantom orchid + 1Eburophyton austinaeCrinkleawn fescue + 1Festuca subulifloraNo common name + 1Linnea borealis longifoliaRedwood sorrel + 1Oxalis oreganaNo common name + 1Smilacina racemosaSnowberry + 1Symphoricarpus rivularisWake-robin + 1Trillium ovatumPussytoes C3 1Antenaria suffrutescensNo common name C3 1Happlopappus racemosa congestusSiskiyou monardella C3 1Monardella purpureaPeck's sanicle C3 1Sanicula peckianaNo common name + 2Asarum caudatumNo common name + 2Calypso bulbosaNo common name + 2Pyrola asarifoliaNo common name ? + 2Synthyris reni<strong>for</strong>misHardy Creek barberryC2Berberis nervosa mendocinensisCrater Lake (pumice) grapefern C1 CBotrychium pumicolaIndian Valley brodiaea C2Brodiaea coronaria roseaArid nor<strong>the</strong>rn clarkia C2Clarkia borealiscontinued-StatusasbOld ForestState Associationc Endemcid Priority RiparianSpecies Fed WA OR CA WA OR CA L B Species Associate Referencesecontinues-361
StatusasbOld ForestState Associationc Endemicd Priority RiparianSpecies Fed WA OR CA WA OR CA L B Species Associate Reterences*362Silky cryptanthaC2Cryptantha crinitaMendocino cypressC2Cupressus pygmaeaRed Mt. (Kellogg's) buckwheat C1EEriogonum kelloggiiMilo Baker's lupine C2 TLupinus milo-bakerMendocino bush-mallow C2Malacothamnus mendocinensisRed Mountain stonecrop C1Sedum laxum eastwoodiaeCrater Lake rock cress C2 CArabis suffrutescens horizontalisGorman aster C2 CAster gormanii hCrater Lake collomia C2 CCollomia mazamaHowell's howellii C2 CErigeron howelliiHowell's microseris C2 CMicroseris howell/iBarrett's penstemon C2 CPenstemon barrettiaePeck's penstemon C2 CPenstemon peckiiBristly sidalceaC2Sidalcea setosaPale blue-eyed grass C2 CSisyrinchium sarmentosumWestern sophora C2 CSophora leachianaOregon sullivantia C2 CSullivantia oreganaWayside aster C2 CAster vialisPeck's milk-vetch C2 CAstragalus peckiiHowell's mariposa lily C2 CCalochortus howell/iGreen-tinged paintbrush C2 CCastilleja chloroticaGentner's mission-bells C2 CFritillaria gentneriPurdy's lewisia C2 CLewisia cotyledon purdyiBellinger's meadowfoam C2 CLimnan<strong>the</strong>s floccosa bellingerianaCusick's lupine C2 CLupinus cusickiiBeardtongue C2 CPenstemon glaucinusWestern senecio C2 CSenecio hesperiusObscure Indian paintbrush C2Castilleja cryptanthaReedgrassC2Calamagrostis tweedyiShowy stickweedC1Hackelia venustaHinds' walnutC2Juglans hindsiiGairdner's yampahC2Perideridia gairdneri gairdneriBolander's beach pine C2Pinus contorta bolandenNorthcoast semaphore grass C2 RPleuropogon hooverianuscontinued-continues-
continued-Statusa.bOld ForestState Associationc Endemcid Priority RiparianSpecies Fed WA OR CA WA OR CA L B Species Associate References"'Columbia yellow-cress C2 CRorippa columbiaeTamalpais streptanthusC2Streptanthus batrachopusPit River jewelflowerC2Streptanthus ssp.Oat grass + 1Festuca cali<strong>for</strong>nicaBedstraw + 1Gallium aparineIris + 1Iris tenuissimaMelic grass + 1Melica subulataSnowberry + 1Symphoricarpus mollisFungi and Lichens:No common name +Elaphomyces granulatusNo common name +Elaphomyces muricatusNo common name +Hysterangium crassirhachisNo common name +Hysterangium setcheli:No common name +Rhizopogon atroviolaceusNo common name +Tuber rufumrNo common name S +Oxyporus nobilissimusNo common name S 2Lobaria oregana orpulmonariaWA = Washington OR = Oregon CA = Cali<strong>for</strong>niaaFederal status: E = endangered, C candidate, C1 = category 1 candidate, taxa <strong>for</strong> which <strong>the</strong> U.S. Fish and Wildlife Service has sufficient in<strong>for</strong>mationto support a proposal to list as threatened or endangered under <strong>the</strong> Endangered Species Act. C2 = category 2 candidate, U S. Fish and Wildlife Servicecandidates that need additional in<strong>for</strong>mation to propose as threatened or endangered under <strong>the</strong> Endangered Species Act C3 = taxa which have proven tobe more abundant or widespread than previously believed and/or which have no identifiable threats. This status is based only on <strong>the</strong> most recentlypublished Candidate Notice of Review.State status: CA: E = endangered, T = threatened, R = rare; WA: E = endangered, T = threatened, S = sensitive: OR: C = critical. Sources (State):Califomia Department of Fish and Game (1991b), Oregon Natural Heritage Program (1991), Washington Natural Heritage Program (1990).c+ = old-growth associated, * = close old-growth associated, ? = species not studied or data insufficient (see Ruggiero et al. 1991)dEndemic: L = local, B = broadly (see Ruggiero et al. (1991) <strong>for</strong> definition and list of endemic species).eReferences: 1) Bruce Bingham, Old-growth Douglas-fir Program, USFS, Pacific Southwest Research Station, Arcata, Cali<strong>for</strong>nia (see administrativerecord). 2) Ruggiero et al. 1991.genus Lobariri occur primarily in <strong>the</strong> canopy of coniferous <strong>for</strong>ests, and <strong>the</strong>irabundance in <strong>the</strong>se canopies becomes greater as a stand develops into an oldgrowth<strong>for</strong>est. These organisms are characteristic of older <strong>for</strong>ests in <strong>the</strong> PacificNorthwest and provide important food <strong>for</strong> several animal species, most notablyungulates and nor<strong>the</strong>rn flying squirrels. These food sources are particularlyimportant during <strong>the</strong> winter when o<strong>the</strong>r foods are scarce. The most noblepolypore (Oxyporus nobiltssinius) has been found only three times and wasassociated with older <strong>for</strong>ests on each occasion.The role of mycorrhizal fungi in coniferous <strong>for</strong>ests is important to ecosystemfunction (Trappe and Fogel 1977) because of <strong>the</strong> symbiotic relationship betweentruffle fungi and <strong>the</strong> roots of vascular plants. Each organism derives abenefit from <strong>the</strong> relationship: <strong>the</strong> fungi take up nutrients such as potassium,phosphorus, nitrogen, and sodium, and <strong>the</strong>se are translocated to <strong>the</strong> associatedconiferous trees. Conversely, <strong>the</strong> fungi depend on <strong>the</strong> host tree <strong>for</strong>phytosynthates of carbon. Small animals eat truffle fungi and disperse <strong>the</strong>ir363
Summaryspores (Maser et al. 1978b). Mushrooms also are consumed which complimentsspore dispersal by wind. The functional role of mycorrhizal fungi inconiferous <strong>for</strong>ests has been described by Trappe and Fogel (1977) and <strong>the</strong>ircharacterization of this role is quoted below:"The great majority of vascular plants have evolved to a dependenceon mycorrhizae as <strong>the</strong> most metabolically active parts of <strong>the</strong>ir rootsystems. Most woody plants require mycorrhizae to survive, andmost herbaceous plants need <strong>the</strong>m to thrive. Despite <strong>the</strong>ir relativelysmall biomass, <strong>the</strong> mycorrhizal fungi (mycobionts) are vital <strong>for</strong>uptake and accumulation of ions from soil and translocation tohosts because of <strong>the</strong>ir high metabolic rate and strategically diffusedistribution in <strong>the</strong> upper soil layers. The mycobionts produceenzymes, auxins, vitamins, cytokinins, and o<strong>the</strong>r compounds thatincrease rootlet size and longevity. They commonly protect rootletsfrom pathogens. They absorb and translocate water to <strong>the</strong> host.Most mycobionts, in turn, depend on <strong>the</strong>ir hosts <strong>for</strong> carbon products.Except <strong>for</strong> orchid mycobionts, few are capable of decomposingorganic matter, although <strong>the</strong>ir respiration contributes significantlyto evolution of carbon dioxide from soil. The fungal mycelium andsporocarps are sources of accumulated nutrients and energy <strong>for</strong>decomposers and consumers. Nutrients and carbon can be transferredfrom one vascular plant to ano<strong>the</strong>r by a shared mycorrhizalmycelium. The several thousand species of fungi believed to <strong>for</strong>mmycorrhizae encompass great physiological diversity. They differ innumerous ways, including degree of host specificity, resistance toenvironmental extremes, selectivity in ion uptake, and production ofbiologically active products. Net effects of one mycobiont on a hostcan differ from those of ano<strong>the</strong>r, although overall functions areshared by most. As key links in below ground nutrient and energycycling, mycorrhizae and <strong>the</strong>ir mycobionts can be ignored only atsubstantial peril of reaching unreal conclusions about ecosystemprocesses."This explanation gives some sense of <strong>the</strong> importance of fungi in <strong>the</strong> function ofconiferous <strong>for</strong>ests. In addition, two of <strong>the</strong> spotted owl's primary prey species(nor<strong>the</strong>rn flying squirrel and red-backed vole) consume fungi as <strong>the</strong>ir primaryfood (Maser et al. 1978b), so that fungi are an important link in <strong>the</strong> owl's foodchain.Three hundred and sixty-four species of plants and animals were considered in<strong>the</strong> recovery planning process <strong>for</strong> <strong>the</strong> nor<strong>the</strong>rn spotted owl (Table D.9). Ofthose, five are listed federally as threatened or endangered, more than 150 arecandidates <strong>for</strong> listing; 30 are listed as threatened or endangered in one or moreof <strong>the</strong> three states, and 131 are "species of special concern" in at least one of<strong>the</strong> states. In addition, <strong>the</strong> list of 28 fish species includes approximately 766stocks that are considered at risk and may become candidates <strong>for</strong> listing in <strong>the</strong>future. More than 100 of <strong>the</strong> species are narrowly or broadly endemic to <strong>the</strong>Pacific Northwest and 194 are associated with older <strong>for</strong>ests. The large numberof candidates <strong>for</strong> federal listing, species of special concern, and endemicspecies emphasizes <strong>the</strong> importance of considering o<strong>the</strong>r species in <strong>the</strong> owlrecovery plan. In addition, <strong>the</strong> large number of riparian associated species(132), plus <strong>the</strong> number of fish stocks at risk emphasize <strong>the</strong> importance ofriparian areas.364
Of <strong>the</strong> 364 species considered, <strong>the</strong> committee identified 18 priority species(marbled murrelet, bald eagle, goshawk, marten, fisher, grizzly bear, gray wolf,Oregon slender salamander, Siskiyou Mountain salamander, Larch Mountainsalamander, Del Norte salamander, Olympic salamander-four species, Pacificgiant salamander, Cope's giant salamander, tailed frog); a larger group ofriparian-associated species including fishes, amphibians, mammals, insects,and molluscs: and a small group of prey species <strong>for</strong> <strong>the</strong> nor<strong>the</strong>rn spotted owl(flying squirrel, bushy-tailed woodrat, dusky-footed woodrat, red tree voles, andwestern red-backed vole). Of <strong>the</strong>se, <strong>the</strong> marbled murrelet and <strong>the</strong> numerousfish stocks were given highest priority. The bald eagle, goshawk, marten,fisher, grizzly bear, and gray wolf were assigned lower priority, because <strong>the</strong>bald eagle, grizzly bear and gray wolf already are protected under <strong>the</strong> EndangeredSpecies Act; and sufficient in<strong>for</strong>mation was lacking on goshawks,marten, and fisher to modify <strong>the</strong> recovery plan. The 10 salamanders haveextremely restricted home ranges and were considered in <strong>the</strong> delineation ofDCAs <strong>for</strong> <strong>the</strong> owl. The committee assumed that spotted owl prey and <strong>the</strong>older-<strong>for</strong>est associated species would benefit from a plan that conserved older<strong>for</strong>ests <strong>for</strong> owls.Table D.9. Summary of 361 plants and animals considered in <strong>the</strong> recovery planningprocess <strong>for</strong> <strong>the</strong> nor<strong>the</strong>rn spotted owl.NSpecies ofOlderSpecies Federally Candidate State Special Forest Riparian(Number) Listed <strong>for</strong> Listing Listed Concern Endemica Associate AssociateBirds (23) 1 2 4 8 4 20 3Mammals (18) 2 2 3 9 8 12 4Amphibiansb (26) 0 7 3 16 20 12 12Fish (28) 1 7 3 25 N/A N/A 28Molluscs (58) 0 10 1 29 47 43 45Insects (59) 0 34 0 c c 23 34Vascular plants (144) 1 93 16 42 23 76 6Fungi and Lichens (8) 0 0 c 2 c 8 0TOTAL (N=364) 5 155 30 131 102 194 132aei<strong>the</strong>r locally or broadly endemic.blncludes two reptiles - <strong>the</strong> sharp-tailed snake and western pond turtle.CUnknown.I365
Biology of <strong>Owl</strong> Prey, Older Forest Associates,and Riparian EcosystemsUnique Food Webs of Older Forest EcosystemsTemperate coniferous <strong>for</strong>ests of <strong>the</strong> Pacific Northwest are unique among <strong>the</strong><strong>for</strong>ests of <strong>the</strong> world <strong>for</strong> a number of reasons (Waring and Franklin 1979), and<strong>the</strong> structural and functional diversity of <strong>the</strong>se <strong>for</strong>ests provides habitat <strong>for</strong> adiverse array of plants and animals. Of particular interest is <strong>the</strong> high speciesrichness of birds, mammals, amphibians, molluscs, arthropods, and plantsthat characterize <strong>the</strong> complex food webs in <strong>the</strong>se <strong>for</strong>ests. Among <strong>the</strong> vertebrateand invertebrate fauna, <strong>the</strong>re are numerous species of granivores, detritivores,folivores, herbivores, fungivores, and a diverse group of aquatic species includingfishes, amphibians, and arthropods (Harris 1984:52). The mammalianorder of insectivores (shrews and moles) is represented in <strong>the</strong> Pacific Northwest<strong>for</strong>ests by more species than in any o<strong>the</strong>r temperate or boreal <strong>for</strong>est in NorthAmerica. Two of <strong>the</strong> most important food webs in <strong>the</strong>se coniferous <strong>for</strong>estsinclude foliage and fungi eating mammals (referred to as folivores andfungivores, respectively) that are prey <strong>for</strong> <strong>the</strong> nor<strong>the</strong>rn spotted owl.Two folivores that inhabit coniferous <strong>for</strong>ests in <strong>the</strong> Pacific Northwest belong to<strong>the</strong> genus Phenacomys (Arborimus), which is restricted to western Oregon andnorthwest Cali<strong>for</strong>nia (Figure D. la). The red tree voles (Phenacomyslongicaudus, P. porno) are particularly unusual among rodents in that <strong>the</strong>y livealmost <strong>the</strong>ir entire life in <strong>the</strong> canopy of Douglas-fir trees. These species areassociated with old-growth Douglas-fir <strong>for</strong>ests (Aubry et al. 1991, Ruggiero etal. 199 lb), although <strong>the</strong>y do occur in lower numbers in <strong>for</strong>ests of o<strong>the</strong>r treespecies and younger successional stages. The diet of <strong>the</strong> P. longicaudus isalmost entirely needles of Douglas-fir (Maser et al. 1981). In turn, <strong>the</strong> red treevole is one of <strong>the</strong> primary prey species of <strong>the</strong> nor<strong>the</strong>rn spotted owl in <strong>the</strong>Cascade Mountains of Oregon (Forsman et al. 1984). The third species in thisgenus is <strong>the</strong> white-footed vole (Phenacomys albipes), an extremely rare speciesthat is not as strongly restricted to <strong>the</strong> <strong>for</strong>est canopy (Figure D.l.b). Because ofits rarity, much less is known about this species. For example, of approximately10,000 individual small mammals and amphibians trapped with pitfalltraps in <strong>the</strong> Oregon Coast Range, only 60 were white-footed voles (Gomez 1992).He found this species to be more abundant in deciduous <strong>for</strong>ests than elsewhere,and it was associated with riparian areas where deciduous vegetationwas more abundant. Voth et al. (1983) suggested that <strong>the</strong> species' diet isrestricted to foliage of deciduous plants.A second important food web in coniferous <strong>for</strong>ests in <strong>the</strong> Pacific Northwestinvolves fungivores. Although a number of species eat fungi, <strong>the</strong> western redbackedvole and <strong>the</strong> nor<strong>the</strong>rn flying squirrel are most notable within thisgroup. The nor<strong>the</strong>rn flying squirrel is <strong>the</strong> primary prey species <strong>for</strong> <strong>the</strong> nor<strong>the</strong>rnspotted owl in Washington and most of Oregon. The red-backed vole isamong <strong>the</strong> top five prey species (Forsman et al. 1984, Thomas et al. 1990) andis endemic to <strong>the</strong> Pacific Northwest (Figure D.5.a). Old-growth <strong>for</strong>ests areoptimal habitat <strong>for</strong> <strong>the</strong> flying squirrel and <strong>the</strong> red-backed vole. The red-backedvole spends most of its time in underground burrows and feeds on <strong>the</strong> fruitingbodies of hypogeous fungi (Maser et al. 1978a). Many mammals consumefungi, but few depend on this food source to <strong>the</strong> extent that <strong>the</strong> red-backedvole does. Gashwiler (1959, 1970) and Goertz (1964) reported a decrease orelimination of this species following clear-cutting. The decrease is believed tohave resulted from <strong>the</strong> disappearance of hypogeous fungi after this <strong>for</strong>m of366
<strong>Spotted</strong> <strong>Owl</strong> Prey 2timber harvest (Maser et al. 1978b). Hypogeous fungi <strong>for</strong>m symbiotic relationshipswith <strong>the</strong> roots of coniferous trees, and <strong>the</strong>se associations are importantto <strong>the</strong> overall health of <strong>the</strong> trees. The nor<strong>the</strong>rn flying squirrel also consumesfungi (McKeever 1960, Maser et al. 1978b), at least seasonally, although itspends most of its time in <strong>the</strong> <strong>for</strong>est canopy. The flying squirrel also eatsepiphytic lichens that are abundant in <strong>the</strong> <strong>for</strong>est canopy. The nor<strong>the</strong>rn flyingsquirrel, red tree vole, and red-backed vole comprise more than 75 percent of<strong>the</strong> diet of <strong>the</strong> spotted owl in <strong>the</strong> Oregon Cascades, so <strong>the</strong>ir dependence on <strong>the</strong>production of fir needles, fungi, and lichens in coniferous <strong>for</strong>est is important to<strong>the</strong>se food webs and <strong>the</strong> owl.The availability of energy <strong>for</strong> maintenance and reproduction is important to allorganisms, so to properly manage an animal, <strong>the</strong> ecology of its food sourcesmust be considered. Although dietary requirements of a predator may be metby a large range of sources, many species, and <strong>the</strong> spotted owl in particular,are selective in <strong>the</strong> prey <strong>the</strong>y feed upon. Although a variety of species are eatenby <strong>the</strong> owl, only a few species make up <strong>the</strong> majority of <strong>the</strong> owl's diet within agiven region. More than 90 percent of <strong>the</strong> spotted owl prey consists of mammals(Forsman et al. 1984). <strong>Spotted</strong> owl diets and <strong>the</strong> habitat associations ofits prey were reviewed thoroughly by Thomas et al. (1990:20 1). This sectionsummarizes <strong>the</strong>ir report and adds recently published in<strong>for</strong>mation that augments<strong>the</strong>ir work.The diet of nor<strong>the</strong>rn spotted owls varies regionally, but within a region it istypically dominated by two or three species (Thomas et al. 1990). Compositionof diets varies seasonally (Forsman et al. 1984) but appears to be stable overtime based on studies during different years (Thomas et al. 1990). Flyingsquirrels (Glaucomys sabrinus) and woodrats (Neotoma cinerea and N. fuscipes)dominate <strong>the</strong> diet in mesic and dry <strong>for</strong>ests, respectively (Thomas et al. 1990).Snowshoe hares (Lepus americanus) and brush rabbits (Sylvilagus bachmantjtypically represent less than 10 percent of <strong>the</strong> prey based on number of preytaken, but because of <strong>the</strong>ir larger size, <strong>the</strong>y have been reported to comprise upto 25 percent of <strong>the</strong> prey biomass (Forsman et al. 1984:43). Red tree voles(Phenoacomys longicaudus P. porno) and deer mice (Peromyscus maniculatus)may constitute more than 30 percent of prey numbers and more than 10percent of prey biomass regionally (Thomas et al. 1990). Western red-backedvoles (Clethrionomys cali<strong>for</strong>nicus) usually comprise a smaller percent of <strong>the</strong> dietthan do red tree voles and deer mice, generally less than 5 percent of preybiomass (Forsman et al. 1984:41).Nor<strong>the</strong>rn Flying Squirrels.-Nor<strong>the</strong>rn flying squirrels have a broad distributionthroughout coniferous <strong>for</strong>ests and are found in western Washington,Oregon, and nor<strong>the</strong>rn Cali<strong>for</strong>nia (Figure D.5.a). Flying squirrels are arborealmammals and are not resident in recent clear-cuts. They nest in many substrates,including cavities in live and dead trees. Density does not appear to bestrongly dependent on stand age alone. In <strong>the</strong> Oregon Coast Range, flyingsquirrels were more abundant in old-growth than in second-growth standsduring some, but not all, years of a study by Carey et al. (1992). Similardensities were reported in old-growth and second-growth stands in <strong>the</strong> OregonCascades (Rosenberg and Anthony 1992). In an ongoing study in true fir(Abies spp.) <strong>for</strong>ests in Lassen National Forest (north-central Cali<strong>for</strong>nia), preliminarydata suggest squirrel densities are markedly lower in an intensivelymanaged shelterwood cut than in young- and old-growth stands (J. Waters,U.S. Forest Service, Arcata, Cali<strong>for</strong>nia, pers. comm.).2 Contributed by Daniel Rosenberg, Redwood Sciences Laboratory. U.S. Forest Service, Arcata, Cali<strong>for</strong>nia367
Woodrats.-The dusky-footed woodrat (N.Jfiscipes) is limited in distribution toparts of western Oregon and most of western Cali<strong>for</strong>nia (Figure D.5.b), while<strong>the</strong> bushy-tailed woodrat (N. cinerea) is found throughout Washington andOregon, and in parts of nor<strong>the</strong>rn Cali<strong>for</strong>nia (Figure D.5.c). Woodrats areassociated with seral stages that have abundant understory vegetation andcoarse woody debris, such as early successional stages (recent clear-cuts) andolder seral stages (Thomas et al. 1990); bushy-tailed woodrats also are associatedwith rocky areas, such as talus slopes (Thomas et al. 1990).Deer mice.-The deer mouse (Peromyscus maniculatus) is one of <strong>the</strong> mostwidely distributed mammal species in North America and is found throughoutOregon, Washington, and Cali<strong>for</strong>nia. Such a wide-ranging species would beexpected to be a habitat generalist, and data from <strong>the</strong> Pacific Northwest supportthis contention. Deer mice do not show consistent preferences <strong>for</strong> particularstand ages (Thomas et al. 1990). The <strong>for</strong>est deer mouse (P. oreas)inhabits older <strong>for</strong>ests in western Washington and sou<strong>the</strong>rn British Columbia(Figure D.5.c). Because of its extensive use of tree canopies, it is probably animportant prey species <strong>for</strong> owls in Washington (West 1991).Red tree vole.-The red tree voles (Phenacomys ssp.) have <strong>the</strong> most restricteddistribution of all <strong>the</strong> species preyed upon by spotted owls. Be<strong>for</strong>e <strong>the</strong> Cali<strong>for</strong>niapopulation (P. pomo) was recognized to be a species separate from <strong>the</strong>Oregon (P. longicaudus) species (Johnson and George 1991), <strong>the</strong> range of <strong>the</strong>red tree vole included parts of western Oregon and northwest Cali<strong>for</strong>nia (FigureD.2). The Cali<strong>for</strong>nia population now is considered a separate species based onmorphometric and genetic data. Habitat associations of <strong>the</strong>se species arebased on relatively small sample sizes, but <strong>the</strong>re is a trend of greater relativeabundance with increasing stand age, with <strong>the</strong> highest densities in old-growth<strong>for</strong>ests (Corn and Bury 1991, Ruggiero et al. 199 lb).Rabbits and Hares.-Brush rabbits occur in most of western Oregon andCali<strong>for</strong>nia, and appear to be absent from Washington (Figure D.5.A. Snowshoehares are found in western Oregon and Washington, and into north-centralCali<strong>for</strong>nia (Figure D.5.e). No research has been conducted to specifically studyhabitat associations of lagomorphs in relationship to spotted owl habitat. Ingeneral, <strong>the</strong>se species occupy brushy, densely vegetated habitats (Thomas etal. 1990) and are not more abundant in older <strong>for</strong>ests. It is primarily young of<strong>the</strong> year that are preyed upon by spotted owls (Forsman et al. 1984:41), sodispersal habitat may be most important when considering <strong>the</strong>se species asspotted owl prey.Red-backed voles.-Westem red-backed voles occur throughout westernOregon and northwest Cali<strong>for</strong>nia, and <strong>the</strong> sou<strong>the</strong>rn red-backed vole (C.gapperO occurs in western Washington (Figure D.5.1). Western red-backedvoles live in a variety of <strong>for</strong>ested habitats, but densities are low in recentlyburned clear-cuts and <strong>the</strong>ir occurrence may be positively associated withwoody debris (reviewed by Alexander and Verts, In press). No differences inabundance of Cleithrionomys spp. were found in unmanaged young (30 to 70years) Douglas-fir stands compared to older seral stages (Corn and Bury 1991,Gilbert and Allwine 1991, West 1991), but abundance was much lower inmanaged young stands than in old-growth stands (Rosenberg and Anthony1990).Managing prey <strong>for</strong> <strong>the</strong> nor<strong>the</strong>rn spotted owl.-Recent research on preyspecies was motivated, in part, by an interest in increasing prey abundancethrough silvicultural prescriptions. The results to date do not show consistentpatterns that would allow this to be achieved. This, combined with <strong>the</strong> difficultyin assessing <strong>the</strong> relationship between prey abundance and availability,makes <strong>the</strong> feasibility of manipulating prey densities to increase owl use of368
<strong>for</strong>ests questionable. Experimental manipulations of habitat and assessmentsof prey response (as well as owl response) are needed to test <strong>the</strong> effectiveness ofmanagement techniques. Failure of habitat models to predict animal responsein locations and years o<strong>the</strong>r than <strong>the</strong> ones from which <strong>the</strong> data originally werecollected is a common problem (Noon 1986). This probably results from <strong>the</strong>numerous factors besides habitat that affect animal populations (Noon 1986).The ability to manipulate habitat to increase prey availability is difficult becauseof <strong>the</strong> complex interaction of predator and prey.Ecology of Riparian Ecosystems and Native FishesThe committee's list includes approximately 132 species of animals that arefederally listed as threatened or endangered, candidates <strong>for</strong> federal listing,species of special concern, or older-<strong>for</strong>est associates and are associated withriparian areas. This list of species is diverse and includes three birds, fourmammals, 12 amphibians, 45 molluscs, and 34 arthropods as well as 28 fish.Riparian associates comprise approximately one third of <strong>the</strong> o<strong>the</strong>r speciesconsidered as a result of Secretary of <strong>the</strong> Interior Lujan's request. The associationto riparian areas by <strong>the</strong>se species indicates <strong>the</strong> importance of riparianareas in <strong>the</strong> recovery plan <strong>for</strong> <strong>the</strong> spotted owl.Riparian ecosystems represent a small proportion of <strong>the</strong> land base (generallyless than 5 percent), but <strong>the</strong>y provide habitat <strong>for</strong> a rich and diverse group ofplants and animals. A large number of fish stocks has been identified as beingat risk (Nehlsen et al. 1991, Moyle et al. 1989, Williams et al. 1989), in partbecause of intensive timber harvest along streams in many areas (see sectionon Native Fishes). The importance of riparian ecosystems, <strong>the</strong>ir roles inconiferous <strong>for</strong>ests, and <strong>the</strong>ir potential importance as ecological corridorsamong DCAs is discussed next.Riparian EcosystemsRecently ecologists and land managers have recognized <strong>the</strong> importance ofstructure and function of riparian zones <strong>for</strong> terrestrial and aquatic ecosystems(Gregory et al. 1988, Knight and Bottorf 1984, Meehan et al. 1977, Beschta1989). These functions include stream shading, bank stabilization, nutrientuptake, input of leaves and needles into streams, sediment filtering, bankbuilding, and <strong>the</strong> contribution of large wood (Elmore and Beschta 1987,Gregory et al. 1988). The contrast in communities and physical environmentcreates rich patterns of processes and structure that are <strong>the</strong> basis <strong>for</strong> <strong>the</strong> highbiotic diversity found in riparian zones (Gregory et al. 1988).Management.-The segregation of riparian areas from o<strong>the</strong>r ecosystems bystate and federal agencies is a common management approach. The resultpredominately has been <strong>the</strong> development of federal policies and state <strong>for</strong>estpractices that allow varying intensities of <strong>for</strong>est activities. The states of Cali<strong>for</strong>nia,Washington, and Oregon have addressed riparian ecosystems in <strong>the</strong>ir<strong>for</strong>est practices rules. The states also are involved in an extensive monitoringprogram to evaluate <strong>the</strong> effectiveness of <strong>the</strong>se rules.In general, federal agencies are consistent in <strong>the</strong>ir approach to <strong>the</strong> classificationof streams. Streams are segregated into four classes based on <strong>the</strong> presenceor absence of fishes, <strong>the</strong> uses of <strong>the</strong> water (e.g., domestic use by cities,recreation), and whe<strong>the</strong>r <strong>the</strong> stream is a significant contributor to a higherclassstream. The states use predominately <strong>the</strong> same process but have delineated<strong>the</strong>ir streams by consolidating <strong>the</strong> categories into as few as two or asmany as four classes. Timber harvest regulations, however, vary among states369
and are less restrictive under state <strong>for</strong>est practices laws than under federalmanagement guidances. Regulations in <strong>the</strong> states range from retention of asfew as 21 conifers per 1,000 feet of stream in one state to 50 trees in ano<strong>the</strong>r.None of <strong>the</strong> three states' laws addresses full floodplain function.Not all riparian policies address small upper watershed tributaries, full floodplainfunction, and small wetland areas within <strong>the</strong> terrestrial <strong>for</strong>est matrix.The result is a landscape with various widths of protection along streamsystems that allow varying degrees of harvest. This buffer strip conceptappears to be inherently unstable, biologically and physically (Gregory et al.1988). Changes in natural patterns and composition of streamside vegetationhave major short- and long-term consequences to channel characteristics andmorphology, streambed and channel stability, ecosystem functioning, wildlifehabitat, and <strong>the</strong> biological productivity of streams and wetlands (Beschta1989).Riparian areas and wetlands provide some of <strong>the</strong> most important wildlifehabitat in <strong>the</strong> <strong>for</strong>est lands of <strong>the</strong> western states. Their use as habitat generallyis greater than that of surrounding areas because <strong>the</strong> major life requirements<strong>for</strong> many species are present (Oakley et al. 1985). They are used <strong>for</strong> <strong>for</strong>agingand watering, breeding and rearing, hiding and resting, and <strong>the</strong>rmal cover. Of<strong>the</strong> 414 wildlife species in Oregon and Washington, 359 (87 percent) useriparian zones or wetlands during some season(s) or part(s) of <strong>the</strong>ir life cycle.Of <strong>the</strong>se, 318 species use one or more of <strong>the</strong> plant communities directlyassociated with riparian zones and wetlands (Oakley et al. 1985). Use issimilar in Cali<strong>for</strong>nia. Riparian areas support a diverse arthropod fauna, andmany of <strong>the</strong>se species are important food items <strong>for</strong> vertebrate animals (J.Latlin, Oregon State University, pers. comm.). In addition to wildlife speciesdirectly dependent on riparian areas, populations in adjacent areas are influencedstrongly by <strong>the</strong> riparian community (Stevens et al. 1977). Managementaimed at maintenance or protection of riparian zones is extremely importantbecause of <strong>the</strong> many species that use <strong>the</strong>se areas (Caro<strong>the</strong>rs 1977).Riparian areas are more common than wetlands in <strong>the</strong> <strong>for</strong>ested systems of <strong>the</strong>west. Oakley et al. (1985) identified six major reasons that riparian andwetland areas are important <strong>for</strong> wildlife:1. They contain <strong>the</strong> three critical habitat components: food, cover, and water.2. They contain a greater diversity of plant species and vegetative structurethan adjacent uplands.3. The elongated shape of most riparian zones maximizes edge effect with <strong>the</strong>surrounding <strong>for</strong>est as well as with water.4. They have different microclimates from surrounding coniferous <strong>for</strong>ests dueto increased humidity, a higher rate of transpiration, and greater air movement.5. They serve as natural migration routes and travel corridors.6. They play a major role in maintaining water quality and quantity.Riparian and wetland areas also are important <strong>for</strong> many o<strong>the</strong>r types of landuses. Highly productive timber sites frequently occur along or around <strong>the</strong>seareas. Recreation, road locations, mining activities, road building material,and home sites also are among <strong>the</strong> many o<strong>the</strong>r important uses. For <strong>the</strong>sereasons and many o<strong>the</strong>rs, riparian and wetland areas are recognized as criticalareas in multiple-use management and planning.370
Summary.- Employment of an ecosystem perspective in developing policy andmanagement guidance allows <strong>for</strong> an assessment of riparian function, structure,and interaction with adjoining ecosystems. This process will provide selfsustainingstreamside <strong>for</strong>ests that will ensure <strong>the</strong> desired conditions of riparianresources <strong>for</strong> <strong>the</strong> future (Gregory and Ashkenas 1990). A single prescription<strong>for</strong> riparian management will not address <strong>the</strong> variation in riparian resourcesthat occur throughout <strong>the</strong> region's <strong>for</strong>ests (Gregory and Ashkenas 1990). Forexample, areas within <strong>the</strong> range of <strong>the</strong> nor<strong>the</strong>rn spotted owl east of <strong>the</strong> Cascaderange in Oregon require different considerations than do coastal areas.Landscape and basin considerations should be considered prior to <strong>the</strong> developmentof site-specific prescriptions <strong>for</strong> riparian management.The committee identified <strong>the</strong> following as appropriate management considerationsin riparian areas:* Recognize <strong>the</strong> unique value of riparian areas within <strong>the</strong> context of <strong>the</strong> environrnentin which <strong>the</strong>y are located.* Consider landscape connectivity.* Considerfullfloodplainfunction.* Recognize <strong>the</strong> importance of all stream systems, regardless of size, and view<strong>the</strong>se streams and <strong>the</strong>ir associated riparian areasfrom a basin (landscape)perspective.* Maintain species and age-class distributions of streamside vegetation that willprovide large woody debris to <strong>the</strong><strong>for</strong>estfloor and stream channeL* Restore natural processes within <strong>the</strong> stream channel and <strong>the</strong> riparian managementzone.* Monitor restoration activities to determine If desired results are achieved.Native FishesTwenty-eight species comprising approximately 1,181 native fish stocks occurin approximately 455 streams, rivers, lakes, and estuaries within <strong>the</strong> range of<strong>the</strong> nor<strong>the</strong>rn spotted owl. Of <strong>the</strong>se, <strong>the</strong>re are 348 streams with stocks at risk,and <strong>the</strong> number of stocks that are considered at risk totals 766. Any of <strong>the</strong>sefish stocks potentially could benefit from <strong>the</strong> recovery plan <strong>for</strong> <strong>the</strong> owl (TableD.4). Throughout <strong>the</strong> owl's range, most aquatic habitat has been impacted insome way by land-use activities. Restoration of depleted stocks (<strong>the</strong> stockconcept is discussed below) and protection of currently secure stocks dependson suitable habitat <strong>for</strong> all life stages of those stocks.This inventory of species and stocks is not complete, owing to <strong>the</strong> extensiverange encompassed in this survey and <strong>the</strong> scarcity of in<strong>for</strong>mation on specieso<strong>the</strong>r than those of particular commercial or sporting interest. Little geneticidentification of fish stocks has been done in <strong>the</strong> region; <strong>the</strong>re<strong>for</strong>e distinctstocks may have been overlooked. In general, <strong>the</strong>re are two major life historypatterns among fishes in <strong>the</strong>se areas, anadromous (spawning in fresh waterand maturing in salt water) and resident (remaining in fresh water). Salmonidsmake up a major portion of <strong>the</strong> stocks identified within <strong>the</strong> range of <strong>the</strong> nor<strong>the</strong>rnspotted owl. In<strong>for</strong>mation on distribution, stock size, and habitat requirementsgenerally are available <strong>for</strong> <strong>the</strong>se species because of <strong>the</strong>ir economicimportance and recreational value.371
Stock concept.-The term "stock" was adopted 51 years ago, shortly after <strong>the</strong>first attempts to describe stocks of Pacific salmon and discuss <strong>the</strong>ir importanceto management of <strong>the</strong> species (McIntyre 1983). After reviewing <strong>the</strong> results ofearly marking experiments, Rich (1939) concluded that Pacific salmon weredivided into many local populations or what we now refer to as stocks (Ricker1972). Anadromous salmonid species comprise populations that originatefrom specific watersheds as juveniles and generally return to <strong>the</strong>ir natalstreams to spawn. This life cycle results in a large degree of reproductiveisolation of interbreeding individuals or stocks (Ricker 1972). Stocks representunique genetic entities, and loss of a stock is irreversible. It is at <strong>the</strong> stocklevel that conservation and management of salmon is taking place. Additionaldocumentation and discussion of fish stocks can be found in NehIsen et al.(1991).Effects of land-use activities on fishes and fish habitat.-The condition ofwatersheds dictates <strong>the</strong> physical and chemical makeup of <strong>the</strong> streams thatdrain <strong>the</strong>m and of <strong>the</strong> lakes that lie within <strong>the</strong>m (Meehan 1991). Vannote et al.(1980) proposed a "river continuum concept" based on a continuous gradientin physical variables within a river system from headwaters to mouth. Thisgradient leads to a continuum of biotic adjustments and consistent patterns ofloading, transport, utilization, and storage of organic matter along <strong>the</strong> length ofa river (Vannote et al. 1980). Management of fish habitat, and <strong>the</strong>re<strong>for</strong>e fishpopulations, requires consideration of <strong>the</strong> habitat within <strong>the</strong> watershed toaccommodate stream and terrestrial processes that work in concert throughout<strong>the</strong> basin.Gradients within <strong>the</strong> "river continuum" also provide a basis <strong>for</strong> assessingcumulative effects. For example, fine sediment is transported from highgradient to low gradient areas, where it can accumulate to levels that affectfisheries. The translocation downstream and <strong>the</strong> contribution from severalsources make traditional cause-and-effect evaluation of cumulative effectsdifficult, if not impossible. Multiple ownerships complicate <strong>the</strong> issue and mayimpede evaluation of upstream effects.Many land-use activities can affect aquatic habitat and fish populations. Suchactivities include road construction, timber harvest, livestock grazing, hydroelectricdevelopment, chemical applications, mining, and recreation. Theeffects of road construction and timber harvest, which are significant within<strong>the</strong> range of <strong>the</strong> spotted owl, are discussed here.Roads.-Roads can modify natural drainage systems and accelerate erosionprocesses; <strong>the</strong>se changes can alter physical processes in streams, leading tochanges in streamflow regimes, channel configuration, sediment transport andstorage, substrate composition, and stability of slopes adjacent to streams(Furniss et al. 1991). Increased sediment input from roads can affect fishhabitat. The principle source of sediment entering streams is by mass soilmovements and surface erosion processes (Swanston 1991), although <strong>for</strong>estroads can substantially increase <strong>the</strong> frequency of mass soil movements insteep watersheds (Everest et al. 1987). Furniss et al. (1991:297-323) foundthat rarely can roads be constructed without some effect on fish habitat.However, roads that have been properly planned, constructed, and maintainedhave minimized <strong>the</strong>se effects. Regular maintenance of roads to reduce impactson fish habitat should be practiced on all roads, not just those that are activelyused.Timber harvest.-Effects of timber harvest and silvicultural treatments(planting, thinning, burning, mechanical site preparation, and application ofchemicals) on stream ecosystems are complex (Meehan 1991). Various timberharveststrategies ranging from clear-cutting to long-rotation selective harvest,372
affect fish habitat in different ways. In general, <strong>the</strong> effects of timber harvestingon fish habitat include increased sedimentation and water temperatures,changes in seasonal flow patterns, quantity and distribution of woody debris,and channel morphology (Chamberlin et al. 1991:181 -205).Quantity and timing of sediment entry into stream systems are important indetermining habitat quality <strong>for</strong> fishes. Specific substrate conditions arerequired <strong>for</strong> spawning, rearing, and over-wintering. Increases in fine sedimentfrom logging activities has been shown to decrease survival of salmonid fry(Scriver and Brownlee 1989). Substrate conditions also are important <strong>for</strong>salamanders, aquatic insects and aquatic plants that contribute to energyprocessing in aquatic environments.When streamside trees are removed, increased light may stimulate primaryproduction (Murphy and Meehan 1991). Increased periphyton (algae andassociated microorganisms growing attached to any submerged surface)production after canopy removal may increase <strong>the</strong> abundance of invertebratesand fishes, mainly by increasing <strong>the</strong> quantity of detritus (Murphy and Meehan1991). Increased primary production from canopy removal may last <strong>for</strong> a shortperiod of time and <strong>the</strong>n diminish due to canopy closure, which is often denserin even-age, second-growth <strong>for</strong>ests than in older <strong>for</strong>ests (Murphy and Meehan1991). In addition, cumulative downstream effects of increased water temperaturemay create downstream areas that are not suitable <strong>for</strong> native fishes.Among <strong>the</strong> most important long-term effects of <strong>for</strong>est management activities onfish habitat in western North America have been changes in distribution andabundance of large woody debris (more than 14 inches in diameter) in streams(Hicks et al. 1991). Large woody debris plays a critical role in controllingstream channel morphology, regulating <strong>the</strong> movement and storage of inorganicand organic material, and in creating and maintaining fish habitat (Hicks et al.1991). Debris removal was common in <strong>the</strong> 1960s and 1970s and often wasencouraged by fisheries biologists to improve fish access to upstream areas.Since <strong>the</strong>n, <strong>the</strong> importance of woody debris in stream channel <strong>for</strong>m andfunction has been recognized. Removal of large woody debris from streamchannels has been shown to affect fish populations adversely. Debris removalcan cause a decline in channel stability and a corresponding reduction in <strong>the</strong>quality and quantity of pools and cover (Hicks et al. 1991).Removal of large trees from riparian zones has caused long-term reduction in<strong>the</strong> recruitment of large woody debris to stream channels, leading to a reductionin <strong>the</strong> quality of fish habitat (Hicks et al. 1991). Murphy and Koski (1989)modeled <strong>the</strong> depletion and input of large woody debris from second-growth<strong>for</strong>ests. Their model indicated that 90 years later, clear-cut logging without abuffer strip would reduce large woody debris by 70 percent, and recovery toprelogging levels would take more than 250 years.The use of buffer strips has been shown to reduce <strong>the</strong> localized effects ofstreamside timber harvest. Murphy et al. (1986) found that streams withbuffer strips did not consistently differ from old-growth streams; streams inclear-cuts without buffer strips had more periphyton, lower channel stability,and less canopy, pool volume, large woody debris, and undercut banks thanstreams in old-growth <strong>for</strong>ests.Summary.-Twenty-eight species comprising over 1,181 fish stocks wereidentified within <strong>the</strong> range of <strong>the</strong> nor<strong>the</strong>rn spotted owl. A total of 766 stocks(Table D. 10) are 1) listed federally as threatened or endangered, 2) candidates<strong>for</strong> federal listing, 3) species of special concern (state), or 4) are considered atrisk by Nehlsen et al. (1991), Moyle et al. (1989), or Williams et al. (1989).These stocks occur in 348 streams throughout <strong>the</strong> Pacific Northwest (Tables373
Table D.10. List of fish stocks of various species and <strong>the</strong> number of stocks at risk.Cali<strong>for</strong>nia Oregon WashingtonNumber of Stocks Number of Stocks Number of StocksSpecies/Stock Total At Risk Total At Risk Total At RiskBigeye marbled sculpinBull troutChum salmonClear Lake hitchCoho salmonFall chinook salmonGualala roachJenny Creek suckerKlamath River lampreyMillicoma daceNavarro roachNooky (Chehalis) daceOlympic mudminnowPink salmonPit roachRedband troutReticulate sculpinRough sculpinRussian River tule perchSacramento splittailSacramento winterchinook salmonSalish suckerSea-run cutthroat troutSockeye salmonSpring chinook salmonSummer chinook salmonSummer steelhead troutTidewater gobyTomales roachUmpqua chubWillamette chubWinter steelhead trout118145511152417211211114515115247212121 210 EXTINCT16 16331416833141231 3141 41114 11454 5413513588 522 140 131 138 83610136531335 1933 1322 2133 3313 138 318 1872 248 232 104 235 1439 30Total288 178528 386 365 202I/11 11 .11,11 , 111.1 .............. ....... I - 11 ........ I., .... 11.11,11.11,374
-Table D.1 1. Cali<strong>for</strong>nia streams (or stream reaches) identified as containingat least one fish stock that is considered to be at risk.\Steelhead Salmon Sea-runTrout Chinook Coho CutthroatBasin Stream Sum Win Spr Sum Fall Trout O<strong>the</strong>ra ReferencesbAlbionRussianKlamathBigKlamathKlamathKlamathKlamathSacramentoKlamathKlamathKlamathClear LakeKlamathKlamathEelKlamathHumboldtRogueHumboldtGarciaKlamathGulalaKlamathKlamathSmithKlamathHumboldtSmithKlamathKlamathRedwoodLaqunitasHumboldtLittleKlamathKlamathKlamathMadHumboldtMattoleSacramentoHumboldtRogueEelSmithKlamathSmithSmithKlamathNapaNavarroKlamathNoyoLaqunitasSacramentoRedwoodSacramentoAlbion RiverAustin CreeklBeaver CreekBig RiverBlue CreekBluff CreekBogus CreekBoise CreekBull CreekCamp CreekCanyon CreekClear CreekClear LakeDillon CreekE.ast ForkIndian CreekEel RiverElk CreekElk RiverElliot CreekFreshwater CreekGarcia RiverGrider CreekGulala RiverHay<strong>for</strong>k CreekHorse Linto CreekHurdygurdy CreekIndian CreekJacoby CreekJones CreekKidder CreekKlamath RiverLacks CreekLaqunitas CreekLittle RiverLittle RiverLittle Shasta RiverLower Klamath RiverLower KlamathTributariesMad RiverMaple CreekMattole RiverMcCloud RiverMcDonald CreekMiddle ForkApplegate RiverMiddle ForkEel RiverMiddle ForkSmith RiverMill CreekMill CreekN. Fork Smith RiverN. ForkTrinity RiverNapa RiverNavarro RiverNew RiverNoyo RiverOlema CreekPit RiverPrairie CreekRacoon CreekXXXXXXXXXXXXXXXXXXXXPPPPPPPPPPPDPPPPDPDPDPPDPDPPDPDPPPxxxxPPPPPPPPDPxPDxxPPDPPxPxPxxxxxxxXxXXXxxxxxXxxxxxxxxxxx16X7X16Xlix4X2,731,3,4,52,3,71,3,41,3,41,343,71,33,4,54543X 3P,16X 2,5,6,74X 1,6,712X 5X 3,6,79X,16X 2,3,5,735X,1 6X 2,3,5,73X 1,3,4x 33,4,5X 3,6,7x 37X 3,5X 2,633X 6,737X 5X 3P,9X 2,5,6,7,Xxx3P,9X,16X3P,16X2X,11X12X6,72,5,6,76,73,41,6,7,P 4,5,6PPPxPPPDPPxxxxPPPxXXXXxxP X X15X8X,16X16X1X,10X,13Xlix563,4364,5,65,62,3,5,73,4,5,62,3,732,3,5,73,63,7continues-375
continued-Steelhead-owipu Sea-runTroutChinook Coho CutthroatBasin Stream Sum Win Spr Sum FallTrout O<strong>the</strong>ra ReferencesbKlamathRedwoodSmithKlamathRussian GulchRussianSmithKlamathSalmonKlamathKlamathKlamathKlamathKlamathSmithSacramentoKlamathKlamathKlamathKlamathSacramentoEelSacramentoEelWalkerSacramentoKlamathRed Cap CreekRedwood CreekRowdy CreekRush CreekRussianGulch CreekRussian RiverXXS. Fork Smith River XS. ForkTrinity River XSalmon CreekSalmon River XScott River XSeiad CreekShasta RiverSmall Tributariesto Hay<strong>for</strong>k CreekSmith River XTate CreekTish Tang Creek XTrinity River XUkonom Creek XUpper Klamath River XUpper McCloud RiverUpper S. ForkEel RiverUpper SacramentoRiverVan Duzen RiverWalker CreekWhisky CreekWooley CreekXPPPPPPPPpPPPPPXPXXXxXxXPXPPxPPPXpXXPpPX X pXXXXXxXXxxXXX4,5X 3P,16X 2,3,5,6,7X 3,6333P,BX,9X,14X,16X 2,3,5,6,7X 1,3,63,4,5,616X 2,73,4,51,637X 5,6,73X 3P,16X 2,3,4,6,7lix 3,73,4X 236X,7X 2,5,6lix 3,7X 3X3P,11 X,1 5X,18X 2,5,6,75,616X,1 7X 2,3,5,7lix 3,74,5,6X = endangered, threatened, candidate, or species of concern on federal or state list or identified at risk by Moyle et al. (1989), Nehlsen etal. (1991), or Williams et al. (1989).P = stock is present in stream.Spr = SpringSum = SummerWin = Winterac<strong>the</strong>r species: 1) bigeye marbled sculpin, 2) bull trout. 3) chum salmon, 4) Clear Lake hitch, 5) Gualala roach, 6) Jenny Creek sucker, 7) KlamathRiver lamprey, 8) Navarro roach, 9) pink salmon, 10) Pit roach, 11) redband trout, 12) reticulate sculpin, 13) rough sculpin, 14) Russian River tuleperch, 15) Sacramento splittail, 16) tidewater goby, 17) Tomales roach, 18) Sacramento River winter chinook salmon.bReferences: 1) Cali<strong>for</strong>nia Department of Fish and Game. 1991 Comments to 26 November 1991 draft of Appendix D. See administrative record.2) Frissell (1991), 3) Gerstung (1991). Cali<strong>for</strong>nia Department of Fish and Game. Correspondence and transcrpts of O<strong>the</strong>rSpecies and EcosystemIssues in <strong>Recovery</strong> <strong>Plan</strong>ning <strong>for</strong> <strong>the</strong> Nor<strong>the</strong>rn <strong>Spotted</strong> <strong>Owl</strong>: technical workshop. Volume 1, August 8, 1991. Portland, Oregon See administrativerecord 4) Johnson et al. (1991); 5) Moyle et al. (1989) 6) Nehlsen et al. (1991) 7) Williams et al (1989).-- .... I I I I I/376
I NTable D.12. Oregon streams (or stream reaches) identified as containing at least onefish stock that is considered to be at risk.Steelhead Salmon Sea-runTrout Chinook Coho CutthroatBasin Stream Sum Win Spr Sum Fall Trout O<strong>the</strong>ra ReferencesbAlseaAlseaMcKenzie R.DeschutesColumbiaColumbiaMid. CoastRogueUmpquaColumbiaMid. CoastRogueSantiamNestuccaUmpquaWillametteUmpquaDeschutesRogueMid CoastIllinoisColumbiaKlamathSouth CoastWillametteColumbiaNorth CoastWillametteRogueSouth CoastUmpquaCoquilleDeschutesMid. CoastMcKenzie R.SalmonDeschutesAlseaSiletzSixesColumbiaNehalemRogueWinchuckSouth CoastSouth CoastSouth CoastKlamathWillametteColumbiaWillametteSouth CoastAlseaRogueUmpquaWillametteColumbiaWillametteRogueSiuslawColumbiaAlsea RiverAlsea estuaryAnderson CreekBadger CreekBear CreekBeaver CreekBeaver CreekBeaver CreekBig Bend CreekBig CreekBig CreekBillings CreekBoulder CreekBoulder CreekBoulder CreekCalapooia RiverCalf CreekCandle CreekCanyon CreekCape CreekCave CreekChenowth CreekCherry CreekChetcoClackamas RiverClatskanie RiverCoal CreekCollawash/HotSprings ForkCollier CreekCoos RiverCopeland CreekCoquille RiverCrooked RiverCummins CreekDeer CreekDeer CreekDeschutes RiverDrift CreekDrift CreekDry CreekEagle CreekEast ForkFoley CreekEast ForkIllinois RiverEast ForkWinchuck RiverElk RiverEmily CreekEuchre CreekEvening CreekFern CreekShady DelFifteen Mile CreekFish CreekFloras CreekFlynn CreekFoster CreekFranklin CreekFrench Pete CreekGnat CreekGrayGrayback CreekGreenleaf CreekHerman CreekXXxXPXX X 2XX X1x5XPxPX xXP X XXXxPxxxxxxP PP PXXXXXxxX PP PXPX XP P P X XPXxxPxxXP P X xX Xx PPxxX X xxXxPxx x xx x pPPxxPPXPPxPPxP2Xlxlxx x PPx x P 2XxX 2X1x2Xix2X2Xxx x2X1x2Xx1xPPx x Px x Px x xx x xx x xxxxxxxxxPx1X,6X2X2X2X1x8X2X1x8Xx x xx3771,33,422333241,32,3,4322,3,42,432443,42321,3,41,2,3342311,32,411,342,3,4241,2,3,42,3,42,32,42,343,441,2,3,42,3,41,3222,321,3432,4434243continues-
continued-BasinHoodWillametteRogueSouth CoastRogueRogueDeschutesS. UmpquaKlamathRogueDeschutesNorth CoastMcKenzie R.ColumbiaRogueColumbiaNestuccaColumbiaRogueWilsonRogueWillametteRogueUmpquaDeschutesWillametteDeschutesMiamiWillametteHoodWillametteColumbiaCoosColumbiaWillametteiColumbiaNecanicumNehalemNestuccaNorth CoastNestuccaRogueTraskSiletzUmpquaTraskUmpquaWillametteDeschutesMcKenzie R.RogueSouth CoastColumbiaNestuccaWillametteRogueDeschutesWillametteMid CoastN. CoastDeschutesSteelheadSalmonSea-runTroutChinook Coho CutthroatStream Sum Win Spr Sum FallTrout O<strong>the</strong>rO Ref erenceSbHood RiverHorse CreekHorse Sign CreekHunter CreekIllinois RiverIndigo CreekJack CreekJackson CreekJenny CreekJim Hunt CreekJordon CreekKilchis RiverKink CreekKlaskanine RiverLawson CreekLewis andClark RiverLimestone CreekLindsey CreekLittleApplegate RiverLittle N. ForkWilson RiverLobster CreekLost CreekScott CreekLower Rogue RiverLower Umpqua RiverMarsh CreekMcKenzie RiverMetolius RiverMiami RiverLowerWillamette RiverMiddle ForkHood RiverMiddle ForkWillamette RiverMill CreekMillicoma RiverMilton CreekMolalla RiverMosier CreekNecanicum RiverNehalem RiverNestucca RiverNetarts BayNiagara CreekN. ForkLobster CreekN. Fork N.Fork Trask RiverN. Fork Siletz RiverN. Fork Smith RiverN. Fork TraskN. Umpqua RiverOak GroveOdell CreekOlallie CreekPalmer CreekPistol RiverPlympton CreekPowder CreekPudding RiverQuosatana CreekRoaring CreekRoaring RiverRock CreekRock CreekRock Creekx x x xPxxxPxxxxxPPPPXPxxxx x ix lxxxxPPPXx xx x Px x x xx PxxxPlx3X5X2Xlx2X2XlxX X X 2XX X 2X,7Xlx1 X,8X1X,6PX X 2XXP P x lxxxxxxPP P PP P PPPPxxPPxxxxxxxxxxxxxxxxxxPP8X1,3331,3,42,3444321,3232,3,41,32,3,4324321,31,321,2,3,41,2,411,31,341X,8X 1,434X 43332X 1,32X 1,3,42X 1,3,42X 32,3,4P4PP4xx2P4x x x 7X 1,2,3,4x lx 2Plx 2x2x x x 2X 1,3x3x P2,3,43xP2,3lx 4P x iX 2,4xx 2X 2,3,4x3,45X 2continues-4378
continued-SteelheadSalmonSea-runTroutChinook Coho CutthroatBasin Stream Sum Win Spr Sum FallTrout O<strong>the</strong>ra ReferencesbColumbiaRogueRogueCoosCoquilleWillametteUmpquaMid CoastSandySalmonNehalemSandyWillametteColumbiaYachatsKlamathRogueSiletzRogueSiuslawSixesSixesUmpquaKlamathSiuslawMcKenzie RColumbiaSouth CoastMid CoastColumbiaNestuccaTillamookTillamookCoosNestuccaDeschutesTraskDeschutesRogueMid. CoastHoodRogueUmpquaColumbiaUmpquaHoodDeschutesWilsonSouth CoastSouth CoastMid CoastRogueYaquinaColumbiaRock CreekRogue RiverRough and ReadyCreekSouth Coos RiverSouth Fork CoquilleRiverSouth Fork McKenzieRiverSouth Umpqua RiverSalmon RiverSalmon RiverSalmon estuarySalmonberry RiverSandy RiverSantiam RiverScappose CreekSchool ForkSeven Mile CreekShasta Costa CreekSiletz RiverSilver CreekSiuslaw RiverSixes RiverSixes estuarySteamboat CreekSun CreekSweet CreekSweetwater CreekTanner CreekTaylor CreekTenmile CreekThree Mile CreekThree RiversTillamook BayTillamook RiverTioga CreekTony CreekTrapper CreekTrask RiverTygh CreekUpper E. ForkIllinois RiverUpper KnowlesUpper MiddleFork Hood RiverPPPPPXXPPUpper Rogue River XUpper S. UmpquaRiverViento CreekWassen CreekW. Fork Hood River PWhite RiverWilson RiverWinchuck RiverWinchuck estuaryYachats RiverYale CreekYaquina RiverYoungs RiverPX 34P X X PP X P 44X4PPxPPxPxPPPxxxPPPPxPXxXPPX X PX PX XXX X XXPX X XXXPX X PX X XXPX XX XX XX XX X XXxxXXXxxP Xx PPPxPxXx xXXXXPXXX XX X XX X XX X XXX X XX X X2iX 2,47X 1,2,3,42X 1,32,43,441,31X,8X 1,32X 34iX 22,3,42X 1,3,42,32X 1,32X 1,32X 3,42,4iX 42iX 22X 322X 2,3,432,32X 32X 1,34X 42,3,4iX 42X 1,35X 21x5X2X2X2X2X2X2441,3,43,432221,31,2,33,41,2,3,421,31,3X = endangered, threatened, candidate, or species of concem on federal or state list or identified by Nehisen et al. (1991), or Williams et al(1989).P = stock is present in stream.Spr = springSum = summerWin = winteraO<strong>the</strong>r species: 1) bull trout, 2) chum salmon, 3) Jenny Creek sucker, 4) Millicoma dace, 5) redband trout, 6) sockeye salmon, 7) Umpqua Oregon chub,8) Willametle Oregon chubbReferences: 1) Frissell (1991), 2) Johnson et al. (1991), 3) NehIsen et al. (1991), 4) Oregon Chapter of <strong>the</strong> American Fisheries Society (1991). Draft:Watershed classification/biodiversity list See Administrative Record..1 "I'll", ..... - . I --- .- I I'll - I ......... 1.1-1- 1 ..........379
Table D.13. Washington streams (or stream reaches) identified as containingat least one fish stock that is considered to be at risk.Steelhead Salmon Sea-runTrout Chinook Coho CutthroatBasin Stream Sum Win Spr Sum Fall Trout O<strong>the</strong>rO ReferenceSbColumbiaColumbiaSkagitQuillayuteColumbiaPuget SoundGraysColumbiaQueetsColumbiaColumbiaQuinaultMid. CoastCoweemanCowlitzColumbiaPuget SoundHood CanalHood CanalHood CanalStrait JDFPuget SoundLewisColumbiaStrait JDFColumbiaColumbiaGraysColumbiaPuget SoundColumbiaColumbiaN. CoastPuget SoundPuget SoundG raysG raysColumbiaColumbiaColumbiaPuget SoundLewisStrait JDFColumbiaHood CanalQuinaultColumbiaColumbiaNooksackPuget SoundNooksackWillapaOzetteOzetteSnohomishPuget SoundN. CoastMid. CoastColumbiaNooksackAbernathy CreekAlder Creek XBaker RiverBogachiel RiverCa<strong>the</strong>rine CreekChambers CreekChehalis RiverChinook RiverClearwater RiverCoal CreekCollins CreekCook CreekCopalis RiverCoweeman RiverCowlitz River PCrooked CreekDeschutes RiverDewatto RiverDosewallips RiverDuckabush RiverDungeness RiverDuwamish-GreenRiversEast Fork Lewis River XElochoman RiverElwha RiverEntiat River XGermany CreekGrays HarborGrays RiverGreen RiverHamilton CreekHardy CreekHoh RiverHood CanalHood CanalTributairiesHoquim RiverHumptulips RiverJim Crow CreekKalama RiverKlickitat River XLake WashingtonLewis River PLyre RiverMajor Creek XMason LakeMcCalla CreekMethow River XMill CreekNorth ForkNooksack River PNisqually RiverNooksack River XNorth RiverOzette LakeOzette RiverPilchuck RiverPuyallup RiverQueets RiverQuinalt RiverRock Creek XSouth ForkNooksack River Pxxxx xxPxxxxxxPxxPxxxxPxPxPXPPPPxxxxx xxxxxxXPPXP2X3X,6X,7X3X2X3X,4X3X,4X2X4XP 3X,4XxX X 2P2XX 3X,6XP2PP2PP P 2PP 2P,5XP2X,3X,6XXXXP2X2X,5X,7Pi P2XxX X 2XxXPxPPx x xPx x xx Pxxx2X2X3X2X3X,4X3X,4X2X1 P,2XP3X,6X,74XP2XP2PP 2X,3X,6Xx P 3X,6XP 3X7Xx P 2XPxxPx 3X,6X2P,3X,6X3X,4X3X,4XP x P 2P331,3331,3333231,331,31,31,31,2,31,2,32,31,31,2,31,2,3331,333313311331,331,2,31,33121,332,311,311,31,311,31,3132,3380continues-
continued-SteelheadSea-runTroutChinook Coho CutthroatBasin Stream Sum Win Spr Sum FallTrout O<strong>the</strong>rO ReferencesbCowlitzWillapaPuget SoundChehalisColumbiaSkagitPuget SoundColumbiaHood CanalChehalisSnohomishPuget SoundSnohomishStillaHood CanalCowlitzPuget SoundColumbiaColumbiaPuyallupColumbiaWillapaWillapaColumbiaChehalisColumbiaChehalisSouth ForkToutle RiverSalmon CreekSamish RiverSatsop RiverScappoose CreekSauk RiverSkagit RiverSkamokawa CreekSkokomish RiverSkookumchuck RiverSkykomish RiverSnohomish RiverSnoqualmie RiverStillagumaish RiverTahuya RiverToutle RiverTulalip RiverWashougal RiverWenatchee RiverWhite RiverWhite Salmon RiverWillapa BayWillapa RiverWind RiverWishkah RiverWoodward CreekWynoochee RiverPPPxxPxxPxxPxxPxxxPxxxPPxPPxPxPxxxxxxPPPPxxPPPxPPXPPPPXPXPXxXXPPPPP2X3X,6X3X,4X1,2,3X,5,6X3X,6X2P2,3X,5X,6X3X,4X1,3X,5,6X3X,6X3X,6X3X,6X2,3X,6X2P2X1 P,7P3X,6X1P3P3X3X,4X3X,4X3311,31,2311,211,311,31,2,311,211,31,31,31,31,3. 31,31,2,31,2,31,2,3311 ,2,3131,2,3X = endangered, threatened, candidate, or species of concern on federal or state list or identified by Nehisen et al. (1991), or Williams et al.(1989).P = stock is present in streamSpr = springSum = summerWin = winteraO<strong>the</strong>r species: 1) bull trout, 2) chum salmon, 3) Nooky dace, 4) Olympic mudminnow, 5) pink salmon, 6) Salish sucker, 7) sockeye salmonbReferences: 1) Frissell, (1991), 2) Johnson et al. (1991), 3) Nehlsen et al (1991).11D. 11, D. 12, and D. 13). These lists include streams with at least one stockidentified at risk. These streams could provide habitat connectivity among owlconservation areas. Streams included on <strong>the</strong>se lists may need special considerationwhen land management activities are planned. If future fisheriesinventories reveal additional streams containing <strong>the</strong>se stocks, <strong>the</strong>se streamsmay need similar considerations. Since data are incomplete on <strong>the</strong> identificationof unique fish stocks across <strong>the</strong> range of <strong>the</strong> spotted owl, each stockshould be considered individually to reduce <strong>the</strong> risk of losing a geneticallydistinct stock.Ecology of O<strong>the</strong>r Priority SpeciesMarbled Murrelet (Brachyramphus marmoratus)Distribution.-The marbled murrelet is a seabird that occurs along <strong>the</strong> PacificCoast from Alaska to central Cali<strong>for</strong>nia throughout <strong>the</strong> year (Marshall 1988).The species nest in coniferous <strong>for</strong>ests within about 50 miles of <strong>the</strong> coast in <strong>the</strong>Northwest and feeds on <strong>the</strong> ocean immediately offshore, inland marine waters(i.e. Puget Sound), and freshwater lakes (Carter and Sealy 1986, 1987). Known381
inland distribution currently decreases north to south, and, to date, <strong>the</strong>maximum distance <strong>the</strong> marbled murrelet has been detected inland is 52 milesin <strong>the</strong> nor<strong>the</strong>rn Washington Cascades (Eric Cummins, USDI, pers. comm.), 35miles in Oregon (Nelson 1990), and 24 miles in Cali<strong>for</strong>nia (Paton and Ralph1988). Inland distribution is now discontinuous in all three states due to lossof nesting habitat (Federal Register 56(119);28363).Status.-In June 1991, <strong>the</strong> FWS proposed <strong>the</strong> species <strong>for</strong> listing as threatenedthroughout its range in Washington, Oregon, and Cali<strong>for</strong>nia, primarily due to<strong>the</strong> loss of nesting habitat (Federal Register 56(119):28363). At <strong>the</strong> state andprovince level, <strong>the</strong> species currently is listed as endangered in Cali<strong>for</strong>nia,sensitive in Oregon and Washington, and threatened in British Columbia.Some legal protection is af<strong>for</strong>ded murrelets in Cali<strong>for</strong>nia on state and privatelands under <strong>the</strong> Cali<strong>for</strong>nia Forest Practices Act, but not in Oregon or Washington.The Cali<strong>for</strong>nia population is considered in danger of extinction becauseonly small isolated poulations and habitat remain, and <strong>the</strong>y may be subject tocatastrophic disturbances. As a result of <strong>the</strong> proposed federal listing of <strong>the</strong>murrelet, <strong>the</strong> Forest Service and BLM are consulting in<strong>for</strong>mally with <strong>the</strong> FWSon timber sales within 0.5 mile of occupied habitat (G. Miller, U.S. Fish andWildlife Service, Portland, Oregon, pers. comm.).Current population estimates are 1,650 to 2,000 and 2,000 individuals <strong>for</strong>Cali<strong>for</strong>nia and Oregon, respectively (Sowls et al. 1980, Carter and Erickson1988, Nelson 1990); and 1,900 to 3,500 breeding pairs in Washington (Speichet al. in press). Rodway (1990) estimated <strong>the</strong> population size as 22,500 inBritish Columbia. Estimates <strong>for</strong> Alaska range from 50,000 to 250,000 individuals(Mendenhall 1988). The significance of <strong>the</strong>se figures can be put incontext with <strong>the</strong> historical estimate of 60,000 individuals in <strong>the</strong> Cali<strong>for</strong>niapopulation prior to logging (Larsen 1991). Ninety-six percent of <strong>the</strong> historicalbreeding habitat in Cali<strong>for</strong>nia is believed to have been eliminated throughlogging (Larsen 1991). Similar patterns of habitat loss have occurred throughout<strong>for</strong>ests of <strong>the</strong> West Coast. Recent estimates suggest a decline of as high as83 to 88 percent of historical old-growth habitat (Spies and Franklin 1988,Morrison 1988, Norse 1990).Natural history and habitat associations.-Throughout <strong>the</strong> species' range,murrelets show a strong dependence on old-growth or mature <strong>for</strong>ests with anold-growth component <strong>for</strong> nesting (Nelson 1990, Carter and Erickson 1988,Ralph et al. 1990, Paton and Ralph 1988, Hamer 1991). <strong>Plan</strong>t communityassociations include redwood and Douglas-fir in Cali<strong>for</strong>nia, and Douglas-fir,western hemlock, western red cedar, and Sitka spruce in Oregon and Washington.Of 23 nests located to date from Alaska to Cali<strong>for</strong>nia, all were in oldgrowthor mature trees. Nest trees (n= 16) averaged 73-inch dbh (range 35 to106 inches) (S.K. Nelson, Oregon State University, Corvallis, pers. comm.).Nests were primarily on large or de<strong>for</strong>med limbs with a moss substrate used<strong>for</strong> nesting. Seventy percent of <strong>the</strong> inland records of downy young and fledglingscompiled by Carter and Sealy (1987) were from old-growth <strong>for</strong>ests and <strong>the</strong>remainder were located near old-growth. Many additional young and eggremnants have since been located in Washington, all in older <strong>for</strong>ests (Cummins1991).In Oregon, Nelson (1990) found that murrelets were most abundant within 12miles of <strong>the</strong> coast and decreased significantly from <strong>the</strong>re inland. From stratifiedrandom surveys in Oregon, <strong>for</strong>est stands occupied by murrelets werelarger than random sites (Nelson 1990). Larger stands of old-growth in Cali<strong>for</strong>niaalso had significantly higher numbers of detections of murrelets thansmaller stands. The average number of detections also increased as <strong>the</strong>number of large trees in <strong>the</strong> stands increased (Paton and Ralph 1988).382
In Oregon, stands occupied by murrelets ranged from 25 acres to more than2,000 acres with a mean of 480 acres. In Cali<strong>for</strong>nia <strong>the</strong> range was 40 to28,000 acres (S.K. Nelson, Oregon State University, Corvallis, pers. comm.).The relationship between stand size and murrelet productivity is unknown, butsmaller stand sizes and greater landscape fragmentation may expose nestingbirds to increased predation. Of 21 nests located, in which <strong>the</strong> nesting outcomewas known, 48 percent were lost to predation (S.K. Nelson, Oregon StateUniversity, Corvallis, pers. comm.).In all three states, <strong>the</strong> remaining habitat is primarily on public lands. InWashington, significant population numbers are located only in <strong>the</strong> NorthCascades and Olympic Peninsula, with remnant pockets of suitable habitatlocated within <strong>the</strong> southwest corner of <strong>the</strong> state just north of <strong>the</strong> ColumbiaRiver. In Oregon, two-thirds of <strong>the</strong> remaining population occurs in <strong>the</strong> centralCoast Range in <strong>the</strong> Siuslaw National Forest and scattered BLM lands. Theremainder is found along <strong>the</strong> southwest coast in <strong>the</strong> Siskiyou National Forest.In Cali<strong>for</strong>nia, <strong>the</strong> current population exists primarily in state or federal parksand private lands along <strong>the</strong> north coast and near Santa Cruz in state parks. InCali<strong>for</strong>nia, an estimated 60,000 acres of old-growth remain in <strong>the</strong>se areas andano<strong>the</strong>r 10,000 acres still exist on private commercial <strong>for</strong>est lands (Larsen1991).Bald Eagle (Hallaeetus leucocephalus)Distribution.-Bald eagles occur throughout <strong>the</strong> North American continentfrom nor<strong>the</strong>rn Alaska and Canada to sou<strong>the</strong>rn United States and Baja Cali<strong>for</strong>nia.Their breeding range includes most of Alaska (except <strong>the</strong> north slope),sou<strong>the</strong>rn Canada, <strong>the</strong> nor<strong>the</strong>rn United States, and parts of <strong>the</strong> east and westcoasts (Stalmaster 1987). Because <strong>the</strong>y migrate south in <strong>the</strong> winter to avoidsevere winters and shortage of food, <strong>the</strong>ir winter distribution is substantiallysouth of <strong>the</strong>ir breeding range. Their winter range includes northwestern andcentral states and <strong>the</strong> Alaskan and Canadian seacoasts, where large concentrationsoccur. Breeding and wintering populations occur along <strong>the</strong> east coast.The largest breeding populations in <strong>the</strong> contiguous United States occur inFlorida, <strong>the</strong> Great Lakes states, Chesapeake Bay, and <strong>the</strong> Pacific Northwest.Wintering populations are much more abundant because of <strong>the</strong> large numberof migrants from Alaska and Canada that come to <strong>the</strong> lower 48 states. Alaskahas a wintering population of 35,000 to 45,000, and Washington has <strong>the</strong>largest winter population in <strong>the</strong> contiguous states (Stalmaster 1987).In <strong>the</strong> Pacific Northwest, <strong>the</strong> largest populations of breeding eagles occur in <strong>the</strong>San Juan Islands, Puget Trough, and Olympic Peninsula of Washington; <strong>the</strong>Klamath Basin and Cascade lakes of Oregon, and Shasta Lake of Cali<strong>for</strong>nia.The largest wintering concentration occurs in <strong>the</strong> Klamath Basin of sou<strong>the</strong>rnOregon and nor<strong>the</strong>rn Cali<strong>for</strong>nia where more than 1,000 eagles have beencounted in one day (R. Opp, Oregon Department Fish and Wildlife ResearchUnit, Corvallis, Oregon, pers. comm.). Ano<strong>the</strong>r large population occurs along<strong>the</strong> Skagit and Nooksack Rivers in northwest Washington.Status-The bald eagle is listed as federally threatened in Washington andOregon and endangered in Cali<strong>for</strong>nia. Breeding populations have been increasingin <strong>the</strong> Pacific Northwest during <strong>the</strong> last 15 years as a result of <strong>the</strong> banningof <strong>the</strong> pesticide DDT (Henny and Anthony 1989), and winter populations haveremained stable or have increased during this time. As of 1990, <strong>the</strong>re wereapproximately 530, 210, and 108 nesting territories in <strong>the</strong> states of Washington,Oregon, and Cali<strong>for</strong>nia, respectively. Of those, approximately 70 percentare on federal lands, and <strong>the</strong> remainder are on state and private lands inOregon and Cali<strong>for</strong>nia. Conversely, about 60 percent of <strong>the</strong> nesting territoriesare on state and private lands in Washington. More than 95 percent of <strong>the</strong>383
nesting territories in <strong>the</strong> three states are within <strong>the</strong> range of <strong>the</strong> nor<strong>the</strong>rnspotted owl. There are 130, 76, and six known communal roosts in Washington,Oregon, and Cali<strong>for</strong>nia, respectively. More than 95 percent of <strong>the</strong> communalroosts also are within <strong>the</strong> range of <strong>the</strong> owl in Washington and Cali<strong>for</strong>nia,whereas less than 10 percent of <strong>the</strong> roosts in Oregon are within <strong>the</strong> range of<strong>the</strong> owl.Natural history and habitat associations.-The bald eagle is <strong>the</strong> only memberof <strong>the</strong> fish-eating eagle group in North America. It is free ranging <strong>for</strong> muchof its life except in sou<strong>the</strong>rn or coastal areas where eagles <strong>for</strong>m resident breedingpopulations throughout <strong>the</strong> year. The bald eagle <strong>for</strong>ages over waterthroughout most of its range and <strong>for</strong> most parts of <strong>the</strong> year, so its prey isderived from non<strong>for</strong>ested habitats. Prey consists primarily of fish during <strong>the</strong>breeding season and waterfowl or carrion during <strong>the</strong> winter (Stalmaster 1987).However, eagles nest and roost communally in <strong>for</strong>ested habitats throughout<strong>the</strong>ir geographic range. Selection of areas <strong>for</strong> nesting and communal roostingis predominantly in coniferous <strong>for</strong>ests that contain some component of older<strong>for</strong>ests, and <strong>the</strong>se areas are considered essential habitat features <strong>for</strong> <strong>the</strong>species (Keister and Anthony 1983, Anthony and Isaacs 1989). The PacificStates Bald Eagle <strong>Recovery</strong> <strong>Plan</strong> (USDI 1986) recognizes <strong>the</strong> importance ofnesting and roosting areas, and it is important to manage <strong>the</strong>se two habitatsproperly, because timber harvest can have an adverse impact on <strong>the</strong>m.Present threats to bald eagle populations include illegal shooting, pesticides,human disturbance of <strong>for</strong>aging and nesting areas, and habitat destruction.The effects of pesticides have decreased since <strong>the</strong> banning of DDT, but <strong>the</strong>re isstill low reproductive success of breeding pairs on <strong>the</strong> lower Columbia River,which is associated with high levels of DDE and PCBs (Garrett et al. 1987).The increase in human populations and amount of leisure time <strong>for</strong> recreationhas resulted in an increase in human-eagle interactions, and human disturbancehas been reported to have effects on nesting (Anthony and Isaacs 1989)and <strong>for</strong>aging populations (McGarigal et al. 1991, Stalmaster 1987:161). Thisthreat may become more important over time. Habitat destruction is a problemprimarily on nonfederal lands where only nest trees and small, surroundingstands of trees are reserved from logging. These nest trees and stands arehighly vulnerable to windthrow and o<strong>the</strong>r natural mortality.Nor<strong>the</strong>rn Goshawk (Accipitergentilis)Distribution.-The nor<strong>the</strong>rn goshawk inhabits coniferous and deciduous<strong>for</strong>ests in temperate and subarctic regions of <strong>the</strong> nor<strong>the</strong>rn hemisphere. InNorth America, goshawks are known to breed as far south as <strong>the</strong> AppalachianMountains in <strong>the</strong> Sou<strong>the</strong>ast and throughout <strong>the</strong> Rocky Mountains into Mexico.In <strong>the</strong> western United States, <strong>the</strong> species nests as far south as <strong>the</strong> SierraNevada Mountains of Cali<strong>for</strong>nia and <strong>the</strong> Kaibab Plateau of nor<strong>the</strong>rn Arizona(Reynolds 1989). The goshawk is an uncommon resident in Cali<strong>for</strong>nia. Nestinggoshawks have been recorded as far south as Tulare County in <strong>the</strong> SierraNevada, and in <strong>the</strong> Coast Range to Mendocino County (Grinnell and Miller1944). Summer sightings of goshawks near Mt. Pinos and in <strong>the</strong> San JacintoMountains suggest that isolated breeding populations may have persisted upto <strong>the</strong> 1970s.In Oregon, nesting goshawks have been located in <strong>the</strong> Cascade, Klamath,Ochoco, and Blue Mountains, and smaller ranges in eastern Oregon. Althoughgoshawks are not known to nest in <strong>the</strong> central or nor<strong>the</strong>rn portions of <strong>the</strong>Oregon Coast Range, nests have been located in <strong>the</strong> Siskiyou Mountains insouthwestern Oregon (Marshall 1991). Goshawks breed in all of Washington's<strong>for</strong>ested montane areas, including <strong>the</strong> Olympic Peninsula, <strong>the</strong> entire Cascade384
Range, <strong>the</strong> Blue and Okanogan Mountains, and <strong>the</strong> Selkirk Mountains(Fleming 1987).Status.-Goshawks historically nested throughout <strong>the</strong> <strong>for</strong>ested regions oftemperate North America. By <strong>the</strong> 1930s however, breeding populations in <strong>the</strong>eastern United States were much reduced (Bent 1937). The status of <strong>the</strong>goshawk is not well known <strong>for</strong> much of <strong>the</strong> western United States. Mostauthors believe that <strong>the</strong> species has declined substantially since <strong>the</strong> turn of <strong>the</strong>century, primarily as a result of habitat loss attributed to intensive timberharvest. Bloom et al. (1985) estimated that goshawk populations in Cali<strong>for</strong>niahad decreased by 30 percent from historic levels by 1985, with continuingdeclines of approximately 1 percent per year. Mannan and Meslow (1984)speculated that goshawks could be extirpated from nor<strong>the</strong>astern Oregon<strong>for</strong>ests under timber management regimes that resulted in <strong>the</strong> liquidation ofmost of <strong>the</strong> old-growth <strong>for</strong>est in <strong>the</strong> area. Patla (1991) documented an 80percent decrease in occupancy rates <strong>for</strong> goshawks in habitat adjacent to timbersales, despite <strong>the</strong> establishment of buffers around <strong>the</strong> immediate nest sites.Buffers apparently were unsuccessful in Arizona as well, as Crocker-Bed<strong>for</strong>d(1990) suggested declines of as much as 90 percent in nest occupancy andproductivity <strong>for</strong> an isolated population in nor<strong>the</strong>rn Arizona.The goshawk is classified as "critical" on <strong>the</strong> Oregon sensitive species list."Critical" indicates a species <strong>for</strong> which listing is pending or <strong>for</strong> which listingmay be appropriate if immediate conservation actions are not taken (OregonDepartment Fish and Wildlife 199 lb). The states of Washington and Cali<strong>for</strong>niaalso list <strong>the</strong> nor<strong>the</strong>rn goshawk as a candidate <strong>for</strong> state listing and a sensitivespecies, respectively (Washington Department Wildlife 199 lb, Cali<strong>for</strong>nia Fishand Game 1990). In July 1991, a petition was filed with <strong>the</strong> FWS <strong>for</strong> emergencylisting of an isolated population of goshawks in <strong>the</strong> southwestern UnitedStates. More recently, <strong>the</strong> species has been petitioned <strong>for</strong> listing throughout<strong>the</strong> western United States. The goshawk is a management indicator species <strong>for</strong>old-growth dependent species on <strong>the</strong> Deschutes, Fremont, Wallowa-Whitman,and Winema National Forests in Oregon, and <strong>the</strong> Inyo, Klamath, Six Rivers,and Shasta-Trinity National Forests in Cali<strong>for</strong>nia.Natural history and habitat associations.-Goshawks may be found indeciduous and coniferous <strong>for</strong>est types, where <strong>the</strong>y typically select nest sites indense, single-storied mature to old-growth <strong>for</strong>ests with high canopy closureand poorly developed understories. Nest trees tend to be significantly larger indiameter than those of <strong>the</strong> surrounding stand: nest stands, in turn, often aremore dense and include larger diameter stems than adjacent <strong>for</strong>est stands(Buchanan 1991, Fleming 1987). Snags, stumps, and down logs are importantas plucking perches, which are generally located within 55 yards of <strong>the</strong> nest.This general characterization holds <strong>for</strong> goshawk nests from <strong>the</strong> OlympicPeninsula (Fleming 1987), south to Cali<strong>for</strong>nia and nor<strong>the</strong>rn Arizona (Austin1989, Reynolds 1989, Hall 1984), and east into <strong>the</strong> nor<strong>the</strong>rn Rockies (Haywardetal. 1990).Ongoing research and decades of nest records and incidental sightings indicatethat goshawks in western North America find optimal habitat in mature andold-growth coniferous <strong>for</strong>ests. The vertical and horizontal structure of older<strong>for</strong>ests contributes to accessible prey and nest sites (trees) substantial enoughto support <strong>the</strong> bulky stick nest. The strength of <strong>the</strong> association may vary. InOregon, all but one of 74 nests located by Reynolds were situated in densemature or old-growth stands (Reynolds and Wight 1978). Loss of breeding andwintering habitat resulting from harvest of old-growth, reproductive failure,and human disturbance were <strong>the</strong> primary limiting factors <strong>for</strong> goshawks(Reynolds 1989). The liquidation of older <strong>for</strong>ests and increasing fragmentationof suitable habitat are probably <strong>the</strong> most significant threats to goshawks.385
However, little is known about <strong>the</strong> ecology of <strong>the</strong> species in western Oregonand Washington.Gray Wolf (Canis lupus)Distribution.-Wolves <strong>for</strong>merly occurred throughout <strong>the</strong> Nor<strong>the</strong>rn Hemisphereabove 20 degrees north latitude in all habitats except deserts. Now <strong>the</strong>y arerestricted to <strong>the</strong> nor<strong>the</strong>rn portions of North America (primarily Alaska, Canada,and states bordering Canada), eastern Europe, <strong>the</strong> Soviet Union, China, andnor<strong>the</strong>rn India. Remnant populations occur in western Europe andScandinavia and some may remain in Mexico (Mech 1974). Historically, wolvesranged over all of Washington, Oregon, and Cali<strong>for</strong>nia. The wolf was extirpatedfrom Washington by <strong>the</strong> early 1900s and current sightings suggest it hasreestablished itself in <strong>the</strong> mountainous areas of nor<strong>the</strong>rn Washington (Hansen1986).Status.-The gray wolf is listed as endangered under federal and WashingtonState Law. It is extirpated in Oregon and Cali<strong>for</strong>nia. Three breeding occurrences(dens) of gray wolves were documented in <strong>the</strong> North Cascades of Washingtonduring <strong>the</strong> spring and summer of 1990. Wolf pups and adults wereseen or heard in <strong>the</strong> North Cascades National Park Service Complex, in <strong>the</strong>Okanogan National Forest, and in <strong>the</strong> Wenatchee National Forest. Two of <strong>the</strong>breeding observations of wolves are near spotted owl habitat conservationareas as proposed by Thomas et al. (1990). These breeding occurrences andreports of individual wolves in <strong>the</strong> Cascades, Okanogan Highlands, and SelkirkMountains likely indicate a sou<strong>the</strong>rn range extension of gray wolf populationsfrom British Columbia.Natural history and habitat associations.-Forested and open habitatssupporting ungulate populations are <strong>the</strong> primary requirements of <strong>the</strong> graywolf. Areas that support small mammal populations may be seasonallyimportant <strong>for</strong> wolves. Gray wolf populations are typically organized into socialpacks of two to 20 individuals. Each pack usually comprises a mated pair and<strong>the</strong>ir offspring from several generations. Since each pack consists of severalanimals, habitat management must consider <strong>the</strong> food requirements of a largenumber of wolves, ra<strong>the</strong>r than isolated individuals. Wolf pack territories mayrange in size from 40 to 1,000 square miles. These territories must provideadequate year-round prey (ungulates and small mammals) and secure densites <strong>for</strong> birth and rearing pups. Dens usually are located in a slightly elevatedarea of soft soil that provides a dry, easily-excavated site. Denning sites oftenreceive traditional use and usually are secluded, but occasionally are locatednear human activity. Rendezvous sites are used <strong>for</strong> raising pups and arelocated within 1 to 5 miles of <strong>the</strong> den in an open area near water. Wolves areparticularly sensitive to human activity near den and rendezvous sites (USDI1987).Human-induced mortality is <strong>the</strong> major limiting factor affecting <strong>the</strong> survival of<strong>the</strong> gray wolf over most of its range. Wolf predation on livestock can causeconflicts with humans, and misconceptions about wolves often lead to indiscriminateshooting. In <strong>the</strong> absence of human-induced mortality, year-roundprey availability is <strong>the</strong> most significant limiting factor affecting <strong>the</strong> survival ofindividual wolves, packs, and local wolf populations (USDI 1987). Althoughwolves are not particularly associated with older <strong>for</strong>ests, <strong>the</strong>y may benefit fromDCAs if <strong>the</strong>y remain roadless and free from human disturbance.386
Grizzly Bear (Ursus arctos)Distribution.-The historic range of <strong>the</strong> grizzly bear included western NorthAmerica, roughly from <strong>the</strong> Mississippi River and Canadian Great Plains west to<strong>the</strong> Pacific Ocean and from Alaska and <strong>the</strong> Northwest Territories south tocentral Mexico. The current range is from <strong>the</strong> Rocky Mountain east front inCanada, Montana, and Wyoming to <strong>the</strong> Pacific Ocean and from Alaska and <strong>the</strong>Northwest Territories south to portions of Washington, Idaho, Montana,Wyoming, and perhaps Colorado. Current grizzly bear range is less than 2percent of <strong>the</strong> historic range in <strong>the</strong> lower 48 States, and populations numberless than 1,000 (USDI 1990). Although <strong>the</strong> north Cascades and SelkirkMountains are recognized as grizzly bear ecosystems in <strong>the</strong> Grizzly Bear<strong>Recovery</strong> <strong>Plan</strong>, bears may occur in <strong>the</strong> Okanogan Highlands and Kettle Rangeas well (J.A. Almack, Washington Department Wildlife, Olympia, pers. comm.).The remote areas occupied by grizzly bears are primarily on federal lands. TheSelkirk ecosystem is designated as a recovery area and <strong>the</strong> north Cascades isbeing evaluated to determine if it is capable of supporting a viable population ofgrizzly bears. In one 5-year study, four sets of confirmed grizzly bear trackswere found in <strong>the</strong> north Cascades of Washington. One grizzly bear skull and afood cache also were found. Washington Department of Wildlife biologistsevaluated a total of 128 reports of grizzly bear observations in <strong>the</strong> north Cascades.These observations, combined with o<strong>the</strong>r incidental sightings, indicatethat <strong>the</strong>re is a small, resident population of grizzly bears in <strong>the</strong> north Cascades.A technical review team will determine <strong>the</strong> capability of <strong>the</strong> northCascades to support a viable population of grizzly bears and <strong>the</strong> FWS willdecide whe<strong>the</strong>r to designate this area as a recovery zone (Washington Departmentof Wildlife 1990).Status.-The grizzly bear is federally listed as threatened and state listed asendangered in Washington. It is extirpated in Oregon and Cali<strong>for</strong>nia. Apetition was submitted to <strong>the</strong> FWS in 1990 to have <strong>the</strong> grizzly bear in <strong>the</strong> northCascades listed as an endangered, ra<strong>the</strong>r than a threatened species. The FWSfound <strong>the</strong> petition was substantive and undertook a review of <strong>the</strong> bear's status;a final finding on <strong>the</strong> petition has not been made.Natural History and Habitat Associations.-Grizzly bears remain only invast, diverse, and remote mountainous habitat. They require a variety ofvegetation types <strong>for</strong> food and <strong>for</strong> breeding, bedding, and denning activities.These habitats include open areas such as lowland wet meadows and marshes,shrub fields located in avalanche chutes, high elevation sedge or heath meadows,and stream floodplains. Forest cover is used <strong>for</strong> resting and hiding cover.The importance of <strong>the</strong>se habitats to bears varies during <strong>the</strong> year, and often isdetermined by <strong>the</strong> availability of seasonally important foods. <strong>Plan</strong>t materials,including succulent grasses, sedges, <strong>for</strong>bs, and fruits; fish; and large mammalsare major components of <strong>the</strong> diet. Carrion, insects, and small mammals suchas ground squirrels also are consumed. Grizzly bears usually prepare winterdens in excavated chambers or natural caves located above 5,000 feet onslopes with deep snow. Den sites must have well-drained, soil, and must beisolated from humans and o<strong>the</strong>r animals (Almack 1985).Human-induced mortality is <strong>the</strong> major limiting factor restricting grizzly bearpopulations south of Canada. Availability of seasonally important habitatsmay be critical to <strong>the</strong> survival of specific grizzly bear populations. Grizzly bearsrequire large tracts of suitable habitat that are managed to minimize conflictswith humans (USDI 1990). Grizzly bears, like wolves, are not dependent onold-growth <strong>for</strong>ests, but <strong>the</strong>y may benefit from DCAs that remain roadless andfree from human disturbance.387
Fisher (Martes penncmti)Distribution.-The range of <strong>the</strong> fisher (a small mammalian carnivore) extendssouth from <strong>the</strong> <strong>for</strong>ests of central and sou<strong>the</strong>astern Canada to New Englandand <strong>the</strong> Great Lakes states in <strong>the</strong> east and from British Columbia to westernMontana and <strong>the</strong> Sierra Nevada mountains of Cali<strong>for</strong>nia in <strong>the</strong> west (Arthur etal. 1989, Strickland et al. 1982). Prior to European settlement, <strong>the</strong> fisheroccupied all densely <strong>for</strong>ested areas of Washington, with <strong>the</strong> most dense populationslocated on <strong>the</strong> Olympic Peninsula (K. Aubry, U.S. Forest Service,Olympia, Washington, pers. comm. 1991). Although rare, <strong>the</strong> fisher stilloccurs in <strong>the</strong> Cascades, Okanogan Highlands, and <strong>the</strong> Olympic Peninsula (K.Aubry, U.S. Forest Service, Olympia, Washington, pers. comm. 1991). At onetime, <strong>the</strong> fisher probably was present in all Oregon counties where coniferous<strong>for</strong>ests occurred. Today, <strong>the</strong> species is known to inhabit <strong>for</strong>ested portions of<strong>the</strong> Cascade, Klamath, Siskiyou, and Blue Mountains (Marshall 1991). Thereare few recent reports from <strong>the</strong> Coast Range, although a fisher sighting wasreported from <strong>the</strong> Hebo Ranger District, Lincoln County in 1991. The range of<strong>the</strong> fisher in Cali<strong>for</strong>nia extends from <strong>the</strong> Oregon border in <strong>the</strong> northwest southto Lake and Sonoma Counties. To <strong>the</strong> east, <strong>the</strong> species has been found nearClear Lake in Lassen County, and as far south as Greenhorn Mountain, KernCounty. Fishers range from near sea level in <strong>the</strong> low coastal areas to above11,000 feet in <strong>the</strong> Sierra Nevada (Cali<strong>for</strong>nia Department Fish and Game 1986).Status.- A petition was filed with <strong>the</strong> U.S. Fish and Wildlife Service in 1990 tolist <strong>the</strong> fisher as a threatened species in Cali<strong>for</strong>nia, Oregon, and Washington.The petition was denied, based on <strong>the</strong> inconclusive nature of <strong>the</strong> in<strong>for</strong>mation itprovided. An interagency working group subsequently was <strong>for</strong>med to facilitatesharing on new in<strong>for</strong>mation of fishers and <strong>the</strong> FWS included <strong>the</strong> fisher amongits candidate species in 1991. During <strong>the</strong> last decade, sightings of fishershave been recorded in Mt. Rainier, Olympic, and North Cascades NationalParks in Washington, but no <strong>for</strong>mal surveys were conducted. Ongoing investigationsin Olympic National Park indicate that <strong>the</strong> fisher may have beenextirpated from <strong>the</strong> Olympic Peninsula as a result of extensive habitat alteration(K. Aubry, U.S. Forest Service, Olympia, Washington, pers. comm. 1991).The fisher is a "candidate" species <strong>for</strong> listing as threatened or endangered inWashington.Trapping and incidental loss caused by nontarget strychnine poisoning (fromwolf and coyote baits) resulted in declines in Oregon fisher populations by <strong>the</strong>1930s (Irwin 1987). Trapping <strong>for</strong> fishers has been prohibited in Oregon since1937, but after more than 50 years, populations do not seem to have recovered(Marshall 1991). In 1961, 24 fishers were transplanted from British Columbiato Klamath and Union Counties. No post-release monitoring was conducted,and <strong>the</strong> status of any resulting fisher population is unknown (Marshall 1991).Incidental sightings in <strong>the</strong> Cascade, Siskiyou, and Coast Range Mountainscontinue to be reported, but no standardized surveys have been undertaken toassess population status at <strong>the</strong> state level (Marshall 1991). The fisher is listedas a sensitive species in Oregon and Cali<strong>for</strong>nia. Schempf and White (1977)suggested that fishers were relatively common in <strong>the</strong> nor<strong>the</strong>rn coastal mountainsof Cali<strong>for</strong>nia, but were uncommon or rare in <strong>the</strong> Sierra Nevada.Natural history and habitat associations.-Fishers inhabit coniferous andmixed coniferous/deciduous <strong>for</strong>ests. Dense, mature to old-growth <strong>for</strong>ests arepreferred during summer <strong>for</strong> cover and den sites (Jones 1991, Marshall 1991,Washington Department Wildlife 199 lb). In Idaho, stands used by fishersduring <strong>the</strong> breeding season had more snags, logs, and large-diameter treesrelative to all available habitat. Stands of pole-sized or smaller trees wereavoided, as were open, drier habitats. Jones (1991) reported a preference <strong>for</strong>388
<strong>for</strong>ested riparian habitats. Fishers in Cali<strong>for</strong>nia selected coniferous <strong>for</strong>estswith a hardwood component <strong>for</strong> summer habitat (Marshall 1991).Several authors suggest that fishers select habitats with a high degree ofoverhead cover and avoid large openings (Strickland et al. 1982, Marshall1991). In Maine, where population densities are quite high in comparison topopulations in <strong>the</strong> western states, fishers are tolerant of low-density ruraldevelopment and will cross roads and farm fields to travel among <strong>for</strong>estedstands. Summer resting sites may be situated in hollow snags, under logs,brush piles, or root wads. Maternal dens usually are situated high in a hollowsnag.Fishers may use a wider variety of habitats during winter than in summer.Forest structure and prey availability are probably <strong>the</strong> critical factors in <strong>the</strong>selection of winter habitat. Jones (1991) found that old-growth stands wereimportant winter habitats <strong>for</strong> fishers in Idaho, but second-growth stands alsowere used. Fishers select stands with large remnant trees and/or logs thathave survived earlier fires in second-growth. Fishers appeared to select <strong>for</strong>estedriparian areas in winter as well as in summer. Allen (1983) concludedthat stands having a high degree of coniferous tree canopy closure providedoptimal winter habitat. Jones (1991) found no indication that snow conditionsinfluenced winter habitat use by fishers; o<strong>the</strong>r authors suggest that fishersmay move to lower elevations to avoid deep snow or to find prey (Marshall1991).Small to medium-sized mammals, birds, and carrion dominate <strong>the</strong> diet of <strong>the</strong>fisher; however vegetation, molluscs, and o<strong>the</strong>r invertebrates also have beenidentified from digestive tracts (Jones 1991, Arthur et al. 1989). Porcupinesare a major prey species wherever <strong>the</strong>y occur within <strong>the</strong> range of <strong>the</strong> fisher(Strickland et al. 1982). Red-backed voles and flying squirrels are importantprey <strong>for</strong> <strong>the</strong> fisher in Idaho and Oregon (Ingram 1973). Grenfell and Fasenfest(1979) found false truffles (Rhizopogon) to be an important food of fishers innor<strong>the</strong>rn Cali<strong>for</strong>nia. Fishers may be common locally in parts of nor<strong>the</strong>rnCali<strong>for</strong>nia and Maine (Cali<strong>for</strong>nia Fish and Game 1986, Arthur 1987); o<strong>the</strong>rwise<strong>the</strong> species occurs at low densities.Most authors concur that mature and old-growth <strong>for</strong>ests are important habitats<strong>for</strong> fishers. While some believe fishers require large contiguous stands ofold-growth (Marshall 1991, Washington Department Wildlife 199 lb), o<strong>the</strong>rsemphasize an apparent selection <strong>for</strong> habitat diversity within <strong>the</strong> home range(Strickland et al. 1982). Given <strong>the</strong> large home ranges of fishers, <strong>the</strong>se twoviews may not be contradictory.Marten Martes arnericana)Distribution.-The marten (a small mammalian carnivore) inhabits <strong>the</strong> boreal<strong>for</strong>ests of North America from Canada and Alaska south to Cali<strong>for</strong>nia, Idaho,western Montana, Colorado, Utah, and New Mexico in <strong>the</strong> west, and <strong>the</strong> GreatLakes states and nor<strong>the</strong>rn New England in <strong>the</strong> east. Historically, <strong>the</strong> specieswas common throughout <strong>the</strong> nor<strong>the</strong>astern United States and most of Canada.Loss of habitat compounded by commercial trapping resulted in <strong>the</strong> extirpationof martens from most of New England and portions of sou<strong>the</strong>astern Canada by<strong>the</strong> 1930s (Clark et al. 1987, deVos 1964).Martens have been recorded from most of <strong>the</strong> mountainous areas of Washingtonincluding <strong>the</strong> Blue, Cascade, Olympic and Selkirk Mountains, <strong>the</strong>Okanogan Highlands, <strong>the</strong> coastal ranges and Vancouver Island. Populationsare most dense in <strong>the</strong> Cascades, Selkirks, and Okanogan Highlands (WashingtonDepartment Wildlife 199 lb). All of <strong>the</strong> major mountain ranges in Oregon389
at one time supported marten populations. The species now occurs primarilyin <strong>the</strong> Cascade, Siskiyou, Wallowa, and Blue Mountains; a few recent recordsalso exist <strong>for</strong> <strong>the</strong> Coast Range and <strong>the</strong> Fremont National Forest in sou<strong>the</strong>asternOregon (Marshall 1991). Martes americana hwrboldtensts occurs in <strong>the</strong>coastal coniferous <strong>for</strong>ests of Cali<strong>for</strong>nia from Sonoma County north into southwesternOregon, where it inhabits areas from sea level to more than 4,000 feetin elevation (Grinnell et al. 1937).Status.-In Washington and Oregon, martens are trapped commerciallydespite <strong>the</strong>ir status as sensitive species. Designation as a "priority species" inWashington is aimed at providing guidance <strong>for</strong> habitat retention and enhancement(Washington Department of Wildlife 199 lb). Marshall (1991) speculatedthat <strong>the</strong> marten in Oregon has declined in numbers in <strong>the</strong> Coast Range, andviable populations no longer may exist <strong>the</strong>re. Martens probably are mostabundant in Oregon in <strong>the</strong> central and sou<strong>the</strong>rn Cascades and in <strong>the</strong> BlueMountains. The M.a. hurmboldtensis subspecies is listed as sensitive in Cali<strong>for</strong>nia.Here, as in o<strong>the</strong>r parts of its range, <strong>the</strong> marten may be vulnerable to overtrapping(Clark et al. 1987).Natural history and habitat associations.-The marten is a managementindicator species <strong>for</strong> old-growth habitats in several national <strong>for</strong>ests in Cali<strong>for</strong>niaand most national <strong>for</strong>ests in Oregon and Washington. Martens are knownto use a variety of coniferous <strong>for</strong>est types, and optimal habitat appears to bemoist subalpine fir communities more than 100 years old (Koehler et al. 1975).In <strong>the</strong> Pacific Northwest, martens select dense, mature or old-growth coniferous<strong>for</strong>ests having abundant standing snags and down woody debris (Buskirk1984, Irwin 1987, Hargis and McCullough 1984, Spencer 1981). Martensapparently avoid large open areas within <strong>the</strong>ir territories. Hargis (1981) notedthat martens would cross but not hunt in small openings during winter, whilein nor<strong>the</strong>rn Cali<strong>for</strong>nia, martens avoided open areas during all seasons, rarelyventuring more than 10 yards into open meadows (Spencer 1981, Spencer etal. 1983). Martens may avoid openings during winter if a combination of deepsnow and lack of exposed logs and stumps deny access to prey beneath <strong>the</strong>snow (Hargis and McCullough 1984, Koehler et al. 1975). Avoidance of openingsalso may be a defense against aerial predators such as golden eagles andgreat horned owls (Raine 1982, Hargis and McCullough 1984).Hargis (1981), Spencer (1981), and Jones and Raphael (1991) have documented<strong>the</strong> marten's affinity <strong>for</strong> riparian habitats, which are important <strong>for</strong> <strong>the</strong>irabundant food and dense cover. In Cali<strong>for</strong>nia, Spencer (1981) found riparianareas were used heavily <strong>for</strong> <strong>for</strong>aging, while Jones and Raphael (1991) reportedmore resting sites in streamside than in upland plant communities in Washington.Summer resting sites have been located in live trees, standing snags,slash piles, and hollow logs. Where <strong>the</strong>se components are limited, rock slidesor <strong>the</strong> tree canopy may suffice (Irwin 1987, Jones and Raphael 1991). Largeold trees, snags, and large hollow logs are also important as denning sites.Down woody material, an important component of marten habitat, is especiallycritical in winter <strong>for</strong> energy conservation and access to prey. In <strong>the</strong> centralRocky Mountains, Buskirk et al. (1989) found that martens selected partiallydecayed stumps and logs as resting sites. They suggested that decomposingwood provided much more effective insulation than snow, allowing martens toconserve energy. Because martens do not hibernate or store large amounts offat be<strong>for</strong>e <strong>the</strong> onset of winter (Washington Department of Wildlife 199 lb),maintenance of a positive energy balance is critical to overwinter survival.Stumps, logs, tree wells, and slash piles also provide access to prey undersnow cover. Although martens are capable of digging through snow to captureprey, use of woody debris to reach prey is probably energetically less costly(Hargis and McCullough 1984).390
AmphibiansHome range size of martens varies with population density, food abundanceand sex (Buskirk et al. 1989, Clark et al. 1987). Martens are opportunistic<strong>for</strong>agers that will feed on a wide variety of small mammals, birds, reptiles,invertebrates, and plants depending on availability. In Oregon, red-backedvoles, flying squirrels, and Douglas' squirrels are important winter prey (Irwin1987, Marshall 1991). Fruits, insects, and birds, mostly absent from <strong>the</strong>winter diet, may comprise a significant proportion of <strong>the</strong> summer diet (Irwin1987). The close association of martens with mature and old-growth coniferous<strong>for</strong>ests has been confirmed in numerous investigations (Irwin 1987, Jonesand Raphael 1991, Hargis 1981, Koehler et al. 1975). High canopy closure andabundant coarse woody debris are <strong>the</strong> two most important components ofmarten habitat provided by old-growth <strong>for</strong>ests. Forest cover and large woodydebris are critical in winter, when <strong>the</strong>y provide cover from predators andinsulation from harsh winter conditions. Loss of habitat and timber harvestare <strong>the</strong> primary limiting factors <strong>for</strong> marten populations in <strong>the</strong> Pacific Northwest(Irwin 1987, Marshall 1991, Washington Department of Wildlife 199 lb). Clearcuttingand stand-replacing fires significantly have reduced <strong>the</strong> amount ofmature and old-growth habitat available. Over-harvesting by commercialtrapping is a major concern <strong>for</strong> martens in Cali<strong>for</strong>nia (Grinnell et al. 1937, G.Gould, Klamath National Forest, Cali<strong>for</strong>nia, pers. comm.) and also may be aproblem in Washington, where martens are concurrently listed as "game" andas 'sensitive." Marten trapping continues in Oregon, but to a limited degree(Irwin 1987).The committee solicited an account of <strong>the</strong> ecology of amphibians and reptiles(Beatty et al. 1991) in <strong>the</strong> course of its examination of o<strong>the</strong>r species. Thefollowing treatment is extracted from that report.Twenty-three species or species groups of amphibians and reptiles wereidentified whose ranges overlap with <strong>the</strong> distribution of <strong>the</strong> nor<strong>the</strong>rn spottedowl and whose ecological requirements appear to be linked with <strong>the</strong> remainingdistribution of older <strong>for</strong>est ecosystems in <strong>the</strong> Pacific Northwest. These speciesrepresent approximately 40 percent of <strong>the</strong> extant amphibians and reptiles in<strong>the</strong> region (Nussbaum et al. 1983, Stebbins 1985). Within this group ofanimals, eight were designated as priority species by <strong>the</strong> committee. They are<strong>the</strong> Olympic salamander (four species), <strong>the</strong> Oregon slender salamander, Pacificgiant salamander, Cope's giant salamander, Del Nortesalamander, <strong>the</strong> LarchMountain salamander, <strong>the</strong> Siskiyou Mountain salamander, and <strong>the</strong> tailed frog.The reasons <strong>for</strong> selecting <strong>the</strong>se animals as a subset of <strong>the</strong> 23 species or speciesgroups center on at least two characteristics <strong>the</strong>y share. One is <strong>the</strong>ir relativelylimited distribution. (Figures D.2 - D.4) The o<strong>the</strong>r is with <strong>the</strong>ir apparentlynarrow ecological requirements in comparison with close relatives. Distributionsare fairly well worked out <strong>for</strong> most of <strong>the</strong>se animals, but more field workmay reveal new populations in what most herpetologists would consider novelhabitats. Examples of this finding include <strong>the</strong> discovery of Larch Mountainsalamanders in <strong>the</strong> central Cascades of Washington (Aubry et al. 1987) and <strong>the</strong>Oregon slender salamander east of <strong>the</strong> Cascade crest (Kirk and Forbes 1991).A related point is that not much is known about <strong>the</strong> precise ecological requirementsof many of <strong>the</strong>se species. Research indicates that amphibian populationsmay be a significant component, and may play an important functionalrole in ecosystems, especially with respect to energy flow through <strong>the</strong> systems.One of <strong>the</strong> important characteristics of <strong>the</strong>se animals' biology is <strong>the</strong> geneticstructure of <strong>the</strong>ir populations. Evidence indicates that, at least <strong>for</strong> salamanders,<strong>the</strong>re is considerable genetic differentiation among populations(Wake and Yanev 1986; Good 1989). The results of <strong>the</strong>se studies indicate that391
each population of <strong>the</strong>se animals is genetically unique and that when onepopulation is extirpated, a portion of <strong>the</strong> genetic diversity within <strong>the</strong> species inquestion is lost and probably is not recoverable. This in<strong>for</strong>mation, coupledwith <strong>the</strong> concerns raised by Blaustein and Wake (1990) with respect to recentglobal declines in many amphibian populations, calls <strong>for</strong> careful considerationof <strong>the</strong> impacts of management practices on populations of <strong>the</strong>se animals.Del Norte Salamander (Plethodon elongatus)Distribution and habitat.-The Del Norte salamander occurs in humid coastal<strong>for</strong>ests from near Port Or<strong>for</strong>d, Curry County and Powers, Coos County, Oregon,to near Orick, Humboldt County, Cali<strong>for</strong>nia, and inland to near Salyer, TrinityCounty, and Seiad Valley, Siskiyou County, Cali<strong>for</strong>nia, from sea level to around3,900 feet (1,200 meters) (Stebbins 1985). It is often found in rock rubble ofold riverbeds, road fills, outcrops, and moss-covered talus. It generally occursin drier situations than <strong>the</strong> Dunn's salamander. Stebbins (1985) andHerrington (1988) found that <strong>the</strong> Del Norte salamander occurred almostentirely in <strong>for</strong>ested talus areas. Using time-constrained search methods,Raphael (1988) found <strong>the</strong> species present in all six of his <strong>for</strong>est seral stages butmost abundant in mature and old-growth timber. Abundance seemed correlatedwith a hardwood understory. Welsh and Lind (1988) found this speciesto have a higher abundance in older <strong>for</strong>est stands and a lower relative abundanceon drier stands. Welsh (1990) considered <strong>the</strong> Del Norte salamander(along with <strong>the</strong> Olympic salamander and <strong>the</strong> tailed frog) to be a species longassociated with elements of <strong>the</strong> arcto-tertiary <strong>for</strong>est.Ecology and management.-Welsh (1990) stated that <strong>the</strong> close association of<strong>the</strong> Del Norte salamander with old-growth <strong>for</strong>ests probably is due to <strong>the</strong>presence of microhabitat and microclimate factors that occur <strong>the</strong>re, and that<strong>the</strong> species has evolved with habitats existing only in <strong>the</strong>se <strong>for</strong>ests. Thespecies retreats to deeper crevices in talus during hot, dry, or cold periods, butmay occur under surface objects during warm, wet wea<strong>the</strong>r (J. Beatty, OregonState University, Corvallis, pers. obser). The Del Norte salamander has a fairlylimited distribution in southwestern Oregon and northwestern Cali<strong>for</strong>nia.Within its range, it most often occurs in moist (not wet) situations, usuallyassociated with talus or outcrops in older <strong>for</strong>ests. Raphael (1988) has estimatedthat removal of old-growth fir <strong>for</strong>est within its range would result in a 75percent population reduction. Because of its restricted range and associationwith older <strong>for</strong>ests, no timber harvest should be considered in conservationareas where this species occurs.Siskiyou Mountain Salamander (Plethodon stormi)Distribution and habitat.-The Siskiyou Mountain salamander occurs inJackson County, Oregon, and nor<strong>the</strong>rn Siskiyou County, Cali<strong>for</strong>nia. It is notsympatric with any o<strong>the</strong>r Plethodon, but occurs within 9 miles of P. elongatus(Brodie 1971). Populations of P. stormi are associated closely with talusdeposits and fissured rock outcrops. Individuals occasionally may be foundunder coarse woody debris, but only during <strong>the</strong> wettest wea<strong>the</strong>r and alwaysnear talus. Populations are densest on heavily wooded, north-facing slopeswith talus (Nussbaum et al. 1983).Ecology and management.-Soil temperatures where P. stormi have beencollected during daytime were 3.50 to 11.3 0 C. Individuals are closest to <strong>the</strong>surface during spring (March to April) and fall (September to early November).However, even in dry summer wea<strong>the</strong>r, some may come to <strong>the</strong> surface to feedat night. They usually lie with <strong>the</strong>ir heads near <strong>the</strong> opening of <strong>the</strong>ir shelter392
and dart <strong>for</strong>ward to snap up small invertebrates. During wet wea<strong>the</strong>r, <strong>the</strong>ymay crawl over <strong>the</strong> surface of a talus slope (Nussbaum et al. 1983).Larch Mountain Salamander (Plethodon larsellWDistribution and habitat.-The Larch Mountain salamander has a veryrestricted range (Herrington and Larsen 1985). It is found only along a 35-milestretch of <strong>the</strong> Columbia River Gorge in Washington and Oregon and in o<strong>the</strong>rlocations in sou<strong>the</strong>rn Washington (Aubrey et al. 1987). It appears to havenarrow habitat requirements in stabilized talus ranging in size from one-thirdto 2 inches with soil deposits in <strong>the</strong> spaces. No data exist regarding populationdynamics of this species. The animals behave as most plethodontidsalamanders do; <strong>the</strong>y are active at or near <strong>the</strong> surface whenever temperatureand moisture regimes permit, which could be any day of <strong>the</strong> year in <strong>the</strong> ColumbiaRiver Gorge (Herrington and Larson 1985, 1987).Herrington and Larsen (1985) make a case <strong>for</strong> a dependent relationshipbetween this salamander and old-growth <strong>for</strong>ests based on one case. One of<strong>the</strong>ir sites (Mabee Mines Road in Skamania County, Washington) was comprisedof two talus slopes separated by a creek. One talus slope had beenclear-cut 10 years be<strong>for</strong>e <strong>the</strong>ir study and no P. larselli were found in <strong>the</strong>clearing. The talus slope directly across <strong>the</strong> creek from <strong>the</strong> cut slope containeda population of Larch Mountain salamanders.Ecology and management.-Herrington and Larson (1985) go on to state that<strong>the</strong> Columbia River Gorge is a geographic area with many potential uses, manyof which could affect populations of <strong>the</strong>se salamanders. Any land use practicethat alters moisture regimes in suitable stabilized talus slopes may causeextirpation of populations of P. larseltL Logging, harvesting talus <strong>for</strong> roadbuilding, and housing developments may affect this species adversely, but it isnot well documented.The Larch Mountain salamander has an extremely limited range and narrowhabitat requirements. The species appears to be an old-growth obligate withinmost areas of its range (Beatty et al. 1991). Based upon <strong>the</strong> two points aboveand o<strong>the</strong>r factors, Herrington and Larson (1985) recommend that this speciesbe listed as threatened, despite <strong>the</strong>ir having discovered new populations inWashington. Clearly, this is an animal of special concern. Based on personalobservations by J. Beatty (Oregon State University, pers. comm.), it appearsthat this species must have protection of some kind (in terms of habitat preservation)if viable populations are to be retained. Every ef<strong>for</strong>t should be made toprovide stabilized talus areas in older <strong>for</strong>ests within its range.Oregon Slender Salamander (Batrachoseps wripghDistribution and habitat.-The Oregon slender salamander occurs only inOregon along <strong>the</strong> <strong>for</strong>ested west slopes of <strong>the</strong> Cascades from <strong>the</strong> Columbia Riversouth to sou<strong>the</strong>rn Lane County and ranges in elevation from about 50 feet in<strong>the</strong> Columbia Gorge to near 4,300 feet in <strong>the</strong> Cascade Mountains. The speciesrecently has been collected in Wasco County, Oregon, extending its distributioneast of <strong>the</strong> Cascades crest (Nussbaum et al. 1983, Stebbins 1985, Kirk1991).The Oregon slender salamander appears to be most common in mature Douglas-fir<strong>for</strong>ests on west slopes of <strong>the</strong> Cascades, but it also occurs in secondgrowth<strong>for</strong>est, and in fairly recent lava flows a few miles west of Santiam Pass,Linn County. It is seldom found in clear-cuts, but has been collected undersurface debris in open, second-growth <strong>for</strong>ests during a damp spring. The393
species also is found under <strong>the</strong> bark of decaying Douglas-fir logs or deep withinsuch logs (Nussbaum et al. 1983, R. Storm, pers. obser.). It also frequentsmoist woods of Douglas-fir, maple, hemlock, and red cedar (Stebbins 1985). Inlate spring and summer, it retreats to underground refugia (Nussbaum et al.1983).Bury and Corn (1988) found B. wrighti in damp to wet old-growth, in mature<strong>for</strong>est, and in clear-cuts. Within <strong>the</strong>se areas, <strong>the</strong>y found 62.3 percent insidelogs and 87 percent in or near logs. They state, 'The Oregon slendersalamander seems to be associated with coarse woody debris in older decayclasses, which is a characteristic feature of old-growth <strong>for</strong>ests." Herrington(1988) observed B. wrighti in talus habitats more often than in o<strong>the</strong>r areas.This species was included in a list of species that he believed were capable ofcarrying out <strong>the</strong>ir entire life cycle within talus habitats.Ecology and Management.-Substrate temperatures where salamanders werefound in May varied from 10.80 to 13.80 C (Nussbaum et al. 1983). Stebbins(1951) gives good details of his collection sites, indicating microhabitat preferences.Individuals of this species often are found clumped, with two or morebeing toge<strong>the</strong>r under <strong>the</strong> same object. When disturbed, <strong>the</strong>y usually coil <strong>the</strong>irbodies like a watchspring and if fur<strong>the</strong>r disturbed, flip about violently bycoiling and uncoiling <strong>the</strong>ir bodies. If seized by <strong>the</strong> tail, B. wrighti can shed it atany segment. Near Hidden Lake, Lane County, Oregon, 13 percent of <strong>the</strong>adults lacked tails or were regenerating <strong>the</strong>m (Nussbaum et al. 1983, Stebbins1951).The Oregon slender salamander is endemic to <strong>the</strong> <strong>for</strong>ested west slopes of <strong>the</strong>Oregon Cascades north of sou<strong>the</strong>rn Lane County, Oregon. Studies haveshown it to prefer older <strong>for</strong>ests and to use, with frequency, large decaying logstypical of such <strong>for</strong>ests. Fur<strong>the</strong>r studies of precise ecological requirements areneeded, but it seems obvious that harvesting of older <strong>for</strong>ests has a high likelihoodof affecting populations of this species (Beatty et al. 1991). There<strong>for</strong>e,older <strong>for</strong>est preserves would benefit this species.Giant Salamanders (Dicamptodon spp.)Since all Dicamptodon share similar habitat requirements and reproductivebiology, <strong>the</strong>y will be discussed as a single entity, except where appropriate.These animals are probably <strong>the</strong> largest terrestrial caudate amphibians.Detailed historical descriptions of <strong>the</strong> genus and D. ensatus are provided byAnderson (1969) and Nussbaum (1976). Nussbaum (1970) described <strong>the</strong> firstcryptic species (D. copeO within <strong>the</strong> genus, and Good (1989) detailed <strong>the</strong>biochemical evidence he used to describe additional enigmatic taxa within D.ensatus. Electrophoretic studies (Daugherty et al. 1983, Good 1989) indicatethat <strong>the</strong>re may be biologically significant levels of genetic discontinuity betweengroups of populations throughout <strong>the</strong> range. Moreover, <strong>the</strong> observed heterogeneityamong <strong>the</strong> groups is consistent with that which is used to differentiatespecies. Thus, <strong>the</strong>se scientists have elected to split D. ensatus into a group ofthree cryptic species, two of which are within <strong>the</strong> range of <strong>the</strong> nor<strong>the</strong>rn spottedowl (D. copei and D. tenebrosus). This adds new responsibilities to <strong>the</strong> constructionof any management plan <strong>for</strong> this array of salamanders.Distribution and habitat.-Disjunct populations inhabiting <strong>the</strong> Rocky Mountainsof Idaho and Montana (see range map) have been designated D. aterrtmusby Good (1989) and Daugherty et al. (1983). Populations of concern to thisreport are found in northwestern Cali<strong>for</strong>nia, Oregon, Washington, and extreme394
southwestern British Columbia. Good's (1989) D. ensatus is found in <strong>the</strong> SanFrancisco Bay area, his D. tenebrosus from lower Sonoma County, Cali<strong>for</strong>nia,through southwestern British Columbia, and Nussbaum's (1970) D. copei in<strong>the</strong> Columbia River Gorge (both Oregon and Washington sides), <strong>the</strong> OlympicPeninsula, <strong>the</strong> Willapa Hills, and <strong>the</strong> sou<strong>the</strong>astern Washington Cascades(Figure D.5).Adults are common in many areas, but <strong>the</strong>y are nocturnal and secretive. Theycan be found in moist coniferous <strong>for</strong>ests under bark, logs, rocks, and wanderingabout on <strong>the</strong> <strong>for</strong>est floor (Beatty et al. 1991). During <strong>the</strong> breeding season<strong>the</strong>y can be found in or near streams and are also resident in talus slopesassociated with road cuts throughout most of <strong>the</strong>ir range (Nussbaum et al.1983, Stebbins 1985, Beatty et al. 1991 pers. obser.). Gomez (1992) foundPacific giant salamanders to be most abundant in riparian areas of mature andold-growth <strong>for</strong>ests as compared to upland sites and young and deciduous<strong>for</strong>ests.Ecology and management.-Larval giant salamanders feed upon a widevariety of aquatic invertebrates and vertebrates (fish, tadpoles, and conspecifics).Predators on larval <strong>for</strong>ms include fishes, weasels, water shrews, and o<strong>the</strong>rgiant salamanders. Metamorphic individuals have a reputation <strong>for</strong> beingvoracious predators. Stomach analyses have showed that <strong>the</strong>y eat terrestrialinvertebrates as well as many kinds of vertebrates (snakes, shrews, and birds)(Metter 1963, Nussbaum et al. 1983, Stebbins 1985).The effects of logging on stream amphibians has been examined by Corn andBury (1989). They were able to compare densities of salamanders in loggedversus unlogged reaches of streams in areas where stream gradients were highand low. The major effects of logging on habitats of <strong>the</strong>se salamanders seemsmost severe on low gradient reaches of streams that have been disturbed bytimber harvest. Disturbance adjacent to lower gradient areas in <strong>the</strong> stream oralong <strong>the</strong> banks of higher gradient riparian areas allows <strong>the</strong> deposition ofsediment, which fills cracks and crevices in lower reaches, making <strong>the</strong> habitatunsuitable. A second effect, apparently limited to cut over areas on highergradient streams is <strong>the</strong> enhancement of population densities owing to <strong>the</strong>increased primary and herbivore production which canopy opening allows(Hawkins et al. 1983). This may be a short term improvement as no long termpublished studies dealing with population dynamics exist.Olympic Salamanders (Rhyacotriton spp.)Range and habitat.-This group of species is <strong>the</strong> sole member of <strong>the</strong> subfamilyRhyacotritoninae and ranges from <strong>the</strong> Olympic Peninsula of northwesternWashington southward to Mendocino, Cali<strong>for</strong>nia in humid coastal <strong>for</strong>ests,entirely west of <strong>the</strong> crest of <strong>the</strong> Cascade Mountains (Anderson 1968; FigureD.4). This group is comprised of four different species which is soon to berevised by Good and his coworkers.These salamanders are found in and near small, rapidly flowing, well-shadedand permanent streams with clear, cold (usually 60 to 100 C) water (Stebbins1951). They are seldom more than 1 meter from free-running water(Nussbaum and Tait 1977). Small cold (80 to 120 C in summer) streams withwater seeping through moss-covered gravel are preferred habitats. Larvaeoccur in small mountain streams, spring heads and seepages from sea level toabout 1,200 meters (Nussbaum et al. 1983).Ecology and management.-Olympic salamanders apparently require fairlylow ambient temperatures. Adults may occasionally be found under objects a395
few meters from water after heavy rains, but this is unusual (Nussbaum et al.1983). Corn and Bury (1989) compared four species of aquatic amphibians in23 streams in uncut <strong>for</strong>ests versus those in <strong>for</strong>ests logged 14 to 40 years ago,in <strong>the</strong> central part of <strong>the</strong> Oregon Coast Range. The density and biomass of <strong>the</strong>four species (including Rhyacotriton spp.) was significantly higher (2-7X) in <strong>the</strong>streams of uncut <strong>for</strong>ests, because streams in logged stands generally possessedsmaller substrate material, caused by increased sedimentation. WhereRhyacotrton spp. occur in and adjacent to small headwater streams, <strong>the</strong>irexistence is threatened by timber harvest (Bury and Corn 1988b).Rhyacotriton spp. are fairly widespread in <strong>the</strong> Pacific Northwest and are mostlikely to occur in or adjacent to higher order, cold streams in <strong>for</strong>ested areas.Because of <strong>the</strong> requirement <strong>for</strong> permanently cold water in smaller streams,Olympic salamanders are highly susceptible to <strong>for</strong>est practices that removecanopy cover and elevate water temperatures (Beatty et al. 1991).Tailed Frog (Ascaphus tie)Distribution and habitat.-Tailed frogs are found west of <strong>the</strong> crest of <strong>the</strong>Cascade Range from British Columbia to northwestern Cali<strong>for</strong>nia. They arealso found in extreme northwestern Oregon, southwestern Washington,nor<strong>the</strong>rn Idaho, and northwestern Montana. Tailed frogs may be found fromsea level to over 2,000 meters. They are usually found near or in fast-flowing,permanent streams in <strong>for</strong>ests. The tadpoles of <strong>the</strong> tailed frog are uniqueamong northwestern larvae because <strong>the</strong>ir oral disc is modified into a suckingorgan that enables <strong>the</strong>m to cling to rocks in swift current. In <strong>the</strong> Oregon CoastRange, Gomez (1992) found tailed frogs to be most abundant in riparian areasof mature- and old-growth <strong>for</strong>ests as compared to upland sites and young anddeciduous <strong>for</strong>ests.Ecology and management.-Adults eat a wide variety of invertebrates includingsnails, ticks, spiders, mites, and numerous insect species (Nussbaum et al.1983). Pacific giant salamanders (Dicamptodon) are a major predator of A. trueitadpoles (Metter 1963, Duellman and Trueb 1986). Populations of A. tnuei maybe decimated by natural disasters such as floods that greatly reduce larvalpopulations (Metter 1968).Ascaphus truei is probably <strong>the</strong> amphibian most likely to be affected by oldgrowthhabitat loss and habitat destruction. Tailed frogs are closely associatedwith fast-flowing streams in <strong>for</strong>ested areas and are commonly found within oldgrowth<strong>for</strong>ests (Bury 1983, Bury and Corn 1988a and 1988b, Raphael 1988,Welsh and Lind 1988, Corn and Bury 1989). Bury (1983) found A. truei onundisturbed old-growth sites but none in logged areas. Bury and Corn (1988)bconsidered A. tnrei to be 'sensitive to timber harvest" and that <strong>the</strong> survival ofthis species may depend upon protection of cool flowing streams that <strong>the</strong>species requires <strong>for</strong> breeding purposes and larval development. In loggedstands, tailed frogs are most often found in streams where uncut timber stillremains upstream (Corn and Bury 1989). Tailed frogs are likely to be affectedby increased water temperature that occurs after clear-cutting (Bury and Corn1988b).Because of <strong>the</strong> extreme philopatry and tendency <strong>for</strong> A. truei populations to beextremely disjunct (Daugherty and Sheldon 1982), recolonization after localextinction may take a relatively long time. There<strong>for</strong>e, some populations maynot recover from habitat destruction.396
Summary and ConclusionsAs a result of <strong>the</strong> Secretary of Interior's directive, <strong>the</strong> <strong>Recovery</strong> Team considered<strong>the</strong> needs of o<strong>the</strong>r species associated with older <strong>for</strong>est ecosystems andassessed <strong>the</strong> benefits to o<strong>the</strong>rs species from various recovery options. TheO<strong>the</strong>r Species and Ecocystems Committee emphasized species that were listedfederally as threatened or endangered, candidates <strong>for</strong> federal listing, statesensitive or species of special concern, and those associated with older <strong>for</strong>ests.We assembled a list of 364 species of plants and animals that meet <strong>the</strong> abovecriteria and occur within <strong>the</strong> range of <strong>the</strong> nor<strong>the</strong>rn spotted owl. We alsoprovided descriptions of older <strong>for</strong>est and riparian ecosystems, unique foodwebs of older <strong>for</strong>ests, <strong>the</strong> use of <strong>the</strong> spotted owl as an indicator species, and<strong>the</strong> biology of spotted owl prey. In this section, we present an overview of <strong>the</strong>committee's work and accomplishments and how we were able to benefit o<strong>the</strong>rspecies with <strong>the</strong> owl recovery plan: this section summarizes in<strong>for</strong>mation inChapter V as well as this appendix.The list of 364 species is comprised of 23 species of birds, 18 mammals, 26amphibians and reptiles, 28 fish, 58 molluscs, 59 arthropods, 144 vascularplants, and 8 fungi and lichens. Five species are listed federally as threatenedor endangered (bald eagle, grizzly bear, gray wolf, Sacramento River winterchinook salmon, McDonald's rock cress), and <strong>the</strong> marbled murrelet andgoshawk have been proposed and petitioned <strong>for</strong> listing, respectively. A total of155 species was candidates <strong>for</strong> federal listing, and more than 100 species werelisted as threatened or endangered by one or more of <strong>the</strong> three states or weredesignated as sensitive or species of special concern. More than 100 speciesare narrowly or broadly endemic to <strong>the</strong> Pacific Northwest and 194 are associatedwith older <strong>for</strong>ests. The large number of species on <strong>the</strong> list emphasizes <strong>the</strong>relevance of considering o<strong>the</strong>r species in <strong>the</strong> owl recovery plan.The committee's work has substantiated <strong>the</strong> role of riparian ecosystems inconiferous <strong>for</strong>ests of <strong>the</strong> Pacific Northwest. Of <strong>the</strong> 364 species that meet ourcriteria, approximately one third (132) are associated with riparian areasincluding 28 species of fish, 45 molluscs, 34 arthropods, 12 amphibians, sixvascular plants, four mammals, and three birds. The 28 species of fish includeapproximately 800 stocks that are considered at risk and may become candidates<strong>for</strong> listing in <strong>the</strong> future. The numerous riparian associated species plus<strong>the</strong> number of fish stocks that are considered at risk stresses <strong>the</strong> importanceof riparian areas within <strong>the</strong> range of <strong>the</strong> nor<strong>the</strong>rn owl. As a result, we haveprovided a brief synopsis of on <strong>the</strong> ecology and management of riparian ecosystems.In addition to assembling a list of species <strong>for</strong> consideration in <strong>the</strong> owl recoveryplan, <strong>the</strong> committee developed a short list of priority species. The short list ofpriority species was given <strong>the</strong> most emphasis in <strong>the</strong> recovery plan and includes18 species (bald eagle, marbled murrelet, goshawk, marten, fisher, gray wolf,grizzly bear, Oregon slender salamander, Siskiyou Mountain salamander,Larch Mountain salamander, Del Norte salamander, Olympic salamandersfourspecies, Pacific giant salamander, Cope's giant salamander, and tailedfrog); a large group of riparian associated species; and a small group of speciesthat are preyed upon by <strong>the</strong> owl (nor<strong>the</strong>rn flying squirrel, dusky-footedwoodrat, bushy-tailed woodrat, deer mouse, western red-backed vole, and redtree vole). Of <strong>the</strong>se species, <strong>the</strong> marbled murrelet and <strong>the</strong> numerous fishstocks that are considered at risk were assigned <strong>the</strong> highest priority. Wecompiled in<strong>for</strong>mation on <strong>the</strong> distribution, biology, and habitat relationships of<strong>the</strong> priority species and on <strong>the</strong> ecology of riparian ecosystems. This in<strong>for</strong>mationwas used to influence <strong>the</strong> design and management of DCAs.397
In considering <strong>the</strong> needs of o<strong>the</strong>r species in <strong>the</strong> recovery plan <strong>for</strong> <strong>the</strong> owl, <strong>the</strong><strong>Recovery</strong> Team took advantage of opportunities to benefit o<strong>the</strong>r species andecosystem function without increasing <strong>the</strong> cost of <strong>the</strong> plan. This was done byaltering <strong>the</strong> size, shape, and location of DCAs to attain maximum benefit <strong>for</strong>owls and incorporate o<strong>the</strong>r species to <strong>the</strong> extent possible. In<strong>for</strong>mation on o<strong>the</strong>rspecies was used in several ways in <strong>the</strong> development of <strong>the</strong> recovery plan.First, in development of <strong>the</strong> overall strategy <strong>for</strong> <strong>the</strong> plan, <strong>the</strong> team evaluated<strong>the</strong> overlap between possible owl conservation areas and <strong>the</strong> geographic rangesof <strong>the</strong> list of priority species. Second, in developing recommendations <strong>for</strong>specific management practices in DCAs and <strong>the</strong> <strong>for</strong>est matrix surroundingDCAs, <strong>the</strong> <strong>Recovery</strong> Team attempted to look beyond <strong>the</strong> habitat needs ofspotted owls. The <strong>Recovery</strong> Team used <strong>the</strong> characteristics of older <strong>for</strong>ests,wherever possible, in developing guidelines <strong>for</strong> management recommendations.This insured that o<strong>the</strong>r species would benefit and not be inadvertently harmed.As a result of <strong>the</strong>se activities, <strong>the</strong> <strong>Recovery</strong> Team was able to locate DCAs sothat <strong>the</strong>y include approximately 500 locations (nest or occupied sites) of o<strong>the</strong>rspecies, namely 228 occupied murrelet sites, 120 goshawk nest sites, 56marten locations, 37 fisher locations, and 37 bald eagle nest sites. The greatestbenefits to o<strong>the</strong>r species were achieved <strong>for</strong> marbled murrelets in <strong>the</strong> OregonCoast Range where 151 occupied sites were included in DCAs. The DCAs alsoinclude 2,047 miles of streams with fish stocks that are considered at risk.The greatest benefits to fish stocks were achieved in <strong>the</strong> Klamath province and<strong>the</strong> Oregon Coast Range where 696 and 314 miles of stream, respectively, wereincluded in DCAs. Inclusion of streams and of o<strong>the</strong>r species sites in DCAs,along with <strong>the</strong> conservation of older <strong>for</strong>ests <strong>for</strong> owl habitat, will provide significantbenefits to o<strong>the</strong>r species within <strong>the</strong> range of <strong>the</strong> spotted owl. However, <strong>the</strong>marbled murrelet and <strong>the</strong> numerous fish stocks will likely require fur<strong>the</strong>rconservation ef<strong>for</strong>ts in <strong>the</strong> future by ano<strong>the</strong>r group, as is <strong>the</strong> case <strong>for</strong> most of<strong>the</strong> o<strong>the</strong>r priority species. The conservation needs of arthropods and molluscsare particularly elusive at <strong>the</strong> present time, because we do not know enoughabout <strong>the</strong> geographic distributions or <strong>the</strong> habitat associations of many of <strong>the</strong>seorganisms. In addition, <strong>the</strong>re are many species yet to be described and namedwithin <strong>the</strong>se two groups.Management guidelines <strong>for</strong> DCAs were designed to maintain suitable habitat<strong>for</strong> spotted owls and to develop suitable habitat in stands that are currentlyunsuitable (see section III.C.2. on silviculture, salvage, and catastrophic risk).These guidelines are written to conserve owl habitat and <strong>the</strong> characteristics ofolder <strong>for</strong>ests. As a result, <strong>the</strong> <strong>for</strong>ests within DCAs will provide habitat <strong>for</strong> awide array of o<strong>the</strong>r species. For example, <strong>the</strong> guidelines <strong>for</strong> salvage of treesafter catastrophic events (primarily wind and fire) are designed to providecoarse woody debris (snags and down logs) over a 100-year period. Thismanagement will contribute to <strong>the</strong> habitat requirements of a number of cavitydwellers including cavity-nesting birds and flying squirrels which make extensiveuse of snags. The recommendations will also promote suitable habitatconditions <strong>for</strong> marten, salamanders, numerous arthropods, fungi, and smallmammals by providing coarse woody debris on <strong>the</strong> <strong>for</strong>est floor. The retentionof coarse woody debris in riparian areas will provide habitat <strong>for</strong> fish and o<strong>the</strong>raquatic organisms. In addition, <strong>the</strong> <strong>for</strong>est matrix on federal lands will bemanaged to protect residual habitat areas, reserved pair areas, and managedpairareas <strong>for</strong> owls where <strong>the</strong> DCA network is deficient or <strong>the</strong>re is a risk ofcatastrophic disturbance. These guidelines will provide habitat <strong>for</strong> manyspecies that are associated with older <strong>for</strong>ests. Habitat around managed-pairareas will provide habitat <strong>for</strong> o<strong>the</strong>r species if management strategies includelong rotations and uneven-aged management with <strong>the</strong> goal of providing largetrees, snags, and coarse woody debris.398
Literature CitedLastly, <strong>the</strong> O<strong>the</strong>r Species and Ecosystems Committee recommends fur<strong>the</strong>rsurveys, inventory, and research on o<strong>the</strong>r species so that <strong>the</strong>ir habitat needscan be identified more accurately in <strong>the</strong> future (see Chapter V). We provided alist of birds, mammals, amphibians, and fishes that were suggested <strong>for</strong> fur<strong>the</strong>rreview of <strong>the</strong> status of <strong>the</strong>ir populations, and provided a partial list of researchtopics. Research on arthropods and molluscs is one of <strong>the</strong> highest priorities.There is a need to understand <strong>the</strong> responses of all organisms to varioussilvicultural practices o<strong>the</strong>r than clear-cut timber harvests. In<strong>for</strong>mation on <strong>the</strong>ecological requirements of <strong>the</strong>se species will be needed to develop managementstrategies to sustain populations of all organisms that are well dispersedthroughout <strong>the</strong>ir range.Alexander, L., and B. J. Verts. In press. Clethrionomys califomicus. Mammal.Species.Allen, A. W. 1983. Habitat suitability index models: fisher. U.S. Fish and WildlifeService FWS/OBS-82/10.45. l9pp.Almack, J. A. 1985. An evaluation of grizzly bear habitat in <strong>the</strong> Selkirk Mountainsof north Idaho. M.S. Thesis, University of Idaho, Moscow. 87pp.Anderson, J. D. 1969. Catalogue of American amphibians and reptiles.Dicamptodon and D. ensatus. 76.1-76.2.Anthony, R. G., and F. B. Isaacs. 1989. Characteristics of bald eagle nest sites inOregon. Journal of Wildlife Manage. 53:148-159.Anthony, R. G., R. L. Knight, G. T. Allen, B. R. McClelland, and J. I. Hodges. 1982.Habitat use by nesting and roosting bald eagles in <strong>the</strong> Pacific Northwest.Trans. North American Wildlife and Natural Resources Conference 47:332-342.Arthur, S. M. 1987. Ecology of fishers in south-central Maine. Ph.D. Thesis,University Maine, Orono. Il2pp.Arthur, S. M., W. B. Krohn, and J. R. Gilbert. 1989. Habitat use and diet offishers. Journal of Wildlife Management 53:680-688.Aubry, K. B., M. J. Crites, and S. D. West. 1991. Regional patterns of smallmammal abundance and community composition in Oregon and Washington.Pages 285-294 in Ruggiero et al., eds. Wildlife and vegetation of unmanagedDouglas-fir <strong>for</strong>ests. USDA, Forest Service, Pacific Northwest Research Station,Portland, Oregon. Gen. Tech. Rept. PNW-GTR-285. 533p.Aubry, K. B., C. M. Senger, and R. L. Craw<strong>for</strong>d. 1987. Discovery of Larch Mountainsalamanders Plethodon klrseUl in <strong>the</strong> Central Cascade Range of Washington.Biology Conservation 42:147-152.Austin, K. 1989. Habitat use of nesting goshawk in nor<strong>the</strong>rn Cali<strong>for</strong>nia. M.S.Thesis research proposal, Department Fish and Wildlife, Oregon State University,Corvallis. 23pp.Baker, R. J., and C. M. Shonewald-Cox. 1986. Management strategies <strong>for</strong> improvingpopulation viability. Pages 73-87 in B.A. Wilcox, P.F. Brussard, and B.G.Marcot, eds. The Management of Viable Populations: Theory, Applications andCase Studies. Center <strong>for</strong> Conservation Biology. Stan<strong>for</strong>d University, Palo Alto,Cali<strong>for</strong>nia399
Barrows, C. W. 1981. Roost selection by spotted owls: An adaptation to heatstress. Condor 83:302-309.Barrows, C. and K. Barrows. 1978. Roost characteristics and behavioral <strong>the</strong>rmoregulationin <strong>the</strong> spotted owl. Western Birds 9:1-8.Beatty, J. J., A. R. Blaustein, and R. M. Storm. 1991. A report to <strong>the</strong> Nor<strong>the</strong>rn<strong>Spotted</strong> <strong>Owl</strong> <strong>Recovery</strong> Team: The biology of amphibians and reptiles. DepartmentZoology, Oregon State University, Corvallis. 78pp plus figures.Bent, A. C. 1937. Life histories of North American birds of prey: part 1. U.S.National Museum Bulletin 167. Washington, D.C.Beschta, R. L. 1989. The effects of riparian vegetation on channel morphology,sediment, and temperature in streams. In: Proceedings, Silvicultural managementof riparian areas <strong>for</strong> multiple resources. Coastal Oregon Productivity andEnhancement Workshop. Pacific Northwest Research Station, U.S. ForestService and Oregon State University College of Forestry, Corvallis, OregonBlakesley, J. A., A. B. Franklin, and R. J. Gutierrez, In press. <strong>Spotted</strong> owl roostand nest site selection in northwestern Cali<strong>for</strong>nia. Journal of Wildlife Management.Blaustein, A. R., and D. B. Wake. 1990. Declining amphibian populations: Aglobal phenomena? Trends in Ecology and Evolution 5:203-204.Bloom, P. H., G. R. Stewart, and B. J. Walton. 1985. The status of <strong>the</strong> nor<strong>the</strong>rngoshawk in Cali<strong>for</strong>nia, 1981-1983. Wildlife Management. Branch Admin.Report 85- 1. Cali<strong>for</strong>nia Department of Fish and Game, Sacramento, Cali<strong>for</strong>nia.Brodie. E. D., Jr. 1971. Plethodon stornL Catalogue of American amphibians andreptiles. 103.1-103.2Brown, E. R. (ed.). 1985. Management of wildlife and fish habitats in <strong>for</strong>ests ofwestern Oregon and Washington. U.S. Forest Service, Portland, Oregon,Publication No. R6-F&WL-192-1985. 332pp.Buchannan, J. B. 1991. <strong>Spotted</strong> owl nest site characteristics in mixed conifer<strong>for</strong>ests of <strong>the</strong> easten Cascade Mountains, Washington. M.S. Thesis, Universityof Washington, Seattle. 140pp.Bull, E. I. 1980. Resource partitioning among woodpeckers in Nor<strong>the</strong>ast Oregon.Ph.D. Dissertation, University of Idaho, Moscow. 54p.Bury, R. B. 1983. Differences in amphibian populations in logged and old growthredwood <strong>for</strong>est. Northwest Sci. 57:167-178.Bury, R. B. 1988. Habitat relationships and ecological importance of amphibiansand reptiles. Pages 61-76 in Raedeke, K. J., ed. Streamside management:riparian wildlife and <strong>for</strong>estry interactions. University of Washington, Instituteof Forest Resources Contribution 59, Seattle.Bury, R. B., and P. S. Corn. 1988a. Douglas-fir <strong>for</strong>ests in <strong>the</strong> Oregon and WashingtonCascades: Relation of <strong>the</strong> herpetofauna to stand age and moisture.Pages 11-22 in R. C. Szaro et al., eds. Management of Amphibians, Reptilesand Small Mammals in North America. Rocky Mt. Forest and Range ExperimentStation, Gen. Tech. Rep. RM-166.400
Bury, R. B., and P. S. Corn. 1988b. Responses of aquatic and streamside amphibiansto timber harvest: A review. In K.J. Raedke (ed.), Streamside Management:Riparian Wildlife and Forestry Interactions. University of WashingtonInstitute of Resources Contribution No. 59.Bury, R. B., Corn, P. S., and K. B. Aubry. 1991. Regional patterns of terrestrialamphibian communities in Oregon and Washington. Pages 341-350 inRuggiero et al., eds. Wildlife and vegetation of unmanaged Douglas-fir <strong>for</strong>ests.USDA, Forest Service, Pacific Northwest Research Station, Portland, Oregon.Bury, R. B. 1983. Differences in amphibian populations in logged and old growthredwood <strong>for</strong>ests. Northwest Sci. 57:167-178.Buskirk, S. W. 1984. Seasonal use of resting sites by marten in south-centralAlaska. Journal of Wildlife Management. 48:950-953.Buskirk, S. W., S. C. Forrest, M. G. Raphael and H. J. Harlow. 1989. Winterresting site ecology of marten in <strong>the</strong> central Rocky Mountains. Journal ofWildlife Management. 53:191-196.Cali<strong>for</strong>nia Department of Fish and Game. 1991a. Natural diversity data base,special animals. July 1991.Cali<strong>for</strong>nia Department of Fish and Game. 199 lb. Designated endangered, threatenedor plants. Cali<strong>for</strong>naia Department of Fish and Game, Natural HeritageDivision, Endangered <strong>Plan</strong>t Program.Cali<strong>for</strong>nia Department of Fish and Game. 1986. Mammalian species of specialconcern in Cali<strong>for</strong>nia. II2pp.Cali<strong>for</strong>nia Department of Fish and Game. 1990. Sensitive Species List. Sacramento.3pp.Carey, A. B., S. P. Horton, and B. L. Biswell. 1992. Nor<strong>the</strong>rn spotted owls: influenceof prey base and landscape character. Ecological Monographs In press.Carey, A. B. 1989. Wildlife associated with old-growth <strong>for</strong>ests in <strong>the</strong> Pacific Northwest.Natural Areas. Journal 151-162.Caro<strong>the</strong>rs, S. W. 1977. Importance, preservation, and management of riparianhabitats: an overview. Pages 2-4 in R. R. Johnson and D. A. Jones, tech.coord. Importance, preservation and management of riparian habitat: asymposium. U.S. Forest Service, Rocky Mt. Forest and Range ExperimentStation Gen. Tech. Rep. RM-43. Fort Collins, Colorado.Carter, H. R., and R. A. Erickson. 1988. Population status and conservationproblems of <strong>the</strong> marbled murrelet in Cali<strong>for</strong>nia, 1892-1987. Final Report,Cali<strong>for</strong>nia Department of Fish and Game, Contract FG7569, Sacramento.68pp.Carter, H. R., and S. G. Sealy. 1986. Year-round use of coastal lakes by marbledmurrelets. Condor 88:473-477.Carter, H. R., and S. G. Sealy. 1987. Inland records of downy young and fledglingmarbled murrelets in North America. Murrelet 68:58-63.Chambers, T. W., R. D. Harr, and F. H. Everest. 1991 Timber harvesting, silviculture,and watershed processes. American Fisheries Society Special Publication19: 181-205.401
Clark, T. W., E. Anderson, C. Douglas, and M. Strickland. 1987. Martesamericana. Am. Soc. Mammal. No. 289:1-8.Corn, P. S., and R. B. Bury. 1989. Logging in western Oregon: responses ofheadwater habitats and stream amphibians. Forest Ecology and Management29:39-57.Corn, P. S., and R. B. Bury. 1991. Small mammal communities in <strong>the</strong> OregonCoast Range. Pages 241-254 in Ruggiero et al., eds. Wildlife and vegetation ofunmanaged Douglas-fir <strong>for</strong>ests. USDA, Forest Service, Pacific NorthwestResearch Station, Portland, Oregon. Gen. Tech. Rept. PNW-GTR-285. 533p.Crocker-Bed<strong>for</strong>d, D. C. 1990. Goshawk reproduction and <strong>for</strong>est management.Wildlife Society Bulletin 18:262-269.Cummins, E. 1991. Marbled murrelet status in Washington. Transcript fromtechnical workshop in o<strong>the</strong>r species and ecosystem issues in recovery planning<strong>for</strong> <strong>the</strong> Nor<strong>the</strong>rn <strong>Spotted</strong> <strong>Owl</strong>. U.S. Fish and Wildlife Service, Portland, Oregon.Daugherty, C. H., F. W. Allendorf, W. W. Dunlop, and K. L. Knudsen. 1983.Systematic implications of geographic patterns of genetic variation in <strong>the</strong> genusDicamptodon. Copeia 1983:679-691.Daugherty, C. H., and A. L. Sheldon. 1982. Age-specific movement patterns of <strong>the</strong>tailed frog Ascaphus truei Herpetologica 38:468-474.deVos, A. 1964. Range changes of mammals in <strong>the</strong> Great Lakes region. AmericanMidland Naturalist 71:210-231.Duellman, W. E., and L. Trueb. 1986. Biology of Amphibians. New York, McGraw-Hill.Elmore, W., and R. L. Beschta. 1987. Riparian areas: perceptions in management.Rangelands 9:260-265.Everest, F. H., R. L. Beschta, J. C. Scrivenier, K. V. Koski, J. R. Sedell, and C. J.Cederholm. 1987. Fine sediment and salmonid production: a paradox. Pages98-142 in Salo and Cundy, eds. Streamside management: <strong>for</strong>estry and fisheryinteractions. University of Washington, Institute of Forest Resources Contribution57, Seattle.Fleming, T. 1987. Nor<strong>the</strong>rn goshawk status and habitat associations in westernWashington, with special emphasis on <strong>the</strong> Olympic Penninsula. U.S. ForestService, Olympia, Washington 45pp.Forsman, E. K. 1976. A preliminary investigation of <strong>the</strong> spotted owl in Oregon.M.S. Thesis, Oregon State University, Corvallis. 127pp.Forsman, E. D., E. C. Meslow, and H. M. Wight. 1984. Distribution and biology of<strong>the</strong> spotted owl in Oregon. Wildlife Monographs 87. 64pp.Frest, T. J. and E. J. Johannes. 1991. Present and potential candidate molluscsoccurring within <strong>the</strong> range of <strong>the</strong> Nor<strong>the</strong>rn <strong>Spotted</strong> <strong>Owl</strong>. Final Report, ContractNo. P53354. Nor<strong>the</strong>rn <strong>Spotted</strong> <strong>Owl</strong> <strong>Recovery</strong> Team, 30pp.Frissell, C. A. 1991. Topology of extinction and endangerment of native fishes in<strong>the</strong> Pacific Northwest and Cali<strong>for</strong>nia (USA). Submitted to Conservation Biology.Date of draft: 28 August 1991.402
Furniss, M. J., T. D. Roelofs, and C. S. Yee. 1991. Road construction and maintenance.Am. Fish. Soc. Spec. Publ. 19:297-323.Garrett, M. L., J. Watson, and R. G. Anthony. 1987. Ecology of bald eagles on <strong>the</strong>lower Columbia River. Oregon Coop. Wildlife Research Unit. Report to U.S.Army Corps of Engineers. 181pp.Gashwiler, J. S. 1959. Small mammal study in west-central Oregon. J. Mammal.40:128-139.Gashwiler, J. S. 1970. <strong>Plan</strong>t and animal changes on a clearcut in west-centralOregon. Ecology 51:1018-1026.Gilbert, F. F., and R. Allwine. 1991. Small mammal communities in <strong>the</strong> OregonCascade Range. Pages 257-268 in L. F. Ruggerio, K. B, Aubry, A. B. Carey,and M. H. Huff, eds. Wildlife and vegetation of unmanaged Douglas-fir <strong>for</strong>ests.U.S. Forest Service Gen. Tech. Rep. PNW-GTR-285.Goertz, J. W. 1964. Habitats of three Oregon voles. Ecology 45:846-848.Goggans, R. 1986. Habitat use by flammulated owls in Nor<strong>the</strong>astern Oregon.M.S. Thesis, Oregon State University, Corvallis. 54p.Goggans, R., R. Dixon, and L. C. Seminara. 1987. Habitat use by three-toed andblack-backed woodpecker, Deschutes National Forest, Oregon. NongameProject Report No. 87-3-02, Oregon Department of Fish and Wildlife. 50p.Gomez, D. M. 1992. Influence of riparian and upslope vegetation on smallmammaland herpetofaunal abundance in five <strong>for</strong>est types. M.S. Thesis,Oregon State University, Corvallis.Good, D. A. 1989. Hybridization and cryptic species in Dicamptodon (Caudata:Dicamptodontidae). Evolution 43:728-744.Gregory, S.V., G. A. Lamberti, K. M. S. Moore. 1988. Influence of valley floorland<strong>for</strong>ms on stream ecosystems. Pages 3-8 in Abell, D. L., technicalcoodinator. Proceedings of <strong>the</strong> Cali<strong>for</strong>nia Riparian Systems Conference:protection, management, and restoration <strong>for</strong> <strong>the</strong> 1990s; 1988 September;Davis, C. A. Gen. Tech. Report. PSW-1 0. Berkeley, Cali<strong>for</strong>nia: Pacific SouthwestForest and Range Experiment Station, Forest Service, USDA.Gregory, S., and L. Ashkenas. 1990. Riparian Management Guide: WillametteNational Forest. U.S. Forest Service, Pacific Northwest Region.Grenfell, W. E., and M. Fasenfest. 1979. Winter food habits of fishers, MartespennantL in northwestern Cali<strong>for</strong>nia. Cali<strong>for</strong>nia Fish and Game 65:184-189.Grinnel, J., J. S. Dixon, and J. M. Linsdale. 1937. Fur-bearing mammals ofCali<strong>for</strong>nia. University Cali<strong>for</strong>nia Press, Berkeley. 777pp.Grinnell, J., and A. H. Miller. 1944. Acipitergentilis antricap-American goshawk.Pages 97-98 in J. Grinnell and A. H. Miller, The distribution of <strong>the</strong> birds ofCali<strong>for</strong>nia. Cooper Ornithological Club, Berkeley, Cali<strong>for</strong>nia.Hall, P. 1984. Characterization of nesting habitat of goshawks (Accipiter gentilts) innorthwestern Cali<strong>for</strong>nia. M.S. Thesis, Humboldt State University, Arcata,Cali<strong>for</strong>nia. 70pp.403
Hamer, T. E. 1991. Habitat relationships of marbled murrelets (Brachyrarophusrnarmoratus) in western Washington. Final report, Washington Department ofWildlife, Olympia. 20 pp.Hansen, J. J. 1986. Wolves of nor<strong>the</strong>rn Idaho and nor<strong>the</strong>astern Washington.Montana Coop. Wildlife Research Unit. U.S. Fish and Wildlife Service, Universityof Montana, Missoula.Hargis, C. D. 1981. Winter habitat utilization and food habits of pine martens inYosemite National Park. M.S. Thesis, University Cali<strong>for</strong>nia, Berkeley. 57pp.Hargis, C. D. and D. R. McCullough. 1984. Winter diet and habitat selection ofmarten in Yosemite National Park. Journal of Wildlife Management. 48:140-146.Harmon, M. E., J. F. Franklin, F. J. Swanson, P. Sollins, S. V. Gregory, J. D. Lattin,N. H. Anderson, S. P. Cline, N. G. Aumen, J. R. Sedell, G. W. Lienkaemper, K.Cromack, Jr., and K. W. Cummins. 1986. Ecology of coarse woody debris intemperate ecosystems. Adv. in Ecol. Res. 15:133-302.Harris, L. D. and C. Maser. 1984. Animal community characteristics. Pages 44-68 un L. D. Harris, ed. The fragmented <strong>for</strong>est. University of Chicago Press,Chicago and London. 21 pp.Harris, L. G. 1984. The fragmented <strong>for</strong>est. University Chicago Press. 21 'pp.Hayward, G. D., T. Holland, and R. Escano. 1990. Goshawk habitat relationships.Pages 19-25 in N. Warren, ed., Old growth habitats and associated wildlifespecies in <strong>the</strong> nor<strong>the</strong>rn Rocky Mountains. USDA, Forest Service, Nor<strong>the</strong>rnRegion, Wildlife Habitat Relationships Program. Paper No. Rl-90-42.Hawkins, C. P., M. L. Murphy, N. H. Anderson, and M. A. Wilzbach. 1983. Densityof fish and salamanders in relation to riparian canopy and physical habitat instreams of <strong>the</strong> northwestern United States. Canadian Journal of Fisheries andAquatic Sciences 40:1173-1185.Henny, C., and R. G. Anthony. 1989. Status of bald eagle and osprey. Pages 66-82 In Proc. Western Raptor Management Symposium Workshop. Natl. WildlifeFed., Washington, D.C.Herrington, R. E. 1988. Talus use by amphibians and reptiles in <strong>the</strong> PacificNorthwest. Pages 216-221 in Management of amphibians, reptiles, and smallmammals in North America. Rocky Mt. Forest and Range Experiment Station,Gen. Tech. Rep. RM- 166.Herrington, R. E., and J. H. Larsen, Jr. 1985. The current status, habitat requirementsand management of <strong>the</strong> Larch Mountain salamander. Biol. Cons.34:169-179.Herrington, R. E., and J. H. Larsen, Jr. 1987. Reproductive biology of <strong>the</strong> LarchMountain salamander (Plethodon larselli Bums). J. Herpetology 21:48-56.Hicks, B. J., J. D. Hall, P. A. Bisson, and J. R. Sedell. 1991. Responses of salmonidsto habitat changes. Am. Fish. Soc. Spec. Publ. 19:483-518.Ingles, L. G., 1976. Mammals of <strong>the</strong> Pacific States, Stan<strong>for</strong>d University Press,Stan<strong>for</strong>d, Cali<strong>for</strong>nia, 506 pp.404Ingram, R. 1973. Wolverine, fisher and marten in central Oregon. Oregon StateGame Commission, Central Region, Admin Rep. 73-2. 41pp.
Irwin, L. 1987. Review of Minium Management Requirements <strong>for</strong> indicator species:pine marten and pileated woodpeckers. National Council Paper Industry<strong>for</strong> Air and Stream Improvement. Technical Bulletin No. 522.Isaac, L. A. 1952. Biological aspects of <strong>for</strong>est conservation in Washington andOregon. Pages 12-15 in Proc. 13th Oregon State College of BiologyColloquium: Conservation, Corvallis.Johnson, K. N., J. F. Franklin, J. W. Thomas, and J. Gordon. 1991. Alternatives<strong>for</strong> management of late successional <strong>for</strong>ests of <strong>the</strong> Pacific Northwest. Draftreport to <strong>the</strong> U.S. House of Representatives Committee on Agriculture andCommittee on Merchant Marine and Fisheries.Johnson, M. L., and S. B. George. 1991. Species limits within <strong>the</strong> Arborimuslongtcaudus species complex (Mammalia: Rodentia) with a description of a newspecies from Cali<strong>for</strong>nia. Contributions in Science. 429:1-16.Jones, J. L. 1991. Habitat use of fisher in north-central Idaho. M.S. Thesis,University of Idaho, Moscow. 147pp.Jones, L. C. and M. G. Raphael. 1991. Ecology and management of marten infragmented habitats of <strong>the</strong> Pacific Northwest. Fiscal year 1990 progress report.U.S. Forest Service, Pacific Northwest Research Station, Olympia, Washington60pp.Keister, G. P., Jr., and R. G. Anthony. 1983. Characteristics of bald eagle communalroosts in <strong>the</strong> Klamath Basin, Oregon and Cali<strong>for</strong>nia. Journal of WildlifeManagement 47:1072-1079.Kirk, J. J. 1991. Batrachoseps wrightt Hood River Co. Herpetol. Rev. 22:22.Kirk J. J. and R.D. Forbs 1991. Geographic distribution: Batrachoseps wrighti.SSAR Herp. Review: 22-23.Knight, A. W., and R. L. Bottorf. 1984. The importance of riparian vegetation tostream ecosystems. Pages 160-167 in R E. Warner and K. M. Hendrix, eds.Proc. Cali<strong>for</strong>nia Riparian Systems, Berkeley, Cali<strong>for</strong>nia. University of Cali<strong>for</strong>niaPress, Berkeley.Koehler, G. M., W. R. Moore, and R. Taylor. 1975. Preserving <strong>the</strong> pine marten:management guidelines <strong>for</strong> western <strong>for</strong>ests. West. Wildlands 2:31-36.Landres, P. B., J. Verner, and J. W. Thomas. 1988. Ecological uses of vertebrateindicator species: a critique. Cons. Biol. 2:316-328.Larsen, C. J. 1991. Report to <strong>the</strong> Fish and Game Commission: A status review of<strong>the</strong> marbled murrelet (Brachyramphus marmoratus) in Cali<strong>for</strong>nia. NongameBird and Mammal Section, Department Candidate Species Status Report. 91 -1, Cali<strong>for</strong>nia Department of Fish and Game, Sacramento. 30pp., plus appendices.Mannan, R. W., M. L. Morrison, and E. C. Meslow. 1984. Comment: <strong>the</strong> use ofguilds in <strong>for</strong>est bird management. Wildlife Society Bulletin 12:426-430.Mannan, R. W. 1977. Use of snags by birds: Douglas-fir region, western Oregon.M.S. Thesis, Oregon State University, Corvallis. 114pp.Mannan, R. W., and E. C. Meslow. 1984. Bird populations and vegetation characteristicsin managed and old growth <strong>for</strong>ests, nor<strong>the</strong>astern Oregon. Journal ofWildlife Management. 48:1219-1238.405
Mannan, R. W., E. C. Meslow, and H. M. Wight. 1980. Use of snags by birds inDouglas-fir <strong>for</strong>ests, western Oregon. Journal of Wildlife Management. 44:787-797.Marshall, D. 1991. Threatened and sensitive wildlife of Oregon's <strong>for</strong>ests andwoodlands. Draft report prepared <strong>for</strong> <strong>the</strong> Audubon Society, Portland, Oregon66pp.Marshall, D. B. 1988. Status of <strong>the</strong> marbled murrelet in North America: withspecial emphasis on populations in Cali<strong>for</strong>nia, Oregon, and Washington. U.S.Fish and Wildlife Service, Biological Report. 88(30). l9pp.Maser, C., B. R. Mate, J. F. Franklin, and C. T. Dryness. 1981. Natural history ofOregon coast mammals. U.S. Forest Service Gen. Tech. Rep. PNW-133.4 9 6 pp.Maser, C., J. M. Trappe, and D. C. Ure. 1978a. Implications of small mammalmycophagy to <strong>the</strong> management of western coniferous <strong>for</strong>ests. Trans. NorthAm. Wildlife Natural Resources Conference 43:78-88.Maser, C., J. M. Trappe, and R. A. Nussbaum. 1978b. Fungal-small mammalinter-relationships with emphasis on Oregon coniferous <strong>for</strong>ests. Ecology59:799-809.Maser, Z., C. Maser, and J. M. Trappe. 1985. Food habits of <strong>the</strong> nor<strong>the</strong>rn flyingsquirrel in Oregon. Canadian Journal Zoology 63:1084-1085.McComb, W. C. 1991. The role of dead wood in habitat of spotted owl prey ando<strong>the</strong>r old <strong>for</strong>est vertebrates. Report to <strong>the</strong> Nor<strong>the</strong>rn <strong>Spotted</strong> <strong>Owl</strong> <strong>Recovery</strong>Team, Portland, Oregon 57pp.McGarigal, K., R.G. Anthony, and F. B. Isaacs. 1991. Human-eagle interactions on<strong>the</strong> Columbia River estuary. Wildlife Monographs 115. 47pp.McIntyre, J. D. 1983. Differentiation of anadromous salmonid stocks. Pages 9-15in J. Walton and D. B. Houston, eds. Proceedings of Olympic Wild Fish Conference,Port Angeles, Washington.McKeever, S. 1960. Food of <strong>the</strong> nor<strong>the</strong>rn flying squirrel in northwestern Cali<strong>for</strong>nia.J. Mammal. 41:270-71.Mech. 1974. Canis lupus. Mammal Species 37:1-6.Meehan, W. R. 1991. Introduction and overview. Am. Fish. Soc. Spec. Publ. 19: 1-15.Meehan, W. R., F. J. Swanson, and J. R. Sedell. 1977. Influences of riparianvegetation on aquatic ecosystems with particular references to salmonid fishersand <strong>the</strong>ir food supply. Pages 137-145 in R. R. Johnson and D. A. Jones, eds.Symposium, Importance, preservation and management of riparian habitat.U.S. Forest Service Gen. Tech. Rep. RM-43. Rocky Mt. Forest and RangeExperiment Station, Fort Collins, Colorado.Mendenhall, V. M. 1988. Current status and potential threats of <strong>the</strong> marbledmurrelet in Alaska (draft report). In: Proc. of <strong>the</strong> marbled murrelet workshop,Pacific Seabird Group, Pacific Grove, Cali<strong>for</strong>nia.Metter, D. E. 1963. Stomach contents of Idaho larval Dicamptodon. Copeia1963:435-436.406
Metter, D. E. 1968. The influence of floods on population structure of Ascaphustruei Stejneger. J. Herpetol. 1:1-4.Morrison, P. H. 1988. Old-growth in <strong>the</strong> Pacific Northwest: a status report. TheWilderness Society, Washington. D.C. 4 6 pp.Moyle, P. B., J. E. Williams, and E. D. Wikramanayake. 1989. Fish species ofspecial concern of Cali<strong>for</strong>nia. Final report submitted to Cali<strong>for</strong>nia Departmentof Fish and Game, Inland Fisheries Division. Rancho Cordova, Cali<strong>for</strong>nia.Contract No. 7337.Murphy, M. L., and K. V. Koski. 1989. Input and depletion of woody debris inAlaska streams and implications <strong>for</strong> streamside management. North AmericanJournal Fish. Management. 9:427-436.Murphy, M. L., and W. R. Meehan. 1991. Stream ecosystems. American FishingSociety Spec. Publication. 19:17-46.Murphy, M. L., J. Heifetz, S. W. Johnson, K. V. Koski, and J. F. Thedinga. 1986.Effects of clear-cut logging with and without buffer strips on juvenile salmonidsin Alaskan streams. Canadian Journal Fish. and Aquatic Science 43:1521 -1533.Nehlsen, W., J. E. Williams, and J. A. Lichatowich. 1991. Pacific salmon at <strong>the</strong>crossroads: Stocks at risk from Cali<strong>for</strong>nia, Oregon, Idaho, and Washington.fisheries 16:4-21.Nelson, S. K. 1989. Habitat use and densities of cavity-nesting birds in <strong>the</strong> OregonCoast Ranges. M.S. Thesis, Oregon State University, Corvallis. 1 5 7 pp.Nelson, S. K. 1990. Distribution of <strong>the</strong> marbled murrelet in western Oregon. Finalreport. Nongame Wildlife Research Program, Oregon Department Fish andWildlife, Contract 89-9-02. 46pp.Noon, B. R. 1986. Summary: Biometric approaches to modeling - <strong>the</strong> researcher'sviewpoint. Pages 197-202 in J. Verner et al., Wildlife 2000: modeling habitatrelationships of terrestrial vertebrates. University of Wisconsin Press, Madison.470pp:Norse, W. A. 1990. Ancient <strong>for</strong>ests of <strong>the</strong> Pacific Northwest. Island Press, Washington,D.C. 327pp.Nussbaum, R. A. 1970. Dicampntodon copei n. sp., from <strong>the</strong> Pacific Northwest,USA. (Amphibia: Caudata: Ambystomatidae). Copeia 1970:506-514.Nussbaum, R. A. 1976. Geographic variation and systematics of salamanders of<strong>the</strong> genus Dicamptodon Strauch (Ambystomatidae). Misc. Publ. Mus. Zool.University Michigan 149:1-94.Nussbaum, R. A., and C. K. Tait. 1977. Aspects of <strong>the</strong> life history and ecology of<strong>the</strong> Olympic salamander, Rhyacotriton olympicus (Gaige). American MidlandNaturalist 98:176-199.Nussbaum, R A., E. D. Brodie, Jr., and R. M. Storm. 1983. Amphibians andreptiles of <strong>the</strong> Pacific Northwest. Moscow: University of Idaho Press, Moscow332p.407
Oakley, A. L., Collins, J. A., Everson, L. B., Heller, D. A., Howerton, J. C., Vincent,R. E. 1985. Riparian zones and freshwater wetlands. Pages 157-80 tn R. E.Brown, ed. Management of wildlife and fish habitats in <strong>for</strong>ests of westernOregon and Washington. Pacific Northwest Region, U.S. Forest Service PublicationNo. R6-F&WL: 1985.O'Neil, T., and G. Witmer. 1991. Assessing cumulative impacts to elk and muledeer in <strong>the</strong> Salmon River Basin, Idaho. Applied Animal Behavioral Science.29:225-238.Oregon Department of Fish and Wildlife. 1991. Sensitive species list: 17 September1991. Wildlife Division, Portland, Oregon.Oregon Natural Heritage Program. 1991. Rare, threatened and endangered plantsand animals of Oregon. Oregon Natural Heritage Program, Portland, Oregon.64p.Parsons, G. L., G. Cassis, A. R. Moldenke, J. D. Lattin, N. H. Anderson, J. C. Miller,P. Hammond, and T. D. Schowalter. 1991. Invertebrates of <strong>the</strong> H. J. AndrewsExperimental Forest, western Cascade Mountains, Oregon. V. An annotatedlist of insects and o<strong>the</strong>r arthropods at <strong>the</strong> H. J. Andrews Experimental Forest.USDA, Forest Service, Pacific Northwest Forest Experiment Station, TechnicalBulletin 166p.Patla, S. 1991. Nor<strong>the</strong>rn goshawk monitoring project report. Targhee NationalForest, 1989. Contractor's final report. U.S. Forest Service, St. Anthony,Idaho. 52pp.Paton, P. W., and C. J. Ralph. 1988. Geographic distribution of <strong>the</strong> marbledmurrelet in Cali<strong>for</strong>nia at inland sites during <strong>the</strong> 1988 breeding season. FinalReport, Nongame Bird and Mammal Section, Cali<strong>for</strong>nia Department of Fishand Game, Contract FG7569, Sacramento. 35pp.Perry, D. 1991. The ecology of coarse woody debris in Pacific Northwest <strong>for</strong>ests:Overview and <strong>the</strong> role of down logs in ecosystem processes. Report to <strong>the</strong>Nor<strong>the</strong>rn <strong>Spotted</strong> <strong>Owl</strong> <strong>Recovery</strong> Team. U.S. Fish and Wildlife Service, Portland,Oregon 39pp.Raine, R. M. 1982. Ranges of juvenile fisher, Martespennanati and marten,Martes americana, in sou<strong>the</strong>astern Manitoba. Canadian Field Naturalist.96:431-438.Ralph, C. J., S. L. Miller, N. L. Naslund, B. O'Donnell, P.W.C. Paton, and J. Seay.1990. Marbled murrelet research during 1989 in nor<strong>the</strong>rn and central Cali<strong>for</strong>nia.Interim report. Nongame Bird and Mammal Section, Cali<strong>for</strong>nia Departmentof Fish and Game, Sacramento. 39pp.Raphael, M. G. 1988. Long-term trends in abundance of amphibians in Douglas fir<strong>for</strong>ests of northwestern Cali<strong>for</strong>nia. Pages 23-31 in Management of Amphibians,Reptiles, and Small Mammals in North America. Rocky Mountain Forest andRange Experiment Station, General Technical Report. RM- 166.Raphael, M. G. 1985. Administrative study of relationships between wildlife andold-growth <strong>for</strong>est stands. Final Report submitted to USDA, Forest Service,Pacific Southwest Region. Supplement R)-44 under Master Agreement No. 21 -395.408Reynolds, R. T. 1989. Accipiters. Pages 92-110 in B.G. Pendleton, project ed.Proc. of <strong>the</strong> Western Raptor Symposium and Workshop. Institute <strong>for</strong> WildlifeResearch, National Wildlife Federation Science and Technical Series no. 12.
Reynolds, R. T., and H. M. Wight. 1978. Distribution, density, and productivity ofaccipiter hawks breeding in Oregon. Wilson Bulletin 90:182-196.Reynolds, R. T., E. C. Meslow, and H. M. Wight. 1982. Nesting habitat of coexistingAccipiter in Oregon. Journal of Wildlife Management. 46:124-138.Rich, W. M. 1939. Local populations and migration in relation to <strong>the</strong> conservationof Pacific salmon in <strong>the</strong> western states and Alaska. Contribution No. 1, FishCommission, Oregon.Ricker, W. E. 1972. Hereditary and environmental factors affecting certain salmonidpopulations. Pages 19-160 in R. C. Simon and P. A. Larkin, eds. The stockconcept in Pacific salmon. University of British Columbia, Vancouver.Rodway, M. S. 1990. Status report on <strong>the</strong> marbled murrelet Brachyramphusnurmnoratus. Committee on <strong>the</strong> Status of Endangered Wildlife in Canada,Ottawa, Canada 59pp.Rosenberg, D. K., and R. G. Anthony. 1992. Characteristics of nor<strong>the</strong>rn flyingsquirrel populations in young second- and old-growth <strong>for</strong>ests in westernOregon. Canadian Journal Zoology In press.Rosenberg, D. K., and R. G. Anthony. 1990. Abundance of small mammals insecond- and old-growth Douglas-fir <strong>for</strong>ests. Unpubl. report. Oregon Coop.Wildlife Res. Unit, Corvallis. lOpp.Ruggerio, L. E., K. B. Aubry, A. B. Carey, and M. H. Huff, (eds). 1991a. Wildlifeand vegetation of unmanaged Douglas-fir <strong>for</strong>ests. U.S. Forest Service, GeneralTechnical Report. PNW-GTR-285. 533pp.Ruggiero, L. F., L. L. C. Jones, and K. B. Aubry. 1991b. <strong>Plan</strong>t and animal habitatassociations in Douglas-fir <strong>for</strong>ests of <strong>the</strong> Pacific Northwest: an overview. Pages447-462 in Ruggiero et al., eds. Wildlife and vegetation of unmanaged Douglas-fir<strong>for</strong>ests. USDA, Forest Service, Pacific Northwest Research Station,Portland, Oregon. Gen. Tech. Report PNW-GTR-285. 533p.Ruggiero, L. F., R. S. Holthausen, B. G. Marcot, and o<strong>the</strong>rs. 1988. Ecologicaldependency: <strong>the</strong> concept and its implications <strong>for</strong> research and management.Transactions of <strong>the</strong> North American Wildlife and Natural Resources Conference.53:115-126.Sakai, H. F., and B. R. Noon. 1991. Nest-site characteristics of Hammond's andpacific-slope flycatchers in nor<strong>the</strong>rn Cali<strong>for</strong>nia. Condor 93:563-574.Schempf, P. F., and M. White. 1977. Status of six furbearer populations in <strong>the</strong>mountains of nor<strong>the</strong>rn Cali<strong>for</strong>nia. U.S. Forest Service, San Francisco, Cali<strong>for</strong>nia,Unpublished Report. 51pp.Schowalter, T. D., B. A. Caldwell, S. E. Carpenter, R. P. Griffiths, M. E. Harmon, E.R. Ingham, R. G. Kelsey, J. D. Lattin, and A. R. Moldenke. 1991. Decompositionof fallen trees: effects of initial conditions and helerotroph colonizationrates. Pages 371-381 in K. P. King, ed. Tropical ecosystems and management.Wiley Eastern, Ltd.Scrivener, J. C., and M. J. Brownlee. 1982. An analysis of Carnation Creek gravel- quality, data, 1973 to 1981. Pages 154-176 in Hartman, G. F., ed. Proceedingsof <strong>the</strong> Carnation Creek workshop: a ten-year review. Pacific BiologicalStation, Nanaimo, British Columbia.409
Solis, D. M. 1983. Summer habitat ecology of spotted owls in northwesternCali<strong>for</strong>nia. M.S. Thesis, Humboldt State University, Arcata, Cali<strong>for</strong>nia. 169pp.Solis, D. M. and R. J. Gutierrez. 1990. Summer habitat ecology of Nor<strong>the</strong>rnspotted owl in Northwest Cali<strong>for</strong>nia. Condor 92:739-748.Sowls, A. L., A. R. DeGange, J. W. Nelson, and G. S. Lester. 1980. Catalogue ofCali<strong>for</strong>nia seabird colonies. U.S. Fish and Wildlife Service, Biological ServiceProgram, FWS/OBS/80/37. 371pp.Speich, S. M., R. T. Wahl, and D. A. Manuwal. In Press. The numbers of marbledmurrelets in Washington marine waters. Proc. of <strong>the</strong> Western FoundationVertebrate Zoology.Spencer, W. D. 1981. Pine marten habitat preferences at Sagehen Creek, Cali<strong>for</strong>nia.M.S. Thesis, University Cali<strong>for</strong>nia, Berkeley. 121pp.Spencer, W. D., R. H. Barrett, and W. J. Zielinski. 1983. Marten habitat preferencesin <strong>the</strong> nor<strong>the</strong>rn Sierra Nevada. Journal of Wildlife Management.47:1181-1186.Spies, T. A. and S. P. Cline. 1988. Coarse woody debris in <strong>for</strong>ests and plantationsof coastal Oregon. Pages. 5-23 in C. Maser, R. F. Tarrant, J. M. Trappe, and J.F. Franklin (eds.). From <strong>the</strong> Forest to <strong>the</strong> sea: A story of fallen trees. GeneralTechnical Report. PNW-GTR-229, Pacific Northwest Forest and Range ExperimentStation, Portland, Oregon.Spies, T. A. and J. F. Franklin. 1988. Old-growth and <strong>for</strong>est dynamics in <strong>the</strong>Douglas-fir region of western Oregon and Washington. Nat. Areas J. 8:190-201.Stalmaster, M. V. 1987. The Bald Eagle. Universal Books, New York. 227pp.Stebbins, R. C. 1951. Amphibians of Western North America. University of Cali<strong>for</strong>niaPress, Berkeley and Los Angeles, Cali<strong>for</strong>nia. 539pp.Stebbins, R. C. 1985. Peterson field guides: Western amphibians and reptiles.Houghton Mifflin Co., Boston. 336pp.Stevens, L. E., Brown, B. T., Simpson, J. M., Johnson, R. R. The importance ofriparian habitat to migrating birds. Pages 156-164 in R. R. Johnson, and D. A.Jones, tech. coords. Importance, preservation and management of riparianhabitat; a symposium. Gen. Tech. Rep. RM-43. U.S. Forest Service, RockyMountain. Forest and Range Experiment Station, Fort Collins, Colorado.Strickland, M. A., C. W. Douglas, M. Novak, and N. P. Hunziger. 1982. Pages 586-598 in J. A. Chapman and G. A. Feldhammer, eds. Wild mammals of NorthAmerica, biology, management and economics. The Johns Hopkins UniversityPress, Baltimore, Maryland.Swanston, D. N.19:139-179.1991. Natural processes. American Fisheries Society PublicationSzaro, R. C. 1986. Guild management: an evaluation of avian guilds as a predictivetool. Environmental Management. 10:681-688.Thomas, J. W., E. D. Forsman, J. B. Lint, E. C. Meslow, B. R. Noon. and J. Vemer.1990. A conservation strategy <strong>for</strong> <strong>the</strong> nor<strong>the</strong>rn spotted owl. Report of <strong>the</strong>Interagency Scientific Committee to address <strong>the</strong> conservation of <strong>the</strong> nor<strong>the</strong>rn410
spotted owl. U.S. Forest Service, U.S. Fish and Wildlife Service, Bureau ofLand Management, and National Park Service, Portland, Oregon. May 1990.U.S. Government Printing Office. 1990-791-171/20026. 427pp., plus 3maps.Thomas, W. A. 1972. Indicators of environmental quality: An overview. Pages 1-5in W. A. Thomas, ed. Indicators of Environmental Quality. Plenum Press, NewYork, New York.Trappe, J. M. and R. D. Fogel. 1977. Ecosystematic functions of mycorrhizae.Pages 205-214 in The belowground ecosystem: A syn<strong>the</strong>sis of plant-associatedprocesses. U.S. Forest Service, Ser. Publ. No. 26. Colo. State University, FortCollins, Colorado.USDI. 1986. <strong>Recovery</strong> plan <strong>for</strong> <strong>the</strong> Pacific Bald Eagle. U.S. Fish and WildlifeService, Portland, Oregon. 160pp.USDI. 1987. Nor<strong>the</strong>rn Rocky mountain wolf recovery plan. U.S. Fish and WildlifeService, Washington, D.C.USDI. 1990. Draft revised grizzly bear recovery plan. U.S. Fish and WildlifeService, Denver, Colorado.USDA. 1984. Regional guide <strong>for</strong> <strong>the</strong> Pacific Northwest Region. U.S. Forest Service,Pacific Northwest Region. Portland, Oregon.USDA. 1988. Final Supplement to <strong>the</strong> Environmental Impact Statement <strong>for</strong> anAmendment to <strong>the</strong> Pacific Northwest Regional Guide. U.S. Forest Service,Pacific Northwest Region, Portland, Oregon.USDA. 1986. Interim definitions <strong>for</strong> old-growth Douglas-fir <strong>for</strong>ests in <strong>the</strong> PacificNorthwest and Cali<strong>for</strong>nia. Pacific Northwest Research Station, Research NotePNW-447. Portland, Oregon.Ure, D. C. and C. Maser. 1982. Mycophagy of red-backed voles in Oregon andWashington. Canadian Journal Zoology. 60:3307-3315.Vannote, R. L., G. W. Minshall, K. Cummins, J. R Sedell, and C. E. Cushing.1980. The river continuum concept. Canadian Journal Fisheries and AquaticScience. 37:130-137.Voth, E., C. Maser, and M. Johnson. 1983. Food Habits of Aborimus albipes, <strong>the</strong>white-footed vole, in Oregon. Northwest Science 57:1-7.Wake, D. B. and K. P. Yanev. 1986. Geographic variation in allozymes in a "ringspecies", <strong>the</strong> plethodontid salamander Ensatina eschscholtzti of western NorthAmerica. Evolution 40:702-715.Waring, R.H., and J.F. Franklin. 1979. The evergreen coniferous <strong>for</strong>ests of <strong>the</strong>Pacific Northwest. Science 204:1380-1386.Washington Department of Wildlife. 1990. Endangered and threatened speciesstatus report. Washington Department of Wildlife, Olympia, Washington.Washington Department of Wildlife. 1991 a. Species of concern list, nongameprogram, Wildlife Management Division, Olympia, Washington.Washington Department of Wildlife. 199 lb. Management recommendations <strong>for</strong>priority species. Olympia, Washington.411
Washington Natural Heritage Program. 1990. Endangered, threatened and sensitivevascular plants of Washington. Department of Natural Resources, Olympia,Washington. 52p.Welsh, H. H., Jr., and A. J. Lind. 1988. Old-growth <strong>for</strong>ests and <strong>the</strong> distribution of<strong>the</strong> terrestrial herpetofauna. In J. Beatty ed(s) Management of amphibians,reptiles, and small mammals in North America. Rocky Mountain Forest andRange Experiment Station, Gen. Tech. Rep. RM-166:439-458.Welsh, H. H., Jr. 1990. Relictual amphibians and old-growth <strong>for</strong>ests. ConservationBiology 4(3): 309-319.West, S. D. 1991. Small mammal communities in <strong>the</strong> Sou<strong>the</strong>rn WashingtonCascade Range. Pages 269-283 in Ruggiero et al., eds. Wildlife and vegetationof unmanaged douglas-fir <strong>for</strong>ests. USDA, Forest Service, Pacific NorthwestResearch Station, Portland, Oregon. General Technical Report. PNW-GTR-285.533p.Williams, J. E., J. E. Johnson, D. A. Hendrickson, S. Contreras-Balderas, J. D.Williams, M. Navarro-Mendoza, D. E. McAllister, and J. E. Deacon. 1989.Fishes of North America endangered, threatened, or of special concern: 1989.Fisheries (14):2-20.412
Appendix EPreparation ofDCA Management <strong>Plan</strong>s413
414
E.Section III.C.2. of <strong>the</strong> recovery plan discusses proposed management activitieswithin designated conservation areas (DCAs) and provides recommendationsrelated to <strong>the</strong>se activities. Individual DCA management plans will be preparedto address <strong>the</strong>se activities and recommendations, as well as any o<strong>the</strong>r on-<strong>the</strong>groundconcerns affecting nor<strong>the</strong>rn spotted owls.This outline provides in<strong>for</strong>mation <strong>for</strong> preparing DCA management plans. TheDCA description and <strong>the</strong> multiple-use coordination sections address manymanagement activities that may or may not apply to a particular DCA. Componentsof <strong>the</strong>se sections not relevant to an individual DCA should be identifiedas "not applicable."A. Introduction. Provide a clear, written description of <strong>the</strong> DCA, includingan appropriately referenced location map.B. History. Include data on owl status within <strong>the</strong> area, but do notinclude specific nest site locations. Instead, reference files containingadditional data and nest site location maps so this in<strong>for</strong>mation can beaccessed easily.Summarize monitoring data <strong>for</strong> each known activity center to provide<strong>the</strong> following in<strong>for</strong>mation: year, presence, occupancy, and reproductivestatus. Include documentation of owl surveys that do not detect owls,with <strong>the</strong> year, intensity of ef<strong>for</strong>t, and location.C. DCA Description. Provide a description of <strong>the</strong> landscape and <strong>the</strong>factors pertinent to management of <strong>the</strong> area. Such factors mightinclude, but are not limited to:1. General vegetation. Provide type, elevation, aspect, drainages(provide maps).2. Land ownership. Include a breakdown of acreage and a mapby ownership.3. Developments. List and map recreational facilities, roads,and o<strong>the</strong>r factors.4. Fire and fuels. List and map fire history and occurrencesand fuel loading considerations.5. Forest health. List insect and disease concerns and mapareas of known concern.6. Timber management activities. List and map past timberharvest and silvicultural activities.7. Wildlife and fisheries. Describe wildlife and fisheries communitiesin <strong>the</strong> area, <strong>the</strong>ir management history, specific concerns,and opportunities. -8. Sensitive species. List sensitive species in <strong>the</strong> area andproposed management.9. O<strong>the</strong>r uses. List and map any o<strong>the</strong>r management considerationsnot identified earlier, such as:a. Proposed and expected land exchanges.b. Minerals extraction.c. Federal Energy Regulatory Commission (FERC) permitsand applications.d. Research natural areas (RNAs).e. Wild and scenic rivers.415
f. Wilderness.g. Livestock grazing.h. Fuelwood ga<strong>the</strong>ring areas.i. Watershed considerations, including existingand proposed impoundments.D. DCA Management Objectives. Based on <strong>the</strong> recovery plan objectives,owl habitat requirements, and existing habitat conditions within <strong>the</strong>particular DCA, describe site-specific management objectives anddesired future conditions, and provide supporting documentation.Objectives are to be specific enough to guide any silvicultural prescriptionsand provide direction <strong>for</strong> planning o<strong>the</strong>r management activities.Examples of <strong>the</strong> types of management objectives to be included are: 1)identify areas of unsuitable habitat where silvicultural treatment willbe used to facilitate <strong>the</strong> development of suitable habitat, and thusreduce <strong>the</strong> fragmentation of habitat in <strong>the</strong> DCA: 2) identify landexchanges that would provide additional suitable habitat; 3) identifyroads no longer needed that could be closed or rehabilitated; and 4)identify areas of fuels management concerns within and adjacent to<strong>the</strong> DCA. Each management objective will include a map showingwhere <strong>the</strong> management activity will occur in relation to known owlsand habitat.E. Silviculture. A description of <strong>the</strong> silvicultural prescriptions that areappropriate <strong>for</strong> <strong>the</strong> area will be provided. Prescriptions should bedeveloped by silviculturists and wildlife biologists. They will contain<strong>the</strong> level of detail necessary <strong>for</strong> field implementation of those projectsthat would be scheduled during a 10-year planning period, and willinclude <strong>the</strong> following in<strong>for</strong>mation (easily accessible in permanent files):1. Stand descriptions.2. Stand objectives.3. Silviculture prescriptions and systems.4. Site preparation treatments.5. <strong>Plan</strong>ting.6. Release.7. Hardwood management.8. Thinning.F. Risk Assessment. Identify and define <strong>the</strong> risks to suitable habitat orpotentially suitable habitat through an analysis which includes adiscussion of <strong>the</strong> following: wildfire, pathogens, wind, insects, andstand density. Based on <strong>the</strong> analysis, DCA management plan recommendationswill be developed, including prescriptions and implementationplans. These implementation plans will include monitoringstrategies and provide <strong>for</strong> scientific peer review.To assure effective fuels management within <strong>the</strong> DCA, significant fuelaccumulations will be identified and managed through prescribedburning or o<strong>the</strong>r means, as recommended in <strong>the</strong> recovery plan.The DCA management plan should take into account conditions onmatrix lands adjacent to DCAs. Silviculturists and fire specialists willevaluate <strong>the</strong>se lands to determine whe<strong>the</strong>r such conditions pose a fireor windstorm threat to DCA management, and address <strong>the</strong>m in <strong>the</strong>DCA management plan. The DCA management planning process alsoshould highlight matrix-related concerns to be addressed through416
means o<strong>the</strong>r than <strong>the</strong> DCA management plan. For example, it may benecessary to evaluate harvest unit placement and layout to determine<strong>the</strong> effects of future fuels treatment on owls and owl habitat. Basedupon that evaluation, unit location may require modification to meetobjectives of owl management. In addition, proposed prescribed burnsin <strong>the</strong> matrix will be evaluated. Seasonal restrictions and limitationson locations of bums will be imposed as appropriate.G. Salvage. The recovery plan includes guidance <strong>for</strong> salvage of dead treeswithin <strong>the</strong> DCAs. Salvage may occur in those instances when it hasbeen determined through review procedures that salvage is necessaryto reduce or eliminate an adverse effect on owl habitat. The DCAmanagement plan will specify procedures to be followed consistent withrecovery plan recommendations.H. Multiple-Use Coordination. The recovery plan provides recommendationsconcerning a wide variety of activities that already may occur ormay be proposed in DCAs. As applicable, <strong>the</strong>se will be addressed inindividual DCA management plans. A proposed or existing activity canproceed if, through an evaluation process, a detennination is madethat <strong>the</strong> activity complies with <strong>the</strong> recommendations contained in aDCA management plan that has been submitted <strong>for</strong> <strong>for</strong>mal consultationand approved by <strong>the</strong> U.S. Fish and Wildlife Service.The recovery plan recommends <strong>the</strong> evaluation of all proposed activitieswithin a quarter mile of known owl activity centers to determine <strong>the</strong>effects on owl reproductive success. Activities which would disruptbreeding should be prohibited between March 1 and September 1.Aside from this general restriction, <strong>the</strong> DCA management plan willtailor management practices according to <strong>the</strong> existing and potentialimpacts of proposed activities on owl needs and recovery. As noted in<strong>the</strong> recovery plan, it may be necessary to modify or eliminate currentactivities that pose adverse impacts, and impose seasonal or o<strong>the</strong>rappropriate restrictions. Consequently, <strong>the</strong> DCA management planmay require <strong>the</strong> revision of management guidelines, regulations, orprocedures governing particular activities.The following list includes activities most likely to require attention inDCA management plans. Individual plans will address o<strong>the</strong>r concerns,as appropriate to <strong>the</strong> situation in <strong>the</strong> specific DCA.1. Road construction and maintenance.2. Fuelwood ga<strong>the</strong>ring.3. Mining.4. Developments.5. Trail development and maintenance.6. Land exchanges.7. Habitat improvement projects.8. Range facilities.9. Fire suppression and prevention.10. Christmas tree sales.11. Minor <strong>for</strong>est products.12. Recreational uses.13. Research.14. Rights-of-way, contracted rights, easements.417
I. Monitoring.1. Nor<strong>the</strong>rn spotted owls. Monitoring tasks and in<strong>for</strong>mational needswill be defined, consistent with <strong>the</strong> recovery plan's recommendations(section III.C.6). Monitoring of owls will be particularly important inareas where silviculture and salvage activities are implemented.2. Habitat. Habitat in<strong>for</strong>mation should be updated periodically inaccordance with <strong>the</strong> recovery plan's recommendations (sectionIII.C.6). It also should be updated after any significant event (e.g.,wildfire, windstorm) that has <strong>the</strong> potential to alter vegetation.Monitoring of habitat is especially important in areas where silvicultureand salvage are practiced. This monitoring would assess (1)whe<strong>the</strong>r <strong>the</strong> activities were implemented properly, and (2) whe<strong>the</strong>r<strong>the</strong>y produce <strong>the</strong> desired effects on habitat. A monitoring plan <strong>for</strong><strong>the</strong>se activities is a prerequisite to <strong>the</strong>ir implementation.J. Coordination. The management plan must be prepared cooperativelyby all landowners and land managers within <strong>the</strong> DCA. This cooperationis crucial to <strong>the</strong> success of inventory and monitoring ef<strong>for</strong>ts and to<strong>the</strong> appropriate implementation of silviculture, salvage, and riskreduction activities. Mechanisms to assure ongoing coordination mustbe identified in <strong>the</strong> plan.K. References. Include appropriate references as necessary, a list ofNational Environmental Policy Act (NEPA) documents pertaining to <strong>the</strong>area, <strong>the</strong> record of decision, and a brief description of <strong>the</strong> action <strong>for</strong>each DCA management plan.418
Appendix FForest Protection Guidelines<strong>for</strong> <strong>the</strong> Nor<strong>the</strong>rn <strong>Spotted</strong> <strong>Owl</strong>James K. Agee and Robert L. EdmnondsCollege of Forest ResourcesUniversity of WashingtonSeattle, Washington 98195Submitted to <strong>the</strong> Nor<strong>the</strong>rn <strong>Spotted</strong> <strong>Owl</strong> <strong>Recovery</strong> TeamU.S. Fish and Wildlife ServicePortland, OregonNovember 1991419
420
SummaryThe strategy <strong>for</strong> protecting <strong>the</strong> nor<strong>the</strong>rn spotted owl (Strix occidentalis spp.cawina) revolves around large management zones called designated conservationareas (DCAs). Most discussion has centered on slowing or stopping timberharvest activities within such areas and leaving <strong>the</strong>m in "protected" status.However, throughout <strong>the</strong> range of <strong>the</strong> nor<strong>the</strong>rn spotted owl, natural disturbancepatterns have a long history and were sometimes catastrophic, eliminating owlhabitat <strong>for</strong> decades to centuries. In o<strong>the</strong>r areas, disturbances were frequent andof low magnitude, keeping <strong>for</strong>est stands fairly open.This report discusses <strong>the</strong> nature of <strong>the</strong>se historic disturbance patterns, managementeffects on <strong>for</strong>ests over <strong>the</strong> past century, likely impacts of "total protection"attempts, and guidelines intended to reduce probabilities of catastrophic disturbanceduring <strong>the</strong> next century. In producing <strong>the</strong>se guidelines, larger scale issuessuch as global change were not considered. The consequences of globalwarming, <strong>for</strong> example, might affect not only <strong>for</strong>est structure and species compositionbut owl physiology and predator/prey abundance. Our long-term projectionsand recommendations must be qualified in this respect.The range of <strong>the</strong> owl has been divided into three arbitrary 'subregions" <strong>for</strong> <strong>the</strong>purposes of this report (see Figure F. 1). The three subregions defined included<strong>the</strong> West Cascades subregion, <strong>the</strong> Klamath subregion, and <strong>the</strong> East Cascadessubregion. This division was based on groupings of disturbance regimes includingfire, wind, insects, and diseases. Locally significant disturbance factors suchas ice damage along streams or animal damage were ignored, as was volcanicdisturbance. We clearly recognize that <strong>the</strong> descriptions we provide, being thoseof modal conditions, do not represent <strong>the</strong> entire range of conditions across eachsubregion. A gradient of disturbance types and patterns exists on <strong>the</strong> landscape,but could not be summarized easily. Site-specific <strong>for</strong>est protection strategieswill need to be developed by adapting general trends to individual DCAswithin a subregion.The report first describes <strong>the</strong> nature of <strong>the</strong> major disturbance factors, recognizing<strong>the</strong> need to focus on those disturbances likely to remove significant portionsof DCAs in a single or extended event. The probability of such catastrophic disturbanceis summarized in Table F. 1. The risk levels shown are subjective, butindicate some clear trends. The probability of catastrophic disturbance on awide scale is lowest in <strong>the</strong> West Cascade subregion. The Klamath subregion hasa higher probability of catastrophic disturbance, but is somewhat buffered by itswider physiographic and tree species diversity. For insects and diseases, whichoften tend to be one or several tree species-specific, affected species may be replacedby nonaffected species, and quickly replace <strong>for</strong>est structure needed <strong>for</strong>owl habitat. The East Cascades subregion is <strong>the</strong> subregion most at risk, andsignificant catastrophic disturbance already may be underway.A "hands-off" policy is not recommended <strong>for</strong> any of <strong>the</strong> subregions. Managementmay be more passive in some than o<strong>the</strong>rs, but active management is necessaryto preserve spotted owl habitat in all three subregions. A summary of <strong>the</strong> <strong>for</strong>estprotection strategies (Table F.2) indicates that active management will be particularlynecessary in <strong>the</strong> Klamath and East Cascades subregions.Fire suppression in those regions has helped to create a broader landscape patternof multiple-canopied stands with thick understories, thought to be suitable<strong>for</strong> nor<strong>the</strong>rn spotted owl habitat. The <strong>for</strong>est protection strategies recommended421
here will reduce some of that habitat to more effectively protect <strong>the</strong> rest. Such<strong>for</strong>ests, in <strong>the</strong>ir present condition, are also more likely to be catastrophicallydisturbed because of higher physiological stress, caused by increased tree density,higher fire hazard, and higher horizontal and vertical fuel continuity.Recommendations to reduce owl habitat in order to save it may seem a paradox.We believe that such implementation will, in <strong>the</strong> long run, better protectowl habitat than a more short-sighted attempt to continue total protection.Active management in some areas to reduce <strong>the</strong> probability of large-scale catastrophicevents is <strong>the</strong> most rational management direction.Table F.1. Synopsis of catastrophic risk levels fromfour natural disturbance agents in <strong>the</strong> three <strong>for</strong>estsubregions.Disturbance West Klamath EastAgent Cascades Subregion CascadesSubregionSubregionFire Low High HighWind Moderate-Low* Low** LowInsects Low Moderate HighDiseases Low Moderate High'may be high in areas close to <strong>the</strong> coast--may be moderate in areas close to <strong>the</strong> coast422
ITable F.2. Summary of risk (bold capital letters) and <strong>for</strong>est protection guidelines<strong>for</strong> natural disturbance agents within <strong>the</strong> three subregions.DisturbanceAgentFireWindInsectsDiseasesDisturbanceAgentFireWindInsectsDiseasesDisturbanceAgentFireWindInsectsRisk and Forest Protection Guidelinesin <strong>the</strong> West Cascades SubregionLow given aggressive fire control strategy with high level of detection and initial attack.Areas often will have poor access. Generally no treatment of slash recommended. Constrainnatural fire policies in natural areas where owl habitat is defined as <strong>the</strong> primary managementobjective.Moderate with high risk along coast and less inland. Sitka spruce zone highest risk, alongwith fragmented <strong>for</strong>est (areas with high density of patch cuts). Avoid fur<strong>the</strong>r fragmentation,possibly fea<strong>the</strong>r edges of susceptible stands. In windthrow-prone areas where thinningrecommended to increase development of suitable owl structure, generally remove more than30 percent of basal area.Low Salvage of burned or windthrown timber may be needed in some situations to preventinsect population buildup.Low Endemic diseases likely to continue, unlikely to be catastrophic. Some, like mistletoe,may enhance owl habitat.Risk and Forest Protection GuidelinesIn <strong>the</strong> Klamath SubregionHigh except in higher elevation white and red fir zones and along coast in moist coastalredwood. Need a site-specific fuelbreak zone linked with area treatment (underburning aprimary strategy) to reduce potential wildfire severity and extent. This may reduce owl habitatto some extent in treated areas in order to preserve it elsewhere.Low except along coast. Leave windfirm redwood and Douglas-fir in any coastal thinnings ormanipulations; may want to fea<strong>the</strong>r edges of existing fragmented <strong>for</strong>est.Moderate with some fuel treatment after harvest or wildfire to prevent insect populationbuildup. Underburning should eventually result in healthier stands with lower stress levels.Moderate with disease extent likely to increase with continued fire suppression. Higher treespecies diversity tends to buffer impact on owl habitat, however.Risk and Forest Protection GuidelinesIn <strong>the</strong> East Cascades SubregionHigh will need fuelbreak system plus substantial underburning, particularly in lower elevationhabitat, to break up fuel continuity. South aspects a high priority: fewer nest sites <strong>the</strong>re.Subsequent wildfire severity and extent reduced at some cost to existing owl habitat.Low with some increased wind damage expected if total fire suppression continues anddisease continues to increase.High stand density control is imperative on most sites to reduce stocking and stress onexisting stands. Extensive thinning could increase root rot problems. Mortality alreadyoccurring in pine.Diseases High diseases likely to increase in absence of fire. Underburning may help to control somedisease by burning out stumps harboring disease organisms.-f423
424
Table of ContentsI. Introduction ................................................. 427Definition of Suitable Habitat ................................................. 427Selection of Forest wpes ................................................. 428Characteristics of Forest Types of <strong>the</strong> Three Subregions ....................... 429II. Major Natural Disturbance Factors of <strong>the</strong> Region ................................. 431A. Fire ................................................. 432B. Wind ................................................. 433C. Insects ................................................. 433D. Diseases ................................................. 438III. Forest Protection in <strong>the</strong> West Cascades Subregion ............................... 444A. The Natural History of Disturbance ................................................. 444B. Management Effects on Stands ................................................. 451C. Likely Outcome of a TotalProtection Strategy Over <strong>the</strong> Next Century ..................................... 452D. Forest Protection Guidelines ................................................. 453IV. Forest Protection in <strong>the</strong> Klamath Subregion ......................................... 455A. The Natural History of Disturbance ................................................. 455B. Management Effects on Stands ................................................. 458C. Likely Outcome of a TotalProtection Strategy in DCAs over <strong>the</strong> Next Century ......................... 459D. Forest Protection Guidelines ................................................. 460V. Forest Protection in <strong>the</strong> East Cascades Subregion ................................ 463A. The Natural History of Disturbance ................................................. 463B. Management Effects on Stands ................................................. 467C. Likely Outcome of a TotalProtection Strategy over <strong>the</strong> Next Century ...................................... 470D. Forest Protection Guidelines ................................................. 471VI. Conclusions ................................................. 472Literature Cited ................................................. 473425
426
I. IntroductionThe long-term protection of habitat <strong>for</strong> <strong>the</strong> nor<strong>the</strong>rn spotted owl (Strix occidentalisspp. cawuina) revolves around large protected areas called designatedconservation areas (DCAs). This strategy assumes that by protecting fairlylarge blocks of suitable habitat, and spacing <strong>the</strong>se blocks throughout <strong>the</strong> rangeof <strong>the</strong> species, <strong>the</strong>re is a high probability that <strong>the</strong> viability of <strong>the</strong> subspecies willbe maintained. A major assumption of this strategy is that <strong>the</strong> DCAs willperpetually serve as suitable habitat <strong>for</strong> <strong>the</strong> spotted owl. A primary threat to<strong>the</strong> owl to date has been clear-cutting of mature to old-growth stands; <strong>the</strong> DCAstrategy assumes elimination or major reduction in timber removal withinDCAs as well as between <strong>the</strong>m. A primary threat in <strong>the</strong> future <strong>for</strong> establishedDCAs will be <strong>the</strong> probability of damage or destruction by a variety of natural"disturbance agents: fire, wind, insects, and diseases. The purpose of thisreport is to describe <strong>the</strong> nature of <strong>the</strong>se threats, <strong>the</strong> probability of success of atotal protection strategy, and guidelines to increase <strong>the</strong> probability of successfulmaintenance of conditions within DCAs suitable <strong>for</strong> spotted owls in <strong>the</strong> faceof such threats.Definition of Suitable HabitatThe following description of habitat <strong>for</strong> <strong>the</strong> nor<strong>the</strong>rn spotted owl is abstractedfrom <strong>the</strong> proposed critical habitat rules published in <strong>the</strong> Federal Register onMay 6, 1991 (vol. 56, no. 87). The nor<strong>the</strong>rn spotted owl is known from most of<strong>the</strong> major types of coniferous <strong>for</strong>ests in <strong>the</strong> Pacific Northwest. <strong>Spotted</strong> owlsseem to avoid subalpine <strong>for</strong>ests, but have been found as low as 70 feet elevationin <strong>the</strong> Olympic Mountains and as high as 6,000 feet elevation in Cali<strong>for</strong>nia.<strong>Spotted</strong> owls commonly use Douglas-fir (Pseudotsuga mrenziesiO andmixed-conifer <strong>for</strong>ests in Cali<strong>for</strong>nia. In that area habitat tends to be discontinuousin a mosaic pattern. In Washington's coastal <strong>for</strong>ests, <strong>the</strong> spotted owl isfound in <strong>for</strong>ests dominated by Douglas-fir and western hemlock (Tsugaheterophylk4. At higher elevations spotted owls use Pacific silver fir (Abiesamnabilis), while on <strong>the</strong> east side of <strong>the</strong> Cascades, Douglas-fir and grand fir(Abies grandis) are used.The age of a <strong>for</strong>est is not as important a factor in determining habitat suitabilityas are vegetational and structural elements. Components of nor<strong>the</strong>rn spottedowl nesting habitat are: 1) moderate to high canopy closure (60 to 80 percent);a multilayered, multispecies canopy dominated by large (more than 30inches dbh) overstory trees: 2) a high incidence of large trees with various de<strong>for</strong>mities(e.g., large cavities, broken tops, mistletoe infections, and o<strong>the</strong>r evidenceof decadence); 3) numerous large snags; 4) large accumulations of fallentrees and woody debris on <strong>the</strong> ground; and 5) sufficient open space beneath<strong>the</strong> canopy <strong>for</strong> owls to fly (Thomas et al. 1990). Old-growth or mixed speciesstands typically require a minimum of 150 to 200 years to attain <strong>the</strong>se a<strong>for</strong>ementionedattributes. Attributes of breeding and roosting habitat are sometimesfound in younger stands, especially those with remnants of <strong>the</strong> earlierstand that was disturbed by fire, wind storms, inefficient logging operations, orhighgrading. However, nearly all nest and roost sites are found in <strong>the</strong> portionsof <strong>the</strong>se stands with <strong>the</strong> oldest components. In <strong>the</strong> Oregon Coast Ranges, OregonCascades, Washington Cascades, Olympic Peninsula, and Klamath Province,owls use old <strong>for</strong>ests more than expected <strong>for</strong> <strong>for</strong>aging and roosting.427
Selection of Forest TypesAt <strong>the</strong> time this report was prepared, fall 1991, a final set of DCAs was notavailable <strong>for</strong> analysis. There<strong>for</strong>e, we chose three <strong>for</strong>est "subregions" typical of<strong>the</strong> range of conditions found in nor<strong>the</strong>rn spotted owl habitat from Washingtonthrough northwestern Cali<strong>for</strong>nia. Each subregion has a unique <strong>for</strong>est speciescomposition, environment, and mix of disturbance agents. Effects of naturaldisturbance and successful protection scenarios are likely to vary by subregion.This scenario will vary also within subregion, as <strong>the</strong>re is more withinsubregionvariation than can be adequately represented by <strong>the</strong> three "modal"scenarios presented in this report.The first type is <strong>the</strong> wet-cool type including <strong>the</strong> whole of <strong>the</strong> Sitka Spruce (Piceasitchensis) Zone and most of <strong>the</strong> Western Hemlock Zone (Franklin and Dyrness1973), ranging into <strong>the</strong> lower Pacific Silver Fir Zone, with less emphasis on <strong>the</strong>drier plant associations, particularly toward <strong>the</strong> south within <strong>the</strong> WesternHemlock Zone. We call this <strong>the</strong> West Cascades subregion (Figure F. 1). Thesecond type is <strong>the</strong> Mixed-Evergreen/Mixed-Conifer Zone of southwestern Oregon/northwesternCali<strong>for</strong>nia, which we call <strong>the</strong> Klamath subregion. The thirdtype is <strong>the</strong> Grand Fir/Douglas-fir Zone of <strong>the</strong> eastern Cascades, which we call<strong>the</strong> East Cascades subregion. While <strong>the</strong>se are not wholly homogeneous subregions,<strong>the</strong>y encompass <strong>the</strong> range of variability expected in nor<strong>the</strong>rn spotted owlhabitat protection scenarios.Figure F. 1. Generalgeographical range of <strong>the</strong>three subregions defined inthis report. Where subregionsrneet, <strong>the</strong>re is anoverlap that is not representedin thisfgure.E West Cascades |j*.;;/ / S KlamathLf~~~~~~EsCasadeI " I'll ......................... IIIIIIIIIIIII- I - - .1111 I I 11 .1428
Table F.3. Major tree species in <strong>the</strong> region and <strong>the</strong>ir relative importance by subregion.Species West Cascades Klamath East CascadesSitka spruce M mWestern redcedar M MWestern hemlock M MSitka Western Mixed Mixed Douglas- GrandSpruce Hemlock Conifer Evergreen fir FirZone Zone Zone Zone Zone ZoneDouglas-fir m M M M M MPacific silver fir - mPacific madrone m m MTanoak - - MWhite/grand fir - - M m m MPonderosa pine - - M M M mLodgepole pine - - m - m MWestern larch - - - - - MiiM = major species m = minor speciesNote: Not all species in a type are listed Some that are listed above may be classed as absent (-)only (e.g., riparian) or are not widely distributed across <strong>the</strong> type.(adapted from Franklin and Dyrness 1973)because <strong>the</strong>y are present in special environmentsI/Characteristics of Forest Types of <strong>the</strong> Three SubregionsThe general characteristics of <strong>the</strong> <strong>for</strong>est types of <strong>the</strong> Pacific Northwest are welldescribed in Franklin and Dyrness (1973). A skeletal description of <strong>the</strong> subregionsincluded in this report is made to provide a brief context <strong>for</strong> <strong>the</strong> sectionsof <strong>the</strong> report to follow. In <strong>the</strong> West Cascades subregion, nor<strong>the</strong>rn spotted owlsare found in <strong>the</strong> Sitka Spruce Zone, <strong>the</strong> Western Hemlock Zone, and into <strong>the</strong>Pacific Silver Fir Zone, <strong>the</strong> latter of which is not fully described here, althoughsome owls may live in <strong>the</strong>se <strong>for</strong>ests. The Sitka Spruce Zone is a narrow coastalstrip normally a few miles in width, except where it extends up river valleys.Its proximity to <strong>the</strong> ocean and summer fogs, and presence of Sitka spruce(Table F.3), differentiate this zone from <strong>the</strong> Western Hemlock Zone, which hasmany of <strong>the</strong> same species.The Western Hemlock Zone (Table F.3) occurs over much of <strong>the</strong> lowlands westof <strong>the</strong> Cascade Mountains, and is often dominated by Douglas-fir as <strong>the</strong> majorseral tree species; western hemlock is commonly found in all canopy layers inold-growth <strong>for</strong>est. Its upper boundary with <strong>the</strong> Pacific Silver Fir Zone oftencorresponds to <strong>the</strong> line of perennial snowpack in winter months. The portionof <strong>the</strong> Pacific Silver Fir Zone which contains owl habitat also has Douglas-fir asa seral species, but increasingly Pacific silver fir replaces western hemlock as<strong>the</strong> late successional tree dominant. The wetter plant associations may receiveup to 160 inches of annual precipitation, and <strong>the</strong> driest plant associations may429
eceive as little as 25 inches. Discussion of disturbance and <strong>for</strong>est protection<strong>for</strong> this zone is most applicable to <strong>the</strong> wetter plant associations (those withmore than about 60 inches of annual precipitation). The drier western hemlockplant associations are on an environmental gradient toward <strong>the</strong> Mixed-Conifer Zone discussed <strong>for</strong> <strong>the</strong> Klamath subregion, environmentally if not geographically.The Klamath subregion <strong>for</strong>ests include those of <strong>the</strong> Mixed-Evergreen Zone, <strong>the</strong>Mixed-Conifer Zone, and <strong>the</strong> White Fir Zone, <strong>the</strong> latter of which is a moist andcool transition normally above ei<strong>the</strong>r of <strong>the</strong> o<strong>the</strong>r two zones in sou<strong>the</strong>rn Oregonand nor<strong>the</strong>rn Cali<strong>for</strong>nia. Douglas-fir is a common dominant in both <strong>for</strong>esttypes. In <strong>the</strong> Mixed-Conifer Zone, ponderosa pine, white or grand fir, sugarpine (Pinus lanbertnaro)i or incense-cedar (Calocedrus decurrens) may becodominants. In <strong>the</strong> Mixed-Evergreen Zone, madrone (Arbutus menziesll),tanoak (Lithocarpus densiflorus), black oak (Quercus kelloggio, and canyon liveoak (Quercus chrysolepis) are common lower canopy dominants, while in <strong>the</strong>Mixed-Conifer Zone, white fir is commonly <strong>the</strong> lower canopy dominant.The East Cascades subregion includes <strong>the</strong> mid-elevation Douglas-fir andGrand Fir Zones sandwiched between higher elevation subalpine <strong>for</strong>est andlower elevation ponderosa pine <strong>for</strong>ests. In some locations, particularly nor<strong>the</strong>rnWashington, <strong>the</strong> Grand Fir Zone is absent. Douglas-fir tends to be acanopy dominant, sometimes with western larch (Larix occidentalis) and/orponderosa pine (Pinus ponderosa). Grand fir in <strong>the</strong> Grand Fir Zone, and Douglas-firin <strong>the</strong> Douglas-fir Zone, are <strong>the</strong> most shade-tolerant species and maybe well represented in <strong>the</strong> lower canopy layers.fX0). Mied @*.@. Ponderosa----- evergreen.'*...Western *i6.- - |.*.9 .............pine'hemlock a . .... Mixed ,'Douglas-fir: . o . g . . f coniferwoodlnd)Figure F.2. Fire severity regimes of <strong>the</strong> Pac(ficNorthwest. MqJor<strong>for</strong>est types are ordinated ontemperature and moisture axes, and <strong>the</strong>ndefined as high, moderate, or low severityregimes. The types enclosed by <strong>the</strong> stippledpattern are those where <strong>the</strong> nor<strong>the</strong>rn spottedowl isfound0I-0)0)a-E0)-0-Pacific'silver fir wSubalpine<strong>for</strong>estsRedfirMoisture stress indexI- -........ "I'l l, I - ......... 1.1.11, 11-1- ..- I ......................430
II. Major Natural Disturbance Factorsof <strong>the</strong> RegionTraditional <strong>the</strong>ories of disturbance in ecosystems have held that disturbancemust be a major event and must originate outside <strong>the</strong> ecosystem (i.e., be exogenous)(White 1979). We now embrace a much broader concept of disturbance,recognizing a disturbance gradient from minor to major and <strong>the</strong> endogenouscomponent of many disturbances (due ei<strong>the</strong>r to biotic agents orecosystem states that encourage disturbance to occur). As we accept thisbroader concept, we <strong>the</strong>reby create a fuzzier image of disturbance.Disturbance is a difficult word to define. A simple definition is to "interrupt" or"break up a quiet or settled order." Forest ecosystems, we know, are not "quietor settled orders," but when do <strong>the</strong> natural, normal rhythms of <strong>the</strong> systemoscillate to a point where <strong>the</strong>y become "abnormal"? There is no easy answer,but White and Pickett (1985) suggest that disturbance can be defined as ". . .any relatively discrete event in time that disrupts ecosystem, community, orpopulation structure and changes resources, substrate availability, or <strong>the</strong>physical environment." It may be characterized by such descriptors as frequency,magnitude, extent, predictability, synergism, and timing (White andPickett 1985). It may include processes such as <strong>for</strong>est fire, wind, insect, anddisease outbreaks, ice and freeze damage, landslides, floods, and o<strong>the</strong>rs. Disturbanceneed not be ei<strong>the</strong>r a disaster or a catastrophe.In Pacific Northwest <strong>for</strong>ests, <strong>the</strong> primary disturbance factors of concern in DCAprotection are fire, wind, insects, and disease. This report <strong>the</strong>re<strong>for</strong>e focuses on<strong>the</strong>se and omits <strong>the</strong> minor disturbance factors that normally are of limitedextent and major disturbance factors such as volcanoes.I ^-HighFigure F.3. A range offire severity levelsis found within eachfire regime depictedModeratein Figure F.2. The proportion of <strong>the</strong>-s -_ _ svariousfire severity levels are shown by"' o H ~ s / <strong>the</strong> lines of <strong>the</strong> graph. Asfire severity- regimes move on <strong>the</strong> left-to-right gradientfrom low to high, <strong>the</strong> proportion of lowo / 40 4, severityfires decrease while high severity._fires increase. Moderate severityfireso /.;0 peak in <strong>the</strong> moderate severity regime.Q ., 1*/ which is <strong>the</strong> most complexfire regime in. , terms offire effects.Low Moderate HighSeverityType of fire regime- -.......................... - I..431
A. FireThe combination and interaction of fire frequency, intensity, and extent thatoccur in an ecosystem are known as a fire regime. The fire regimes of PacificNorthwest <strong>for</strong>ests span a wide gradient of variation (Agee 1981). Natural fireregimes ranged from infrequent (hundreds of years) stand replacement fires, tovery frequent (several years) low-intensity surface fires that had little effect on<strong>the</strong> canopy trees. The fire regime is a way to syn<strong>the</strong>size <strong>the</strong> effects of fire bycombining many of <strong>the</strong> descriptors listed earlier. Although fire regimes can bedescribed on <strong>the</strong> basis of characters of <strong>the</strong> disturbance itself (Heinselman1981), or character of <strong>the</strong> vegetation (Davis et al. 1980), ano<strong>the</strong>r way is by defining<strong>the</strong> fire regime on <strong>the</strong> basis of fire effects, or severity (Agee 1990). Thesystem using fire severity is defined in terms of fire effects on dominant treespecies, and works well <strong>for</strong> application to owl habitat. For <strong>the</strong> Pacific Northwest,three levels of fire severity are recognized (Figure F.2): high, moderate,and low. Nor<strong>the</strong>rn spotted owls occur in <strong>for</strong>ests subjected to all three fire severitytypes.A high severity fire is one that topkills most of <strong>the</strong> vegetation in <strong>the</strong> stand (70to 80 percent plus of <strong>the</strong> basal area); a moderate severity fire topkills 20 to 70percent; and a low severity fire topkills less than 20 percent of <strong>the</strong> basal area.Fire, in a silvicultural sense, tends to thin from below, first taking smaller treesand/or those less fire-resistant (thin-barked, <strong>for</strong> example). It must be recognizedthat each regime is defined on <strong>the</strong> basis of <strong>the</strong> modal severity but thatfires of o<strong>the</strong>r severity levels are likely to occur as well (Figure F.3). The mostcomplex fire regimes are <strong>the</strong> moderate ones because of <strong>the</strong> mix of expected fireseverities, while <strong>the</strong> low and high fire severity regimes are generally more predictable.Management activities over decades, such as successful fire protection,can change low or moderate severity fire regimes to moderate to high severityfire regimes. Descriptions of fire regimes in later sections of <strong>the</strong> reportwill refer to <strong>the</strong>se severity diagrams.Within <strong>the</strong> DCA system lightning will be <strong>the</strong> largest single source of ignition <strong>for</strong>fires. Lightning is <strong>the</strong> primary source of <strong>for</strong>est fires worldwide, with as manyas 44,000 thunderstorms occurring daily over <strong>the</strong> earth (Trewartha 1968).Thunderstorm activity is relatively mild in <strong>the</strong> Pacific Northwest. While Portland,Oregon, and Tacoma, Washington, average 5 thunderstorm days peryear, and Baker, Oregon, and Walla Walla, Washington, average 10 to 15,sou<strong>the</strong>astern areas such as Mobile, Alabama, average about 75 thunderstormdays per year (Alexander 1924). However, in <strong>the</strong> sou<strong>the</strong>ast only 2 percent ofwildfires are lightning-caused, while in <strong>the</strong> Pacific states 37 percent of ignitionsoriginate from lightning (Taylor 1974). Some lightning storms in <strong>the</strong> PacificNorthwest are very localized and o<strong>the</strong>rs are regional in extent. The regionalstorms can ignite hundreds of fires almost simultaneously and pose <strong>the</strong> greatesttype of fire threat to DCAs. Lightning detection systems can pinpoint where<strong>the</strong> lightning is striking, but crews may not arrive in time to suppress <strong>the</strong> firewhile it is small.In <strong>the</strong> past, human ignitions have been locally significant in <strong>the</strong> West Cascadessubregion, particularly Indian burning of grasslands and oak woodlands (Boyd1986, Teensma 1987, Norton 1979, White 1980). In <strong>the</strong> East Cascade subregion,Indian burning was more common in <strong>the</strong> <strong>for</strong>est (Shinn 1980, Barrett andArno 1982). Today's human ignitions (recreation, logging, debris burningcauses) are partially amenable to management actions through education(Keep Green campaigns) or by limiting access (complete or wea<strong>the</strong>r-relatedroad closures).432
B. WindMost of <strong>the</strong> in<strong>for</strong>mation about wind as a disturbance factor is from coastalareas exposed to <strong>the</strong> Pacific Ocean winds. This area includes <strong>the</strong> Sitka SpruceZone, as defined by Franklin and Dyrness (1973), and <strong>the</strong> adjacent WesternHemlock Zone.The successional dynamics of <strong>the</strong>se coastal <strong>for</strong>ests are complex because of <strong>the</strong>types and intensities of disturbances that have interacted with <strong>the</strong> <strong>for</strong>ests overtime. In <strong>the</strong> absence of disturbance over many centuries, western hemlockand western redcedar (7huja pkcata) would dominate <strong>the</strong> <strong>for</strong>ests of this zone.In <strong>the</strong> presence of major periodic disturbance such as fire, which removes almostall of <strong>the</strong> pre-existing stand, Douglas-fir would initially dominate on uplandsites and red alder (Alnus rubra) would initially dominate on very wetsites, gradually being replaced by hemlock and cedar. Sitka spruce appears tobe a "gap-phase" species capable of regenerating in small openings created bywindthrow or overstory mortality (Hines 1971). Large fires and blowdowns dooccur in spruce-hemlock <strong>for</strong>ests, but smaller scale events may be equally important<strong>for</strong>ces in <strong>for</strong>est stand development (Harcombe 1986).Wind appears to have been <strong>the</strong> most important disturbance factor <strong>for</strong> <strong>the</strong> <strong>for</strong>estsof <strong>the</strong> Sitka Spruce Zone (Ruth and Harris 1979). Most wind-dominatedstands have "pit and mound" topography. It is a hummocky ground topographycaused by uprooting of tree stems by wind, causing <strong>the</strong> pit, and subsequentsloughing of <strong>the</strong> soil material from <strong>the</strong> base of <strong>the</strong> uprooted stem, creating<strong>the</strong> adjacent mound. Usually, <strong>the</strong> prevailing wind direction creates apattern of pits on <strong>the</strong> upwind side and mounds on <strong>the</strong> downwind (direction oftree fall) side. Most recent windthrown trees also are oriented downwind, althoughjackstrawing also may occur.Studies of windthrow in Washington and Oregon suggest most damaging windsare from <strong>the</strong> southwest (Ruth and Yoder 1953, Steinbrenner and Gessel 1956),or occasionally east (Gratkowski 1956). Blowdown is more important on poorlydrained soils (Gratkowski 1956), or where <strong>the</strong> area is oriented across <strong>the</strong> directionof <strong>the</strong> prevailing winds (Moore and McDonald 1974). Species' tolerances towind may be site-specific. Western hemlock and Pacific silver fir are generallyprone to windthrow, western redcedar and Sitka spruce at times may bewindfirm, and Douglas-fir has been described as both wind-tolerant and windsensitive(Boe 1965, Moore and McDonald 1974, Henderson et al. 1989).Dominants in a stand are often more windfirm than intermediate crown-classtrees (Boe 1965, Gordon 1973).The frequency of winds strong enough to affect stand dynamics cannot be determinedwith much accuracy. However, topographic situations suggest thatflat lands or slopes/ridges exposed to <strong>the</strong> southwest will be least sheltered. Inareas where clear-cutting occurs, <strong>the</strong> lee side of <strong>the</strong> patch is most susceptibleto accelerated windthrow. Areas sheltered from <strong>the</strong>se winds will suffer lessblowdown. For example, at Fort Clatsop near Astoria, Oregon, Merriwe<strong>the</strong>rLewis noted on February 15, 1806: ". . . <strong>the</strong> S.W. winds are frequently veryviolent on <strong>the</strong> coast when we are but little sensible of <strong>the</strong>m at Fort Clatsop, inConsequence of <strong>the</strong> lofty and thickly timbered fir country which surrounds usfrom that quarter, from <strong>the</strong> south to <strong>the</strong> N. East" (Thwaites 1905).C. InsectsInsects cause many problems in Pacific Northwest <strong>for</strong>ests and <strong>the</strong>re are thousandsof species (Furniss and Carolin 1977). Only a few, however, have major433
Table F.4. Important <strong>for</strong>est insects in <strong>the</strong> West Cascades, Klamath and EastCascades subregions.Common NameDEFOLIATORSWestern hemlock looperForest tent caterpillarTERMINAL MINERSSitka spruce weevilCausal AgentWest Cascades SubregionLambdina fiscellarialugubrosaMalacosoma disstriaPissodes sitchensisTree SpeciesWestern hemlock mostly,also associated Sitkaspruce, Pacific silverfir and Douglas-firAlderSitka spruceBARK BEETLES, WEEVILS, AND PINHOLE BORERSDouglas-fir beetleHylastes root barkbeetleRoot weevilAmbrosia beetleSilver fir beetleDendroctonus pseudotsugaeHylastes nigricinusPissodes fasciatusSteremnius carinatusPlatypus spp., Gnathotrichusspp., Trypodendron spp.Pseudohylesinus sericeusDouglas-firDouglas-firDouglas-firDouglas-firAll conifersPacific silver fir,western hemlock,Douglas-firSCALES AND APHIDSCooley spruce gallaphidAdelgeES cooleyiDouglas-fir, spruceCARPENTER ANTS AND WOOD BORERSCarpenter antWood borerCampotrbotus pennsylvanicusBupresllids and CerambycidsAll speciesAll conifers434continues-
Pandora mothDouglas-fir tussockmothWestern sprucebudwormBARK BEETLESDouglas-fir beetleMountain pine beetleRed turpentine beetleWestern pine beetlePine engraver beetleFir engraverAmbrosia beetleFla<strong>the</strong>aded fir borerCali<strong>for</strong>nia fla<strong>the</strong>adedborerSCALES AND APHIDSCooley spruce gallaphidColoradia pandoraOrygia pseudotsugataChoristoneura occidentalisDendroctonus pseudotsugaeDendroctonus ponderosaeDendroctonus valensDendroctonus brevicomis/ps spp.Scolytus ventralisPlatypus spp., Gnathotrichusspp., Trypodendron spp.Melanophila drummondiMelanophila cali<strong>for</strong>nicaAdelges cooleyiPonderosa pine, sugar pineDouglas-fir, ponderosapineDouglas-fir, grand firDouglas-firPonderosa, sugar, lodgepole,western white pinesPonderosa, lodgepole, sugar,Jeffrey, western white pinesPonderosa pinePinesTrue firsAll conifersDouglas-fir, true firsJeffrey, sugar,ponderosa pinesDouglas-fir, spruceCARPENTER ANTS and WOOD BORERSCarpenter antWood borerCamponotus pennsylvanicusBuprestids and CerambycidsAll speciesAll coniferscontinued-Common Name Causal Agent Tree SpeciesKlamath SubregionDEFOLIATORScontInues-_____ 435
continued-Common Name Causal Agent Tree SpeclesEast Cascades SubregionDEFOLIATORSDouglas-fir tussockmothWestern spruce budwormLarch sawflyLarch casebearerTERMINAL MINERSWestern pine shootborerOrygia pseudotsugataChoristoneura occidental/sPristiphora erichsoniiColeophora far/celiaEucosma sonomonaDouglas-fir, ponderosapineDouglas-fir, grand fir,larchLarchLarchPonderosa and lodgepolepinesBARK BEETLES AND PINHOLE BORERSDouglas-fir beetleMountain pine beetleRed turpentine beetlePine engraver beetleFir engraverWestern pine beetleAmbrosia beetleSCALES AND APHIDSCooley spruce gallaphidDendroctonus pseudotsugaeDendroctonus ponderosaeDendroctonus valens/Ps spp.Scolytus ventral/sDendroctonus bre vicorn/sPlatypus spp., Gnathotr/chusspp., Trypodendron spp.Adelges cooleyiDouglas-firPonderosa, white, lodgepolepinesPinesPinesTrue firsPonderosa pineAll conifersDouglas-fir, spruceiiBalsam wooly adelgidAdelges piceaeCARPENTER ANTS AND WOOD BORERSCarpenter antCamponotus pennsylvanicusGrand firAll speciesWood borerBuprestids and CerambycidsAll conifersSource- Furniss and carolin (1977), Pettinger and Goheen (1982), Holsten et al (1985), Hagle et al. (1987), Johnson and Lyon (1988). and Partridgeet al (undated)I'll I I I- ,- 11.11 I 11.1.1- 1.1- 1 .....J436
Insects cause many problems in Pacific Northwest <strong>for</strong>ests and <strong>the</strong>re are thousandsof species (Furniss and Carolin 1977). Only a few, however, have majorimpacts on <strong>for</strong>ests. Insects in Table F.4 are listed according to <strong>the</strong>ir activity in<strong>for</strong>ests; e.g., defoliators, terminal miners, bark beetles, aphids and scale insects,and wood borers. O<strong>the</strong>r parts of trees, such as cones, are affected, but<strong>the</strong>se are not included in Table F.4 because <strong>the</strong>y have little impact on <strong>for</strong>eststructure. Note that <strong>the</strong>re are generally fewer insect species having a majorimpact on <strong>for</strong>ests in <strong>the</strong> West Cascades subregion than in <strong>the</strong> o<strong>the</strong>r two subregions.Defoliators and bark beetles are important in <strong>the</strong> East Cascades andKlamath subregions. There, <strong>the</strong>y can create large landscape level disturbancecausing tree mortality over thousands of acres. In <strong>the</strong> West Cascades subregiondisturbances are smaller, but occasionally large epidemics of defoliatorsoccur; e.g., <strong>the</strong> western hemlock looper which had outbreak periods in 1889-1991, 1911-1914, 1929-1932, 1943-1946, and 1961-1963. These outbreaksgenerally occurred in extensive old-growth hemlock stands (Furniss andCarolin 1977).Each insect has its own ecological niche and function in western <strong>for</strong>ests andeach kind of tree is host to many insects. Some tree species, however, aremore attractive to insects than o<strong>the</strong>rs. For example, Pines and oaks are infestedby far more insects than are redwoods and yew. Some insects play amajor role in <strong>the</strong> life cycle and structure of extensive <strong>for</strong>est areas, such as <strong>the</strong>western pine beetle in ponderosa pine <strong>for</strong>ests (Furniss and Carolin 1977). With<strong>for</strong>est harvesting and management many of <strong>the</strong>se insects became destructiveand now are controlled artificially.Most western <strong>for</strong>est insects are native, although a few, such as <strong>the</strong> balsamwooly adelgid, have been introduced. Numbers of insects tend to fluctuatewidely and some periodically become epidemic, such as <strong>the</strong> Douglas-fir tussockmoth and spruce budworm. A number of bark beetle species also has becomeepidemic, especially in drier areas. Fire control practices and early <strong>for</strong>est harvestingpractices in <strong>the</strong> last 75 years are generally thought to have contributedto increases in bark beetle populations by creating populations of stressedtrees. Bark beetles tend to cause <strong>the</strong> highest amounts of insect-related mortality.In healthy ecosystems insects generally remain in small numbers withoutbreaks often precipitated by plant stress (e.g., caused by drought, nutrientdeficiencies, and air pollution). With predicted global climate change, manyplant species could become stressed as temperature and precipitation changebeyond <strong>the</strong>ir tolerance level (Perry and Borchers 1990). This, plus <strong>the</strong> fact thatinsect populations usually grow faster in warmer, drier climates, could lead tolarge outbreaks. However, climate changes may suppress some insects.Defoliating insects cause reduced radial growth and height increment, topkilling,and reduced regeneration; <strong>the</strong>y also sometimes kill extensive stands(Swetnam and Lynch 1989). Heavy defoliation by Douglas-fir tussock moth ofDouglas-fir and grand fir in north central Idaho caused growth of host speciesto decrease 75 to 90 percent in 1 year (Brubaker 1978). Normal growth ratesreturned 3 to 4 years after maximum defoliation, however. Some researchersreport increased radial growth of trees after defoliation (Stoszek 1988.Wickman 1990). Lowest levels of defoliation usually are associated with laterstages of succession (old-growth) (Stoszek 1988).Many of <strong>the</strong> trees killed by bark beetles and defoliators also are being attackedby root diseases and it is sometimes difficult or even impossible to separate <strong>the</strong>effects of insects and diseases, especially in drier <strong>for</strong>est types. Snags and downwood from insect-killed trees increase <strong>for</strong>est-fire hazard but provide importantwildlife habitat.437
D. DiseasesForest diseases in <strong>the</strong> Pacific Northwest are caused mainly by fungi and dwarfmistletoes. Bacteria, viruses, and nematodes also cause diseases but to a minorextent. The major diseases can be classified as foliage diseases, heart rotsor bole decays; stem and branch diseases (cankers, rusts, dwarf mistletoes),root rots; and cone and seed diseases. More recently "decline diseases" havebeen recognized whereby trees tend to decline and slowly die over a period ofyears. Decline usually occurs in areas where chronic levels of air pollution ordrought have induced stress allowing insects and diseases to gain a foothold.Although <strong>the</strong> general types of diseases are similar in <strong>the</strong> West Cascades, Kmamath,and East Cascades subregions, <strong>the</strong> species of fungi and dwarf mistletoestend to change with <strong>the</strong> tree species. Some disease organisms have broad hostranges while o<strong>the</strong>rs have relatively narrow host ranges (Table F.5). There arehundreds of disease organisms in <strong>the</strong>se <strong>for</strong>ests but only <strong>the</strong> most important/Table F.5. Important <strong>for</strong>est diseases in <strong>the</strong> West Cascades, Klamath, and EastCascades subregions.Common Name Causal Agent Tree SpeclesFOLIAGE DISEASESWest Cascades SubregionSwiss needle cast Phaeocryptopus gaumanhi Douglas-firRhabdocline needle cast Rhabdocline pseudotsugae Douglas-firBrown felt blight Herpotrichia nigra True firsCedar leaf blight Didymascella thujina Western redcedarBynum's blight Lophodermella morbida Ponderosa pineROOT ROTSPhellinus root rot Phellinus weiril Douglas-fir, mountainhemlock mostsusceptibleArmillaria root disease Armillaria ostoyae All conifers (Douglas-firmost susceptible)Annosus root and Heterobasidion annosum Western hemlock andbutt rottrue firs mostsusceptibleBlack stain root Leptographium wageneri Douglas-fir mostdiseasesusceptibleRhizina root rot Rhizina undulata Douglas-fir41-38continues-
Common Name Causal Agent Tree SpeciesHEART ROTS AND DECAYSWhite pocket rotAnnosus root andbutt rotVelvet top fungusSulphur fungus(No common name)Red belt fungusPouch fungusArtists conkFalse tinder fungusMISTLETOESWestern hemlock dwarfmistletoeOak mistletoeRUSTSWestern gall rustWhite pine blister rust(introduced)CANKERSPhomopsis cankerFOLIAGE DISEASESElytroderma needle castRed band needle diseaseLohphodermium complexPhellinus piniHeterobasidion annosumPhaeolus schweinitziiLaetoporus sulphureusPoria asiaticaFomes pinicolaCryptoporus volvatusGanoderma applanatumPhelinus ignariusArceuthobium tsugensePhoradendron spp.Endocronartium harknessiiCronartium ribicolaDiapor<strong>the</strong> lokoyaeKlamath SubregionElytroderma de<strong>for</strong>mansDothistroma piniLophodermium pinastriDouglas-firWestern hemlock andtrue firs mostsusceptible,Sitka spruceDouglas-fir, true firsDouglas-fir, spruceWestern redcedarAll dead conifersDead conifersHardwoods, conifersHardwoodsWestern hemlockOaksShore pine, lodgepole pineWestern white pineDouglas-firPonderosa pinePonderosa pineSugar pinecontinued-continues-439
continued-Common Name Causal Agent Tree SpeciesROOT ROTSPhellinus root rotPhellinus weirllDouglas-firArmillaria root diseaseArmillaria ostoyaeAll conifers (Douglasfirand ponderosapine most suscepttible)Annosus root andbutt rotHeterobasidion annosumPonderosa pine mostsusceptible, white firPort Or<strong>for</strong>d cedarPhytophthora lateralisPort Or<strong>for</strong>d cedarBlack stain root diseaseLeptographium wageneriDouglas-fir and pinesHEART ROTS AND DECA YSWhite pocket rotPhellinus piniDouglas-fir, pines,true firsVelvet top fungusPhaeolus schweinitziiDouglas-fir, pines,true firs, incensecedarPocket dry rotPolyporus amarusIncense cedarSulphur fungusLaetoporus sulphureusDouglas-fir, true firs,pines(no common name)Poria sequoiaeCoast redwoodRed belt fungusFomes pinicolaAll dead conifersPouch fungusPolyporus volvatusDead conifersMISTLETOESDouglas-fir dwarfmistletoeArceuthobium douglas/iDouglas-firIWestern dwarfmistletoeSugar pine dwarfmistletoeA. campylopodumA. califomicumPonderosa pineSugar pineTrue fir dwarf mistletoeA. abietinumWhite and grand firIIIncense-cedar mistletoeOak mistletoePhoradendron juniperinumssp. fibocedriPhoradendron spp.Incense cedarOakscontinues-440
continued-Common Name Causal Agent Tree SpeciesRUSTSWestern gall rust Endocronartium harknessfi Shore pine, lodgepolepineWhite pine blister rust Cronartium ribicola Western white, sugar pine(introduced)Incense cedar rust Gymnosporangium libocedri Incense cedarFOLIAGE DISEASESEast Cascades SubregionElytroderma needle castLarch needle blightROOT ROTSPhellinus root rotArmillaria root diseaseAnnosus root andbutt rotTomentosus root rotHEART ROTS AND DECA YSWhite pocket rotVelvet top fungusSulphur fungusIndian paint fungusQuinine conkElytroderma de<strong>for</strong>mansHypodermella laricisPhellinus weirliArmillaria ostoyaeHeterobasidion annosumInonotus tomentosusPhellinus piniPhaeolus schweinitziiLaetoporus sulphureusEchinodontium tinctoriumFomitopsis officinalisPonderosa pineWestern larchDouglas-fir, westernredcedarAll conifers (Douglas-fir and ponderosa pinemost susceptible)Ponderosa pine mostsusceptibleTrue firs, ponderosaand lodgepole pinesDouglas-fir, pines,true firs, larch,hemlock, westernredcedarDouglas-fir, pines,true firs, larch,western redcedarDouglas-fir, true firs,pines, larch, westernredcedarTrue firs, hemlock,western redcedarDouglas-fir, pines,larchcontinues-- 441
continued-Common Name Causal Agent Tree SpeciesCommon NameRed belt fungusCausal AgentFomes pinicolaAll dead conifersPouch fungusMISTLETOESDouglas-fir dwarfmistletoeCryptoporus volvatusArceuthobium douglasiiDead conifers, esp.ponderosa and lodgepolepinesDouglas-firWestern dwarfmistletoeLodgepole pine dwarfmistletoeA. campylopodum Ponderosa pineA. americanum Lodgepole pineLarch dwarf mistletoe A. laricis Western larchOak mistletoe Phoradendron sp. OaksIncense-cedar mistletoeRUSTSPhoradendron juniperinumssp. libocedriIncense cedarWestern gall rust Endocronartium harknessii Shore pine, lodgepolepineComandra blister rustWhite pine blister rustCronartium comandraeCronartium fibicola(introduced)Ponderosa pine,lodgepole pineWestern white pineSource: Bega( 1979), Boyce (1961), Hadfield et al. (1986), Hagel et al. (1987), Hepting (1971), Holsten et al. (1985), Partridge et al. (undated), Pettinger(1982), Sinclair et al (1987), and USDA Forest Service (1983)... I.... I I 1 1 " I' l l442organisms; i.e., those likely to strongly influence <strong>the</strong> structure of <strong>for</strong>ests, arelisted in Table F.5. Most of <strong>the</strong> diseases in <strong>the</strong> region are native. White pineblister rust, however, is introduced and has had a major impact on populationsof five-needled pines.The type of disease typically changes as <strong>for</strong>est succession proceeds (Table F.6).Root rots tend to be more important in <strong>the</strong> early stages of succession whileheart rots and o<strong>the</strong>r decays and dwarf mistletoes tend to be more important inlater stages of succession, especially in old-growth <strong>for</strong>ests. Root rots, however,can be an important disturbance in old-growth <strong>for</strong>ests; e.g., PheUinus weilit in150- to 250-year-old mountain hemlock stands in central Oregon (Waring et al.1987). Franklin et al. (1987) implicate diseases as a major cause of tree mortalityin old-growth <strong>for</strong>ests, especially in <strong>the</strong> West Cascades subregion. Theyare probably a more important cause of mortality than insects in this subregion.
Diseases constitute a major disturbance factor in natural <strong>for</strong>ests. They createhabitat <strong>for</strong> wildlife and contribute to species diversity. Wildlife habitat is createdthrough tree mortality resulting in standing dead snags and down logs. Inaddition, cavities can be easily excavated by animals in living trees with rot.Decay in tree tops also may cause tops to fall during wind storms, creatingnest sites. Fur<strong>the</strong>rmore, parasites such as dwarf mistletoes create witches'brooms and o<strong>the</strong>r abnormal branching patterns that also may be suitable <strong>for</strong>nest sites <strong>for</strong> owls. Dwarf mistletoe-infected trees may be extremely importantsites <strong>for</strong> spotted owls in <strong>the</strong> East Cascades subregion. In <strong>the</strong> West Cascadessubregion spotted owls may utilize dwarf mistletoe-infected trees as well astrees with cavities created by disease organisms. Dwarf mistletoes also mayaffect fire behavior and species succession in some drier ecosystems (Wickerand Leaphart 1976).As a result of tree mortality, gaps are commonly created in <strong>for</strong>ests. These gapsprovide more light to <strong>the</strong> <strong>for</strong>est floor and encourage light-loving understoryplants. Thus, species and structural diversity is increased and <strong>the</strong> rate of <strong>for</strong>estsuccession is increased. Generally, <strong>the</strong> scale of disease disturbance; e.g.,infection centers in stands, is considerably smaller than <strong>the</strong> landscape-sizedisturbances created by bark beetles or defoliators. Most of <strong>the</strong> fungi causingdiseases are decomposer organisms in natural ecosystems. In this role <strong>the</strong>ydecompose organic matter, including woody debris, and cycle nutrients (Waringetal. 1987).7 -Table F.6. Changes in causes and rates of tree mortality during <strong>for</strong>est successionalstages in <strong>the</strong> Douglas-fir region of <strong>the</strong> Pacific Northwest.StagePrevegetative Full Vegetative Closed Tree Mature OldClosure Cover Canopy Forest ForestApproximateperiod0 to 5 5 to 20 20 to 100 100 to 200 >200(years)Mortality Very high High High to Medium to Medium torate medium low lowTypical Environmental Interspecific Intraspecific Pathogens, Wind,mortality stress, competition, competition, wind, pathogens,causes predation, environmental pathogens, competition physiopathogensstress,pathogens,wind logicaldisorderspredationSource: Franklin et al. (1987).443
III. Forest Protection in <strong>the</strong>West Cascades SubregionA. The Natural History of DisturbanceFireIn <strong>the</strong> moist Douglas-fir <strong>for</strong>ests of <strong>the</strong> Coast Range of Oregon, <strong>the</strong> WashingtonCascades, and <strong>the</strong> Olympics, fire return intervals are long (Fahnestock andAgee 1983) and most <strong>for</strong>ests are first-generation post-fire <strong>for</strong>ests less than 750years old. This would suggest a fire return interval somewhat less than 750years. The fire cycle model of Agee and Flewelling (1983), which is based onclimate, could not reproduce a natural fire rotation (essentially a fire cycle) lessthan 3,500 years using 20th Century climate patterns, and even with significantalteration in climate input to <strong>the</strong> model, fire return intervals could only bebrought down to about 900 years. They suggest that perhaps much largerthan average events may have occurred in <strong>the</strong> past (also suggested byHenderson and Peter 1981, <strong>for</strong> <strong>the</strong> sou<strong>the</strong>astern Olympics) as a result of shorttermbut very extreme changes in two or more of <strong>the</strong> climate parameters thatdrive <strong>the</strong> model.Large fires have occurred in <strong>the</strong> historic past (Morris 1934) but our knowledgeof old-growth <strong>for</strong>est establishment dates is so weak as to preclude firm hypo<strong>the</strong>sesabout disturbance pulses of <strong>the</strong> presettlement past. The <strong>for</strong>ests aroundMt. Rainier appear to have had a major fire event about 750 years ago(Hemstrom and Franklin 1982) and similar aged stands have been identified in<strong>the</strong> sou<strong>the</strong>rn and western Olympics (Agee personal observation). A series ofabout 650-year-old and/or 450- to 500-year-old fires is apparent from <strong>the</strong> dataof Henderson and Peter (1981) in <strong>the</strong> sou<strong>the</strong>rn Olympics; Franklin andHemstrom (1981) and Yamaguchi (1986) in <strong>the</strong> sou<strong>the</strong>rn Washington Cascades;and Huff (1984) and legend (Quinault Natural Resources 1983) in <strong>the</strong>western Olympics. Although <strong>for</strong>est age-class data are sparse, <strong>the</strong>se are alsotimes of sunspot minima identified by Stuiver and Quay (1980), using tree-ringanalysis of carbon- 14 activity. If large fire events are associated with <strong>the</strong>seperiods of general global cooling, <strong>the</strong>y may represent periods where alteredsynoptic wea<strong>the</strong>r patterns, particularly during <strong>the</strong> growing season, containedhigher lightning frequency and foehn (east) wind patterns.444In moist Douglas-fir <strong>for</strong>ests, long early seral tree recruitment (e.g., 75 to 100years <strong>for</strong> Douglas-fir) has been documented after disturbance by fire (Franklinand Hemstrom 1981). This pattern is not characteristic of all prehistoric fires.For example, Huff (1984) showed a 60-year recruitment interval <strong>for</strong> a ca. 1465fire in <strong>the</strong> western Olympics, while Yamaguchi (1986) shows that about 95percent of Douglas-fir was recruited within 40 years after a fire in ca. 1300near Mount St. Helens. However, even on <strong>the</strong>se sites <strong>the</strong> regeneration period isdecades long and probably represents some regeneration from trees thatinitially colonized <strong>the</strong> burn and grew large enough to produce viable seed tohelp completely restock <strong>the</strong> stand. Lack of seed source, brush competition,and/or reburns have been identified as factors delaying regeneration on suchsites (Franklin and Hemstrom 1981). Patterns of reburns on <strong>the</strong> Tillamook fireof 1933 at 6-year intervals (1939, 1945, 1951) (Pvne 1982), at Mt. Rainier in<strong>the</strong> late 19th Century, and at <strong>the</strong> sou<strong>the</strong>rn Washington Yacolt burn of 1902(Gray 1990) are evidence <strong>the</strong>se sites will rebum. High surface fire potentialduring early succession in Douglas-fir <strong>for</strong>est was identified by Isaac (1940) as a"vicious cycle" of positive feedback, encouraging rhizomatous bracken fern(Pteridium aqutihnum): this pattern was quantified by Agee and Huff (1987).Given sufficient sources <strong>for</strong> reignition (e.g., <strong>the</strong> original Yacolt and Tillamook
ums and all rebums are thought to have been human-ignited), <strong>the</strong> reburnhypo<strong>the</strong>sis is likely to be true in certain areas. However, it is not clear whe<strong>the</strong>rrebums were a common event prior to European settlement in <strong>the</strong> moistportion of <strong>the</strong> Douglas-fir region.After crown closure, potential surface fire behavior declines, and <strong>the</strong>n graduallyincreases in <strong>the</strong> old-growth seral stage (Agee and Huff 1987). Rebums inroughly 100-year-old stands during <strong>the</strong> late 1400s (Henderson and Peter 1981)may suggest that crown fire behavior independent of surface fuels in <strong>the</strong>sethick-canopied stands may be an additional significant type of fire. Currentknowledge is insufficient to tell.For many years, <strong>the</strong> pattern of stand replacement fire summarized above was aparadigm of fire <strong>for</strong> <strong>the</strong> west side Douglas-fir region. Recent work, particularlyin <strong>the</strong> Oregon Cascades in drier western hemlock plant associations, suggestsa higher fire frequency, and different ecological role, <strong>for</strong> fire in mesic to dryDouglas-fir <strong>for</strong>est, rein<strong>for</strong>cing <strong>the</strong> output of <strong>the</strong> climate-based fire cycle model(Agee 1991 a). A site in <strong>the</strong> western Oregon Cascades (Stewart 1986) near <strong>the</strong>H. J. Andrews Experimental Forest regenerated after a stand replacement firein ca. 1530, but had experienced three partial mortality fires since <strong>the</strong>n, in ca.1660, 1860, and 1890. Some of <strong>the</strong>se were in <strong>the</strong> settlement period and probablyreflect human-caused fires of that period, but <strong>the</strong> partial mortality associatedwith <strong>the</strong>m is significant. Over a broader area several miles to <strong>the</strong> sou<strong>the</strong>astencompassing similar <strong>for</strong>est types, Morrison and Swanson (1990) suggesta natural fire rotation of 95 to 145 years over <strong>the</strong> last 5 centuries, well belowthat of <strong>the</strong> moist Douglas-fir <strong>for</strong>ests of Washington. The patchiness of at leastsome of <strong>the</strong> fires is illustrated by <strong>the</strong> fire severity maps in Morrison andSwanson (1990). A similar fire regime was noted by Means (1982) on dry Douglas-firsites in <strong>the</strong> western Oregon Cascades and by Agee and Dunwiddie(1984) <strong>for</strong> dry Douglas-fir <strong>for</strong>ests in Washington's San Juan Islands. Ano<strong>the</strong>rfire history analysis was completed by Teensma (1987) near <strong>the</strong> area studiedby Morrison and Swanson. Using conservative methods that did not recognizeunderburns with no resulting regeneration or substantial fire-scarring of trees,Teensma estimated a natural fire rotation of 100 years over <strong>the</strong> last 5 centuries.If fires of moderate severity are removed from <strong>the</strong> analysis, a stand-replacementmean fire return interval is 130 to 150 years, suggesting that intensefires are a significant part of <strong>the</strong> natural fire regime in this area, but thatfires of lower severity also occur. O<strong>the</strong>r stands of 500 years age or older existwithout much evidence of recurrent fire.These studies indicate that a variable fire regime with shorter fire return intervalsthan moist Washington Douglas-fir <strong>for</strong>ests occur in <strong>the</strong> central OregonCascades, and in o<strong>the</strong>r mesic to dry Douglas-fir <strong>for</strong>ests. It is, in a sense, atransitional area to <strong>the</strong> Klamath subregion in terms of fire history.Huff (1984) has summarized <strong>the</strong> species response to disturbance regimes <strong>for</strong>moist Douglas-fir <strong>for</strong>ests. If fire is absent <strong>for</strong> 700 to 1,000 years on wet sites,Douglas-fir will drop out of <strong>the</strong> stand, and western hemlock, Pacific silver fir,or western redcedar will be <strong>the</strong> primary seed source <strong>for</strong> post-fire regeneration.On sites with fire return intervals in <strong>the</strong> 300- to 600-year range, well within<strong>the</strong> longevity of individual Douglas-fir, mixed dominance of Douglas-fir andwestern hemlock or Pacific silver fir will result from a typically severe standreplacement fire (Figure F.4). By age 200+years, <strong>the</strong> characteristics of oldgrowthare almost always present. The Douglas-fir component, having developedafter <strong>the</strong> previous centuries-old fire, provides <strong>the</strong> large live tree criterion.Both Douglas-fir and <strong>the</strong> more dense western hemlock begin to supply <strong>the</strong>large log component as <strong>the</strong>y begin to die from suppression, disease, orwindthrow.445
120 100200 500I~~~~.K446Figure F.4. A stand development sequence <strong>for</strong> <strong>the</strong> moist western hemlock/Douglas-fir type. Stand age is shownabove each stage, and begins after a total crown scorch fire event. Old-growth character begins between 100 and 200years and is maximized in <strong>the</strong> 500-year stand.-... I I 11 ...-............... I.. ...- .- I I I - - ..
WindLocal situations away from <strong>the</strong> coast may be associated with substantial winddamage over time. Forests on <strong>the</strong> lee side of Mt. Rainier, <strong>for</strong> example, in <strong>the</strong>White River drainage, appear to have been damaged by winds over past centuries.Trees in <strong>the</strong> Columbia River gorge area north to at least Mount St. Helensand south to Mt. Hood are "flagged" because of strong easterly winds whichdesiccate foliage on <strong>the</strong> upriver sides of <strong>the</strong> trees. North or east winds, such asoccurred in Puget Sound during December 1990, occasionally are associatedwith substantial windthrow.At Cascade Head, an exposed headland near Otis, Oregon, Harcombe (1986)found that small-scale events have a larger impact on <strong>the</strong> <strong>for</strong>est than largescaleblowdowns, comparing <strong>the</strong> canopy turnover time of 119 years from smallscaleevents to 384 years <strong>for</strong> blowdown from large-scale events (i.e., time <strong>for</strong> anarea equal to <strong>the</strong> <strong>for</strong>est area to blow down from ei<strong>the</strong>r type of disturbance). Infact, small- and large-scale blowdown can occur. Basing long-term windthrowreturn intervals on 50 years of record, as Harcombe does, is not a very reliablemethod of prediction <strong>for</strong> such an episodic disturbance.In <strong>the</strong> Olympic Mountains, Henderson et al. (1989) suggest that wind is mostimportant in <strong>the</strong> coastal zones (Figure F.5). Substantial blowdowns have occurredin 1979 (Hood Canal Storm), 1962 (Columbus Day Storm), and 1921(Boyce 1929). Stand-level in<strong>for</strong>mation from ridgeline stands in <strong>the</strong> westernOlympics suggests o<strong>the</strong>r wind-associated events in <strong>the</strong> late 1880s and early1850s (Agee, unpublished data). Although each event did not affect <strong>the</strong> entirearea, a return interval of about 30 years <strong>for</strong> major wind disturbances seems tobe operating in this area. The Columbus Day Storm also affected o<strong>the</strong>r standsthroughout <strong>the</strong> subregion but to a lesser extent and generally in sensitive topographicsituations (such as saddles).(Few fires, 40wind Low frequency +tires #*** High frequency& ftiresFigure F.5. Map of Olympic Peninsula showing<strong>the</strong> relationship between groups of environmentalzones and<strong>for</strong>estfirefrequency.I 1-1 .....I. ..... I... .111.1... I.......... I I I.. 11.1.-... I.." I .447
InsectsDiseasesInsects in this subregion usually act as secondary agents of disturbance aftermajor disturbances caused by fire and wind. Insects tend to have less influencein this subregion because physiological stress from drought and o<strong>the</strong>rcauses is relatively low.After fire Douglas-fir beetles will attack weakened trees and freshly down trees.Ambrosia beetles will also attack boles of standing dead and down conifers.Trees weakened by root diseases, particularly by Phellinus weiriL, are very susceptibleto Douglas-fir beetle attack.Occasional outbreaks of <strong>the</strong> western hemlock looper in extensive old-growthhemlock stands have occurred every 15 to 20 years from <strong>the</strong> 1890s to <strong>the</strong>1960s, but no o<strong>the</strong>r insects have caused large scale defoliation. Sitka spruceweevil causes leader de<strong>for</strong>mation in young trees (Furniss and Carolin 1977).Sitka spruce tends to be least impacted by weevils in <strong>the</strong> fog zone along <strong>the</strong>coast and up major river valleys. Outside this zone it is commonly attacked by<strong>the</strong> Sitka spruce weevil.Diseases, especially root rots, stem decays, and dwarf mistletoes, in <strong>the</strong> WestCascades subregion appear to be a greater agent of disturbance than insects.Foliage diseases, stem cankers, and rusts play a minor role. Diseases appearto occur in a relatively random pattern across <strong>the</strong> landscape, although somesite factors such as moisture no doubt influence disease expression. Theyhave considerable influence on <strong>for</strong>est succession and biodiversity. Manydiseases have specific hosts such as Douglas-fir. Thus, diseases can changespecies composition in affected stands.After a large-scale stand-replacement fire (Figure F.6, A-C) Douglas-fir tends toinvade sites except in wetter areas near <strong>the</strong> coast. In <strong>the</strong> early stages ofsuccession where Douglas-fir dominates, root diseases are important causes ofmortality. Rhizina root rot can be important in <strong>the</strong> seedling stage. Phellinusweirit is important from about age 15 to 125 years (Childs 1970) whileArmillaria ostoyae is most important from about age 5 to 25 years (Hadfield etal. 1986). These ages are relative since in many cases <strong>the</strong> actual establishmentperiod in natural stands may be as long as 20 years. In old-growth <strong>for</strong>ests,butt and bole decay fungi dominate although root rots are still present and cancontribute to mortality. Dwarf mistletoes are not important in <strong>for</strong>ests dominatedby Douglas-fir because it is rarely attacked west of <strong>the</strong> Cascade crest(Bega 1979). As <strong>the</strong> hemlock component increases with succession, dwarfmistletoes also increase.In drier areas of <strong>the</strong> West Cascades subregion away from <strong>the</strong> coast, fires arenot always of stand-replacement intensity. Such fires may not kill large, oldDouglas-fir trees, and <strong>the</strong>se fires typically create uneven-aged stands.Rhizina undulata is a fire-loving fungus. Dormant spores in <strong>the</strong> soil germinateonly in <strong>the</strong> presence of heat from fires. The fungus is only active <strong>for</strong> a fewyears after fire <strong>the</strong>n it once again goes dormant (Morgan and Driver 1972).Plellinus weirii tends to create large expanding root rot centers. Northwesternconifers appear to vary in <strong>the</strong>ir susceptibility to P. weirii (Hadfield et al. 1986).Douglas-fir and true firs are highly susceptible. Western hemlock and Sitkaspruce are intermediately susceptible (infected but seldom killed). Westernwhite pine (Pinus monticola) and western redcedar are tolerant or resistant. All448
f I,Inland Douglas-fir/western hemlockA. Root rots, especially caused by P. weirii,kill young Douglas-fir allowing shade tolerantand less disease susceptible western hemlockand western redcedar in <strong>the</strong> understory to growin disease pocket. Decay fungi becomeimportant later in older stands.A:NStand replacement fireB. Root rots kill young Douglas-fir. Hardwoodspecies, such as red alder, vine maple, andbigleaf maple occupy <strong>the</strong> pocket. As diseaseinoculum is reduced Douglas-fir can growin <strong>the</strong> pocket. Western hemlock also will grow.C. Root rots kill young Douglas-fir. Brush speciesoccupy pocket <strong>for</strong> many years until inoculum isreduced and Douglas-fir can grow in <strong>the</strong> pocket.Western hemlock also will grow.Coastal western hemlockD. Wind is a major factor. Dwarf mistletoes anddecay fungi (butt and stem decay) stronglyinfluence <strong>for</strong>est structure.IL1LFigure F.6. Typical <strong>the</strong>oretical successional sequences involving fire (A-C), wind (D), and diseases in <strong>the</strong> West Cascadessubregion.449
__hardwoods are immune. Shade tolerant species in <strong>the</strong> understory which areless susceptible to P. weini, such as western hemlock, are usually favored thusspeeding up succession (Figure F.6A). In some cases, especially in very youngstands, hardwoods such as vine maple (Acer circinatunm), big leaf maple (Acerniacrophyllutm, and red alder (Alnus rubra) may establish in P. weirti pockets(Figure F.6B). These species are immune to P. weiiii and this process effectivelysets succession back in time. Brush species also may establish in diseasepockets devoid of trees (Figure F.6C). Thus P. weirti can create significantspecies and structural diversity at <strong>the</strong> landscape level.The spread of P. weirir is almost exclusively by vegetative growth along root contactsbetween neighboring trees. Spread by spores is rare (Hadfield et al.1986). Clones of P. weu-i can occupy <strong>the</strong> same relative location on <strong>the</strong> landscape<strong>for</strong> 1,000 or more years moving very slowly (12 inches per year: Dickman1984). Tree species change is associated with spread of <strong>the</strong> infection center.The fungal clone usually is not destroyed by fire since it resides in large woodyroots and <strong>the</strong> base of trees. It also infects old-growth trees, but large, old treesoften survive infection <strong>for</strong> many years. Production of adventitious roots assiststhis process. In an old-growth stand dominated by Douglas-fir in <strong>the</strong> OregonCoast Range, Tkacz and Hansen (1982) estimated that 19 percent of <strong>the</strong> susceptiblespecies were healthy, 30 percent were live and infected, 36 percentwere killed by <strong>the</strong> fungus, and 15 percent were killed by o<strong>the</strong>r causes. There isno doubt some degree of genetic resistance to <strong>the</strong> fungus exists and someclones appear more pathogenic than o<strong>the</strong>rs (Driver and o<strong>the</strong>rs 1972). Afterfire, P. weirii can stay alive in large woody root systems <strong>for</strong> as long as 100years, thus influencing <strong>the</strong> structure of <strong>the</strong> post-fire stand.The area of western Oregon and Washington heavily infected by P. weirli isestimated to be about 10 percent (Hansen and Goheen 1989). Clones of P.weirti however, are not distributed evenly across <strong>the</strong> landscape. The incidenceof P. weirii seems to be higher on moisture and/or nutrient stressed sites. Incidenceappears to be higher in sites with dry gravelly soils and or lower rainfalland ridges and upper slopes (Kastner 1991). Disease incidence is not stronglyrelated to aspect. P. weirti incidence seems to be particularly high in <strong>the</strong> PugetSound region, <strong>the</strong> Cascade Mountains foothills, <strong>the</strong> Oregon Coast range, andmountain hemlock (Tsuga mertenstana) <strong>for</strong>ests of <strong>the</strong> Oregon Cascades.Armrllaria ostoyae attacks a wider range of conifers than P. wetit, but in thissubregion it is not thought to be as important as P. weiriL It usually does notoccur in large pockets but attacks individual or small clusters of trees. Thesetrees are usually under environmental or competitive stress. Mortality causedby Armlllaria seldom occurs in stands older than 25 years west of <strong>the</strong> Cascadecrest unless <strong>the</strong> trees are undergoing extreme stress. Occasionally trees onvery moist sites are attacked. Armnilaria also may attack Douglas-fir alreadystressed by P.RweiriLBlack stain root disease has become important in young-growth managedstands in sou<strong>the</strong>rn Oregon, but <strong>the</strong> role of this disease in older <strong>for</strong>ests and<strong>for</strong>est succession is not known at this stage. In later stages of succession, buttrot and bole decay become increasingly important as shown in Figure F.6 A-C.Dwarf mistletoe is also important in areas with a lot of western hemlock.In coastal areas where western hemlock and Sitka spruce dominate, and wherewind is <strong>the</strong> primary disturbance ra<strong>the</strong>r than fire, root rots do not seem to be asimportant as <strong>the</strong>y are in Douglas-fir dominated <strong>for</strong>ests (Figure F.6D). Incoastal <strong>for</strong>ests decay fungi tend to be <strong>the</strong> dominant disturbance agents alongwith hemlock dwarf mistletoe. Heterobastdion annosum is <strong>the</strong> dominant diseaseorganism in western hemlock, and commonly acts as butt and root rot.Trees do not seem to develop significant butt rot until <strong>the</strong>y are more than 100450
years old. A successional sequence involving dwarf mistletoes and decay fungiin coastal western hemlock <strong>for</strong>est is shown in Figure F.6D. Dwarf mistletoesstrongly affect tree growth and branch habit, but usually do not cause muchmortality. Trees in <strong>the</strong> coastal area tend to grow to large sizes and ages, especiallyin areas protected from high winds. They typically have considerabledefect caused by diseases; large and irregular branches, dead tops andbranches, broken tops and snags created by wind, butt rot and decay fungi.Arrnillaria root rot may contribute to whole tree blowdown in old-growth <strong>for</strong>ests.B. Management Effects on StandsStand manipulation in <strong>the</strong> West Cascades subregion has occurred since <strong>the</strong>1850s, when <strong>the</strong> first extensive logging began in <strong>the</strong> Douglas-fir region (Ficken1987). Management effects on stands still in a "natural" condition include firesuppression effects, of cutting pattern on adjacent stands, and <strong>the</strong> spread ofinsect and disease problems.Fire protection in most areas became effective only after 1910. With naturalfire return intervals in <strong>the</strong> hundreds of years, <strong>the</strong> effect of 80 years of successfulfire exclusion has been minimal. In <strong>the</strong> remote and rugged Olympic Mountains,Agee and Flewelling (1983) estimated that park fire protection this centuryhad "saved" only several thousand acres. Many of <strong>the</strong> stands in <strong>the</strong>subregion would not have burned even if fire protection had not been in place,but protection has had subtle effects on <strong>the</strong> mosaic of age classes present.This subtle effect on <strong>the</strong> landscape has been overwhelmed by <strong>the</strong> effects ofclear-cutting in <strong>the</strong> subregion.Escaped slash fires have been an important component of recent wildfire acreagein <strong>the</strong> West Cascades subregion. For example, of <strong>the</strong> 14 major fires in <strong>the</strong>Mt. Hood National Forest in 1960-75, all started or gained momentum in loggingslash (Dell 1977, Deeming 1990). Debris burning was responsible <strong>for</strong>about 15 percent of wildfire acreage in Oregon and Washington in 1960-80(Agee 1989). Recent declines in area slash burned, due to air quality restrictions,as well as very large fires from o<strong>the</strong>r causes in <strong>the</strong> 1980s, may likelyreduce <strong>the</strong>se percentages in <strong>the</strong> future.The effects of management on wind have been to accelerate windthrow alongsusceptible edges where clear-cuts border protected <strong>for</strong>est. For example,Ruediger (1985) noted that blowdown adversely affected small owl managementareas on <strong>the</strong> Gif<strong>for</strong>d Pinchot National Forest, particularly in locationswhere <strong>the</strong> <strong>for</strong>est was fragmented by timber harvesting. On <strong>the</strong> Bull Run watershednear Portland, Oregon, 43 percent of large blowdown areas after a 1973storm and 81 percent after a 1983 storm were associated with boundaries ofexisting clear-cuts and roads (Franklin and Forman 1987).Management of stands in <strong>the</strong> West Cascades subregion has had considerableinfluence on diseases and a lesser influence on insect populations. The Sitkaspruce weevil strongly influences <strong>the</strong> successful establishment of Sitka spruceplantations. Populations of <strong>the</strong> Douglas-fir beetle probably have increasedslightly as a result of logging but not usually to epidemic proportions. However,root diseases, especially Phellinus root rot, appear to have increased considerablyas more and more of <strong>the</strong> landscape has been converted to younggrowthDouglas-fir <strong>for</strong>ests. Stumps created by logging harbor <strong>the</strong> fungus,allowing it to remain viable (Tkacz and Hansen 1982, Thies 1984). Manyyoung plantations of Douglas-fir are now at risk. Management activities suchas thinning seem to have increased <strong>the</strong> incidence of Armillaria and black stainroot disease. Reducing <strong>the</strong> variety of tree species in <strong>for</strong>ests tends to promote451
pests (Schowalter 1988). Black stain disease has spread dramatically in Douglas-firmonocultures where nonhost trees are not available to interrupt transmissionof <strong>the</strong> pathogen. Fertilization has been practiced widely but as yet <strong>the</strong>impact on root diseases seems small. Foliage diseases also appear to haveincreased but not to epidemic proportions.C. Likely Outcome of a Total Protection StrategyOver <strong>the</strong> Next CenturyFireWindInsectsTotal protection in <strong>the</strong> context of this section is defined as 'hands-off" managementwithin habitat conservation areas (DCAs) <strong>for</strong> <strong>the</strong> next 100 years.The West Cascades subregion has <strong>the</strong> highest probability of a successful firesuppression strategy <strong>for</strong> DCAs. Mature to old-growth <strong>for</strong>ests have a low surfacefire behavior potential (Agee and Huff 1987). Severe fire wea<strong>the</strong>r is usuallyshort-lived (Pick<strong>for</strong>d et al. 1980, Huff and Agee 1980). The area of greatestconcern is <strong>the</strong> Columbia Gorge area, where severe east winds can cause fires tomove rapidly. DCAs in this area (Gif<strong>for</strong>d Pinchot and Mt. Hood National Forests)still have a high probability of successful protection, but <strong>the</strong> area has ahistory of large fires (Gray 1990). While <strong>the</strong> chance of protection is high, and<strong>the</strong> probability of a large fire in a DCA is low, over <strong>the</strong> next 50 to 100 years,portions of some DCAs are likely to bum. There remains <strong>the</strong> possibility that alarge fire complex caused by extremely unusual lightning or east wind eventscould occur, but <strong>the</strong> probability of this occurring in <strong>the</strong> next 50 to 100 years isunknown and likely beyond management control. Global climate change, if itcreates more ignition or increases fire behavior potential, may alter fire disturbancepatterns.Within <strong>the</strong> coastal Sitka Spruce Zone, large-scale windthrow events are likely tooccur several times a century. Within exposed areas (see Figure F.5) substantialblowdown potential exists. The "biological legacy" of green trees left by <strong>the</strong>1921 windstorm on <strong>the</strong> western Olympic Peninsula has allowed rapid habitatrecovery to <strong>the</strong> point that spotted owls now inhabit <strong>the</strong>se stands (North, pers.comm.). It is not clear whe<strong>the</strong>r such habitation by owls is recent, or whe<strong>the</strong>r itcontinued through and after <strong>the</strong> blowdown event, or recovered decades later.In <strong>the</strong> transitional areas between primarily wind-dominated and primarily firedominatedareas (see Figure F.5, <strong>the</strong> Olympic Peninsula), similar windthrowevents are likely in <strong>for</strong>ests at <strong>the</strong> edge of cleared <strong>for</strong>est or in <strong>for</strong>est patches interspersedwith clear-cut patches. In more inland areas, more localized impactsfrom wind are likely. Large, unbroken old-growth <strong>for</strong>ests are not likely tosuffer severe impacts from wind, while more fragmented areas may suffer severeblowdown (Ruediger 1985, Franklin and-Forman 1987).Insects have not proved to be a major problem in <strong>the</strong> West Cascades subregion.The chance of protection from catastrophic insect attacks in DCAs is high except<strong>for</strong> <strong>the</strong> occasional outbreaks of defoliators such as <strong>the</strong> western hemlocklooper. Large hemlock looper outbreaks probably will not occur until largeareas of older hemlock <strong>for</strong>ests are restored. O<strong>the</strong>r insects such as <strong>the</strong> Douglasfirbeetle may increase if large fires or large areas of blowdown occur.452
DiseasesIt will be difficult to completely protect DCAs from diseases. Many diseases,especially decay organisms and dwarf mistletoes, are desirable in terms of creatingowl habitat. While removal of infected western hemlock trees is desirable<strong>for</strong> timber production, retention of some infected trees in managed stands willallow development of dwarf mistletoe trees in <strong>the</strong> future. Young trees may beprotected from wounding to prevent entry of decay organisms, but eventuallymost trees will develop decay if <strong>the</strong>y are left <strong>for</strong> more than 100 years. Oldertrees are much more likely to have substantial decay columns, especially whitewood species like western hemlock, Sitka spruce, and true firs.D. Forest Protection GuidelinesFireIntensive presuppression, detection, and initial attack, with high priority <strong>for</strong>suppression <strong>for</strong>ces, are <strong>the</strong> most prudent course in <strong>the</strong> West Cascades subregion.This region is moist, and severe fire wea<strong>the</strong>r usually persists only <strong>for</strong>several days at a time. Fire suppression records in 1950-80 (Hardy 1983) showthat <strong>the</strong> average size of Class E and larger fires (300+ acres) was relativelysmall in national <strong>for</strong>ests primarily in this subregion: Olympic (897 acres),Mt. Baker-Snoqualmie (458 acres), Gif<strong>for</strong>d Pinchot (1,458 acres), Mt. Hood(2,423 acres), and Siuslaw (none), in contrast to east side national <strong>for</strong>ests,which averaged More than 2,500 acres <strong>for</strong> Class E+ fires. The Gif<strong>for</strong>d Pinchotand Mt. Hood <strong>for</strong>ests, with <strong>the</strong> largest averages in <strong>the</strong> subregion, have east sideacreage and have <strong>the</strong> Columbia Gorge wind influence. Of course, larger fireshave occurred within historical time in <strong>the</strong> subregion, and <strong>the</strong>re is a chance ofa series of large fires in this subregion similar to what apparently occurred in<strong>the</strong> past. Never<strong>the</strong>less, an aggressive fire control strategy appears to have ahigh chance of success here.The primary fire severity level in this subregion is high (Huff 1984, Yamaguchi1986, Gray 1990) so that stands burned are likely to be unsuitable <strong>for</strong> owls <strong>for</strong>decades to a century, assuming that snags and any residuals are not salvaged.In wilderness areas and national parks, a prescribed natural fire policy may bein place. If owl habitat is a primary management constraint, prescribed naturalfire zones should exclude DCAs and should include an intervening bufferbetween <strong>the</strong> DCA and <strong>the</strong> prescribed natural fire zone.If manipulation of stands is mandated (some portion clear-cut or partial cut),<strong>the</strong> use of fire to reduce hazard should be considered in a minority of cases,generally on <strong>the</strong> drier, more fire-prone sites. First, <strong>the</strong> risk of escaped firesexists (Dell 1977), although fire behavior usually is reduced once <strong>the</strong> fire entersadjacent uncut stands. Secondly, fuel hazards in untreated slash decline tolevels similar to treated slash over a short time frame. Burning slash in <strong>the</strong>semoist west side conditions may reduce fire hazard up to 15 years (Morris 1970)compared to untreated slash. Fine fuels fall to background levels <strong>for</strong> bothprecommercial thinning and blowdown within 2 to 4 years (Christensen andPick<strong>for</strong>d 1991). This is a temporal risk which is probably acceptable as long ascontiguous slash is not present over thousands of acres.From a fire protection standpoint, stand manipulation directed toward reductionof fire hazard in natural stands should be avoided. Instead, an aggressivefire control strategy should be implemented, with concentration on fire detec-453
tion and initial attack. If manipulation is contemplated (<strong>for</strong> salvage, thinning),slash treatment should be considered on a minority of sites.WindInsectsDiseasesMost potential DCAs already have some clear-cut units within <strong>the</strong>m. From awind protection standpoint, adjacent areas are at risk. One option is to simplyleave <strong>the</strong> existing units alone and accept <strong>the</strong> windthrow risk in <strong>the</strong> hope thatadditional damage will be limited to a couple of tree lengths into <strong>the</strong> stand.Ano<strong>the</strong>r option is to enter adjacent stands along susceptible edges and"fea<strong>the</strong>r" <strong>the</strong> edges. The objective of fea<strong>the</strong>ring is to divert or break up <strong>the</strong> flowpattern of wind so it is not continually encountering a "wall" of trees. For aseveral-tree length reach, susceptible species or crown classes of trees can bethinned out. Residuals can be mechanically pruned; those on <strong>the</strong> leading edgecan be pruned on alternate whorls to reduce wind pressure in <strong>the</strong> crown. All<strong>the</strong>se techniques open <strong>the</strong> stands and reduce owl habitat <strong>for</strong> perhaps decades,but may stop an o<strong>the</strong>rwise decades-long advancing wall of windthrow. Moststands affected by wind tend to rebuild wind resistance in this same manner.Such intensive management to build wind resistance has not generally beenpracticed in <strong>the</strong> Pacific Northwest, and its economics are unknown, but suchmanagement may be useful in areas bordering DCA units. Local expertise willbe invaluable in designing wind-protected units.Partial cutting may be employed in intervening areas between DCAs or potentiallywithin a DCA (management directives not available as of <strong>the</strong> date of thisreport). Coastal areas (see Figure F. 5), particularly <strong>the</strong> western Olympic Peninsula,are at greatest risk <strong>for</strong> accelerated windthrow. Recent experience is lackingin <strong>the</strong> Pacific Northwest, but guidelines from sou<strong>the</strong>ast Alaska (Harris1989) may be relevant until more local experience is available: 1) stay out ofareas with evidence of past blowdown; 2) avoid those stands exposed to stormwinds (usually from southwest in our area): 3) avoid thinning more than 30percent of <strong>the</strong> basal area of closed-canopy, even-aged stands; 4) thin from belowand concentrate on trees with stilt roots, decay, or lean; 5) avoid damage to<strong>the</strong> residual stand: and 6) thin heavily at an early age to provide good rootingopportunity <strong>for</strong> residuals. Western redcedar seems to be relatively windfirmalong <strong>the</strong> coastal margin (Harris 1989; Franklin, pers. comm.).Windthrown areas have increased fuel hazards and higher potential fire behavior.The guidelines <strong>for</strong> slash treatment after partial cutting, summarized in <strong>the</strong>previous section, should be implemented in windthrown areas: treat slash in aminority of areas.Under most conditions, active management <strong>for</strong> control of insect populationswill not be necessary in DCAs. In <strong>the</strong> event of major windthrow where accessis possible, some down timber should be removed to prevent large buildups ofDouglas-fir and ambrosia beetle populations. Salvage could be done withoutnegative impacts on fire hazard, but must be weighed against o<strong>the</strong>r habitatvalues of <strong>the</strong> windthrown trees.Foliage diseases are not likely to be epidemic. No sprays are recommended. Itmay be desirable to control root rots in some areas to prevent tree death andrapid stand succession. In some areas with good access, stump removal hasbeen employed to maintain a relatively healthy stand, especially in areas with454
high Pheltinus incidence. In most DCAs, access <strong>for</strong> stump removal will not begood, and little active management of root rots will be feasible. Young standsshould also be protected against <strong>the</strong> spread of black stain root disease whichcan be devastating. There is some evidence that thinning during summer mayreduce infection. The usual timber management practice <strong>for</strong> controlling westernhemlock dwarf mistletoe is to remove all infected trees. An alternativestrategy, if timber management is to be practiced in DCAs might be to leave afew mistletoe-infected trees so that <strong>the</strong> habitat values produced by mistletoewill continue to be present into <strong>the</strong> future. There is concern that mistletoeinfection will significantly reduce timber yields, and providing nesting plat<strong>for</strong>msand nest boxes might be considered. Wounding of younger trees may bedesirable to create entry columns <strong>for</strong> decay organisms at an earlier age thanwould occur naturally. This would be helpful <strong>for</strong> cavity-nesting birds.IV. Forest Protection in <strong>the</strong>Kiamath SubregionA. The Natural History of DisturbanceFireThe Douglas-fir <strong>for</strong>ests of <strong>the</strong> Klamath subregion are among <strong>the</strong> driest <strong>for</strong>esttypes in which Douglas-fir is a dominant and where Douglas-fir old-growth isrecognized (Old-Growth Definition Task Group 1986). The complex geology,land use history, steep environmental gradients, and variable fire history ofthis area have prevented generalizations about fire history and its ecologicaleffects. Indians may have had significant ignition effects in <strong>the</strong>se drier Douglas-fir<strong>for</strong>ests (Lewis 1973, Boyd 1986). Miners, settlers, and trappers altered<strong>the</strong> patterns of burning in <strong>the</strong> 19th Century, and fire suppression has alteredburn patterns in <strong>the</strong> 20th Century (Atzet and Wheeler 1982, Atzet et al. 1988).From <strong>the</strong> coastal <strong>for</strong>ests of southwest Oregon to <strong>the</strong> crest of <strong>the</strong> Coast Rangeinland, <strong>the</strong> fire frequency decreases from perhaps 90 to 150 years to about 50years. Frequencies averaging 20 years have been found in <strong>the</strong> easternSiskiyou Mountains (Atzet et al. 1988), and Agee (199 lb) has documented asimilar fire return interval in <strong>the</strong> eastern Siskiyous between 1740 and 1860be<strong>for</strong>e significant European settlement. In <strong>the</strong> Salmon River watershed innor<strong>the</strong>rn Cali<strong>for</strong>nia, Wills (1991) found presettlement mean fire return intervalsof 10 to 15 years <strong>for</strong> Douglas-fir/hardwood <strong>for</strong>ests.When fire return intervals are reduced to 50 years or less in <strong>the</strong>se drier andwarmer environments, a stand development sequence similar to that shown inFigure F.7 may occur (Agee 1991 a). Beginning after a stand-replacement fire,<strong>the</strong> Douglas-fir regenerating on <strong>the</strong> site may survive several low to moderateseverity fires that thin <strong>the</strong> Douglas-fir ("resisters"), remove <strong>the</strong> understorywhite or grand fir ("avoiders"), and topkill <strong>the</strong> associated hardwoods such asmadrone, oaks, and tanoak ("endurers"). Several recurrences of such fires willcreate a stand with several age classes of Douglas-fir (some of which are large),and an age class of Douglas-fir and hardwoods representing regeneration after<strong>the</strong> last disturbance. Not every fire will result in Douglas-fir regeneration, suggestingmany fires had little effect on <strong>the</strong> overstory canopy (Thornburgh 1982,Wills 1991). Understory-tolerant conifers of o<strong>the</strong>r species may be representedin post-fire regeneration. Large logs may be provided by residual Douglas-fir(or ponderosa or sugar pine where <strong>the</strong>y are present) that have died from insects,diseases, or <strong>the</strong> last fire, or have blown over. In presettlement time, <strong>the</strong>455
log and snag density was likely lower than at present because of frequent fires.At age 250+years, <strong>the</strong> structure of this stand may meet <strong>the</strong> old-growth criteria,having developed in a very different way than wet site Douglas-fir stands.Such stands usually will be intermixed with o<strong>the</strong>rs that have experienced astand-replacement event during one of <strong>the</strong> intermediate fires, so that <strong>the</strong> landscapeis more patchy than in wetter Douglas-fir <strong>for</strong>ests.Along <strong>the</strong> coast, redwood <strong>for</strong>est exists along a fog belt and may extend upvalleys with slopes dominated by Douglas-fir/hardwood <strong>for</strong>ests. Veirs (1980)suggests fire return intervals in <strong>the</strong> nor<strong>the</strong>rn redwood <strong>for</strong>ests at 50 to 500years, but o<strong>the</strong>r investigators working to <strong>the</strong> south suggest more frequent firereturn intervals: 31 years at Humboldt Redwoods State Park (Stuart 1987), 20to 29 years at Salt Point (Finney and Martin 1989), and 22 to 27 years at MuirWoods (Jacobs et al. 1985). The pattern of fairly frequent presettlement fireand moderate fire severity apparently existed almost to <strong>the</strong> coast in areassouth of Eureka.WindInsectsDiseasesWind appears to be an important disturbance factor primarily along <strong>the</strong> coastin <strong>the</strong> Klamath subregion. In coastal Humboldt County, average timber lossesfrom windthrow exceeded <strong>the</strong> combined losses from fire, insects, and diseases(Oswald 1968), and Zinke (1988) noted wind-flagging along <strong>the</strong> coastal rivers in<strong>the</strong> redwood belt. Fur<strong>the</strong>r inland, wind is not mentioned in a discussion ofDouglas-fir/hardwood and mixed hardwood <strong>for</strong>ests (Thornburgh 1982, Sawyeret al. 1988). Whittaker (1960), in his extensive monograph on <strong>the</strong>se <strong>for</strong>ests,does not include discussion of wind, although he recognizes <strong>the</strong> importance offire. However, in ridgeline areas within <strong>the</strong> White Fir Zone of <strong>the</strong> SiskiyouMountains, wind was implied to be an important disturbance factor (Agee1991b).Insects have historically caused disturbances in this subregion in associationwith fire. In natural <strong>for</strong>ests insect populations were probably higher thanthose in <strong>the</strong> West Cascades subregion because of higher stress. However,<strong>the</strong>re is a great deal of ecosystem variability across <strong>the</strong> landscape and <strong>the</strong>mixed species nature of <strong>the</strong> <strong>for</strong>ests may have kept defoliator and bark beetlepopulations lower than anticipated. There is also a great deal of variability in<strong>the</strong> fire regime in this subregion.Root diseases were probably important agents of disturbance in this subregion.Armillaria probably killed stressed pines but wide tree spacing may havereduced its rate of spread through <strong>the</strong> soil. Pheffinus weirff and Heterobasidionannosum incidences would have been related to development of susceptibleDouglas-fir and true firs. H. annosurn, although capable of causing root rot ofpines, probably only attacked <strong>the</strong> most stressed individuals.Dwarf mistletoe infections would have been lower in areas with frequent firesand slightly higher in areas with lower fire frequency. Natural rust populations,especially western gall rust, were lower and of course white pine blisterrust was absent. Foliage diseases also would have been low. Butt rot and boledecay would have been important disturbance agents in older <strong>for</strong>ests.456
Figure F.7. A stand development sequence<strong>for</strong> Douglas-fir/hardwood<strong>for</strong>est. After a stand replacement event,fires occur at return intervals of 50 years or less. Conifers are thinned/pruned while hardwoods are top-kiLledOld-growth character develops, but through quite a different process than in <strong>the</strong> moist western hemlock/Douglas-firtype (see Figure 4).I ''I'll ... -.1....................j457
B. Management Effects on StandsManagement effects on fire in <strong>the</strong> Klamath subregion are complex. Historicalfire return intervals varied considerably, and <strong>the</strong> fire severity associated with<strong>the</strong>se historical events was also quite variable. Fire suppression has been apolicy since early in <strong>the</strong> 20th Century, and <strong>for</strong> <strong>the</strong> most part it has been asuccessful strategy. The effect of fire management can perhaps be broken intotwo periods: <strong>the</strong> 1900 to 1980 period, and <strong>the</strong> period 1980 to present and <strong>the</strong>future.In <strong>the</strong> beginning of <strong>the</strong> <strong>for</strong>mer period, large fires occurred in <strong>the</strong> subregion(179,000 acres in 1907; 152,000 acres in 1918 on <strong>the</strong> Siskiyou NationalForest; Atzet et al. 1988). The effect of fire management up into <strong>the</strong> 1980s wasto suppress all fires but those burning under <strong>the</strong> most severe conditions. Totalburn acreage declined, although <strong>the</strong> acres that did burn usually were scorchedmore heavily than in prehistoric fires. The average size of <strong>the</strong> "large fire" (ClassE+: more than 300 acres) between 1950 and 1980 in <strong>the</strong> Siskiyou and RogueRiver National Forests was 747 and 327 acres, respectively (Hardy 1983). Thisaverage has ballooned since <strong>the</strong>n on <strong>the</strong> Siskiyou National Forest with <strong>the</strong>1987 fires (Helgerson 1988). In <strong>the</strong> Klamath National Forest in nor<strong>the</strong>rnCali<strong>for</strong>nia, a U-shaped distribution of average total area burned exists from1950 to 1988 (Perkins unpublished data). The 1950-60 annual average was11,605 acres, which dipped to 4,862 acres in 1960-80; <strong>the</strong> large 1987 fires(more than 275,000 acres on <strong>the</strong> Klamath National Forest) increased <strong>the</strong>average <strong>for</strong> <strong>the</strong> decade 1980-88 to 31,140 acres.The success of <strong>the</strong> fire suppression policy allowed fuels to build in remainingprotected <strong>for</strong>ests. The patchiness of variable fire severity was removed, andfuels became more continuous, both horizontally and vertically. Thick understoriesof conifers and/or hardwoods developed. Slash left after timber cuttingoften was treated by broadcast burning, and yarding of unmerchantablematerial (YUM yarding) also was done in some locations to reduce fuel hazardpotential (Hardy 1983).The recent period has been characterized by a trend toward larger fires. Amore continuous fuel complex over <strong>the</strong> landscape is at least partially responsible,fuels have increased within protected stands, and clear-cut stands haveexposed slash, not all of which has been fuel treated. In 1987, an extensivelightning storm set off more than 600 fires in sou<strong>the</strong>rn Oregon, including 19which reached more than 1,000 acres in size (Helgerson 1988). Fire suppression<strong>for</strong>ces were overwhelmed, and some fires burned <strong>for</strong> months over rough,semiaccessible terrain. Fires burned at night, during cool days, on hot days,up and down slopes, essentially spreading over a wide variety of burningconditions. The 1987 fires were <strong>the</strong> third largest fire event on record in <strong>the</strong>Siskiyou National Forest, burning 190,000 acres in sou<strong>the</strong>rn Oregon, morethan half were on <strong>the</strong> Siskiyou National Forest. About 775,000 acres innor<strong>the</strong>rn Cali<strong>for</strong>nia burned during <strong>the</strong> same time, mostly on national <strong>for</strong>estland (Atzet et al. 1988).A mosaic of fire severity resulted. Less than half of <strong>the</strong> area of most of <strong>the</strong>sou<strong>the</strong>rn Oregon fires burned with high intensity, with <strong>the</strong> remainder burningat moderate and low intensity (Gross et al. 1989). In nor<strong>the</strong>rn Cali<strong>for</strong>nia on<strong>the</strong> Hay<strong>for</strong>k District of <strong>the</strong> Shasta-Trinity National Forest, burned stands hadabout 5 percent of <strong>the</strong> area burned with crown fire consuming more than 50percent of <strong>the</strong> crown; with ano<strong>the</strong>r 25 percent of <strong>the</strong> area more than 50 percentscorched: about 32 percent was 10 to 50 percent scorched; while <strong>the</strong> remaining38 percent was less than 10 percent crown scorched (Wea<strong>the</strong>rspoon andSkinner unpublished manuscript). It is not possible to reconstruct what those458
percentages would have been historically, but it is expected that <strong>the</strong>y mighthave been even more biased toward <strong>the</strong> lower damage classes.The effects of fire management in <strong>the</strong> Klamath subregion was <strong>the</strong>n a 70-yearperiod of declining fire acreage, with burned areas probably biased to <strong>the</strong> highscorch level, followed by recent experience with larger fires of more variableseverity, due to <strong>the</strong>ir simultaneous occurrence and lack of fire control <strong>for</strong>ces toimmediately control <strong>the</strong>m.Management effects on wind are similar in type to <strong>the</strong> West Cascades subregionbut less extensive due to dissected terrain. The <strong>for</strong>est landscape has beenfragmented by clear-cutting, and loss to windthrow occurs around uncut edges(Stone et al. 1969). However, because of dissected terrain of <strong>the</strong> subregion and<strong>the</strong> inland nature of much of it, windthrow owing to management activities hasbeen relatively limited in extent.In <strong>the</strong> Klamath subregion <strong>for</strong>est management, including clear-cutting and firesuppression, has had a major impact on insects and diseases. Defoliator andbark beetle populations have increased. Armilku-a, P. weirit and H. annosumalso have increased. Specific diseases such as Phytophthora lateralis root rot ofPort Or<strong>for</strong>d cedar and black stain root disease of Douglas-fir have been dramaticallyincreased by <strong>for</strong>est management (Baker 1988). Infections appear tobe worse along roads <strong>for</strong> both of <strong>the</strong>se diseases. It is suspected that roadmachinery carries spores of P. ateral is from infected to noninfected areaswhere <strong>the</strong>y spread in runoff and soil water. Thinning has caused an increasein black stain root disease.C. Likely Outcome of a Total Protection Strategy inDCAs Over <strong>the</strong> Next CenturyFireTotal protection in <strong>the</strong> context of this section of <strong>the</strong> report is defined as "handsoff"management within designated conservation areas <strong>for</strong> <strong>the</strong> next 100 years.The recent experience in this subregion with large, uncontrolled fire events islikely to continue with a total protection strategy <strong>for</strong> DCAs. Fuels will onlybecome more continuous with successful protection, and multiple fires arelikely to recur because of <strong>the</strong> nature of lightning events in <strong>the</strong> subregion. Totalprotection should result in 1) a continued occurrence of isolated fires whichburn with relative high severity, being controlled when fire wea<strong>the</strong>r shiftstoward more moderate conditions, and 2) continued large fire "events" withmultiple fires of many thousands of acres. These fires will overwhelm control<strong>for</strong>ces and exhibit variable severity, with a skew over time toward <strong>the</strong> higherdamage classes. A total fire protection strategy is likely to be unsuccessful,over <strong>the</strong> next 50 to 100 years, in providing protection against catastrophicdisturbance in DCAs.If timber harvest activity is undertaken in DCAs, fire management simulations(Hardy 1983) suggests that fuel treatment will be effective in reducing futureburned area, although it may be cost-inefficient. Hardy's fuel treatmentoptions were YUM yarding (8 inches x 10 feet or 6 inches x 6 feet), and his'base case" <strong>for</strong> wildfire size distributions (1950-80) did not include ei<strong>the</strong>r <strong>the</strong>early 1907-18 fires or <strong>the</strong> 1987 fires, making fuel treatment compared to <strong>the</strong>"base case" hard to justify economically. A survey of partial-cut and uncutstands burned by <strong>the</strong> nor<strong>the</strong>rn Cali<strong>for</strong>nia fires of 1987 suggests that cuttingwas associated with increased fire severity levels, but fuel treatment within cut459
units (underburning or lop/scatter) was effective in reducing damage comparedto no treatment within cut units (Wea<strong>the</strong>rspoon and Skinner unpublishedmanuscript).WindWind effects should not be exacerbated by total protection of DCAs. Continuedlimited blowdown should occur around <strong>the</strong> margins of currently clear-cutareas within DCAs. Unusual storms may accelerate this damage, but it ishighly unlikely that a single storm or series of storms will cause massiveblowdown within <strong>the</strong> DCAs of this subregion. This conclusion becomes moretempered toward <strong>the</strong> coastal edge of <strong>the</strong> subregion.Total fire protection in this region usually will result in more insect and diseaseoutbreaks because of increased stress. However, because of <strong>the</strong> patchy natureof <strong>the</strong> <strong>for</strong>est types and <strong>the</strong> fact that large landscape areas are not covered by asingle species, insect outbreaks over extensive areas probably are not as likelyas <strong>the</strong>y are in <strong>the</strong> East Cascades subregion. Fire exclusion, however, willcause an increase in <strong>the</strong> Douglas-fir and true fir components of stands growingon dry, lower elevation sites. During drought periods <strong>the</strong> fla<strong>the</strong>aded fir borerand fir engraver beetle will cause extensive mortality in <strong>the</strong>se stands; resultingfuels could cause increased fire problems. Root diseases, especially Arnillariaroot disease, and dwarf mistletoes are likely to increase.D. Forest Protection GuidelinesFireThere is likely to be a wide variety of opinion regarding <strong>the</strong> optimum firemanagement strategy <strong>for</strong> DCAs in <strong>the</strong> Klamath subregion over <strong>the</strong> next century.This variety is partly due to <strong>the</strong> fact that a total protection strategy, ifsuccessful, would produce <strong>the</strong> most acres of owl habitat. It is partly due to <strong>the</strong>uncertainty associated with global change; disturbance regimes are likely to beaffected and may drive many of <strong>the</strong> vegetation changes projected under variousglobal change scenarios. The range of opinions also is caused by a lack ofconsensus about how effective fire suppression alone may be, and what isgained by treating fuels in unmanipulated stands.In our opinion, a total fire protection strategy has a fairly low probability ofprotecting owl habitat over <strong>the</strong> next century in most DCAs in <strong>the</strong> Klamathsubregion. There is substantial reason to believe <strong>the</strong> trend toward large fireswill continue, and fire severity will become skewed toward higher severitylevels. Damage to understory and overstory will reduce or eliminate owlhabitat in burned areas. There<strong>for</strong>e, some type of fuel management program isrecommended. Available data suggest that stands manipulated primarily <strong>for</strong>timber production will have increased fire severity levels. The fire managementmanipulations suggested below are specifically recommended <strong>for</strong> owl habitatobjectives, not <strong>for</strong> timber production. There are probably ways <strong>the</strong> two couldbe integrated if timber management occurs within <strong>the</strong> DCA system.Fuel and fire specialists in <strong>the</strong> vicinity of each DCA are <strong>the</strong> best qualified todevelop <strong>the</strong> fuel management strategies. There is no reason to expect strategyto be <strong>the</strong> same in each DCA. The expected result of any strategy will be atemporary to permanent reduction in preferred owl habitat within <strong>the</strong> manipulatedarea, with a higher probability of control of potentially catastrophicwildfires over <strong>the</strong> larger area. Two types of fuel management strategies are460
described, and an innovative fire management program will make use of bothof <strong>the</strong>m plus additional measures. The first is underburning, and <strong>the</strong> secondis fuelbreaks; each addresses different objectives.Underburning is an area treatment which eventually reduces total dead fuelloads and vertical fuel continuity. Wildfires entering such stands under mostconditions have less severe overstory scorch and allow direct control of <strong>the</strong> fire.To be effective, underburning must be implemented over wide areas. Forexample, to <strong>the</strong> south at Yosemite National Park, some stands that had beenunderburned twice experienced crown fire behavior from wildfire that developedmomentum as it crowned through adjacent brush and untreated stands(Wagtendonk pers. comm.). A first fire will consume much dead fuel, but alsowill create a lot (Thomas and Agee 1986). A second fire within <strong>the</strong> decade willconsume <strong>the</strong> created fuel and maintain low fuel hazard <strong>for</strong> a longer period.Opening <strong>the</strong> understory reduces <strong>the</strong> protection offered owls and at leasttemporarily (1 to 2 decades?) provides less optimum habitat. There<strong>for</strong>e,underburning should not be done over a wide area of any DCA within onedecade.The main objective of a fuelbreak is to compartmentalize units by creating azone of reduced fuel between <strong>the</strong>m, which allows safe access <strong>for</strong> fire suppression<strong>for</strong>ces during wildfires and a reasonable control location (Green 1977).Fuelbreaks generally are placed along ridgelines where continuous fuels exist.Stands are manipulated to have discontinuous tree canopies, pruned boles onresidual trees, and substantial understory removal (leaving a few clumps hereand <strong>the</strong>re). Some removed fuels can be utilized if good access is present; finefuels are often pile-burned at <strong>the</strong> site. From a distance <strong>the</strong> fuelbreak need notbe a visual eyesore and can be quite visually pleasing even at close range. Afuel manipulation in mixed evergreen <strong>for</strong>est below <strong>the</strong> developed area atOregon Caves National Monument in <strong>the</strong> early 1980s is a good example of <strong>the</strong>visual advantages of understory thinning and fuel reduction. Indefinite maintenanceof <strong>the</strong> fuelbreak in low fuel condition is essential. In <strong>the</strong> Klamathsubregion, <strong>the</strong> occurrence of sprouting hardwoods with substantial regrowthpotential (Tappeiner et al. 1984) suggests maintenance intervals of a decade orless <strong>for</strong> fuelbreaks.Underburn sites can be keyed into fuelbreaks to expand fuel-reduced areas.The underburning need not be done at historic return intervals. Monitoring ofburned areas where owls exist should be done to determine what effectsunderburning has and how long <strong>the</strong>y last.If <strong>the</strong>se fuel strategies are implemented over wide areas, conflicts with existingair quality guidelines are likely. The choice to be made is planned emissions orunplanned ones; absence of emissions is not a realistic option. An additionalconstraint on fuel management activities is that some DCAs may be partiallywithin designated wilderness. Prescribed fire has been used in national parkwilderness (Yosemite, van Wagtendonk 1985, Pinnacles National Monument,Agee and o<strong>the</strong>rs 1981), but not to our knowledge in Forest Service wilderness(although policy now allows such use), which would be <strong>the</strong> primary managementagency <strong>for</strong> wilderness in <strong>the</strong> Klamath subregion. Fuelbreaks have notbeen used in ei<strong>the</strong>r type of wilderness, and increased use of prescribed firemight help to avoid placing fuelbreaks in wilderness. Consideration of firemanagement strategies in wilderness where DCAs exist should be done on aregional basis, but applied using local expertise. There will be some risk ofescaped prescribed fires, some portions of which may be of high severity, eventhough <strong>the</strong>y will be burning in early or late season. This risk cannot beeliminated, but it can be reduced with crew training, good ignition patterns,and patience. When compared to <strong>the</strong> alternative of attempted full suppression,<strong>the</strong> risk of escaped prescribed fires is reasonable to assume.461
In <strong>the</strong> higher elevation White Fir and Red Fir Zones, where cooler climate andoften lush herbaceous understories exist, fuelbreak and underburning activitiesprobably are not needed specifically <strong>for</strong> owl habitat protection. A quickresponsefire suppression strategy should be sufficient protection in <strong>the</strong>seareas. Wilderness fire plans should be designed to mesh with <strong>the</strong> larger DCAfire management plans, and may consider ei<strong>the</strong>r prescribed or prescribednatural fire as deemed appropriate by local fire management personnel.WindInsectsFireGuidelines similar to those <strong>for</strong> <strong>the</strong> West Cascades subregion are applicable to<strong>the</strong> Klamath subregion. The zone of highest susceptibility is along <strong>the</strong> coast,but since this subregion is relatively mountainous right to <strong>the</strong> edge of <strong>the</strong> sea,<strong>the</strong> guidelines <strong>for</strong> <strong>the</strong> inland area of <strong>the</strong> West Cascades subregion are applicable.Along <strong>the</strong> coast, dominant coast redwood trees are relatively windfirm(Boe 1965) and should be favored in any stand manipulations such asthinnings or fea<strong>the</strong>ring operations.Insect behavior will be largely controlled by fire frequency. There should be noneed <strong>for</strong> spraying defoliators, but this option should not be ruled out if needed.Fuel treatment after harvest activity should keep <strong>the</strong> populations of Douglas-firbeetle and ambrosia beetles relatively low. Keeping stands in as low a stresscondition as possible should reduce bark beetle attacks.Total fire suppression increases root diseases, dwarf mistletoe infections, anddecay fungi. However, it will be difficult to totally suppress fires and it isanticipated that diseases will not increase dramatically if fires occur.462
V. Forest Protection in <strong>the</strong>East Cascades SubregionA. The Natural History of DisturbanceFireHistorical fire return intervals in <strong>the</strong> East Cascades subregion tend to beshortest in areas lower in elevation than what appears to be prime owl habitat.Moving from <strong>the</strong> sage steppe to ponderosa pine <strong>for</strong>ests, nei<strong>the</strong>r of which isprime owl habitat, presettlement fire return intervals may be as low as 5 to 10years (Bork 1985) in low severity fire regimes. As elevation increases, a moremixed conifer <strong>for</strong>est emerges, grading from <strong>the</strong> Douglas-fir series to <strong>the</strong> grandfir series of plant associations. Douglas-fir and ponderosa pine are dominantat <strong>the</strong> lower elevations and at higher elevations on ridges, while western larch,grand fir, and o<strong>the</strong>r conifers are found in addition on <strong>the</strong> more mesic or higherelevation sites (Sudworth 1908).Stand replacement fires are not <strong>the</strong> most common fire severity that occurred in<strong>the</strong> Douglas-fir and grand fir series of plant associations (Keane et al. 1990).However, higher intensity fires are an important process <strong>for</strong> natural standregeneration of western larch, lodgepole pine, and Douglas-fir, and haveoccurred in <strong>the</strong>se areas at centuries-long intervals (Antos and Habeck 1981).Many intermediate fires of lower intensity and severity occur at a more frequentinterval. In Montana, on a grand fir habitat type, <strong>the</strong> intermediateinterval was about 17 years (Arno 1976). In <strong>the</strong> eastern Washington Cascadesand Okanogan Highlands, <strong>the</strong> intermediate fire interval was estimated at 22years (Finch 1984), with a range of 12 to 52 years. Fires of low to moderateseverity are <strong>the</strong> most common types of severity in <strong>the</strong> moderate severity fireregime.Unusual stand conditions created by a long fire-free interval or severe firewea<strong>the</strong>r can result in a crown fire. Fuel conditions also can affect <strong>the</strong> probabilityof crown fire behavior. Pole-sized, heavily stocked stands have a high crownfire potential (Davis et al. 1980). If a young stand survives an initial light burn,perhaps due to its burning under average to moist wea<strong>the</strong>r conditions, subsequentunderbums act as a negative feedback mechanism <strong>for</strong> crown fires byreducing fuels that might encourage crown fire spread. A long interval betweenunderbums allows a tall understory to develop, which has a higher probabilityof crowning (Davis et al. 1980).The successional dynamics of <strong>for</strong>ests in <strong>the</strong> East Cascades subregion dependon <strong>the</strong> intensity of <strong>the</strong> fire as well as <strong>the</strong> species composition and structure of<strong>the</strong> vegetation at <strong>the</strong> time of <strong>the</strong> fire. Low intensity surface fires encouragewestern larch and ponderosa pine canopy dominance (Arno et al. 1985), as<strong>the</strong>y are fire resisters. Their thick bark insulates <strong>the</strong> cambium against damagebetter than any of <strong>the</strong>ir associates, and in mature stands <strong>the</strong>y are usually <strong>the</strong>taller trees, which helps <strong>the</strong>m avoid crown scorch. The deciduous habit oflarch may make crown scorch less important, especially <strong>for</strong> late season fires(Davis et al. 1980). Peterson and Ryan (1986) modeled <strong>the</strong> relative survival of amixed conifer stand after a fire under moderate fuel moisture conditions with ascorch height of 30 feet. Mature western larch and ponderosa pine suffered nomortality in <strong>the</strong> simulation, while <strong>the</strong> basal area of o<strong>the</strong>r species, includingDouglas-fir, declined 75 to 100 percent. After such fires, western larch radial463
growth often increases (Reinhardt and Ryan 1988), while residual Douglas-firmay show no change in radial growth lixcrement.If a crown fire does occur, it kills all <strong>the</strong> trees in <strong>the</strong> stand. Herbs and shrubsmay dominate <strong>the</strong> floristics of early succession, with some herbs (e.g.,Epilobium angustifoliurn) peaking and declining within <strong>the</strong> same decade(Stickney 1986). Western larch has light-winged seeds, which can blow onto aburned site from adjacent stands or from lightly scorched cones in <strong>the</strong> firekilledstand (Haig et al. 1941). Lodgepole pine, if present on <strong>the</strong> site, willestablish from serotinous cones in <strong>the</strong> area. If <strong>the</strong> crown fires have beenspaced more than 150 years apart, western larch is <strong>the</strong> most probable treedominant at <strong>the</strong> time of disturbance, because lodgepole pine, <strong>the</strong> o<strong>the</strong>r earlyseral species with fast growth, is short-lived and may have been killed bymountain pine beetles (Haig et al. 1941). Where <strong>the</strong> crown fire interval isshorter than 150 years, lodgepole pine will at least share dominance in <strong>the</strong>post-fire tree cohort (Gabriel 1976, Antos 1977, Antos and Habeck 1981).However, if <strong>the</strong> stand is repeatedly underburned after lodgepole pine establishment,lodgepole pine will be eliminated because of its thin bark in favor ofwestern larch, ponderosa pine, and Douglas-fir.If two crown fires occur in quick succession, <strong>the</strong> site may revert to a brushfield(Antos and Habeck 1981), as nei<strong>the</strong>r western larch nor lodgepole pine survivessuch fires in <strong>the</strong> pole stage (Davis et al. 1980). Where a single crown fireoccurs, stand establishment usually includes individuals of o<strong>the</strong>r species aswell as lodgepole pine and larch. On dry sites, ponderosa pine may be included.On average sites, Douglas-fir and grand fir are normally present, andon moist sites western white pine may be a codominant. None of <strong>the</strong> associatedspecies typically grows as fast as western larch and lodgepole pine (Haig etal. 1941, Cobb 1988). Individual species create different strata over time,although all may establish in <strong>the</strong> same time period. On a series of even-agedstands in eastern Washington that regenerated after crown fires, Cobb (1988;Figure F.8) found western larch to be a consistent dominant, with lodgepolepine sharing dominance on some sites. Douglas-fir and grand fir showed avariety of stratification patterns but always in intermediate or suppressedcrown positions.Low intensity fires in <strong>the</strong>se stands increase <strong>the</strong> relative dominance of westernlarch, ponderosa pine, and/or Douglas-fir over <strong>the</strong>ir associates because of <strong>the</strong>ircrown position relative to grand fir, and thicker bark than lodgepole pine ondominant trees. Substantial understory development, perhaps after <strong>the</strong>breakup of lodgepole pine in <strong>the</strong> canopy, will encourage an understoryreinitiation stage in stand development (Oliver 1981) which may be associatedwith increased crown fire potential and ano<strong>the</strong>r set of multiple successionalpost-fire pathways.A successional model of western larch/Douglas-fir <strong>for</strong>ests, including firedynamics was developed by Keane et al. (1990) <strong>for</strong> <strong>the</strong> Douglas-fir series inMontana. The model outputs generated by fire return intervals of 10, 20, and50 years, and a no-fire situation are shown in Figure F.9. Ponderosa pine ismost dominant in <strong>the</strong> more frequent fire return interval simulations. In <strong>the</strong>Douglas-fir series simulation, Douglas-fir is <strong>the</strong> most shade-tolerant speciesincluded and dominates <strong>the</strong> no-fire scenario. In <strong>the</strong> East Cascades subregion,<strong>the</strong> Douglas-fir series has little larch, and <strong>the</strong> fire scenarios would favorponderosa pine with some Douglas-fir. The grand fir series is more commonwhere larch is found; Douglas-fir in this series behaves more like larch whilegrand fir is <strong>the</strong> most shade-tolerant species. Substituting those species in <strong>the</strong>graphs gives a general idea of this alternative succession scenario: <strong>for</strong> example,in <strong>the</strong> no-fire scenario, larch, ponderosa pine, and Douglas-fir would declineand grand fir would increase.464
WindThere is no known published in<strong>for</strong>mation concerning wind in <strong>the</strong> East Cascadessubregion. This is likely because it is an intermittent and rarely extensivedisturbance factor here. Our experience suggests that most naturalstands and partial cuttings are relatively windfirm. Wind does not appear to bea factor of significant concern in designing a <strong>for</strong>est protection scheme <strong>for</strong>spotted owl DCAs in <strong>the</strong> East Cascades subregion.InsectsInsects in this subregion historically have caused large disturbances. Thefrequent natural fire frequency on <strong>the</strong> eastern side of <strong>the</strong> subregion, however,probably did not allow populations to build frequently to <strong>the</strong> epidemic levelscurrently observed in this area. Insects probably acted as agents of stabilizationin <strong>the</strong>se ecosystems, similar to fire. Endemic populations of defoliatorsWern larchLodgepole pine 1*0- Douglas-fir E303 0 Grand fir20- At a -2010-tX 100 10 20 30 40 50 6030 -3020 20010.: :: .0 10 20 30 40 50 60 0MetersFigure F.8. In <strong>the</strong>se mixed-conifer<strong>for</strong>ests of <strong>the</strong> eastern Cascades, multiple canopy levelscan befound in young stands (Cobb 1988). These stands are even-aged, both developingafter a stand replacement disturbance. Larch and lodgepole pine dominate <strong>the</strong>se youngstands (100 years old) while Douglas-fir and grand fir are relegated to subcanopy positions... .1 ----- ... ...I465
50rcc4*0-cC)2M CmZ13010-yearI ,...** st -- _ ' ^- ~ .-. ,-,_ Ponderosa pine..... ... -.... __,10 Western larch Fires . . .........A A A A A 4'> A A A A 4 A A A U.E-10 ,,a).5 =00 .)Figure F.9. Simulations ofrelative basal area of species inmixed conifer<strong>for</strong>est undervarying disturbance regimes(Keane and o<strong>the</strong>rs 1990). Asfire return intervals leng<strong>the</strong>n.ponderosa pine decreases ininportance relative to Douglasfir.Where grandfir Is present.its response would be similar tothat shown<strong>for</strong> Douglas-fir in<strong>the</strong>sefigures.50c 40-C1Nf3020-yearPonderosa pine2 20mOV,coCOl 10Western larch '1XA, L / -oDouglas-fir __ \ '-. 5 -.. \,, hFire~s,- t- ,-1F- °00 20 40 60 80 100 120 140 160 180 20050Simulation Year40NE 30co(s 20rncmclo010 11.C_ 5 sQ- 0)50_ 40coNE 30No firePonderosa pineDouglas-fira) 20-I~~~~~~~~~~~~~1U)c 10Western larch . ' \,.00 20 40 60 80 100 120 140 160 180 200Simulation Year0c,:466
Disases(Douglas-fir tussock moth and spruce budworm) which tend to attack Douglasfirand true firs could not easily build up in areas with frequent natural fireregimes because succession to <strong>the</strong> shade tolerant Douglas-fir and true firs didnot proceed and stands were typically dominated by pine species. On <strong>the</strong>western edge of <strong>the</strong> subregion, where fires are less frequent, and Douglas-firand true firs were more dominant, insect populations were historically higher.Douglas-fir beetle, fir engraver beetle, and Cooley spruce gall aphid populationswere generally low in areas with high fire freqency. Frequent fires also keptpopulations of mountain pine beetle, red turpentine beetle, and pine engraverbeetles at low levels because tree density was low and trees were under relativelylow stress. In areas with less frequent fires beetle populations wouldhave been larger.Like insects, diseases in this area also acted as an agent of stabilization innatural <strong>for</strong>ests. Root diseases such as Annalarta probably removed stressedpines. Phellus weirli and H. annosum incidences were also lower because oflower populations of susceptible Douglas-fir and true firs. More root diseasesprobably occurred on <strong>the</strong> western than eastern edge of <strong>the</strong> subregion.Dwarf mistletoe infections were also lower in areas with frequent fires andslightly higher in areas with lower fire frequency. Natural rust populationswere lower and white pine blister rust was absent. Foliage diseases also wouldhave been low. Decay fungi would have been present, but pines tend to haveless butt rot and bole decay than later successional species such as Douglas-firand true firs. In older stands butt rots and decay fungi would increase inimportance.B. Management Effects on StandsAn extensive summary of <strong>for</strong>est health problems created by management (orlack of it) over this century is contained in <strong>the</strong> Blue Mountains Forest HealthReport "New Perspectives in Forest Health" (Gast et al. 1991). Although thisreport was prepared <strong>for</strong> two national <strong>for</strong>ests east of <strong>the</strong> East Cascades subregion,as defined in this report, its summary of management impacts is applicableto this subregion. The report has garnered wide regional publicity.Fires were once common in <strong>the</strong> subregion, but effective fire suppression hasallowed <strong>the</strong> development under an overstory of larch, ponderosa pine, andDouglas-fir a thick understory of shade-tolerant grand fir (Figure F. 10). Firehazard increases, and fires which were once likely to be benign understory firesof low severity become high severity stand-replacement fires. High severityfires did occur in <strong>the</strong>se low severity regimes (see Figure 3) but not at <strong>the</strong> scale<strong>the</strong>y now do. Where protection is successful, <strong>the</strong> moisture stress experiencedby <strong>the</strong> dense overstocked stands encourages spruce budworm attacks on <strong>the</strong>firs. Although seldom fatal, such attacks weaken trees over several years andincrease <strong>the</strong> probability of successful attacks by bark beetles or root rots. TheBlue Mountains report recommended a large increase in prescribedunderburning to remove vulnerable species and reduce fire hazards (Gast et al.1991).With <strong>the</strong> exception of increased windthrow potential around edges of clear-cut,management has had little effect on wind in <strong>the</strong> East Cascades subregion.467
In <strong>the</strong> East Cascades subregion <strong>for</strong>est management, especially high gradingand fire suppression, has had a major impact on insects and diseases. Firesuppression and removal of desirable shade intolerant species, such as ponderosapine, have favored shade tolerant Douglas-fir and true firs with veryhigh stand densities. As a result insect and disease incidence in this subregionincreased dramatically in <strong>the</strong> last 50 to 100 years.Ca,Z-Eco0)(nmo1720 1800 1900Less-than-optimum owl habitatoptimum owl habitat.has been trans<strong>for</strong>med into,..,4Herb Shrub Western larch Ponderosa pine Douglas-firor grand fir468Figure F. 10. A simulation of ecological changes in East Cascades subregion <strong>for</strong>ests due to successfl fire exclusion.This graph was constructed by combiningfrom Figure 9 <strong>the</strong> 20-yearfire return interval simulation up to 1900 with <strong>the</strong> nofiresimulation after 1900. Shade-tolerant understory trees now choke <strong>the</strong> <strong>for</strong>est. Although such conditions may beconducive to owl habitat, <strong>the</strong>re appears to be little historic precedent<strong>for</strong> current<strong>for</strong>est structure, and <strong>the</strong>se habitats arelikely to be significantly altered in <strong>the</strong> next several decades..... ..........-.... ........... ... . "I I I --- --- -- 11 .111.1111.11 1.111, .- 11
Outbreaks of Douglas-fir tussock moth and spruce budworm occurred naturallybut it is thought that management has increased outbreak severity. Suchoutbreaks can cover hundreds of square miles.Swetnam and Lynch (1989) reconstructed <strong>the</strong> history of spruce budwormoutbreaks in <strong>the</strong> sou<strong>the</strong>rn Rocky Mountains from 1700 to 1983 using tree ringanalysis and identified at least nine outbreaks. Severity and timing werehighly variable. The average period of reduced growth was 12.9 years andranged from 5 to 26 years. The average interval between initial years of successiveoutbreaks was 34.9 years and ranged from 14 to 58 years. There was arelatively long period of reduced budworm activity in <strong>the</strong> first decades of <strong>the</strong>20th Century but since <strong>the</strong>n outbreaks have been more severe. Currentoutbreaks may be more severe than outbreaks occurring under natural conditions.However, current outbreaks were not clearly less or more frequent thanthose during <strong>the</strong> previous 2 centuries. This change in severity was related tochanges in age structure and species composition following harvesting and firesuppression in <strong>the</strong> late 19th and 20th Centuries.Douglas-fir tussock moths also seem to have increased in severity. Althoughnative to North America, tussock moths were not reported defoliating standsuntil 1908. Since that time infestations have occurred synchronously every 8to 10 years over wide geographic areas (Brubaker 1978).Spraying epidemic defoliator populations with chemicals and Bacillusthuringiensis has had little impact.Douglas-fir and pine bark beetle populations all have increased resulting inwidespread mortality across <strong>the</strong> landscape. Pine tip moth problems also haveincreased, especially in young plantations.Fire suppression, high grading and changes in species succession also havechanged <strong>the</strong> disease situation; root rot diseases are now extremely damaging,especially Phellinus weird and Annillaria ostoyae (Baker 1988). ArTnllarTa hasbecome extremely damaging in <strong>the</strong> more stressful environment created by firesuppression. It kills all conifer species and all ages of trees in this subregion.It has increased dramatically as stumps have been created in managed <strong>for</strong>estswith <strong>the</strong> subsequent increase in inoculum potential. Mixed conifer <strong>for</strong>ests areoften more severely damaged by root diseases after logging than be<strong>for</strong>e logging(Filip 1990, Filip and Goheen 1984). Heterobasidion annosum also has increased.It now causes considerable mortality in pine stands as well as rootand butt rot in true firs. It may even occur in Douglas-fir. Some foliagediseases seem to have increased with management and larch needle blight iscurrently active over a wide area in eastern Washington.Dwarf mistletoes also have increased in managed stands. Fire typicallycleanses <strong>for</strong>est stands of dwarf mistletoe (Baker 1988). Douglas-fir, true firs,ponderosa pine, and lodgepole pine have become easily infected and now manyof <strong>the</strong>se trees have reached canopy dominance capable of infecting new trees in<strong>the</strong> understory. Interestingly, half of <strong>the</strong> owl nesting sites in <strong>the</strong> Wenatcheearea of <strong>the</strong> East Cascades subregion are in dwarf mistletoe-infected Douglas-firtrees. Few of <strong>the</strong>se trees would have existed in natural <strong>for</strong>ests. Forsman et al.(1990) noted that owls utilize north-slope, closed-canopy <strong>for</strong>est more than <strong>the</strong>south-slope ponderosa pine <strong>for</strong>ests. These mixed coniferous stands retaincharacteristics of mature and old-growth stands, such as snags and downtrees, a moderate to strongly multilayered canopy and heavy infestation ofDouglas-fir dwarf mistletoe. In <strong>the</strong> Wenatchee National Forest spotted owlswere noted to nest in more or less even-aged Douglas-fir stands 90 to 130years old with a high proportion of Douglas-fir (Buchanan pers. comm.). Thesestands were infected with dwarf mistletoe and more than half <strong>the</strong> owl nestswere in mistletoe brooms.469
The introduced disease, white pine blister rust, has been particularly devastatingto western white pine and sugar pine. Native western gall rust has increasedin plantations of lodgepole pine and also occurs in ponderosa pine.C. Likely Outcome of a Total Protection StrategyOver <strong>the</strong> Next CenturyFireWindInsectsTotal protection in <strong>the</strong> context of this section of <strong>the</strong> report is defined as 'handsoff'management within designated conservation areas <strong>for</strong> <strong>the</strong> next 100 years.A total fire suppression strategy has created <strong>the</strong> multilayered yet unstable<strong>for</strong>est structure present on <strong>the</strong> landscape today. There is a very low probabilitythat any DCA created in <strong>the</strong> East Cascades subregion will avoid catastrophicwildfire over a significant portion of its landscape over <strong>the</strong> next century. MostDCAs will exhibit landscape effects of fire similar to those in <strong>the</strong> Entiat Riverwatershed. Fires of high severity and wide extent (with little overlap) haveburned in 1970, 1974, 1976, and 1988 in areas once capable of supportingowls. In <strong>the</strong> 1970 fire area, many midslope and ridge areas exhibited apresettlement pattern of low intensity fires, with even-aged lodgepole pinestands in valley bottoms, suggesting longer interval, higher severity fires in <strong>the</strong>valleys. With <strong>the</strong> more continuous fuels provided by successful fire protection,<strong>the</strong> 1970 fires were more uni<strong>for</strong>mly stand replacement in nature. One stumpbared by salvage in a burned area of <strong>the</strong> 1988 fire showed a fire-free period of99 years over which a dense, stagnated understory developed (a 60-year-oldponderosa pine was 2 inches in diameter). Be<strong>for</strong>e that, <strong>the</strong> tree survivedunderburns in 1870, 1860, 1850, 1830, and 1817, with earlier fire scarserased by <strong>the</strong> later burns.If fires can be suppressed, root rots are likely to accelerate <strong>the</strong>ir spread. Treessignificantly infected by root rots have an increased probability of windthrow.Such windthrow pockets begin as small circles and eventually widen as <strong>the</strong>root rots spread laterally to susceptible tree species. Resistant species willregenerate or be released in <strong>the</strong> openings, creating a younger, all-sized stand ofprimarily shade tolerant species. These are likely to be affected by o<strong>the</strong>rpathogens or insects and be heavily damaged by wildfires.Fire exclusion, coupled with natural mortality factors, gradually reduce <strong>the</strong>pine and larch components of mixed conifer stands. Insect outbreaks associatedwith <strong>the</strong>se seral species should show a gradual reduction in severity.However, <strong>the</strong> resulting multistoried stands of Douglas-fir and true fir createconditions <strong>for</strong> <strong>the</strong> buildup of defoliators. Douglas-fir tussock moth and westemspruce budworm populations will increase, with frequent outbreaks.Episodes of tree defoliation and/or drought in east side stands will result insevere outbreaks of <strong>the</strong> Douglas-fir beetle and fir engraver beetle. Accumulationsof heavy fuels within stands will make total fire protection very difficult.Large, fire-damaged Douglas-fir trees are susceptible to bark beetle attack.470
DiseasesTotal fire protection will continue to increase foliage diseases, such as larchneedle blight, root rots, especially Armillarta root disease, heart rots (especiallyof true firs), and true fir and Douglas-fir dwarf mistletoes. As mentionedearlier, however, total fire protection in this subregion will be difficult to attain.Fires may reduce certain diseases, such as dwarf mistletoes, depending on fireintensity. They also cause wounding of some tree species, thus providing entrycourts <strong>for</strong> fungi, especially bole decay organisms.D. Forest Protection GuidelinesInsectsDiseasesThere are no <strong>for</strong>est protection options to maintain owl habitat at its currentlevel in <strong>the</strong> East Cascades subregion. As noted, <strong>the</strong> current extensive habitatis likely a result of an historical anomaly: successful fire protection. Thestructure resulting from this anomaly is inherently unstable, subject to increasedfire, wind, disease, and insect damage. Any stand manipulation whichwill significantly increase resistance to <strong>the</strong>se disturbance factors apparentlywill result in decreased owl habitat, through reduction of thick understoryconditions. However, <strong>the</strong>re should be experiments to test <strong>the</strong> effect suchmanipulations will have on owl populations. Through <strong>the</strong> process of adaptivemanagement (Walters 1986) future management direction will depend on <strong>the</strong>results of initial management ef<strong>for</strong>ts.Many valley stands have longer fire return intervals than associated slopes. Aprescribed burning program might be implemented on slopes while excludingtoe slopes and valley bottoms. Such a program might protect nesting habitatin valley locations <strong>for</strong> a significant number of owls, while providing much morefire-resistant <strong>for</strong>aging areas on <strong>the</strong> slopes. Since north aspects appear to havemore owl nesting sites (Buchanan pers. comm.) <strong>the</strong>se aspects might be protectedmore often than south aspects. Wildfire control would have much moresuccess if stands with thick understories were isolated and in riparian, northaspectlocations. Possible effects of fragmenting owl populations will have to beweighed against <strong>the</strong> benefits of hazard reduction. Effects of <strong>the</strong> burning ono<strong>the</strong>r wildlife and fish populations also might be more positive than negative ifselected areas were excluded from <strong>the</strong> burning programs.As in <strong>the</strong> Klamath subregion, tying in prescribed burning areas with fuelbreakswill increase <strong>the</strong> suppression capability when wildfires occur and aid in <strong>the</strong>implementation of a successful prescribed fire program with fewer escape fires.In <strong>the</strong> absence of fire, spraying <strong>the</strong> <strong>for</strong>est with Sevin or Bacillus thur-ngensishas been recommended in some areas to reduce population levels of defoliatinginsects. This can also reduce tree mortality and lower <strong>the</strong> fire danger temporarily.However, such treatment is not likely to be very effective in DCAs orelsewhere and is not recommended as a DCA protection strategy. Stands mayneed to be thinned to keep <strong>the</strong>m in a condition with less moisture stress toreduce <strong>the</strong> possibility of bark beetle attack and increased mortality. Thinning,however, may increase <strong>the</strong> incidence of root diseases such as Annillaria rootrot.In <strong>the</strong> absence of fire, Armillarta root disease will continue to increase. Thinningto control bark beetles probably will increase <strong>the</strong> rate of spread. More471
VI. Conclusionsmortality will result and stands will become particularly vulnerable to firebecause of heavy fuel loadings. Dwarf mistletoes will continue to increase in<strong>the</strong> absence of fire, particularly on Douglas-fir. With underburning, mistletoeinfectedtrees in <strong>the</strong> understory will be killed. Heart rots will also continue toincrease in <strong>the</strong> absence of fire in older stands.Forest ecosystems are dynamic. They change with or without active management.In <strong>the</strong> case of unmanaged stands within <strong>the</strong> range of <strong>the</strong> nor<strong>the</strong>rnspotted owl, such temporal change has been different within <strong>the</strong> three subregionsdefined in this report: <strong>the</strong> West Cascades, Klamath, and East Cascadessubregions. Such change and <strong>the</strong> likelihood of successful protection of owlhabitat by subregion is summarized in Table F.7, Klamath subregion. Clearly,active management is recommended <strong>for</strong> a majority of <strong>the</strong> land area occupied by<strong>the</strong> nor<strong>the</strong>rn spotted owl, and within areas such as <strong>the</strong> Klamath subregionwhere <strong>the</strong> highest densities of owls exist.A recommendation to implement a strategy that in fact reduces optimum owlhabitat may seem a paradox. We believe that such implementation will in <strong>the</strong>long run better protect owl habitat than a more short-sighted attempt tocontinue total protection. Total protection would have been a viable 50-yearstrategy in 1910, but it is not viable in <strong>the</strong> 1990's. Active management ofhabitat in <strong>the</strong> Klamath and East Cascades subregions, through protectionstrategies designed to prevent large-scale catastrophic events, is <strong>the</strong> mostrational management direction. In <strong>the</strong> West Cascades subregion, while werecognize that large-scale catastrophic disturbance is historically important,future occurrence is not predictable, and an aggressive fire control strategy isrecommended. While <strong>the</strong>se strategies are by no means perfected, <strong>the</strong>y will helpus learn through implementation, and hopefully ensure <strong>the</strong> long-term viabilityof <strong>the</strong> nor<strong>the</strong>rn spotted owl.Table F.7. A comparison by subregion of changes in <strong>for</strong>est structure since active<strong>for</strong>est protection began, <strong>the</strong> probability of continued successful protection, andneeds <strong>for</strong> innovative management.CategorySubregionWest Cascades Klamath East CascadesChange in UnmanagedStands with Protection Low High Very highProbability of ContinuedSuccessful ProtectionOver <strong>the</strong> Next Century High Very low Very lowNeed <strong>for</strong> InnovativeFuture Forest Protection Low High High472
Literature CitedAgee, J.K. 1981. Fire effects on Pacific Northwest <strong>for</strong>ests: flora, fuel, andfauna. In: Northwest Fire Council Proceedings, Northwest Fire Council,Portland, Oregon: 54-66.Agee, J.K. 1989. A history of fire and slash burning in western Oregon andWashington. pp. 3-20 In: Hanley, D. and o<strong>the</strong>rs (eds.). The Burning Decision:Regional Perspectives on Slash. University Washington, Institute ofForest Resources Contribution 66. Seattle, Washington.Agee, J.K. 1990. The historical role of fire in Pacific Northwest <strong>for</strong>ests. Chap.3 In: Walstad, J.D., S.R. Radosevich, and D.V. Sandberg (eds.). Naturaland Prescribed Fire in Pacific Northwest Forests. Oregon State UniversityPress. 317 pp.Agee, J.K. 199 la. Fire history of Douglas-fir <strong>for</strong>ests in <strong>the</strong> Pacific Northwest.pp. 25-33 In: Aubry K. and o<strong>the</strong>rs (eds.) Wildlife and vegetation ofunmanaged Douglas-fir <strong>for</strong>ests. USDA Forest Service Gen. Tech. Rep.PNW-xxx.Agee, J.K. 199 lb. Fire history along an elevational gradient in <strong>the</strong> SiskiyouMountains, Oregon. Northwest Science 65: 188-199.Agee, J.K, and R. Flewelling. 1983. A fire cycle model based on climate <strong>for</strong> <strong>the</strong>Olympic Mountains, Washington. Fire and Forest Meteorology Conference7: 32-37.Agee, J.K., and P. Dunwiddie. 1984. Recent <strong>for</strong>est development on Yellow Island,San Juan County, Washington. Canadian Journal of Botany 62:2074-2080.Agee, J.K., and M.H. Huff. 1987. Fuel succession in a western hemlock/Douglas-fir<strong>for</strong>est. Canadian Journal of Forest Research 17: 697-704.Agee, J.K., L.D. Clark, R.P. Broyles, and L. Rose. 1981. Wilderness fire managementat Pinnacles National Monument. Fire Management Notes 42(1):10-12.Alexander, W.H. 1924. The distribution of thunderstorms in <strong>the</strong> United States.Monthly Wea<strong>the</strong>r Rev. 52: 337-343.Antos, J.A. 1977. Grand fir (Abies grandis IDougl.] Forbes) <strong>for</strong>ests of <strong>the</strong> SwanValley, Montana. M.S. <strong>the</strong>sis, University of Montana, Missoula, Montana.Antos, J.A., and J.R. Habeck. 1981. Successional development in Abiesgrandis (Dougl.) Forbes <strong>for</strong>ests in <strong>the</strong> Swan Valley, western Montana.Northwest Science 55: 26-39.Arno, S.F. 1976. The historical role of fire on <strong>the</strong> Bitterroot National Forest.USDA Forest Service Research Paper. INT-187.Amo, S.F., D.G. Simmerman, and R.E. Keane. 1985. Forest succession onfour habitat types in western Montana. USDA Forest Service GeneralTechnical Report INT- 177.Atzet, T., and D. Wheeler. 1982. Historical and ecological perspectives on fireactivity in <strong>the</strong> Klamath Geological Province of <strong>the</strong> Rogue River andSiskiyou National Forests. USDA Forest Service, Pacific Northwest Region,Portland, Oregon.Atzet, T., D. Wheeler, and R. Gripp. 1988. Fire and <strong>for</strong>estry in southwest Oregon.FIR Report 9(4): 4-7.473
Baker, F.A. 1988. The influence of <strong>for</strong>est management on pathogens. NorthwestEnvironmental Journal 4:229-246.Barrett, S., and S. Arno. 1982. Indian fires as an ecological influence in <strong>the</strong>nor<strong>the</strong>rn Rockies. Journal of Forestry 80: 647-651.Bega, R.V. 1979. Diseases of Pacific coast conifers. USDA Agricculture HandbookNo. 521.Boe, K.N. 1965. Windfall after experimental cuttings in old-growth redwood.Society of American Forest Proc. 1965: 59-63.Bork, J. 1985. Fire history in three vegetation types on <strong>the</strong> eastern side of <strong>the</strong>Oregon Cascades. Ph.D. dissertation, Oregon State University, Corvallis,Oregon.Boyce, J.S. 1929. Deterioration of wind-thrown timber on <strong>the</strong> Olympic Peninsula,Washington. USDA Technical Bulletin 104.Boyce, J.S. 1961. Forest pathology. McGraw-Hill. NY.Boyd, R. 1986. Strategies of Indian burning in <strong>the</strong> Willamette Valley. CanadianJournal of Anthropology 5: 65-86.Brubaker, L.B. 1978. Effects of defoliation by Douglas-fir tussock moth onring sequences of Douglas-fir and grand-fir. Tree Ring Bull. 38:49-60.Buchanan, J. College of Forest Resources, Seattle, Washington.Childs, T.W. 1970. Laminated root rot of Douglas-fir in western Oregon andWashington. USDA Forest Service Reseach Paper PNW- 102.Christiansen, E.C., and S.G. Pick<strong>for</strong>d. 1991. Natural abatement of fire hazardin Douglas-fir blowdown and thinning fuelbeds. Northwest Science 65:(in press).Cobb, D.F. 1988. Development of mixed western larch, lodgepole pine, Douglas-fir,and grand fir stands in eastern Washington. M.S. <strong>the</strong>sis, Universityof Washington, Seattle, Washington.Davis, K.M., B.D. Clayton, and W.C. Fischer. 1980. Fire ecology of Lolo NationalForest habitat types. USDA Forest Service General Technical ReportINT-79.Deeming, J. 1990. Effects of prescribed fire on wildfire occurrence and severity.pp. 95-104 In: Walstad, J.D., and o<strong>the</strong>rs (eds) Natural and PrescribedFire in Pacific Northwest Forests. Oregon State University Press.Dell, J. 1977. Some implications of eliminating prescribed burning as a treatmentoption in managing <strong>for</strong>est vegetation and fuels in <strong>the</strong> Pacific Northwest.USDA Forest Service, Pacific Northwest Region, Portland, Oregon.R-6 Fuel Management Notes 5: 1-10.Dickman, A.W. 1984. Fire and Phelltnus weirit in a mountain hemlock (Tsugamertensiana) <strong>for</strong>est; postfire succession and <strong>the</strong> persistence, distribution,and spread of a root-rot fungus. Ph.D. Dissertation, University Oregon,Eugene, Oregon.Driver, C.H., D.R. Morse, and R.L. Edmonds. 1982. Detection of disease resistancein Douglas-fir seedlings and variation in pathogeneity in Phellinuswebrii by monitoring water stress after inoculation. pp.275-282 In:Heybrock, H.M. and o<strong>the</strong>rs (eds) Resistance to disease and pests in <strong>for</strong>esttrees. Centre <strong>for</strong> Agricultural Publishing and Documentation (Poduc),Wageningen, The Ne<strong>the</strong>rlands.Fahnestock, G.R., and J.K. Agee. 1983. Biomass consumption and smokeproduction by prehistoric and modem <strong>for</strong>est fires in western Washington.Journal of Forestry 81: 653-657.474
Ficken, R.E. 1987. The Forested Land: A History of Lumbering in Western Washington.University of Washington Press, Seattle, Washington. 324 pp.Filip, G.M. 1990. Effect of tree harvesting on Armillaria root diseases in an oldgrowthmixed conifer stand in nor<strong>the</strong>astern Oregon. Northwest Environ.J. 6:412-413.Filip, G.M. and D.J. Goheen. 1984. Root diseases cause severe mortality inwhite and grand fir stands of <strong>the</strong> Pacific Northwest. Forest Science.30:138-142.Finch, R.B. 1984. Fire history of selected sites on <strong>the</strong> Okanogan National Forest.USDA Forest Service, Okanogan National Forest, Okanogan, Washington.Finney, M.A., and R.E. Martin. 1989. Fire history in a Sequoia sempervrens<strong>for</strong>est at Salt Point State Park, Cali<strong>for</strong>nia. Canadian Journal of ForestResearch 19: 1451-1457.Forsman, E.D., S.C. Sovern, M. Taylor, D.N. Rolph and K.J. Maurie. 1990.Home range and habitat of nor<strong>the</strong>rn spotted owls on <strong>the</strong> east slope of <strong>the</strong>Cascade Mountains. Northwest Environmental Journal 6:430-43 1.Franklin, J.F., and C.T. Dyrness. 1973. Natural vegetation of Oregon andWashington. USDA Forest Service General Technical Report. PNW-8.Franklin, J.F., and M.A. Hemstrom. 1981. Aspects of succession in <strong>the</strong> coniferous<strong>for</strong>ests of <strong>the</strong> Pacific Northwest. In: West, D.C. and o<strong>the</strong>rs (eds)Forest Succession. Springer-Verlag. New York.Franklin, J.F., and R.T.T. Forman. 1987. Creating landscape patterns by <strong>for</strong>estcutting: ecological consequences and principles. Landscape Ecology1: 5-18.Franklin, J.F., H.H. Shugart, and M.E. Harmon. 1987 Tree death as an ecologicalprocess. BioScience 37: 550-556.Furniss, R.L. and V.M. Carolin. 1977. Western <strong>for</strong>est insects. USDA ForestService Misc. Publ. No. 1339.Gabriel, H.W. 1976. Wilderness ecology: <strong>the</strong> Danaher Creek drainage, BobMarshall Wilderness, Montana. Ph.D. dissertation, University Montana,Missoula, Montana.Gast, W.R., D.W. Scott, C. Schmitt, D. Clemens, S. Howes, C.G. Johnson, R.Mason, F. Mohr, and R.A. Clapp. 1991. Blue Mountains <strong>for</strong>est healthreport: "New perspectives in <strong>for</strong>est health". USDA Forest Service, PacificNorthwest Region, Malheur, Umatilla, and <strong>the</strong> Wallowa-Whitman NationalForests.Gordon, D.T. 1973. Damage from wind and o<strong>the</strong>r causes in mixed white fir -red fir stands adjacent to clearcuttings. USDA Forest Service Res. Pap.PSW-90.Gratkowski, H. 1956. Windthrow around staggered settings in old growthDouglas-fir. Forest Sci. 2: 60-74.Gray, A. 1990. Forest structure on <strong>the</strong> Siouxon burn, sou<strong>the</strong>rn WashingtonCascades: comparison of single and multiple burns. M.S. <strong>the</strong>sis, Universityof Washington, Seattle.Green, L. 1977. Fuelbreaks and o<strong>the</strong>r fuel modification <strong>for</strong> wildland fire control.USDA Agriculture Handbook. 499.Gross, E., I. Steinblums, C. Ralston, and H. Jubas. 1988. Emergency watershedtreatments on burned lands in southwestern Oregon. pp. 109-114In: Berg, N. (Ed.) Proceedings of <strong>the</strong> Symposium on Fire and WatershedManagement. USDA Forest Service General Technical Report PSW- 109.475
Habeck, J.R. 1990. Old-growth ponderosa pine-western larch <strong>for</strong>ests in westemMontana: ecology and management. Northwest Environ. Journal6:271-292.Hadfield, F.S., D.J. Goheen, G.M. Filip, C.L. Schmitt and RD. Harvey. 1986.Root diseases in Oregon and Washington conifers. USDA Forest Service,State and Private Forestry, Forest Pest Management, Portland, OregonR6-FPM-250-86.Hagle, S.K., S. Tunnock, K.E. Gibson, and C.J. Gilligan. 1987. Field guide todiseases and insect pests of Idaho and Montana <strong>for</strong>ests. USDA ForestService, State and Private Forestry, Missoula, Montana.Haig, I.T., K.P. Davis, and R.H. Weidman. 1941. Natural regeneration in <strong>the</strong>western white pine type. USDA Technical Bulletin 767.Hansen, E.M., and D.J. Goheen. 1989. Root disease complexes in <strong>the</strong> PacificNorthwest. pp. 129-141 In Morrison, D.J. (ed) Proc. 7th InternationalConference Root and Butt Rots. Pacific Forestry Centre, Victoria, B.C.Harcombe, P.A. 1986. Stand development in a 130-year-old spruce-hemlock<strong>for</strong>est based on age structure and 50 years of mortality data. Forest Ecol.Manage. 14: 41-58.Hardy, C.C. 1983. An evaluation of alternative fuel treatments on <strong>the</strong> SiskiyouNational Forest, southwest Oregon. Master of Forest Resources Prof.Pap., University of Washington, Seattle, Washinton. 1Opp.Harris, A.S. 1989. Wind in <strong>the</strong> <strong>for</strong>ests of sou<strong>the</strong>ast Alaska and guides <strong>for</strong> reducingdamage. USDA Forest Service General Technical Report PNW-GTR-244.Hawksworth, F. G. and D. Wiens. 1972. Biology and management of dwarfmistletoes. USDA Agriculture Handbook No. 401.Helgerson, 0. 1988. Historic fire year <strong>for</strong> Oregon and Cali<strong>for</strong>nia. FIR Notes9(4): 2-4.Heinselman, M. 1981. Fire intensity and frequency as factors in <strong>the</strong> distributionand structure of nor<strong>the</strong>rn ecosystems. pp. 7-57 Irn Mooney, H.A.and o<strong>the</strong>rs (eds.) Fire Regimes and Ecosystem Properties. USDA ForestService General Technical Report WO-26.Hemstrom, M.A., and J.F. Franklin. 1982. Fire and o<strong>the</strong>r disturbances of <strong>the</strong><strong>for</strong>est in Mount Rainier National Park. Quaternary Research 18: 32-51.Henderson, J.A., and D. Peter. 1981. Preliminary plant associations and habitattypes of <strong>the</strong> Shelton Ranger District, Olympic National Forest. USDAForest Service, Pacific Northwest Region, Portland, Oregon.Henderson, J.A., D.H. Peter, R.D. Lesher, and D.C. Shaw. 1989. Forestedplant associations of <strong>the</strong> Olympic National Forest. USDA Forest Service,Pacific Northwest Region R6 ECOL Tech. Pap. 001-88.Hepting, G. 1971. Diseases of <strong>for</strong>est and shade trees of <strong>the</strong> United States.USDA Forest Service, Agriculture Handbook No. 386.Hines, W.W. 1971. <strong>Plan</strong>t communities in <strong>the</strong> old growth <strong>for</strong>ests of northcoastal Oregon. M.S. <strong>the</strong>sis. Oregon State University. Corvallis, Oregon.Holsten, E.H., P.E. Hennon and R.A. Werner. 1985. Insects and diseases ofAlaskan <strong>for</strong>ests. USDA Forest Service, State and Private Forestry, ForestPest Management, Alaska Region Report No. 181.Huff, M.H. 1984. Post-fire succession in <strong>the</strong> Olympic Mountains, Washington:<strong>for</strong>est vegetation, fuels, and avifauna. Ph.D. dissertation. University ofWashington, Seattle, Washington.476
Huff, M.H., and J.K. Agee. 1980. Characteristics of large lightning fires in <strong>the</strong>Olympic Mountains, Washington. Fire and Forest Meteorology Conf.Proc. 6: 117-123.Isaac, L.A. 1940. Vegetation succession following logging in <strong>the</strong> Douglas-firregion with special reference to fire. Journal of Forestry 38: 716-721.Jacobs, D.F., D.W. Cole, and J.R. McBride. 1985. Fire history and perpetuationof natural coast redwood ecosystems. Journal of Forestry 83: 494-497.Johnson, W.T., and H.H. Lyon. 1988. Insects that feed on trees and shrubs.Cornell University Press, Ithaca, New York.Kastner, W.W. 1991. Relationship between occurrence of laminated root rotand site characteristics and its impacts in Douglas-fir <strong>for</strong>ests of <strong>the</strong>nor<strong>the</strong>rn Oregon Coast Range. Prof. Paper, Master of Forest Resources,University of Washington, Seattle, Washington.Keane, R.E., S.F. Arno, and J.K. Brown. 1990. Simulating cumulative fire effectsin ponderosa pine/Douglas-fir <strong>for</strong>ests. Ecology 71: 189-203.Lewis, H. 1973. Patterns of Indian burning in Cali<strong>for</strong>nia: ecology andethnohistory. In: Bean, L. (ed.) Anthropological Pap. 1. Ballena Press,Ramona, Cali<strong>for</strong>nia.Means, J.E. 1982. Developmental history of dry coniferous <strong>for</strong>ests in <strong>the</strong> centralwestern Cascade Range of Oregon. pp. 142-158 In: Means, J.E. (ed)Forest succession and stand development research in <strong>the</strong> Northwest.Forest Research Lab., Oregon State University, Corvallis, Oregon.Moore, K., and B. MacDonald 1974. Final report of <strong>the</strong> fringe-strip study team.British Columbia Fish and Widlife Branch, Nanaimo, British Columbia,unpub. rep., 19 pp.Morgan, P.D., and C.H. Driver. 1972. Rhizina root rot of Douglas-fir seedlingsplanted on burned sites in Washington. <strong>Plan</strong>t Disease Reporter 56: 407-409.Morris, W.G. 1934. Forest fires in western Oregon and Washington. OregonHist. Quarterly 35: 313-339.Morris, W.G. 1970. Effects of slash burning in overmature stands of <strong>the</strong> Douglas-firregion. Forest Sci. 16: 258-270.Morrison, P. and F. Swanson. 1990. Fire history and pattern in a CascadeRange landscape. USDA Forest Service General Technical Report. PNW-254.Norton, H. 1979. The association between anthropogenic prairies and importantfood plants in western Washington. Northwest Anthropological ResearchNotes 13: 175-200.Old-growth Defnition Task Group. 1986. Interim definitions <strong>for</strong> old-growthDouglas-fir and mixed-conifer <strong>for</strong>ests in <strong>the</strong> Pacific Northwest and Cali<strong>for</strong>nia.USDA Forest Service Res. Note PNW-447.Oliver, C.D. 1981. Forest development in North America following major disturbances.Forest Ecol. Manage. 3:153-168.Oswald, D.D. 1968. The timber resources of Humboldt County, Cali<strong>for</strong>nia.USDA Forest Service Resour. Bull. PNW-26.Partridge, A.D., E.R. Canfield, R.J. Chacko, D.L. Kulhavy, H.L. Osborne, J.W.Schwandt, and R.E. Stone. (undated). Keys to major disease insect andrelated problems of <strong>for</strong>ests in nor<strong>the</strong>rn Idaho. University of Idaho Forest,Wildlife, and Range Experiment Station Contribution No. 27. Moscow,Idaho.477
Perry, D.A., and J.G. Borchers. 1990. Climate change and ecosystem response.Northwest Environ. J. 6:293-313.Peterson, D.L., and K.C. Ryan. 1986. Modeling post-fire conifer mortality <strong>for</strong>long-range planning. Environmental Management 10: 797-808.Pettinger, L.F. and D.J. Goheen. 1972. A field guide to important <strong>for</strong>est insectsand diseases of Oregon and Washington. USDA Forest Service, PacificNorthwest Region, Division of Timber Management.Pick<strong>for</strong>d, S.G., G. Fahnestock, and R. Ottmar. 1980. Wea<strong>the</strong>r, fuels, andlightning fires in Olympic National Park. Northwest Sci. 54: 92-105.Pyne, S.J. 1982. Fire in America: a cultural history of wildland and rural firein America. Princeton University Press.Quinault Natural Resources 1983. The great fire of 500 years ago. Quin. Nat.Res. IV,5: 23.Reinhardt, E.D., and K.C. Ryan. 1988. Eight-year tree growth followingprescribed underburning in a western Montana Douglas-fir/western larchstand. USDA Forest Service Res. Note INT-387.Ruediger, W.C. 1985. Implementing a spotted owl plan: <strong>the</strong> Gif<strong>for</strong>d PinchotNational Forest experience. pp. 10-13 In: Gutierrez, R.J., and A.B. Carey(eds). Ecology and management of <strong>the</strong> spotted owl in <strong>the</strong> Pacific Northwest.USDA Forest Service General Technical Report. PNW- 185.Ruth, R.H., and A.S. Harris. 1979. Management of western hemlock - Sitkaspruce <strong>for</strong>ests <strong>for</strong> timber production. USDA Forest Service GeneralTechnical Report. PNW-88.Ruth, R.H., and R.A. Yoder. 1953. Reducing wind damage in <strong>the</strong> <strong>for</strong>ests of <strong>the</strong>Oregon Coast Range. USDA Forest Service Pac. Northwest Forest andRange Experiment Station Res. Pap. 7.Sawyer, J.O., D.A. Thornburgh, and J.R. Griffim. 1988. Mixed evergreen <strong>for</strong>est.pp. 359-381 In: Barbour, M.G., and J. Major (eds.) Terrestrial Vegetationof Cali<strong>for</strong>nia. Cali<strong>for</strong>nia Native <strong>Plan</strong>t Society Special Pub. 9.Schowalter, T.D. 1988. Forest pest management: a synopsis. NorthwestEnviron. J. 4:313-318.Shinn, D. 1980. Historical perspectives on range burning in <strong>the</strong> inland PacificNorthwest. Jour. Range Management 33: 415-422.Sinclair, W.A., H.H. Lyon and W.T. Johnson. 1987. Diseases of trees andshrubs. Cornell University Press, Ithaca, New York.Steinbrenner, E.C., and S.P. Gessel. 1956. Windthrow along cutlines inrelation to physiography on <strong>the</strong> McDonald Tree Farm. WeyerhaeuserForestry Res. Notes 15. Centralia, Washington.Stewart, G.H. 1986. Population dynamics of a montane conifer <strong>for</strong>est, westernCascade Range, Oregon, USA. Ecology 67: 534-544.Stone, E.C., R.F. Grah, and P.J. Zinke. 1969. An analysis of <strong>the</strong> buffers andwatershed management required to preserve <strong>the</strong> redwood <strong>for</strong>est andassociated streams in <strong>the</strong> Redwood National Park. Stone and Associates.Berekley. Cali<strong>for</strong>nia. Mimeo Rep. 106 pp.Stoszek, K. J. 1988. Forests under stress and insect outbreaks. NorthwestEnviron. J. 4:247-261.Stuart, J.D. 1987. Fire history of an old-growth <strong>for</strong>est of Sequoia sempervfrensflaxodiaceae) <strong>for</strong>est in Humboldt Redwoods State Park, Cali<strong>for</strong>nia.Madrono 43: 128-141.478
Stuiver, M., and P. Quay. 1980. Changes in atmospheric carbon-14 attributedto a variable sun. Science 207: 11-19.Sudworth, G. 1908. Forest trees of <strong>the</strong> Pacific slope. USDA Forest Service,Washington, D.C.Swetnam, T.W. and A.M. Lynch. 1989. A tree ring reconstruction of westernspruce budworm history in <strong>the</strong> sou<strong>the</strong>rn Rocky Mountains. Forest Sci.35:962-986.Tappeiner, J.C., T.B. Harrington, and J.D. Walstad. 1984. Predicting recoveryof tanoak (Lithocarpus densiflorus) and Pacific madrone (Arbutusmenziesitj after cutting or burning. Weed Sci. 32: 413-417.Taylor, A.R. 1974. Ecological aspects of lightning in <strong>for</strong>ests. Tall Timbers FireEcology Conf. Proc. 13: 455-482.Teensma, P. 1987. Fire history and fire regimes of <strong>the</strong> central western Cascadesof Oregon. Ph.D. Dissertation, University Oregon, Eugene.Thies, W.G. 1984. Laminated root rot: <strong>the</strong> quest <strong>for</strong> control. Journal of Forestry82:345-356.Thomas, J.W., E.D. Forsman, J.B. Lint, E.C. Meslow, B.R. Noon, and J.Verner. 1990. A conservation strategy <strong>for</strong> <strong>the</strong> nor<strong>the</strong>rn spotted owl. Areport by <strong>the</strong> Interagency Scientific Committee to address <strong>the</strong> conservationof <strong>the</strong> nor<strong>the</strong>rn spotted owl. USDA Forest Service, and USDI Fishand Wildlife Service, Bureau of Land Management, and National ParkService. Portland, Oregon.Thomas, T. and J.K. Agee. 1986. Prescribed fire effects on mixed conifer <strong>for</strong>eststructure at Crater Lake, Oregon. Canadian Journal of Forest Res. 16:1082-1087.Thornburgh, D.A. 1982. Succession in <strong>the</strong> mixed evergreen <strong>for</strong>ests of northwesternCalifomia. pp. 87-91 In: Means, J.E. (ed) Forest succession andstand development research in <strong>the</strong> Northwest. Forest Research Lab.,Oregon State University, Corvallis, Oregon.Thwaites, R.G. (ed.) 1905. Original journals of <strong>the</strong> Lewis and Clark expedition1804-06. Dodd,,Mead. New York. Tkacz, B.M. and E.M. Hansen. 1982.Damage by laminated root rot in two succeeding stands of Douglas-fir.Joumal of Forestry 80:788-79 1.Trewartha, G.T. 1968. An Introduction to Climate: Fourth Edition. Mc-Graw-Hill Book Company, New York.USDA Forest Service. 1983. Forest disease management notes. USDA ForestService, Pacific Northwest Region, Forest Pest Management, Portland,Oregon.van Wagtendonk, J.W. 1985. Fire suppression effects on fuels and successionin short-fire-interval wilderness ecosystems. pp. 119-126 In: Lotan, J.and o<strong>the</strong>rs (eds) Proceedings - Symposium and workshop on wildernessfire. USDA Forest Service General Technical Report. INT- 182.Veirs, S. 1980. The influence of fire in coast redowood <strong>for</strong>ests. pp. 93-95 In:Stokes, M. A. and J.H. Dieterich (eds). Proceedings of <strong>the</strong> Fire HistoryWorkshop. USDA Forest Service General Technical Report. RM-81.Walters, C. 1986. Adaptive management of renewable resources. Macmillan,New York.Waring, R.H., K. Cromack, Jr., P.A. Matson, R. Boone, and S.G. Staf<strong>for</strong>d.1987. Responses to pathogen-induced disturbance: decomposition, nutrientavailability and tree vigour. Forestry 60:219-228.479
Wea<strong>the</strong>rspoon, C.P., and C.N. Skinner. no date. An assessment of factors associatedwith damage from <strong>the</strong> 1987 wildfires in nor<strong>the</strong>rn Cali<strong>for</strong>nia. Unpublishedmanuscript, USDA Forest Service, Pacific Southwest ResearchStation, Redding, Cali<strong>for</strong>nia. 27 pp. + tables and figures.White, P.S. 1979. Pattern, process, and natural disturbance in vegetation.Bot. Rev. 45: 229-299.White, P.S., and S.T.A. Pickett. 1985. Natural disturbance and patch dynamics:an introduction. Chap. 1 In: Pickett, S.T.A., and P. White (eds.) TheEcology of Natural Disturbance and Patch Dynamics. Academic Press,New York. 472 pp.White, R. 1980. Land use, environment, and social change: <strong>the</strong> shaping ofIsland County, Washington. University Washington Press. Seattle,Washington.Whittaker, R.H. 1960. Vegetation of <strong>the</strong> Siskiyou Mountains, Oregon and Cali<strong>for</strong>nia.Ecol. Monographs 30: 279-338.Wicker, E.F. and C.D. Leaphart. 1976. Fire and dwarf mistletoes(Arceuthobtum spp.) relationships in <strong>the</strong> nor<strong>the</strong>rn Rocky Mountains. TallTimbers Fire Ecology Conference Proc. 14: 279-298.Wickman, B.G. 1990. Old-growth <strong>for</strong>ests and history of insect outbreaks.Northwest Environ. J. 6:401-403.Wills, R. 1991. Fire history and stand development of Douglas-fir/hardwood<strong>for</strong>ests in nor<strong>the</strong>rn Cali<strong>for</strong>nia. M.S. <strong>the</strong>sis, Humboldt State University,Arcata, Cali<strong>for</strong>nia.Yamaguchi, D.K. 1986. The development of old-growth Douglas-fir <strong>for</strong>estsnor<strong>the</strong>ast of Mt. St. Helens, Washington, following an A.D. 1480 eruption.Ph.D. dissertation, University of Washington, Seattle, Washington.Zinke, P. 1988. The redwood <strong>for</strong>est and associated north coast <strong>for</strong>ests. pp.679-698 In: Barbour, M.G., and J. Major (eds.) Terrestrial Vegetation ofCali<strong>for</strong>nia. Cali<strong>for</strong>nia Native <strong>Plan</strong>t Society Special Pub. 9.480
Apendix GkManaging Stands <strong>for</strong>Nor<strong>the</strong>rn <strong>Spotted</strong> <strong>Owl</strong> HabitatThis report was prepared by Dr. John Tappeinerand <strong>the</strong> following scientists:K.qK__Nor<strong>the</strong>rn CaU<strong>for</strong>mia - Sou<strong>the</strong>rn OregonRob Lewvis - U.S Bureau of Land Management, Med<strong>for</strong>dl DistrictDr. Steve Tesch - College of Forestry, Oregon State UniversityDr. Dalee Thombuigh - Departmnent of Forestry, Humboldt State UniversityDr. Phil Wea<strong>the</strong>rspoon - U.S. Forest Servic, Thacjfc Southwvest EDpernment Station,Redding, Call<strong>for</strong>nia~~~~~~~~~~~~~OregonCascades and Coast RangeKevin Birch - Oregon Departmrent of ForestryWalt Knapp - U.S. Forest Service, Portland, OregonDr. Bill McComb - College of Forestry, Oregon State UniversityBob Saunders - U.S. Forest Service, Willamrette National ForestDr. Torn Spies - U.S. Forest Service, Research Lab, Corvallis, OregonDr. John Zasada - U.S. Forest Service. Research Lab, Corvallis, Oregon2 ~~~~~~~~~~WesternWashirngton and East Cascades~~~~~~~~MonteBick<strong>for</strong>d - U.S. Forest Service, Wenatchee National Forest~~~~~~~~~~~~~~Dr.Bob Gama - UniL'ersity of WashingtonDr. Connie Harrngton - U.S. Forest Service, Research Lab, Olympia, WashinigtonDr. Lorin Hicks - Plumn Creek T1mber Company, WashingtonDr. Jerry Hoyer - Washington Department of Natural ResourcesDr. ~~George Leitner - U.S. Forest Service, Region 6, Plortland, OregonD.SnyMartin - U.S. Forest Service. Research Lab, Wenatchee, WashingtonDr. Chad Oliver - College of Forest Resources, University of WashingtonC~~~~~~~Terry Raettig - Washington Governor's Thimber Teamn481
482
Table of Contents1. Summary of Literature Review and Experience . ........................ 485A. Stand Structure and <strong>Owl</strong> Habitat .................................................. 486B. Producing Stand Structure <strong>for</strong> Nor<strong>the</strong>rn <strong>Spotted</strong> <strong>Owl</strong>s .................... 486II. Review of Natural Vegetation and Stand Development -History of Forest Management ...................................................... 492A. Coastal Forests and Western Cascades of Oregon and Washington .4921. Natural Forest Development .................................................... 4922. Forest Management and Stand Development ........................... 493B. Nor<strong>the</strong>rn Cali<strong>for</strong>nia and Southwestern Oregon ............................... 4941. Natural Forest Development .................................................... 4942. Forest Management and Stand Development ........................... 495C. East Cascades of Oregon and Washington ..................................... 495III. Stand Development and Management . ............................... 496A. Stand Manipulation and Thinning ................................................. 496B. Understory Vegetation and Advanced Regeneration ........................ 500C. Fertilization ...................................................... 501D. Historical Stand Management Practices ........................................ 501E. Stand Simulators and Growth Models ........................................... 502IV. Examples of Silviculture Prescriptions . ............................... 502A. Douglas-fir and Western Hemlock Stands ...................................... 503B. Douglas-fir from Oregon Coast Range ............................................ 503C. Redood and Mixed Conifer from Northwestern Cali<strong>for</strong>nia ............... 508D. Douglas-fir and Tanoak from Southwestern Oregon ....................... 510E. Uneven-age Management in MixedConifer Forests in Nor<strong>the</strong>rn Cali<strong>for</strong>nia ........................................... 510F. Multilayer/Mixed Species East Side Cascades ................................ 513Summary ...................................................... 518Literature Cited ...................................................... 519483
484
I. Summary of Literature Reviewand ExperienceThis report discusses management of <strong>for</strong>est stands <strong>for</strong> nor<strong>the</strong>rn spotted owlhabitat. We present examples of silvicultural systems and treatments whichresemble natural <strong>for</strong>est disturbances. These systems can be used to accelerate<strong>the</strong> development of stand structures used by owls and to grow habitat instands where it is not likely to occur through natural stand development. Weuse stand structure (density, stocking by tree species and size class, snags,logs on <strong>the</strong> <strong>for</strong>est floor) of stands that contain owl nest sites as goals (or desiredfuture conditions) <strong>for</strong> <strong>the</strong>se silvicultural systems. We use data from actualstands to develop examples of silvicultural systems which will produce owlhabitat.A silvicultural system is a series of treatments to trees, shrubs, and o<strong>the</strong>rplants designed to produce a desired stand through time-in this case, astructure that provides habitat <strong>for</strong> nor<strong>the</strong>rn spotted owls. The treatments andtechniques employed necessarily will vary throughout <strong>the</strong> range of nor<strong>the</strong>rnspotted owls. For example, in some <strong>for</strong>ests in nor<strong>the</strong>rn Cali<strong>for</strong>nia and easternWashington Cascades where <strong>the</strong>re has been a history of harvesting individualtrees or small groups of trees, <strong>the</strong>re are mixed-species stands composed oftrees of various sizes or ages. In <strong>the</strong>se <strong>for</strong>ests, silvicultural systems shouldmaintain this diverse structure, while ensuring that <strong>the</strong>re will be large trees in<strong>the</strong> future and protecting stands against fire, insects, and disease. In <strong>the</strong>se<strong>for</strong>ests, mimicking natural disturbance (i.e., fire) too closely may reduce owlhabitat. In o<strong>the</strong>r <strong>for</strong>ests of Cali<strong>for</strong>nia, Oregon, and Washington, stands arecomposed of trees of relatively uni<strong>for</strong>m sizes and ages. Here, silviculturalsystems that attempt to mimic natural, small-scale disturbances and increaseunderstory tree regeneration to develop multilayered stands seem appropriate.In many of <strong>the</strong>se <strong>for</strong>ests, windthrow and <strong>the</strong> regeneration of trees in denseunderstories of shrubs are probably of more concern than fire.Not all <strong>the</strong>se stands "need" to be treated to develop into suitable habitat. Somestands already provide habitat or will provide it in a short time without intervention.However, many o<strong>the</strong>r stands have been managed <strong>for</strong> wood production,not <strong>for</strong> owl habitat, and <strong>the</strong>y will not readily produce multistoried standswithout treatment. Thus, <strong>the</strong>re are many stands in which treatment mayhasten development of habitat, and many stands in which maintenance ofhabitat and wood production may occur simultaneously. The potential <strong>for</strong> astand to produce owl habitat varies from stand to stand and depends onvariables such as tree and shrub species composition; site productivity: and<strong>the</strong> age, size, number, and spatial distribution of trees. For example, standswith a high stocking of conifers will not quickly produce large trees with deepcrowns or develop a multistoried structure. Stands with a dense understory ofshrubs may not produce additional layers of trees because regeneration oftrees cannot occur under <strong>the</strong> shrubs. Stands must be evaluated individuallyto determine <strong>the</strong>ir potential <strong>for</strong> producing habitat and which silviculturesystem to apply, if any. The possibilities <strong>for</strong> managing stands <strong>for</strong> owls areconsiderable. For example, we estimate that within <strong>the</strong> habitat conservationareas (HCAs) proposed by <strong>the</strong> Interagency Scientific Committee (ISC) <strong>the</strong>re aremore than 2 million acres in stands on federal lands in Oregon and Washingtonthat are not suitable owl habitat.<strong>Plan</strong>ning <strong>for</strong> silviculture systems to provide owl habitat must be done at <strong>the</strong>landscape and stand levels. Landscape variables to evaluate include locationof owls: habitat <strong>for</strong> owl prey: types of stands not providing habitat including485
area, structure, ages, location; need <strong>for</strong> fire protection and fuel breaks: diseaseand insect populations: access, and o<strong>the</strong>r uses. When thinning stands, <strong>for</strong>example, activities probably should be spread over time and space to avoidhaving large contiguous areas of temporarily open canopy, and to avoid nestingowls. Similarly, treatments such as prescribed burning to reduce fire hazardshould be scheduled with regard to stand structure, owl use, fuel concentrations,fire control strategies, and o<strong>the</strong>r considerations.A. Stand Structure and <strong>Owl</strong> Habitat<strong>Owl</strong> habitat as used in this report is defined as <strong>the</strong> stand structures that owlsuse <strong>for</strong> nesting. This type of habitat is apparently <strong>the</strong> most critical <strong>for</strong> survivaland recovery of owls. The structure has been quantified (see Appendix B) bystudies in which tree diameter and heights as well as snags, logs, and o<strong>the</strong>rvegetation were inventoried in stands used <strong>for</strong> nesting. The structures ofstands used <strong>for</strong> nesting are consistently multistoried with many small treesand fewer large trees per area (Figure G. 1). They are typically mixed specieswith two or more age classes which have developed following one or moredisturbances such as light fire, windthrow, and root diseases. Species in <strong>the</strong>overstory are generally redwood, ponderosa pine, sugar pine, western hemlock,and Douglas-fir, while <strong>the</strong> understory may include western hemlock, westernred cedar, white fir, tanoak, bigleaf maple, and Douglas-fir on dry sites. Thereare often large dead trees and logs on <strong>the</strong> <strong>for</strong>est floor. The structures resemblethose of old-growth stands (Spies and Franklin 1991).B. Producing Stand Structure <strong>for</strong> Nor<strong>the</strong>rn<strong>Spotted</strong> <strong>Owl</strong>sActual examples of thinning show that reducing <strong>the</strong> density of overstory treesallows space <strong>for</strong> trees to produce large crowns and stems, and <strong>for</strong> trees andshrubs to be established in <strong>the</strong> understory (Figures G.2 and G.3). If stocking isnot controlled, dense stands may develop (Figure G.4), and it would take manyyears <strong>for</strong> <strong>the</strong>se stands to produce owl habitat.The following key points emerge from <strong>the</strong> review of stand development historyand literature (11 and 111) and from developing silviculture prescriptions (IV):1. Disturbances of various sizes and intensities are a natural part of longterm<strong>for</strong>est stand development.2. Many stands within <strong>the</strong> range of <strong>the</strong> owl are growing at high densities(many trees per area). Thinning <strong>the</strong>se stands will increase growth rates,sizes of crowns, and diameters of remaining trees.3. Mortality caused by suppression and crowding among trees is not likelyto provide large snags or logs on <strong>the</strong> <strong>for</strong>est floor because only <strong>the</strong> smallertrees die. Thinning of stands will shift <strong>the</strong> size of a tree that dies fromdisease, insect, fire, and o<strong>the</strong>r causes, to large sizes.4. To provide large snags and logs on <strong>the</strong> <strong>for</strong>est floor in young (30 to 80+years) conifer stands, it often may be necessary to kill some of <strong>the</strong> largertrees in <strong>the</strong> stand. This is particularly true <strong>for</strong> stands regenerated afterharvesting or re<strong>for</strong>estation following a fire.5. Development of a multistoried stand from single-story conifer standsgenerally will require thinning, small openings in <strong>the</strong> canopy, or someo<strong>the</strong>r disturbance to reduce overstory density. If a dense layer of shrubsis present, disturbance or control of this layer likely will be required toestablish conifers or hardwoods which can <strong>for</strong>m <strong>the</strong> additional layers.6. Young stands (10 to 80+ years) on productive sites develop quite rapidly.486
6E Hardwood snagsLiConifer snagsN I\Trees per acre16012080400Trees per acre107 C87 Hl Hardwoods (H)ft49C35 H32C14 H
Stand AFigure G.2. A--unthmnned Douglas-fir stand 65 years old; average diameter at 4.5 feet is about 15 inches. Salal, Oregon grape,and swordfem wnderstory will likely preclude <strong>the</strong> establishment of species which would <strong>for</strong>m a muftistorled stand. B-a 65-year-oldstand thinned to 50 trees per acre at age 45 years, and planted with western hemlock: Douglas-fir diameter averages about 29inches. Stand B is likely to produce suitable habitat more quickly <strong>for</strong> spotted owls than stand A. Photographs taken near Folls City.Oregon.488
To treat <strong>the</strong>m most effectively, treatment should begin early in <strong>the</strong> life of<strong>the</strong> stand when <strong>the</strong>y are most "plastic", be<strong>for</strong>e crowns become short andstands become susceptible to wind damage, insects, and diseases. Failureto treat stands be<strong>for</strong>e <strong>the</strong>y become too dense will reduce options <strong>for</strong> futuretreatments and will delay substantially <strong>the</strong> development of stand structuresused by owls.7. To maintain uneven-size/age stand structure in many nor<strong>the</strong>rn Cali<strong>for</strong>niaand eastern Cascades <strong>for</strong>ests and to keep ponderosa pine in <strong>the</strong>se <strong>for</strong>ests,it will be necessary to make openings and to thin dense stands or parts ofstands. Thinning also will help relieve disease and insect problems in<strong>the</strong>se <strong>for</strong>ests.8. In fire-prone areas in nor<strong>the</strong>rn Cali<strong>for</strong>nia, sou<strong>the</strong>rn Oregon, and <strong>the</strong>eastern Cascades, where natural fire has been excluded, <strong>the</strong>re may beshort-term habitat improvement. However, in <strong>the</strong> long term <strong>the</strong>se standsmay be destroyed by fire if fuel loading and <strong>the</strong> potential <strong>for</strong> severe wildfireare not reduced.9. Seedlings and saplings of shade-tolerant conifers and hardwoods needed to<strong>for</strong>m multistory stands will be present in some stands as advanced regeneration.In o<strong>the</strong>r stands, it will be necessary to control dense shrub/hardwood understories to attain regeneration by planting or seeding.489
figure 0.3. Effects of thinning Douglas-ftr. Stands are about 40 years okld Photograph takennear Hoskins, Oregon (Curtis and Marshall 1986).G.3.A. (treatment 9) = no thinning. No understory: average tree diamneter at 4.5 feet is about 12inches.G.3.B. (treatment 7) = lightly thinned. Some understory development: average diameter is about18 inches.490
0.3.C. (treatment 1) = heavy thinning. Considerable understory: aver-age diameter about 20 inches.See Figure G.5 and G.6.Figure G.4. An unthinned,dense Douglas-fir standabout 70 years old, with nounderstory. Carefulthinning and making smallopenings. followed byestablishing shade-tole-ranttree species, would aid <strong>the</strong>development of amultistoried stand and owlhabitat. Thinnings atearlier ages would haveresulted in trees with largerdiameter stems, longercrowns, development of anunderstory, as well ascommercial wood production.491
II. Review of Natural Vegetation and StandDevelopment - History of ForestManagementA. Coastal Forests and Western Cascades ofOregon and WashingtonForests on federal lands in <strong>the</strong> western Cascades and Coast Range mountainsof Oregon generally are classified in <strong>the</strong> western hemlock and silver fir zones byFranklin and Dyrness (1973). There is generally plentiful moisture throughout<strong>the</strong>se zones, and plant associations range from oxalis and sword fern on moistsites to Douglas-fir, ocean spray, vine maple, and salal on drier sites. Olderstands in <strong>the</strong>se <strong>for</strong>ests often have a well-developed understory of shrubs andhardwoods such as vine maple, yew, bigleaf maple, salal, salmonberry,rhododendron, hazel, ocean spray, and huckleberry. Conifers in <strong>the</strong> understoryare primarily western hemlock and western red cedar on moist sites.Grand fir and Douglas-fir may occur on dry sites, and silver and noble fir atupper elevations.1. Natural Forest DevelopmentNatural disturbances in <strong>the</strong>se <strong>for</strong>ests occur over a range of sites, frequencies,intensities, and patterns. Under natural conditions, stand replacement firesoccurred at intervals of about 95 years to more than 500 years (Appendix F)with <strong>the</strong> longer intervals on moist sites. These fires often burned many thousandsof acres. The mortality of <strong>the</strong> overstory within <strong>the</strong>se extensive bumsvaried considerably (Spies and Franklin 1991, Morrison and Swanson 1990).Groups of trees and scattered individual trees often survived more than onefire. Thus, <strong>the</strong> Douglas-fir overstory in old-growth <strong>for</strong>ests is often multi-aged(Franklin and Hemstrom 1981). Even with fire suppression, large fires canoccur, <strong>for</strong> example, <strong>the</strong> Tillamook bum in <strong>the</strong> 1930s and <strong>the</strong> Oxbow fire in <strong>the</strong>1960s.Wind effects are most severe on ridge tops and near <strong>the</strong> coast and ColumbiaGorge, although severe storms like <strong>the</strong> Columbus Day Storm of 1961 causedmajor disturbances on a wide range of sites (Ruth and Harris 1979). Windeffects are often small-scale, blowing down small groups (less than one acre)and individual trees and breaking tops: although entire stands (more than 20acres) may be blown down. Insect populations (bark beetles) often increaseafter fire or blowdown.Root and stem diseases are widespread, but <strong>the</strong>y generally occur on a smallerscale than wind and fire. They slowly kill groups of trees. Over extensive areas,root disease may affect more than 10 percent of <strong>the</strong> entire area. O<strong>the</strong>r agentsof disturbance include ice storms, which mostly break <strong>the</strong> tops of stands ofyoung trees, and mass movement such as landslides, which are importantlocally.Individual trees also die because of competition among trees (Drew andFlewelling 1979). Self-thinning is a natural part of stand development andoccurs much more quickly on more productive sites than on poor sites. Rateof self-thinning is dependent on species composition and stand density.492
These factors act toge<strong>the</strong>r to affect <strong>the</strong> rate and course of stand development(Spies et al. 1991). For example, natural succession after fire likely wouldresult in a variety of young stands irregularly stocked with conifers, shrubs,and hardwoods, some large green trees not killed by <strong>the</strong> fire, and often largeaccumulations of snags and down logs from <strong>the</strong> previous stand (Spies et al.1988). As stand development continued, conifers would dominate parts ofstands and if <strong>the</strong>y are dense enough, shrubs and hardwoods would be excluded(Oliver 1981). In o<strong>the</strong>r parts of <strong>the</strong> stand, conifers would grow in <strong>the</strong>open and develop large crowns and branches, and patches of shrubs andhardwoods would remain. After about 80 years, wind, pathogens, and selfthinningwould kill individual overstory conifers and groups of conifers producingopenings, snags, and down logs. Patches of shade-tolerant conifers,hardwoods, and shrubs would grow in <strong>the</strong> openings (Alaback and Tappeiner1991). Where shrub layers were dense, tree regeneration would be excluded ortime <strong>for</strong> its establishment greatly extended. This process of disturbances atirregular intervals would continue producing waves of tree and shrub regeneration,snags, and down logs and providing a diverse structure (Spies andFranklin 1991, Spies et al. 1988, Spies et al. 1990).Natural disturbances to <strong>for</strong>est stands vary in intensity, distribution, frequency,and size. Viewed in <strong>the</strong> context of <strong>the</strong> home range of an owl (about 3,000acres, <strong>for</strong> example) <strong>the</strong>se disturbances may be extremely small (a 0.05-acreopening, less than 0.0002 percent of a home range) or <strong>the</strong>y could include <strong>the</strong>entire home ranges of one to many spotted owls.2. Forest Management and Stand DevelopmentWhile timber harvest on private lands began in <strong>the</strong> late 1800s, major timberharvest programs by <strong>the</strong> Forest Service and BLM started about 1945 to 1950.Due to concerns <strong>for</strong> road access, logging methods, watershed impacts, andproviding edge <strong>for</strong> elk and deer, 'patch cutting" (usually more than 20 acres)was used; that is, stands scattered throughout a watershed were clear-cut andplanted. Since harvesting on federal lands began about 40 years ago, today inmost watersheds young stands are usually 0 to 40 years of age, and <strong>the</strong>re arenatural stands of large old trees. Thus, today <strong>the</strong>re is a strongly bimodal agedistribution between managed and unmanaged stands. In addition, <strong>the</strong>re aresome natural stands of intermediate ages resulting from fire, wind, and earlierharvesting. Harvest by thinning in some areas also has occurred in <strong>the</strong> last 20to 30 years.Treatments to establish plantations following clear-cutting or fire have tendedto alter secondary succession to ensure well-stocked conifer stands. Thecourse of <strong>for</strong>est succession following fire or harvesting of mature or old <strong>for</strong>estsvaries depending upon severity of disturbance, composition of preharvestvegetation, site conditions, availability of conifer seeds, and animal populationlevels. In most situations, if Douglas-fir seed is not available in sufficientquantities immediately after harvest, tree regeneration is slow and irregularand generally unacceptable in terms of meeting wood production objectives.Because of this long, natural regeneration period, most sites are planted assoon after harvesting as possible. To reduce growth of broad-leaved trees,shrubs, and herbs, some type of site preparation (fire, mechanical, chemical) isdone following harvesting and be<strong>for</strong>e planting. <strong>Plan</strong>ting often is followed bysome treatment that reduces density and vigor of nonconiferous vegetation.The purpose of <strong>the</strong>se practices is to obtain a uni<strong>for</strong>m conifer stand and quicklyachieve conifer crown closure <strong>the</strong>reby shortening <strong>the</strong> period of dominance bynonconifers. Stocking control is important <strong>for</strong> obtaining correct stand structure.Precommercial thinning is done often in 10- to 20-year-old stands toensure uni<strong>for</strong>m conifer spacing and control density of conifers and hardwoods.This is especially necessary on coastal sites where natural regeneration of493
western hemlock, and sometimes o<strong>the</strong>r conifers, occurs among planted seedlingsand dramatically increases stocking (700 + trees per acre). Foreststands, especially plantations established <strong>for</strong> timber production, often willproceed through a stem exclusion stage (Oliver 1981) in which shrubs andhardwoods die or become substantially suppressed by a dense conifer overstory.Most of <strong>the</strong> understory plants likely will die if hemlock is <strong>the</strong> main overstorytree (Alaback 1982), because its foliage is denser (high leaf area index)compared to Douglas-fir (Waring et al. 1978). Thus, plantations, because of <strong>the</strong>irlack of large trees and snags from <strong>the</strong> previous stand, and regular, close spacing,may develop stands that are quite different from young natural stands (Spies et al.1988).On coastal sites, red alder stands frequently have become established. Thesestands often have salmonberry or salmonberry-sword fern understories whichprevent conifer establishment. The shade from <strong>the</strong> salmonberry and browsingfrom mountain beaver often found in salmonberry-dominated communitiesprevent conifer regeneration. Alder stands with salmonberry in <strong>the</strong> understory,unless treated to establish conifers, are unlikely to produce conifer standscapable of developing owl habitat because <strong>the</strong> salmonberry will <strong>for</strong>m a dense,persistent shrub layer as <strong>the</strong> alder dies and will retard invasion of conifers(Tappeiner et al. 1991).B. Nor<strong>the</strong>rn Cali<strong>for</strong>nia and Southwestern Oregon1. Natural Forest DevelopmentThe vegetation comprising owl habitat in southwestern Oregon and nor<strong>the</strong>rnCali<strong>for</strong>nia is quite diverse. It includes redwood <strong>for</strong>ests (Zinke 1977), mixedevergreen <strong>for</strong>ests (both hardwood and conifers) (Sawyer and Thornburgh1977a) and mixed conifer <strong>for</strong>ests (Sawyer and Thornburgh 1977b). Atzet et al.(1992) have classified <strong>the</strong> vegetation of southwestern Oregon into 16 series andeach series usually is subdivided into several plant associations (more than200 total). The most common series are white fir, western hemlock, Douglasfir,tanoak, and mountain hemlock. These vegetation series and <strong>the</strong>ir includedassociations vary by elevation and aspect and occur on a variety of soil types,including soils of volcanic and metasedimentary material. There is generallyless precipitation in this area, except near <strong>the</strong> coast, than <strong>the</strong>re is in <strong>the</strong>western Cascades and nor<strong>the</strong>rn coastal <strong>for</strong>ests. Climate is Mediterranean,with strong coastal and continental influences. In nor<strong>the</strong>rn Cali<strong>for</strong>nia, <strong>the</strong>most common vegetation series include redwood, Douglas-fir, tanoak, andwhite fir.Fire occurs in <strong>for</strong>ests of all vegetation series. Natural fire return intervals varyfrom 20 to 200 years (Atzet and Wheeler 1982) (Appendix F). More frequentand less intense fires generally occur on drier sites at lower elevation, with lessfrequent stand-replacement fires at higher elevations or near <strong>the</strong> coast. SeeWalstad (1992) <strong>for</strong> a discussion of recent fire history. Accidental ignition andpurposeful use of fire by Indians and European settlers also has had a majorimpact on <strong>the</strong> <strong>for</strong>ests.Factors which affect natural succession and management of landscapes andindividual stands in this region include fire, wind, insects, pathogens, andbrowsing by animals. Chance of ignition is high on interior sites due to lightningand human causes. Fires are likely to be intense because of <strong>the</strong> summerdrought, steep terrain, and accumulation of fuels due to fire suppression andlogging slash. The likelihood of fire and its effects vary by <strong>for</strong>est type. Fire isnot expected to be a severe problem in most of <strong>the</strong> redwood <strong>for</strong>ests or coastal494
Douglas-fir <strong>for</strong>ests. Fire (or some o<strong>the</strong>r disturbance) is, however, important tohelp conifers maintain dominance over hardwoods in mixed evergreen <strong>for</strong>ests(Thornburgh 1981, Hoover 1988).Pathogens (such as black stain and annosus root rot) and insects (such aswestern and mountain pine beetle, fir engraver beetle) are most likely to causeconifer mortality on dry interior sites. Insects are particularly likely to affectdense stands where poor tree vigor may predispose stands to attack, especiallyin periods of drought. Root disease also may make stands susceptible toinsects. Ice storms and wet snow can uproot large, broad-leaved evergreentrees in <strong>the</strong> mixed evergreen <strong>for</strong>ests.Wind can be a major factor on coastal sites, especially when large individualtrees are left in shelterwoods. Hemlock, Douglas-fir, redwood, sugar pine, andponderosa pine are susceptible to windthrow, which is locally important oninterior sites and most likely to occur on ridge tops, saddles, and in coniferstands on shallow soils or infected with root diseases. Pocket gophers andbrowsing deer and livestock, which are important factors in <strong>the</strong> establishmentand growth of planted and natural conifers, may have major effects on re<strong>for</strong>estationin some areas.Four to five decades of fire suppression and timber harvesting have influencedtoday's <strong>for</strong>ests. Fire suppression likely has favored <strong>the</strong> development of <strong>the</strong>understory of tanoak, a shade-tolerant hardwood, which is a climax species in<strong>the</strong> tanoak association and an important component of <strong>the</strong> Douglas-fir, whitefir, and western hemlock associations. Fire exclusion also has favored <strong>the</strong>development of hemlock and white fir understories on some mesic sites,Douglas-fir understory on dry sites, and a tanoak understory beneath redwood.To <strong>the</strong> extent that a well-developed understory is important <strong>for</strong> owlhabitat, fire exclusion probably has improved owl habitat. Recent large,variable-intensity fires have increased <strong>the</strong> structural and species diversity ofmixed evergreen and mixed conifer <strong>for</strong>ests in northwestern Cali<strong>for</strong>nia(Thornburgh 1991).2. Forest Management and Stand DevelopmentLogging in this area began about 1830. Large-scale commercial harvestingbegan about 1915, but was confined to gentle terrain (Walstad 1992). Cuttingrapidly increased after 1945. Effects of logging varied tremendously. In somecases, only certain species were cut and large trees of nonmerchantable specieswere left (partial cutting). Also, shelterwood methods and, more recently, clearcuttingwere employed. Partial cutting and shelterwood regeneration methodprobably have favored <strong>the</strong> establishment and growth of Pacific madrone andwhite fir and <strong>the</strong> growth of established tanoak. In general, <strong>the</strong> types of standspresent today include: a) old-growth stands undisturbed, except <strong>for</strong> fire suppression;b) stands composed of varying numbers and species of conifers andhardwoods released by logging, residual old-growth trees, and natural regenerationof conifers, hardwoods, and shrubs following logging; and c) relativelyuni<strong>for</strong>m young stands that contain shrubs, hardwoods, and o<strong>the</strong>r conifers thathave been established by natural seeding and planting.C. East Cascades of Oregon and WashingtonThe <strong>for</strong>ests in <strong>the</strong> east Cascades, inhabited by nor<strong>the</strong>rn spotted owls, generallyare composed of mixed conifer stands in <strong>the</strong> Douglas-fir and grand fir plantassociations. Under natural fire regimes <strong>the</strong>se <strong>for</strong>ests had intense fire, atpossibly centuries-long intervals, and light underburns at about 10- to 20 -495
year intervals (Appendix F). With <strong>the</strong> reduction of fire during <strong>the</strong> last 6 to 10decades, <strong>for</strong>ests have become quite dense and multistoried, primarily from <strong>the</strong>invasion of more shade-tolerant grand fir, Douglas-fir, and Englemann spruce.Lack of fire likely has resulted in better owl habitat.Insects and diseases are of major concern in many of <strong>the</strong>se <strong>for</strong>ests. Defoliatorsand bark beetles are common, as are root diseases (Annillaria, Phelllnus and H.annosuni). Insects and diseases probably have increased as shade-tolerantconifers invaded after fire suppression (Appendix F). These <strong>for</strong>ests frequentlyhave been managed by individual tree selection with <strong>the</strong> goal of salvaginglarger dead or diseased trees. This practice, along with fire exclusion, hascontributed to today's mixed species, multistoried stands. Fire hazard is highdue to <strong>the</strong> dry climate, fuels from dead trees, and <strong>the</strong> multistory structure(Appendix F).III. Stand Development andManagementThe studies and models discussed here were designed to understand andpredict <strong>the</strong> effects of thinning and regulating stand density on <strong>for</strong>est standgrowth, development, and yield. They were not designed specifically to determinehow to provide owl habitat. For example, <strong>the</strong>y do not provide in<strong>for</strong>mationon snag production from mortality of larger trees or <strong>the</strong> development of largelimbs or cavities which may be used as nest sites. Never<strong>the</strong>less, <strong>the</strong>se studiesare valuable background <strong>for</strong> developing silvicultural systems to provide habitat.They show that tree size and stand structure can be regulated by carefulmanagement of stand density. There are growth models, applicable to <strong>the</strong><strong>for</strong>ests used by owls, which can be used to predict trends in stand development,tree size, crown cover, mortality, and o<strong>the</strong>r factors. Background in<strong>for</strong>mationand techniques are available that can be applied to stands of variousages, structures, species composition, and sites to grow stands <strong>for</strong> owl habitat.There is a large body of literature on stand growth and development dating toEurope in <strong>the</strong> 19th Century (Assmann 1970) and it includes many studies inNorth America. However, we will discuss only <strong>the</strong> in<strong>for</strong>mation developed fromstudies in <strong>for</strong>ests within <strong>the</strong> range of <strong>the</strong> nor<strong>the</strong>rn spotted owl.A. Stand Manipulation and ThinningNumerous studies have shown that regulation of stand density affects individualtree and stand characteristics such as crown length and width, branchand stem size, leaf area index, vigor, and wind stability. Effects are apparentin young and old stands. Reukema (1975) summarized in<strong>for</strong>mation fromreplicated spacing studies, established 50 years earlier at Wind River ExperimentalForest. On <strong>the</strong>se dry sites, high stocking reduced height and diametergrowth rates and resulted in stands of poor vigor. Eversole (1955) recognized<strong>the</strong>se trends when <strong>the</strong> stands were 25 years old, and <strong>the</strong>re was no reversal oftrends in height and diameter growth rates during <strong>the</strong> intervening 25 years.496The most thorough study on <strong>the</strong> effects of management on young Douglas-fir is<strong>the</strong> regionwide "levels of growing stock study" (Marshall 1990, Curtis andMarshall 1986, Williamson and Curtis 1984, Tappeiner et al. 1982). The studyis being conducted on five study sites with each of nine treatments replicatedthree times at each site. Treatments range from no thinning to intensivethinning, with only about 50 trees per acre remaining at age 40 years. Thisstudy shows that in stands on a wide range of site productivity, frequent
thinning has altered substantially stand structure and tree growth. Forexample, after 25 years at <strong>the</strong> Hoskins, Oregon, study site, diameter distributions,crown length, wood volume, and basal area growth were altered bythinning (Marshall 1990). The average diameter of <strong>the</strong> stands, especially <strong>the</strong>numbers of trees in <strong>the</strong> larger size classes, increased following thinning (FigureG. 5). For example, after heavy thinning, diameters ranged from 16 to 24inches; after light thinning <strong>the</strong>y ranged from about 4 to 20 inches. The crownsize of individual trees and understory development increased as thinningintensity increased (Figure G.6). Understory biomass increased from about 9pounds per acre in unthinned plots to more than 6,300 pounds per acre withheavy thinning. The trends and actual values <strong>for</strong> diameter (Figure G.7) ando<strong>the</strong>r parameters at <strong>the</strong> o<strong>the</strong>r sites were quite similar to those at <strong>the</strong> Hoskins,Oregon, study site (Curtis and Marshall 1986).Thinning regimes can be flexible and Douglas-fir stands can respond equallywell to different intensities and timing of thinnings (Reukema 1972). Stands38 years old were thinned: a) lightly (12 percent volume removed) at 3-yearNumber oftrees per acre50Light40 thinning(treatment 7)30 _ j \ Heavy30 - / w \ No thinning(treatment 1)20 40100D060 - o thinning(treatment 9)80-40-20-00 1 0 20 30Diameter class (inches)Figure G.5. Number of trees per acre by diameter class at age 45 years; 20 years afterthinning. Hoskins, Oregon, level of growing stock study (Marshall 1990).497
Live crown ratiobecent)6050IStand A4030201001 3 5Treatment7 9Heavy thinning No No thinningUnderstory biomass(pounds per acre)6,400Stand B5,6004, 8004, 0003, 2002, 4001,60080001 3 5 7 9TreatmentHeavy thinning IM No thinning\1 -I/- - ---....--....................................... I'll.."Figure G.6. Effect of thinning intensity on: average live crown ratios of Douglas-fir trees(Stand A) and understory shrub biomass (Stand B). Hoskins, Oregon, levels of growing stockstudy (Marshall 1990). Sutli (unpublished data).intervals, b) moderately (22 percent volume removed) at 6-year cycles, and c)heavily (31 percent volume removed) at 9-year intervals. About <strong>the</strong> sameamount of volume was removed in all three treatments. After 18 years, <strong>the</strong>rewas no difference in net volume growth compared to <strong>the</strong> controls, indicatingthat young stands can respond positively to a range of thinning regimes.Studies by Dilworth (1980), Nystrom et al. (1984), and Greene andEmmingham (1986) suggested that <strong>the</strong> effects of density on <strong>the</strong> development ofyoung western hemlock and western red cedar stands are similar to effects onDouglas-fir (see King 1986).498
20Heavy thinning15 | Stand A | (treatment 1)15 Hoskins, OregonLight thinnrgAve rage 10 (treatment 7)diameter 1(inches)No thinning5 (treatment 9)010 20 30 40Age (years)2 0Heavy thinningStand B (treatment 1)Average 15 Skykomish,diameter Washington Light thinning(inches) (treatment 7)10No thinning5 (treatment 9)020 30 40 50Age (years)I 11 "I'll,'----- I . . ....- ................. I.... 1.111- 1- .............. -1.1-...... 11 ... "I -...- -.1...... 1.1.111, IFigure G.7. Average doarneterfoUowing three intensities of thinning in two levels of growingstock studies (Curtis and MarshtU 1986).O<strong>the</strong>r work has shown that development of older Douglas-fir and westernhemlock stands can be regulated by stand density control and careful thinning.Williamson and Price (1971) summarize in<strong>for</strong>mation collected 5 to 38years after thinning in 70-to 150-year-old Douglas-fir. Thinning intensityranged from a control with no thinning to 55 percent of total basal area removed,and included both crown thinning (removing large trees) and lowthinnings (removing small trees). Thinning reduced mortality caused by barkbeetles, indicating that stand vigor was improved. Similarly, Williamson (1966and 1982) studied growth response after thinning in a 110-year-old stand ofDouglas-fir. Nineteen years after light and heavy thinnings, volume growthwas nearly equal that of <strong>the</strong> control, suggesting that stands this age can bevigorous and are able ra<strong>the</strong>r quickly to occupy space made available by thinning.Newton and Cole (1987) reconstructed stand development to providefur<strong>the</strong>r evidence of <strong>the</strong> ability of thinned Douglas-fir stands to produce largetrees. Stands 50 and 70 years old were thinned to less than 40 trees per acre.At time of thinning, trees were about 14 to 24 inches in diameter. Seventyyears later, diameters ranged from 24 to 50 inches (average 35 to 40 inches).499
Basal area growth continued to increase <strong>for</strong> 70 years, indicating that trees werevigorous and continued to respond to <strong>the</strong> growing space provided by <strong>the</strong> lowstocking. An understory of bigleaf maple, grand fir, and shrubs (e.g., hazel andoceanspray) had developed in <strong>the</strong>se stands.Windthrow is a natural part of stand development which will occur in thinnedand unthinned stands. It is not necessarily a concern after thinning, even inolder stands. Graham et al. (1985) recorded windthrow on 400 acres ofthinned 100-year-old Sitka spruce-western hemlock stands near <strong>the</strong> coast atCascade Head, Oregon, from which 0 to 25 percent of <strong>the</strong> basal area wasremoved. Windthrow was variable and occurred in thinned and unthinnedsites. For example, all windthrow in one tract occurred on half <strong>the</strong> plots, andtracts which had heavy windthrow during some storms had only very lightlosses during o<strong>the</strong>rs. Overall volume of windthrown trees was nearly twice asgreat in unthinned stands as it was in thinned stands, possibly because treesprone to wind damage were removed in thinning. Total mortality from allcauses, but not including thinned volume, was somewhat less on thinned sites(225 cubic feet per acre) than on unthinned sites (300 cubic feet per acre); thisamounts to about only one year's volume growth. Similarly, Williams and Price(1971), after studying 70- to 150-year-old stands 18 years after thinning,concluded that windthrow was related to factors such as soil depth andtopographic position and wind patterns ra<strong>the</strong>r than thinning.Ruth and Harris (1979) discussed <strong>the</strong> problems of wind and thinning inwestern hemlock-Sitka spruce <strong>for</strong>ests. They concluded that site (topography,soil depth, soil drainage), root disease, type of thinning, and age at thinning (oro<strong>the</strong>r disturbance) predispose stands to windthrow. Thinning old, densestands likely will increase risk of damage on windy sites, while thinningyounger stands may decrease <strong>the</strong> risk at later stages of development. Leavingwind firm edges that do not channel wind and unthinned buffers is importanton exposed sites because <strong>the</strong>y are likely to decrease <strong>the</strong> risk of blowdownprogressing throughout a stand. Thinning also lowers height to diameterratios of trees by increasing stem diameter growth relative to height growth andby lowering <strong>the</strong> center of gravity of <strong>the</strong> crown. Based on European experience,height to diameter ratios of 100 or more in Douglas-fir indicate susceptibility todamage (Worthington and Staebler 1961). Thinning would decrease this ratiobecause tree diameter growth usually is increased by thinning more thanheight growth is increased.B. Understory Vegetation and Advanced Regeneration500Regulating stand density affects understory vegetation. As <strong>the</strong> overstorybecomes less dense from thinning or natural disturbance, an understory ofshrubs, hardwoods, conifers, and o<strong>the</strong>r species develops. Conifer and hardwoodseedlings and saplings will grow to provide <strong>the</strong> multilayered stands usedby owls. Alaback and Herman (1988) reported <strong>the</strong> development of a twolayeredconifer stand 17 years following thinning in western hemlock andspruce stands. However, development of too dense an understory of hemlockmay inhibit development of shrub or <strong>for</strong>b layers. After disturbance to <strong>the</strong>overstory (release), conifer seedlings and saplings increase <strong>the</strong>ir growth, and itappears that in open conditions <strong>the</strong> rate of growth following release is relatedto <strong>the</strong> size of <strong>the</strong>ir crowns and rates of prerelease height growth (Helms andSandi<strong>for</strong>d 1985, Gordon 1973, Stein 1981, 1986). Careful removal of overstorytrees is needed to ensure release of advanced regeneration (Mann and Tesch1985, Tesch et al. 1990a); however, Douglas-fir seedlings can recover fromdamage by overstory removal (Tesch et al. 1990b). Growth of western hemlockand western red cedar present in <strong>the</strong> understory of a recently thinned 110-year-old Douglas-fir stand was increased by fertilization or thinning(Harrington and Wierman 1990).
C. FertilizationThinning or o<strong>the</strong>r disturbance also aids <strong>the</strong> development of shrubs (Long andTurner 1975) (see Figure G.3). Vine maple clones spread by layering as <strong>the</strong>yare pinned to <strong>the</strong> ground by falling trees (O'Dea 1991). Shrubs like salmonberryand salal spread from increased rhizome extension and seedling establishmentin thinned stands flappeiner et al. 1991, Huffman 1991). Too densea layer of shrubs or <strong>for</strong>bs will prevent <strong>the</strong> establishment of conifers and hardwoodsin <strong>the</strong> understory (Isaac 1938). Bigleaf maple seedlings become establishedas <strong>the</strong> overstory is thinned to about 70 to 80 percent cover or less, butbe<strong>for</strong>e a layer of shrubs or <strong>for</strong>bs is <strong>for</strong>med (Fried et al. 1988). Where layers ofshrubs occur in <strong>the</strong> understory, some treatment to reduce <strong>the</strong>ir density may beneeded to establish trees to provide <strong>the</strong> stand structure used by owls.Fertilization has been shown to increase <strong>the</strong> rate of stand development instands 15 to 110 years old. For example, 90-year-old (Miller and Harrington1979) and 110-year-old (Harrington and Miller 1979) Douglas-fir standsincreased basal area and diameter growth rates following application of nitrogenfertilizer as urea or ammonium nitrate. Increased growth occurred inthinned and unthinned stands and on a range of sites and stand ages lessthan 90 years (Miller et al. 1979, Miller and Tarrant 1983). Fertilization alsoincreased diameter and height growth in thinned and unthinned 15-year-oldwestern red cedar stands (Harrington and Wierman 1990).D. Historical Stand Management PracticesThe primary silvicultural system <strong>for</strong> Douglas-fir and western hemlock <strong>for</strong>ests in<strong>the</strong> coastal <strong>for</strong>ests and western Cascades of Oregon and Washington has beeneven-age management. This is an efficient way to manage <strong>the</strong>se <strong>for</strong>ests <strong>for</strong>timber production primarily because a) <strong>the</strong> major conifers can be regeneratedin open conditions following disturbance, b) steep topography on many sitesprecludes tractor logging or makes it prohibitively expensive and likely to causeserious soil erosion, and c) cost of setting up cable logging equipment and roadbuilding in steep terrain makes it most efficient and least expensive to clearcut.Under <strong>the</strong> even-age system, stands most often are regenerated using <strong>the</strong>clear-cutting method, followed by site preparation, planting nursery-grownseedlings, and some level of control of herbs, shrubs, or hardwoods. Theshelterwood method also has been used on some sites where wind is not aserious problem (Williamson 1973).Early in <strong>the</strong> development of silvicultural practices in this region, Kirkland andBrandstrom (1936) recommended partial cutting and group selection as a wayto manage Douglas-fir. Isaac (1956) reviewed <strong>the</strong> early trials of this type of"selection management" in old-growth <strong>for</strong>ests and recommended that Douglasfir<strong>for</strong>ests be managed under even-age systems. His recommendations werebased on observations that a) <strong>the</strong>re was little natural regeneration occurringafter selection cutting, b) understory trees were damaged by logging, c) <strong>the</strong>rewas blowdown (few trees, but lots of volume), and d) <strong>the</strong> old trees generally didnot increase <strong>the</strong>ir growth rates after cutting. Isaac (1956) recognized severalcases where selection cutting (uneven-age management) appeared to be reasonable:a) dry sites with more open stands, b) stands with a high proportionof young trees, and c) salvage of mortality. It is important to note that hisrecommendations were based mainly on experience in old stands, not youngstands (less than 100 to 120 years). These recommendations considered onlynatural regeneration without well-planned site preparation prior to planting ornatural seeding, followed by vegetation control. Also, advances in logging501
technology probably will allow somewhat more intricate treatments. There<strong>for</strong>e,because of new in<strong>for</strong>mation on harvesting and re<strong>for</strong>estation methods, Kirklandand Brandstrom's (1936) ideas of group selection, and group shelterwood andirregular shelterwood (Smith 1986, Troup 1928) should be reviewed. They canbe considered <strong>for</strong> use on certain sites in young and mature <strong>for</strong>ests along withgreen tree-retention and o<strong>the</strong>r "new perspective" practices.E. Stand Simulators and Growth ModelsGrowth models can be used to predict <strong>the</strong> development, growth, and yield of<strong>for</strong>est stands with and without treatments. These models will predict averagetree diameter, height, total stand basal area, volume, and mortality. Simulatorssuch as DFSIM (Curtis et al. 1981), CRYPTOS (Krunimland and Wensel1980), ORGANON (Hester et al. 1989), and PROGNOSIS (Stage 1973) predict<strong>the</strong>se variables <strong>for</strong> entire stands and/or by tree size classes within stands. Thetrends in simulated stand growth and development are consistent among <strong>the</strong>semodels. We used <strong>the</strong>m to project <strong>the</strong> effects of different silvicultural systemson stand growth <strong>for</strong> owl habitat. When compared with data from actualstands, DFSIM and ORGANON predict trends in stand growth quite accurately(Hann 1991, Stere 1991).The snag recruitment simulator provides a means to predict snag longevity bydiameter and decay class <strong>for</strong> natural snags or those created by management.This program was developed by Bruce Marcot (PNW Research Station, Portland,Oregon) based on in<strong>for</strong>mation in Neitro et al. (1985).IV. Examples of Silviculture PrescriptionsFollowing are silviculture systems <strong>for</strong> different types of stands commonthroughout <strong>the</strong> range of nor<strong>the</strong>rn spotted owls. We used data from actualstands and-simulated <strong>the</strong> development of structures following treatments togrow large trees and produce multilayered stands. When actually implementing<strong>the</strong>se systems <strong>the</strong> following points should be evaluated to see if <strong>the</strong>y applyto <strong>the</strong> stand in question. They are suggestions which will help ensure thatsilviculture systems "mimic" natural disturbance and stand development. Thelist is not exhaustive: o<strong>the</strong>r ideas will be appropriate on a stand by stand basis:* Favor some large, trees with many limbs <strong>for</strong> potential nest sites.* Use hardwoods to help develop a multilayered stand.* Encourage <strong>the</strong> growth of advanced regeneration of shade-tolerant coniferand hardwood species, even in young (30 to 50+ years old) stands.* Establish new regeneration by planting or seeding in young (50+ year-old)stands after making small openings or reducing overstory density in partsof a stand.* Consider varying <strong>the</strong> distribution of overstory trees when thinning. Varyspacing and tree density, make openings <strong>for</strong> new regeneration and releaseadvanced regeneration.* When thinning, leave some trees in <strong>the</strong> smaller crown size classes (intermediateand suppressed) to help promote a layered stand.* In stands with irregularly spaced trees, consider a crown thinning torelease individual trees while maintaining <strong>the</strong> irregular spacing.502
A. Douglas-fir and Western Hemlock Stands(Oliver et al .1991)The following examples from Douglas-fir and western hemlock stands 30 to 70years old (Oliver et al. 1991) show trends of stand development under differentdensities. Diagrams are drawn to scale using in<strong>for</strong>mation from stand simulators.Stands are projected with no treatment (Figures G.8, G.9, G.10). Inaddition, <strong>the</strong> 30-year-old stand (Figure G.8) is projected with two thinningregimes (low and moderate density); <strong>the</strong> 70-year-old stand is projected with athinning regime (moderate density) and a treatment to produce a multiplecanopystand (Figure G.9). In <strong>the</strong>se stands, <strong>the</strong> second story would result fromrelease of conifers and hardwoods, or planting and seeding of conifers followingthinning. Development of a young plantation is shown in Figure G.10. Here,too, thinnings stimulate large tree and early understory development. Thesesimulations indicate that <strong>the</strong>re are several advantages of manipulating overstorydensity to produce owl habitat:a) The size of <strong>the</strong> average tree, and <strong>the</strong> size of <strong>the</strong> largest 5 percent of <strong>the</strong>trees in <strong>the</strong> stands, are increased. For example, <strong>the</strong> 30-year-old stand(stand B, Figure G.8) under a low density thinning regime is simulated atage 90 (year 2050) to have an average diameter of 36 inches and <strong>the</strong>largest 5 percent of <strong>the</strong> trees have diameters of about 44 inches; whileStand A, with no activity, has trees of 18-inch average diameter and <strong>for</strong> <strong>the</strong>largest 5 percent of <strong>the</strong> trees have 27-inch diameters.b) In stands which have had trees thinned, <strong>the</strong> canopy is "deeper," and treeshave larger crowns. For example, stands managed under <strong>the</strong> low-densitythinning regime, at age 90 years (year 2050), have crowns estimated fromabout 60 to 140 feet above ground (i.e., more than 60 percent of <strong>the</strong> lengthof <strong>the</strong> tree will have live crown on it); while on <strong>the</strong> untreated stand crownswill be about 110 to 140 feet above ground (see Figure G.8).c) Reducing overstory density will enhance development of an understory andencourage <strong>the</strong> development of multilayered stands typical of those used byowls (Figure G. 1). Without thinning, stands may be ei<strong>the</strong>r too dense <strong>for</strong>tree and shrub seedlings to become established, or those that are presentwill grow very slowly.These stands likely will not produce large snags or logs on <strong>the</strong> <strong>for</strong>est floornaturally. Mortality due to crowding will kill trees less than 11 inches indiameter. However, stands at low density will have trees 25 inches diameterbreast height (dbh) and larger, some of which will be killed by pathogens andinsects, or which can be girdled or topped to make snags.Oliver et al. (1991) predicted that <strong>the</strong> risk of wind damage to unmanagedstands is greatest when <strong>the</strong>y are about 30 to 70 years old (see Ruth and Harris1979). After about 70 years, <strong>the</strong> larger trees in <strong>the</strong> stand are likely to becomestable.The maximum possible costs and maximum possible returns <strong>for</strong> <strong>the</strong>se scenarioshave been estimated (Table G.1).B. Douglas-fir from Oregon Coast Range (Birch 1991)Example 1: A 60-year-old Douglas-fir and western hemlock stand, on aproductive site (site index 130 feet at 50 years) with 280 trees per acre. Thegoal of <strong>the</strong> simulation was to produce a multilayered stand structure (similarto stand A in Figure G. 1 1) as quickly as possible.* At 60 years <strong>the</strong> stand was thinned leaving a) <strong>the</strong> largest 10 trees per acre(26 to 30 inches in diameter), b) trees in <strong>the</strong> smaller sizes (48 trees per503
Stand A. No activities (west side 30-year-old stand)*293/8-14 NAN12-18 NA/15-23 153/18-27150 - I100 A AU-5001990 2010 2030 2050150 -100LL500~~~~~~~~~~~~~~~~~~~~~~~~~~~~~~~~1990 2010 2030 2050Stand C. Moderate density regime (west side 30-year-old stand)*170/8-15 111/15-22 91/18-28 87/23-31Stand B. Low density regime (west side 30-year-old stand)* 100/9-12 70/20-28 50/28-38 49/36-150-- 100 ft501990 2010 2030 2050* Trees per acre/average diameter (inches) - diameter of largest 5 percentNA = Data not availableBlack crown = Douglas-firStand A. No treatmentor western hemlockStand B. Thinning and planting 1992, 201 1, and 2031White crown = o<strong>the</strong>rStand C. Thinning 1992, and 201 1, and 2031A ^ shrubs Hardwood conifer speciesFigure G.8. A 30-year-old Douglas-fr/westem hemlock stand simulated with no treatments and with development under lowdensity and high density regimes. Numbers of trees per acre, average diameter, and diameter of <strong>the</strong> largest 5 percent of <strong>the</strong> treesare shown at each year. Note <strong>the</strong> increased crown and understory development as overstory tree density decreases (Oliver et aL1991).504
Figure G.9. A 70-year-old Douglas-fir/westem hemlock stand simulated with no treatments and with development of multiplecanopy and moderate density regimes. Number of trees per acre, average diameter, and diameter of <strong>the</strong> largest 5 percent of <strong>the</strong> treesare shown at each year. Note <strong>the</strong> increased crown and understory development as overstory tree density decreases (Oliver et al.1991).505
Stand A. No activities (west side open area)150 *500/ 500/5-9 /8-11 294/12-17100ILL5001990 2010 2030 2050Stand B. Low density (west side open area)150 500/ 100/7-11 70/15-21 70/23-31100501990 2010 2030 2050Stand A = No treatmentStand B = Thinning 1992 and 2030*Trees per acre/average diameter (inches) - diameter of largest 5 percentBlack crown = Douglas-fir or western hemlock H AWhite crown = o<strong>the</strong>r conifer species Hardwoods AlA shrubsFigure G. 10. A plantation of Douglas-fhr and western hemlock simulated with no thinning and with thinning of small trees at ages20 and 40 years. Numbers of trees per acre, average diameter, and diameter of <strong>the</strong> lurgest 5 percent of <strong>the</strong> trees are shown at eachyear. Note <strong>the</strong> increased crown and understory development as overstory tree density decreases (Oliver et aL 1991).506
Table G.1. Costs per acre or return per acre over 60 years <strong>for</strong> each silviculturalsystem on each stand (Oliver et al. 1991). Costs assume no timber removal isdone and no risk reduction measures are taken. Returns assume all timber killedis removed (none is left to create snags and logs). Part of <strong>the</strong> cost of creatingspotted owl habitat, as well as reducing <strong>the</strong> risk of fires and insects, may be defrayedby selling some of killed trees in each stand. Where some trees are left ando<strong>the</strong>rs removed, costs (or returns) would be between values shown here.CostNo Removal(in dollars)ReturnsFull Removal(in dollars)West side 30-year-old standsNo activities system: 0 0Low density system: 340 7,165High density system: 337 7,900West side 70-year-old standsNo activities system: 0 0Multiple canopy strata system: 1,390 14,042Moderate density system: 771 4,866West side open areasNo activities system: 0 0Maintain opening system 310 0Low density system: 422 1,000East side multiple canopy strata standsNo activities system: 0 0Low density system: 1,030 2,129High density system: 742 1,215East side pole standsNo activities system: 0 0Multiple canopy strata system: 2,822 1,777High density system: 1,515 1,862East side open areasNo activities system: 0 0Maintain opening system: 350 0Low density system: 150 0 - - --- -- - .-...1I507
acre, 4 to 12 inches in diameter), and c) 10 percent of <strong>the</strong> trees 12 to 26inches in diameter.* Space created by tree removal was regenerated at a density of about 200trees per acre by planting or releasing advanced regeneration.* By age 120 years, this stand was projected to have a diameter distributionresembling those around owl nest sites (Figure G. 1 1 Stand A). Largesttrees were more than 44 inches dbh. There were more than 150 trees peracre less than 12 inches in diameter in <strong>the</strong> understory. Estimated understoryheight ranged from 45 feet to more than 120 feet; estimated canopycover is 100 percent.* Snags and logs on <strong>the</strong> <strong>for</strong>est floor might not occur naturally with thissystem, and may have to be made by killing live trees.Note that <strong>the</strong> untreated stand was not projected to have developed multiplelayers or have <strong>the</strong> desired structure by age 120 years.Example 2: A Douglas-fir, grand fir, bigleaf maple stand, site index 120 feet at50 years, with an initial density of 881 stems per acre. Since stocking wasso high, this stand was simulated to have three thinnings (Figure G. I 1,Stand B). Hardwoods were left to develop a multilayered structure.* At age 40 years, 50 percent of <strong>the</strong> conifers in <strong>the</strong> 10- to 16-inch diameterclasses were thinned. There were 362 conifers and 114 hardwoods per acreleft; 100 conifers per acre were planted.* At age 60 years, 50 percent of <strong>the</strong> trees in <strong>the</strong> 10- to 22-inch diameter classwere converted to snags, logs on <strong>the</strong> <strong>for</strong>est floor, or harvested. There were275 conifers and 70 hardwoods per acre left; 100 conifers per acre wereplanted.* At age 80 years, 60 percent of <strong>the</strong> conifers 8- to 22-inches in diameter weremade into snags and down logs or harvested. There were 224 conifers and70 hardwoods per acre left.Removing trees or killing <strong>the</strong>m <strong>for</strong> snags or down logs allowed space <strong>for</strong> developmentof large trees (42+ inches in diameter) and establishment and growth ofan understory. No trees more than 22 inches in diameter were removed orkilled <strong>for</strong> snags or down logs. At age 120 years, <strong>the</strong> treated stand was projectedto have <strong>the</strong> required structure (Figure G. 1 1, Stand B); simulated understoryheight ranged from 30 feet to 110 feet; canopy cover was 53 percent.Without treatment, <strong>the</strong> stand would not have a multilayered structure; understorywas projected to be about 22 percent.Example 3: Two young stands were simulated to grow without treatmentuntil age 120 years. Stand A, which had about 230 bigleaf maple stems peracre, developed a second layer as <strong>the</strong> conifers overtopped <strong>the</strong> maple (FigureG. 12). However, <strong>the</strong> understory was not nearly as well developed as <strong>the</strong> standused <strong>for</strong> nest sites (or <strong>the</strong> managed stands in examples 1 and 2), since <strong>the</strong>second layer had fewer, shorter trees than stands used <strong>for</strong> nesting. Stand B,which had no maple, would not likely <strong>for</strong>m a second story.C. Redwood and Mixed Conifer from NorthwesternCali<strong>for</strong>nia (Tlornburgh 1991 b)This is a simulation of a redwood and Douglas-fir plantation on a productivesite (site index 200 feet at 100 years). At 15 years, <strong>the</strong>re are 78 redwoodsprout clumps per acre (4 to 12 sprouts per clump). The rest of <strong>the</strong> stand isplanted to redwood and Douglas-fir and <strong>the</strong>re are natural saplings and seedlingsof grand fir, western hemlock, Sitka spruce, and tanoak (Figure G. 13).Also present are salal, ceanothus, huckleberry, and red alder. The goal is to508
Trees per acre200 -Stand I A150 L1_60-year-old stand thinned and'underplanted;" now 120 years old.100 _-Ave age of five nest si50 _CI< 10 10 to 26 26 to 42 43+Diameter class (inches)60-year-old stand,untreatedTrees per acre200 r-Stand I B I150 1-100 I-I40-year-old stand thinned three timesand "underplanted." Projected to age120 years.Average of five nest sites(Hershey).50 I..- Forty-year-old stand not treated,projected to age 120 years.< 10 10to26 26to42 43+Diameter class (inches)Figure G.1 1. Diameter distributions<strong>for</strong> spotted owl nest sites (Hershey pers. comm.) andsimulations of two stands managed to produce spotted owl habitat, and two unmanagedstands (Birch 1991).509
allow redwood sprout clumps maximum development to <strong>for</strong>m an upper canopyand to produce a mixed layered stand with <strong>the</strong> o<strong>the</strong>r species.* At 15 years, four to five sprout clumps per acre were selected and all largesaplings were removed within a 16- to 20-foot radius. Shorter seedlinggrand fir, western hemlock, and Sitka spruce were allowed to grow in <strong>the</strong>shade of <strong>the</strong> large sprout clumps. The rest of <strong>the</strong> stand was thinned at anirregular spacing, 9 to 18 feet (average about 13 feet.)* At 25 years, <strong>the</strong>re was 100 percent cover within <strong>the</strong> sprout clumps, andabout 95 percent cover within <strong>the</strong> remainder of <strong>the</strong> stand with some gapsin <strong>the</strong> canopy. At this age, <strong>the</strong> stand may provide cover <strong>for</strong> dispersal,roosting, and <strong>for</strong>aging. Large redwood trees in sprout clumps could betopped to begin to produce potential nest sites.* At 40 years, <strong>the</strong> stand was multilayered within <strong>the</strong> redwood sprout clumps.It was thinned to 135 trees per acre. Two to four large trees per sproutclump were girdled <strong>for</strong> snags and logs on <strong>the</strong> <strong>for</strong>est floor.* At 40 to 50 years, this stand was multilayered, with a structure typical ofstands used by owls <strong>for</strong> nesting.Without management, this stand would not have a well-developed understory.This type of prescription could be started in older stands using <strong>the</strong> principles ofthinning around large trees to favor <strong>the</strong>ir development and keeping smallertrees of tolerant species in <strong>the</strong> understory to <strong>for</strong>m a multilayered stand.D. Douglas-fir and Tanoak from Southwestern Oregon(Lewis 1 991)A 20-year-old Douglas-fir stand was modeled with treatments to produce amultilayered stand and without treatments. An old multilayered stand similarto stands used by owls <strong>for</strong> nesting was used as a goal, or <strong>the</strong> desired standstructure. Figure G. 14 compares <strong>the</strong> structure of <strong>the</strong> natural old growth standto <strong>the</strong> structure of <strong>the</strong> 2 modeled stands at age 135.* The managed stand was thinned to 200 trees per acre at age 20 years.* At age 50 years, <strong>the</strong> stand was thinned to about 80 trees per acre. Tanoakwere controlled to establish Douglas-fir in <strong>the</strong> openings created by thinning.These treatments minimized <strong>the</strong> establishment of openings createdby a moderately intense fire.* At age 80 years, <strong>the</strong> stand was thinned again, removing about 30 trees peracre. In practice, underburning might be considered to reduce fire hazardand duplicate <strong>the</strong> presettlement fire return interval.* By 135 years of age, a multilayered stand was achieved which resembled<strong>the</strong> old stand used as a goal (Figure G. 14, stand C). Maximum treediameters were 40 inches compared to 52 inches in <strong>the</strong> old stand. Heightof trees in <strong>the</strong> lower layers were predicted to range from about 20 feet to 80feet. Projected crown closure was more than 70 percent. If burning weredone, <strong>the</strong>re likely would be fewer conifers in <strong>the</strong> 10- to 16-inch diameterclasses in <strong>the</strong> managed stand at 135 years. The unmanaged stand was notprojected to have a multilayered structure, and maximum diameter waspredicted to be about 34 inches.E. Uneven-age Management in Mixed Conifer Forestsin Nor<strong>the</strong>rn Cali<strong>for</strong>nia (Wea<strong>the</strong>rspoon and Ritchie 1991)In this case, <strong>the</strong> stand was multistoried, and it was simulated under unevenagemanagement and use of prescribed fire <strong>for</strong> 240 years (Figure G. 15). Thisexample illustrates that uneven-age management in mixed conifer <strong>for</strong>ests can510
Trees per acre200150Stand A. Thinned. At age 20 years, 255 conifersand 23 bigleaf maple stems per acre. At 120 years,114 conifers and 11 bigleaf maple stems per acre.Largest conifers are 36 inches diameter.100Conifers50Hardwoods0
KAge 15 years - 511 trees per acre, 78 sprout clumps per acre. Treatment: thin four to five sprout clumps (-16-X-17 feet) tomaintain large live crowns and accelerate diameter growth, thin rest of stand at an irregular spacing (average -13-X-13 feet).Maintain species mix; leave trees beneath crowns of sprout clumps to encourage development of layers.a)a)LL150 I100 I500<strong>Plan</strong>ted Redwood Natural regeneration of cecJar,Douglas-fir sprout hemlock, spruce, fir, tanoalandclumpsredwood1 V V4* qmj j ft~f =Age 25 years - Sprout clumps average 65 feet tall: 19.2 inches diameter. O<strong>the</strong>r trees average 60 feet tall 16 inches diameter,smaller understory trees at edges of taller redwood clumps. Possibly take tops out of two to three large redwoods per acre to<strong>for</strong>m multiple-top trees <strong>for</strong> possible future nest sitesa)a)LL150100500Tanoak<strong>Plan</strong>ted Douglas- Redwood sprout Natural regeneration of western cedar, westernfir and redwood clumps hemlock, sitka spruce, grand fir, tanoakI yf X X 4Age 40 years - Sprout clumps average 110 feet tall; 30.2 inches diameter. O<strong>the</strong>r trees average 100 to 105 feet tall; 24 inchesdiameter; 250 to 270 trees per acre. Treatment: girdle two or more dominant trees per sprout clump <strong>for</strong> down logs and snags(-30 inches). Thin <strong>the</strong> rest of stand (16 to 30 inches diameter) to 135 trees per acre.0)a)U-150 [-10050A A0_S , ...IAge 50 years - Sprout clumps average 140 feet tall; 37.6 inches diameter. O<strong>the</strong>r trees 130 feet tall, 29.5 inches diameter.0)a)LLAl150 I-100 I500,A. . ....... I'a. . .t 9RedwoodsproutclumpsI - . . .-. . - . ---- -... I 11.1111, I IFigure G. 13. Silviculture system <strong>for</strong> producing spotted owl habitat in young-growth redwood stands (Thomburg 1991 b)512
e used to maintain a structure like that used by owls. However, if prescribedfire is used to reduce fuel accumulation and risk of an intense wildfire, <strong>the</strong>n itlikely will be difficult to maintain a suitable structure in all parts of a stand <strong>for</strong>long periods of time.* The stand was multistoried, but probably had many more small trees 1 to10 inches in diameter than would be present without fire prevention.* Two systems were used: 1) group selection to make small openings up toabout 1 acre, plus thinning among groups, and 2) small (1 to 2 acres)irregular shelterwood units to obtain regeneration and to keep large treesin <strong>the</strong> stand.* Regeneration and thinning were done every 20 years.* Prescribed underburning was used about every 40 years to reduce fuelloads and to make <strong>the</strong> stand less susceptible to a severe wildfire.Underburning was estimated to cause a reduction in numbers of trees in<strong>the</strong> understory, but it would aid establishment of new seedlings.* The unmanaged stand lost its layered structure. Since <strong>the</strong>re was nodisturbance to <strong>the</strong> overstory, large trees were projected to increase <strong>the</strong>irdensity (basal area) to well over 300 square feet per acre (Figures G. 15 andG. 16), and to <strong>for</strong>m a dense canopy which would inhibit growth of trees intosize classes greater than 41 inches in diameter.This example shows that uneven-age management can be used to maintainmultilayered stands. Without disturbance to <strong>the</strong> overstory, <strong>the</strong> understorylayers would be reduced greatly over time. In <strong>the</strong>se <strong>for</strong>ests with a low intensityhigh frequency natural fire regime, prescribed burning is desirable to reducefuels and <strong>the</strong> chances of an intense fire which would kill all <strong>the</strong> trees. However,if fire is used, understory density is likely to be decreased <strong>for</strong> a number ofyears. These multistoried stands probably were not common prior to firesuppression and logging. Controlling stand density and obtaining regeneration,as well as fire control, will be needed to maintain <strong>the</strong>se structures. If prescribedfire is used to reduce fuels and likelihood of an intense wildfire, it may not bepossible to maintain an ideal structure <strong>for</strong> owls in all parts of a stand overtime. Use of prescribed fire should be implemented on a landscape basis withburning varied over space and time.F. Multilayer and Mixed Species, East Side CascadesTypical east side Cascade multilayered, mixed species stands of ponderosapine, larch, lodgepole pine, Douglas-fir, and grand fir are projected: a) with notreatment of a stand originated by wildfire about 80 to 100 years ago, b) withheavy thinning applied to a stand which resulted from partial cutting during<strong>the</strong> past 80 to 90 years, and c) with light thinning applied to high densitystands which resulted following fire suppression but no partial cutting. Undernatural fire regimes, <strong>the</strong>se stands would tend to be more open and probably tobe less suitable habitat<strong>for</strong> owls (Oliver et al. 1991).* With no activity, a stand <strong>for</strong>med a very dense layer of grand fir and Douglas-firbeneath a sparse canopy of ponderosa pine (Figure G. 17, stand A).* Thinning (Figure G. 17, stands B and C) followed by natural regenerationchanged <strong>the</strong> understory to primarily grand fir and decreased ponderosapine in <strong>the</strong> overstory. This trend probably could be reversed with heavythinning and/or planting of pine. Trees with mistletoe brooms can be left<strong>for</strong> owl nest sites.* Risk of severe fire was high in all three systems due to slash followingtreatment or self-thinning due to crowding. Fuel management and firesuppression likely will be needed to maintain <strong>the</strong>se structures (Appendix F).* Pathogens and insects killed trees of all species, added to fuel loading, anddecreased <strong>the</strong> density of <strong>the</strong> overstory. Thinning and salvage under a lowdensity scenario would help reduce effects of pathogens and insects.513
6Stems per acre100 _ Stand A. Natural development of 20 year oldstand; no treatment <strong>for</strong> 100 years.8060402001III nI10 I , I I I- . . . . . .. . . . . . .10080113Stand B. Stand managed <strong>for</strong> 120 years toachieve old-growth characteristics.6040200I F I I H ri I I I100121299lo#Stand C. Natural old-growth stand.I80_HardwoodsI6040- Conifers200'-II I I n n I n n I< 4 6 10 14 18 22 26 30 34 36 40 44 48 52Mid-point of four-inch diameter classesFigure G. 14. A. 20-year-old stand modeled with treatments to produce old-growth characteristics at 100 years (Stand B), and at100 years with no treatments (Stand A). Stand C is <strong>the</strong> desired stand structure (R. Lewis 1991).514...-
.1iiHeight (feet)No treatment.h442001000ll l l liAAi A Ai Al l* * * * | | * IfIncense cedafirPonde ass pineADouQ as-rHeight (feet) Group selection or Irregular shelterwood, prescribed fire.200 -A A100 401Trees per acre200 r n 400+Height (feet)I200 [-Initial stand. No prescribed fire.150100010050E Group selection3 Irregular shelterwood* UnmanagedCl Initial stand00-5Diameter class (inches)Figure G.15. Simulations of a mtxed conifer stand be<strong>for</strong>e management, after 240 years with no management and with uneven-agemanagement using irregular shelterwood and group selection methods. Prescribeddfires were used to reduce fre hazard in <strong>the</strong>managed stands. Drawings of stand structures above and diameter distributions below (Wea<strong>the</strong>rspoon and Ritchie 1991).515
Basal Area(square feetper acre)50 1Basal Area(square feetA. Trees 5 to 10 inches diameterper acre)B. Trees 11 to 20 inches diameterI4030201000 60 120 180 240 0 60 120 180 240YearsYearsBasal Area(square feetper acre)20015010050 /C. Trees 21 to 36 inches diameterBasal Area(square feetper acre)---2W r200 l-150 I100-50 ID. Trees less than 36 inches diameterjackE200 I N100 -1+ Indicate times of treatment I00 60 120 180 240Years)Figure G.1 6. A mixed conifer stand simulated to maintain a multilayered structure through 240 years by two types of uneven-agemanagement and prescribedfire. Diagrams show <strong>the</strong> basal area byfour size classes in Stands A, B. C, and D, and<strong>for</strong> <strong>the</strong> entireStand E. Horizontal lines indicate minimal level of basal area needed to maintain structure (Wea<strong>the</strong>rspoon and Ritchiel 991).516
II Stand A. No activities (east side multiple canopystand)150* P 21/20G 451/4D 222/4IP 15/24G 318/18D 152/7a)a)1005001990 2010 2030 2050I Stand B. Low density regime (east side multiple canopy stand)150* P 21/20G 332/4D 166/4P 10/25G 293/10D 30/9P 11/29G 552/18D 10/0a)IL1005001990 2010 2030 2050Stand C. High density regime (east side multiple canopy stand)C)LL150100500* P 7/21G 451/4- D 222/4I I... I ' .5 ,*** _ ** w_ -- ,. AIIk-- fP 10/25G 293/10D 30/91990 2010 2030P 7/29G 705/13D 22/24L, IK,, I .A_.2050* Trees per acre/average diameterA. No treatmentB. Heavy thinningC. Light thinning ,Douglas-fir (D)Ponderosa pine (P)11 - I - - - I I I - I 1. .....I......111- 111 I .1.1 ..... 1. . -... 1- 1Figure G. 7. Development of a mixed conifer, multiaged stand, eastern Cascades, at different densities. Nurnber of trees per acreand <strong>the</strong> average diameter are shown <strong>for</strong> <strong>the</strong> principal species (Oliver et aL 1991).517
* Opening <strong>the</strong> canopy in small patches and preparing <strong>the</strong> site <strong>for</strong> seeding orplanting probably will be needed to maintain ponderosa pine and Douglasfirin <strong>the</strong> <strong>for</strong>ests, if fire is to be excluded to provide owl habitat.SummaryThese silvicultural systems, developed <strong>for</strong> common types of stands throughout<strong>the</strong> range of <strong>the</strong> owl, indicate that multilayered stands can be developed ormaintained. Where stands are well stocked with young conifers, thinning<strong>the</strong>se stands provides space <strong>for</strong> development of large trees with full crowns,while providing light and moisture <strong>for</strong> growth of understory trees into multiplelayers. The structure and species composition of multistoried stands can bedeveloped and maintained by opening <strong>the</strong> overstory to favor establishedseedlings and saplings or to establish new ones.Fire, wind, insects, pathogens, soils, and o<strong>the</strong>r environmental variables areimportant within <strong>for</strong>ests throughout <strong>the</strong> owl's range. They must be evaluatedon a stand by stand basis to determine how <strong>the</strong>y affect stand development.Their potential effects often will be a key in determining <strong>the</strong> silviculture systememployed. Also, <strong>the</strong> structure of stands must be considered. Are <strong>the</strong>re hardwoodsor conifers present in <strong>the</strong> understory which will <strong>for</strong>m multiple layers?Are <strong>the</strong>re shrubs which will prevent or delay <strong>the</strong> establishment of trees neededto <strong>for</strong>m multilayers? Will <strong>the</strong> stand produce large snags or only small ones?What will costs or returns be? There<strong>for</strong>e, <strong>the</strong> cases presented are examples ofsystems which might be used to produce owl habitat. In practice,multidisciplinary professional input is needed on <strong>the</strong> ground to develop andimplement silvicultural systems.Careful implementation, monitoring, and evaluation of treatment effects arealso essential. They indicate <strong>the</strong> willingness and commitment to ensure that<strong>the</strong> system will produce <strong>the</strong> desired structure and habitat.As with all silviculture activities, <strong>the</strong>re is an important linkage between planningand implementation. Silviculture systems and practices that are feasibleecologically may be difficult and expensive to carry out. The prescriptionsoutlined here call <strong>for</strong> thinning, encouraging <strong>the</strong> growth of advance regenerationof hardwoods and conifers, and establishment of regeneration during <strong>the</strong>course of stand development. All of <strong>the</strong>se practices require care and need to beclosely monitored during and after implementation. Natural disturbances suchas fire, insect outbreaks, and windthrow affect managed and unmanagedstands. These events occur at random, and <strong>the</strong> timing and nature of <strong>the</strong>ireffects cannot be predicted. After such events occur, managed andunmanaged stands must be evaluated to determine <strong>the</strong>ir effects on standdevelopment. In some stands, <strong>the</strong> effects might be beneficial, in that <strong>the</strong>ywould aid stand development toward old-growth characteristics. In o<strong>the</strong>rcases, disturbance might prevent or delay development of desired standstructures.518
Literature CitedAlaback, P.A. 1982. Dynamics of understory biomass in Sitka spruce-westernhemlock <strong>for</strong>ests of sou<strong>the</strong>ast Alaska. Ecology. 63:1932-1948.Alaback, P.A., and F. R. Herman. 1988. Long-term response of understoryvegetation to stand density in Picea-Tsuga. Canadian Journal of ForestResearch 18:1522-1530.Alaback, P.A. and J.C. Tappeiner. 1991. Response of western hemlock andearly huckleberry seedlings to <strong>for</strong>est windthrow. Canadian Journal ofForest Research 21:534-539.Agee, J.K. 1990. The historical role of fire in <strong>the</strong> Pacific Northwest <strong>for</strong>ests. InWalstad et al. (eds.) Prescribed and natural fires in Pacific Northwest<strong>for</strong>ests, Oregon State University Press. Corvallis, Oregon, 316 pp.Assmann, E. 1970. Principles of <strong>for</strong>est yield study. Pergammon, New York,506 pp.Atzet, T. and D.L. Wheeler. 1982. Historical and ecological perspectives of fireactivity in <strong>the</strong> Klamath Geological Province of <strong>the</strong> Rogue River and SiskiyouNational Forests. USDA Forest Service, Pacific Northwest Region, Portland,Oregon. Region 6 -Range 102, 16 pp.Atzet, T., D.L. Wheeler, B. Smith, J. Franklin, G. Riegel, and D. Thornburgh.1992. Vegetation in re<strong>for</strong>estation practices in southwestern Oregon andnor<strong>the</strong>rn Cali<strong>for</strong>nia. Forest regeneration in southwestern Oregon. ForestResearch Laboratory, Oregon State University, Corvallis, Oregon (In press).Baker, F.S. 1953. Stand density and growth. Journal of Forestry. 51:95-97.Birch, K. 1991. Silviculture systems <strong>for</strong> Douglas-fir. Report to Nor<strong>the</strong>rn<strong>Spotted</strong> <strong>Owl</strong> <strong>Recovery</strong> Team.Brieglieb, P.A. 1952. An approach to density management in Douglas-fir.Journal of Forestry. 50:529-536.Curtis, R.O., G.W. Clendenen, and D.J. DeMars. 1981. A new stand simulator<strong>for</strong> coastal Douglas-fir: DF SIM: A user's guide. USDA Forest ServiceGeneral Technical Report PNW- 128.Curtis, R.O. and D.D. Marshall. 1986. Levels-of-growing-stock cooperativestudy in Douglas-fir. USDA Forest Service Research Paper. PNW-356. 113PP.Curtis, R.O. 1987. Levels-of-growing-stock cooperative study report no. 9-some comparisons of DFSIM estimates with growth in <strong>the</strong> levels-of-growing-stockstudy. USDA Forest Service Research Paper. PNW-376, 34 pp.Del Rio, E. and A.B. Berg. 1979. Growth of Douglas-fir reproduction in <strong>the</strong>shade of a managed <strong>for</strong>est. Research Paper 40, Forest Research Laboratory,Oregon State University, Corvallis, Oregon.Dilworth, J.R. 1980. Growth of western hemlock stands after precommercialthinning. Research Bulletin 33, Forest Research Laboratory, Oregon StateUniversity, Corvallis, Oregon.519
Drew, T.J. and J.W. Flewelling. 1979. Stand density management: An alternativeapproach and its application to Douglas-fir plantations. Forest Science.25:518-532.Eversole, K.R. 1955. Spacing tests in a Douglas-fir plantation. Forest Science.1:14-18.Franklin, J. and C.T. Dymess. 1973. Natural vegetation of Oregon andWashington. Oregon State University Press, Corvallis, Oregon. 417 pp.Franklin, J.F. and M.A. Hemstrom. 1981. Aspects of succession in coniferous<strong>for</strong>ests in <strong>the</strong> Pacific Northwest. Pages 212-229 In O.C. West, H.H.Shugart, and D.B. Botkin, eds. Forest Succession: Concepts and Application.Springer Verlag, New York.Fried, J.S., J.C. Tappeiner and D.E. Hibbs. 1988. Bigleaf maple seedlingestablishment and early growth in Douglas-fir <strong>for</strong>ests. Canadian Journalof Forest Research. 18:1226-1233.Gordon, D.T. 1973. Released advance reproduction of white and red fir ...growth, damage, mortality. USDA Forest Service Research Paper. PSW-95.22 pp.Graham, J.N., J.F. Bell, and F.R. Herman. 1985. Response of Sitka spruceand western hemlock to commercial thinning. USDA Research PaperPNW-334.Greene, S.E. and W.H. Emmingham. 1986. Early lessons from commercialthinning in a 30-year-old Sitka spruce, western hemlock <strong>for</strong>est. USDAForest Service Research Note PNW-448, 15 pp.Gutierrez, R.J. and A.B. Carey (eds). 1985. Ecology and management of <strong>the</strong>spotted owl in <strong>the</strong> Pacific Northwest. USDA Forest Service General TechnicalReport. PNW-185.Hadfield, J.S., D.J. Goheen, G.M. Filip, C.L. Schmitt and R.D. Harvey. 1986.Root diseases in Oregon and Washington conifers. USDA Forest ServiceRegion 6, Portland, Oregon, 27 pp.Hann, D.W. 1991. Memo. Subject: Validation of ORGANON.Harrington, C.A. and R. E. Miller. 1979. Response of a 110-year-old Douglasfir stand to urea and ammonia nitrate fertilizer. USDA Forest ServiceResearch Note PNW-336.Harrington, C.A. and C.A. Wierman. 1990. Growth and foliar nutrient responseto fertilization and precommercial thinning in a coastal westernredcedar stand. Canadian Journal of Forest Research. 20:764-773.Helms, J.A., and R.B. Standi<strong>for</strong>d. 1985. Predicting release of advance reproductionof mixed conifer species in Cali<strong>for</strong>nia following overstory removal.Forest Science. 31:3-15.Hester, A.S., D.W. Hann, and D.R. Larsen. 1989. Organon: Southwest Oregongrowth and yield model user manual, version 2. Forest Research Laboratory,Oregon State University, Corvallis, Oregon.520Hoover, L.D. 1988. Gap regeneration in old-growth Douglas-fir hardwood<strong>for</strong>ests of northwestern Cali<strong>for</strong>nia. M.S. <strong>the</strong>sis, Humboldt State University,Arcata, Cali<strong>for</strong>nia.
Huffman, D. 1991. Salal seedling establishment and clonal development inyoung growth Douglas-fir stands. Data on file, College of Forestry, OregonState University, Corvallis, Oregon.Hunter, M.L. 1990. Wildlife <strong>for</strong>ests and <strong>for</strong>estry, Prentice Hall, EnglewoodCliffs, New Jersey. 370 pp.Isaac, L.A. 1938. Factors affecting <strong>the</strong> establishment of Douglas-fir seedlings.USDA Circular 486.Isaac, L.A. 1956. Place of partial cutting in old-growth stands of <strong>the</strong> Douglasfirregion. USDA Forest Service Pacific Northwest Forest and RangeExperiment Station Research Paper 16, 148 pp.King, J.E. 1986. Review of Douglas-fir thinning treats. In Oliver et al. (eds).Douglas-fir stand management <strong>for</strong> <strong>the</strong> future. Proceedings, Institute ofForest Resources Contribution 55, 388 pp.Kirkland, B.P. and A.J.F. Brandstrom. 1936. Selective timber management in<strong>the</strong> Douglas-fir region. Charles Lathrop Park Forestry Foundation. Washington,D.C., 172 pp.Krumland, B. and L.D. Wensel. 1980. CRYPTOS(I) - user's guide. Universityof Cali<strong>for</strong>nia, Berkeley, College of Natural Resources. Cooperative redwoodyield research project, Research Note 16.Lewis, R. 1991. Silvicultural systems <strong>for</strong> Douglas-fir tanoak stands. Report to<strong>the</strong> Nor<strong>the</strong>rn <strong>Spotted</strong> <strong>Owl</strong> <strong>Recovery</strong> Team.Lindquist, J.L. and M.N. Palley. 1963. Empirical yield tables <strong>for</strong> young-growthredwood. Cali<strong>for</strong>nia Agriculture Experiment Station Bulletin 796. Universityof Cali<strong>for</strong>nia.Long, J.N. 1977. Trends in plant species diversity associated with developmentin a series of Pseudotsuga menziesii/Gaul<strong>the</strong>ria shalon stands.Northwest Science. 51:119-130.Long, J.N. and J. Turner. 1975. Above ground biomass of understory andoverstory in an age sequence of four Douglas-fir stands. Journal of AppliedEcology. 12:179-188.Mann, J.W. and S.D. Tesch. 1985. Coordinating silvicultural objectives withharvesting capabilities in southwest Oregon. p. 27-32 In Improving MountainLogging: <strong>Plan</strong>ning, Techniques, and Hardware. Joint symposium ofIUFRO and Sixth PNW Skyline Symposium, May 8-11, 1985. Vancouver,British Columbia, Canada.Marshall, D.D. 1990. The effects of thinning on stand and tree growth in ayoung high site of Douglas-fir in western Oregon. Ph.D. <strong>the</strong>sis, OregonState University, Corvallis, Oregon.McCreary, D.D. and Perry, D.A. 1983. Strip thinning and selective thinning inDouglas-fir. Journal of Forestry. 81:375-377.Miller, R.E. and C.A. Harrington. 1979. Response to urea and ammonianitrate fertilizer in an 80-year-old Douglas-fir stand. USDA Forest ServiceResearch Note PNW-330.521
Miller, R.E.; D.L. Reukema, and R.L. Williams. 1979. Response to fertilizationin thinned and unthinned Douglas-fir stands. Proceedings: Forest FertilizationConference [Gessel, Kenady, Atkinson eds.]. College of ForestResearch, University of Washington.Miller, R.E. and R.F. Tarrant. 1983. Long-term growth response of Douglas-firto ammonia nitrate fertilizer. Forest Science. 29:127-137.Morrison, P.H. and F.J. Swanson. 1990. Fire history in two <strong>for</strong>est ecosystemsof <strong>the</strong> central western Cascade Range, Oregon. USDA Forest ServiceGeneral Technical Report. PNW-254.Neitro, W.A., V.N. Binkley, S.P. Cline, RW. Mannan, B.G. Marcot, D.Taylor, and F.F. Wagner. 1985. Snags (wildlife trees). In E.R. Brown (ed).Management of wildlife and fish habitats in <strong>for</strong>ests of western Oregon andWashington. USDA Forest Service, Pacific Northwest Region, Portland,Oregon.Newton, M. and E.C. Cole. 1987. A sustained yield scheme <strong>for</strong> old-growthDouglas-fir. Western Journal of Applied Forestry. 2:22-25.Nystrom, M.N, D.S. Bell, and C.D. Oliver. 1984. Development of younggrowthwestern redcedar stands. USDA Forest Service Research PaperPNW-324.O'Dea M. 1991. Vine maple clonal development in Douglas-fir <strong>for</strong>ests. Dataon file Oregon State University College of Forestry, Corvallis, Oregon.Oliver, C.D. 1981. Forest development in North America following majordisturbances. Forest Ecology and Management. 3:153-168.Oliver, C.D. and B.C. Larson. 1990. Forest stand dynamics. McGraw-Hill Inc.New York, 467 pp.Oliver, C.D., C.W. Harrington and o<strong>the</strong>rs. 1991. Silvicultural systems <strong>for</strong>Douglas-fir-western hemlock and o<strong>the</strong>r mixed conifer stands. Report to<strong>the</strong> Nor<strong>the</strong>rn <strong>Spotted</strong> <strong>Owl</strong> <strong>Recovery</strong> Team.Reukema, D.L. 1972. Twenty-one-year development of Douglas-fir standsrepeatedly thinned at varying intervals. USDA Forest Service ResearchPaper PNW- 141.Reukema, D.L. 1975 Fifty-year development of Douglas-fir stands planted atvarious spacings. USDA Forest Service Research Paper PNW-253.Rosenberg, K.V. and M.G. Raphael. 1986. Effects of <strong>for</strong>est fragmentation onvertebrate in Douglas-fir <strong>for</strong>ests. Pages 263-272 In J. Vemer, M.L.Morrison, C.J. Ralph, eds. Wildlife 2000, Modeling habitat relationships ofterrestrial vertebrates, University of Wisconsin Press, Madison, Wisconsin,University of Wisconsin.Ruth, R.H. and A.S. Harris. 1979. Management of western hemlock Sitkaspruce <strong>for</strong>ests <strong>for</strong> timber production. USDA Forest Service General TechnicalReport. PNW-88.Sawyer, J.O. and D.A. Thornburgh. 1977a. Mixed evergreen <strong>for</strong>ests In:Barbour, M.G. and J. Major (eds). Terrestrial vegetation of Cali<strong>for</strong>nia.Wiley & Sons, New York.522
Sawyer, J.O. and D.A. Thornburgh. 1977b. Montane and subalpine vegetationof <strong>the</strong> Klamath Mountains. Ir: Barbour, M.G. and J. Major (eds).Terrestrial vegetation of Cali<strong>for</strong>nia. Wiley and Sons, New York.Smith, D.M. 1986. The practice of silviculture. John Wiley and Sons, NewYork. 527 pp.Spies, T.A. and J.F. Franklin. 1988. Old-growth and <strong>for</strong>est dynamics in <strong>the</strong>Douglas-fir. Natural Areas Journal. 8:190-201.Spies, T.A., J.F. Franklin, and T.B. Thomas. 1988. Coarse woody debris inDouglas-fir <strong>for</strong>ests of western Oregon and Washington. Ecology. 69:1689-1702.Spies, T.A., J.F. Franklin, and M. Klopsch. 1990. Canopy gaps in Douglas-fir<strong>for</strong>ests of <strong>the</strong> Cascade mountains. Canadian Journal of Forest Research.20:649-658.Spies, T.A. 1991. <strong>Plan</strong>t species diversity and occurrence in young, mature,and old-growth Douglas-fir stands in western Oregon and Washington.USDA Forest Service, Old-growth symposium. Portland, Oregon. In press.Spies, T.A. and J.F. Franklin. 1991. The structure of natural young, mature,and old-growth Douglas-fir <strong>for</strong>ests in Oregon and Washington. USDAForest Service, Old-growth symposium. Portland, Oregon. In press.Spies, T.A., J. Tappeiner, J. Pojar, and D. Coates. 1991. Trends in ecosystemmanagement. Trans. N. Am. Wildlife and Nat. Resources Conf. In press.Staebler, G.R. 1956. Evidence of shock following thinning of young Douglasfir.Journal of Forestry. 54:339.Staebler, G.R. 1956. Effect of controlled release on growth of individualDouglas-fir trees. Journal of Forestry. 54:567-568.Stage, A.R. 1973. Prognosis model <strong>for</strong> stand development. USDA AgricultureForest Service Research Paper INT- 164.Stein, W.I. 1981. Regeneration outlook on BLM lands in <strong>the</strong> sou<strong>the</strong>rn OregonCascades. USDA Forest Service Research Paper PNW-284. 68 pp.Stein, W.I. 1986. Regeneration outlook on BLM lands in <strong>the</strong> Siskiyou Mountains.USDA Forest Service Research Paper PNW-349. 104 pp.Stere, David H. 1991. A discussion of <strong>for</strong>est stand simulators. UnpublishedManuscript. Oregon Department of Forestry.Tappeiner, J.C., J.F. Bell, and J.D. Brodie. 1982. Response of young Douglasfirto 16 years of intensive thinning. Research Bulletin 38 Forest ResearchLaboratory, Oregon State University, Corvallis, Oregon.Tappeiner, J.C. and P.M. McDonald. 1984. Development of tanoak understoriesin conifer stands. Canadian Journal of Forest Research. 14:271-277.Tappeiner, J.C., W.H. Knapp, C.A. Wierman, W.A. Atkinson, C.D. Oliver, J.E.King, and J.C. Zasada. 1986. Silviculture on <strong>the</strong> Pacific Coast-<strong>the</strong> past30 years and <strong>the</strong> next 30 years. Journal of Forestry. 84(5):37-46.523
Tappeiner, J.C., P.M. McDonald, and T.F. Hughes. 1986. Establishment oftanoak and Pacific madrone in conifer <strong>for</strong>ests of southwestern Oregon.New Forests. 1:43-55.Tappeiner, J.C., J. Zasada, R.B. Ryan, and M. Newton. 1991. Salmonberryclonal and population structure: <strong>the</strong> basis <strong>for</strong> persistent cover. Ecology.72(2):609-618.Tesch, S.D., M.S. Craw<strong>for</strong>d, K. Baker-Katz, and J.W. Mann. 1990b. <strong>Recovery</strong>of Douglas-fir seedlings from logging damage in southwestern Oregon:Preliminary evidence. Northwest Science. 64:131-139.Thornburgh, D.A. 1981. Succession in mixed evergreen <strong>for</strong>ests in northwesternCali<strong>for</strong>nia. Proceedings: Forest Succession and Stand Development,March 26, 1981. Corvallis, Oregon.Thornburgh, D.A. 1991 a. Effect of <strong>the</strong> 1987 fires on <strong>the</strong> old-growth <strong>for</strong>eststructural and compositional diversity of <strong>the</strong> mixed evergreen and Klama<strong>the</strong>nriched montane mixed conifer <strong>for</strong>ests. Symposium of Biodiversity ofNor<strong>the</strong>rn Cali<strong>for</strong>nia.Thornburgh, D.A. 199 lb. Silvicultural systems <strong>for</strong> redwood <strong>for</strong>ests. Report to<strong>the</strong> Nor<strong>the</strong>rn <strong>Spotted</strong> <strong>Owl</strong> <strong>Recovery</strong> Team.Troup, R.S. 1928. Silvicultural Systems, Clarendon Press, Ox<strong>for</strong>d.Turner, J. 1979. Effects of fertilization on understory vegetation. In Gessel,Kenady, Atkinson, eds. Proceedings: Forest Fertilization Conference.College of Forest Resources, University of Washington, Seattle. Institute ofForest Research Contr. No. 40.USDA Forest Service. 1979. Shelterwood cutting in Region 6. USDA ForestService task <strong>for</strong>ce report, Div. of Timber Manage. Miscellanous Publication,Portland, Oregon. 55 pp.Walstad, J.D. 1992. A history of <strong>the</strong> development, use, and management ofresources in southwestern Oregon and Nor<strong>the</strong>rn Cali<strong>for</strong>nia. In Re<strong>for</strong>estationpractices in southwestern Oregon and Nor<strong>the</strong>rn Cali<strong>for</strong>nia. In press,FRL, Oregon State University, Corvallis, Oregon.Waring, R.H., W.H. Emmingham, H.L. Gholz, and C.C. Grier. 1978. Variationin maximum leaf area of coniferous <strong>for</strong>ests in Oregon and its ecologicalsignificance. Forest Science. 24:131-140.Wea<strong>the</strong>rspoon, P. and M. Ritchie. 1991. Silvicultural prescriptions <strong>for</strong> mixedconifer stands in Nor<strong>the</strong>rn Cali<strong>for</strong>nia. Report to <strong>the</strong> Nor<strong>the</strong>rn <strong>Spotted</strong> <strong>Owl</strong><strong>Recovery</strong> Team.Wensel, L.C., and J.R. Koehler. 1985. A tree growth projection system <strong>for</strong>nor<strong>the</strong>rn Cali<strong>for</strong>nia coniferous <strong>for</strong>ests. Research Note 10. 12 U.C. Berkeley,Dept. of Forestry and Resource Management, Nor<strong>the</strong>rn Cali<strong>for</strong>niaForest Yield Cooperative, 30 pp.Williamson, R.L. 1966. Thinning response in 110-year-old Douglas-fir. USDAForest Service Research Note, PNW-36.Williamson, R.L. and F. Price. 1971. Initial thinning effects in 70- to-150-year-old Douglas-fir - western Oregon and Washington. USDA ForestService Research Paper PNW- 117.524
Williamson, R.L. 1973. Results of shelterwood harvesting of Douglas-fir in <strong>the</strong>Cascades of western Oregon. USDA Forest Service Research Paper PNW-161, 13 pp.Williamson, R.L. 1982. Response to commercial thinning in a 1 10-year-oldDouglas-fir stand. USDA Forest Service Research Paper PNW-296.Williamson, R.L. and A.D. Twombly. 1983. Pacific Douglas-fir. In silviculturesystems <strong>for</strong> <strong>the</strong> major <strong>for</strong>est types of <strong>the</strong> United States. USDA ForestService, Agriculture Handbook 445.Williamson, R.L. and R.O. Curtis. 1984. Levels-of-growing-stock cooperativestudy in Douglas-fir: Report no. 7 - preliminary results, Stampede Creek,and some comparisons with Iron Creek and Hoskins. USDA Forest ServiceResearch Paper PNW-323. 42 pp.Worthington, N.P. and G.R. Staebler. 1961. Commercial thinning of Douglasfirin <strong>the</strong> Pacific Northwest. USDA Forest Service Technical Bulletin No.1230. 124. pp.Yerkes, V.P. 1960. Growth after thinning in 110-year-old Douglas-fir. USDAForest Service Pacific Northwest Forest and Range Experiment StationResearch Note 189. 3 pp.Zinke, P.J. 1977. The redwood <strong>for</strong>est and associated north coast <strong>for</strong>ests. In:525
526
Appendix HEconomic and Social Considerationsin <strong>the</strong> Formulation of The Nor<strong>the</strong>rn<strong>Spotted</strong> <strong>Owl</strong> <strong>Recovery</strong> <strong>Plan</strong>527
528
Table of ContentsI. Introduction and Sum m ary ................................................ 531A. Requirements of <strong>the</strong> Endangered Species Act ................................. 531B. The Problem ......................................................... 531C. The Role of Economic Considerations ............................................ 531D. Summary of Features to Reduce Costs .......................................... 533E. Summary of Preliminary Estimatesof <strong>the</strong> Economic Effects of Implementing <strong>the</strong> <strong>Recovery</strong> <strong>Plan</strong> ............ 534II.General Economic Principles <strong>for</strong>Reducing <strong>the</strong> Cost of <strong>Spotted</strong> <strong>Owl</strong> <strong>Recovery</strong> . ........................... 536A. The Efficiency Principle ......................................................... 536B. The Importance of <strong>Owl</strong> Habitat Productivity ................................... 537C. Joint Production Possibilities ........................................................ 538D. The Importance of Timber Productivity .......................................... 539E. Institutional Principles <strong>for</strong> Promoting Efficiency ............................. 539F. Equity and Distributional Principles .............................................. 540G. Dealing with Uncertainty and Risk ................................................ 540III. Relationship Between <strong>Spotted</strong> <strong>Owl</strong>Habitat and <strong>the</strong> Timber Resource Base ................................................ 541IV. Economic and Social Cost In<strong>for</strong>mationConsidered in <strong>the</strong> Formation of <strong>the</strong> <strong>Recovery</strong> <strong>Plan</strong> . ...................... 543A. Previously Estimated Economic Costsof <strong>Owl</strong> Conservation Proposals ...................................................... 544B. Potential Social Costs of <strong>Owl</strong> Conservation Measures ..................... 548C. Indicators of <strong>the</strong> Timber Dependency of Local Economies ............... 550V. Preliminary Evaluation of <strong>the</strong> Economic Effectsof Implementing <strong>the</strong> <strong>Spotted</strong> <strong>Owl</strong> <strong>Recovery</strong> <strong>Plan</strong> ................................... 558A. Economic Effects Covered by Preliminary Estimates ....................... 558B. Analytical Concepts .......................................... 5581. The Supply Curve ......................................................... 5582. The Fundamental Economic Benefits of Timber Production ...... 5623. Economic Effects of <strong>Owl</strong> Habitat Protection .............................. 5654. The Demand <strong>for</strong> Labor in <strong>the</strong> Timber Industry ......................... 5715. Effects on <strong>the</strong> Value of Capital Assets ...................................... 573C. Estimating Economic Effects of Implementing <strong>the</strong> <strong>Recovery</strong> <strong>Plan</strong> .... 5731. Estimating <strong>the</strong> Loss of Benefits from Federal Timber Harvest .... 5732. Estimating Employment Effects ............................................... 5743. Estimating Wage Losses ......................................................... 5764. Estimating <strong>the</strong> Economic Effects of Silvicultural Practices ........ 5785. Estimating <strong>the</strong> Economic Effects of Salvage .............................. 5806. Estimating <strong>the</strong> Effects on County Revenues ............................. 580Bibliography . 583Figures1. Timber supply curve . 5592. Timber supply curve from Table H.7 . 5603. Timber supply curves . 5604. Timber supply curves from Table H.8 . 5625. Effect of removing low cost timber from timber supply curve . 562529
6. Timber supply curve and economic rent ........................................ 5637. Timber supply curve and consumers' surplus ................................ 5648. Effects of removal of timberland on regional timber market ............. 5659. Economic benefit <strong>for</strong>egone by reduction in federal timber harvest ... 56610. Price-induced gains in economic benefits from federal timber harvest ... 56711. Price-induced gains in economic benefit from private timber harvest ... 56712. Price-induced losses in benefits from milling .................................. 56813. Total economic losses from reduction in federal timber harvest ....... 56914. Dynamic effects of removal of timberland on regional timber market ... 570Tables1. Summary of previous studiesof economic effects of nor<strong>the</strong>rn spotted owl conservation ................ 5472. Economic dependency indexes <strong>for</strong> wood products and o<strong>the</strong>rselected industrial sectors, by economic area and region, 1985 ....... 5523. Job response coefficients <strong>for</strong> affected counties ............................... 5534. Economic characteristicsof counties affected by critical habitat designation .......................... 5545. High-risk communities in Washington ........................................... 5566. Severely affected communities and counties in Oregon ................... 5577. Derivation of timber supply curve .................................................. 5618. Effect of restricted timber availabilityon derivation of timber supply curve .............................................. 5619. Comparison of federal timber available <strong>for</strong> harvest,1995, with conservation areas and matrix rules ............................. 57510. Comparison of timber employment levels, 1995, related tofederal timber harvest (with conservation areas and matrix) ........... 57611. State and county timber industry employment effectsof withdrawing designated conservation areas(DCAs) from <strong>the</strong> timber base ......................................................... 57712. Economic effects of silviculturein designated conservation areas ................................................... 58013. State and county revenue sharing effects of withdrawingdesignated conservation areas (DCAs) from <strong>the</strong> timber base ............ 581530
I. Introduction and SurnmaryA. Requirements of <strong>the</strong> Endangered Species ActB. The ProblemThe Endangered Species Act establishes a biological imperative that governs<strong>the</strong> <strong>for</strong>mulation of <strong>the</strong> recovery plan <strong>for</strong> <strong>the</strong> nor<strong>the</strong>rn spotted owl, a speciesthat was placed on <strong>the</strong> list of threatened species on June 26, 1990. Thebiological imperative requires that <strong>the</strong> recovery plan provide <strong>for</strong> <strong>the</strong> managementof <strong>the</strong> owl and its habitat in a manner that will result in <strong>the</strong> conditionsnecessary <strong>for</strong> its long-term survival without <strong>the</strong> protections of <strong>the</strong> act. If this isachieved, <strong>the</strong> species can be removed from <strong>the</strong> list. Clearly, biological principlesand in<strong>for</strong>mation will <strong>for</strong>m <strong>the</strong> primary basis <strong>for</strong> designing and evaluating <strong>the</strong>likely success of management actions <strong>for</strong> recovery of <strong>the</strong> spotted owl.Formulation of a recovery plan <strong>for</strong> <strong>the</strong> nor<strong>the</strong>rn spotted owl encounters manyof <strong>the</strong> fundamental conflicts that generally arise between economic growth andproductivity, on one hand, and environmental quality, on <strong>the</strong> o<strong>the</strong>r. The rangeand habitat of <strong>the</strong> owl are extensive and largely coincide with <strong>the</strong> remainingold-growth <strong>for</strong>ests of <strong>the</strong> Pacific Northwest and o<strong>the</strong>r valuable timberlands withsimilar characteristics. Many of <strong>the</strong> actions being suggested to protect <strong>the</strong> owlpopulation would substantially restrict <strong>the</strong> harvesting of timber from <strong>the</strong>se<strong>for</strong>ests. They also would prevent harvest from some younger <strong>for</strong>estlands thatcould become owl habitat in future decades. Although <strong>the</strong> preservation of owlhabitat will yield a variety of benefits to wildlife and recreation, substantialsocial and economic costs will be caused by <strong>the</strong> reductions in timber harveststhat will result from implementing such measures during many decades.U.S. Forest Service and Bureau of Land Management (BLM) estimates indicatethat planned timber sales in federal <strong>for</strong>ests in <strong>the</strong> 1990s would have yieldedannual timber harvests between 3 and 4 billion board feet per year, generatingmore than $1 billion dollars annually in economic benefits and supportingnearly 70,000 jobs in <strong>the</strong> Pacific Northwest. Projections <strong>for</strong> some owl preservationplans show that <strong>the</strong>y would cause a substantial decline in production andemployment in <strong>the</strong> timber and wood products industries in <strong>the</strong> Pacific Northwest.Timber harvests from federal lands would be cut nearly in half. Estimatesof <strong>the</strong> costs of such proposals have ranged as high as $25 billion over 50years (Mead et al. 1990) and 40,000 jobs (Beuter et al. 1990). The threat ofsuch economic effects has made <strong>the</strong> preservation of <strong>the</strong> owl very controversial.C. The Role of Economic ConsiderationsSecretary of <strong>the</strong> Interior Manuel Lujan, Jr., asked <strong>the</strong> Nor<strong>the</strong>rn <strong>Spotted</strong> <strong>Owl</strong><strong>Recovery</strong> Team to consider economic effects to <strong>the</strong> extent consistent with itslegal mandate in <strong>for</strong>mulating a recovery plan <strong>for</strong> <strong>the</strong> owl. The decision toconsider economic effects in <strong>for</strong>mulating a recovery plan represents a significantdeparture from past practice. <strong>Recovery</strong> plans prepared <strong>for</strong> o<strong>the</strong>r specieshave not <strong>for</strong>mally used economic analysis, although <strong>the</strong> costs of managementactions such as acquisition of habitat have been considered.Several unique challenges confronted <strong>the</strong> <strong>Recovery</strong> Team because of <strong>the</strong>precedent-setting nature of this ef<strong>for</strong>t. On one hand, advocates of <strong>for</strong>estpreservation and owl conservation expressed concerns that <strong>the</strong> considerationof economic effects would prevent <strong>the</strong> recovery plan from being based on531
scientifically credible biological principles and in<strong>for</strong>mation. Moreover, in <strong>the</strong>ircomments on o<strong>the</strong>r owl conservation proposals, <strong>for</strong>est preservation advocateshave emphasized <strong>the</strong> ecological and economic benefits of owl conservation. On<strong>the</strong> o<strong>the</strong>r hand, advocates of timber harvesting have expressed concerns about<strong>the</strong> substantial economic costs of owl conservation and have sought ways ofreducing restrictions on timber harvesting. The <strong>Recovery</strong> Team needed todevelop an approach that would be responsive to <strong>the</strong> Secretary's directive whilealso addressing concerns on both sides of <strong>the</strong> spotted owl controversy.Early in discussions of its task, <strong>the</strong> <strong>Recovery</strong> Team developed a conceptualapproach <strong>for</strong> considering economic effects. The <strong>Recovery</strong> Team agreed thatconsideration of economic effects would be done in a manner that would notdiminish <strong>the</strong> primacy of <strong>the</strong> biological imperative. The <strong>Recovery</strong> Team woulduse <strong>the</strong> best available biological in<strong>for</strong>mation to set recovery objectives and toidentify management actions to achieve recovery <strong>for</strong> <strong>the</strong> owl. Because recoveryof <strong>the</strong> species is <strong>the</strong> goal of a recovery plan under <strong>the</strong> Endangered Species Act,<strong>the</strong> <strong>Recovery</strong> Team decided not to consider whe<strong>the</strong>r, in light of <strong>the</strong> costs andbenefits of achieving recovery, a less costly goal should be pursued.The <strong>Recovery</strong> Team recognized, however, that different combinations of managementactions could satisfy <strong>the</strong> biological imperative to provide <strong>for</strong> <strong>the</strong> longtermsurvival and recovery of <strong>the</strong> owl. Because different management actionshave different costs, it should be possible, at least in principle, to find a combinationof management actions that would satisfy this biological imperative atleast cost. Because of <strong>the</strong> substantial costs of protecting <strong>the</strong> owl and <strong>the</strong>ireffects on <strong>the</strong> well-being of people economically dependent on timber harvestsin <strong>the</strong> Pacific Northwest, it was appropriate to make a concerted ef<strong>for</strong>t toreduce <strong>the</strong> costs of achieving recovery <strong>for</strong> <strong>the</strong> owl.In light of <strong>the</strong> biological imperative and <strong>the</strong> desirability of reducing <strong>the</strong> costs ofrecovery, <strong>the</strong> <strong>Recovery</strong> Team sought an approach that would provide a reasonableand appropriate consideration of economic principles and in<strong>for</strong>mation aswell as <strong>the</strong> best biological in<strong>for</strong>mation available. It decided to use biologicalprinciples and in<strong>for</strong>mation to design management actions that would contributeto achieving recovery while considering economic effects in a manner thatwould focus thinking on ways to achieve recovery at lower costs. This commonsense approach is like <strong>the</strong> ef<strong>for</strong>ts of a family to decide what sorts of productsmeet <strong>the</strong>ir needs and <strong>the</strong>n to shop <strong>for</strong> <strong>the</strong> least costly source of those products.It is also consistent with generally accepted principles of public policy.The approach used by <strong>the</strong> <strong>Recovery</strong> Team also was designed to meet <strong>the</strong> needsof <strong>the</strong> biologists on <strong>the</strong> <strong>Recovery</strong> Team who were responsible <strong>for</strong> <strong>for</strong>mulating<strong>the</strong> owl conservation measures in <strong>the</strong> plan. Decisions regarding owl conservationoptions to be considered and <strong>the</strong> design criteria <strong>for</strong> those options werebased on biological considerations. The economic in<strong>for</strong>mation developed <strong>for</strong>use by <strong>the</strong> biologists and o<strong>the</strong>r <strong>Recovery</strong> Team members was limited to fundamentaleconomic principles and simple indicators of <strong>the</strong> most importanteconomic effects. This economic in<strong>for</strong>mation was designed to be understandableto biologists and o<strong>the</strong>r <strong>Recovery</strong> Team members with little or no trainingin economics.532The in<strong>for</strong>mation summarized in this appendix differs in several ways from acomprehensive, systematic cost-benefit study of options <strong>for</strong> achieving recovery.First, it was designed primarily to facilitate design of a cost-effective recoveryplan ra<strong>the</strong>r than to provide in<strong>for</strong>mation to be used by decision-makers consideringwhe<strong>the</strong>r to implement <strong>the</strong> resulting plan. Fur<strong>the</strong>r in<strong>for</strong>mation collectedduring <strong>the</strong> period of public review of <strong>the</strong> draft recovery plan will be used todevelop a more complete assessment of its costs and benefits. This assessmentwill be available <strong>for</strong> consideration in making final decisions about implementationof <strong>the</strong> plan.
Second, <strong>the</strong> analysis in this appendix focuses primarily on <strong>the</strong> costs of owlconservation measures because <strong>the</strong>y are central to <strong>the</strong> development of a costeffectiverecovery plan. It does not assess <strong>the</strong> benefits of recovery because <strong>the</strong><strong>Recovery</strong> Team did not pursue options that would fail to achieve recovery. TheEndangered Species Act required <strong>the</strong> <strong>Recovery</strong> Team to focus on <strong>the</strong> questionof how to achieve recovery, not whe<strong>the</strong>r ef<strong>for</strong>ts to recover <strong>the</strong> spotted owl arejustified by <strong>the</strong> benefits of preserving <strong>the</strong> species and its habitat. The o<strong>the</strong>rbenefits of various owl conservation measures, such as protection of o<strong>the</strong>rspecies and increased recreation value, were considered only when <strong>the</strong>y wouldaffect <strong>the</strong> design of <strong>the</strong> plan. They would be relevant, of course, in making finaldecisions about implementation of <strong>the</strong> plan.In addition, <strong>the</strong> economic analysis used in <strong>the</strong> <strong>for</strong>mulation of <strong>the</strong> draft recoveryplan was not intended to provide a highly precise and comprehensive enumerationof all of <strong>the</strong> economic effects of owl conservation measures. The approachused was to be selective and "economical" in <strong>the</strong> conduct of economic analysis.Analysis was limited to key indicators of <strong>the</strong> costs of owl conservation thatwould be understandable and helpful to <strong>the</strong> <strong>Recovery</strong> Team's biologists in <strong>the</strong>iref<strong>for</strong>ts to find ways to reduce <strong>the</strong> costs of achieving recovery.D. Summary of Features to Reduce CostsPart of <strong>the</strong> process of <strong>for</strong>mulating a cost-effective recovery plan is to consider awide variety of ways to reduce costs without undercutting <strong>the</strong> effectiveness of<strong>the</strong> plan. This appendix outlines economic principles and in<strong>for</strong>mation suggestingmany ways of reducing costs that <strong>the</strong> <strong>Recovery</strong> Team considered. Somewere rejected <strong>for</strong> biological reasons, o<strong>the</strong>rs <strong>for</strong> lack of demonstrated applicationand lack of <strong>the</strong> data needed to implement <strong>the</strong>m in designing a recovery plan.Several features, however, were included in <strong>the</strong> recovery plan as a result ofef<strong>for</strong>ts to reduce <strong>the</strong> costs of achieving recovery. These include <strong>the</strong> following:1. The designated conservation areas (DCAs) were designed to make use ofareas that have relatively high quality owl habitat and, where possible, to avoid<strong>the</strong> use of <strong>for</strong>est with high potential <strong>for</strong> timber harvest.2. To promote greater efficiency, <strong>the</strong> DCA boundaries will be refined prior toapproval of <strong>the</strong> final recovery plan based on <strong>the</strong> site-specific data available to<strong>the</strong> federal <strong>for</strong>est management agencies.3. The DCA management guidelines allow silvicultural treatment of areas notsuitable <strong>for</strong> owl habitat to promote more rapid development of suitable conditionsand provide timber as well.4. The management guidelines <strong>for</strong> federal land outside of DCAs were tailoredto local conditions so that <strong>the</strong> resulting timber harvest restrictions will betterassure <strong>the</strong> habitat conditions in each area that are needed <strong>for</strong> recovery withoutincurring unnecessary cost.5. Suggestions were developed <strong>for</strong> management of nonfederal lands that willincrease <strong>the</strong> efficiency of <strong>the</strong>ir contribution to recovery by integrating stateauthorities and existing programs into a coordinated strategy.6. To provide a basis <strong>for</strong> improving <strong>the</strong> cost-effectiveness of <strong>the</strong> recovery plan,a research and monitoring program is proposed to provide in<strong>for</strong>mation on <strong>the</strong>habitat conditions that are most productive <strong>for</strong> owls and <strong>the</strong> <strong>for</strong>est managementpractices that are most compatible with production and maintenance ofowl habitat conditions.533
E. Summary of Preliminary Estimates of <strong>the</strong> EconomicEffects of Implementing <strong>the</strong> <strong>Recovery</strong> <strong>Plan</strong>Preliminary estimates of <strong>the</strong> economic effects of <strong>the</strong> draft recovery plan areincluded in this appendix. They were developed to provide an early basis <strong>for</strong>comparison between <strong>the</strong> draft recovery plan and o<strong>the</strong>r owl conservation and<strong>for</strong>est preservation proposals. To provide a consistent basis <strong>for</strong> such comparisons,<strong>the</strong> estimates were developed using <strong>the</strong> same estimation methods appliedby <strong>the</strong> U.S. Fish and Wildlife Service (FWS) in evaluating <strong>the</strong> effects of <strong>the</strong>critical habitat designation <strong>for</strong> <strong>the</strong> spotted owl. These estimation methods aresummarized in section IV. and are described in more detail in Economic Analysisof Critical Habitat Designation Effects<strong>for</strong> <strong>the</strong> Nor<strong>the</strong>rn <strong>Spotted</strong> <strong>Owl</strong> publishedby <strong>the</strong> FWS at <strong>the</strong> time of <strong>the</strong> critical habitat designation (USDI 1992).There are several important limitations in <strong>the</strong> preliminary estimates provided<strong>for</strong> <strong>the</strong> draft recovery plan. The most important limitation is that <strong>the</strong>se preliminaryestimates do not reflect site-specific assessments of <strong>the</strong> timber potential of<strong>the</strong> <strong>for</strong>estland included in each of <strong>the</strong> DCAs. In addition, <strong>the</strong>y do not providesufficiently precise estimates of <strong>the</strong> timber harvest and economic benefits from<strong>the</strong> salvage and silvicultural activities allowed in <strong>the</strong> DCAs. The <strong>Recovery</strong>Team will work with <strong>the</strong> management agencies during review of <strong>the</strong> draftrecovery plan to develop timber harvest estimates based on more site-specificin<strong>for</strong>mation.The preliminary estimates do not include measures of <strong>the</strong> benefits of implementing<strong>the</strong> recovery plan. Nor do <strong>the</strong>y reflect <strong>the</strong> potential increase in privatetimber industry harvest in response to <strong>the</strong> higher timber prices that are likelyto result from implementing <strong>the</strong> plan. Such effects are analyzed in <strong>the</strong> FWS'seconomic analysis of <strong>the</strong> critical habitat designation and will be reflected inestimates prepared <strong>for</strong> <strong>the</strong> final recovery plan.Implementation of <strong>the</strong> recovery plan would reduce future annual timberharvests in <strong>the</strong> federal <strong>for</strong>ests of <strong>the</strong> Pacific Northwest below <strong>the</strong> levels thatwould o<strong>the</strong>rwise occur. It is estimated that <strong>the</strong> network of DCAs would reducemid- 1990s timber harvests by 1.3 billion board feet per year in comparison to<strong>the</strong> levels that would occur under federal agencies' plans. This reduction infederal timber harvest is expected to reduce <strong>the</strong> economic benefits of timberharvest by about $470 million per year over <strong>the</strong> next 20 years or more . Employmentlevels in <strong>the</strong> timber industry are estimated to decline by 18,900 jobsas <strong>the</strong> industry shrinks to a size appropriate to lower harvest levels. Employmentlevels in related sectors also will decline by an estimated 13,200 jobs.The displacement of workers and <strong>the</strong>ir reemployment at generally lower wagelevels are estimated to cause wage losses of $1.4 billion during <strong>the</strong> next 20years.Fur<strong>the</strong>r reductions in timber harvest will result from protection of habitat in<strong>the</strong> areas outside DCAs, on federal and nonfederal land. No estimates of <strong>the</strong>sereductions have been made at this time, but estimates will be prepared <strong>for</strong> <strong>the</strong>final recovery plan. Previous studies have shown that similar policies proposedby <strong>the</strong> Interagency Scientific Committee (ISC) would reduce annual federaltimber harvest in areas outside of <strong>the</strong> habitat conservation areas (HCAs) byabout 0.7 billion board feet. The reduction in federal harvest outside of <strong>the</strong>DCAs is expected to be of similar magnitude.Several features of <strong>the</strong> draft recovery plan will tend to offset <strong>the</strong> economiceffects of restrictions on federal timber harvest. First, <strong>the</strong> recovery plan allowssilvicultural treatments within DCAs if <strong>the</strong>y are designed to promote <strong>the</strong>development of habitat conditions suitable <strong>for</strong> owls in areas that are not534
currently suitable. Rough estimates of <strong>the</strong> possible effects of <strong>the</strong>se activitiesshow that treatment of 50,000 acres per year could support about 600 jobsand yield about 100 million board feet of timber per year worth about $26million.The second feature that will tend to offset <strong>the</strong> effects of timber restrictions isallowing limited timber salvage in DCAs. Timber salvage on federal <strong>for</strong>estsaveraged more than 600 million board feet per year during <strong>the</strong> 1980s. In lightof <strong>the</strong> fact that DCAs contain approximately one third of <strong>the</strong> <strong>for</strong>estland available<strong>for</strong> timber harvest, salvage of 10 to 20 percent of <strong>the</strong> salvageable timberwithin DCAs could yield, on average, 20 to 40 million board feet per year,supporting about 315 to 630 jobs.Fur<strong>the</strong>rmore, o<strong>the</strong>r sources of timber supply, including private <strong>for</strong>estlands in<strong>the</strong> Pacific Northwest, may increase production in response to higher timberprices. Although <strong>the</strong> response in <strong>the</strong> Northwest is likely to be limited andprobably could not be sustained more than a few years, it would slow <strong>the</strong> rateof job displacement in <strong>the</strong> early years of recovery plan implementation.In reviewing <strong>the</strong>se estimates of <strong>the</strong> economic effects of implementing <strong>the</strong>recovery plan, it is important to note that <strong>the</strong>y reflect <strong>the</strong> future effects of allnor<strong>the</strong>rn spotted owl conservation on federal land, not just <strong>the</strong> protectionadded to <strong>the</strong> current management regime by <strong>the</strong> recovery plan. The estimateswere prepared in this way because <strong>the</strong> recovery plan will provide a comprehensivebasis <strong>for</strong> all owl conservation ef<strong>for</strong>ts. Thus, <strong>the</strong>se estimates attribute to<strong>the</strong> recovery plan all of <strong>the</strong> economic effects of owl conservation that occur afterimplementation of <strong>the</strong> plan.If <strong>the</strong> recovery plan is not implemented, o<strong>the</strong>r owl conservation measures willremain in effect that also will restrict timber harvests. In particular, <strong>the</strong> ForestService and <strong>the</strong> BLM will continue policies <strong>the</strong>y developed in response to <strong>the</strong>ISC's recommendations. In addition, <strong>the</strong> FWS has designated critical habitat<strong>for</strong> <strong>the</strong> spotted owl and will apply <strong>the</strong> Endangered Species Act prohibitionsagainst federal actions that would adversely modify critical habitat or jeopardize<strong>the</strong> species. Comparable estimates of <strong>the</strong> economic effects of <strong>the</strong>se policiesare presented in <strong>the</strong> Economic Analysis of Critical Habitat Designation Effects of<strong>the</strong> Nor<strong>the</strong>m <strong>Spotted</strong> <strong>Owl</strong> prepared by <strong>the</strong> FWS. Comparison of <strong>the</strong> economiceffects of <strong>the</strong>se policies and those proposed by <strong>the</strong> draft recovery plan areprovided in section IV. That section presents more detailed estimates of <strong>the</strong>economic effects of <strong>the</strong> recovery plan and comparisons of <strong>the</strong>se estimates witho<strong>the</strong>r owl conservation activities and proposals.535
II. General Economic Principles <strong>for</strong> Reducing<strong>the</strong> Cost of <strong>Spotted</strong> <strong>Owl</strong> <strong>Recovery</strong>The <strong>Recovery</strong> Team began its ef<strong>for</strong>ts to find ways of achieving recovery at lowercost by reviewing general principles of economics that deal with costs andefficiency. To identify a wide range of possibilities <strong>for</strong> reducing costs, <strong>the</strong><strong>Recovery</strong> Team considered <strong>the</strong> application of <strong>the</strong>se principles to a variety of owlconservation measures. This section summarizes <strong>the</strong> principles and applicationsto spotted owl recovery that <strong>the</strong> <strong>Recovery</strong> Team considered. The draftrecovery plan includes some, but clearly not all, of <strong>the</strong> possible applications of<strong>the</strong>se principles.A. The Efficiency PrincipleThe efficiency principle can be simply stated: people in <strong>the</strong> United States willhave higher incomes and a higher standard of living if <strong>the</strong> goods and services<strong>the</strong>y want, including environmental quality and <strong>the</strong> preservation of species andecosystems, are all produced efficiently.The American people want many things. Most consumers recognize that <strong>the</strong>ycan get more from <strong>the</strong>ir family budget by shopping to find <strong>the</strong> things <strong>the</strong>y wantat lower prices. Business managers know that <strong>the</strong>y can make higher profits byreducing <strong>the</strong> costs of <strong>the</strong>ir business operations or by increasing <strong>the</strong> total valueof <strong>the</strong>ir output without proportionally increasing costs. Though imperfect,market-based economic systems have proven capable of providing people withmore of what <strong>the</strong>y want than o<strong>the</strong>r economic systems. An important reason <strong>for</strong>this success is <strong>the</strong> incentives <strong>the</strong> market creates to reduce costs. Reducingcosts is one way that our economic system solves conflicts among <strong>the</strong> manydifferent opportunities to use each resource.Our desire <strong>for</strong> secure and increasing incomes and material well-being oftenappear to be in conflict with our desire <strong>for</strong> protecting <strong>the</strong> environment. Economists,however, do not see this conflict as inherently different from <strong>the</strong> conflictbetween, say, using iron to construct office buildings and using iron to manufacturecars. More of both buildings and cars can be produced if proper care istaken to reduce <strong>the</strong> costs of <strong>the</strong> iron used in building construction and automanufacturing. Similarly, higher environmental quality and greater materialwell-being can be produced if proper care is taken to reduce <strong>the</strong> costs ofenvironmental protection as well as <strong>the</strong> costs of economic production.The same principle applies to owl recovery. The conflict between achievingrecovery <strong>for</strong> <strong>the</strong> owl and realizing <strong>the</strong> economic and social benefits from agreater supply of timber can be reduced by implementing <strong>for</strong>estland andhabitat management practices that yield a viable owl population at lower totalcost.536In general, achieving recovery of <strong>the</strong> owl requires <strong>the</strong> preservation and developmentof owl habitat that will support an owl population of sufficient numberand appropriate spatial distribution despite random catastrophic events suchas fire and disease. Much of <strong>the</strong> existing owl habitat is land with old-growth<strong>for</strong>ests that are prime <strong>for</strong> harvesting. Additional owl habitat can be grown byletting younger <strong>for</strong>ests continue to grow and age. Thus, <strong>the</strong> preservation anddevelopment of habitat will require restrictions on <strong>the</strong> harvesting of timberfrom <strong>for</strong>estlands that are now suitable owl habitat as well as from <strong>for</strong>estlandsthat are likely to develop into suitable owl habitat.
The primary economic costs of achieving recovery result from <strong>the</strong> loss of <strong>the</strong>economic benefits from <strong>the</strong> timber that o<strong>the</strong>rwise would be harvested and from<strong>the</strong> resulting increases in <strong>the</strong> prices of goods that are produced from timber.Economic benefits arise from timber harvesting because logs have a highereconomic value than <strong>the</strong> costs of producing <strong>the</strong>m. The economic benefits fromharvesting timber are mostly captured by <strong>the</strong> owners of <strong>for</strong>estlands. Forfederal lands, <strong>the</strong> profits are captured by <strong>the</strong> Forest Service and <strong>the</strong> BLM andare shared with states and local communities.The primary social cost of owl conservation measures is <strong>the</strong> decline in <strong>the</strong>quality of peoples' lives that results from <strong>the</strong> unemployment and reducedincome caused by <strong>for</strong>egone timber harvests. These social costs are generallymost severe in small, isolated communities with a large portion of <strong>the</strong> populationemployed in <strong>the</strong> timber and wood products industry. Small businessessuch as sawmills and supply businesses may fail, causing loss of assets andincome. People in <strong>the</strong>se communities have less opportunity to find new jobs atsimilar wages than people living closer to urban areas with a more diversifiedeconomic structure.The general principle <strong>for</strong> reducing <strong>the</strong> economic and social costs of owl recoveryis to employ management actions that will produce a higher "yield" of owls(<strong>the</strong> number of owls supported) per unit of <strong>for</strong>egone timber production and itsbenefits, particularly near communities where timber workers are less able toshift to o<strong>the</strong>r employment.B. The Importance of <strong>Owl</strong> Habitat ProductivityA recovery plan that uses habitat having higher productivity <strong>for</strong> owls should beable to achieve recovery using less habitat (assuming o<strong>the</strong>r biological requirements<strong>for</strong> recovery are met). Identifying <strong>the</strong> characteristics of habitat that arebest <strong>for</strong> owls and finding ways to enhance owl habitat productivity, especiallyin areas that currently are not suitable habitat, may help to reduce <strong>the</strong> costs ofrecovery.The high cost of owl preservation results from <strong>the</strong> large area of <strong>for</strong>estland withold-growth characteristics that is needed to provide sufficient habitat to supporta viable owl population. The productivity of owl habitat is measured by<strong>the</strong> density, reproductive success and individual survival rates of <strong>the</strong> owlpopulation that it is capable of supporting. <strong>Owl</strong> habitat productivity variessubstantially and depends highly on local conditions as well as <strong>the</strong> generalstructure of <strong>the</strong> <strong>for</strong>est landscape. O<strong>the</strong>r things being equal, <strong>the</strong> costs ofachieving recovery <strong>for</strong> <strong>the</strong> owl will be lower if <strong>the</strong> areas used as owl habitat arecapable of supporting more owls per acre.Measures that increase owl habitat productivity also may help reduce recoverycosts. For <strong>the</strong> overall cost of recovery to be reduced, <strong>the</strong> cost of implementingmeasures to increase owl habitat productivity must be less than <strong>the</strong> economicbenefits gained from <strong>the</strong> additional timber that can be harvested because of <strong>the</strong>increased owl habitat productivity.If ways can be found to improve <strong>the</strong> capability of currently existing and newlydeveloped owl habitat to support <strong>the</strong> owl population, <strong>the</strong>n less <strong>for</strong>estland willbe needed to sustain <strong>the</strong> population and more <strong>for</strong>estland can be used <strong>for</strong>timber production. This may reduce <strong>the</strong> long-run costs of achieving recovery<strong>for</strong> <strong>the</strong> owl.Research on owl ecology may help to identify environmental conditions thatpromote higher owl productivity. Experimentation with various silvicultural537
practices may be able to show how such conditions can be created or improvedin <strong>the</strong> <strong>for</strong>estlands reserved <strong>for</strong> owl habitat. Each measure <strong>for</strong> increasing owlhabitat productivity should be evaluated to determine whe<strong>the</strong>r it would costless than <strong>the</strong> economic benefits from <strong>the</strong> additional timber harvest that couldbe allowed if it were implemented. If those measures that cost less are implemented,<strong>the</strong> total cost of achieving recovery will be reduced.It appears that, in general, <strong>the</strong> total area and connectivity of owl habitat willneed to be increased to achieve recovery. Some younger <strong>for</strong>estlands that donot currently provide good owl habitat will need to be added to <strong>the</strong> overalllandscape devoted to <strong>the</strong> owl. Measures that accelerate <strong>the</strong> development ofyounger <strong>for</strong>estlands into good owl habitat may be able to promote more rapidrecovery and reduce <strong>the</strong> amount of <strong>for</strong>estlands that must be reserved toachieve recovery.It also may be possible that, as new habitat is added, some areas of old-growthdevoted to support of <strong>the</strong> owl population early in <strong>the</strong> recovery process can beharvested, perhaps by using selective harvest techniques instead of clearcutting.As younger <strong>for</strong>ests develop into suitable habitat, <strong>the</strong>y could be substituted<strong>for</strong> equivalent old-growth areas previously reserved <strong>for</strong> <strong>the</strong> owl. Timberharvest could <strong>the</strong>n occur in <strong>the</strong> old-growth areas that had been replacedinstead of in younger <strong>for</strong>ests with lower timber yields. To <strong>the</strong> extent that <strong>the</strong>economic benefits from harvesting timber in <strong>the</strong> younger <strong>for</strong>ests would havebeen lower than in <strong>the</strong> old-growth that could be harvested, this process wouldreduce <strong>the</strong> total cost of recovery.C. Joint Production PossibilitiesA recovery plan may be able to achieve recovery at lower cost by preserving orproducing owl habitat areas that also contribute to <strong>the</strong> preservation of o<strong>the</strong>rspecies that are candidates <strong>for</strong> being listed as threatened or endangered andneed similar conservation measures. If timber harvest will need to be restrictedto preserve o<strong>the</strong>r species as well as <strong>the</strong> owl, <strong>the</strong>re may be opportunitiesto reduce <strong>the</strong> total costs of wildlife preservation by using areas capable ofsupporting a variety of species ra<strong>the</strong>r than using separate habitat areas <strong>for</strong>each species. Economists regard such opportunities as joint productionpossibilities.A recovery plan also may be able to achieve recovery at lower costs by preservingor producing owl habitat areas that contribute to <strong>the</strong> provision of valuableservices, such as recreation. Recreation is an important use of <strong>for</strong>estland, onethat has brought increasing demand <strong>for</strong> restrictions on timber harvesting.There may be opportunities to reduce <strong>the</strong> total cost of providing <strong>for</strong>estland <strong>for</strong>habitat and recreation by identifying areas where <strong>the</strong> opportunities <strong>for</strong> jointproduction are greatest.In <strong>the</strong> long run, it may prove possible to provide owl habitat using measuresthat also provide <strong>for</strong> <strong>the</strong> growth and harvest of timber in <strong>the</strong> same areas.Although much attention has been focused by previous plans such as <strong>the</strong> ISC'sstrategy on <strong>the</strong> prohibition of all timber harvest in owl habitat areas, selectiveharvesting of timber in existing suitable habitat may be able to provide timberwhile also preserving essential habitat conditions. If <strong>the</strong> effectiveness of suchpractices can be demonstrated, <strong>the</strong>se selective harvesting practices can beused to reduce <strong>the</strong> economic and social costs of achieving recovery. Suchpossibilities need to be identified and tested to determine <strong>the</strong> extent <strong>the</strong>y canbe used to reduce <strong>the</strong> total cost of owl recovery.538
D. The Importance of Timber ProductivityTo <strong>the</strong> extent that a recovery plan uses <strong>for</strong>estland of lower timber productivity<strong>for</strong> owl habitat, it can achieve recovery at lower cost. Ideally, <strong>the</strong> total cost of arecovery plan would be minimized by selecting owl habitat areas having <strong>the</strong>highest ratio of owl habitat productivity to timber productivity as long as thoseareas also met <strong>the</strong> established recovery objectives.Nor<strong>the</strong>rn spotted owl conservation proposals have raised great controversybecause of <strong>the</strong> un<strong>for</strong>tunate coincidence between owl habitat and high valuetimber. Never<strong>the</strong>less, <strong>the</strong>re are clearly variations in <strong>the</strong> value of <strong>the</strong> timberinventory and in <strong>the</strong> future timber growth that can be achieved on differentsites. Location and slope as well as <strong>the</strong> timber inventory affect <strong>the</strong> value of <strong>the</strong>existing timber on a site. Soil conditions and rainfall affect <strong>the</strong> rate of regenerationand regrowth of timber once a site has been harvested. In principle,use of areas with lower value timber and lower quality sites as owl habitatwould reduce <strong>the</strong> costs of achieving recovery, assuming that such areasprovide appropriate and sufficient habitat <strong>for</strong> owl recovery.E. Institutional Principles <strong>for</strong> Promoting EfficiencyEconomists have been able to identify <strong>the</strong> characteristics of institutions thattend to achieve high efficiency. The <strong>Recovery</strong> Team considered several of suchprinciples in <strong>for</strong>mulating <strong>the</strong> recovery plan.Institutions tend to achieve higher efficiency when <strong>the</strong>y:* Use incentives to reward per<strong>for</strong>mance that improves <strong>the</strong> achievement ofobjectives,* Achieve an effective balance between central guidance on goals and objectivesand decentralized decision-making,* Allow a diversity of approaches reflecting differences in local conditions,* Provide flexibility to adapt to changing conditions and to improve quality andefficiency by responding to in<strong>for</strong>mation about <strong>the</strong> effectiveness and cost ofvarious actions,* Specialize in closely related activities,* Participate in trading or market transactions that promote <strong>the</strong> highest valueuse of resources.Experience with market mechanisms shows that resource managers respondmore efficiently to incentives than to directives and restrictions. The <strong>Recovery</strong>Team looked <strong>for</strong> opportunities to create incentives <strong>for</strong> improving owl productivitywithin each of <strong>the</strong> ownership and management regimes with jurisdictionover owl habitat.Field level <strong>for</strong>est managers and biologists often have knowledge of local conditionsthat is not reflected in <strong>for</strong>mal data available to <strong>the</strong>ir headquarters' organizations.Using this local knowledge, <strong>the</strong>y may be able to identify <strong>the</strong> mostproductive habitat and make significant increases in <strong>the</strong> owl productivity andtimber harvests on <strong>the</strong> lands within <strong>the</strong>ir jurisdiction.If in<strong>for</strong>mation on <strong>the</strong> effectiveness of various <strong>for</strong>est management practices thatcan enhance <strong>the</strong> productivity of owl habitat can be provided to local <strong>for</strong>estlandmanagers and biologists, <strong>the</strong>y may be able to better identify areas within <strong>the</strong>irjurisdiction with <strong>the</strong> greatest carrying capacity and apply management actionsthat would best enhance that capacity. Allowing greater diversity in designatingand managing owl habitat also may increase <strong>the</strong> chances of finding new,innovative measures <strong>for</strong> increasing owl productivity.539
Economic patterns show <strong>the</strong> efficiency of specialized organizations. In <strong>the</strong> caseof owl conservation, specialization may facilitate increases in owl productivity.It may be possible to create specialized elements within existing organizations<strong>for</strong> <strong>the</strong> express purpose of managing owl habitat. In some cases, changes inland ownership may be needed. Because protection of <strong>the</strong> owl population is apublic good, not a market good, it would be reasonable to rely more on publicthan private institutions <strong>for</strong> <strong>the</strong> provision of owl habitat.Management systems that allow trading of resources among managers ofcompeting uses have proven to be more effective at allocating resources amongthose competing uses in a cost minimizing way. This principle has gainedwider recognition in environmental policy in recent years. For example,applications of trading processes are being developed <strong>for</strong> air emission reductionas well as wetlands preservation and restoration. Similar trading mechanismsmay be able to contribute to reducing <strong>the</strong> costs of allocating <strong>for</strong>estland to owlrecovery. For example, government agencies might be allowed to trade <strong>for</strong>estlandoutside of areas designated <strong>for</strong> owl habitat <strong>for</strong> areas within designatedareas if <strong>the</strong>y can show that <strong>the</strong>re will be gains in <strong>the</strong> support of owls andtimber harvests.F. Equity and Distributional PrinciplesIn its ef<strong>for</strong>ts to ga<strong>the</strong>r in<strong>for</strong>mation on <strong>the</strong> costs of owl conservation measures<strong>the</strong> <strong>Recovery</strong> Team learned of <strong>the</strong> strong concerns in timber dependent communitiesabout <strong>the</strong> unfairness of <strong>the</strong> burden <strong>the</strong>y may be <strong>for</strong>ced bear so that<strong>the</strong> owl can be preserved to <strong>the</strong> benefit of all. As a result, <strong>the</strong> <strong>Recovery</strong> Teamdeveloped a number of principles dealing with equity and distributional issues.It may be possible to reduce <strong>the</strong> social costs of achieving owl recovery byslowing <strong>the</strong> rate of decline in timber harvests near <strong>the</strong> most isolated, timberdependent communities. The job losses that result from restricting timberharvests cause more severe wage losses and o<strong>the</strong>r social costs in isolated,timber dependent communities. If ways can be found to lessen <strong>the</strong> reductionin timber harvests near such communities, especially in <strong>the</strong> near term, <strong>the</strong>social costs of owl recovery may be lower. It also may be more equitable tocompensate individuals who bear <strong>the</strong> cost of owl conservation measures byshifting more of <strong>the</strong> cost to <strong>the</strong> general public. Compensation has <strong>the</strong> addedadvantage of reducing <strong>the</strong> social costs by offsetting income losses that oftencause socially damaging behavior without causing similar costs among <strong>the</strong>broader population from which <strong>the</strong> compensation is drawn.G. Dealing with Uncertainty and RiskBoth policy uncertainties and scientific uncertainties affect <strong>the</strong> costs of owlconservation measures. Policy uncertainty increases costs by encouragingharvesting of timber be<strong>for</strong>e it has reached <strong>the</strong> age at which it would yieldgreatest profit. Policy uncertainty also is likely to dampen investments inincreased <strong>for</strong>estland productivity. Scientific uncertainty about owl ecologyand <strong>the</strong> effects of various <strong>for</strong>est management practices increases costs byrequiring habitat protection measures in <strong>the</strong> short term that may be morerestrictive than are needed in light of subsequent research. However, pastexperience shows that it also can be costly when research shows that greaterprotection is needed because past <strong>for</strong>est management practices did not provideadequately <strong>for</strong> <strong>the</strong> owl.540
Investments that would improve <strong>the</strong> timber productivity of <strong>for</strong>estlands arediscouraged by <strong>the</strong> uncertainty regarding whe<strong>the</strong>r <strong>the</strong> additional timber supplythat results will be available <strong>for</strong> harvest or whe<strong>the</strong>r it will be unavailable owingto future owl conservation measures. Thus one aspect of providing incentivesto increase timber growth, especially on private lands, is to reduce this uncertainty.Policies that make clear what <strong>for</strong>estland can be harvested and whenwill reduce <strong>the</strong> uncertainty that impedes investment.Various <strong>for</strong>est management practices have <strong>the</strong> potential to increase <strong>the</strong> productivityof owl habitat or to allow some timber harvest within owl habitat withless damage to its value as habitat. Uncertainty about <strong>the</strong> effects of suchpractices prevents <strong>the</strong>ir use and increases <strong>the</strong> costs of owl conservation.III. Relationship Between <strong>Spotted</strong> <strong>Owl</strong> Habitatand <strong>the</strong> Timber Resource BaseThe high costs of protecting nor<strong>the</strong>rn spotted owl habitat result from <strong>the</strong> factthat its range largely coincides with <strong>the</strong> most valuable timber resources on <strong>the</strong><strong>for</strong>estlands of <strong>the</strong> Pacific Northwest. <strong>Spotted</strong> owls appear to concentrate <strong>the</strong>iractivities in old-growth stands or in mixed-age stands with both old-growthand mature trees. Recent owl surveys have located owls in a wide variety ofhabitat conditions. However, until research has shown that owl populationscan thrive in areas that do not have classic old-growth characteristics, oldgrowthstands will be needed as <strong>the</strong> primary source of <strong>the</strong> owl habitat neededto assure its survival and recovery.Nor<strong>the</strong>rn spotted owls not only prefer old-growth and mature <strong>for</strong>estland, but<strong>the</strong>y use a great deal of it. Studies of <strong>the</strong> home ranges of owl pairs in variousprovinces showed that owls use areas as small as about 1,000 acres and aslarge as 27,000 acres. Median home ranges of 3,000 to 9,000 acres weretypical. A fur<strong>the</strong>r factor that accounts <strong>for</strong> <strong>the</strong> large amount of habitat neededto support owl populations is <strong>the</strong> need <strong>for</strong> numbers of owl pairs and individualowls to occupy a contiguous habitat area within which <strong>the</strong>y can interact. Thelong-tenn survival of a species depends not just upon <strong>the</strong> survival of individualsbut also upon successful mating, raising of young, and dispersal of newadults. For owls, this requires relatively large contiguous areas of habitatwithin which individual owls can interact.The need to preserve large areas of old-growth and mature <strong>for</strong>estland bringsowl conservation into direct conflict with timber harvesting. For decades, oldgrowthtimber has been <strong>the</strong> primary source of logs <strong>for</strong> <strong>the</strong> timber and woodproducts industries of <strong>the</strong> Pacific Northwest. Stands of large trees provide alarger volume of high quality wood at lower cost than do younger stands.Un<strong>for</strong>tunately, many of <strong>the</strong> <strong>for</strong>est management practices that have been usedto increase <strong>the</strong> returns from timber harvesting and growing have been detrimentalto owl habitat. Not only does <strong>the</strong> practice of clear-cutting remove oldgrowthtrees from <strong>the</strong> land, but <strong>the</strong> regenerated <strong>for</strong>ests grown on cleared landare often even-aged, single-species stands with little habitat value <strong>for</strong> owls.The patchwork of regenerated clear-cuts distributed across <strong>the</strong> landscape afterdecades of timber harvesting breaks up <strong>the</strong> continuity of <strong>the</strong> habitat available<strong>for</strong> owls. Although owls are often found in young or mature stands, <strong>the</strong>irsuccess in mating and raising young appears to be reduced by habitat fragmentation.Fur<strong>the</strong>rmore, <strong>the</strong> harvest of old-growth allows cleared land to beused to grow new trees. Younger trees grow more rapidly than old trees. From<strong>the</strong> standpoint of long-term timber supply, <strong>the</strong> more rapid growth in youngerstands helps to support higher levels of sustainable timber harvest.541
The sustainable yield concept that underlies most modem <strong>for</strong>est managementrelies in part on <strong>the</strong> fact that regenerated <strong>for</strong>ests grow more rapidly than <strong>the</strong>old-growth <strong>the</strong>y replace. Simply stated, sustainable yield harvesting of timberlimits <strong>the</strong> removal of timber to <strong>the</strong> rate at which timber can be regrown within<strong>the</strong> management area. The growth in regenerated <strong>for</strong>ests is considered insetting <strong>the</strong> rate of cutting of old-growth.There has been considerable debate about whe<strong>the</strong>r <strong>the</strong> past level of federaltimber harvest in <strong>the</strong> Pacific Northwest is, in fact, sustainable. This is acomplex issue and its resolution is beyond <strong>the</strong> scope of <strong>the</strong> <strong>Recovery</strong> Team'sresponsibility. The level of future timber harvest that would occur if <strong>the</strong>re wereno owl conservation is <strong>the</strong> baseline <strong>for</strong> <strong>the</strong> analysis of <strong>the</strong> economic effects of<strong>the</strong> recovery plan. If harvest levels in coming decades turn out to be lowerthan <strong>the</strong>y were during <strong>the</strong> 1980s or are lower than indicated by current <strong>for</strong>estplans, <strong>the</strong>n timber industry employment and timber revenues also will belower, even without owl conservation. The economic losses resulting from alower baseline harvest should not be attributed to owl conservation measures.However, it is important to recognize that economic losses resulting from o<strong>the</strong>rdeclines in timber harvesting will be exacerbated by <strong>the</strong> costs of protecting owlhabitat. Removal of <strong>for</strong>estlands from <strong>the</strong> timber base to protect owl habitatmay have spillover effects on <strong>the</strong> rate of timber sales in federal <strong>for</strong>ests. Fur<strong>the</strong>rmore,timber dependent communities may be less able to adapt to <strong>the</strong>effects of owl conservation because of <strong>the</strong> effects of o<strong>the</strong>r declines in timberharvest. For <strong>the</strong> purposes of this analysis, however, <strong>the</strong> costs attributable to<strong>the</strong> need to protect owl habitat were treated as independent from costs associatedwith reductions in <strong>the</strong> baseline harvest level.The problem posed by <strong>the</strong> owl's need <strong>for</strong> extensive areas of commerciallyvaluable old-growth and mature <strong>for</strong>est is evident in a few statistics. Although<strong>the</strong> variety of definitions of old-growth makes assessment of trends somewhatconfusing, it is clear that <strong>the</strong> trend has been sharply downward. For example,Booth estimated <strong>the</strong> amount of prelogging old-growth 200 years or older. Priorto <strong>the</strong> start of logging, an estimated 19.8 million acres of old-growth werepresent in western portions of Oregon and Washington (Booth 1991). By <strong>the</strong>early 1980s, more that 80 percent of this original old-growth had disappeared,with federal lands containing most of <strong>the</strong> residual old-growth (Booth 1991).Haynes (1986) estimated that about 3.5 million acres of old-growth <strong>for</strong>ests (200years or older) remained on nonwilderness lands. Ano<strong>the</strong>r source, <strong>the</strong> ISCreport, cited an estimate that 17.5 million acres of suitable habitat wereavailable <strong>for</strong> owls in 1800 (Thomas et al. 1990). By <strong>the</strong> 1990s, only about 7.1million acres were available. The Forest Service recently produced estimates ofold-growth by ga<strong>the</strong>ring in<strong>for</strong>mation from a wide range of <strong>for</strong>estland owners.Reports from various owners use different definitions of old-growth. Thissurvey estimates that <strong>the</strong>re currently are 10.4 million acres of old-growth, ofwhich 8.8 million acres are on federal land, including wilderness areas andnational parks.In <strong>the</strong> 1980s, old-growth harvest on federal lands proceeded at about 3 to 4billion board feet per year, mostly by clear-cutting. Although inventories ofspotted owl habitat are not available to measure its decline during this period,habitat would have continued to decline steeply because of this rate of harvest.On <strong>the</strong> economic side of <strong>the</strong> balance, old-growth harvests from federal landswere worth more than $1 billion per year, providing substantial revenue thatwas shared between <strong>the</strong> U.S. Treasury and <strong>the</strong> state and county governments.Direct employment in <strong>the</strong> timber and wood products industries that depend on<strong>the</strong> supply of logs from old-growth harvests of federal lands has provided jobsto about 30,000 people.542
In general, <strong>the</strong> harvest of timber in <strong>the</strong> Pacific Northwest has occurred earlierand more rapidly on private <strong>for</strong>estlands than on public <strong>for</strong>estlands. Significantharvesting of timber in <strong>the</strong> national <strong>for</strong>ests did not begin until after World WarII. Several consequences of this pattern affect <strong>the</strong> preservation of owl habitatand its economic effects. First, because most of <strong>the</strong> private old-growth <strong>for</strong>estlandhas been harvested, most of <strong>the</strong> remaining <strong>for</strong>estland that provides <strong>the</strong>best owl habitat is on federal <strong>for</strong>ests. Second, it was expected that <strong>the</strong> totaltimber harvest in <strong>the</strong> Northwest in <strong>the</strong> next few decades (while <strong>the</strong> regrowth onprivate lands matured) would be sustained by harvest from federal <strong>for</strong>ests.Sustained yield or nondeclining flow concepts being used in setting <strong>the</strong> rate oftimber sales from federal <strong>for</strong>ests were applied to <strong>the</strong> substantial areas of oldgrowthtimber in <strong>the</strong>se <strong>for</strong>ests. The removal of a substantial portion of thistimber inventory from <strong>the</strong> timber resource base will reduce <strong>the</strong> federal harvestlevel during a period when private <strong>for</strong>ests are not capable of sustaining asignificant increase in harvest.IV. Economic and Social Cost In<strong>for</strong>mationConsidered in <strong>the</strong> Formation of <strong>the</strong><strong>Recovery</strong> <strong>Plan</strong>In addition to <strong>the</strong> economic principles discussed earlier, <strong>the</strong> <strong>Recovery</strong> Teamconsidered several types of economic in<strong>for</strong>mation. These included:* The estimated costs of previous owl conservation proposals,* Indicators of <strong>the</strong> dependency and sensitivity of local economies to timberharvest,* Indicators of <strong>the</strong> effects of various elements of <strong>the</strong> recovery plan and o<strong>the</strong>r owlconservation proposals on timber harvest, revenues, and employment,* Estimates of <strong>the</strong> costs and returns of various silvicultural practices.The first two categories of in<strong>for</strong>mation were used to provide a context thatwould facilitate <strong>the</strong> design of lower cost options <strong>for</strong> consideration. The thirdwas used in <strong>the</strong> assessment of <strong>the</strong> various management actions <strong>the</strong> <strong>Recovery</strong>Team considered <strong>for</strong> inclusion in <strong>the</strong> recovery plan. Most of <strong>the</strong> evaluationcriteria were intended to help <strong>the</strong> <strong>Recovery</strong> Team evaluate <strong>the</strong> likely contributionof various options toward recovery. Harvest and employment effects wereincluded to show whe<strong>the</strong>r various options were substantially different in <strong>the</strong>ircosts. The <strong>Recovery</strong> Team also reviewed estimates of <strong>the</strong> costs and revenuesfrom silvicultural practices that might be used to promote development of owlhabitat.The <strong>Recovery</strong> Team also considered in<strong>for</strong>mation on <strong>the</strong> social costs of implementingowl conservation measures from several sociological studies.When <strong>the</strong> <strong>Recovery</strong> Team completed <strong>for</strong>mulation of <strong>the</strong> draft recovery plan, itprepared preliminary estimates of <strong>the</strong> economic costs of its implementation.These are described in section IV. Section IV also provides a discussion of <strong>the</strong>concepts and analytical methods used to estimate <strong>the</strong> indicators of employmentand revenue effects.543
A. Previously Estimated Economic Costs of <strong>Owl</strong>Conservation ProposalsThe <strong>Recovery</strong> Team reviewed six major studies of <strong>the</strong> economic effects of owlconservation. This was done to gain a better understanding of <strong>the</strong> factors thatcontribute to <strong>the</strong> high cost of protecting <strong>the</strong> owl and to identify analytic methods,assumptions, and data that could be used in producing economic in<strong>for</strong>mationabout <strong>the</strong> recovery plan. These studies are summarized briefly.1. The Economic Consequences of Preserving Old-Growth Timber<strong>for</strong> <strong>Spotted</strong><strong>Owl</strong>s in Oregon and Washington. Walter J. Mead et al., University of Cali<strong>for</strong>nia,Santa Barbara. October 1990.This study provided a comprehensive analysis of <strong>the</strong> economic effects ofpreserving <strong>the</strong> remaining old-growth <strong>for</strong>ests of Oregon and Washington toprovide habitat <strong>for</strong> <strong>the</strong> owl. In addition to <strong>the</strong> nearly 2 million acres of oldgrowthalready set aside in preserves, such as national parks and wildernessareas, <strong>the</strong> proposal would protect from harvesting all o<strong>the</strong>r old-growth, estimatedhere to be more than 4 million acres. A harvest reduction of 2,257million board feet on federal lands is estimated to be partially offset in earlyyears by increased harvest from younger <strong>for</strong>ests on private lands.The estimated net cost of this proposal during <strong>the</strong> next 50 years is $24.5 billion(discounted to present value at 4 percent). Direct job losses are estimated tobe as high as 18,000 jobs.The Mead study provided estimates of <strong>the</strong> following economic effects:* The value of <strong>for</strong>egone old-growth timber harvest,* The value of <strong>for</strong>egone second-growth timber harvest that would have beengrown on lands from which old-growth is cut,* The loss in <strong>the</strong> value of capital equipment, primarily saw mills,* The loss in <strong>the</strong> value of labor due to unemployment and reemployment atlower wages,* The increased value of recreation in old-growth <strong>for</strong>ests.2. Social and Economic Impacts of <strong>Spotted</strong> <strong>Owl</strong> Conservation Strategy. John H.Beuter et al., <strong>for</strong> <strong>the</strong> American Forest Resource Alliance, 1990.The Beuter study examined <strong>the</strong> economic, social, and cultural effects of <strong>the</strong>conservation strategy <strong>for</strong> <strong>the</strong> nor<strong>the</strong>rn spotted owl prepared by <strong>the</strong> InteragencyScientific Committee (ISC) (Thomas et al. 1990). The ISC strategy established anetwork of habitat conservation areas (HCAs) encompassing about 5 millionacres of <strong>for</strong>estland managed by <strong>the</strong> Forest Service and <strong>the</strong> BLM. Significantportions of <strong>the</strong> HCAs are not currently old-growth, but under <strong>the</strong> prohibitionon timber harvest in HCAs, <strong>the</strong>se portions would become owl habitat in futuredecades. Significant amounts of old-growth <strong>for</strong>ests were not included in <strong>the</strong>HCAs, but were to be partly protected under a rule requiring 50 percent ofeach quarter-township of federal <strong>for</strong>est outside <strong>the</strong> HCAs to be left with treesaveraging at least 11 inches in diameter and providing 40 percent canopyclosure (<strong>the</strong> 50-11-40 rule).The estimated annual timber harvest on federal lands in <strong>the</strong> Pacific Northwestduring <strong>the</strong> 1991-2000 period would be reduced by 1.6 billion board feet.Oregon and Washington federal lands would experience an estimated reductionof 1.4 billion board feet per year.The Beuter study estimates that <strong>the</strong> implementation of <strong>the</strong> ISC strategy onpublic land would cause direct job losses of 17,133 and total job losses of544
40,321. Income losses are estimated to be $1.0 billion. In making <strong>the</strong>seestimates, adjustments were made <strong>for</strong> job and income losses caused by o<strong>the</strong>rreductions in timber harvest plans and technological change.The Beuter study provided estimates of <strong>the</strong> following economic effects:* Changes in employment,* Changes in income and gross state product,* Tax effects,* Effects on revenues to local governments from federal timber sales,* Social and cultural effects on timber dependent communities.3. Economic Effects of Implementing a Conservation Strategy<strong>for</strong> <strong>the</strong> Nor<strong>the</strong>rn<strong>Spotted</strong> OwL Tom Hamilton et al., Forest Service and BLM, May 1990.This study was per<strong>for</strong>med by <strong>the</strong> Forest Service and <strong>the</strong> BLM to asses <strong>the</strong>effects of implementing <strong>the</strong> ISC strategy. It estimated that federal timber saleswould be reduced from <strong>the</strong> planned 1995 level of 4.4 billion board feet to 2.6billion board feet, a reduction of 2.4 billion board feet. The reduction in totalemployment resulting from <strong>the</strong>se restrictions was estimated to be 25,409 jobs.The value of <strong>the</strong> <strong>for</strong>egone timber harvest was estimated to be $392 million in1995. An analysis of <strong>the</strong> potential market response estimated that timberprices would be about 30 percent higher in 1995 if <strong>the</strong> ISC strategy wereimplemented and <strong>the</strong> <strong>the</strong> private timber harvest would be 1.1 billion board feetgreater. The higher prices and private harvest would partially offset <strong>the</strong>revenue and employment effects of <strong>the</strong> <strong>for</strong>egone federal timber sales, but couldnot be sustained because of inadequate private timber inventories.4. Three-State Impact of <strong>Spotted</strong> <strong>Owl</strong> Conservation and O<strong>the</strong>r Timber HarvestReductions. Bruce R. Lippke et al., Center <strong>for</strong> International Trade in ForestProducts, University of Washington, September 1990.The Lippke study also estimated <strong>the</strong> impacts of implementing <strong>the</strong> ISC strategy.It estimated that federal timber harvests would be reduced by 1.7 billion boardfeet per year and that state and private harvests could be reduced by 1.0billion board feet. The Lippke study estimated that <strong>the</strong> implementation of <strong>the</strong>ISC strategy on public land would cause direct job losses of 22,919 and totaljob losses of 48,130. Income losses are estimated to be $530 million per year if<strong>the</strong>re is no reemployment. In making <strong>the</strong>se estimates, adjustments were made<strong>for</strong> job and income losses caused by o<strong>the</strong>r reductions in timber harvest plans.The Lippke study provided estimates of <strong>the</strong> following economic effects:* Changes in employment,* Changes in income,* Tax effects,* Effects on federal revenues from timber sales,* Effects on revenues to local governments from federal timber sales,* Capital asset losses suffered by mill owners and homeowners,* Gains to o<strong>the</strong>r U.S. and <strong>for</strong>eign timber producers and,* Social impacts in timber dependent communities.5. Conservation <strong>Plan</strong>s<strong>for</strong> <strong>the</strong> Nor<strong>the</strong>rn <strong>Spotted</strong> <strong>Owl</strong> and O<strong>the</strong>r Forest ManagementProposals in Oregon: Economic Implications of Changing Timber Availability.Brian J. Greber et al., Oregon State University, July 1990.This study estimated <strong>the</strong> effects of <strong>the</strong> ISC strategy on timber harvests, employment,wage and salary losses, and local government funding in Oregon. Itestimated that <strong>the</strong> ISC strategy would reduce federal and state timber harvestsin Oregon by 1.154 billion board feet per year in <strong>the</strong> 1990s, displacing 16,000workers by 1995 and causing wage and salary losses of $682 million per year.545
County receipts were estimated to decline by about $14 million or about 3.8percent. These estimates reflect <strong>the</strong> assumption that <strong>the</strong>re would be nochange in private timber harvests.The study also estimated <strong>the</strong> effects of private industry conservation ef<strong>for</strong>tssimilar to <strong>the</strong> ISC policies and of private harvest increase in response to <strong>the</strong>higher timber prices that would result from federal conservation ef<strong>for</strong>ts.Private conservation was estimated to increase total job displacement to42,100 jobs and income losses to $1.8 billion per year. An increase in privatetimber harvest, while not sustainable over <strong>the</strong> long run, would reduce jobdisplacement in <strong>the</strong> 1990s to 4,700 jobs and <strong>the</strong> income losses to $199 millionper year. These effects would be higher, however, in <strong>the</strong> next decade whenprivate harvest would be lower than <strong>the</strong> sustainable level.6. Economic Analysis of Critical Habitat Designation Effects<strong>for</strong> <strong>the</strong> Nor<strong>the</strong>m<strong>Spotted</strong> OwL USDI January 1992.The FWS prepared this analysis to accompany its January 1992 rulemaking todesignate critical habitat <strong>for</strong> <strong>the</strong> nor<strong>the</strong>rn spotted owl. It used estimatesprovided by <strong>the</strong> Forest Service and <strong>the</strong> BLM on <strong>the</strong> effects on federal timberharvest attributed to various ef<strong>for</strong>ts to protect owl habitat. This study providedestimates of timber harvest <strong>for</strong> <strong>the</strong> Forest Service and BLM <strong>for</strong>estlands accordingto <strong>the</strong> agencies' latest plans, under announced policies <strong>for</strong> implementationof <strong>the</strong> ISC strategy, and under <strong>the</strong> FWS determinations of whe<strong>the</strong>r timber saleswould jeopardize <strong>the</strong> continued existence of <strong>the</strong> owl or adversely modify <strong>the</strong>designated critical habitat. The critical habitat includes most of <strong>the</strong> acreage in<strong>the</strong> ISC's HCAs plus about 1.7 million acres of federal <strong>for</strong>estland that was notincluded in HCAs.The FWS study estimated that Forest Service and BLM implementation of <strong>the</strong>ISC strategy would reduce federal timber harvests in 1995 by 1.7 billion boardfeet per year. It estimated that <strong>the</strong> Forest Service and BLM implementation of<strong>the</strong> ISC strategy would cause total job losses of 27,705. The fur<strong>the</strong>r protectionsprovided by <strong>the</strong> FWS under <strong>the</strong> Endangered Species Act would reducetimber harvests by an additional 236 million board feet and total employmentby an additional 3,311 jobs. The imposition of <strong>the</strong> prohibition on adversemodification of <strong>the</strong> critical habitat is estimated to cause additional reductionsof 102 million board feet in <strong>the</strong> 1995 timber harvest and an additional loss of1,420 jobs. The wage losses due to critical habitat designation were estimatedto be $65 million in present value (discounted at 10 percent).The FWS study also provided estimates of <strong>the</strong> following economic effects:* Federal revenue from timber sales and <strong>the</strong> net loss to <strong>the</strong> U.S. Treasury,* Changes in employment by county,* Effects on revenues to counties from federal timber sales.Although <strong>the</strong>se studies analyzed somewhat different proposals using differentmethods and assumptions, <strong>the</strong>y produced comparable estimates. Table H. 1summarizes selected estimates from <strong>the</strong> studies to facilitate comparison. It isclear that <strong>the</strong> costs of owl habitat protection are substantial at <strong>the</strong> nationaland regional levels. Nationally, <strong>the</strong> value of <strong>for</strong>egone timber harvest is <strong>the</strong> mostsignificant cost. This cost is borne primarily by federal taxpayers. The countiesthat share federal timber receipts also are hurt by <strong>the</strong> loss of timberrevenues. Employment and wage losses and asset losses also hit timberdependent communities hard.546
ITable H.1. Summary of previous studies of economic effects of nor<strong>the</strong>rn spotted own conservation.Mead Beuter Lippke Hamilton FWSISCESAReductions in federal timber harvest 2,2571 1,8002 1,7002 2,400 1,6823 3383(millions of board feet)Job lossDirect 7,225 17,133 22,919Total 18,000 40,321 48,130 25,409 27,705 4,731Wage losses 1,0494 1,0495 4,6006 657(millions of dollars)Timber value losses (net) 23,3714 5005(millions of dollars)1 1n Washington and Oregon only, estimate <strong>for</strong> <strong>the</strong> first year reflects offset by increased pnvate harvest.2 0n public lands in all three states.3 FS and BLM lands in three states.4 Total present value over 50 years, discounted at 4 percent.5 Annually.6'Total present value.7 Present value discounted at 10 percent. Estimated only <strong>for</strong> <strong>the</strong> 1,690,000 acres of federal <strong>for</strong>estland that <strong>the</strong> critical habitat designation adds to <strong>the</strong> ISC's habitat conservation areas.Sources: Mead et al. 1990, Beuter et al. 1990, Lippke et al. 1990, Hamilton et al. 1990, USDI 1992.FWS = U.S. Fish and Wildlife ServiceISC = Interagency Scientific CommitteeESA = Endandered Species ActFS = U.S. Forest ServiceBLM = U.S. Bureau of Land Managementk /,,.......... .............. ...... ... I - 1.11-...... 1. 111 .............. 1. ...- ........ -- -. 1. I 1.1- 1Vn c-PI4
B. Potential Social Costs of <strong>Owl</strong> Conservation MeasuresThere is substantial literature on <strong>the</strong> social effects of economic changes inrural communities. Research on timber dependent communities has beenused in several studies to assess <strong>the</strong> social effects of <strong>the</strong> timber harvest reductionsthat might result from owl conservation measures. This literature wasreviewed and discussed by <strong>the</strong> <strong>Recovery</strong> Team. Existing sociologic studies donot provide a basis <strong>for</strong> quantitative estimates of <strong>the</strong> social effects that wouldresult from implementation of <strong>the</strong> recovery plan or o<strong>the</strong>r owl conservationplans. Such studies do, however, allow an assessment that is useful in judging<strong>the</strong> types of social effects that are likely and in planning programs to mitigatesuch effects.It appears likely that success of <strong>the</strong> recovery plan in <strong>the</strong> long run may dependsubstantially on how its social effects are handled. The support and cooperationof local communities has proven to be important in <strong>the</strong> success of manywildlife preservation programs. Experience with o<strong>the</strong>r large-scale wildlifeconservation programs has shown that it is difficult to sustain a healthy anddiverse ecosystem unless <strong>the</strong> human communities that depend on it are alsohealthy. It appears likely that, if people in timber dependent communities areto support ef<strong>for</strong>ts to protect <strong>the</strong> owl, substantial ef<strong>for</strong>ts will be needed to reduce<strong>the</strong> social costs <strong>the</strong>y bear.The work of Robert G. Lee of <strong>the</strong> University of Washington provides a goodsyn<strong>the</strong>sis of studies of <strong>the</strong> social effects of owl conservation programs (Lee1990 and 1991 a). Louise Fortmann of <strong>the</strong> University of Cali<strong>for</strong>nia, Berkeley,has studied similar effects in Cali<strong>for</strong>nia (Fortmann et al. 1990). This worksupports <strong>the</strong> use of employment and revenue estimates as indicators of economicand social effects. More importantly, it suggests that o<strong>the</strong>r factors mayhave an equally important bearing on <strong>the</strong> way people in timber dependentcommunities respond to <strong>the</strong> resulting changes in <strong>the</strong>ir lives.Lee identified four factors that are likely to exacerbate <strong>the</strong> social effects of owlconservation: 1) an apparent shift from decentralized, participatory <strong>for</strong>estlandmanagement that is oriented toward community stability to centralized commandand control regulation to protect owl habitat; 2) <strong>the</strong> perception that <strong>the</strong>federal government has reneged on its commitment to maintain a nondecliningeven flow of timber from federal <strong>for</strong>ests, a commitment on which many peoplebased a lifelong commitment of <strong>the</strong>ir own resources; 3) a social structure thatis less likely to adapt to permanently decreased employment and loss ofpersonal and business assets in timber dependent communities than isassumed: 4) <strong>the</strong> potential emergence of conflict among different groups ofpeople in which timber workers are stereotyped and stigmatized.Lee's work suggests that <strong>the</strong>se factors may create a situation that inhibits <strong>the</strong>adaptiveness of people in timber dependent communities and increases <strong>the</strong>undesirable social effects of reductions in federal timber harvest.Research in timber dependent communities suggests that <strong>the</strong> shift fromdecentralized <strong>for</strong>est management to centralized species preservation policycauses increased opposition to owl conservation measures. As a result,implementation of owl conservation plans is likely to require greater use ofen<strong>for</strong>cement measures and greater short-term exploitation of <strong>the</strong> <strong>for</strong>ests mayoccur. Accelerated liquidation of private timberlands may offset economiclosses <strong>for</strong> some in <strong>the</strong> short run, but also may have undesirable ecologicaleffects and exacerbate <strong>the</strong> decline in timber harvests in coming decades.The removal of <strong>for</strong>estland from <strong>the</strong> timber base to protect owl habitat will causea permanent decrease in timber harvest levels. This is perceived by people in548
timber dependent communities as a betrayal. Many people in <strong>the</strong>se communitieshave committed <strong>the</strong>ir personal energies and financial resources in responseto <strong>the</strong> government's assurance of a nondeclining flow of timber fromfederal <strong>for</strong>ests. Many regarded this policy as a promise on <strong>the</strong> part of <strong>the</strong>government. The federal timber harvest was expected to play a particularlyimportant role in <strong>the</strong> next decade or two because of <strong>the</strong> inadequacy of <strong>the</strong>timber inventory on private lands to sustain harvest levels during that period.People in <strong>the</strong>se communities have developed ways of adapting to <strong>the</strong> cyclicalunemployment that results from changes in <strong>the</strong> demand <strong>for</strong> timber that havebeen induced by national economic cycles. These adaptations depend in parton <strong>the</strong> assurance that <strong>the</strong> timber supply would be adequate to support recoveryas soon as <strong>the</strong> demand <strong>for</strong> timber rebounded. As Lee reported, <strong>the</strong>seadaptations are not well suited <strong>for</strong> coping with permanent reductions in timberharvest levels, <strong>the</strong> resulting permanent reductions in timber industry employmentand <strong>the</strong> resulting effects on peoples' income.Sociological research in timber-dependent communities has shown that peopledeveloped shared values and behavior patterns that allowed <strong>the</strong>m to cope withcyclical changes in timber demand. People share a commitment to hard work,individualism, and self-reliance. While <strong>the</strong>se values often are regarded as <strong>the</strong>bedrock of American culture, <strong>the</strong>y may inhibit <strong>the</strong> development of cohesivenessand adaptability needed to make <strong>the</strong> changes in careers and economic structureto respond to a permanent decline in timber harvests.As Lee reported, loggers have relied on <strong>the</strong>ir reputation as skilled woodsworkers and <strong>the</strong>ir mobility to find work. A logger has been able to improve hiseconomic security. by developing a reputation as a "good worker." Loggersappear to have developed a sense of occupational community, a commitment tologging as a way of life that may inhibit adaptation to permanent reduction intimber employment through career change. Many mill workers are less mobilethan loggers and tend to be dependent on a single mill. Small business ownershave committed <strong>the</strong>ir life's savings to investment in <strong>the</strong>ir enterprises, knowingthat <strong>the</strong>y would have some hard times during down-cycles, but expecting that,over <strong>the</strong> long run, <strong>the</strong> timber supply would provide support <strong>for</strong> <strong>the</strong>ir businesses.The controversy about protection of <strong>the</strong> owl appears to have elements of anemerging conflict between urban populations wanting increased protection ofenvironmental resources and rural populations that have worked in extractiveindustries. According to Lee, people in timber dependent communities fear <strong>the</strong>dominance of <strong>the</strong> urban majority and feel manipulated by <strong>the</strong> apparent expectationthat <strong>the</strong>y will adapt to <strong>the</strong> change in <strong>the</strong> timber supply. Moreover, thisconflict is exacerbated by <strong>the</strong> attempt to exclude wood products workers from<strong>the</strong> larger community of people regarded as deserving sympathy and fairtreatment (Lee 1991 c).Sociologic research indicates that <strong>the</strong> social costs in timber dependent communitiesmay be heightened by <strong>the</strong> stereotyping and stigmatizing methods thatsome groups advocating preservation of owl habitat have employed, particularlyagainst loggers. From <strong>the</strong>ir studies of behavior in o<strong>the</strong>r communities,sociologists know that <strong>the</strong> resulting dehumanization can make victimizationmore likely and can cause maladaptive behavior among victims. The combinationof economic stress and stigmatization can lead to increased loss of selfesteem,depression and passivity, drug and alcohol abuse, violence and familydysfunction. Sociologists regard such situations as life-threatening traumasthat can cause maladaptive behavior patterns that can be transmitted throughfamilies <strong>for</strong> generations.549
The contrast between <strong>the</strong> behavior described by sociologists and <strong>the</strong> behaviordescribed by economists is worth noting. Economic models are based on <strong>the</strong>assumption that economic behavior is "rational." It is assumed, <strong>for</strong> example,that people are able to figure out and take <strong>the</strong> actions that would best improve<strong>the</strong>ir situations. Displaced workers, in this model, seek new training or moveto new locations with better employment opportunities. Sociologic models, incontrast, recognize that people respond to some traumatic experiences in waysthat prevent such economic adaptation. The resulting individual and communitybehavior patterns may inhibit people's recovery from traumatic changesin <strong>the</strong>ir situation.Lee and o<strong>the</strong>r sociologists suggested that programs to protect <strong>the</strong> owl beaccompanied by ef<strong>for</strong>ts to draw on <strong>the</strong> strengths of <strong>the</strong> people in timber dependentcommunities. Lee recommended, <strong>for</strong> example, that <strong>the</strong>ir entrepreneuriallifestyle and inventiveness be used to develop and implement silviculturalmethods that would promote <strong>the</strong> growth of owl habitat and increase <strong>the</strong> valueof timber that can be harvested.Lee's work also points out <strong>the</strong> difficulties imposed on state and local governmentsby <strong>the</strong> combined effects of <strong>the</strong> unemployment and social effects resultingfrom owl habitat conservation and <strong>the</strong> decline in revenues received bycounties from federal timber sales (Lee 199 lb, and Bray and Lee 1991). Justas <strong>the</strong> demand <strong>for</strong> social services increases, <strong>the</strong> financial resources available tolocal governments will decrease because of <strong>the</strong> decline in federal timber receiptsin which <strong>the</strong>y share. Counties with a high dependency on federal timberand an above average proportion of protected owl habitat will suffer disproportionately.Studies of this problem concluded that severely affected counties could havedifficulty maintaining essential services and meeting <strong>the</strong> additional needscaused by economic dislocation. Many counties, particularly in Oregon, havereceived more than 50 percent of <strong>the</strong>ir revenues from federal timber receipts(Bray and Lee 1991). Federal receipts have been allocated primarily to schoolsand roads but support o<strong>the</strong>r programs as well. Reductions in funds fromfederal timber receipts would <strong>for</strong>ce cuts in services that are not mandated bylaw such as preventive health care, social services such as counseling andyouth programs, parks and libraries. The reduction in such services is expectedto heighten <strong>the</strong> social costs in communities hit by permanent reductionsin employment opportunities and o<strong>the</strong>r effects of owl conservationpolicies.C. Indicators of <strong>the</strong> Timber Dependency of LocalEconomiesOne of <strong>the</strong> opportunities to reduce <strong>the</strong> economic and social costs of achievingrecovery <strong>for</strong> <strong>the</strong> owl is to reduce <strong>the</strong> amount of habitat preservation in areaswhere it causes <strong>the</strong> highest cost. It is useful to identify those communitieswhere people's incomes are most directly tied to timber harvests that might beaffected by owl conservation. A closely related factor is <strong>the</strong> extent to whichpeople will be able to find employment in o<strong>the</strong>r sectors because of <strong>the</strong> proximityto more diverse urban economies or local opportunities <strong>for</strong> economicdiversification. Several of <strong>the</strong> studies reviewed by <strong>the</strong> <strong>Recovery</strong> Team includedef<strong>for</strong>ts to measure timber dependency. Instead of developing new indicators,<strong>the</strong> <strong>Recovery</strong> Team drew upon <strong>the</strong>se ef<strong>for</strong>ts. They are summarized here.The Beuter study included a substantial ef<strong>for</strong>t by Douglas C. Olson to assess<strong>the</strong> timber dependency of various multicounty regions in <strong>the</strong> three-state area.550
Table H.2, taken from <strong>the</strong> Beuter study, summarizes <strong>the</strong> results of that ef<strong>for</strong>t,and shows that <strong>the</strong> highest dependency on timber occurs in southwest Washingtonand Southwest Oregon. West-central Oregon, <strong>the</strong> Olympic Peninsula,and western Oregon fall into a second tier of high dependency.The FWS study developed job response coefficients <strong>for</strong> <strong>the</strong> 55 counties affectedby owl conservation ef<strong>for</strong>ts. These coefficients reflect <strong>the</strong> flow of logs fromharvest sites to mills and <strong>the</strong> direct and total employment that results in eachcounty per million board feet of timber harvest. Table H.3 shows <strong>the</strong> jobresponse coefficients <strong>for</strong> <strong>the</strong> 55 counties from <strong>the</strong> FWS study.The FWS analysis also examined a variety of o<strong>the</strong>r economic indicators at <strong>the</strong>county level including unemployment, per capita income, percent of employmentin <strong>the</strong> timber and wood products industries, <strong>the</strong> percent of federallyowned land and dependence on federal timber harvest, and <strong>the</strong> effect of reductionsin timber harvest on county revenues. These statistics are summarizedin Table H.4.Trends in economic development and population growth provide an importantindicator of recent diversification in county economic structure. Counties thathave experienced rapid population and income growth are participating in <strong>the</strong>general diversification of <strong>the</strong> economic structure in <strong>the</strong> Pacific Northwest,primarily through growth in service sectors and light industry. Data onchanges in employment in timber and manufacturing assembled by <strong>the</strong> FWS<strong>for</strong> <strong>the</strong> 55 counties that may be affected by owl conservation also are includedin Table H.4.The FWS considered <strong>the</strong>se factors in designing a process <strong>for</strong> deciding whe<strong>the</strong>rto exclude areas from <strong>the</strong> designation of critical habitat (USDI 1992). It used<strong>the</strong> effects on county budgets and timber based employment to identify 13counties on which to focus exclusion decisions. These counties are:Washington Oregon Cali<strong>for</strong>niaChelan Curry TrinityClallamDouglasLewisHood RiverSkamaniaJacksonJosephineLaneTillamookWascoThe State of Washington has completed an evaluation of <strong>the</strong> potential jobs lostdue to ef<strong>for</strong>ts to conserve <strong>the</strong> nor<strong>the</strong>rn spotted owl. Using ISC recommendationsas a benchmark and recent harvest levels as a base, 8,200 jobs in <strong>the</strong><strong>for</strong>est products industry are considered to be at risk. These are distributed asfollows:Olympic Peninsula 1,161Northwest Washington 1,849Southwest Washington 1,964Central Washington 855Puget Sound 2,234Eastern Washington 136When indirect employment is considered in addition to <strong>the</strong> direct employmentin <strong>the</strong> <strong>for</strong>est products industry, <strong>the</strong> total potential job loss in Washington is20,800. These estimates reflect <strong>the</strong> actual harvest in recent years ra<strong>the</strong>r thantimber sale plans and include indirect employment impacts <strong>for</strong> <strong>the</strong> entire state.551
0U1 n1nDTable H.2. Economic dependency indexes <strong>for</strong> wood products and o<strong>the</strong>r selected industrial sectors, by economic areaand region, 1985.Dependency Indexes: Estimated Percent of Area's Economic Base in Each SectorEconomic Wood Products O<strong>the</strong>r Agriculture, ForestryArea/Region Primary Secondary Manufacturing and Fisheries Services O<strong>the</strong>r TotalWashingtonPuget Sound 7 2 31 16 14 30 100.0Olympic Peninsula 40 5 0 9 19 27 100.0Southwest 55 4 9 13 9 10 100.0Western 13 0 40 7 13 27 100.0Central 10 0 9 72 4 5 100.0OregonNorthwest 23 3 10 44 8 12 100.0West Central 45 6 2 21 13 13 100.0Southwest 52 6 0 23 7 12 100.0Western 40 5 4 22 6 23 100.0Central 28 18 0 18 9 27 100.0Cali<strong>for</strong>niaNorth Coast 15 4 9 24 28 20 100.0North Interior 17 5 0 17 23 38 100.0Sacramento 2 3 6 44 21 24 100.0Nor<strong>the</strong>rn 5 3 3 22 27 40 100.03-State <strong>Owl</strong> Region 20 4 16 14 17 29 100.0Dependency indexes in this table were determined exclusive of <strong>the</strong> government and household sectors. See Table A-2 in Olson (1990) <strong>for</strong> indexes determined with all sectors included. Also, see Table A-1 in Olson(1990) <strong>for</strong> more sector detail regarding indexes in this table.Metropolitan areas are included in <strong>the</strong> economic areas as well as <strong>the</strong> regions in this table.Source: Olson in Beuter et al. 1990.
Table H.3. Job response coefficients <strong>for</strong> affected counties.*Washington Jobs/ Oregon Jobs/ Cali<strong>for</strong>nia Jobs/County mmbf County mmbf County mmbfChelan 11.81 Benton 17.11 Colusa 8.01Clallam 12.46 Clackamas 9.88 Del Norte 12.51Clark 10.40 Clatsop 10.79 Glenn 8.0Cowlitz 11.58 Columbia 10.79 Humboldt 14.29Grays Harbor 12.46 Coos 14.47 Lake 12.51Jefferson 10.30 Curry 13.92 Mendocino 12.51King 12.00 Deschutes 15.58 Shasta 9.63Kittitas 15.08 Douglas 13.87 Siskiyou 9.63Klickitat 10.40 Hood River 8.51 Tehama 8.36Lewis 10.40 Jackson 13.92 Trinity 10.03Mason 10.72 Jefferson 14.17Okanogan 10.40 Josephine 13.92Pacific 10.30 Klamath 15.74Pierce 10.41 Lane 17.11Skagit 9.63 Lincoln 17.11Skamania 10.40 Linn 17.11Snohomish 10.41 Marion 14.02Thurston 10.72 Multnomah 11.05Wahkiakum 8.07 Polk 14.02Whatcom 9.63 Tillamook 9.46Yakima 15.08 Wasco 8.51Washington 9.88Yamhill 10.79'Includes direct, indirect, and induced jobsmmbf = million board feetSource USDI 1992.553
cḻlTable H.4. Economic characteristics of counties affected by critical habitat designation.Timberand Wood(1990) 1989 1990 Products Percent Employment Changes Percent Percent Percent*Unem- Per population Employ- 1980-1989 Federally Dependence Reductionployment Capita per Square ment Change in Change in Owned Land on Federal in CountyState/County Rate Income Mile (%) Timber Jobs Manufacturing Jobs in County Timber RevenueWashingtonChelanClallamClarkCowlitzDouglasGrays HarborJeffersonKingKittitasKlickitatLewisMasonOkanoganPacificPierceSkagitSkamaniaSnohomishThurstonWahkiakumWhatcomYakima8.07.04.96.97.09.14.83.47.111.47.96.19.98.14.86.716.03.95.08.74.99.7$17,335$14,942$15,379$15,276$15,539$14,772$15,378$22,125$14,035$15,270$13,920$13,072$15,163$14,979$15,546$16,163$14,225$17,832$15,663$15,715$15,457$14,49418323807214331170812925406NA350465222NANA60441.310.34.219.5.0.017.81.31.11.713.411.210.68.0NA1.83.129.12.21.912.23.12.3-34-335-36-88-35-514-610-22-2115NA-10-8-21-4NANA6110201243760122830810121819NA3029-4648NANA35227546134136124293302746NA31467547NANA611939.860.660.35.138.91.624.850.155.96.345.31.646.140.950.152.58.7NA39.0NA18801051301021763NA0410920035OregonBentonClackamasClatsopColumbiaCoosCurryDeschutes3.8 $16,6873.5 $18,1916.4 $16,4847.4 $13,8918.9 $13,6085.8 $13,7995.9 $15,836104140NA583817254.02.44.711.510.210.18.7127-14NA-2-36-4471640NA15-51641543NA07577557.563.932.86.824.587.610.51670042593
Timberand Wood(1990) 1989 1990 Products Percent Employment Changes Percent Percent Percent*Unem- Per population Employ- 1980-1989 Federally Dependence Reductionployment Capita per Square ment Change in Change in Owned Land on Federal in CountyState/County Rate Income Mile (%) Timber Jobs Manufacturing Jobs in County Timber RevenueDouglas 8.4 $13,353 19 19.6 8 9 29 81.6 62Hood River 7.8 $15,438 32 5.7 7 18 63 52.7 18Jackson 6.8 $14,046 53 9.0 18 22 26 76.1 45Jefferson 6.3 $13,880 9 14.8 79 36 25 10.5 3Josephine 8.0 $11,438 38 9.0 -3 20 33 94.2 49Klamath 9.3 $13,540 10 16.0 -14 6 56 51.1 14Lake 9.2 $14,443 1 14.7 NA NA 70 82.1 0Lane 5.9 $15,049 62 8.1 -11 14 47 60.4 30Lincoln 5.9 $14,722 40 2.7 -39 14 29 57.5 30Linn 7.8 $13,059 40 13.7 -18 9 33 41.2 30Marion 5.4 $14,957 193 3.1 47 29 27 81.4 5Multnomah 4.9 $18,308 1,355 1.3 -28 10 26 52.7 1Polk 5.5 $13,582 67 3.8 -37 5 0 70.3 12Tillamook 6.1 $13,360 20 4.8 -62 0 15 32.8 28Wasco 7.8 $16,672 9 4.8 -9 -1 13 67.0 8Washington 3.4 $18,596 430 1.1 29 35 1 18.9 0Yamhill 5.3 $14,585 92 5.5 -6 25 6 58.5 6Cali<strong>for</strong>niaDel Norte 12.6 $12,139 24 6.5 -68 -14 72 13.5 15Glenn 12.5 $16,185 19 0.5 -69 -9 24 75.5 3Humboldt 7.7 $15,546 33 9.9 -18 6 20 1.8 5Lake 9.4 $14,166 NA 0.2 NA NA NA NA 2Mendocino 8.1 $15,856 23 9.3 -4 10 14 14.9 1Napa 4.7 $21,417 NA NA NA NA NA NA NAShasta 8.6 $15,567 39 4.0 1 29 40 41.7 2Siskiyou 11.6 $14,300 7 9.7 -5 -2 62 71.7 8Sonoma 4.4 $20,860 NA NA NA NA NA 5.7 NATehama 10.7 $12,471 17 11.3 7 9 23 24.4 3Trinity 12.2 $12,495 4 NA 4 -8 74 76.0 32NA = data not availableRevenue reductions estimated <strong>for</strong> effects of Forest Service and BLM implementation of <strong>the</strong> ISC strategy, <strong>the</strong> prohibition against federal actions that would jeopardize a threatened species and <strong>the</strong> designation ofcritical habitat.0nUlU1Source: USDI 1992.
An analysis completed by <strong>the</strong> State of Washington identified <strong>the</strong> relativeeconomic risk of 100 communities in areas affected by <strong>the</strong> reductions in federaltimber harvest. Communities were designated as ei<strong>the</strong>r high-risk, at risk, lowriskor uncertain on <strong>the</strong> basis of a number of criteria. The criteria includedabsolute and relative dependency on timber-based employment, dependencyon federal timber supplies that are being reduced, and an assessment of <strong>the</strong>local industry.The following factors were used to designate a community as high-risk:* More than 20 percent of <strong>the</strong> population is employed in <strong>the</strong> wood productsindustry.* Significant portions of <strong>the</strong> local wood products industry are dependenton national <strong>for</strong>est timber where harvest reductions are planned.Table H.5 shows <strong>the</strong> results of this analysis.556
The State of Oregon has per<strong>for</strong>med a similar analysis to identify severelyaffected timber dependent communities that would receive services under <strong>the</strong>Oregon Economic Development Department's (OEDD) Timber ResponseProgram. A community is considered to be severely affected if:* It has had a 4 percent decline in employment in <strong>the</strong> timber industry since1989 compared to <strong>the</strong> total 1990 work<strong>for</strong>ce.* Its annual average unemployment rate exceeds <strong>the</strong> state's annual averagerate by more than 50 percent, or* The OEDD director determines that <strong>the</strong> community has suffered or is likely tosuffer a severe economic decline.The communities shown on Table H.6 are affected by both timber supply andcyclical problems. While <strong>the</strong> spotted owl most directly affects western Oregoncommunities, eastern Oregon communities feel <strong>the</strong> pressure on log supply.Fur<strong>the</strong>r, eastern Oregon communities primarily are affected by timber supplydeclines, particularly ponderosa pine, in <strong>the</strong> new federal <strong>for</strong>est plans. As aresult, eastern Oregon comminities also are shown to be severely affected.Table H.6 lists <strong>the</strong> Oregon communities declared to be severely affected as ofNovember 19, 1991.Table H.6. Severely affected communities and counties in Oregon (updatedNovember 19,1991*).CommunitiesAstoriaBeavercreekBlodgettBrownsvilleCamas ValleyCamp ShermanCascadiaCave JunctionKerbyChemultCheshireChiloquinCrater LakeSprague RiverClatskanieCoquilleCottage GroveSaginawCrabtreeCulp CreekCurtinDays CreekDeadwoodDexterDillardElmiraEstacadaFosterGaribaldiGilchristGlideGold BeachHalfwayHarrisburgHinesJeffersonMarionJohn DayLakesideLakeviewLebanonLoraneLostineLowellFall CreekLyonsMapletonMarcolaMaupinMed<strong>for</strong>dCentral PointWhite CityMerlinMill CityGatesMolallaMonmouthMonumentMyrtle PointNew Pine CreekNorth BendNorth PowderNotiOakridgePhilomathPowell ButteProspectReedsportRiddleRitterSelmaSpraySpringfieldThurstonSu<strong>the</strong>rlinSweet HomeSwisshomeTenmileTidewaterTillerTygh ValleyUkiahUnionVernoniaWaltonWarm SpringsWarrentonWilburWillaminaWilliamsYoncallaCountiesGrantCoosDouglasLakeHarneyKlamathWheelerMorrowUmatillaSource- Oregon Timber Response Program Status Report, November 1991.'Affected by declines in log supplyJI557
V. Preliminary Evaluation of <strong>the</strong> EconomicEffects of Implementing <strong>the</strong> <strong>Spotted</strong> <strong>Owl</strong><strong>Recovery</strong> <strong>Plan</strong>558A. Economic Effects Covered by Preliminaiy EstimatesThe <strong>Recovery</strong> Team drew upon <strong>the</strong> studies summarized in Section IV, particularly<strong>the</strong> FWS analysis, to develop preliminary estimates of <strong>the</strong> economic costsof implementing <strong>the</strong> recovery plan. Estimates of <strong>the</strong> following indicators ofeconomic costs were made:* Reduction in federal timber sale volumes and revenues and <strong>the</strong> resultingeffects on U.S. Treasury and county budgets.* Reduction in employment levels.* Reduction in wage and salary income due to unemployment andreemployment at lower wages.Estimates were not made of o<strong>the</strong>r economic effects such as capital asset losses,recreation or <strong>the</strong> o<strong>the</strong>r benefits of <strong>for</strong>est preservation, and increased profits orharvest by private <strong>for</strong>estland owners. Quantitative estimates of social costs ofimplementing <strong>the</strong> recovery plan were not made.These preliminary estimates were not intended to provide a complete basis <strong>for</strong>final decisions on <strong>the</strong> implementation of <strong>the</strong> draft recovery plan. During <strong>the</strong>public comment period, <strong>the</strong> <strong>Recovery</strong> Team will work with <strong>the</strong> Forest Serviceand <strong>the</strong> BLM to refine <strong>the</strong> estimates of effects of federal timber sales based onmore site-specific data on potential timber yields. In addition, estimates will beprepared of economic effects not covered by <strong>the</strong> preliminary estimates.B. Analytical ConceptsThis section summarizes <strong>the</strong> basic analytical concepts needed to estimate andproperly account <strong>for</strong> <strong>the</strong> economic effects of reduced federal timber harvests.Next it summarizes <strong>the</strong> estimation methods and assumptions used <strong>for</strong> <strong>the</strong>preliminary estimates and presents <strong>the</strong> resulting estimates.This section provides an economic framework within which <strong>the</strong> various factorsthat affect <strong>the</strong> costs of achieving recovery can be related. The discussion ispresented in qualitative, non-ma<strong>the</strong>matical terms to facilitate a broader understandingand use of <strong>the</strong> concepts. The basic concepts are presented in a singleperiod, comparative static analysis <strong>for</strong> <strong>the</strong> sake of simplicity. For a comprehensiveanalysis of long-term effects, <strong>the</strong> concepts would be extended to dealwith many time periods. This would reflect <strong>the</strong> effects of timber growth and <strong>the</strong>concept that resource values realized sooner are worth more than <strong>the</strong> samevalue if realized later. It also would deal more explicitly with <strong>the</strong> dynamicprocesses through which local and regional economies adjust to <strong>the</strong> kind ofstructural economic change caused by policies restricting timber harvest. Thefollowing discussion takes a static approach to provide a more easily understandableanalytical framework.1. The Supply Curve.The supply curve <strong>for</strong> a commodity is one of <strong>the</strong> fundamental concepts ofeconomic analysis. It represents <strong>the</strong> rate of production <strong>for</strong> a commodity or
good that is achievable at various costs. For timber, <strong>the</strong> supply curve reflects<strong>the</strong> real costs that would be incurred in all <strong>the</strong> activities needed to grow trees,harvest timber, and bring logs to <strong>the</strong> mills to be sawn into lumber. Such costsinclude <strong>for</strong>est management, road construction, cutting and loading, andtransportation. It also includes <strong>the</strong> cost of complying with regulations designedto reduce <strong>the</strong> environmental effects of <strong>the</strong>se activities.As is <strong>the</strong> general case with supply curves, <strong>the</strong> timber supply curve slopesupward as shown in Figure H. 1. At any given time, <strong>the</strong>re are numerous sitesthat could be harvested at various costs. When prices are higher, it is worthwhileincurring greater costs to harvest additional timber. The upward slopingsupply curve reflects <strong>the</strong> economic diversity of <strong>the</strong> existing <strong>for</strong>estlands. Itresults from a mixture of stands of timber, some with relatively low costs perboard foot, some with relatively high.The supply curve can be derived from a table listing <strong>the</strong> annual amount oftimber that could be harvested at each cost from each site in <strong>the</strong> inventory.The total amount that could be produced at each cost is <strong>the</strong> sum of <strong>the</strong> annualharvest at that cost from all <strong>the</strong> sites. The supply curve shows <strong>the</strong> annualproduction at each price which is <strong>the</strong> sum of <strong>the</strong> potential annual harvest at allcosts less than or equal to <strong>the</strong> price. Table H.7 provides an example of this wayof deriving a supply curve. Figure H.2 shows <strong>the</strong> supply curve derived fromTable H.7.A region's timber supply curve reflects <strong>the</strong> condition of its current inventory ofstanding timber. For example, Figure H.3 shows two supply curves, one thatwould yield very high levels of production over a broad range of timber pricesand a second that yields relatively little production at low prices, moderateproduction at midrange prices and not much increase in production even atfairly high prices. The first would characterize production from <strong>the</strong> <strong>for</strong>estlandsin a region that has a substantial inventory of mature standing timber, <strong>the</strong>second from a region with limited <strong>for</strong>estlands or <strong>for</strong>estlands where <strong>the</strong> lowercost timber already has been harvested./IPSci)0-D2a)C.0C.)0a1)C.)Annual rate of productionQ/oFigure H. 1. Timber supply curve.559
25-° 20/0M 15-a)CLU)0 10-0CL 5 -0)0 200 400 600 800 1,200 1,600 2,000Annual rate of production --- -11.1.1 .... 111.1 ..................... - - ...I...................................... ------- -.11111-Figure H.2. Tifnber supply curve derlvedfrom Table 7.The second supply curve also could represent <strong>the</strong> supply curve in a region inwhich lands with low cost timber were held off <strong>the</strong> market. Prohibiting timberharvests on sites with relatively low costs shifts <strong>the</strong> supply curve to <strong>the</strong> left <strong>for</strong>all higher costs. Table H.8 shows <strong>the</strong> supply schedule from Table H.7 recalculatedto reflect <strong>the</strong> removal of sites 1 and 2. Figure H.4 shows <strong>the</strong> supply curvederived from Table H.8. As a comparison of Figures H.2 and H.4 shows,policies that remove harvestable timber from <strong>the</strong> timber resource base generallycan be represented by a leftward shift in <strong>the</strong> supply curve from SO to S. asshown in Figure H.5. This is particularly true if low cost sources of timber aremade unavailable <strong>for</strong> harvest.PS Timber-poor regiona)CD*0 cis0 2-Da)0.U)oS Timber-rich region0)a-)Annual rate of productionQFigure H.3. Timber supply curves.560
Table H.7. Derivation of timber supply curve.Potential Timber Production Potential Timber Production Supplyby Site and Cost by Cost ScheduleProductionSite Cost Production Cost Production Price (units per(dollars per unit) (units) (dollars per unit) (units) (dollars per unit) year)1 5 200 5 450 5 4501011010510109601515475151,4352050 20300201,7352500025140251,875251015275205025 203550o 010015020100255045250104001515020502520550100150201002550111.11 .....-.......I...111.1111 .1.11 I -Table H.8. Effect of restricted timber availability on derivation of timber supply curve.\Potential Timber Productionby Site and CostPotential Timber Productionby CostSupplyScheduleSiteCost(dollars per unit)Production(units)Cost(dollars per unit)Production(units)Price(dollars per unit)Production(units peryear)2345510152025510152025510152025510152025510152025000000000000010050250400150502000010050I'll -1- 1.1- 111- 11" .." .., ... 11 ......510152025250400150250120510152025........... I....... ........... ....I..................................................................... ..11 I I ----... 1 .1.1 11,2506508001,0501,170JI561
25 -- 20-0co/o 15--Da)a0a)10m~ C) 5-0 200 400 600 800 1,200 1,600 2,000Annual rate of production1 11 ....I.... 11.1Figure HA. Timber supply curve derivedfrom Table H.8.2. The Fundamental Economic Benefits of TimberProduction.The market <strong>for</strong> lumber is national. Lumber and wood products are shippedlong distances and can be imported, primarily from Canada. Because of <strong>the</strong>available supply of lumber from timber grown in o<strong>the</strong>r regions and <strong>the</strong> flexibilityin substitution of o<strong>the</strong>r materials <strong>for</strong> lumber, <strong>the</strong> level of timber productionin <strong>the</strong> Pacific Northwest has only a small effect on lumber prices. If <strong>the</strong> rate ofPS1S0aDa)i0,0.0coC1)0C1)a-Annual rate of productionQFigure H.5. Effect of removing low cost timberffrom timber supply curve.562
timber harvesting in <strong>the</strong> Pacific Northwest does not much affect nationallumber prices or consumption, it will not substantially affect <strong>the</strong> rate of consumptionor <strong>the</strong> benefits that consumers experience from using lumber.If lumber prices and consumption are not much affected by changes in PacificNorthwest timber production, what <strong>the</strong>n is its benefit? Economists call <strong>the</strong>fundamental economic benefit from development of natural resources <strong>the</strong>economic rent. The economic rent from harvesting a stand of timber is <strong>the</strong>difference between <strong>the</strong> revenues from <strong>the</strong> sale of <strong>the</strong> timber harvested and <strong>the</strong>costs of all <strong>the</strong> various resources-labor, materials, energy, capital-used inharvesting and transporting <strong>the</strong>m. As Figure H.6 shows, <strong>the</strong> price of timber,PT, is determined by <strong>the</strong> intersection of <strong>the</strong> supply curve and <strong>the</strong> demand curve<strong>for</strong> timber. This intersection represents <strong>the</strong> market equilibrium betweensupply and demand.In Figure H.6, <strong>the</strong> economic rent from <strong>the</strong> harvesting of Q, board feet per yearsold at PT' <strong>the</strong> price of timber, is <strong>the</strong> hatched area between <strong>the</strong> price line and<strong>the</strong> supply curve. The hatched area is what is left when <strong>the</strong> costs of production,which is represented by <strong>the</strong> area under <strong>the</strong> supply curve from <strong>the</strong> originto Q,, is subtracted from <strong>the</strong> rectangle that represents <strong>the</strong> production revenues,PT X Q9.Thus, a good measure of <strong>the</strong> direct economic benefit of producing timber is <strong>the</strong>gains <strong>the</strong> economy realizes by incurring less cost in harvesting and transportinglogs than <strong>the</strong> price paid <strong>for</strong> <strong>the</strong> logs. These benefits are captured in avariety of <strong>for</strong>ms: stumpage fees paid to landowners including <strong>the</strong> federalgovernment and state governments, lumber company profits, federal incometaxes, and state taxes. Stumpage prices are <strong>the</strong> best indicators of <strong>the</strong> economicbenefit of <strong>the</strong> timber that is cut because competitive bidding <strong>for</strong> timberharvest contracts <strong>for</strong>ces firms to bid away most of <strong>the</strong> difference between <strong>the</strong>value of <strong>the</strong> logs at <strong>the</strong> millgate and <strong>the</strong> costs of harvesting and transportation.The timber supply curve in Figure H.6 shows <strong>the</strong> economic benefit that can berealized from harvesting various portions of <strong>the</strong> timber resources in a region'sPS0.0(I)00T_DAnnual rate of production 1Figure H.6. Timber supply curve and economic rent563
<strong>for</strong>estlands. The costs of production reflect technologies currently availableand <strong>the</strong> current prices of <strong>the</strong> resources used to harvest and transport timber.Under ideal market conditions, <strong>the</strong> portion of <strong>the</strong> timber inventory that isbrought into production would be <strong>the</strong> portion that yields economic rent atprevailing prices, thus contributing direct benefits to <strong>the</strong> economy. If timberprices are low, only <strong>the</strong> lower cost stands are brought into production. Iftimber prices are higher, <strong>the</strong>n higher cost stands can be brought into productionas well, increasing <strong>the</strong> total rate of production and <strong>the</strong> economic rent. Thetotal economic rent realized from <strong>the</strong> timber produced is equal to <strong>the</strong> sum of<strong>the</strong> economic rent realized from each of <strong>the</strong> stands contributing to production.Timber consumers, such as sawmills, plywood mills, and pulpmills, alsobenefit from <strong>the</strong> production of timber. The extent of such benefits depends on<strong>the</strong> prices at which <strong>the</strong>y sell <strong>the</strong>ir products, <strong>the</strong> o<strong>the</strong>r costs <strong>the</strong>y incur inprocessing wood, and <strong>the</strong> price <strong>the</strong>y pay <strong>for</strong> timber.Figure H.7 shows <strong>the</strong> same supply and demand curves as Figure H.6. Thedemand curve <strong>for</strong> timber shows <strong>the</strong> prices that timber buyers would be willingto pay <strong>for</strong> timber at different rates of timber consumption. The prices millswould pay depend on wood product prices and o<strong>the</strong>r mill operating costs.More efficient mills with lower operating costs can pay higher prices <strong>for</strong> timberand still make profits. Less efficient mills close when timber prices are high,reducing <strong>the</strong> rate of timber consumption. The substantial profits that can bemade by most efficient mills during periods when timber prices are relativelylow are represented by <strong>the</strong> difference between <strong>the</strong> highest prices on <strong>the</strong> demandcurve and <strong>the</strong> prices set by <strong>the</strong> market when timber supplies are abundant.The hatched area in Figure H.7 represents <strong>the</strong> benefits to timber consumers,called <strong>the</strong> consumers' surplus by economists. In this case, itrepresents <strong>the</strong> sum of <strong>the</strong> profits made by mill operators at <strong>the</strong> timber price setby <strong>the</strong> market.P'Na}a)te0.0U) coS0.00)D..DQAnnual rate of productionFigure H. 7. Timnber supply curve and consumers' surplus.564
3. Economic Effects of <strong>Owl</strong> Habitat Protection.The dedication of substantial areas of federal <strong>for</strong>estland to provide owl habitatwill remove substantial amounts of land suitable <strong>for</strong> timber harvest from <strong>the</strong>federal timber base. What is <strong>the</strong> economic response and <strong>the</strong> effect on <strong>the</strong>various elements of <strong>the</strong> economy directly affected by this difference in <strong>the</strong>timber supply? In general, <strong>the</strong> following differences would be expected infuture timber markets:* The rate of federal timber harvest will be lower in future years than it wouldbe without owl habitat protection.* The rate of production from private lands will be somewhat higher.* The price of timber will be somewhat higher.WFederal revenues will be lower because of <strong>the</strong> <strong>for</strong>egone harvest, but higher on<strong>the</strong> remaining harvest because of <strong>the</strong> price increase.* Private timber profits will be higher because of higher production and highertimber prices.* Timber consumers, such as sawmills and plywood mills, will have lowerprofits because <strong>the</strong>y must pay higher timber prices without receiving more <strong>for</strong><strong>the</strong>ir lumber.To estimate <strong>the</strong> extent of <strong>the</strong>se effects, economists use <strong>the</strong> basic analyticalconcepts of supply and demand curves discussed earlier. Their application to<strong>the</strong> analysis of <strong>the</strong> effects of owl habitat protection is shown in Figure H.8.Without owl conservation measures, <strong>the</strong> total timber harvest would be Q 0 ., and<strong>the</strong> timber price would be PO. The federal harvest, QGid' is shown as if it were<strong>the</strong> lowest cost source of supply, having cost approximately equal to C.. Federal<strong>for</strong>ests have most of <strong>the</strong> remaining old-growth timber that has <strong>the</strong> lowestcost per unit in <strong>the</strong> timber resource base. It is assumed that <strong>the</strong> rate of federaltimber harvest would be lower by Q' because of <strong>the</strong> establishment of owlhabitat conservation areas. In Figure H.8, <strong>the</strong> effect of <strong>the</strong> lower federalharvest, is shown by a leftward shift in <strong>the</strong> timber supply curve that resultsfrom deletion of <strong>the</strong> segment of <strong>the</strong> original supply curve from <strong>the</strong> origin to Q'.E0P 1P 0Rate of timber harvest...... ~............ . ............ . ....... ... ..Figure H.8. Effects of removal of timberland on regional timber market565
In Figure H.8, <strong>the</strong> equilibrium between <strong>the</strong> supply curve with owl habitatconservation, S., and <strong>the</strong> demand curve, D, is shown at E, with <strong>the</strong> timberprice, Pf., higher than P. and timber harvest, Qr With owl conservation, <strong>the</strong>harvest rate, Qf, is less than Q. but greater than Q,, <strong>the</strong> harvest rate equal to(Q. - Q') that would occur if <strong>the</strong>re were no increase in <strong>the</strong> private harvest ratein response to <strong>the</strong> restriction in federal harvest. These features of Figure H.8can be used to estimate <strong>the</strong> direct economic effects of <strong>the</strong> removal of <strong>for</strong>estlandfrom <strong>the</strong> timber base to protect <strong>the</strong> owl.The basic concepts <strong>for</strong> analysis of <strong>the</strong> economic effects caused by owl habitatconservation are <strong>the</strong> economic rent realized from timber harvest and <strong>the</strong>consumers' surplus. The graphic representation of economic rent is shown inFigure H.6. The hatched area represents <strong>the</strong> sum of <strong>the</strong> profits landownerswould realize from harvest on all of <strong>the</strong> <strong>for</strong>estlands contributing to <strong>the</strong> annualharvest. These lands range from those with low costs that yield high profits too<strong>the</strong>rs with costs nearly equal to <strong>the</strong> price which logs bring that yield almostno profit. The graphic representation of <strong>the</strong> consumers' surplus is shown inFigure H.7. The hatched area represents <strong>the</strong> sum of mill profits ranging from<strong>the</strong> high profits earned by <strong>the</strong> most efficient mills to nearly zero profits earnedby economically marginal mills with high costs.The federal government will not, of course, produce economic benefits orreceive revenues <strong>for</strong> <strong>the</strong> portion of its timber that is on land reserved <strong>for</strong> owlhabitat and must go unharvested. The economic benefit that would resultfrom this harvest is equal to <strong>the</strong> difference between <strong>the</strong> value of <strong>the</strong> logs thatwould be produced and <strong>the</strong> cost of harvesting. This benefit is represented byArea A approximately equal to (P. - C) x Q' in Figure H.9. The removal offederal <strong>for</strong>estland from <strong>the</strong> timber base to provide owl habitat causes economiclosses equal to this unrealized benefit.The economic benefits from <strong>the</strong> federal timber harvest that continues despiteprotection of owl habitat would be higher, however, because of <strong>the</strong> higher priceof timber. The gain resulting from <strong>the</strong> higher timber price is shown in Figure/~~~~~~~~~~~~~~~~~~~~E0CD0~Q1 Qfd 0Q Rate of timber harvest566Figure H.9. Economic benefit <strong>for</strong>egone by reduction infederal timber harvest.
Ia) E-50).C0) ~~~t ~ soC QDPtP| \D~~qld- Qa Qi Qf QORate of timber harvestFigure H.10. Price-induced gains in economic benefitsfromfederal timber harvest.H. 10 by Area B equal to (P,-P 0 ) x (Qre - Q'). As we shall see, <strong>the</strong>se gains to <strong>the</strong>federal government are offset by losses to timber consumers.To compute <strong>the</strong> effects of owl habitat conservation on <strong>the</strong> benefits and revenuesfrom federal timber harvest, we must know <strong>the</strong> relationship between <strong>the</strong>analytical concepts shown in Figures H.9 and H. 10, and (1) <strong>the</strong> way costs areincurred by federal agencies and <strong>the</strong> timber buyers and (2) <strong>the</strong> receipts from<strong>the</strong>se sales. The BLM and Forest Service incur different costs and structurebids <strong>for</strong> timber differently. These differences will affect <strong>the</strong> receipts that are-\a)E-Da)OS. SQ|DP.P 09 w E-tx oC0-9DAKQW-QI Q, Qf QORate of timber harvest- ....... I..,1. -1.1-11 ......... I..",."",Figure H. 11. Price-induced gains in economic benefitffrom private timber harvest.1567
<strong>for</strong>egone and <strong>the</strong> way <strong>the</strong>y will save costs by not preparing <strong>for</strong> timber sales on<strong>the</strong> reserved lands.Private timber producers also would benefit from receiving a higher price on<strong>the</strong> timber <strong>the</strong>y would harvest even if <strong>the</strong>re is no owl conservation. In FigureH. 11, this is represented by Area C equal to (Pf - P,) x (Ql -Qfd + Q'). As is <strong>the</strong>case <strong>for</strong> federal timber, this gain is offset by losses to timber consumers.Private producers would also harvest at a higher rate in <strong>the</strong> case with federalowl habitat conservation in response to <strong>the</strong> higher price, Pr The additionalharvest is shown in Figure H. 11 as (Qf -Q,). This harvest is achieved at highercost, however, as represented by <strong>the</strong> area under <strong>the</strong> supply curve, Sf from Q, toQf. The profit on this additional production is relatively small because of itshigh cost. It is equal to <strong>the</strong> area representing <strong>the</strong> additional revenues, Pox (Q. -Q 1 ) less <strong>the</strong> area representing <strong>the</strong> additional costs. The profit on <strong>the</strong> additionalprivate production is shown in Figure H. 11 as <strong>the</strong> small triangular Area Dunder price line Pf but above Sf between Q, and Qf.Although both <strong>the</strong> federal government and private timber owners benefit from<strong>the</strong> price increase, consumers of timber, such as sawmills and plywood mills,lose. To determine <strong>the</strong> total effect on <strong>the</strong> economy, we must estimate <strong>the</strong>effects on timber consumers as well as producers. Mills lose because <strong>the</strong>higher price of logs that results if timber harvest on federal lands is restrictedby protection of owl habitat causes lower profits.The graphic analysis of <strong>the</strong> effects on timber consumers is shown in FigureH. 12. If <strong>the</strong>re were no owl conservation, <strong>the</strong> timber buyers' benefits are representedby <strong>the</strong> roughly triangular area with corners at PO, Id and E 0 . If owlconservation restricts timber supply, <strong>the</strong> timber buyers' benefits are representedby <strong>the</strong> roughly triangular area with corners at P., Id and E,. The lossesexperienced by timber buyers are represented by <strong>the</strong> difference between <strong>the</strong>two triangles, shown as Area E.IDa).0Eo tS Sa)C-,TPtP 0Q1 Qfd QI Q~ QORate of timber harvest.11111 .........- I " Ill ., I I......... - IFigure H.12. Price-induced losses in benefitsfrom milfing.568
Careful examination of Figures H. 10, H. 11, and H. 12 shows that all of <strong>the</strong>areas representing price-induced gains to <strong>the</strong> federal government (Area B inFigure H. 10) and <strong>the</strong> private timber producers (Areas C and D in Figure H. 1 1)are part of Area E in Figure H. 12 representing losses to timber buyers. Thus,<strong>the</strong> price-induced gains to timber owners are achieved at <strong>the</strong> expense of timberbuyers. Moreover, <strong>the</strong> losses to timber buyers exceed <strong>the</strong> price-induced gainsto timber producers by Area F shown in Figure H. 13.Figure H. 13 shows <strong>the</strong> graphical representation of <strong>the</strong> total cost from loss intimber production due to habitat conservation. The total cost is <strong>the</strong> sum ofArea A, <strong>the</strong> loss of economic benefits on <strong>the</strong> federal timber that will not beharvested, and Area F, <strong>the</strong> net loss caused by timber price increases. Thesecosts reflect all of <strong>the</strong> effects on <strong>the</strong> national economy that occur in timbermarkets. If all of <strong>the</strong> costs of harvesting timber, including all environmentalcosts, such as lost recreational opportunities and effects on water quality, werepaid <strong>for</strong> by firms harvesting timber and were reflected in <strong>the</strong> supply curve, <strong>the</strong>n<strong>the</strong> losses shown in Figure H. 13 would be <strong>the</strong> total national costs of protectingowl habitat. Because such costs are external to transactions in <strong>the</strong> timbermarket, <strong>the</strong> reduced environmental costs caused by reduced timber harvestmust be estimated separately.The economic effects of protecting owl habitat can be viewed from <strong>the</strong> regionalas well as <strong>the</strong> national perspective. This requires an accounting of <strong>the</strong> effectson <strong>the</strong> regional share of <strong>the</strong> national economic benefits created by timberharvesting as well as <strong>for</strong> <strong>the</strong> effects on regional income generated by <strong>the</strong>purchase of labor, equipment, and services <strong>for</strong> <strong>the</strong> harvesting and processingof timber.The region shares in <strong>the</strong> benefits from timber harvesting, shown in Figure H.6,in several ways. First, counties receive 25 percent to 50 percent of federaltimber sales receipts. Second, firms that own <strong>for</strong>estland in <strong>the</strong> region earnprofits on timber <strong>the</strong>y harvest. State governments also receive revenue fromtimber harvest on state lands. The effects of owl habitat protection on <strong>the</strong>seregional shares of <strong>the</strong> benefits from timber harvesting can be analyzed using<strong>the</strong> concepts shown in Figures H.9, H. 10, and H. 11._ IDCDE0)Pf0 +--AcooRate of timber harvest)i Qf Q 0/.1 .................... --- - I ---...-.111.1.111.1.11Figure H.13. Total economic losses from reduction infederal timber harvest.569
The income created by <strong>the</strong> purchase of labor, equipment, and materials usedin harvesting and processing timber is also a part of <strong>the</strong> regional economy.Since <strong>the</strong> primary component of this income is wages and salaries, analysis of<strong>the</strong>se effects is based upon concepts regarding <strong>the</strong> demand <strong>for</strong> labor in <strong>the</strong>timber industry and <strong>the</strong> relationship between <strong>the</strong> level of employment in <strong>the</strong>timber industry and <strong>the</strong> level of employment in related industries. The nextsection presents concepts that are useful <strong>for</strong> understanding <strong>the</strong> employmenteffects of protecting owl habitat.The analytical concepts discussed earlier are static. They show differencesbetween two future situations, one without protection of owl habitat, one withowl habitat protection. They do not show how <strong>the</strong> economy would change overtime in response to <strong>the</strong> implementation of a new policy such as <strong>the</strong> recoveryplan. A few observations can be made, however, about <strong>the</strong> dynamic responseof <strong>the</strong> economy using <strong>the</strong> same concepts.The response of <strong>the</strong> private timber industry to reductions in federal timberharvests in <strong>the</strong> Northwest is of particular interest. As shown in Figure H. 14,<strong>the</strong> initial market response to <strong>the</strong> change in <strong>the</strong> timber supply is to drivetimber prices up to P.. Private timber owners will respond by increasing <strong>the</strong>irrate of timber harvest to <strong>the</strong> extent that <strong>the</strong>y can do so at a profit at <strong>the</strong> higherprices. This increased harvest will partially offset <strong>the</strong> reduction in <strong>the</strong> federaltimber harvest and will drive <strong>the</strong> timber price down toward P. It appears,however, that <strong>the</strong> additional harvest from private <strong>for</strong>estlands will be limited inamount and duration because of <strong>the</strong> relatively small portion of that land withtrees of harvestable, or nearly harvestable, age.In general, timber harvesting in <strong>the</strong> present tends to reduce <strong>the</strong> potentialharvest in future years. This effect of harvesting can be viewed as a tendency<strong>for</strong> <strong>the</strong> timber supply curve to shift toward <strong>the</strong> left over time, because <strong>the</strong>timber that is harvested tends to be <strong>the</strong> lower cost timber in <strong>the</strong> inventory.* IDDE0f~I\1Q1 afed Qi QfRate of timber harvest- - 11 - - - -- ........... I.............. 11.11, I -QIFigure H. 14. Dynamic effects of removal of timberland on regional timber market.570
The tendency of <strong>the</strong> supply curve to shift leftward over time due to harvestingis counteracted by <strong>the</strong> natural growth of trees in <strong>the</strong> inventory and by technologicaldevelopments that reduce <strong>the</strong> costs of harvesting and transportation.The timber market tends to balance <strong>the</strong> overall rate of harvest with <strong>the</strong> rates ofgrowth and technological progress.In recent decades, federal timber harvest policy has provided assurance offuture timber supplies, preventing <strong>the</strong> depletion of timber on private landsfrom causing expectations of higher future prices which are <strong>the</strong> market's signalto delay harvesting. As a result, private harvests have not slowed, creating adip in <strong>the</strong> potential <strong>for</strong> harvest during <strong>the</strong> next decade or two.The additional harvest from private <strong>for</strong>estlands also is likely to be limited bytwo factors that will tend to counteract <strong>the</strong> tendency <strong>for</strong> timber prices toremain higher. First, during <strong>the</strong> period of higher timber prices, some mills willbe <strong>for</strong>ced to close. The resulting decrease in mill capacity in <strong>the</strong> Northwestwould appear in Figure H. 14 as a downward shift in <strong>the</strong> demand curve. Second,<strong>the</strong> rate of timber harvest in o<strong>the</strong>r regions also would increase in responseto <strong>the</strong> higher price. More lumber would be produced in o<strong>the</strong>r regions, puttingfur<strong>the</strong>r downward pressure on <strong>the</strong> demand <strong>for</strong> timber in <strong>the</strong> Northwest. Thedownward movement of <strong>the</strong> demand curve would tend to put downwardpressure on timber prices, undercutting <strong>the</strong> increased harvest on private<strong>for</strong>estlands.4. The Demand<strong>for</strong> Labor in <strong>the</strong> Timber Industry.Reduced employment is an important effect of owl conservation measures,particularly at <strong>the</strong> personal and local levels. Because people lose <strong>the</strong>ir jobs andincome, employment reductions are regarded as undesirable impacts. Whilesuch effects are bad at <strong>the</strong> personal and local level in <strong>the</strong> short run, paradoxically<strong>the</strong>y are much less damaging over <strong>the</strong> long run at <strong>the</strong> regional andnational level. To assess employment effects, it is useful to understand howlabor markets operate to put people to work in ways that achieve greater totaloutput and how timber availability affects employment.Economists usually consider <strong>the</strong> labor involved in any enterprise like timberharvesting or milling to be a cost ra<strong>the</strong>r than a benefit. Businesses correctlyregard labor costs as an important element of total production costs in <strong>the</strong>iref<strong>for</strong>ts to operate efficiently. The labor used in timber harvest and millingcould contribute to producing o<strong>the</strong>r goods. Its cost is a measure of <strong>the</strong> o<strong>the</strong>rproduction given up by using labor in <strong>the</strong> timber industry. Over <strong>the</strong> long run,labor-saving measures are usually beneficial to <strong>the</strong> economy, because <strong>the</strong>yallow <strong>the</strong> work <strong>for</strong>ce to be deployed in a manner that yields greater totaloutput.However, our economic system does not always shift labor effectively from oneactivity to ano<strong>the</strong>r. When people become unemployed, <strong>the</strong>y may not find newemployment <strong>for</strong> an extended period of time. While <strong>the</strong>y are unemployed, <strong>the</strong>yare not contributing <strong>the</strong>ir productive services to <strong>the</strong> economy. In some cases,<strong>the</strong> new employment opportunities are less productive and less remunerativethan previous jobs.The value of total economic production decreases if people are unemployed orare reemployed in less productive jobs that bring lower wages. At <strong>the</strong> locallevel, unemployed people have less money to spend. Lower spending reducesemployment in a variety of businesses. At <strong>the</strong> personal level, unemploymentcan cause great hardship and stress <strong>for</strong> unemployed individuals and <strong>the</strong>irfamilies. Extended periods of higher than normal unemployment are bad <strong>for</strong><strong>the</strong> unemployed individuals and <strong>the</strong> economy as a whole.571
Two concepts are useful <strong>for</strong> understanding <strong>the</strong> employment effects of owlconservation measures. One is <strong>the</strong> relationship among <strong>the</strong> various factors thataffect <strong>the</strong> decisions of businesses with employment directly related to timberharvest, such as sawmills. The key factors of interest are <strong>the</strong> supply of timberand labor and <strong>the</strong> demand <strong>for</strong> timber. The second is <strong>the</strong> relationship betweendirect employment in timber cutting and milling and employment in relatedindustries and in <strong>the</strong> economy as a whole.Figure H. 15 shows <strong>the</strong> factors that affect a sawmill's management decisions.The mill manager determines <strong>the</strong> rate of lumber production, <strong>the</strong> rate of timberpurchases, and <strong>the</strong> amount of labor and o<strong>the</strong>r inputs it needs <strong>for</strong> that rate ofproduction. These decisions are affected by <strong>the</strong> price of lumber, <strong>the</strong> price oftimber, and <strong>the</strong> prices of labor and o<strong>the</strong>r inputs. The demand <strong>for</strong> workers in<strong>the</strong> timber industry results from <strong>the</strong> decisions of many mills and o<strong>the</strong>r businessesinvolved in <strong>the</strong> harvesting, transportation, and processing of timber.The price of timber provides <strong>the</strong> connection between <strong>the</strong> availability of timberas represented by <strong>the</strong> timber supply curve and <strong>the</strong> rate of production andlevels of employment in timber businesses. As shown in Figure H.5, <strong>the</strong> priceof timber is represented by <strong>the</strong> intersection between <strong>the</strong> demand curve <strong>for</strong>timber and <strong>the</strong> supply curve.The demand curve <strong>for</strong> timber shows <strong>the</strong> rate of timber consumption at eachtimber price. The demand <strong>for</strong> timber is derived from <strong>the</strong> demand <strong>for</strong> lumber. If<strong>the</strong>re are many firms producing lumber, none can affect lumber prices. Eachsawmill must sell its lumber at <strong>the</strong> market price. At a given lumber price, eachsawmill's profits and production rate depend on <strong>the</strong> firm's costs. The price oftimber is an important factor in <strong>the</strong> total costs of producing lumber. Whentimber prices increase, profits and <strong>the</strong> rate of production decrease.Some firms are efficient enough to be able to absorb an increase in <strong>the</strong> price oftimber and continue operating, though at lower output. Firms that weremarginally profitable be<strong>for</strong>e an increase in timber prices will be <strong>for</strong>ced to close.Thus when <strong>the</strong> price of timber in a region is higher, <strong>the</strong> total output of lumberwill be lower.To minimize costs, a firm would normally adjust its mix of inputs whenever aninput price changed significantly. Often, increased use of some inputs canoffset <strong>the</strong> reduction in use of an input whose price has increased. In sawmilloperations, however, <strong>the</strong>re is little flexibility to alter <strong>the</strong> amount of timberneeded to make a board foot of lumber, at least in <strong>the</strong> short run (<strong>the</strong> periodduring which capital equipment cannot be changed). There<strong>for</strong>e, to simplify <strong>the</strong>discussion, it is reasonable to assume that <strong>for</strong> each rate of lumber production<strong>the</strong>re is a corresponding rate of timber purchases by <strong>the</strong> mill. Fur<strong>the</strong>rmore, <strong>for</strong>each rate of lumber production, <strong>the</strong>re is a profit maximizing employment level.Thus, direct employment in <strong>the</strong> timber and wood products industries is higherwhen timber prices are lower. If restrictions in <strong>the</strong> availability of timber <strong>for</strong>harvest shift <strong>the</strong> supply curve to <strong>the</strong> left as in Figure H.5, timber prices will behigher. As a result, lumber output and direct employment will be lower.The level of output in a region's timber industry also affects employmentoutside of that industry. Timber businesses buy goods and services from avariety of firms in o<strong>the</strong>r sectors of <strong>the</strong> economy, from equipment manufacturingto accounting. At lower levels of output, <strong>the</strong> timber industry uses less of<strong>the</strong>se goods and services. Firms in o<strong>the</strong>r sectors must reduce <strong>the</strong>ir levels ofoutput to avoid producing goods that cannot be sold. Workers are laid off ornew hiring is deferred when such reductions occur. Thus changes in output in<strong>the</strong> timber and lumber industries induce changes in employment in o<strong>the</strong>rsectors. In addition to <strong>the</strong> direct employment effects of a change in timberavailability, <strong>the</strong>re are induced employment effects in <strong>the</strong> related industries.572
Fur<strong>the</strong>r employment effects, called indirect effects, occur because of <strong>the</strong>changes in income levels that are caused by changes in employment. Indirecteffects result from <strong>the</strong> reduced consumer spending that is caused whenunemployment reduces <strong>the</strong> income people have to spend. The total employmenteffects of reducing timber availability include direct, induced, and indirecteffects.5. Effects on <strong>the</strong> Value of Capital Assets.The two <strong>for</strong>ns of asset most strongly affected by <strong>the</strong> reduction of timberharvest are sawmills and homes. Home asset losses result from <strong>the</strong> decline inincome of many residents in a community. Losses in <strong>the</strong> value of housingcause a transfer of wealth that can seriously affect people's lives, but suchlosses do not represent a significant loss to <strong>the</strong> output of <strong>the</strong> national economy.Losses in <strong>the</strong> value of real estate also cause a reduction in <strong>the</strong> tax base of localgovernments. When mills close because <strong>the</strong>y cannot make a profit at <strong>the</strong>higher timber prices that will result from owl conservation, <strong>the</strong> mill equipmentusually is scrapped. Capital equipment of this sort is valued <strong>for</strong> <strong>the</strong> profits itcan yield. Once <strong>the</strong> profits disappear, <strong>the</strong> value of <strong>the</strong> capital becomes negligible.Although <strong>the</strong> resulting loss in mill asset values reflects a loss in economicoutput in <strong>the</strong> national economy, that loss is already accounted <strong>for</strong> by<strong>the</strong> reduction in timber consumers' surplus (that is, profits) discussed earlier.Thus, separate estimates of housing and mill asset losses are of interestprimarily because of <strong>the</strong>ir effect on <strong>the</strong> local or regional economy but <strong>the</strong>yshould not be added to <strong>the</strong> estimates of <strong>the</strong> underlying losses in <strong>the</strong> componentsof income that cause <strong>the</strong>m.C. Estimating Economic Effects of Implementing <strong>the</strong><strong>Recovery</strong> <strong>Plan</strong>As noted earlier, <strong>the</strong> FWS, with assistance from <strong>the</strong> Forest Service and BLM,conducted an economic analysis of <strong>the</strong> critical habitat designation <strong>for</strong> <strong>the</strong>nor<strong>the</strong>rn spotted owl (USDI 1992). As a part of this analysis it developedmethods to estimate <strong>the</strong> loss of federal timber harvest from various measuresto protect owl habitat. It developed methods <strong>for</strong> estimating <strong>the</strong> employmenteffects of <strong>the</strong> resulting harvest reductions in each of <strong>the</strong> affected counties. Italso developed methods to estimate <strong>the</strong> net effect on <strong>the</strong> U.S. Treasury and on<strong>the</strong> timber revenues shared with <strong>the</strong> county governments. The analysisprovided a comparison of <strong>the</strong> effects of <strong>the</strong> original <strong>for</strong>est plans, <strong>the</strong> implementationof <strong>the</strong> ISC strategy and <strong>the</strong> effect of Endangered Species Act protectionsof <strong>the</strong> owl, including <strong>the</strong> designated critical habitat. To provide comparablepreliminary estimates <strong>for</strong> <strong>the</strong> draft recovery plan, <strong>the</strong> ISC strategy, and <strong>the</strong>critical habitat designation, it was decided that <strong>the</strong> same methods of analysis.with some adjustments appropriate to <strong>the</strong> recovery plan, would be applied toestimate <strong>the</strong> economic effects of implementing <strong>the</strong> recovery plan.The methods used <strong>for</strong> making preliminary estimates of <strong>the</strong> effects of implementing<strong>the</strong> recovery plan are summarized here.1. Estimating <strong>the</strong> Loss of Benefitsfrom Federal TimberHarvest.The estimation of <strong>the</strong> loss in <strong>the</strong> economic benefits from <strong>the</strong> federal timberharvest that will be <strong>for</strong>egone to provide owl habitat (Area A in Figure H. 13) isstraight<strong>for</strong>ward. An estimate of <strong>the</strong> change in <strong>the</strong> annual harvest is multiplied573
y an estimate of <strong>the</strong> price that would have been bid <strong>for</strong> <strong>the</strong> timber. Theappropriate price to use in this computation is <strong>the</strong> price that would occur if <strong>the</strong>recovery plan is not implemented.The Forest Service and BLM provided <strong>the</strong> FWS estimates of <strong>the</strong> reduction infederal timber available <strong>for</strong> sale that would result from <strong>the</strong>ir plans, fromimplementation of <strong>the</strong> ISC strategy, and from <strong>the</strong> proposed designation ofcritical habitat <strong>for</strong> <strong>the</strong> spotted owl. The FWS used <strong>the</strong>se estimates to deriveestimates of timber productivity factors (in board feet per acre) <strong>for</strong> <strong>the</strong> HCAacreage and <strong>the</strong> acreage proposed <strong>for</strong> inclusion in <strong>the</strong> critical habitat in eachnational <strong>for</strong>est and BLM district. These factors were used to estimate <strong>the</strong>reductions in timber harvest (assuming that annual timber harvests would be,on average, equal to <strong>the</strong> amount available <strong>for</strong> sale) that would result from <strong>the</strong>DCAs proposed in <strong>the</strong> recovery plan. Productivity factors were adjusted toreflect differences in <strong>the</strong> proportion of land suitable <strong>for</strong> timber included in <strong>the</strong>DCAs as compared to <strong>the</strong> proportion in <strong>the</strong> HCAs in each <strong>for</strong>est. In addition toestablishing <strong>the</strong> DCAs, <strong>the</strong> draft recovery plan would impose restructions ontimber harvest on federal lands outside <strong>the</strong> DCAs, an area called <strong>the</strong> matrix.The draft recovery plan guidelines <strong>for</strong> management of <strong>the</strong> matrix are quitesimilar to those of <strong>the</strong> ISC strategy. For purposes of making preliminaryestimates of <strong>the</strong> effects of <strong>the</strong> draft recovery plan, it was assumed that it wouldhave similar effects on timber harvest within <strong>the</strong> matrix, a reduction of about0.7 billion board feet per year.It is important to note that <strong>the</strong> estimated reductions in future timber harvestare based upon <strong>the</strong> assumptions underlying <strong>the</strong> baseline estimates of <strong>the</strong>harvest under <strong>the</strong> final plans. In general, factors that would tend to reduce <strong>the</strong>harvest under <strong>the</strong>se plans also would tend to reduce <strong>the</strong> harvest under <strong>the</strong>draft recovery plan, reducing estimated harvest levels <strong>for</strong> both <strong>the</strong> baseline and<strong>the</strong> draft recovery plan. The estimated annual timber harvests <strong>for</strong> <strong>the</strong> finalplans, <strong>the</strong> current owl management regime (Forest Service and BLM implementationof <strong>the</strong> ISC strategy), and <strong>the</strong> effect of <strong>the</strong> Endangered Species Act including<strong>the</strong> designation of critical habitat, and <strong>the</strong> recovery plan are in Table H.9.To provide better estimates of <strong>the</strong> timber harvests under <strong>the</strong> recovery plan, <strong>the</strong>Forest Service and BLM will be asked during <strong>the</strong> public comment period toestimate <strong>the</strong> annual timber harvest levels under <strong>the</strong> recovery plan using <strong>the</strong>best site-specific in<strong>for</strong>mation on timber yields available.The estimated loss due to <strong>the</strong> timber harvest <strong>for</strong>egone in <strong>the</strong> DCAs is $470million per year. This estimate is based on <strong>the</strong> reduction in timber harvestcaused by withdrawal of <strong>the</strong> land in <strong>the</strong> DCAs and on estimates of 1995 timberprices developed by <strong>the</strong> Forest Service using <strong>the</strong> Timber Assessment MarketModel (TAMM) <strong>for</strong> conditions expected under <strong>the</strong> final plans (USDA 199 la).2. Estimating Employment Effects.Substantial ef<strong>for</strong>t has been made in recent years to develop techniques <strong>for</strong>estimating <strong>the</strong> employment effects of reductions in <strong>the</strong> rate of timber harvest.In its economic analysis of proposed critical habitat, <strong>the</strong> FWS, with assistancefrom <strong>the</strong> Forest Service, developed job response coefficients <strong>for</strong> use in estimating<strong>the</strong> employment effects of <strong>the</strong> designation of critical habitat <strong>for</strong> <strong>the</strong> owl.These coefficients were developed by <strong>the</strong> Forest Service using IMPLAN, aninput-output model that simulates <strong>the</strong> transactions between various sectors of<strong>the</strong> economy. Adjustments were made during <strong>the</strong> development of <strong>the</strong>se jobcoefficients to reflect <strong>the</strong> log flows among counties. Adjustments also weremade in <strong>the</strong> coefficients to remove <strong>the</strong> effects of <strong>the</strong> large metropolitan areasfrom <strong>the</strong> county coefficients. This was done to produce estimates of job lossesthat would measure <strong>the</strong> impacts within <strong>the</strong> rural regions whose economies aremost closely related to timber production. A more detailed description of <strong>the</strong>574
Table H.9. Comparison of federal timber available <strong>for</strong> harvest, 1995, withconservation areas and matrix rules.(Billions of board feet)Timber Harvest With Timber HarvestTimber Harvest Current With <strong>Recovery</strong> <strong>Plan</strong>**With Final <strong>Plan</strong>s <strong>Owl</strong> Management* (DCAs & Matrix)Washington Forest Service 0.72 0.26 0.25Oregon Forest Service 1.81 1.05 1.02Oregon BLM 1.19 0.68 0.67Oregon Subtotal 3.00 1.72 1.69Cali<strong>for</strong>nia Forest Service 0 . 5 0 a 0.21 0.21Cali<strong>for</strong>nia BLM 0.00 0.00 0.00Cali<strong>for</strong>nia Subtotal 0.50 0.21 0.21Salvage and Silviculture*** 0.13Three States Total 4.22 2.20 2.28Forest Service 3.02 1.52 1.57BLM 1.19 0.68 0.72aProjections Final <strong>for</strong>est plans have not been released.*Estimates based on U.S. Fish and Wildlife Service analysis of critical habitat.Assumes 56 percent of planned harvest in matrix is prohibited by listing under <strong>the</strong> Endangered Species Act and an additional 24 percent isprohibited in critical habitat outside of habitat conservation areas.-Estimates assume effects of recovery plan matrix guidelines will be <strong>the</strong> same as effects of current owl management outside of <strong>the</strong> ISC's habitatconservation areas plus Endangered Species Act.BLM will provide more precise estimate of matrix effects during draft recovery plan comment period.- Effects of limited silviculture and salvage in DCAs.DCAs = designated conservation areasBLM = USDI Bureau of Land Managementuse of <strong>the</strong> IMPLAN model and <strong>the</strong>se adjustments are provided in <strong>the</strong> FWSreport (USDI 1992). The resulting job coefficients generally fall in <strong>the</strong> middleof <strong>the</strong> range of o<strong>the</strong>r multipliers that have been used <strong>for</strong> estimating employmenteffects of changes in timber harvest. They are generally consistent with<strong>the</strong> results of <strong>the</strong> review of a number of such studies by Stevens (199 1).The FWS used <strong>the</strong>se job response coefficients to estimate <strong>the</strong> employmentlevels that would result from <strong>the</strong> timber harvests under <strong>the</strong> <strong>for</strong>est plans, <strong>the</strong>BLM and Forest Service implementation of <strong>the</strong> ISC strategy, and <strong>the</strong> EndangeredSpecies Act, including designation of critical habitat. To provide aconsistent analysis of <strong>the</strong> recovery plan, <strong>the</strong> same methods of analysis wereapplied to estimate its employment effects. Table H.3 shows <strong>the</strong> job coefficientsused in this estimation. Table H. 10 summarizes <strong>the</strong> estimated employmenteffects <strong>for</strong> various owl conservation plans. Table H. I 1 shows <strong>the</strong> employmenteffects of <strong>the</strong> draft recovery plan DCAs by county. It should be noted thatthose estimates do not reflect all of <strong>the</strong> employment effects within <strong>the</strong> threestates because large urban areas have been removed in developing <strong>the</strong> countyjob coefficients (see USDI 1992).575
Table H.10. Comparison of timber employment levels, 1995, related to federal timberharvest (with conservation areas and matrix).Timber Harvest With Timber HarvestTimber Harvest Current With <strong>Recovery</strong> <strong>Plan</strong>**With Final <strong>Plan</strong>s <strong>Owl</strong> Management* (DCAs & Matrix)Washington Forest Service 10,342 3,814 3,541Oregon Forest Service 29,754 17,478 17,075Oregon BLM 18,546 9,233 9,137Oregon Subtotal 48,300 26,711 26,212Cali<strong>for</strong>nia Forest Service 7,728a 3,434 3,478Cali<strong>for</strong>nia BLM 25 0 0Cali<strong>for</strong>nia Subtotal 7,753 3,434 3,478Salvage and Silviculture*** 1,770Three States Total 66,395 33,959 35,001Forest Service 47,824 24,726 25,377BLM 18,571 9,233 9,624"Projections. Final <strong>for</strong>est plans have not been released'Estimates based on U.S. Fish and Wildlife Service analysis of critical habitat.Assumes 56 percent of planned harvest in matrix is prohibited by listing under <strong>the</strong> Endangered Species Act and an additional 24 percent isprohibited in critical habitat outside of habitat conservation areas.-Estimates assume effects of recovery plan matrix guidelines will be <strong>the</strong> same as effects of current owl management outside of <strong>the</strong> ISc's habitatconservation areas plus Endangered Species ActBLM will provide more precise estimate of matrix effects during draft recovery plan comment penod.Effects of limited silviculture and salvage in DCAs.DCAs = designated conservation areasBLM USDI Bureau of Land Management5763. Estimating Wage Losses.Protection of owl habitat causes wage losses because reductions in <strong>the</strong> level ofemployment in <strong>the</strong> timber industry cause layoffs. People who lose <strong>the</strong>ir jobsare unemployed <strong>for</strong> a period, during which <strong>the</strong>y earn no income, and <strong>the</strong>n atleast some are reemployed, often at a lower wage. Some displaced workersgain reemployment within <strong>the</strong> timber industry, displacing o<strong>the</strong>r workers. Toestimate <strong>the</strong> wage losses due to implementation of <strong>the</strong> recovery plan, it isnecessary to estimate <strong>the</strong> number of workers that would be displaced eachyear, <strong>the</strong> period during which <strong>the</strong>y would be unemployed, and <strong>the</strong> wage level atwhich <strong>the</strong>y would be reemployed.Wage losses were estimated <strong>for</strong> <strong>the</strong> draft recovery plan and <strong>for</strong> o<strong>the</strong>r owlhabitat protection plans using <strong>the</strong> same methods used by <strong>the</strong> FWS in itsanalysis of <strong>the</strong> critical habitat designation. These estimates were based on <strong>the</strong>employment levels estimated <strong>for</strong> <strong>the</strong> annual harvest levels <strong>for</strong> <strong>the</strong> variousplans. To estimate <strong>the</strong> period of unemployment, <strong>the</strong> FWS assumed thatdisplaced workers will be reemployed over two years with 92 percent reemployedby <strong>the</strong> end of <strong>the</strong> first year after displacement and 8 percent at <strong>the</strong> end
I,Table H.1 1. State and county timber industry employment effects of withdrawingdesignated conservation areas (DCAs) from <strong>the</strong> timber base.1995 Employment LossesDue to DCAs1995 Direct JobsTimber and Wood Lost as Percent of 1989Products 1989 Total Direct Timber and Wood ProductsState/County Employment** Jobs Jobs EmploymentWashingtonChelan 360 336 201 56.Clallam 2,356 700 388 16.48Clark 5,171 14 8 *0.16Cowlitz 7,060 43 28 *0.39Grays Harbor 4,262 354 196 5.Jefferson 114 0 NA *0.King 9,049 45 23 *0.Kittitas 194 64 38 20.Klickitat 931 18 11 1.Lewis 2,626 1,233 746 28.Mason 1,456 134 78 5.Okanogan 1,286 129 87 7.Pierce 4,268 261 163 4.Skagit 1,177 42 27 2.Skamania 535 152 92 17.Snohomish 4,959 683 426 9.Thurston 1,481 0 *0.Whatcom 1,981 73 47 2.Yakima 2,097 0 *0.Washington Total 51,363 4,281 2,559 5.OregonBenton 1,496 21 11 1.Clackamas 3,460 382 257 7.Coos 2,547 209 121 5.Curry 929 505 283 30.Deschutes 3,428 40 25 1.Douglas 8,228 3,982 2,676 33.Hood River 532 177 120 23.Jackson 6,071 1,204 675 11.Jefferson 999 0 NA *0.Josephine 2,186 155 82 4.Klamath 3,769 352 219 6.Lane 11,314 2,967 1,616 14.Lincoln 496 33 18 4.Linn 5,557 751 409 7.Marion 3,430 569 321 9.Multnomah 3,974 55 33 1.Polk 880 4 2 *0.Tillamook 423 184 112 26.Wasco 326 139 94 29.Yamhill 1,621 0 NA *0.Oregon Total 61,666 11,729 7,075 11.Cali<strong>for</strong>niaDel Norte 478 NA NA *0.Glenn 47 NA NA *0.Humboldt 4,623 800 482 10.Lake 38 NA NA *0.Mendocino 3,142 68 43 1.Shasta 2,240 69 22 1.Siskiyou 1,618 584 187 12.Tehama 1,774 NA NA *0.Trinity 425 352 181 43.Cali<strong>for</strong>nia Total 14,385 1,873 914 6.Three-state Total 127,414 17,883 10,548 8.*Less than 1 percent.*'County timber and wood products employment generally has declined since 1989.NA = data not available.11 11 -. 1 ..... 11 ......... I.....577
of <strong>the</strong> second year. The same assumptions were used <strong>for</strong> <strong>the</strong> preliminaryestimates of wage losses due to <strong>the</strong> implementation of <strong>the</strong> draft recovery plan.The assumption that 92 percent of unemployed workers would be reemployedby <strong>the</strong> end of <strong>the</strong> first year was derived from general unemployment data (seeMead et al. 1990) and probably overstates <strong>the</strong> rate or reemployment of timberindustry workers displaced by permanent restrictions in timber harvest imposedto protect owl habitat. The wage losses from implementation of <strong>the</strong>recovery plan were estimated to be $1.42 billion. Wage losses <strong>for</strong> <strong>the</strong> currentregime (planned implementation of <strong>the</strong> ISC strategy, <strong>the</strong> effects of listing, and<strong>the</strong> critical habitat designation) were estimated to be $1.46 billion.4. Estimating <strong>the</strong> Economic Effects of SilviculturalPractices.The recovery plan provides <strong>for</strong> <strong>the</strong> use of silvicultural techniques in DCAs <strong>for</strong><strong>the</strong> purpose of promoting more rapid development of <strong>for</strong>est characteristicsfavorable to <strong>the</strong> owl in stands that do not currently have <strong>the</strong> characteristics ofsuitable habitat. In general, younger stands would be thinned in a mannerthat promotes more rapid development of larger trees and o<strong>the</strong>r structuralcharacteristics of suitable owl habitat. These techniques are described andevaluated in Appendix G.The implementation of silvicultural practices in DCAs is one of <strong>the</strong> features of<strong>the</strong> recovery plan with potential to reduce <strong>the</strong> undesirable economic effects ofprotecting owl habitat, particularly during <strong>the</strong> first decade. The direct economiceffects of silvicultural practices result from <strong>the</strong> equipment and laborcosts of silvicultural operations, such as thinning, and <strong>the</strong> removal of timberfrom younger stands that can be sold commercially.There are also important indirect effects that could be of significant benefit over<strong>the</strong> long run. It appears that properly designed silvicultural treatments will beable to significantly shorten <strong>the</strong> time needed <strong>for</strong> <strong>the</strong> development of suitablehabitat in regenerated <strong>for</strong>ests. Such practices would mean that stands wouldprovide suitable habitat <strong>for</strong> owls <strong>for</strong> a longer period of time. If widely appliedover many decades, particularly in concert with longer rotations and selectiveharvest techniques, it may be possible to evolve a <strong>for</strong>est landscape to support aviable owl population with much less reduction in timber harvests than o<strong>the</strong>rwisewould be needed.The variable that most strongly affects <strong>the</strong> economic benefits of silviculturaltreatments is <strong>the</strong> percent of timber that is removed and sold commercially.The thinning prescriptions specify <strong>the</strong> density of <strong>the</strong> stand in trees per acreafter thinning. The design of <strong>the</strong> treatment identifies trees to be cut, leavingsufficient trees to meet <strong>the</strong> density standard. The design also will specify <strong>the</strong>percentage of such trees to be removed, left standing, and left on <strong>the</strong> ground.These design parameters will depend on <strong>the</strong> characteristics of <strong>the</strong> stand and<strong>the</strong> requirements specified <strong>for</strong> promoting <strong>the</strong> development of suitable owlhabitat.If no timber is removed during thinning, <strong>the</strong>n <strong>the</strong> costs of <strong>the</strong> treatment willnot be offset by timber revenues and will need to be borne by agency budgets.Employment will result from <strong>the</strong> thinning itself, but not from hauling or millingof timber. As <strong>the</strong> amount of timber removed during thinning is increased, <strong>the</strong>revenues increase and <strong>the</strong> employment in hauling and milling logs increases.For each stand, <strong>the</strong>re is a breakeven point which depends on costs of operatingon that site, <strong>the</strong> transportation costs, <strong>the</strong> diameter of <strong>the</strong> trees to be removed,and <strong>the</strong> price of logs. Above <strong>the</strong> breakeven point, <strong>the</strong> silvicultural treatment iscommercially viable and could be per<strong>for</strong>med under a contract in which <strong>the</strong>578
proceeds from sale of <strong>the</strong> timber removed cover <strong>the</strong> costs. Any surplus wouldbe bid away to <strong>the</strong> benefit of <strong>the</strong> government if such contracts were auctionedlike timber sales.Estimates of <strong>the</strong> costs and returns of various silvicultural practices in varioustypes of stands were developed by Chadwick Oliver of <strong>the</strong> University of Washington(Oliver 1991). The costs and returns per acre <strong>for</strong> various silviculturalsystems are in Table G. 1 of Appendix G. A typical regime is <strong>the</strong> low densitysystem <strong>for</strong> west side 30-year-old stands. This treatment calls <strong>for</strong> thinning to100 trees per acre at age 30 with subsequent removal of 20 trees per acre atage 50 and again at age 70. The total undiscounted costs with no removal oftimber are estimated to be about $340 per acre and <strong>the</strong> returns (above costs) ifall thinned threes are removed are estimated to be about $7,165 per acre.Although relatively few trees are removed in <strong>the</strong> second and third thinnings,most of <strong>the</strong> returns result from sale of that timber since <strong>the</strong> trees removed aremuch larger. If <strong>the</strong> costs and returns from thinning at ages 50 and 70 arediscounted to present value at <strong>the</strong> time of <strong>the</strong> first thinning using an 8 percentdiscount rate, <strong>the</strong> costs with no removal become $53 per acre and <strong>the</strong> returnswith full removal become $1,109 per acre. In addition, it was estimated thatimplementing this prescription uses, on average, about 3.64 person-years peracre and could produce a maximum of about 3,833 board feet per acre.For purposes of estimating <strong>the</strong> potential economic effects of silviculturalpractices within DCAs, <strong>the</strong> costs and returns <strong>for</strong> <strong>the</strong> low density system on 30-year-old stands shown in Table G. 1 of Appendix G were assumed to be <strong>the</strong> endpoints of a linear relationship starting at 0 percent and ending at 100 percent.It was assumed that 50 percent of <strong>the</strong> thinned trees would be removed onaverage.Estimates of <strong>the</strong> acreage in DCAs that would be an appropriate target <strong>for</strong> suchpractices were developed by using estimates of unsuitable habitat acres inDCAs from <strong>the</strong> <strong>Recovery</strong> Team's GIS (geographic in<strong>for</strong>mation system). Unsuitablehabitat in <strong>the</strong> DCAs accounts <strong>for</strong> nearly 2.5 million acres. Since only* those stands of age 30 to 40 years or less than 11 inches dbh would makegood targets, in<strong>for</strong>mation on <strong>the</strong> age and size distribution of stands in <strong>the</strong>national <strong>for</strong>ests and O&C lands was used to determine <strong>the</strong> percentage ofunsuitable habitat likely to be an appropriate age during <strong>the</strong> 1990s (USDA1991b,c,d, and USDI 1990). For purposes of estimating <strong>the</strong> economic effects ofsilvicultural treatments, it was assumed that 15 percent of unsuitable habitaton Forest Service lands and 30 percent on BLM lands would be appropriate <strong>for</strong>silvicultural treatment. The resulting target acreage is about 450,000 acres.Implementation of silvicultural practices to promote development of suitableowl habitat will be <strong>the</strong> responsibility of <strong>the</strong> land management agencies, <strong>the</strong>BLM and Forest Service. The rate of treatment of <strong>the</strong> target acreage willdepend on administrative and budgetary factors that <strong>the</strong> <strong>Recovery</strong> Teamcannot accurately anticipate. To show <strong>the</strong> range of potential economic effectsfrom an aggressive program of silvicultural treatment to a go-slow approach,various assumptions were made regarding <strong>the</strong> percent of target acreage thatwould be treated in each year during <strong>the</strong> first decade of <strong>the</strong> recovery planimplementation.Estimates <strong>for</strong> <strong>the</strong> employment and economic gains from a program of silviculturaltreatment in DCAs are in Table H. 12. The economic gains are substantial.Even under <strong>the</strong> assumption that only 50 percent of <strong>the</strong> thinned trees willbe removed, a program treating 50,000 acres per year would yield about 100million board feet per year and create net benefits of more than $26 million peryear. The employment created by such a program also could be significant,about 600 jobs. It is important to note, however, that <strong>the</strong> wages <strong>for</strong> thinning579
are generally much lower than <strong>for</strong> commercial harvest and that migrantlaborers often are used <strong>for</strong> such work. If <strong>the</strong> employment created by a silviculturalprogram is to benefit workers displaced from <strong>the</strong> harvesting timber,employment preferences may need to be made a requirement of <strong>the</strong> contractslet <strong>for</strong> such work.5. Estimating <strong>the</strong> Economic Effects of Salvage.As described in section III, <strong>the</strong> recovery plan allows limited salvage within <strong>the</strong>DCAs. Forest Service and BLM timber salvage sales averaged more than 650million board feet per year during <strong>the</strong> 1980s. A rough estimate of <strong>the</strong> economiceffects of allowing salvage was made by assuming an annual potential salvageof 600 million board feet total, of which <strong>the</strong> DCAs would contain approximatelyone third. The guidelines <strong>for</strong> salvage in DCAs are set <strong>for</strong>th in section III. C. Itwas assumed that <strong>the</strong> guidelines would allow 10 to 20 percent of <strong>the</strong> potentialsalvage, leaving <strong>the</strong> rest of <strong>the</strong> dead trees to contribute to maintenance ofhabitat conditions. Annual salvage in DCAs could yield 20 to 40 million boardfeet. The total job coefficients <strong>for</strong> <strong>the</strong> timber counties range from eight to justmore than 17 jobs per million board feet, averaging 15.7. At <strong>the</strong> average totaljob coefficient, salvage in DCAs could support 315 to 630 workers.6. Estimating <strong>the</strong> Effects on County Revenues.In its analysis of <strong>the</strong> effects of <strong>the</strong> critical habitat designation, <strong>the</strong> FWS developedmethods to estimate <strong>the</strong> price effect of restrictions in timber harvest andits effect on <strong>the</strong> federal receipts from <strong>the</strong> remaining timber volume. The FWSalso worked with <strong>the</strong> Forest Service and BLM to develop <strong>the</strong> computationalmethods needed to allocate <strong>the</strong> estimated federal timber sale revenues to <strong>the</strong>counties with which federal receipts are shared. These methods were used toestimate <strong>the</strong> effects of <strong>the</strong> DCAs in <strong>the</strong> recovery plan on <strong>the</strong> timber revenuesthat would be received by <strong>the</strong> counties. These estimates are inTable H. 13.These preliminary estimates do not include <strong>the</strong> effects of asset losses on <strong>the</strong>tax bases of <strong>the</strong> counties.Table H.12. Economic effects of silviculture in designated conservation areas.TimberAcres Removed AnnualTreated Annually EconomicAnnually (million Employment Benefitboard feet) Uobs) ($mllilon)10,000 19 120 525,000 48 302 1350,000 96 600 26100,000 192 1200 53Target Acreage: 450,000 acres currently unsuitable <strong>for</strong> owl habitat580
(1 Table HA1 3. State and county revenue sharing effects of withdrawing designatedconservation areas (DCAs) from <strong>the</strong> timber base.1995 Revenue Percent 1988-89 1995 RevenueShare with 1995 Revenue 1995 Revenue County Share LostFinal <strong>Plan</strong>s Share With DCAs Share Budget' as PercentState/County ($hundred) ($hundred) Lost ($undred) of 1988-89 BudgetWashingtonChelan $3,602 $2,297 36.23 $14,523 8.99Clallam $1,957 $1,192 39.09 $18,543 4.13Clark $0 $0 0.00 $58,349 0.00Cowlitz $579 $507 12.44 $28,641 0.25Grays Harbor $1,314 $800 39.12 $19,059 2.70Jefferson $1,640 $998 39.15 $9,098 7.06King $991 $106 89.30 $489,751 0.18Kittitas $1,123 $640 43.01 $8,851 5.46Klickitat $193 $169 12.44 $8,047 0.30Lewis $5,810 $4,923 15.27 $25,587 3.47Mason $1,248 $760 39.10 $13,723 3.56Okanogan $2,196 $3,149 -43.40* $12,572 -7.58*Pierce $354 $38 89.27 $159,516 0.20Skagit $1,076 $116 89.22 $26,515 3.62Skamania $12,540 $10,982 12.42 $8,549 18.22Snohomish $1,806 $194 89.26 $111,247 1.45Thurston $0 0 0.00 40,806 0.00Whatcom $1,291 $139 89.23 $38,053 3.03Yakima $1,870 $646 65.45 $38,078 3.21Washington Total $39,590 $27,656 30.14OregonBenton $8,325 $6,566 21.13 $20,125 8.74Clackamas $21,242 $18,258 14.05 $98,221 3.04Columbia $5,484 $4,185 23.69 $9,434 13.77Coos $17,020 $12,740 25.15 $19,515 21.93Curry $16,872 $9,550 43.40 $13,323 54.96Deschutes $4,789 $3,070 36.02 $22,833 7.57Douglas $90,867 $73,501 19.11 $67,062 25.90Hood River $2,542 $2,744 -7.95 $7,166 -2.82Jackson $44,626 $34,089 23.61 $46,736 22.55Jefferson $823 $546 33.66 $4,285 6.46Josephine $36,867 $26,117 29.16 $27,870 38.57Klamath $15,340 $14,157 7.71 $35,896 3.30Lane $79,736 $72,299 9.33 $115,313 6.45Lincoln $9,043 $8,936 1.18 $21,343 0.50Linn $17,896 $17,274 3.48 $31,525 1.97Marion $7,833 $7,278 7.09 $68,306 0.81Multnomah $3,792 $3,175 16.27 $211,258 0.29Polk $5,819 $4,458 23.39 $11,344 12.00Tillamook $5,827 $5,539 4.94 $10,483 2.75Wasco $2,023 $2,184 -7.96 $13,260 -1.21Washington $1,677 $1,280 23.67 $119,133 0.33Yarnhill $3,115 $2,680 13.96 $18,313 2.38Oregon Total $401,567 $330,626 17.67Cali<strong>for</strong>niaColusa $404 $159 60.64 $17,840 1.37Del Norte $4,912 $2,472 49.67 $22,026 11.08Glenn $1,181 $466 60.54 $29,586 2.42Humbolt $6,144 $3,176 48.31 $91,724 3.24Lake $1,581 $624 60.53 $52,155 1.83Mendocino $1,093 $431 60.57 $166,058 0.40Shasta $3,109 $1,395 55.13 $115,323 1.49Siskiyou $8,178 $6,262 23.43 $45,310 4.23Tehama $1,304 $542 58.44 $40,697 1.87Trinity $9,819 $4,616 52.99 $26,697 19.49Cali<strong>for</strong>nia Total $37,725 $20,143 46.61Three-state Total $478,882 $378,425 79.02AProjectings. Final <strong>for</strong>est plans havbe not been released.;Estimates <strong>for</strong> Okanogan County Show a gain because <strong>the</strong> effect of a relatively small reduction in timber harvest Is offset by <strong>the</strong> increase in timber prices.'Data <strong>for</strong> some counties estimated from 1987-88 data.I .1 I - 1. - -- .... I- ,-- - .1-1- 1 ........................ .- - - - I 581
582
BibliographyBeuter, J.H. 1990. Social and economic impacts of spotted owl conservationstrategy. Forest Resources Technical Bulletin.Booth, D.E. 1989. Estimating prelogging old-growth in <strong>the</strong> pacific northwest.Journal of Forestry 87:25-29.Bray, M. and R.G. Lee. 1991. Federal <strong>for</strong>est revenue sharing with localgovernments in Washington, Oregon, and Cali<strong>for</strong>nia. The Northwest EnvironmentalJournal 7:35-70.Fortmann, L., J. Kusel, C. Danks, L. Moody, and S. Seshan. 1990. The humancosts of <strong>the</strong> Cali<strong>for</strong>nia <strong>for</strong>estry crisis. Presentation to The Concern <strong>for</strong>Sustainable Forests. Department of Forestry and Resource Management,University of Cali<strong>for</strong>nia, Berkeley.Greber, B.J., K.N. Johnson, and G. Lettman. 1990. Conservation plans <strong>for</strong><strong>the</strong> nor<strong>the</strong>rn spotted owl and o<strong>the</strong>r <strong>for</strong>est management proposals in Oregon:The economics of changing timber availability. Unpublished report ForestResearch Laboratory, College of Forestry, Oregon State University.Hamilton, T. et al. 1990. Economic effects of implementing a conservationstrategy <strong>for</strong> <strong>the</strong> nor<strong>the</strong>rn spotted owl. Unpublished report. USDA ForestService and USDI Bureau of Land Management, Portland, Oregon.Haynes, R.W. 1986. Inventory and value of old-growth in Douglas-fir region.USDA Forest Service Resource Note PNW-438. Portland, Oregon.Johnson, K.N., J. Beuter, B. Greber, G. Lettman, and J. Sessions. 1989.Timber <strong>for</strong> Oregon's tomorrow. The 1989 Update.Lee, R. G. 1990. Social and cultural implications of implementing a conservationstrategy <strong>for</strong> <strong>the</strong> nor<strong>the</strong>rn spotted owl. Unpublished Report. Mason,Bruce and Girard, Portland, Oregon.Lee, R. G. 1991. Moral exclusion and rural poverty: Myth management andwood products workers. Paper prepared <strong>for</strong> Rural Sociological Society, TaskForce on <strong>the</strong> Persistence of Rural Poverty.Lee, R.G., M.S. Carroll, and K.K. Warren. 1991. The social impact of timberharvest reductions in Washington state. Chapter 3 in P. Sommers and H.Birss, eds. Revitalizing <strong>the</strong> Timber Dependent Regions of Washington. FinalReport <strong>for</strong> <strong>the</strong> Washington Department of Trade and Economic Development.Northwest Policy Center, University of Washington.Lee, R.G., P. Sommers, H. Birss, C. Nasser and J. Zientek. 1991. Socialimpacts of alternative timber harvest reductions on federal lands in 0 and Ccounties. Final Report <strong>for</strong> <strong>the</strong> Association of 0 and C Counties. College ofForest Resources and Northwest Policy Center, University of Washington.Lippke, B., J.K. Gilles, P. Sommers, and R.G. Lee. 1990. Three-state impact ofspotted owl conservation and o<strong>the</strong>r timber harvest reductions: A cooperativeevaluation of <strong>the</strong> economic and social impacts, based on independent583
studies at University of Washington, University of Cali<strong>for</strong>nia, and OregonState University. Institute of Forest Resources, University of Washington.Mead, W.J., D.D. Muraoka, M. Schniepp, R.B. Watson, with assistance from J.Anderson. 1990. The economic consequences of preserving old growthtimber <strong>for</strong> spotted owls in Oregon and Washington. Community and OrganizationResearch Institute, University of Cali<strong>for</strong>nia, Santa Barbara, Cali<strong>for</strong>nia.Oliver C.D. 1991. Thinning and pruning 10 to 30-year-old plantations inwestern Washington: Investment, social, wood supply, and environmentalconsequences. Unpublished report.Stevens, B.J. 1991. Final report on <strong>the</strong> comparative evaluation of two majorstudies on <strong>the</strong> employment impacts of <strong>the</strong> ISC nor<strong>the</strong>rn spotted owl conservationstrategy on Washington, Oregon, and Cali<strong>for</strong>nia. Regional ScienceResearch Institute <strong>for</strong> American Forest Resource Alliance.Thomas, J.W., E.D. Forsman, J.B.Lint, E.C. Meslow, B.R.Noon, and J.Vemer.1990. A conservation strategy <strong>for</strong> <strong>the</strong> nor<strong>the</strong>rn spotted owl. InteragencyScientific Committee to Address <strong>the</strong> Conservation of <strong>the</strong> Nor<strong>the</strong>rn <strong>Spotted</strong><strong>Owl</strong>. USDA Forest Service, USDI Bureau of Land Management, Fish andWildlife Service, and National Park Service. Portland, Oregon. U.S. GovernmentPrinting Office 791-171/20026. Washington, D.C.USDA Forest Service. 1991 .b. Preliminary timber resource statistics <strong>for</strong> <strong>the</strong>Puget Sound area, Washington. Resource Bulletin PNW-RB- 179, Portland,Oregon.USDA Forest Service. 1991 .c. Preliminary timber resource statistics <strong>for</strong> <strong>the</strong>Olympic Peninsula, Washington. Resource Bulletin PNW-RB-178, Portland,Oregon.USDA Forest Service. 1991 .d. Preliminary timber resource statistics <strong>for</strong>southwest Washington. Resource Bulletin PNW-RB- 177, Portland, Oregon.USDI Bureau of Land Management. 1991. Age class distribution <strong>for</strong> HCAs.Unpublished data.USDI Fish and Wildlife Service. 1991. Economic analysis of designation ofcritical habitat <strong>for</strong> <strong>the</strong> nor<strong>the</strong>rn spotted owl. Department of <strong>the</strong> Interior,Washington, D.C.USDI Fish and Wildlife Service. 1992. Economic analysis of critical habitatdesignation effects <strong>for</strong> <strong>the</strong> nor<strong>the</strong>rn spotted owl.584
Appendix IEvaluation of Alternatives<strong>for</strong> Achieving <strong>Recovery</strong>585',585
586
IntroductionThis appendix presents <strong>the</strong> criteria and procedures that were used to delineate<strong>the</strong> designated conservation areas (DCAs) that <strong>for</strong>m one of <strong>the</strong> main buildingblocks of <strong>the</strong> Nor<strong>the</strong>rn <strong>Spotted</strong> <strong>Owl</strong> <strong>Recovery</strong> <strong>Plan</strong>. It also provides in<strong>for</strong>mationthat can be used to compare <strong>the</strong> effects on federal lands of <strong>the</strong> recovery planwith o<strong>the</strong>r plans proposed <strong>for</strong> conservation of nor<strong>the</strong>rn spotted owls or oldgrowth<strong>for</strong>ests. These plans include <strong>the</strong> Interagency Scientific Committeereport (Thomas et al. 1990) and two of <strong>the</strong> alternatives presented by <strong>the</strong>Scientific Panel on Late-Successional Forest Ecosystems (Johnson et al. 1991).Description of <strong>the</strong> <strong>Plan</strong>s ConsideredInteragency Scientific CommitteeThe Interagency Scientific Comimittee (ISC) proposed a series of reserves <strong>for</strong>nor<strong>the</strong>rn spotted owls and management guidelines <strong>for</strong> intervening <strong>for</strong>ests onfederal lands (Thomas et al. 1990). The reserves are called habitat conservationareas (HCAs). The design of <strong>the</strong> reserves was based on empirical in<strong>for</strong>mationon spotted owls and concepts and modeling from <strong>the</strong> field of conservationbiology. Criteria used to map <strong>the</strong> reserves are summarized here.Mapping criteriafrom <strong>the</strong> ISC report1. Map HCAs that will support a minimum of 20 currently known or estimatedpairs of spotted owls. Size of HCAs should be determined usingknown owl locations, density and median home range size, and sitespecificgeographic and topographic in<strong>for</strong>mation.2. Where HCAs cannot be made large enough to support 20 pairs owing tonatural or human-induced limitations, provide category 2 HCAs supportingtwo to 19 pairs. Again, determine size using known owl locations,density and median home range size, and site-specific geographic andtopographic in<strong>for</strong>mation.3. Provide <strong>for</strong> single-pair (category 3) HCAs where category 1 HCAs currentlycannot achieve objectives. Median home range size should be used todetermine target size.4. Space category 1 HCAs a maximum of 12 miles edge-to-edge andcategory 2 HCAs a maximum of 7 miles.5. Consider both currently and potentially suitable habitat in designating<strong>the</strong> area such that suitable habitat in <strong>the</strong> future will be as contiguous aspossible.6. The shape of areas should be as nearly circular as possible to minimizeperimeter/area ratio.In addition to <strong>the</strong> HCA network, <strong>the</strong> ISC report recommended management ofintervening <strong>for</strong>ests under <strong>the</strong> 50-11-40 rule. This rule requires that 50 percentof <strong>the</strong> federal <strong>for</strong>ested area in each quarter-township be managed to maintainan average dbh of at least 11 inches and canopy closure of at least 40 percent.This same matrix management rule was proposed <strong>for</strong> all o<strong>the</strong>r options discussedhere. The effects of <strong>the</strong> 50-11-40 rule are not included in this evaluation.587
Most significant late successionallold-grwth<strong>for</strong>estsThe Scientific Panel on Late-Successional Forest Ecosystems (Johnson et al.1991) proposed a series of alternatives <strong>for</strong> managing late successional <strong>for</strong>estsin <strong>the</strong> Pacific Northwest. One of <strong>the</strong>se (identified as alternative 5) wouldprotect <strong>the</strong> most ecologically significant blocks of old-growth <strong>for</strong>est remainingon federal lands. In developing this option, <strong>the</strong> panel simply mapped <strong>the</strong>existing units of old <strong>for</strong>ests with no attempt to provide a specific distribution ofthose blocks.Most signrficant late successional/old-growth <strong>for</strong>ests withowl additionsOnce <strong>the</strong> most significant old-growth acres had been mapped, <strong>the</strong> panelworked with members of <strong>the</strong> ISC to make additions that <strong>the</strong>n would meet <strong>the</strong>guidelines used in <strong>the</strong> HCA network. The resulting network contained all of<strong>the</strong> most significant old-growth areas with additional acres of spotted owlnesting, roosting, and <strong>for</strong>aging habitat that met <strong>the</strong> sizing and spacing criteriaused in <strong>the</strong> ISC report.<strong>Recovery</strong> team map (designated conservation areas)The Nor<strong>the</strong>rn <strong>Spotted</strong> <strong>Owl</strong> <strong>Recovery</strong> Team delineated a system of designatedconservation areas (DCAs) that were modifications of <strong>the</strong> habitat conservationareas (HCAs). The overall objective of remapping was to provide a level ofprotection in DCAs at least as high as that provided by ISC mapping whileincreasing <strong>the</strong> biological and economic efficiency of <strong>the</strong> network and effectivelyproviding <strong>for</strong> o<strong>the</strong>r species. Attempts were made to streng<strong>the</strong>n <strong>the</strong> DCAnetwork in areas where deficiencies were identified in <strong>the</strong> HCA network. Thefundamental sizing and spacing criteria from <strong>the</strong> ISC report were appliedduring mapping of <strong>the</strong> DCAs. Additional criteria used during this ef<strong>for</strong>t follow.1. Areas were mapped to include as much superior habitat and as many owllocations as possible to achieve a highly effective and efficient network.Where more effective (i.e., more owl locations or better habitat) acres wereadded to DCAs, opportunities were sought to drop less effective areas sototal area did not increase.2. DCA boundaries were adjusted to accommodate o<strong>the</strong>r species' sites wherethis adjustment could be made without significantly increasing <strong>the</strong>economic impact of <strong>the</strong> DCA or significantly decreasing its effectiveness inowl conservation.3. Areas were mapped to include as high a proportion of reserved land ando<strong>the</strong>r land unsuited <strong>for</strong> timber production as possible where consistentwith mapping criteria from <strong>the</strong> ISC report.4. Where possible, DCA boundaries were modified to place acres capable offull timber yield back into <strong>the</strong> timber base and replace <strong>the</strong>m in <strong>the</strong> DCAwith acres from which only partial yields were expected because of <strong>for</strong>estplan allocations.5. In areas where <strong>the</strong> existing network was deficient, attempts were made toprovide <strong>for</strong> new owl clusters and populations with <strong>the</strong> least possibleeconomic impact.5886. Where possible, boundaries were refined to avoid conflict with o<strong>the</strong>reconomic development proposals.
The process of mapping DCAs was organized by <strong>Recovery</strong> Team members andinvolved biologists from <strong>the</strong> state wildlife management agencies; biologists andtimber managers from each of <strong>the</strong> affected national <strong>for</strong>ests; and biologists andtimber managers from each of <strong>the</strong> affected BLM districts. Maps used in thisprocess included most or all of <strong>the</strong> following <strong>for</strong> each national <strong>for</strong>est and BLMdistrict:* <strong>Spotted</strong> owl location maps,* <strong>Spotted</strong> owl nesting, roosting, and <strong>for</strong>aging habitat maps,* Maps of lands suitable <strong>for</strong> timber harvest,* National <strong>for</strong>est land management plan allocation maps,* BLM timber production capability maps,* Sensitive soils maps,* ISC habitat conservation area maps,* Maps of o<strong>the</strong>r old <strong>for</strong>est-associated species and streams with fish at risk(see Appendix D),* Base maps at a scale of 1/2-inch to <strong>the</strong> mile.Documentation was developed to explain why changes were or were not madeto HCA boundaries in <strong>the</strong> process of developing <strong>the</strong> DCAs. This documentationincluded additions and deletions of acres of suitable nesting, roosting, and<strong>for</strong>aging habitat; acres of land suitable <strong>for</strong> timber production: known spottedowl sites: sites of o<strong>the</strong>r old <strong>for</strong>est-associated species; and acres of various landallocations.Evaluation of <strong>the</strong> OptionsThe options described earlier were evaluated by <strong>the</strong> <strong>Recovery</strong> Team to assess<strong>the</strong>ir relative biological efficiency. Economic efficiency also was assessed <strong>for</strong><strong>the</strong> DCA and HCA networks as described in Appendix H. Evaluations onlyassess effects that can be judged from federal lands. A detailed evaluation ofnonfederal lands was not done because <strong>the</strong>re was no overall mapping done <strong>for</strong>recovery options on nonfederal lands.Biological efficiency of <strong>the</strong> options was evaluated based on <strong>the</strong>ir success inmeeting <strong>the</strong> mapping criteria specified earlier and <strong>the</strong> biological principlesdiscussed in section III.B. Specific criteria <strong>for</strong> judging <strong>the</strong> options were:1. The number of designated areas that currently contain at least 20 knownpairs of owls, and thus have high likelihood of persisting <strong>for</strong> at least 100years.2. The number of designated areas that contain sufficient potential habitatto be able to support 20 pairs of owls in <strong>the</strong> future.3. The total number of acres of nesting, roosting, and <strong>for</strong>aging habitatincluded in designated areas.4. The total number of known pairs of owls included in designated areas.5. Nearest-neighbor distances of <strong>the</strong> designated areas. Complete in<strong>for</strong>mationon nearest-neighbor distances is not available at this time so is notincluded.6. The number of sites <strong>for</strong> o<strong>the</strong>r old <strong>for</strong>est-associated species and miles ofstreams included in designated areas.In<strong>for</strong>mation from <strong>the</strong> geographic in<strong>for</strong>mation system (GIS) data base was used589
to evaluate options. In<strong>for</strong>mation in this base included acres of nesting, roostingand <strong>for</strong>aging habitat data <strong>for</strong> most federal lands (see Appendix J); knownlocations <strong>for</strong> owl pairs verified during <strong>the</strong> period 1986 through 1990: landssuitable <strong>for</strong> timber production <strong>for</strong> all national <strong>for</strong>ests and BLM districts; landsthat have been reserved from timber harvest by Congressional authority; landownership data; and locations of o<strong>the</strong>r old <strong>for</strong>est-associated species (seeAppendix D).The evaluations are presented in Tables 1.1 to 1. 11. Tables 1.1 through 1.4present summary in<strong>for</strong>mation <strong>for</strong> each strategy. This includes: 1) total federalacres included in <strong>the</strong> strategy; 2) <strong>the</strong> number of those acres that are reservedfrom timber harvest by Congressional action; 3) <strong>the</strong> number of acres, o<strong>the</strong>rwisesuitable <strong>for</strong> timber production, that are included in conservation areas; 4) <strong>the</strong>number of acres of spotted owl nesting, roosting, and <strong>for</strong>aging (NRF) habitat; 5)<strong>the</strong> percent of <strong>the</strong> conservation areas composed of NRF habitat; and 6) <strong>the</strong>number of spotted owl pair locations confirmed inside <strong>the</strong> boundaries of <strong>the</strong>areas between 1986 and 1990. These data are divided by state and individualfederal agency.Tables 1.5 through 1.7 present in<strong>for</strong>mation on <strong>the</strong> size of conservation areasincluded in each of <strong>the</strong> options. Numbers shown are <strong>the</strong> numbers of areasthat fall into each of a series of size class categories. Again, only federal landsare tallied in <strong>the</strong>se tables. Tables 1.8 through 1.10 show a frequency distributionof conservation areas <strong>for</strong> each strategy based on <strong>the</strong> number of spotted owlpair locations. Table I. 11 shows <strong>the</strong> number of sites of o<strong>the</strong>r old <strong>for</strong>est-associatedspecies included in conservation areas <strong>for</strong> each of <strong>the</strong> strategies.Tables 1. 1 through 1.4 show that DCAs contain approximately 275,000 moreacres of NRF habitat than do <strong>the</strong> HCAs. Approximately 120 more owl pairshave been located in <strong>the</strong> DCAs than in <strong>the</strong> HCAs. Approximately 80,000 moreacres suitable <strong>for</strong> timber production are contained in DCAs than in HCAs. Themost significant late successional/old-growth (LSOG) areas contain about 100and 200 fewer known pair locations than do <strong>the</strong> HCAs and DCAs respectively.However, this figure is somewhat misleading since reserved lands were notmapped into <strong>the</strong>se units. If known pair locations in reserved lands were addedto <strong>the</strong> tally <strong>for</strong> <strong>the</strong> LSOG units, <strong>the</strong> total would be very close to that observed<strong>for</strong> <strong>the</strong> HCAs. However, under <strong>the</strong> LSOG strategy, fewer of <strong>the</strong>se owls would becontained in large, contiguous conservation areas. NRF habitat acres in <strong>the</strong>LSOGs are fewer than in <strong>the</strong> HCA or DCA mapping. Again, this figure ismisleading because reserves were not mapped into <strong>the</strong> LSOGs. The addition ofNRF habitat acres from reserves would increase <strong>the</strong> tally <strong>for</strong> LSOGs, but few of<strong>the</strong>se acres would be present within large, contiguous conservation areas. Themost significant late successional/old-growth with owl additions (LSOG + owladditions) contains more pair locations, more NRF habitat, and more acressuitable <strong>for</strong> timber production than <strong>the</strong> o<strong>the</strong>r three options. Thus, it is moreeffective <strong>for</strong> owls but is also a more costly option.The data in Tables 1.5 through 1.7 can be used to determine <strong>the</strong> approximatenumber of areas that might have <strong>the</strong> capability to support at least 20 pairs ofowls if habitat recovered in <strong>the</strong>se areas. Data from tables in Appendix Jsuggest that areas of approximately 40,000 to 50,000 acres in Oregon andCali<strong>for</strong>nia may develop <strong>the</strong> capability to support 20 pairs of owls. Areas of70,000 to 80,000 acres in Washington may develop this capability. Based on<strong>the</strong>se criteria, approximately 60 conservation areas would be capable of supportingat least 20 pairs of owls on federal lands in <strong>the</strong> future under both <strong>the</strong>HCA and DCA strategies. Approximately 50 such areas would be provided in<strong>the</strong> LSOG + owl additions strategy, and 40 areas in <strong>the</strong> LSOG strategy.590
Tables 1.8 through I. 10 clearly demonstrate <strong>the</strong> difficulty of finding areas thatcurrently support at least 20 pairs of owls on federal lands. This reflects <strong>the</strong>fragmented condition of owl populations and owl habitat in <strong>the</strong> landscape.Based on current owl locations in <strong>the</strong> GIS, 1 1 such areas are included in <strong>the</strong>DCA network; 9 in <strong>the</strong> HCA network; 18 in <strong>the</strong> LSOG + owl addition strategy;and 11 in <strong>the</strong> LSOG strategy. Again, it should be noted that <strong>the</strong>se numbersare based solely on GIS analysis and do not include updates that were made totables in Appendix J or tables presented in Thomas et al. (1990). Numberswere used straight from <strong>the</strong> GIS to provide <strong>the</strong> most valid basis <strong>for</strong> comparisonacross options.Table I. 11 presents in<strong>for</strong>mation on o<strong>the</strong>r species locations within each of <strong>the</strong>conservation area networks. The numbers of locations (nest sites, areas ofobservation) <strong>for</strong> bald eagles, marten, and fisher did not vary much among <strong>the</strong>different options. The number of goshawk nest sites varied from 82 to 122,and <strong>the</strong> largest number of <strong>the</strong>se sites was in <strong>the</strong> DCAs of <strong>the</strong> recovery plan.The number of occupied murrelet sites varied from 155 to 227, and <strong>the</strong> largestnumber of <strong>the</strong>se sites was in <strong>the</strong> DCAs of <strong>the</strong> recovery plan. The lowestnumber of occupied sites <strong>for</strong> murrelets was in <strong>the</strong> HCAs. Most of <strong>the</strong> additionalbenefits to murrelets occur on <strong>the</strong> Oregon coast where 60 murrelet siteswere in one DCA. The number of miles of streams with fish stocks at riskvaried from 1,189 <strong>for</strong> <strong>the</strong> late successional old-growth option to 2,118 <strong>for</strong> <strong>the</strong>HCAs. The DCAs of <strong>the</strong> recovery plan included 2,047 miles of stream with fishstocks at risk. Most of <strong>the</strong> stream reaches included in <strong>the</strong> options were in <strong>the</strong>upper parts of <strong>the</strong> drainages, and many of <strong>the</strong>se streams will likely requireadditional attention in <strong>the</strong> future.591
Q0Table 1.1. Estimated acres and owl locations <strong>for</strong> category 1, 2, and 3 habitat conservation areas (HCAs) under <strong>the</strong>ISC strategy.Total Reserved Timber NRF 1 PercentOwnership Acres Acres Acres Habitat Habitat PairsCALIFORNIAU.S. Forest Service 1,533,655 373,784 891,200 522,320 34.06 247National Park Service 115,310 115,310 0 . . 7U.S. Bureau of Land Management 161,466 . 161,466 . . 8Total federal 1,810,430 489,093 1,052,666 522,320 . 262OREGONU.S. Forest Service 1,936,761 468,202 947,440 1,031,080 53.24 378National Park Service 938 938 0 523 55.77U.S. Bureau of Land Management 806,335 6,069 806,335 353,000 43.78 274Total federal 2,744,034 475,209 1,753,775 1,384,603 49.10 652WASHINGTONU.S. Forest Service 2,302,110 475,882 943,960 1,174,400 51.01 242National Park Service 575,996 575,996 0 306,304 53.18 17O<strong>the</strong>r federal 79,188 0 0 0 0Total federal 2,957,293 1,051,877 943,960 1,480,704 50.10 259RANGEWIDEU.S. Forest Service 5,772,525 1,317,868 2,782,600 2,727,800 47.25 867National Park Service 692,243 692,243 0 306,827 44.32 24Bureau of Land Management 967,801 6,069 967,801 353,000 36.47 282O<strong>the</strong>r federal 79,188 0 0 0 0Total federal 7,511,757 2,016,180 3,750,401 3,387,627 1,17321 Nesting, roosting, and <strong>for</strong>aging2 28 additional owl pairs have been located on reserved lands outside <strong>the</strong> HCA networkDot (.) = unknown)
K/Table 1.2. Estimated acres and owl locations <strong>for</strong> category 1 and 2 designated conservation areas (DCAs) and reservedpair areas under <strong>the</strong> recovery plan strategy.Total Reserved Timber NRF 1 PercentOwnership Acres Acres Acres Habitat Habitat Pairs 2CALIFORNIAU.S. Forest Service 1,553,678 384,770 872,758 526,570 33.55 277National Park Service 115,312 115,312 0 . . 7U.S. Bureau of Land Management 119,646 0 119,646 . . 8Total federal 1,788,636 500,082 992,404 526,570 . 292OREGONU.S. ForestService 2,181,730 526,467 1,054,912 1,170,112 53.64 435National Park Service 872 872 0 510 58.49U.S. Bureau of Land Management 804,114 6,064 804,114 348,304 43.44 265Total federal 2,986,716 533,403 1,859,026 1,518,926 50.90 700WASHINGTONU.S. Forest Service 2,415,079 489,356 1,000,076 1,313,858 54.63 287National Park Service 568,570 568,570 0 304,020 53.47 17O<strong>the</strong>r Federal 79,188 0 0 0Total federal 3,062,837 1,057,927 1,000,076 1,617,878 52.80 304RANGEWIDEU.S. Forest Service 6,150,487 1,400,593 2,927,746 3,010,540 48.95 999National Park Service 684,754 684,754 . 304,530 44.47 24U.S. Bureau of Land Management 923,760 6,064 923,760 348,304 37.70 273O<strong>the</strong>r federal 79,188 0 0 0 0Total federal 7,838,189 2,091,412 3,851,506 3,663,374 . 1,29631 Nesting, roosting, and <strong>for</strong>aging2 These numbers are from <strong>the</strong> geographic in<strong>for</strong>mation system <strong>for</strong> comparison with o<strong>the</strong>r alternatives. Theymay not exactly equal numbers reported in main body of draft recovery plan because <strong>the</strong>y do not include adjustments madein <strong>the</strong> plan.3 28 additional pairs have been located in reserved lands outside of <strong>the</strong> DCA network and 19 additional pairslocated in managed pair areas.Dot (.) = unknown
soTable 1.3. Estimated acres and owl locations <strong>for</strong> <strong>the</strong> most significant old-growthon Late-Successional Forest Ecosystems.units mapped by <strong>the</strong> Scientific PanelTotal Reserved Timber NRF1 PercentOwnership Acres Acres Acres Habitat Habitat PairsCALIFORNIAU.S. Forest Service 1,003,734 0 738,880 381,080 37.97 198U.S. Bureau of Land Management 440 0 440Total federal 1,004,174 0 739,320 381,080 . 198OREGONU.S. Forest Service 1,917,730 0 1,147,840 1,037,080 54.08 457U.S. Bureau of Land Management 671,274 0 671,274 345,480 51.47 249Total federal 2,589,004 0 1,819,114 1,382,560 53.40 706WASHINGTONU.S. Forest Service 1,514,164 0 681,720 814,080 53.76 187Total federal 1,514,164 0 681,720 814,080 53.76 187RANGEWIDEU.S. Forest Service 4,435,628 0 2,568,440 2,232,240 50.33 842U.S. Bureau of Land Management 671,713 0 671,713 345,480 51.43 249Total federal 5,107,342 0 3,240,153 2,577,720 50.50 1,0912Nesting, roosting, and <strong>for</strong>aging2 131 additional pairs have been located in reserved lands outside <strong>the</strong> most significant old-growth units.Dot (.) = unknownA,~~~~~~~~~.. ... ..... /.. I/
Table 1.4. Estimated acres and owl locations <strong>for</strong> <strong>the</strong> most significant old-growth units plus owl additions mapped by<strong>the</strong> Scientific Panel on Late-Successional Forest Ecosystems.Total Reserved Timber NRF1 PercentOwnership Acres Acres Acres Habitat Habitat PairsCALIFORNIAU.S. Forest Service 1,551,686 380,269 869,240 549,000 35.38 252U.S. Bureau of Land Management 97,429 . 97,429 0 . 4Total federal 1,649,115 380,269 966,669 549,000 . 256OREGONU.S. Forest Service 2,776,300 477,863 1,390,760 1,450,760 52.26 554National Park Service 3,656 3,656 0 2,733 74.75U.S. Bureau of Land Management 722,410 0 722,410 337,440 46.71 251Total federal 3,502,366 481,519 2,113,170 1,790,933 51.10 805WASHINGTONU.S. Forest Service 2,397,937 322,849 1,039,760 1,211,640 50.53 259National Park Service 582,244 582,244 0 355,825 61.11 19Total federal 2,980,181 905,093 1,039,760 1,567,465 52.60 278RANGEWIDEU.S. Forest Service 6,725,923 1,180,981 3,299,760 3,211,400 47.75 1,065National Park Service 585,900 585,900 0 358,558 61.20 19U.S. Bureau of Land Management 819,839 0 819,839 337,440 41.16 255Total federal 8,131,662 1,766,881 4,119,599 3,907,398 . 1,33921 Nesting, roosting, and <strong>for</strong>aging2 54 additional owl pairs have been located in reserved lands outside of <strong>the</strong> most significant old-growth and owladdition unitsDot (.) = unknown.1. 11- . I -1.- - .",... .......... ", I .. I- - 111.I.." ......................... --- 1. I I - I -.. I I I ''I'll - I I Icn0l
01CDarTable 1.5. Size class distribution of conservation units under various spotted owl conservation strategies in <strong>the</strong> Stateof Cali<strong>for</strong>nia.Number of Conservation Areas By Size Class (In Acres)AlternativeLess than 10 to10 000 20.00020 to30.00030 to40.00040 to50 00050 to60 00060 to 'More than70.000 80.000TotalUnitsDCAHCALSOG+OWLLSOG514840276846532263113741440333236573848160461 No areas between 70,000 and 80,000 acres were located in Cali<strong>for</strong>niaDCA = designated conservation areaHCA = habitat conservation area delineated by ISCLSOG+OWL = most significant old-growth units plus owl additionsLSOG = most significant old-growth unitsI
4Table 1.6. Size class distribution of conservation units under various spotted owl conservation strategies in <strong>the</strong> Stateof Oregon..-.Number of Conservation Areas By Size Class (In Acres)Less than 10 to 20 to 30 to 40 to 50 to 60 to 70 to More than TotalAlternative 10.000 20.000 30,000 40.000 50.000 60000 70 80000 80.000 UnitsDCA 16 3 5 5 6 5 7 5 10 62HCA 6 4 2 3 4 7 8 6 8 48LSOG+OWL 43 8 4 3 8 4 3 1 14 88LSOG 65 19 8 4 7 3 6 4 5 121DCA = designated conservation areaHCA = habitat conservation area delineated by ISCLSOG+OWL = most significant old-growth units plus owl additionsLSOG = most significant old-growth units/KTable 1.7. Size class distribution of conservation units under various spotted owl conservation strategies in <strong>the</strong>State of Washington.Number Of Conservation Areas By Size Class (In Acres)Less than 10 to 20 to 30 to 40 to 50 to 60 to 70 to More than TotalAlternative 10.000 20.000 30.000 40.000 50.000 60.000 70.000 80.000 80.000 UnitsDCA 3 13 8 7 2 3 2 2 10 50HCA 4 10 4 4 3 2 2 2 11 42LSOG+OWL 15 11 4 7 3 3 1 1 8 53LSOG 25 19 9 7 4 2 2 1 1 70DCA = designated conservation areaHCA = habitat conservation area delineated by ISCLSOG+OWL = most significant old-growth units plus owl additionsLSOG = most significant old-growth units
Table 1.8. Frequency distribution of conservation areas based on number ofknown owl pair locations on federal land. Data are presented <strong>for</strong> various spottedowl conservation strategies <strong>for</strong> Cali<strong>for</strong>nia.Number of Areas that Fall Within Specified Ranges of Numbers of Known<strong>Owl</strong> Pair Locations (only owl locations on federal lands were tallied)Alternative 1 to 5 6 to 10 11 to 15 16 to 20 21 to 25 More than 25 Total'DCA 2 32 8 5 1 0 2 48HCA 28 8 3 2 0 2 43LSOG+OWL 17 4 2 1 2 3 29LSOG 22 4 3 1 1 1 32Only areas that contain known owl locations are reported in <strong>the</strong> table; totals do not equal <strong>the</strong> total number of areas.2 These numbers were taken directly from <strong>the</strong> geographic in<strong>for</strong>mation system <strong>for</strong> comparison with o<strong>the</strong>r options. They may not match numbersreported in <strong>the</strong> main body of <strong>the</strong> draft recovery plan because <strong>the</strong>y do not include adjustments made in <strong>the</strong> plan.DCA = designated conservation areaHCA = habitat conservation area delineated by ISCLSOG+OWL = most significant old-growth units plus owl additionsLSOG = most significant old-growth unitsTable 1.9. Frequency distribution of conservation areas based on number ofknown owl pair locations on federal land. Data are presented <strong>for</strong> various spottedowl conservation strategies <strong>for</strong> Oregon.Number of Areas that Fall Within Specified Ranges of Numbers of Known<strong>Owl</strong> Pair Locations (only owl locations on federal lands were tallied)Alternative 1 to5 6to10 11 to15 16to20 21 to25 Morethan 25 Total 1DCA 2 18 12 8 9 4 4 55HCA 14 9 7 11 3 3 47LSOG+OWL 40 8 8 6 3 8 73LSOG 59 13 11 3 4 5 951 Only areas that contain known owl locations are reported in <strong>the</strong> table; totals do not equal <strong>the</strong> total number of areas.2 These numbers were taken directly from <strong>the</strong> geographic in<strong>for</strong>mation system <strong>for</strong> comparison with o<strong>the</strong>r options. They may not match numbersreported in <strong>the</strong> main body of <strong>the</strong> draft recovery plan because <strong>the</strong>y do not include adjustments made in <strong>the</strong> plan.DCA = designated conservation areaHCA = habitat conservation area delineated by ]SCLSOG+OWL = most significant old-growth units plus owl additionsLSOG = most significant old-growth units598
Table 1.10. Frequency distribution of conservation areas based on number ofknown owl pair locations on federal land. Data are presented <strong>for</strong> various spottedowl conservation strategies <strong>for</strong> Washington.Number of Areas that Fall Within Specified Ranges of Numbers of Known<strong>Owl</strong> Pair Locations (only owl locations on federal lands were tallied)Alternative 1 to 5 6 to 10 11 to 15 16 to 20 21 to 25 More than 25 Total'DCA 2 28 11 3 1 0 1 44HCA 21 7 1 3 0 1 33LSOG+OWL 36 10 1 0 0 2 49LSOG 42 10 2 0 0 0 541 Only areas that contain known owl locations are reported in <strong>the</strong> table; totals do not equal <strong>the</strong> total number of areas.2 These numbers were taken directly from <strong>the</strong> geographic in<strong>for</strong>mation system <strong>for</strong> comparison with o<strong>the</strong>r options. They may not match numbersreported in <strong>the</strong> main body of <strong>the</strong> draft recovery plan because <strong>the</strong>y do not include adjustments made in <strong>the</strong> plan.DCA = designated conservation areaHCA = habitat conservation area delineated by ISCLSOG+OWL = most significant old-growth units plus owl additionsLSOG = most significant old-growth units........, . - .- I - -- -... 111.11.11, I ----- - ........ ....-.................................. I.." , -11 I................ I., I ... 11. 1 ... 1. .. -Table 1.11. Number of locations of o<strong>the</strong>r species and miles of streams (with fishstocks at risk) in different conservation options <strong>for</strong> <strong>the</strong> nor<strong>the</strong>rn spotted owl.ISpeciesConservation Bald Miles ofStrategy Eagle Fisher Goshawk Marten Murrelet StreamsDCA 40 37 122 60 227 2,047HCA 45 38 111 51 155 2,118LSOG+OWL 40 40 114 63 205 1,968LSOG 33 32 82 49 177 1,189DCA = designated conservation areaHCA = habitat conservation area delineated by ISCLSOG+OWL = most significant old-growth units plus owl additionsLSOG = most significant old-growth units599
Literature CitedThomas, J.W., E.D. Forsman, J.B. Lint, E.D. Meslow, B.R. Noon, and J.Verner. 1990. A conservation strategy <strong>for</strong> <strong>the</strong> nor<strong>the</strong>rn spotted owl.Report of <strong>the</strong> Interagency Scientific Committee to address <strong>the</strong> conservationof <strong>the</strong> nor<strong>the</strong>rn spotted owl. U.S. Forest Service, U.S. Fish andWildlife Service, U.S. Bureau of Land Management, and National ParkService, Portland, Oregon, U.S. Government Printing Office 1990-79 1-171/20026.Johnson, K.N., J.F. Franklin, J.W. Thomas, and J. Gordon. 1991. Alternatives<strong>for</strong> management of late-successional <strong>for</strong>ests of <strong>the</strong> Pacific Northwest.A report to <strong>the</strong> Agriculture Committee and <strong>the</strong> Merchant Marine andFisheries Committee of <strong>the</strong> U.S. House of Representatives. 59 pages.600
Appendix JDesignated Conservation Areas(Size of <strong>the</strong> Areas and Numbersof Nor<strong>the</strong>rn <strong>Spotted</strong> <strong>Owl</strong>s)601
602
IntroductionThis appendix presents detailed in<strong>for</strong>mation on <strong>the</strong> individual designatedconservation areas (DCAs). Tables show <strong>the</strong> size of <strong>the</strong> areas, <strong>the</strong> currentcondition of habitat within <strong>the</strong>m, <strong>the</strong> current number of known nor<strong>the</strong>rnspotted owls, and projections of <strong>the</strong> near-term and future capability of <strong>the</strong>seareas to support owls. The tables are based on data stored in <strong>the</strong> geographicin<strong>for</strong>mation system (GIS) at <strong>the</strong> Oregon State Service Center in Salem, Oregon.The map of DCAs used to produce <strong>the</strong>se tables was developed by <strong>the</strong> <strong>Recovery</strong>Team as described in Appendix I. The map was digitized <strong>for</strong> <strong>the</strong> GIS and <strong>the</strong>nanalyzed in conjunction with ownership maps, suitable habitat maps, andmaps of owl locations.Figures are given <strong>for</strong> acres of nesting, roosting, and <strong>for</strong>aging (NRF) habitat in<strong>the</strong> DCAs. The areas identified as NRF habitat include acres that are suitable<strong>for</strong> some or all of <strong>the</strong> spotted owl's life needs. In<strong>for</strong>mation on habitat wasavailable <strong>for</strong> all national <strong>for</strong>ests, all BLM districts in Oregon, and <strong>for</strong> nationalparks in Oregon and Washington. Habitat in<strong>for</strong>mation was not available <strong>for</strong>o<strong>the</strong>r federal lands or nonfederal lands.NRF habitat mapping on national <strong>for</strong>ests was based on regional criteria thatwere refined by local biologists on <strong>the</strong> <strong>for</strong>ests. Thus, <strong>the</strong> criteria varied fromlocation to location (USDA 1988; USDA 1992). Habitat mapping on BLM landswas based on a standard set of criteria that was modified at <strong>the</strong> local levelbased on <strong>the</strong> site-specific knowledge of biologists. NRF habitat <strong>for</strong> nationalparks in Oregon and Washington was identified from an analysis of Landsatdata completed in 1991 <strong>for</strong> <strong>the</strong> Forest Service. Acres identified as suitable NRFhabitat had <strong>the</strong> following characteristics: canopy closure equal to or greaterthan 70 percent: tree species including Douglas-fir, western hemlock, andPacific silver fir; predominant tree dbh of 21 inches or greater; and developmentof a second canopy layer.Known owl locations were identified from data bases supplied by <strong>the</strong> WashingtonDepartment of Wildlife, <strong>the</strong> Cali<strong>for</strong>nia Department of Fish and Game, and<strong>the</strong> Oregon Department of Fish and Wildlife. For all three states, owl pairs andindividuals that had been verified from 1986 through 1990 were tallied.The remaining pieces of in<strong>for</strong>mation, current projected and future projectedowl pairs, were based on calculations. The current projected" number is anestimate of <strong>the</strong> number of pairs of owls that <strong>the</strong> DCA would be expected tosupport if <strong>the</strong> population stabilized with current habitat conditions. The"future projected" number is an estimate of <strong>the</strong> number of pairs of owls that<strong>the</strong> DCA might support at a future time if 80 percent of <strong>the</strong> area were composedof NRF habitat. For "current projected" and "future projected," estimateswere made <strong>for</strong> federal lands and <strong>for</strong> federal and nonfederal lands combined.This does not suggest a commitment to provide habitat on those nonfederallands, but shows <strong>the</strong> habitat potential of <strong>the</strong> area if nonfederal lands were tocontribute fully to recovery.The calculations used to estimate <strong>the</strong> number of owl pairs that could besupported in a given DCA were refinements of techniques originally used byThomas et al. (1990). The refinements are described in USDA (1992). Briefly,<strong>the</strong> calculations are based on:- The proportion of a landscape that is NRF habitat,- The relationship between <strong>the</strong> size of <strong>the</strong> annual home range of an owl pairand <strong>the</strong> percentage of that home range in NRF habitat,603
- The overlap of home ranges among adjacent pairs of owls,- A correction <strong>for</strong> expected long-term occupancy of sites based on <strong>the</strong>influence of local population size and proportion of suitable habitat in <strong>the</strong>landscape.Two regressions were developed to relate <strong>the</strong> size of annual pair home rangesto <strong>the</strong> proportion of area in NRF habitat. One was based on data from Washingtonand <strong>the</strong> second was based on data from Oregon and Cali<strong>for</strong>nia combined.The Washington regression was:home range (acres) = 18,364-(17,607 x proportion habitat)For Cali<strong>for</strong>nia and Oregon, <strong>the</strong> regression was:home range (acres) = 8,688-(7,054 x proportion habitat)The proportion habitat term in <strong>the</strong>se equations varies from zero to one.Calculated home ranges were reduced by 30 percent to account <strong>for</strong> overlap ofadjacent spotted owl pairs.The following procedure was used to calculate <strong>the</strong> estimated number of pairsthat could be supported in a DCA given current habitat conditions. These are<strong>the</strong> figures reported as current projected pairs in <strong>the</strong> tables.1. GIS in<strong>for</strong>mation was used to determine <strong>the</strong> total size of <strong>the</strong> DCA and <strong>the</strong>current proportion of NRF habitat.2. The proportion of NRF habitat was used in <strong>the</strong> regression equations tocalculate home range size. The regression result was reduced by 30percent to account <strong>for</strong> home range overlap.3. The resulting home range size was divided into <strong>the</strong> total DCA size todetermine <strong>the</strong> number of potential pair sites in <strong>the</strong> DCA.4. The estimated pair sites were adjusted <strong>for</strong> <strong>the</strong> proportion that would likelyremain occupied over time using an updated table from Thomas et al.(1990). This table was updated by Voss and Noon (pers. comm.) andpredicts <strong>the</strong> number of sites that would remain occupied over time givenan initial number of locally interacting pairs and <strong>the</strong> proportion of <strong>the</strong>area in NRF habitat. For <strong>the</strong> estimate of current projected pairs, it wasassumed that populations in DCAs were still part of a larger interactingpopulation, i.e., that <strong>the</strong>re is still an owl population in <strong>the</strong> matrix thatinteracts with <strong>the</strong> population in <strong>the</strong> DCA. The occupancy correctionfactor <strong>for</strong> <strong>the</strong>se projections reflected this assumption.The same basic procedure was used to estimate future projected pairs. Forthis calculation, it was assumed that 80 percent of <strong>the</strong> DCA would exist asNRF habitat at some future point in time. The assumption of 80 percentreflects (1) an assumption that not all area in any DCA is capable of supportingNRF habitat, and (2) an assumption that natural disturbances always wouldmaintain some portion of <strong>the</strong> <strong>for</strong>ests in each DCA in younger age classes. Italso was assumed that <strong>the</strong> DCA would operate as a cluster at least partiallyisolated from o<strong>the</strong>r populations since o<strong>the</strong>r habitat surrounding <strong>the</strong> DCAwould be managed <strong>for</strong> dispersal ra<strong>the</strong>r than <strong>for</strong> breeding pairs of owls. There<strong>for</strong>e,<strong>the</strong> correction factor used in <strong>the</strong> occupancy table was based on <strong>the</strong>number of pair sites calculated <strong>for</strong> <strong>the</strong> area (see step 3 in <strong>the</strong> previous discussion).Once <strong>the</strong> calculations were complete, <strong>the</strong> current projected and future projectednumbers were fur<strong>the</strong>r refined by state agency biologists based on localknowledge of site conditions.604
Abbreviations and Definitions Used inTables J. 1. through J. 11.BLM = lands managed by <strong>the</strong> U.S. Bureau of Land ManagementNFS = lands in <strong>the</strong> national <strong>for</strong>ests managed by <strong>the</strong> U.S. Forest ServiceNPS = lands in <strong>the</strong> national parks managed by <strong>the</strong> National Park ServiceOTHER FED = o<strong>the</strong>r federal lands; national wildlife refuges; Department ofDefense Military ReservationsNRF = nesting, roosting, and <strong>for</strong>aging habitat <strong>for</strong> spotted owlsCurrent projected = an estimate of <strong>the</strong> number of pairs of owls that <strong>the</strong> DCAwould be expected to support if <strong>the</strong> population stabilized with current habitatconditions. This number may be ei<strong>the</strong>r higher or lower than <strong>the</strong> currentknown, due to lack of survey in<strong>for</strong>mation or recent loss of habitat in <strong>the</strong>vicinity, respectively. Current known numbers of owls may be artifically highdue to displacement from surrounding habitat which was harvested recently orbecause of its proximity to source populations.Future projected = an estimate of <strong>the</strong> number of pairs of owls that <strong>the</strong> DCAmight support in <strong>the</strong> future if DCAs were composed of 80 percent NRF habitat.This estimate includes nonfederal lands within <strong>the</strong> DCA boundaries. This doesnot suggest a commitment to provide habitat on those nonfederal lands. Seesection III.C.4. <strong>for</strong> discussion of management of <strong>the</strong>se lands.Note that owl numbers with <strong>the</strong> tables are split only by federal and nonfederalownership. Specific numbers <strong>for</strong> each category of federal ownership are notshown.Table J.1. Acreage and owl numbers <strong>for</strong> designated conservation areas in <strong>the</strong> OlympicPeninsula province.<strong>Owl</strong> NumbersDCA Land Acreage Known Known Current FutureIdent. Status NRF Total Pairs Singles Projected ProjectedWD-36 NFS 219,360 439,390NPS 227,159 381,025TOTAL FED 446,519 820,415 84 14 124 193TOTAL - 847,086 86 14 124 193WD-45 NPS - 35,439TOTAL FED - 35,439 5 1 8 8TOTAL - 35,439 5 1 8 8PROVINCE TOTAL FED 855,854 89 15 132 201PROVINCE TOTAL - 882,525 91 15 132 201aThe difference between TOTAL FED and TOTAL is nonfederal lands within <strong>the</strong> perimeter of designated conservation areas. Management of <strong>the</strong>se landsis discussed in <strong>the</strong> individual province narratives (section 111.). Values shown as '-' indicate an unknown number.605
Table J.2. Acreage and owl numbers <strong>for</strong> <strong>the</strong> designated conservation area in <strong>the</strong>western Washington lowlands province.a<strong>Owl</strong> NumbersDCA Land Acreage Known Known Current FutureIdent. Status NRF Total Pairs Singles Projected ProjectedWD-43 OTHER FED - 79,188TOTAL FED - 79,188 0 0 0 21TOTAL - 81,590 0 0 0 21PROVINCE TOTAL FED 79,188 0 0 0 21PROVINCE TOTAL - 81,590 0 0 0 21aThe difference between TOTAL FED and TOTAL is nonfederal lands within <strong>the</strong> permeter of designated conservation areas. Management of <strong>the</strong>se landsis discussed in <strong>the</strong> individual province narratives (section 111.). Values shown as "-" indicate an unknown number.I/I - - I - .1.- 11. I 11 - .......................................... I ...- ...- l- ,606
Table J.3. Acreage and owl numbers <strong>for</strong> designated conservation areas in <strong>the</strong> westernWashington Cascades province.a<strong>Owl</strong> NumbersDCA Land Acreage Known Known Current FutureIdent. Status NRF Total Pairs Singles Projected ProjectedIWD-1NFSTOTAL FEDTOTAL92,28092,280147,312147,312153,63115 1 2316 1 244141WD-2NFSTOTAL FEDTOTAL83,24083,240111,669111,669111,75614 0 2514 0 253131WD-2NNFSTOTAL FEDTOTAL33,56033,56048,20248,20252,2398 0 108 0 101212WD-2WNFSTOTAL FEDTOTAL10,040 16,11210,040 16,112- 16,7813 03 03322WD-3NFSNPSTOTAL FEDTOTAL73,52029,775103,295132,39338,961171,354175,41416 0 2316 0 234545WD-4NFSNPSTOTAL FEDTOTAL49,2806,72156,00199,00110,260109,260133,30410 1 1412 1 163036WD-8NFSTOTAL FEDTOTAL44,12044,12084,36084,36087,9456 1 116 1 112424WD-9NFSNPSTOTAL FEDTOTAL57,48076858,248100,8841,042101,925104,21110 0 1410 0 142828WD-10NFSTOTAL FEDTOTAL14,88014,88032,35832,35854,7374 14 157814continues-607
continuedDCA Land AcreageIdent. StatusNRF Total<strong>Owl</strong> NumbersKnown Known CurrentPairs Singles ProjectedFutureProjectedWD-1ilNFSNPSTOTAL FEDTOTAL1,1203,7104,8306,6975,76212,45912,5351 01 01111WD-17NESTOTAL FEDTOTAL7,400 15,6487,400 15,648- 29,7401 01 03326WD-18NFSTOTAL FEDTOTAL11,880 25,17011,880 25,170- 27,3312 12 13355WD-19NFSTOTAL FEDTOTAL19,56019,56035,17635,17638,4041 51 57799WD-19WNFSTOTAL FEDTOTAL6,8406,84012,67312,67313,5172 02 03333WD-25NFSTOTAL FEDTOTAL17,320 30,75317,320 30,753- 31,2733 03 05588WD-26NFSTOTAL FEDTOTAL12,64012,64023,08123,08123,0813 03 04455WD-26WNFSTOTAL FEDTOTAL8,720 14,2488,720 14,248- 14,3102 02 03333WD-27NFSTOTAL FEDTOTAL16,76016,76032,67132,67133,3604 14 15588WD-27SNFSTOTAL FEDTOTAL6,4806,4809,2859,2859,6771 01 02222continues-608
continuedDCAIdent.LandStatusAcreageNRF Total<strong>Owl</strong> NumbersKnown Known CurrentPairs Singles ProjectedFutureProjectedWD-28NFSTOTAL FEDTOTAL51,36051,36076,71876,71876,9256 2 146 2 142020WD-29NFSTOTAL FEDTOTAL18,840 26,39218,840 26,392- 26,4142 02 05555WD-30NFSTOTAL FEDTOTAL9,520 14,4239,520 14,423- 14,4244 04 04433WD-31NFSNPSTOTAL FEDTOTAL19,20022319,42327,01629227,30827,3861 01 05566WD-32NFSNPSTOTAL FEDTOTAL18,92015719,07737,48725837,74537,9952 02 04499WD-34NFSNPSTOTAL FEDTOTAL1,92025,99227,91212,18475,47687,66087,6980 00 0771010WD-35NPSTOTAL FEDTOTAL5,4355,43514,44314,44314,4480 00 02222PROV TOT FED 759,661 1,318,405 121PROVINCE TOTAL 1,408,536 12412 20512 210322338aThe difference between TOTAL FED and TOTAL is nonfederal lands within <strong>the</strong> perimeter of designated conservation areas. Management of <strong>the</strong>se landsis discussed in <strong>the</strong> individual province narratives (section 111.). Values shown as "-" indicate an unknown number.I ............ I....I -- I Ill" ". "..,.,... I....................... ... ......... 11- 1-609
Table J.4. Acreage and owl numbers <strong>for</strong> designated conservation areas in <strong>the</strong>eastern Washington Cascades provincesa<strong>Owl</strong> NumbersDCA Land Acreage Known Known Current FutureIdent. Status NRF Total Pairs Singles Projected ProjectedWD-1NNFESTOTAL FEDTOTAL25,640 34,19725,640 34,197- 34,5256 06 08888WD-5NFESTOTAL FEDTOTAL33,24033,24053,56053,56088,1369 2 1 11 2 131424WD-6NESTOTAL FEDTOTAL54,520 85,85354,520 85,853- 92,26312 1 1612 1 172426WD-7NESTOTAL FEDTOTAL58,96058,960102,030102,030112,0527 1 157 1 162831WD-12N FSTOTAL FEDTOTAL29,280 62,22629,280 62,226- 64,4398 08 0881616WD-14NFESTOTAL FEDTOTAL3,5203,52011,29411,29411,3052 02 02222WD-15NFESTOTAL FEDTOTAL33,40033,40050,73350,73352,1672 03 0991313WD-16NFESTOTAL FEDTOTAL31,640 44,80431,640 44,804- 60,6398 68 69141116WD-20NFSTOTAL FEDTOTAL9,120 24,9049,120 24,904- 26,6683 03 03355WD-21NFSTOTAL FEDTOTAL4,680 17,5524,680 17,552- 24,5726 06 06655WD-22NFSTOTAL FEDTOTAL1,680 7,5541,680 7,554- 11,1072 02 02222WD-23NFSTOTAL FEDTOTAL6,440 11,3026,440 11,302- 13,2221 02 02233continues-610
continued-DCA LandIdent. StatusAcreageNRF Total<strong>Owl</strong> NumbersKnown Known CurrentPairs Singles ProjectedFutureProjectedWD-24NFSTOTAL FEDTOTAL37,76037,76068,53768,53768,5445 0 106 0 101818WD-33NFSNPSTOTAL FEDTOTAL1,5204.0805,60011,86041,05252,91255,1762 02 0661010WD-37NFSTOTAL FEDTOTAL1,400 16,3691,400 16,369- 16,9351 01 022WD-38NFSTOTAL FEDTOTAL3,040 23,8783,040 23,878- 23,8783 03 044WD-39NFSTOTAL FEDTOTAL1,920 11,4801,920 11,480- 11,4801 01 022WD-40NFSTOTAL FEDTOTAL4,880 20,1044,880 20,104- 20,1041 01 022WD-41NFSTOTAL FEDTOTAL3,480 12,8033,480 12,803- 12,8031 01 022WD-42NFSTOTAL FEDTOTAL11,200 26,24511,200 26,245- 26,2453 03 055WD-44NFSTOTAL FEDTOTAL3,000 9,9623,000 9,962- 9,9621 01 011PROV TOT FEDPROVINCE TOTAL364,400 748,299 84 5 120- 836,222 85 5 129176196aThe difference between TOTAL FED and TOTAL is nonfederal lands within <strong>the</strong> perimeter of designated conservation areas. Management of<strong>the</strong>se lands is discussed in <strong>the</strong> individual province narratives (section 111.) Values shown as '-" indicate an unknown number.-- l- -,...I-- ,.....-.... 11J611
Table J.5. Acreage and owl numbers <strong>for</strong> designated conservation areas in <strong>the</strong> OregonCoast Range province.aN'<strong>Owl</strong> NumbersDCA Land Acreage Known Known Current FutureIdent. Status NRF Total Pairs Singles Projected ProjectedOD-27 BLM 27,320 51,832TOTALFED 27,320 51,832 15 2 12 20TOTAL - 77,749 16 3 13 30OD-28 BLM 26,720 48,486TOTALFED 26,720 48,486 19 7 15 20TOTAL - 70,663 24 10 18 27OD-29 NFS 18,480 24,870BLM 9,880 16,472TOTALFED 28,360 41,343 9 2 10 15TOTAL - 50,636 10 2 10 18OD-30 BLM 15,760 34,034TOTALFED 15,760 34,034 14 1 10 12TOTAL - 59,934 18 3 13 23OD-31 NFS 21,840 41,353BLM 9,920 18,141TOTALFED 31,760 59,494 14 3 14 20TOTAL - 70,555 14 4 14 25OD-32 NFS 4,600 8,297BLM 10,400 21,578TOTALFED 15,000 29,874 5 1 5 10TOTAL - 39,894 5 1 5 16OD-33 NFS 6,560 15,771BLM 3,080 20,814TOTALFED 9,640 36,586 5 0 5 12TOTAL - 60,175 5 0 5 23OD-34 NFS 24,600 44,328BLM - 350TOTALFED 24,600 44,678 7 1 7 15TOTAL - 50,661 7 1 7 18OD-35 NFS 17,360 40,889BLM 440 3,707TOTALFED 17,800 44,595 3 2 3 15TOTAL - 51,780 3 2 3 18continues-612
continued-DCAIdent.LandStatusAcreageNRF Total<strong>Owl</strong> NumbersKnown Known CurrentPairs Singles ProjectedFutureProjectedOD-36NFSBLMTOTAL FEDTOTAL5,1604,6009,72014,89838,52053,41870,2123301331825OD-37BLMTOTAL FEDTOTAL2,920 26,7802,920 26,780- 46,239240133716OD-38BLMTOTAL FEDTOTAL1,2401,2404,8324,8328,94211111113OD-49BLMTOTAL FEDTOTAL800 2,925800 2,925- 22,35211001118OD-50BLMTOTAL FEDTOTAL240 8,733240 8,733- 51,05022419OD-53NFSTOTAL FEDTOTAL38,440 77,82238,440 77,822- 86,00412123033OD-54BLMTOTAL FEDTOTAL2,640 4,9042,640 4,904- 8,5091123OD-55BLMTOTAL FEDTOTAL200 1,446200 1,446- 2,7130011PROV TOT FED 253,160 571,782PROVINCE TOTAL828,06811012528 10439 111203306aThe difference between TOTAL FED and TOTAL is nonfederal lands within <strong>the</strong> perimeter of designated conservation areas.is discussed in <strong>the</strong> individual province narratives (section Ill). Values shown as - indicate an unknown number.Management of <strong>the</strong>se landsI .11,11'', I ...... 11 1. 11 I613
Table J.6. Acreage and owl numbers <strong>for</strong> designated conservation areas in <strong>the</strong> westernOregon Cascades provincesa<strong>Owl</strong> NumbersDCA Land Acreage Known Known Current FutureIdent. Status NRF Total Pairs Singles Projected ProjectedOD-1iNFSTOTAL FED~TOTAL95,28095,280147,287147,287148,2999 5 309 5 304242iOD-3iiNFS~BLM~~TOTAL FEDTOTAL60,56060,560111,49210111,502111,71619 10 - 2319 10 233535OD-4NFSBLMTOTAL FEDTOTAL47,3603,48050,84070,49419,16889,66298,61013 4 2013 4 203032OD-5NFESTOTAL FEDTOTAL38,560 76,72338,560 76,723- 80,98223 4 2223 4 223031OD-6NFSBLMTOTAL FEDTOTAL33,80015,72049,52046,25329,17175,42481,25118 5 2518 5 253032OD-7NFSTOTAL FEDTOTAL40,28040,28062,98362,98367,24823 2 2323 2 233031OD-8NFSTOTAL FEDTOTAL78,48078,480103,787103,787103,79221 0 2521 0 252828OD-9NFSTOTAL FEDTOTAL40,48040,48084,20584,20584,37025 5 2525 5 253333OD-10NFSTOTAL FEDTOTAL43,60043,60080,08780,08780,08716 3 2016 3 203030I!OD-1ilNFSBLMTOTAL FEDTOTAL27,0001,72028,72056,2184,42660,64465,44422 2 2022 2 202526OD-12NFSBLMTOTAL FEDTOTAL32,28032,2804251,49351,53689,74129 1 2029 3 202333continues-614
continued-DCA LandIdent. StatusAcreageNRF Total<strong>Owl</strong> NumbersKnown Known CurrentPairs Singles ProjectedFutureProjectedOD-13NFSTOTALFEDTOTAL19,760 90,00919,760 90,009- 92,95627 1 2527 1 253535OD-14NFSBLMTOTALFEDTOTAL- 78,758200 263200 79,021- 82,09029 1 2530 1 253334OD-15NFSTOTALFEDTOTAL4,560 87,5604,560 87,560- 88,78916 2 1816 2 182525OD-17NFSBLMTOTALFEDTOTAL4,84015,12019,96010,87924,20635,08555,17424 5 1328 7 152025OD-18NFSNPSTOTALFEDTOTAL27,66551028,17563,13787264,00966,50420 2 1820 2 182525OD-19NFSTOTALFEDTOTAL39,26539,36580,55980,55986,43314 2 1414 2 142325OD-39BLMTOTALFEDTOTAL920 6,929920 6,929- 12,5042 02 01113OD-40BLMTOTALFEDTOTAL8,4408,44029,85429,85443,1226 16 1551014OD-56BLMTOTALFEDTOTAL360 1,752360 1,752- 2,9600 00 10011OD-57BLMTOTALFEDTOTAL440 1,602440 1,602- 2,6100 10 10011OD-58BLMTOTALFEDTOTAL560 1,444560 1,444- 2,6481 01 01111PROV TOT FEDPROVINCE TOTAL816,100 1,421,664 3571,547,330 36256 37361 375511542aThe difference between TOTAL FED and TOTAL is nonfederal lands within <strong>the</strong> perimeter of designated conservation areas. Management of <strong>the</strong>se landsis discussed in <strong>the</strong> individual province narratives (section 111.). Values shown as '-" indicate an unknown number.7,615
Table J.7. Acreage and owl numbers <strong>for</strong> designated conservation areas in <strong>the</strong> easternOregon Cascades province.a<strong>Owl</strong> NumbersDCA Land Acreage Known Known Current FutureIdent. Status NRF Total Pairs Singles Projected ProjectedOD-2NFSTOTAL FEDTOTAL51,20051,20074,15474,15474,55821 1 2121 1 212626OD-41NFSTOTAL FEDTOTAL4,5604,5608,8708,8709,8551 01 01122OD-42NFSTOTAL FEDTOTAL8,5208,52020,00020,00020,0004 04 04455OD-43NFSTOTAL FEDTOTAL7,8407,84028,64528,64529,3675 05 05566OD-44NFSTOTAL FEDTOTAL8,5608,56016,53216,53216,5324 04 04444OD-45NFSTOTAL FEDTOTAL4,2404,24018,01718,01718,2561 11 11133OD-51NFSTOTAL FEDTOTAL9,3209,32028,33228,33228,6017 07 07777OD-59NFSTOTAL FEDTOTAL20,78320,78339,61139,61141,85813 4 1313 4 1391818OD-60NFSTOTAL FEDTOTAL480 3,023480 3,023- 3,0231 01 01111OD-61NFSTOTAL FEDTOTAL720 3,001720 3,001- 3,0011 01 01111OD-62NFSTOTAL FEDTOTAL1,4001,4002,7052,7052,7051 01 01111OD-63NFSTOTAL FEDTOTAL800 2,137800 2,137- 3,0131 01 01111OD-64NFSTOTAL FEDTOTAL520 3,063520 3,063- 3,0631 01 01111OD-65NFSTOTAL FEDTOTALPROV TOT FEDPROVINCE TOTAL760760119,7032,4772,4773,028250,567256.8601 01620662 6aThe difference between TOTAL FED and TOTAL is nonfederal lands within <strong>the</strong> perimeter of designated conservation areas. Management of <strong>the</strong>se landsis discussed in <strong>the</strong> individual province narratives (section 111.). Values shown as I-" indicate an unknown number.116262117777616
Table J.8. Acreage and owl numbers <strong>for</strong> designated conservation areas in <strong>the</strong> OregonKlamath province. 8<strong>Owl</strong> NumbersDCA Land Acreage Known Known Current FutureIdent. Status NRF Total Pairs Singles Projected Projected-OD-16NFSBLMTOTALFEDTOTAL21,84021,8401,52440,37841,90185,37923 0 1723 1 172230OD-20bNFSBLMTOTALFEDTOTAL18,80060019,40060,10493161,03565,22515 3 1415 3 142324OD-21NFSBLMTOTALFEDTOTAL3,16025,20028,3607,82649,27757,10378,08613 3 1113 6 112027OD-22bNFSTOTALFEDTOTAL24,56024,56064,31364,31367,04719 9 1819 9 182323OD-23NFSTOTALFEDTOTAL52,84052,840129,460129,460130,4477 23 227 23 223030OD-24NFSBLMTOTALFEDTOTAL32039,44039,76093668,48869,42374,7716 1 156 1 152224OD-25NFSBLMTOTALFEDTOTAL33,0004,00037,00053,56010,42763,98771,13316 17 2017 17 202527OD-26BLMTOTALFEDTOTAL22,16022,16044,85044,85086,68414 2 1521 4 181530OD-52NFSBLMTOTALFEDTOTAL21,52012021,64037,39749237,88940,6542 9 132 9 131819CD-5This DCA crosses state boundaries; data are illustrated in Cali<strong>for</strong>nia Klamath province table (seeTable J.10.PROV TOT FED 267,560PROVINCE TOTAL -569,961699,42511512367 14573 148198234aThe difference between TOTAL FED and TOTAL is nonfederal lands within <strong>the</strong> perimeterof designated conservation areas. Management of <strong>the</strong>se landsis discussed in <strong>the</strong> individual province narratives (section 111.). Values shown as i- indicate an unknown number.b A portion of this DCA lies in <strong>the</strong> Cali<strong>for</strong>nia Klamath province; data illustrated here are <strong>for</strong> <strong>the</strong> entire DCA.
Table J.9. Acrea ?e and owl numbers <strong>for</strong> designated conservation areas in <strong>the</strong> Cali<strong>for</strong>niaCoast province.<strong>Owl</strong> NumbersDCA Land Acreage Known Known Current Futureident. Status NRF Total Pairs Singles Projected ProjectedICD-47NFSNPSTOTAL FEDTOTAL1,400 7,541- 6,133- 13,674- 32,3881 11 12437CD-48NPSTOTAL FEDTOTAL- 66,894- 66,894- 80,2500 00 010131417CD-50BLMTOTAL FEDTOTAL- 32,284- 32,284- 38,4552 32 310101213CD-52NPSTOTAL FEDTOTAL- 42,285- 42,285- 73,6441 91 141 1221 122;CD-53BLMTOTAL FEDTOTAL- 3,890- 3,890- 8,3060 10 22324CD-54BLMTOTAL FEDTOTAL- 977- 977- 1,5581 01 0111ICD-56BLMTOTAL FEDTOTAL- 2,269- 2,269- 2,2693 13 13333CD-57BLMTOTAL FEDTOTAL- 2,502- 2,502- 6,5740 10 134CD-58cBLMTOTAL FEDTOTAL- 1,145- 1,145- 1,2660 00 0111122CD-59BLMTOTAL FEDTOTAL- 2,759- 2,759- 5,3400 00 03345CD-60cBLMTOTAL FEDTOTAL- 1,693- 1,693- 2,8990 00 01133CD.61 cBLMTOTAL FEDTOTAL- 2,701- 2,701- 4,5761 01 01134CD-62cN FSBLMTOTAL FEDTOTAL-7- 1,390- 1,397- 2,6760 00 01122CD-63cBLMTOTAL FEDTOTAL- 2,299- 2,299- 2,970o 2o 21134continues-618
continued-DCA LandIdent. StatusAcreageNRF Total<strong>Owl</strong> NumbersKnown Known CurrentPairs Singles ProjectedFutureProjectedCD-65BLMTOTALFEDTOTAL7,4377,43710,6761 01 01122CD-66BLMTOTALFEDTOTAL8,6308,63012,9070 00 01157CD-67BLMTOTALFEDTOTAL- 6,722- 6,722- 8,0900 00 00022CD-69CBLMTOTALFEDTOTAL- 2,255- 2,255- 2,9790 00 01122CD-70cBLMTOTALFEDTOTAL- 1,616- 1,616- 2,5550 00 00012CD-73BLMTOTALFEDTOTAL3,6573,6574,6500 00 01122CD-74BLMTOTALFEDTOTAL6,9886,9887,7150 00 01133CD-75BLMTOTALFEDTOTAL4,5454,5456,9530 00 01122CD-76cBLMTOTALFEDTOTAL1,0691,0691,0690 00 01111CD-77CBLMTOTALFEDTOTAL- 1,649- 1,649- 1,8650 00 00000CD-78cBLMTOTALFEDTOTAL8958952,5000 00 01I11CD-80BLMTOTALFEDTOTAL- 3,222- 3,222- 3,5200 00 01122CD-201cBLMTOTALFEDTOTAL4343430 00 01100CD-202cBLMTOTALFEDTOTAL4264264260 00 01111OD-22This DCA crosses state boundaries; data are illustrated in Oregon Klamath province table.PROV TOT FEDPROVINCE TOTAL226,023 10 18 59329,122 10 24 76aThe difference between TOTAL FED and TOTAL is nonfederal lands within <strong>the</strong> perimeter of designated conservation areas. Managementof <strong>the</strong>se lands is discussed in <strong>the</strong> individual province narratives (section III ). Values noted as I-" indicate an unknown number.cRecommended as DCAs ra<strong>the</strong>r than reserved pair areas because <strong>the</strong>ir contribution is needed <strong>for</strong> long-term management.11 111- -., I I ..1.1 -....... I. .90118I/619
Table J.10. Acreage and owl numbers <strong>for</strong> designated conservation areas in <strong>the</strong>Cali<strong>for</strong>nia Klamath provincesa<strong>Owl</strong> NumbersDCA Land Acreage Known Known Current FutureIdent. Status NRF Total Pairs Singles Projected ProjectedCD-iNFSTOTAL FEDTOTAL42,24042,240103,977103,977104,9567 9 277 9 272828CD-2NFSTOTAL FEDTOTAL26,04026,04054,83554,83555,5969 5 219 5 212323CD-3NFSTOTAL FEDTOTAL14,20014,20036,02236,02238,03227 2 2827 2 282525CD-4NFSTOTAL FEDTOTAL35,84035,84059,88659,88662,98916 6 2216 6 222525CD-5dNFSTOTAL FEDTOTAL14,96014,96082,65982,65982,7648 4 258 4 252930CD-6NFSTOTAL FEDTOTAL13,00013,00047,51047,51047,55910 7 2010 7 202222CD-7N FSTOTAL FEDTOTAL1,8401,84013,54113,54114,1717 07 16688CD-8NFSTOTAL FEDTOTAL71,28071,280140,117140,117140,63023 5 4223 5 424444CD-9NFSTOTAL FEDTOTAL2,1202,1206,2816,2816,2991 21 22222CD-1N FSTOTAL FEDTOTAL17,52017,52053,34953,34956,01113 4 2113 4 212324CD-li1ENFSBLMTOTAL FEDTOTAL27,5604027,60088,2287,72295,95197,5679 5 229 5 232425CD-1 1W NFSTOTAL FEDTOTAL44,32044,32095,19595,19595,90812 6 2612 6 262828CD-12NFSTOTAL FEDTOTAL17,40017,40051,92251,92254,9288 5 218 5 212324CD-13NFSTOTAL FEDTOTAL24,08024,08039,76139,76143,7957 3 167 3 162021continues-620
<strong>Owl</strong> NumbersKnown Known CurrentPairs Singles ProjectedFutureProjectedCD-14CD-15NFSBLMTOTALFEDTOTALNFSBLMTOTALFEDTOTAL4,0404,04034,4805,60040,08027,2403627,27630,042103,0467,375110,421112,6944 14 15512 9 2912 9 29773133CD-16NFSTOTALFEDTOTAL13,68013,68064,98764,98766,3716 9 226 9 222424CD-17CD-18NFSTOTALFEDTOTALNFSTOTALFEDTOTAL6,0006,0008,6008,60032,61532,61533,59748,81048,81050,2213 53 52 32 3771414CD-19CD-20NFSBLMTOTALFEDTOTALNFSTOTALFEDTOTAL5,5205,5201,8801,88024,13518024,31527,5639,1019,1019,7584 24 24 04 06834CD-21CD-23NFSTOTALFEDTOTALNFSTOTALFEDTOTAL5,4405,4402,7602,76024,97224,97225,4657,0747,0747,1452 12 12 32 37744CD-24NFSTOTALFEDTOTAL1,3601,3603,3833,3833,3831 01 01CD-25NFSTOTALFEDTOTAL1,6801,6804,1874,1874,2181 01 011CD-26NFSTOTALFEDTOTAL360 922360 922- 1,7161 01 01111CD-27NFSTOTALFEDTOTAL480 1,867480 1,867- 2,2621 01 01111CD-29NFSBLMTOTALFEDTOTAL4,9601,2006,16021,2461,10022,34626,6132 42 46678continued-DCA Land AcreageIdent. StatusNRF Totalcontinues-621
continued-DCA LandIdent. StatusAcreageNRF Total<strong>Owl</strong> NumbersKnown Known CurrentPairs Singles ProjectedFutureProjectedCD-30NFSTOTALFEDTOTAL3,0003,00011,21211,21213,1871 01 03345CD-31NFSTOTALFEDTOTAL7,8407,84031,32731,32740,1913 03 1891517CD-32NFSTOTALFEDTOTAL2,2802,2806,9286,9289,8113 04 02334CD-33NFSTOTALFEDTOTAL760 3,987760 3,987- 4,1330 00 00022CD-34NFSTOTALFEDTOTAL240 2,440240 2,440- 3,1381 01 01122OD-20This DCA crosses state boundaries; data are illustrated in Oregon Klamath province table.PROV TOT FED 457,800 1,319,755PROVINCE TOTAL - 1,370,292210 100211 102411415464479aThe difference between TOTAL FED and TOTAL is nonfederal lands within <strong>the</strong> perimeter of designated conservation areas. Management of <strong>the</strong>se landsis discussed in <strong>the</strong> individual province narratives (section 111.). Values shown as i-" indicate an unknown number.dDCA crosses state boundaries; data reflect acreage and owls <strong>for</strong> entire DCA.11. 1111.1111, 1- 111, ............ 1.111.111, 1.11,I/Table J.1 1. Acreage and owl numbers <strong>for</strong> designated conservation areas in <strong>the</strong>Cali<strong>for</strong>nia Cascades provincea6222<strong>Owl</strong> NumbersDCA Land Acreage Known Known Current FutureIdent. Status NRF Total Pairs Singles Projected ProjectedCD-28 NFS 5,160 34,310BLM 80 161TOTALFED 5,240 34,471 7 0 5 7TOTAL - 41,356 7 0 5 7CD-35 NFS 2,160 13,222BLM - 8TOTALFED 2,160 13,230 0 1 1 2TOTAL - 13,992 0 1 1 2CD-36 NFS 1040 2,096TOTALFED 1040 2,096 0 0 0 0TOTAL - 2,133 0 0 1 1CD-37 NFS 240 5,647TOTALFED 240 5,647 1 0 1 2TOTAL - 5,710 1 0 1 2CD-38 NFS 2,560 9,556TOTALFED 2,560 9,556 0 1 1 3TOTAL - 9,982 0 1 1 4continues-
DCAIdent.CD-39CD-40CD-41CD-42CD-43CD-44CD-45CD-101CD-102CD-103CD-104CD-105CD-1 06CD-107CD-108CD-109LandStatusNFSTOTALFEDTOTALNFSTOTALFEDTOTALNFSTOTALFEDTOTALNFSTOTALFEDTOTALNFSTOTALFEDTOTALNFSTOTALFEDTOTALNFSTOTALFEDTOTALNFSTOTALFEDTOTALNFSTOTALFEDTOTALNFSTOTALFEDTOTALNFSTOTALFEDTOTALNFSTOTALFEDTOTALNFSTOTALFEDTOTALNFSTOTALFEDTOTALNFSTOTALFEDTOTALNFSTOTAL FEDTOTALAcreageNRF Total880 3,674880 3,674- 3,722640 2,202640 2,202- 2,4191,2001,20022,92022,9201,1201,1202,9202,9203,8403,8403,1173,1173,60064,66364,66370,98513,59013,59014,44210,43010,43011,09521,32721,32738,644- 1,788- 1,788- 1,913400 2,831400 2,831- 3,03240 2,65640 2,656- 2,699440 1,350440 1,350- 2,881240 1,117240 1,117- 1,267800 1,994800 1,994- 1,9942,2402,2402,7782,7788,880240 2,489240 2,489- 2,560200 1,689200 1,689- 1,910<strong>Owl</strong> NumbersKnown Known CurrentPairs Singles Projected0 00 01 01 01 01 00011115 4 105 5 122 22 22 02 01 21 20 00 01 11 10 00 00 10 10 10 10 10 11 01 01 01 00 00 13322441111111111FutureProjected001111121544335611111111111 1111101111101continued-continues-623
-DCAIdent.LandStatusAcreageNRF Total<strong>Owl</strong> NumbersKnown Known CurrentPairs Singles ProjectedFutureProjectedCD-110 NFS 640 2,880TOTAL FED 640 2,880 0 1 1 1TOTAL - 2,881 0 1 1 1continuediiICD-111 NFS 320 2,587TOTAL FED 320 2,587 0 0 1 1TOTAL - 2,881 0 0 1 1PROV TOT FED 50,320 208,162 23 15 39 50PROVINCE TOTAL - 244,978 23 17 43 57aThe difference between TOTAL FED and TOTAL is nonfederal lands within <strong>the</strong> perimeter of designated conservation areas. Management of <strong>the</strong>se landsis discussed in <strong>the</strong> individual province narratives (section 111.). Values shown as '-" indicate an unknown number.......-- ......... ..... I..Literature CitedThomas, J.W., E.D. Forsman, J.B. Lint, E.C. Meslow, B.R. Noon, and J. Verner.1990. A conservation strategy <strong>for</strong> <strong>the</strong> nor<strong>the</strong>rn spotted owl. Report of <strong>the</strong>Interagency Scientific Committee to address <strong>the</strong> conservation of <strong>the</strong> nor<strong>the</strong>rnspotted owl. U.S. Forest Service, U.S. Fish and Wildlife Service, U.S. Bureauof Land Management, and National Park Service, Portland, Oregon, U.S.Government Printing Office 1990: 791-171/20026.USDA, Forest Service. 1988. Final supplement to <strong>the</strong> environmental impactstatement <strong>for</strong> an amendment to <strong>the</strong> Pacific Northwest regional guide. USDAForest Service, Pacific Northwest Region. Portland, Oregon.USDA, Forest Service. 1992. Final environmental impact statement on management<strong>for</strong> nor<strong>the</strong>rn spotted owls in national <strong>for</strong>ests. USDA Forest Service,Pacific Northwest Region. Portland, Oregon.624
Appendix K<strong>Recovery</strong> Team Membersand Activities625
626
The <strong>Recovery</strong> TeamTeam MembersThe <strong>Recovery</strong> Team is made up of 18 members appointed by Secretary of <strong>the</strong>Interior Manuel Lujan Jr. The members include biologists, ecologists, <strong>for</strong>esters,economists, federal <strong>for</strong>est and wildlife managers, and representatives of<strong>the</strong> governors of <strong>the</strong> three affected states.Secretary Lujan directed <strong>the</strong> <strong>Recovery</strong> Team to develop a recovery plan <strong>for</strong> <strong>the</strong>nor<strong>the</strong>rn spotted owl, giving appropriate consideration to <strong>the</strong> needs of o<strong>the</strong>rspecies and economic effects (see pages 639-641).The <strong>Recovery</strong> Team began its work in March 1991. It held numerous meetings,as a team and in smaller committees working on specific matters such asconsideration of o<strong>the</strong>r species, potential economic and social effects, currentmanagement and regulations, silviculture, and o<strong>the</strong>r topics. Members visited awide variety of owl habitats and <strong>for</strong>ests in <strong>the</strong> three states, including lands in<strong>the</strong> Mt. Hood, Willamette, and Six Rivers National Forests, Olympic NationalPark, <strong>the</strong> BLM Eugene District, <strong>the</strong> Yakima Indian Reservation, Oregon'sTillamook State Forest, and Washington state <strong>for</strong>estlands. Privately ownedcommercial <strong>for</strong>ests toured included those of Fruit Growers Timber Company,Sierra Pacific, Weyerhaeuser, Willamette Industries and <strong>the</strong> National Council<strong>for</strong> Air and Stream Improvement (NCASI) study area.Beginning with in<strong>for</strong>mation compiled by <strong>the</strong> Interagency Scientific Committee(ISC), <strong>the</strong> <strong>Recovery</strong> Team <strong>the</strong>n sought new in<strong>for</strong>mation on owls from a varietyof sources and commissioned special reviews on topics such as silviculturalpractices, and management of threats from fire, insects, and disease. Anautomated geographical in<strong>for</strong>mation system was developed to manage <strong>the</strong> greatarray of data on owl sites, habitat areas, and timber resources.Early in <strong>the</strong> recovery planning process, most of each week-long <strong>Recovery</strong> Teammeeting was held in open session, attended by interest group representatives,elected officials, news media representatives, and <strong>the</strong> general public. During<strong>the</strong> planning process, <strong>the</strong> <strong>Recovery</strong> Team sent summaries of past meetings andagendas of future meetings to a mailing list of nearly 400 persons, including<strong>the</strong> news media and local, state, and federal elected officials. Also, two lettersrequesting specific new in<strong>for</strong>mation about owls were sent to <strong>the</strong> same mailinglist. A number of people, representing various interests, presented in<strong>for</strong>mationor points of view to <strong>the</strong> <strong>Recovery</strong> Team or one of its committees. Periodicbriefings were held <strong>for</strong> elected officials and agency staff.Donald R. Knowles - Secretary's representative and team coordinator.Current Position: Associate Deputy Secretary, U.S. Departmentof <strong>the</strong> Interior, Washington, D.C.Experience Includes: Professional staff member, U.S. Senate Committee onAppropriations, including subcommittee assignments on funding <strong>for</strong> <strong>the</strong> ForestService, Bureau of Land Management, Fish and Wildlife Service, National ParkService, Coast Guard, and <strong>the</strong> Federal Highway Administration: variousmanagement, program and budget analyst positions with <strong>the</strong> U.S. Departmentof Commerce and U.S. Department of Agriculture.Education: B.A. in economics from North Carolina State University; M.P.A.with major in water resources from North Carolina State University.Marvin Plenert - Team leader.Current Position: Regional Director, Fish and Wildlife Service Pacific RegionWashington, Oregon, Cali<strong>for</strong>nia, Idaho, Nevada, Hawaii and <strong>the</strong> Pacific TrustTerritories), Portland, Oregon.627
Experience Includes: Assistant Director, Refuges and Wildlife, FWS nationalheadquarters: Deputy Assistant Regional Director, Refuges and Wildlife, FWSRocky Mountain region: refuge supervisor <strong>for</strong> operations, FWS Alaska region.Education: B.S. and M.S. in wildlife management from Kansas State University.Jonathan Bart - Chatniian.Current position: Assistant Leader of <strong>the</strong> Ohio Cooperative Fish and WildlifeResearch Unit: Associate professor in <strong>the</strong> Department of Zoology at Ohio StateUniversity, Columbus, Ohio.Experience includes: teaching graduate seminars and courses in wildlifebiology, biometry and behavioral ecology; publications in <strong>the</strong> areas of surveydesign and evaluation, survival analysis, quantitative analysis, and behavioralecology.Education: B.S. in biology from Syracuse University, M.S. in ecology fromCornell University, Ph.D. in wildlife biology from Cornell University.Robert G. AnthonyCurrent position: Assistant Unit Leader and Professor of Wildlife Ecology,Oregon Cooperative Wildlife Research Unit, Oregon State University, Corvallis,Oregon.Experience includes: Teaching mammalogy, wildlife natural history, andwildlife biometrics; researching, and directing graduate students in research in<strong>the</strong> areas of wildlife ecology, dynamics of wildlife populations, and applicationof quantitative procedures to ecological concepts; Assistant and AssociateProfessor of Wildlife Ecology, Pennsylvania State University: 15 publicationswithin <strong>the</strong> last 5 years.Education: B.S. in biology from Fort Hays Kansas State College: M.S. inWildlife Biology from Washington State University; Ph.D. in zoology fromUniversity of Arizona.Melvin BergCurrent position: Chief, Division of Forestry, U.S. Bureau of Land Management,Washington, D.C.Experience includes: BLM district manager, Roseburg, Oregon: BLM associatedistrict manager; area manager, natural resource specialist, realty specialist,access specialist, and <strong>for</strong>ester.Education: B.S. in <strong>for</strong>est management from Iowa State University.John H. BeuterCurrent position: Deputy Assistant Secretary of Agriculture <strong>for</strong> Natural Resourcesand Environment, Washington, D.C.Experience includes: Consulting Forester with Mason, Bruce and Girard, Inc.,Portland, Oregon; professor and department head of Forest Management atOregon State University; director of Oregon State University research <strong>for</strong>ests.Education: B.S. in <strong>for</strong>estry, M.S. in <strong>for</strong>est economics from Michigan StateUniversity, Ph.D. in <strong>for</strong>estry and economics from Iowa State University.Wayne ElmoreCurrent position: U.S. Bureau of Land Management State Riparian Specialist<strong>for</strong> Oregon and Washington, Prineville, Oregon.Experience includes: BLM resource area <strong>for</strong>ester, and BLM district wildlifebiologist in Spokane, Washington: BLM district wildlife and fisheries biologistin Prineville, Oregon; approximately 20 publications on riparian ecosystemfunction and management.Education: B.S. in <strong>for</strong>est management from Oklahoma State University, postgraduatestudies in fisheries and wildlife management.John FayCurrent position: General Biologist, Division of Endangered Species, U.S. Fishand Wildlife Service, Washington D.C.Experience includes: Botanist, Division of Endangered Species, FWS; Assistant628
Chief, Branch of Biological Support, Office of Endangered Species, FWS;Associate Editor, Flora North America; Botanist, Pacific Tropical BotanicalGarden; <strong>for</strong>mer FWS.representative on Species Survival Commission, I.U.C.N.:numerous scientific and Federal Register publications.Education: B.S. in biology from Fordham College; Ph.D. in biology from CityUniversity of New York.R. J. GutifrrezCurrent position: Professor, Department of Wildlife, Humboldt State University,Arcata, Cali<strong>for</strong>nia. Current major studies ongoing in habitat, dispersal, genetics,and population dynamics of <strong>the</strong> spotted owl.Experience includes: Chairman of Wildlife, Humboldt State University; assistantprofessor in <strong>the</strong> Department of Natural Resources at Cornell University;more than 70 wildlife consulting projects <strong>for</strong> universities, associations, andcorporations; more than 30 peer-reviewed publications on avian ecology.Education: B.S. in wildlife biology from Colorado State University: M.S. inbiology from University of New Mexico; Ph.D. in zoology from University ofCali<strong>for</strong>nia, Berkeley.H. Theodore Heintz, Jr.Current position: Assistant Director <strong>for</strong> Economic Analysis, Office of PolicyAnalysis, U.S. Department of <strong>the</strong> Interior, Washington, D.C.Experience includes: Staff Director of <strong>the</strong> President's Task Force on OuterContinental Shelf Leasing and Development; Research Director, Commission ofFair Market Value Policy <strong>for</strong> Federal Coal Leasing; Director of Economics andSystems Analysis, Earth Satellite Corporation, Washington, D.C.Education: B.E.E. in electrical engineering from Cornell University; M.P.A. inpublic affairs from <strong>the</strong> Woodrow Wilson School of Public and InternationalAffairs at Princeton University.Richard S. HolthausenCurrent position: National Wildlife Ecologist, U.S. Forest Service, Logan, Utah.Experience includes: Regional Wildlife Ecologist, U.S. Forest Service PacificNorthwest Region; Assistant Wildlife Ecologist, National Fish and WildlifeEcology Unit, F.S.; <strong>for</strong>est planner, Bighorn National Forest; <strong>for</strong>est planningbiologist and range conservationist, Bighorn National Forest; range scientist,Peter Kiewit Sons Mining, Sheridan, Wyoming; various teaching and coursedesign work in <strong>for</strong>est management, wildlife and fish ecology.Education: B.S. in ecology and ma<strong>the</strong>matics from Cornell University; M.S. inecology from Utah State University.Kenneth LathropCurrent position: Supervisory Forester, Forest Products and Sale Administration,U.S. Bureau of Indian Affairs, Portland, Oregon.Experience includes: Assistant Forester - Timber Sales, Portland Area Bureauof Indian Affairs; District Ranger and Timber Sale Officer, White Swan RangerStation, Yakima Indian Reservation.Education: B.S. in <strong>for</strong>estry from Michigan Technological University; postgraduate work in <strong>for</strong>estry, wildlife, Indian culture, and public administration atOregon State University, Washington State University, University of Washington,Central Washington College, and Lewis and Clark College.Kent MaysCurrent position: Program Manager <strong>for</strong> <strong>Spotted</strong> <strong>Owl</strong> Research, Developmentand Application program involving 24 national <strong>for</strong>ests and two <strong>for</strong>est and rangeexperiment stations, Portland, Oregon.Experience includes: 34 years with <strong>the</strong> U.S. Forest Service in various line andstaff positions, including District Ranger and Forest Supervisor, on sevennational <strong>for</strong>ests in four states; worked in various positions in <strong>the</strong> U.S. ForestService National Headquarters in Washington D.C. in recreation, planning, andlegislative affairs; and <strong>the</strong> President's Commission on American Outdoors.629
Education: B.S. in <strong>for</strong>estry from Oregon State University, studies in PublicAdministration at American University, awarded an American Political ScienceAssociation Congressional Fellowship.Richard Nafziger - Representing <strong>the</strong> Governor of <strong>the</strong> State of Washington.Current position: Special Assistant to <strong>the</strong> Governor <strong>for</strong> Timber Policy and RuralDevelopment: Coordinator of Interagency Task Force on Timber CommunityDevelopment, Olympia, Washington.Experience includes: Member of Governor's Economic <strong>Recovery</strong> CoordinationBoard: senior policy analyst <strong>for</strong> Economic Development and Labor, Office ofFinancial Management.Education: B.A. in religion from Macalester College, St. Paul, Minnesota; M.S.in economics, New School <strong>for</strong> Social Research, New York, New York.Martha Pagel - Representing <strong>the</strong> Governor of <strong>the</strong> State of Oregon.Current position: Oregon Governor's Senior Policy Advisor on Natural Resources,Salem, Oregon.Experience includes: Director, and Deputy Director, Oregon Division of StateLands; Assistant Attorney General, General Counsel Division, Oregon Departmentof Justice, providing general legal advice to various natural resourceagencies.Education: B.A., in Journalism, San Diego State University: J.D., WillametteUniversity College of Law.Christine Sproul - Representing <strong>the</strong> Governor of <strong>the</strong> State of Califomia.Current position: Assistant Secretary, Legal Affairs, The Resources Agency ofCali<strong>for</strong>nia, Sacramento, Cali<strong>for</strong>nia.Experience includes: Staff Counsel, Office of <strong>the</strong> General Counsel, Cali<strong>for</strong>niaAir Resources Board: Staff Counsel, Office of <strong>the</strong> Chief Counsel, State WaterResources Control Board.Education: B.A., in international relations from <strong>the</strong> University of Cali<strong>for</strong>nia,Davis; J.D. from Martin Lu<strong>the</strong>r King Jr. Law School, University of Cali<strong>for</strong>nia,Davis, Cali<strong>for</strong>nia.Edward E. StarkeyCurrent position: Research Biologist and Terrestrial Ecology Program Leader,National Park Service Cooperative Park Studies Unit, Oregon State University:Professor of terrestrial ecology, Departments of Forest Resources, and Fisheriesand Wildlife, Oregon State University, Corvallis, Oregon.Experience includes: Chief scientist and wildlife ecologist <strong>for</strong> <strong>the</strong> National ParkService Denver Service Center: research and teaching assistant in zoology andbiology at Washington State University: more than 30 publications (and six<strong>the</strong>ses supervised) since 1980, mostly concerning deer and elk in old-growth<strong>for</strong>ests, fire ecology, and nutritional ecology.Education: B.S. in biology from Bemidji State University; M.A. in biology fromSt. cloud State University; Ph.D. in zoology from Washington State University.John C. TappeinerCurrent position: Professor of Forestry at Oregon State University, Corvallis,Oregon, teaching silviculture and <strong>for</strong>est ecology, research in shrub and hardwoodecology and vegetation management and <strong>for</strong>est stand growth.Experience includes: Lecturer in <strong>for</strong>estry, University of Cali<strong>for</strong>nia, Berkeley;Regional Silviculturist <strong>for</strong> U.S. Forest Service Region 5 (17 national <strong>for</strong>ests inCali<strong>for</strong>nia); international <strong>for</strong>estry consulting; associate professor University ofMinnesota Cloquet Forest Research Center; numerous peer-reviewed papers.Education: B.S., M.S., and Ph.D. in <strong>for</strong>estry (specializing in <strong>for</strong>est ecology andsilviculture) all from <strong>the</strong> University of Cali<strong>for</strong>nia, Berkeley.630
631
Team SupportCharles Bruce, Oregon Department of Fish and WildlifePhilip Carroll, U.S. Fish and Wildlife ServiceSusan Earnst, Department of Zoology, Ohio State UniversityCa<strong>the</strong>rine Elliott, Washington Governor's Timber TeamLawrence Finfer, U.S. Department of <strong>the</strong> InteriorGordon Gould, Cali<strong>for</strong>nia Department of Fish and GameAnn Hanus, Oregon Department of ForestryDavid Hays, Washington Department of WildlifeDavid Johnson, Oregon Department of Fish and WildlifeLinda Kucera, U.S. Forest ServiceCay Ogden, U.S. Bureau of Indian AffairsJosefa O'Malley, U.S. Department of <strong>the</strong> Interior, Office of <strong>the</strong> SolicitorCraig Partridge, Washington Department of Natural ResourcesNancy Pollot, U.S. Fish and Wildlife ServiceFred Seavey, U.S. Fish and Wildlife ServiceRaul Tuazon, Cali<strong>for</strong>nia Department of Forestry and Fire Protection632
Table K.2. Chronology of team activities.Date Event Subject3-05-91 <strong>Recovery</strong> Team meetingPortland, Oregon3-27 thru <strong>Recovery</strong> Team meeting3-29-91 Portland, Oregon4-05-91 O<strong>the</strong>r SpeciesSubgroup meetingPortland, Oregon4-15 and <strong>Spotted</strong> <strong>Owl</strong> Subgroup4-16-91 meeting Portland,Oregon4-22 and <strong>Recovery</strong> Team meeting4-23-91 Portland, Oregon4-24-91 <strong>Recovery</strong> Team fieldtrip4-25-91 Economic Subgroup meetingSalem, Oregon5-03-91 O<strong>the</strong>r SpeciesSubgroup meetingPortland, Oregon5-9-91 Economic Subgroup meetingUniversity of Cali<strong>for</strong>nia,Berkeley, Cali<strong>for</strong>nia.5-13-91 O<strong>the</strong>r SpeciesSubgroup meetingCorvallis, Oregon5-14 thru <strong>Recovery</strong> Team meeting5-16-91 Lake Crescent,Washington(Olympic Peninsula)Discussion of <strong>Recovery</strong> Team structure,schedule and reporting dates, and logistics.Overview of Endangered Species Act ando<strong>the</strong>r applicable laws, introduction to recoveryplanning, briefings on owl biology, silviculture,and <strong>for</strong>est ecology.Discussions of species and communitieslikely to benefit from <strong>the</strong> recovery plan,strategy <strong>for</strong> incorporating <strong>the</strong>se into developmentof <strong>the</strong> plan, and benefits of reserves versuscorridors between reserves.Discussions of peer review, data basesavailable to <strong>Recovery</strong> Team, criteria <strong>for</strong>owl range map, need <strong>for</strong> updating in<strong>for</strong>mationon defining suitable habitat.Committee reports. Discussion of ISCAppendices F, G, H, 0, and P. Discussion of owl range.Executive Session: budgetary issues, travel vouchers,staff needs.Mt. Hood National Forest with EstacadaRanger District Forest Service personnel.Met with experts from State of Oregonagencies and universities.Discussion of old-growth ecosystemconcerns, GIS mapping strategies,importance of corridors.Met with experts from State of Cali<strong>for</strong>niaagencies, universities, and consulting groups.Final assignments made and deadlinesagreed to.Committee reports. Discussion of ISCAppendices L, R, S, and T; economic impactsof recovery; critical habitat; proposed o<strong>the</strong>rrecovery goals; recovery options previously identified.5-17-91<strong>Recovery</strong> Team fieldtripLake Crescent, Washington (OlympicPeninsula).5-20-91Economic Subgroup meetingUniversity of Washington,Seattle, Washington.Met with experts from State of Washington agenciesand universities.conttinues-633
continued-1 5-24-91 O<strong>the</strong>r SpeciesSubgroup meetingOlympia, Washington5-29-91 O<strong>the</strong>r SpeciesSubgroup meetingPortland, OregonMeeting at Forest Service PacificNorthwest Research Station to discussspecies that may be influenced by <strong>the</strong> recovery plan.Meeting with J. Sedell and G. Reeves(Forest Service) to discuss native fishthat might be benefitted by <strong>the</strong> plan.5-29 thru5-30-91<strong>Spotted</strong> <strong>Owl</strong> Subgroupmeeting Portland,OregonUpdate on range mapping, status and threatssection, descriptions of suitable habitat and mappingof suitable spotted owl habitat, summary of vegetationdata bases, discussion of roles of silvicultural prescriptions,report on goals and objectives.6-06 and O<strong>the</strong>r Species6-07-91 Subgroup meetingPortland, Oregon6-12-91 Economic Subgroup meetingPortland, Oregon6-12 thru <strong>Spotted</strong> <strong>Owl</strong> Subgroup6-14-91 meeting Portland,Oregon6-17 and <strong>Recovery</strong> Team field6-18-91 trip Cali<strong>for</strong>nia6-19 thru <strong>Recovery</strong> Team meeting6-21-91 Arcata, Cali<strong>for</strong>nia6-26 thru <strong>Spotted</strong> <strong>Owl</strong> Subgroup6-28-91 meeting Portland,OregonMeeting with Cali<strong>for</strong>nia Departments ofFish and Game, Forestry to discuss listsof sensitive species.Evaluation of economic outline.Discussion of final review of goals, review of statusand criteria <strong>for</strong> range mapping; review of statusand threats section; review of suitable habitat definitions.Visit to Sierra Pacific Industries <strong>for</strong>estland, SacramentoCanyon and Deadwood, Fruitgrowers SupplyCompany <strong>for</strong>estland, Willow Creek study area, andSimpson timberland.Committee reports, discussion of revised recovery goals,plan organization, process <strong>for</strong> identifying options andestablishment of milestones, presentation of options beingconsidered by BLM.Discussion of suitable habitatdefinition, GIS, range mapping, delistingcriteria, process <strong>for</strong> evaluating option. Presentation byJ. Agee on fire and windthrow.7-02-917-03-91O<strong>the</strong>r SpeciesSubgroup meetingOregon State UniversityCorvallis, Oregon<strong>Plan</strong>ning Committeemeeting Portland,OregonReview of o<strong>the</strong>r species to be considered,principles and objectives, and outline<strong>for</strong> appendices.Discussion of implementation on federaland nonfederal lands, incentives <strong>for</strong>private land wildlife protection.7-10 thru <strong>Spotted</strong> <strong>Owl</strong> Subgroup7-13-91 meeting Portland,Oregon7-10-91 <strong>Plan</strong>ning Committeemeeting Portland,OregonRevision of significant threats document,options <strong>for</strong> recovery, delisting criteria,range mapping.Review of documents on planimplementation, problems and issuesfederal and nonfederal lands.634continues-
7-16 thru7-19-917-17-917-18-91<strong>Recovery</strong> Team meetingSpringfield, Oregon<strong>Plan</strong>ning Committeemeeting Portland,Oregon<strong>Recovery</strong> Team fieldtripCommittee reports. Discussion of recovery goals anddelisting criteria, options <strong>for</strong> achieving recovery.Definition of goals. Division of assignments.BLM Coast Range Resource AreaSpringfield, Oregon.7-29 thru <strong>Spotted</strong> <strong>Owl</strong> Subgroup7-31-91 meeting Portland,Oregon8-08 and <strong>Recovery</strong> Team8-09-91 workshop Portland,Oregon8-14 thru <strong>Spotted</strong> <strong>Owl</strong> Subgroup8-16-91 meeting Portland,Oregon8-19 thru <strong>Recovery</strong> Team meeting8-22-91 and field tripPortland, OregonReview of states' progress on significant threats document,range maps, report on McKelvey model, options <strong>for</strong>recovery, and delisting criteria. Presentation by J. Thomason old-growth preserve options presented to Congress.O<strong>the</strong>r species and ecosystem issues. Presentations onmarbled murrelets, riparian ecosystems, sensitive streamsand stocks of native fish, amphibians, spotted owl prey,goshawks, bald eagles, marten and fisher, plantsassociated with older <strong>for</strong>est ecosystems, and ecologicalcorridors.Review of range map, map of physiographicprovinces, delisting criteria, evaluationprocess and data needed.Committee reports. Presentation on standsimulators and Douglas County project.Discussion of evaluation procedures, old-growth preserves,and critical habitat.8-21 -918-22-91<strong>Recovery</strong> Team fieldtrip<strong>Plan</strong>ning Committeemeeting Portland,OregonYakima Indian Reservation Forest, Yakima,Washington.Discussion of items needed in recoveryplan from planning group and division ofassignments.9-04 thru <strong>Spotted</strong> <strong>Owl</strong> Subgroup9-05-91 meeting Portland,Oregon9-06-91 O<strong>the</strong>r SpeciesSubgroup meetingOregon State UniversityCorvallis, Oregon9-09 thru <strong>Spotted</strong> <strong>Owl</strong> Subgroup9-13-91 meeting Portland,Oregon9-11-91 <strong>Plan</strong>ning Committeemeeting Portland,OregonCompletion of map work. Reviewstatus and threats by province,contributions from private lands.Discussion of priorities <strong>for</strong> marbledmurrelets, native fish and wolves,grizzly bears, and goshawks. Role ofecological corridors and coarse woody debris.Completion of options <strong>for</strong> federal lands.Discussion of working groups <strong>for</strong> eachstate to finalize options.Briefing on state and private lands recoveryoptions, plan implementation, HCPs,private land incentives, and analysis of harvest impacts.continued-coniinues-635
continued-9-16 thru9-20-919-19-91<strong>Spotted</strong> <strong>Owl</strong> Subgroupmeeting Portland,Oregon<strong>Plan</strong>ning Committeemeeting Portland,OregonReview salvage report, data layers in GISand salvage and silvicultural activities.Discuss options <strong>for</strong> nonfederal lands. Presentation of industryproposal <strong>for</strong> recovery plan.Discussion of institutional mechanisms <strong>for</strong> nonfederallands, principles of implementation, individual managementplans <strong>for</strong> DCAs, and critical habitat. Presentation onBull Run watershed.9-23 thru <strong>Recovery</strong> Team meeting9-27-91 Portland, OregonCommittee reports. Presentation on Bull Run watershed.Discussion of ecological significance of coarse woody debris;effects of fire, wind, insects, and disease; silvicultural methods<strong>for</strong> improving and retaining owl habitat inside and outside DCAs.9-26-919-27-91<strong>Spotted</strong> <strong>Owl</strong> Subgroupmeeting Portland,Oregon<strong>Plan</strong>ning Committeemeeting Portland,OregonMeeting with Forest Ecology Committee todiscuss management of catastrophic riskin DCAs.Discussion of process <strong>for</strong> evaluatingproposals, writing tasks, four-stepprocess <strong>for</strong> integration, development of landscape alternative,oversight mechanism, and critical habitat.10-04-91 <strong>Plan</strong>ning Committeemeeting Portland,Oregon10-11-91 <strong>Plan</strong>ning Committeemeeting Portland,Oregon10-15 and <strong>Plan</strong>ning Committee10-16-91 meeting Portland,Oregon10-17 and <strong>Recovery</strong> Team meeting10-18-91 Portland, Oregon10-29 thru <strong>Recovery</strong> Team meeting11-01-91 Portland, Oregon11-04 thru <strong>Recovery</strong> Team meeting11-08-91 Portland, Oregon11-05-91 <strong>Plan</strong>ning Committeemeeting Portland,OregonState and private participation, criticalhabitat, implementation issues.Conference call to discuss take, HCP,section 4(d) rule.Discussion of critical habitat, take, HCP, section 4(d) rule.Report on "silviculture, salvage and catastrophic riskmanagement in DCAs." Review of draft material onimplementation on state and private lands, coordinationand oversight mechanisms, current management.Committee reports. Progress report on chapters. Discussionof recommendations <strong>for</strong> critical habitat, DCA network matrixmanagement, management on east side <strong>for</strong>ests, developmentof research and monitoring program, and demographic analysis.Mapping designated conservation areaswith participation of representatives from <strong>the</strong> national <strong>for</strong>estsand BLM districts.Committee reports. Discussion ofmanagement guidelines <strong>for</strong> DCAs and matrix.Discussion of state proposals and currentmanagement.continues-636
continued-12-03 thru <strong>Recovery</strong> Team meeting Committee reports. Discussion of12-06-91 Portland, Oregon critical habitat, Washington D.C. review, chapters 1, 11, and 111.1-14 and <strong>Recovery</strong> Team meeting Report on Washington D.C. review of draft recovery plan,1-15-92 Portland, Oregon results from peer review, Appendices A, B, H, and 1,proposed revisions to plan, and Secretary's directive to<strong>the</strong> <strong>Recovery</strong> Team.Technical Reports Prepared <strong>for</strong> <strong>the</strong> <strong>Recovery</strong> TeamBenson, G. 1991. Summary of nor<strong>the</strong>rn spotted owl nest site in<strong>for</strong>mation ineastern Washington. Unpublished manuscript. <strong>Spotted</strong> owl RD&A (research,development, and applications) Program, Pacific Northwest Experiment Station,U.S. Forest Service, Portland, Oregon.Benson, G. 1991. Characterization of spotted owl habitat: east slope of <strong>the</strong>Washington and Oregon Cascades (Draft). Unpublished manuscript. <strong>Spotted</strong>owl RD&_A (research, development and applications) Program, Pacific NorthwestExperiment Station, U.S. Forest Service, Portland, Oregon.Birch, K. 1991. Silviculture systems <strong>for</strong> Douglas-fir. Unpublished reportsubmitted to <strong>the</strong> Nor<strong>the</strong>rn <strong>Spotted</strong> <strong>Owl</strong> <strong>Recovery</strong> Team.Frest, T.J. and E.J. Johannes. 1991. Present and potential candidate molluscsoccurring within <strong>the</strong> range of <strong>the</strong> nor<strong>the</strong>rn spotted owl. Unpublishedmanuscript. Deixis Consultants. Seattle, Washington.Grenier, J. 1991. Review of in<strong>for</strong>mation on structure of old-growth stands andold-growth stands used by spotted owls in western Oregon and Washington.Unpublished manuscript submitted to <strong>the</strong> Nor<strong>the</strong>rn <strong>Spotted</strong> <strong>Owl</strong> <strong>Recovery</strong>Team.Lamberson, R.H. and S. Brooks. 1991. An xxamination of <strong>the</strong> high density ofnor<strong>the</strong>rn spotted owls in nmorthwestem Cali<strong>for</strong>nia. Unpublished manuscript.Department of Ma<strong>the</strong>matics and Program in Environmental Systems, HumboldtState University, Arcata, Cali<strong>for</strong>nia.McComb, W.C. 1991. The role of dead wood in habitat of spotted owl prey ando<strong>the</strong>r old <strong>for</strong>est vertebrates. Unpublished manuscript. Department of ForestScience, Oregon State University, Corvallis, Oregon.Morrell, J.J. 1991. Role of fungi in coarse woody debris. Unpublished manuscript.Department of Forest Products, Oregon State University, Corvallis,Oregon.Oliver, C. 1991. nor<strong>the</strong>rn spotted owl habitat in previously managed <strong>for</strong>ests inwestern and eastern Washington with and without fur<strong>the</strong>r management.Unpublished manuscript. College of Forestry, University of Washington,Seattle, Washington.637
Perry, D. 1991. The ecology of coarse woody debris in Pacific Northwest<strong>for</strong>ests: overview, and <strong>the</strong> role of down logs in ecosystem processes. Departmentof Forest Science, Oregon State University, Corvallis, Oregon.Stere, D.H. 1991. A discussion of <strong>for</strong>est stand simulators. Unpublishedmanuscript. Oregon Department of Forestry, Salem, Oregon.Wea<strong>the</strong>rspoon, P. and M. Ritchie. 1991. Silvicultural prescriptions <strong>for</strong> mixedconifer stands in nor<strong>the</strong>rn Cali<strong>for</strong>nia. Unpublished report submitted to <strong>the</strong>Nor<strong>the</strong>rn <strong>Spotted</strong> <strong>Owl</strong> <strong>Recovery</strong> Team.638
THE SECRETARYOF THE INTERIORW A S H I N G T O N/71 February 5, 1991MemorandumTo:From:Donald R. Knowles, Secretary's Representative and<strong>Recovery</strong> Team CoordinatorMarvin L. Plenert, <strong>Recovery</strong> Te a~rLead rThe SecretarySubject: Directive to No em <strong>Spotted</strong> <strong>Owl</strong> <strong>Recovery</strong> TeamPursuant to Section 4(f) of <strong>the</strong> Endangered Species Act, <strong>the</strong> goalof <strong>the</strong> recovery team ef<strong>for</strong>t is to develop a plan that will leadto <strong>the</strong> conservation and survival of <strong>the</strong> nor<strong>the</strong>rn spotted owl. Thenor<strong>the</strong>rn spotted owl recovery plan will serve as a guide to futureFederal, State and private activities affecting <strong>the</strong> owl and willbe designed to bring <strong>the</strong> owl to <strong>the</strong> point at which it will nolonger need <strong>the</strong> protection of <strong>the</strong> Endangered Species Act (Act).The requirements <strong>for</strong> recovery plans are specified in <strong>the</strong> Act:(i) a description of such site-specific managementactions as may be necessary to achieve <strong>the</strong> plan's goal<strong>for</strong> <strong>the</strong> conservation and survival of <strong>the</strong> species;(ii) objective, measurable criteria which, when met,would result in a determination, in accordance with <strong>the</strong>provisions of this section, that <strong>the</strong> species be removedfrom <strong>the</strong> list; and(iii) estimates of <strong>the</strong> time and cost to carry out thosemeasures needed to achieve <strong>the</strong> plan's goal and toachieve intermediate steps toward that goal.The planning process also must ensure that all availablescientific in<strong>for</strong>mation is considered prior to <strong>the</strong> plan'scompletion. To <strong>the</strong> extent consistent with its legal mandate, <strong>the</strong>plan also should address concerns such as: potential communityand region-wide economic and social impacts; fiscal implicationsat <strong>the</strong> local, State and Federal levels; compatibility with o<strong>the</strong>rlegal mandates; effects on o<strong>the</strong>r threatened and endangered speciesand those species which might be listed in <strong>the</strong> future; and broaderecosystem-related considerations.The recovery team has considerable latitude in which to carry outits task. The Act specifies no road map to recovery, nor does it639
2mandate <strong>the</strong> achievement of recovery within a particular timeframe. Accordingly, recovery plans <strong>for</strong> o<strong>the</strong>r listed species haveemployed a wide variety of management approaches. I encourage <strong>the</strong>team to exercise <strong>the</strong> full range of its creative abilities inassessing options <strong>for</strong> <strong>the</strong> recovery of <strong>the</strong> nor<strong>the</strong>rn spotted owl.The recovery plan, however, must have a sound and crediblescientific basis, so that we can be confident that itsimplementation will meet <strong>the</strong> Act's requirements.In addition to <strong>the</strong> issues noted above, <strong>the</strong>re are several specificconcerns that I request <strong>the</strong> team to consider in <strong>the</strong> plan'sdevelopment process:o Interagency Scientific Committee Conservation Strategy: TheISC conducted a comprehensive review of science on <strong>the</strong>nor<strong>the</strong>rn spotted owl. The team should consider that scienceand incorporate it, as appropriate, with all new scientificdata, in <strong>the</strong> recovery planning ef<strong>for</strong>t.o Risk Analysis: The team should assess <strong>the</strong> feasibility ofdeveloping recovery options that address <strong>the</strong> degree of risk(and associated uncertainty) to <strong>the</strong> owl, o<strong>the</strong>r species, o<strong>the</strong>renvironmental values, and economic concerns.o Subdivided <strong>Plan</strong>s/<strong>Recovery</strong> Targets: The team should determine<strong>the</strong> feasibility of dividing <strong>the</strong> plan into sections thataddress individual States or physiographic provinces. Aspart of this ef<strong>for</strong>t, <strong>the</strong> team should evaluate <strong>the</strong> proprietyof setting recovery targets <strong>for</strong> such locales. In so doing,options such as determining desired population ranges ra<strong>the</strong>rthan fixed number targets, and varying ranges or targets bydate and locale should be assessed. It is important to note,however, that any plan that includes subdivisions must alsobe assessed as a whole in terms of its ability to meet <strong>the</strong>Act's mandates and o<strong>the</strong>r concerns related to <strong>the</strong> plan ef<strong>for</strong>t.o Potential Impact of State and Private Actions: Policiescarried out by States, o<strong>the</strong>r political subdivisions, andprivate landowners may significantly affect <strong>the</strong> range ofrecovery plan options available <strong>for</strong> Federal lands. Potentialactions by <strong>the</strong>se non-Federal parties which could contributeto owl recovery should be assessed in terms of feasibilityand implementation requirements. As appropriate, <strong>the</strong> teamshould incorporate assumptions concerning non-Federal actionsinto plan options as <strong>the</strong>y are developed.o Population Genetics and Adaptability: The team should assess<strong>the</strong> feasibility of considering population genetics andadaptability assumptions in developing <strong>the</strong> plan. These mayyield insights concerning <strong>the</strong> ability of owls to survive invarious habitats.640
3o Ecosystem Issues: There are o<strong>the</strong>r <strong>for</strong>est ecosystem speciesthat may be candidates <strong>for</strong> listing under <strong>the</strong> Act which maybenefit from any recovery plan <strong>for</strong> <strong>the</strong> owl. To <strong>the</strong> extentpossible, <strong>the</strong> team should assess <strong>the</strong> relative benefits to<strong>the</strong>se species from <strong>the</strong> implementation of various recoveryoptions.o Forest Management Practices: The team should assess <strong>the</strong>potential impacts of alternative <strong>for</strong>est and land managementpractices in determining potential recovery plan scenarios,including <strong>the</strong> plan's relationship to o<strong>the</strong>r land use planningexercises.o Cost to <strong>the</strong> Public: Potential plan options should document<strong>the</strong> direct and indirect public costs of implementation.The recovery team leader will be responsible <strong>for</strong> managing <strong>the</strong>team, including <strong>the</strong> preparation of its work plan, staffing andadministration, drafting <strong>the</strong> recovery plan, and assuring publiccomment. The recovery team coordinator will serve as <strong>the</strong>Secretary's representative and will be responsible <strong>for</strong> providinginitial and ongoing policy guidance, through direct and frequentconsultation with <strong>the</strong> team leader and with o<strong>the</strong>r members, asappropriate.The development of a recovery plan <strong>for</strong> <strong>the</strong> nor<strong>the</strong>rn spotted owlmay be <strong>the</strong> most important ef<strong>for</strong>t of its kind since <strong>the</strong> passage of<strong>the</strong> Act. The potential implications <strong>for</strong> <strong>the</strong> survival of <strong>the</strong> owl,with respect to o<strong>the</strong>r economic, social and environmental values,are significant. The results of your work could well have majoreffects on land management at both <strong>the</strong> Federal and non-Federallevels, and also help to set a precedent <strong>for</strong> future recovery teamsworking on plans <strong>for</strong> o<strong>the</strong>r listed species. Accordingly, yourdevelopment of <strong>the</strong> recovery plan <strong>for</strong> <strong>the</strong> nor<strong>the</strong>rn spotted owl hasmy highest expectations as well as my full encouragement andsupport.Please keep me fully in<strong>for</strong>med as milestones in <strong>the</strong> preparation of<strong>the</strong> draft recovery plan are accomplished.cc:Members of <strong>the</strong> Nor<strong>the</strong>rn <strong>Spotted</strong> <strong>Owl</strong> <strong>Recovery</strong> Team641
642
Appendix LGlossary643
644
50-11-40 rule - a guideline developed to provide habitat conditions adequate<strong>for</strong> movement of juvenile and adult owls across <strong>the</strong> landscape. It requiresthat 50 percent of <strong>the</strong> <strong>for</strong>est within a quarter-township be maintainedwith an average tree dbh of at least 11 inches and 40 percent canopyclosure.Activity center - an area of concentrated activity of ei<strong>the</strong>r a pair of spottedowls or a territorial single owl.Adaptive management - <strong>the</strong> process of implementing policy decisions asscientifically driven management experiments that test predictions andassumptions in management plans, and using <strong>the</strong> resulting in<strong>for</strong>mationto improve <strong>the</strong> plans.Allelic difference - <strong>the</strong> distinguishing characteristics among all <strong>for</strong>ms of agene.Allometric - of or pertaining to allometry: <strong>the</strong> increase in size of one part of anorganism related to <strong>the</strong> growth of <strong>the</strong> whole.Allometric analysis - an assessment of <strong>the</strong> relationship of a body trait (e.g.,body mass) and home range size.Allometric equations - a ma<strong>the</strong>matical expression of <strong>the</strong> relationship betweenbody mass and home range size among owls.Atlopreening - reciprocal or ritual cleaning of fea<strong>the</strong>rs by members of an owlpair.Aflozyme electrophoresis - Allozymes are different <strong>for</strong>ms of <strong>the</strong> same enzyme.Electrophoresis is a technique to distinguish among allozymes by comparing<strong>the</strong>ir relative mobility in an electrical field.Anadromous fish - those species of fish that mature in <strong>the</strong> sea and migrateinto streams to spawn. Salmon, steelhead, and shad are examples. RGIIVJ L. i cnu LtL u U J(liiU~yI'~Wt U[CLI~Li OWtS JIHL U itUEUL[TS ULUSgts Wgs~~~WJULLLLI L;I UI rEoow arLerhs au LIym sea Lo tn owe LJrayO In Eeams ylossaryCFR - "Code of Federal Regulations," 36 CFR and 40 CFRDST - "A Dictionary of Statistical Terms," Third Edition, M.G. Kendall and W.R. BucklandEFG - "Ecology Field Glossary - A Naturalist's Vocabulary," Walter H. LewisFSM - "Forest Service Manual 2410"GET - "Glossary of Engineering Terms", Pacific Northwest Forest and Range Experiment Station, USDA-ForestService, 1979MWFH - "Management of Wildlife and Fish Habitats in Forests of Western Oregon and Washington," USDA-ForestService, Pacific Northwest Region, 1985NAD - "New American Dictionary"OLR - "Oregon Law Review, Land and Resource <strong>Plan</strong>ning in <strong>the</strong> NationalAnderson, The University of Oregon Law School, 1985RG - "Glossary from <strong>the</strong> Regional Guide <strong>for</strong> <strong>the</strong> Pacific Northwest Region," May 1984RH - "Random House Dictionary of <strong>the</strong> English Language," College Edition, 1969SAF - "Society of American Foresters Dictionary of Forestry Terms"WEB - 'Webster's New Collegiate Dictionary"Forests," C.F. Wilkinson and H.M.WPG - "Wildland <strong>Plan</strong>ning Glossary," Pacific Southwest Forest and Range Experiment Station, USDA-ForestService, General Technical Report PSW 13/1976645
Aspect - <strong>the</strong> direction a slope faces with respect to <strong>the</strong> cardinal compasspoints. GETAutocorrelation - a measure of <strong>the</strong> similarity of consecutive numbers in atemporal, or o<strong>the</strong>r one-dimensional, series of observations.Basal area - <strong>the</strong> area of <strong>the</strong> cross-section of a tree stem near its base, generallyat breast height and including bark. SAFBiological diversity - <strong>the</strong> variety of life and its processes, including complexityof species, communities, gene pools, and ecological functions.Biological growth potential - <strong>the</strong> average net growth attainable in a fullystocked natural <strong>for</strong>est stand. RGBiological unit management - Forest Service usage. Any unit <strong>for</strong> managementof a particular species or any unit of intensive or special management.The term includes any big-game management unit as recognizedby a cooperating state, even though it may not be strictly a herd unit. In<strong>the</strong> case of fisheries management, <strong>the</strong> term may include a drainagesystem. WPGBiomass - <strong>the</strong> total quantity (at any given time) of living organisms of one ormore species per unit of space (species biomass), or of all <strong>the</strong> species in abiotic community (community biomass). RGBirth-pulse population - a population assumed to produce all of its offspringat an identical, and instantaneous, point during <strong>the</strong> annual cycle.BLM - Bureau of Land Management, U.S. Department of <strong>the</strong> Interior.Blowdown - trees felled by high winds.Board foot - lumber or timber measurement term. The amount of woodcontained in an unfinished board 1 inch thick, 12 inches long, and 12inches wide. WPGBreast height - a standard height from average ground level <strong>for</strong> recordingdiameter, girth, or basal area, generally 4.5 feet (1.37 meters). GETBroadcast burn - allowing a prescribed fire to bum over a designated areawithin well-defined boundaries <strong>for</strong> reduction of fuel hazard or as a silviculturaltreatment, or both. RGBrooms (as in mistletoe) - a cluster of branches, radiating from a single point,that results from damage in a tree from agents such as mistletoe.BT - Bacillus Thuringiensis, a bacterium used <strong>for</strong> biological control of sprucebudworm.Cambium - <strong>the</strong> layer of tissue between <strong>the</strong> bark and wood in a tree or shrub.New bark and wood originate from this layer.Canopy - a layer of foliage in a <strong>for</strong>est stand. This most often refers to <strong>the</strong>uppermost layer of foliage, but it can be used to describe lower layers in amultistoried stand.Canopy closure - <strong>the</strong> degree to which <strong>the</strong> crowns of trees are nearing generalcontact with one ano<strong>the</strong>r. Generally measured as <strong>the</strong> percent of <strong>the</strong>646
ground surface that would be covered by a vertical projection of foliage in<strong>the</strong> crowns of trees.Capability - <strong>the</strong> potential of an area of land to produce resources, supplygoods and services, and allow resource uses. Capability depends uponcurrent vegetation conditions and site conditions such as climate, slope,land<strong>for</strong>n, soils, and geology. RGCenter of activity - <strong>the</strong> nest site of a breeding pair of owls or primary roostarea of a territorial individual owl.CFR - Code of Federal Regulation.Checkerboard ownership - a land ownership pattern in which every o<strong>the</strong>rsection (square mile) is in federal ownership as a result of federal landgrants to early western railroad companies.Class E (fire) - a fire that extends over an area ranging from 300 to 1,000acres.Clear-cut - an area where <strong>the</strong> entire stand of trees has been removed in onecutting. SAFClimax - <strong>the</strong> culminating stage in plant succession <strong>for</strong> a given site where <strong>the</strong>vegetation has reached a highly stable condition. RGClosed sapling pole - sapling and pole stands which are characterized by aclosed tree canopy and very little ground cover. Tree crown closure willexceed 60 percent and often reaches 100 percent.Cluster - an area that contains habitat capable of supporting three or morebreeding pairs of spotted owls with overlapping or nearly overlappinghome ranges.Clutch - <strong>the</strong> number of eggs laid by a female bird at one time. EFGCohort - individuals all resulting from <strong>the</strong> same birth-pulse, and thus all of <strong>the</strong>same age.Colonization - <strong>the</strong> establishment of a species in an area not currently occupiedby that species. Colonization often involves dispersal across an areaof unsuitable habitat.Conferencing - in<strong>for</strong>mal consultation that takes place between <strong>the</strong> U.S. Fishand Wildlife Service and ano<strong>the</strong>r federal agency when it is determinedthat a proposed federal action may jeopardize <strong>the</strong> continued existence of aspecies proposed as threatened or endangered or result in adversemodification of proposed critical habitat.Confidence interval - an-interval that is calculated from a series of samplesintended to estimate <strong>the</strong> value of a parameter. The confidence level is <strong>the</strong>probability that <strong>the</strong> true value of <strong>the</strong> parameter falls within <strong>the</strong> confidenceinterval.Confidence level - <strong>the</strong> probability that <strong>the</strong> true value <strong>for</strong> a parameter isincluded within <strong>the</strong> confidence interval calculated <strong>for</strong> a sample of thatparameter.647
Congressionally classified and designated areas - areas that require congressionalenactment <strong>for</strong> <strong>the</strong>ir establishment, such as national wildernessareas, national wild and scenic rivers, and national recreation areas. RGConifer - a tree belonging to <strong>the</strong> order Gymnospermae, comprising a widerange of trees that are mostly evergreens. Conifers bear cones (henceconiferous) and needle-shaped or scale-like leaves. SAFConnectivity - a measure of <strong>the</strong> extent to which intervening habitat trulyconnects DCAs <strong>for</strong> juvenile spotted owls dispersing among <strong>the</strong>m.Conservation - <strong>the</strong> process or means of achieving recovery.Conspecifics - belonging to or pertaining to <strong>the</strong> same species.Consultation - a <strong>for</strong>mal interaction between <strong>the</strong> U.S. Fish and Wildlife Serviceand ano<strong>the</strong>r federal agency when it is determined that <strong>the</strong> agency's actionmay affect a species that has been listed as threatened or endangered orits critical habitat.Contiguous habitat - habitat suitable to support <strong>the</strong> life needs of owls that isdistributed continuously or nearly continuously across <strong>the</strong> landscape.Corridor - a defined tract of land, usually linear, through which a species musttravel to reach habitat suitable <strong>for</strong> reproduction and o<strong>the</strong>r life-sustainingneeds.Cost efficiency - <strong>the</strong> usefulness of specified inputs (costs) to produce specifiedoutputs (benefits). In measuring cost efficiency, some outputs, includingenvironmental, economic, or social impacts, are not assigned monetaryvalues, but are achieved at specified levels in <strong>the</strong> least costly manner.Cost efficiency usually is measured using present net value, although useof benefit-cost ratios and rates-of-return may be appropriate. RGCritical habitat - specific areas within <strong>the</strong> geographical area occupied by aspecies on which are found those physical or biological features essentialto conservation of <strong>the</strong> species.Crown - <strong>the</strong> upper part of a tree or o<strong>the</strong>r woody plant which carries <strong>the</strong> mainsystem of branches and <strong>the</strong> foliage. SAFCrown closure - see canopy closure.CWD (coarse woody debris) - portion of a tree that has fallen or been cut andleft in <strong>the</strong> woods. Usually refers to pieces at least 20 inches in diameter.DBH - diameter at breast height. The diameter of a tree measured 4 feet 6inches from <strong>the</strong> ground. RGDCA - designated conservation area.Defoliators - insects that feed on foliage and thus act to remove some or all of<strong>the</strong> foliage from a tree, shrub, or herb.Demographic model - a model that predicts <strong>the</strong> future state of an animalpopulation based on its birth and death rates.Demography - <strong>the</strong> quantitative analysis of population structure and trends:population dynamics. EFG648
Density, biological population - <strong>the</strong> number or size of a population in relationto some unit of space. It is usually expressed as <strong>the</strong> number of individualsor <strong>the</strong> population biomass per unit area or volume. RGDepauperate - poorly developed. In biology, it usually refers to an area thathas relatively few plant and animal species.Designated conservation area (DCA) - a contiguous area of habitat to bemanaged and conserved <strong>for</strong> spotted owls. This general description can beapplied to two categories:DCA 1 - category of DCA intended to support at least 20 pairs ofspotted owls.DCA 2 -category of DCA intended to support one to 19 pairs ofspotted owls.Dispersal - <strong>the</strong> movement, usually one way and on any time scale, of plants oranimals from <strong>the</strong>ir point of origin to ano<strong>the</strong>r location where <strong>the</strong>y subsequentlyproduce offspring.Dispersal capability - ability of members of a species to move from <strong>the</strong>ir areaof birth to ano<strong>the</strong>r suitable location and subsequently breed.Dispersal habitat - habitat that supports <strong>the</strong> life needs of an individual animalduring dispersal. Generally satisfies needs <strong>for</strong> <strong>for</strong>aging, roosting, andprotection from predators.Distribution (of a species) - <strong>the</strong> spatial arrangement of a species within itsrange.Disturbance - a significant change in structure and/or composition caused bynatural events such as fire and wind or human-caused events such ascutting.Diversity - see biological diversity.Down log - portion of a tree that has fallen or been cut and left in <strong>the</strong> woods.Early seral stage <strong>for</strong>ests - Stage in <strong>for</strong>est development that includes seedling,sapling, and pole-sized trees.East side <strong>for</strong>ests - <strong>the</strong> 12 national <strong>for</strong>ests in Washington, Oregon, and Cali<strong>for</strong>niathat lie partly or wholly east of <strong>the</strong> Cascade Mountain Range crest:Colville, Deschutes, Fremont, Klamath, Malheur, Ochoco, Okanogan,Shasta-Trinity, Umatilla, Wallowa-Whitman, Wenatchee, and WinemaNational Forests. RGEcosystem - an interacting system of organisms considered toge<strong>the</strong>r with <strong>the</strong>irenvironment: <strong>for</strong> example, marsh, watershed, and lake ecosystems. RGEdge - where plant communities meet or where successional stages or vegetativeconditions within plant communities come toge<strong>the</strong>r. RG See also edgecontrast and horizontal diversity.Edge contrast - a qualitative measure of <strong>the</strong> difference in structure of twoadjacent vegetated areas; <strong>for</strong> example, 'low," "medium," or 'high" edgecontrast. RGElectrophoresis - a technique used to distinguish among allozymes by comparing<strong>the</strong>ir relative mobility in an electrical field.649
Empirical - derived from direct observation or experimentation.Endangered species - any species of animal or plant that is in danger ofextinction throughout all or a significant portion of its range; plant oranimal species identified by <strong>the</strong> Secretary of <strong>the</strong> Interior as endangered inaccordance with <strong>the</strong> 1973 Endangered Species Act. RGEndemic - a species that is unique to a specific locality.Environmental analysis - an analysis of alternative actions and <strong>the</strong>ir predictableshort- and long-term environmental effects, incorporating physical,biological, economic, and social considerations. RGEnvironmental assessment - a concise public document required by <strong>the</strong>regulations implementing <strong>the</strong> National Environmental Policy Act. RGEnvironmental stochasticity - random variation in environmental attributessuch as temperature, precipitation, and fire frequency.Epiphyte - a plant that grows upon ano<strong>the</strong>r plant and that is nonparasitic.Most of <strong>the</strong> plant's necessary moisture and nutrients are derived from <strong>the</strong>atmosphere. RGEven-aged <strong>for</strong>est - a <strong>for</strong>est stand composed of trees with less than a 20-yeardifference in age.Even-aged management - <strong>the</strong> application of a combination of actions thatresult in <strong>the</strong> creation of stands in which trees of essentially <strong>the</strong> same agegrow toge<strong>the</strong>r. Managed even-aged <strong>for</strong>ests are characterized by a distributionof stands of varying ages (and, <strong>the</strong>re<strong>for</strong>e, tree sizes) throughout <strong>the</strong><strong>for</strong>est area. The difference in age among trees <strong>for</strong>ming <strong>the</strong> main canopylevel of a stand usually does not exceed 20 percent of <strong>the</strong> age of <strong>the</strong> standat harvest rotation age. Regeneration in a particular stand is obtainedduring a short period at or near <strong>the</strong> time that a stand has reached <strong>the</strong>desired age or size <strong>for</strong> harvesting. Clear-cut, shelterwood, or seed treecutting methods produce even-aged stands. RGExtended rotation - a period of years that is longer than <strong>the</strong> time necessary togrow timber crops to a specified condition of maturity. SAF See rotation.Extended rotation age - a point in time when trees are harvested or plannedto be harvested that is beyond <strong>the</strong> age when harvest ordinarily wouldoccur. SAF See rotation age.Extinct - A species is extinct when it no longer exists. EFGExtirpation - <strong>the</strong> elimination of a species from a particular area.Fecundity - number of female young produced per adult female.Fire regime - <strong>the</strong> characteristic frequency, extent, intensity, severity, andseasonality of fires in an ecosystem.Fire severity - <strong>the</strong> degree to which a site has been altered or disrupted by fire.Severity reflects fire intensity and residence time.Fledge - to rear until ready <strong>for</strong> flight or independent activity. WEB650
Floaters - nonbreeding adults and subadults that move and live within abreeding population, often replacing breeding adults that die;nonterritorial individuals.Food chain - organisms that are interrelated in <strong>the</strong>ir feeding habits, eachfeeding upon organisms that are lower in <strong>the</strong> chain and in turn being fedon by organisms higher in <strong>the</strong> chain.Forest fragmentation - <strong>the</strong> change in <strong>the</strong> <strong>for</strong>est landscape, from extensive andcontinuous <strong>for</strong>ests of old-growth to a mosaic of younger stand conditions.Fragmentation - see <strong>for</strong>est fragmentation.Fuel loading - <strong>the</strong> amount of combustible material present per unit of area,usually expressed in tons per acre.FWS - Fish and Wildlife Service, U.S. Department of <strong>the</strong> Interior.GIS - geographical in<strong>for</strong>mation system. This is a computer system capable ofstoring and manipulating spatial (i.e., mapped) data.Group selection cutting - removal of groups of trees ranging in size from afraction of an acre up to about 2 acres. Area cut is smaller than <strong>the</strong>minimum feasible under even-aged management <strong>for</strong> a single stand. RGGuideline - a policy statement that is not a mandatory requirement (as opposedto a standard, which is mandatory). RGHA (hectare) - a measure of area in <strong>the</strong> metric system equal to approximately2.5 acres.Habitat - <strong>the</strong> place where a plant or animal naturally or normally lives andgrows. RGHabitat capability - <strong>the</strong> estimated number of pairs of spotted owls that can besupported by <strong>the</strong> kind, amount, and distribution of suitable habitat in <strong>the</strong>area. As used in <strong>the</strong> recovery plan, this means <strong>the</strong> same as capability tosupport spotted owl pairs.Harvest cutting method - methods used to harvest trees. Harvest cuttingmethods are classified as even-aged and uneven-aged. RGHCA (habitat conservation area) - as proposed by <strong>the</strong> Interagency ScientificCommittee, a contiguous block of habitat to be managed and conserved<strong>for</strong> breeding pairs, connectivity, and distribution of owls; application mayvary throughout <strong>the</strong> range according to local conditions.HCP (habitat conservation plan) - an agreement between <strong>the</strong> Secretary of <strong>the</strong>Interior and ei<strong>the</strong>r a private entity or a state that specifies conservationmeasures that will be implemented in exchange <strong>for</strong> a permit that wouldallow taking of a threatened or endangered species.Home range - <strong>the</strong> area within which an animal conducts its activities during adefined period of time.Home range of a pair - <strong>the</strong> sum of <strong>the</strong> home ranges of each member of a pairminus <strong>the</strong> area of home range overlap.Horizontal diversity - <strong>the</strong> distribution and abundance of plant and animalcommunities and successional stages across an area of land; <strong>the</strong> greater <strong>the</strong>number of communities, <strong>the</strong> higher <strong>the</strong> degree of horizontal diversity. RG651
Hummocky - a landscape characterized by small, well-drained areas risingabove <strong>the</strong> general level of poorly-drained land.Hybrid - an offspring that results from <strong>the</strong> mating of individuals of differentraces or species.Hybridization - <strong>the</strong> crossing or mating of two different varieties of plants oranimals.Incidental take - 'take" of a threatened or endangered species that is incidentalto, and not <strong>the</strong> purpose of, <strong>the</strong> carrying out of an o<strong>the</strong>rwise lawfulactivity.Inholding - land belonging to one landowner that occurs within a block of landbelonging to ano<strong>the</strong>r. For example, small parcels of private land thatoccur inside national <strong>for</strong>ests.Integrated pest management - a process <strong>for</strong> selecting strategies to regulate<strong>for</strong>est pests in which all aspects of a pest-host system are studied andweighed. Regulatory strategies are based on sound silvicultural practicesand ecology of <strong>the</strong> pest-host system and consist of a combination oftactics such as timber stand improvement plus selective use of pesticides.RGInteragency <strong>Spotted</strong> <strong>Owl</strong> Subcommittee - a subcommittee of <strong>the</strong> Oregon-Washington Interagency Wildlife Committee that was <strong>for</strong>med to recommendguidelines to federal land management agencies <strong>for</strong> <strong>the</strong> protectionof <strong>the</strong> nor<strong>the</strong>rn spotted owl.Interspecific - occuring among members of different species.Interspecific competition - <strong>the</strong> condition of rivalry that exists when a numberof organisms of different species use common resources that are in shortsupply; or, if <strong>the</strong> resources are not in short supply, <strong>the</strong> condition thatoccurs when <strong>the</strong> organisms seeking that resource never<strong>the</strong>less harm oneor ano<strong>the</strong>r in <strong>the</strong> process. Competition usually is confined to closelyrelated species that eat <strong>the</strong> same sort of food or live in <strong>the</strong> same sort ofplace. Competition typically results in ultimate elimination of <strong>the</strong> lesseffective organism from that ecological niche. WPGIntraspecific - occuring among members of single species.ISC (Interagency Scientific Committee) - a committee of scientists that wasestablished by <strong>the</strong> U.S. Forest Service, U.S. Bureau of Land Management,U./S. Fish and Wildlife Service, and National Park Service, to develop aconservation strategy <strong>for</strong> nor<strong>the</strong>rn spotted owls.Isolate - a population that is isolated. See isolation.Isolation - absence of genetic crossing among populations because of distanceor geographic barriers. SAFJamison strategy - a spotted owl conservation strategy adopted by <strong>the</strong> U.S.Bureau of Land Management that included some but not all of <strong>the</strong> majorprovisions of <strong>the</strong> ISC strategy.Jeopardy - a finding made through consultation under <strong>the</strong> EndangeredSpecies Act that <strong>the</strong> action of a federal agency is likely to jeopardize <strong>the</strong>continued existence of a threatened or endangered species.652
Kuchler vegetative types - potential natural vegetation of <strong>the</strong> coterminousUnited States, classified by Kuchler. RGLambda - <strong>the</strong> rate of population change (population size in year 2 divided by<strong>the</strong> population size in year 1).Landsat - a satellite that produces imagery used in remote sensing of <strong>for</strong>ests.Analysis of this imagery produces maps of vegetation condition.Late seral stage <strong>for</strong>est - stage in <strong>for</strong>est development that includes mature andold-growth <strong>for</strong>est.M - thousand. RGManaged <strong>for</strong>est - refers to any <strong>for</strong>estland, including owl habitat, that is treatedwith silivicultural practices and/or harvested. Generally applied to landthat is harvested on a scheduled basis and contributes to an allowablesale quantity.Managed pair areas - In some portions of <strong>the</strong> range it is necessary to provideadditional protection <strong>for</strong> matrix pairs and territorial singles. This consistsof delineating a core habitat area, plus additional acreage of suitablehabitat around <strong>the</strong> core. The acreage to be delineated around <strong>the</strong> corevaries throughout <strong>the</strong> range, based on data <strong>for</strong> pairs in that area. Thesuitable acreage must be delineated within an area equal to <strong>the</strong> meanhome range <strong>for</strong> that province. Appropriate silvicultural treatment isencouraged in suitable and unsuitable habitat in <strong>the</strong> acreage around <strong>the</strong>core.Management prescription - <strong>the</strong> management practices and intensity selectedand scheduled <strong>for</strong> application on a specific area to attain multiple-useand o<strong>the</strong>r goals and objectives. RGMatrix - land within <strong>the</strong> range of <strong>the</strong> nor<strong>the</strong>rn spotted owl that lies outside ofcategory 1 and 2 designated conservation areas.Mature stand - A mappable stand of trees <strong>for</strong> which <strong>the</strong> annual net rate ofgrowth has culminated. Stand age, diameter of dominant trees, andstand structure at maturity vary by <strong>for</strong>est cover types and local siteconditions. Mature stands generally contain trees with a smaller averagediameter, less age class variation, and less structural complexity thanold-growth stands of <strong>the</strong> same <strong>for</strong>est type. Mature stages of some <strong>for</strong>esttypes are suitable habitat <strong>for</strong> spotted owls; however, mature <strong>for</strong>ests arenot always spotted owl habitat, and spotted owl habitat is not alwaysmature <strong>for</strong>est.MBF - thousand board feet. Lumber or timber measurement term. RGMean - a central value of a series or set of observations obtained by dividing<strong>the</strong> sum of all observations by <strong>the</strong> number of observations. SAFMesic - pertaining to or adapted to an area that has a balanced supply ofwater. Nei<strong>the</strong>r wet nor dry.Metapopulation - a population comprised of a set of local populations that arelinked by migrants, allowing <strong>for</strong> recolonization of unoccupied habitatpatches after local extinction events.Minimum viable population - <strong>the</strong> low end of <strong>the</strong> viable population range. RG653
Mixed conifer - as used in this document, <strong>the</strong> term "mixed conifer" refers tostands of trees, made up of pine, Douglas-fir, and true firs, that aregenerally found east of <strong>the</strong> Cascades.Mixed-conifer <strong>for</strong>est - a <strong>for</strong>est community that is dominated by two or moreconiferous species.Mixed-evergreen <strong>for</strong>est - a <strong>for</strong>est community that is dominated by two ormore species of broad-leaved hardwoods whose foliage persists <strong>for</strong> severalyears: important western species include madrone, tanoak, chinquapin,canyon live oak, and Cali<strong>for</strong>nia-laurel.MM - million. RGMMBF - million board feet. Lumber or timber measurement term.Modal - of or relating to a statistical mode that is <strong>the</strong> highest-frequency value<strong>for</strong> a variable in a data set. WEBModel - an idealized representation of reality developed to describe, analyze, orunderstand <strong>the</strong> behavior of some aspect of it; a ma<strong>the</strong>matical representationof <strong>the</strong> relationships under study. The term model is applicable to abroad class of representations, ranging from a relatively simple qualitativedescription of a system or organization to a highly abstract set of ma<strong>the</strong>maticalequations.Monitoring - a process of collecting in<strong>for</strong>mation to evaluate whe<strong>the</strong>r objectivesof a management plan are being realized.Multiple use - <strong>the</strong> management of renewable resources so that <strong>the</strong>y areutilized in <strong>the</strong> combination that will best meet <strong>the</strong> needs of people. RGMultistoried - term applied to <strong>for</strong>est stands that contain trees of variousheights and diameter classes and <strong>the</strong>re<strong>for</strong>e support foliage at variousheights in <strong>the</strong> vertical profile of <strong>the</strong> stand.Multivariate analysis - a field of statistics in which multiple variables are usedto compare sample groups. Multivariate analysis contrasts withunivariate analysis, in which single variables are used to compare samplegroups.NAAgS - National Ambient Air Quality Standards. RGNatal area - <strong>the</strong> location where an animal was born.NEPA - National Environmental Policy Act of 1969. RGNesting, roosting, and <strong>for</strong>aging (NRF) habitat - <strong>for</strong>est vegetation with appropriatestructure and composition to meet some or all of <strong>the</strong> life needs ofnor<strong>the</strong>rn spotted owls.Nexus - a means of connection. Often used in a legal context to refer to <strong>the</strong>legal connection between one action and ano<strong>the</strong>r.NF - National <strong>for</strong>est. RGNFMA - National Forest Management Act of 1976. RGNocturnal - referring to organisms that are active or functional at night. EFG654
Nonmarket - products derived from resources that do not have a well-establishedmarket value: <strong>for</strong> example, recreation, wilderness, wildlife. RGOccupancy rate - in reference to spotted owls, <strong>the</strong> percent of inventoriedspotted owl habitat that is estimated to be occupied by breeding pairs ofspotted owls.Off-road vehicles (ORVs) - vehicles such as motorcycles, all-terrain vehicles,four-wheel drive vehicles, and snowmobiles. RGOld-growth - a <strong>for</strong>est stand with moderate to high canopy closure; a multilayered,multispecies canopy dominated by large overstory trees; a highincidence of large trees with large, broken tops, and o<strong>the</strong>r indications ofdecadence; numerous large snags; and heavy accumulations of logs ando<strong>the</strong>r woody debris on <strong>the</strong> ground.Old-growth species - plant and animal species that exhibit a strong associationwith old-growth <strong>for</strong>ests.Old-growth stand - a mappable area of old-growth <strong>for</strong>est.Oregon-Washington Interagency Wildlife Committee - a committee composedof administrators from federal and state agencies; including <strong>the</strong>U.S. Forest Service, <strong>the</strong> U.S. Fish and Wildlife Service, U.S. Bureau ofLand Management, <strong>the</strong> Oregon Department of Fish and Wildlife, and <strong>the</strong>Washington Department of Game.Overstory - trees that provide <strong>the</strong> uppermost layer of foliage in a <strong>for</strong>est withmore than one roughly horizontal layer of foliage.<strong>Owl</strong> site - any site where <strong>the</strong>re has been a recent or historic observation of asingle spotted owl or a pair of owls.Pair site - an amount of habitat that is considered capable of supporting onepair of spotted owls.Phenology - <strong>the</strong> annual recurrence of plant and animal phenomena that isinfluenced by seasonal and o<strong>the</strong>r environmental changes, e.g., floweringof plants, ripening of fruit.Physiographic province - a geographic region in which climate and geologyhave given rise to a distinct array of land<strong>for</strong>ms. Biology and habitatrelationships of spotted owls vary by physiographic province due todifferences in climate, vegetation, and productivity of habitats.Plat<strong>for</strong>m nest - a relatively flat nest constructed on a supporting structuresuch as a broad branch.Population density - number of individuals of a species per unit area.Population dynamics - <strong>the</strong> aggregate of changes that occur during <strong>the</strong> life of apopulation. Included are all phases of recruitment and growth, senility,mortality, seasonal fluctuation in biomass, and persistence of each yearclass and its relative dominance, as well as <strong>the</strong> effects that any or all of<strong>the</strong>se factors exert on <strong>the</strong> population. SAFPopulation viability - probability that a population will persist <strong>for</strong> a specifiedperiod of time across its range despite normal fluctuations in populationand environmental conditions.655
Potential habitat - a stand of trees of a vegetation type used by spotted owlsthat is not currently suitable, but is capable of growing or developing intosuitable habitat in <strong>the</strong> future. In general, potential habitats are stands in<strong>the</strong> earlier successional stages of <strong>for</strong>est types used by spotted owls.Power - <strong>the</strong> probability of rejecting <strong>the</strong> null hypo<strong>the</strong>ses in a statistical test.Precommercial thinning - <strong>the</strong> practice of removing some of <strong>the</strong> trees less thanmerchantable size from a stand so that remaining trees will grow faster.RGPredator - any animal that preys externally on o<strong>the</strong>rs, i.e., that hunts, kills,and generally feeds on a succession of hosts, i.e., <strong>the</strong> prey. SAFPrescribed fire - a fire burning under specified conditions that will accomplishcertain planned objectives. The fire may result from planned orunplanned ignitions. RGPresuppression - activities organized in advance of fire occurence to ensureeffective suppression action. RGProtective management - measures taken by nonfederal entities to conservespotted owls and/or <strong>the</strong>ir habitat; measures may include participation inconservation planning (as defined in Endangered Species Act section 10)or o<strong>the</strong>r actions that benefit owls; entities may be states, private landowners,Indian tribes, or o<strong>the</strong>rs.Province - see physiographic province.Quarter-township - an area approximately 3 miles square containing ninesections of land.Radio-telemetry - automatic measurement and transmission of data fromremote sources via radio to a receiving station <strong>for</strong> recording and analysis.In this recovery plan, it refers to <strong>the</strong> tracking of spotted owls by means ofsmall radio transmitters attached to <strong>the</strong>m. NADRandom - being or relating to a set or to an element of a set each of whoseelements has equal probability of occurrence, also characterized byprocedures to obtain such sets or elements. WEBRange (of a species) - <strong>the</strong> area or region over which an organism occurs. EFG<strong>Recovery</strong> - action that is necessary to reduce or resolve <strong>the</strong> threats thatcaused a species to be listed as threatened or endangered.Recruitment - <strong>the</strong> addition to a population from all causes, i.e., reproduction,immigration, and stocking. Recruitment may refer literally to numbersborn or hatched or to numbers at a specified stage of life such as breedingage or weaning age. SAFRe<strong>for</strong>estation - <strong>the</strong> natural or artificial restocking of an area with <strong>for</strong>est trees;most commonly used in reference to artificial restocking. RGRefugia - havens of safety where populations have high probability of survivingperiods of adversity.Regeneration - <strong>the</strong> actual seedlings and saplings existing in a stand; or <strong>the</strong>act of establishing young trees naturally or artificially. RG656
Regulated <strong>for</strong>est - a <strong>the</strong>oretical managed <strong>for</strong>est from which <strong>the</strong> same acreageof stands can be harvested annually in perpetuity.Regulations - generally refers to <strong>the</strong> Code of Federal Regulations.Rescue effect - immigration of new individuals sufficient to maintain a populationthat might o<strong>the</strong>rwise decline toward extinction.Reserved land - lands that have been removed from <strong>the</strong> acreage base used tocalculate timber yields. These lands often have a preservation or protectionstatus. Wildernesses, research natural areas, and national recreationareas are examples of reserved lands.Reserved pair areas - In those portions of <strong>the</strong> species' range where habitatand owl populations were inadequate to apply <strong>the</strong> criteria creating DCAs1 and 2, individual pair areas were also reserved. These are areas ofsuitable habitat identified <strong>for</strong> pairs and territorial single owls. Theacreage of <strong>the</strong>se areas varies throughout <strong>the</strong> range, based on data <strong>for</strong>pairs in each province. All suitable habitat is reserved within an areaequal to <strong>the</strong> mean home range <strong>for</strong> that province.Residual habitat area - a 100-acre area of nesting, roosting, and <strong>for</strong>aginghabitat encompassing <strong>the</strong> activity center <strong>for</strong> a pair of owls or a territorialsingle owl in <strong>the</strong> matrix.Residual stand - <strong>the</strong> trees that remain standing after some event such asselection cutting. RGRiparian area - a geographically delineated area with distinctive resourcevalues and characteristics that comprises aquatic and riparian ecosystems.This includes floodplains, wetlands, and all areas within a horizontaldistance of approximately 100 feet from <strong>the</strong> normal line of high waterof a stream channel or from <strong>the</strong> shoreline of a standing body of water. RGRoost - <strong>the</strong> resting behavior of an animal.Roost sites - a site where an animal roosts. Can refer to daytime and nighttimeroosting. Sites often provide protection from environmental conditionsand from predators.Rotation - <strong>the</strong> planned number of years between <strong>the</strong> regeneration of an evenagedstand and its final cutting at a specified stage.Rotation age - <strong>the</strong> age of a stand when harvested at <strong>the</strong> end of a rotation. RGSanitation salvage - removal of dead, damaged, or susceptible trees primarilyto prevent <strong>the</strong> spread of pests or pathogens and to promote <strong>for</strong>est hygiene.RGSapling - a loose term <strong>for</strong> a young tree no longer a seedling but not yet a pole.It is generally a few feet high and 2 to 4 inches dbh, typically growingvigorously and without dead bark or more than an occasional deadbranch. SAFSecond-growth - relatively young <strong>for</strong>ests that have developed following adisturbance (<strong>for</strong> example, wholesale cutting, serious fire, or insect attack)of <strong>the</strong> previous old-growth <strong>for</strong>est.Section 7 - <strong>the</strong> section of <strong>the</strong> Endangered Species Act that specifies <strong>the</strong> rolesof interagency coordination in accomplishing <strong>the</strong> objective of species recovery.657
Sensitive species - those species that 1) have appeared in <strong>the</strong> Federal Registeras proposed <strong>for</strong> classification and are under consideration <strong>for</strong> officiallisting as endangered or threatened species; or 2) are on an official statelist; or 3) are recognized by <strong>the</strong> U.S. Forest Service or o<strong>the</strong>r managementagency as needing special management to prevent <strong>the</strong>ir being placed onfederal or state lists. RGSeral - a biotic community that is a developmental, transitory stage in anecological succession. RGSeral species - species associated with an early stage in <strong>the</strong> development of abiotic community.Sexual dimorphism - <strong>the</strong> differences in size, weight, color, or o<strong>the</strong>r morphologicalcharacteristics that are related to <strong>the</strong> sex of <strong>the</strong> animal.Shelterwood - an even-aged silvicultural system in which <strong>the</strong> old <strong>for</strong>est isremoved in two or more successive cuttings. SAFSilviculture - <strong>the</strong> science and practice of controlling <strong>the</strong> establishment,composition, and growth of <strong>for</strong>ests. RGSink - population whose average reproductive rate is less than its average rateof mortality: such areas attract immigrants not expected to contributesignificantly to future populations. See source.Slash - <strong>the</strong> residue left on <strong>the</strong> ground after timber cutting. It includes unusedlogs, uprooted stumps, broken or uprooted stems, branches, twigs,leaves, bark, and chips. RGSnag - a standing dead tree. GETSocioeconomic - pertaining to, or signifying <strong>the</strong> combination or interaction of,social and economic factors. RGSOHA (spotted owl habitat area) - a habitat area designated to support onepair of owls. Such areas were prescribed in some previous plans <strong>for</strong>nor<strong>the</strong>rn spotted owl conservation.SOMA (spotted owl management area) - an area designated to support threepairs of owls with home ranges separated by no more than 1.5 miles.Such areas were prescribed in some previous plans <strong>for</strong> nor<strong>the</strong>rn spottedowl conservation.Source - an actively breeding population that has an average birth rate thatexceeds its average death rate; produces an excess number of juvenilesthat may disperse to o<strong>the</strong>r areas.Species - 1) a group of individuals that have <strong>the</strong>ir major characteristics incommon and are potentially interfertile. EFG 2) <strong>the</strong> Endangered SpeciesAct defines species as including any species or subspecies of plant oranimal. Distinct populations of vertebrates also are considered to bespecies under <strong>the</strong> act.Stand (tree stand) - an aggregation of trees occupying a specific area andsufficiently uni<strong>for</strong>m in composition, age, arrangement, and condition asto be distinguishable from <strong>the</strong> <strong>for</strong>est in adjoining areas. RG658Stand condition - a description of <strong>the</strong> physical properties of a stand such ascrown closure or diameters. SAF
Stand-replacing event - a disturbance that is severe enough over a largeenough area (<strong>for</strong> example, 10 acres) to virtually eliminate an existingstand of trees and initiate a new stand.Standards and guidelines - standards and guidelines are <strong>the</strong> primary statementof direction <strong>for</strong> land managers. In <strong>the</strong> recovery plan, standards andguidelines are recommended as actions necessary to accomplish recovery.Stochastic - random, uncertain; involving a random variable.Stochastic model - a model that includes representation of random events.Stocking - <strong>the</strong> degree of occupancy of an area of land by trees as measured bybasal area or number of trees and as compared to a stocking standard:that is, <strong>the</strong> basal area or number of trees required to fully use <strong>the</strong> growthpotential of <strong>the</strong> land. RGStumpage - <strong>the</strong> value of standing timber.Subadult - a young spotted owl that has dispersed but has not yet reachedbreeding age. Subadults are in <strong>the</strong>ir second, or in some cases, third yearof life.Subpopulation - a well-defined set of interacting individuals that comprise aproportion of a larger, interbreeding population.Subspecies - a population of a species occupying a particular geographic area,or less commonly, a distinct habitat, capable of interbreeding with o<strong>the</strong>rpopulations of <strong>the</strong> same species. EFGSuccessional stage - a stage or recognizable condition of a plant communitythat occurs during its development from bare ground to climax; <strong>for</strong>example, coniferous <strong>for</strong>ests in <strong>the</strong> Blue Mountains progress through sixrecognized stages: grass-<strong>for</strong>b; shrub-seedling; pole-sapling; young;mature; old-growth. RG See also Seral.Suitable habitat - in <strong>the</strong> recovery plan, an area of <strong>for</strong>est vegetation with <strong>the</strong>age-class, species of trees, structure, sufficient area, and adequate foodsource to meet some or all of <strong>the</strong> life needs of <strong>the</strong> nor<strong>the</strong>rn spotted owl.See also nesting, roosting, and <strong>for</strong>aging habitat.Suitable spotted owl habitat - See suitable habitat.Superior habitat - in <strong>the</strong> recovery plan, habitat selected in excess of availabilityby <strong>the</strong> majority of individual nor<strong>the</strong>rn spotted owls.Supplemental pair areas - areas on nonfederal lands where habitat is maintainedto support spotted owl pairs or territorial singles.Suppression - <strong>the</strong> action of extinguishing or confining a fire. RGSurvivorship - <strong>the</strong> proportion of newborn individuals that are alive at a givenage. EFGSustained yield or production - <strong>the</strong> amount of timber that a <strong>for</strong>est canproduce continuously from a given intensity of management; impliescontinuous production; a primary goal is to achieve a balance betweenincremental growth and cutting.659
Take -Uunder <strong>the</strong> Endangered Species Act, take means to harrass, harm,pursue, hunt, shoot, wound, kill, trap, capture or collect an animal, or toattempt to engage in any such conduct.Taking (section 7) - implementing an action that results in take.Taxon - a category in a scientific classification system, such as class, family, orphylum.Territorial single - an unpaired owl that is defending a territory.Territory - <strong>the</strong> area that an animal defends, usually during breeding season,against intruders of its own species.Thermoregulation - <strong>the</strong> physiological and biological process whereby ananimal regulates its body temperature.Threatened species - those plant or animal species likely to become endangeredspecies throughout all or a significant portion of <strong>the</strong>ir range within<strong>the</strong> <strong>for</strong>eseeable future. A plant or animal species identified by <strong>the</strong> Secretaryof Interior as threatened, in accordance with <strong>the</strong> 1973 EndangeredSpecies Act. RGTimber classification - <strong>the</strong> following are definitions of timber classifications:1. Non<strong>for</strong>est - land that has never supported <strong>for</strong>ests and land <strong>for</strong>merly<strong>for</strong>ested where use <strong>for</strong> timber production is precluded by development oro<strong>the</strong>r uses.2. Forest - land at least 10 percent stocked (based on crown cover) by <strong>for</strong>esttrees of any size, or <strong>for</strong>merly having had such tree cover and not currentlydeveloped <strong>for</strong> non<strong>for</strong>est use.3. Suitable - commercial <strong>for</strong>estland identified as appropriate <strong>for</strong> timberproduction.4. Unsuitable - <strong>for</strong>estland withdrawn from timber utilization by statue oradministrative regulation (<strong>for</strong> example, wilderness), or locally identified asnot appropriate <strong>for</strong> timber production.Timber harvest schedule - <strong>the</strong> quantity of timber planned <strong>for</strong> sale and harvest,by time period, from <strong>the</strong> area of land administered by a federalagency. The first period, usually a decade, of <strong>the</strong> selected harvest scheduleprovides <strong>the</strong> allowable sale quantity. RGTimber production - <strong>the</strong> purposeful growing, tending, harvesting, and regenerationof regulated crops of trees to be cut into logs, bolts, or o<strong>the</strong>r roundsections <strong>for</strong> industrial or consumer use o<strong>the</strong>r than <strong>for</strong> fuelwood. RGTimber stand - see stand.Timber stand improvement - measures such as thinning, pruning, releasecutting, prescribed fire, girdling, weeding, or poisoning of unwanted treesaimed at improving growing conditons <strong>for</strong> <strong>the</strong> remaining trees. RGTrophic level - <strong>the</strong> level in <strong>the</strong> food chain at which an organism sustains itself.Understory - <strong>the</strong> trees and o<strong>the</strong>r woody species growing under a more or lesscontinuous cover of branches and foliage <strong>for</strong>med collectively by <strong>the</strong> upperportions of adjacent trees and o<strong>the</strong>r woody growth. WPGUneven-aged management - <strong>the</strong> application of a combination of actionsneeded to simultaneously maintain continuous tall <strong>for</strong>est cover, recurring660
egeneration of desirable species, and <strong>the</strong> orderly growth and developmentof trees through a range of diameter or age classes. Cutting methodsthat develop and maintain uneven-aged stands are single-tree selectionand group selection. RGUnsuitable habitat - <strong>for</strong>ested lands that currently do not meet <strong>the</strong> habitatneeds of spotted owls <strong>for</strong> nesting, roosting, or <strong>for</strong>aging, but are ecologicallycapable of doing so. This habitat is deficient in tree size, canopyclosure, and/or stand decadence. It results from timber harvest ornatural disturbance. Also referred to as 'potential habitat.'USDA - U.S. Department of Agriculture.USDI - U.S. Department of <strong>the</strong> Interior.Verified pair - a pair of spotted owls of specified breeding status identifiedaccording to a standard field survey procedure.Vertical diversity - <strong>the</strong> diversity in a stand that results from <strong>the</strong> complexity of<strong>the</strong> above ground structure of <strong>the</strong> vegetation; <strong>the</strong> more tiers of vegetationor <strong>the</strong> more diverse <strong>the</strong> species makeup (or both), <strong>the</strong> higher <strong>the</strong> degree ofvertical diversity. RG See also horizontal diversity.Viability - <strong>the</strong> ability of a population to maintain sufficient size so that itpersists over time in spite of normal fluctuations in numbers; usuallyexpressed as a probability of maintaining a specific population <strong>for</strong> aspecified period.Viable population - a population that contains an adequate number of individualsappropriately distributed to ensure <strong>the</strong> long-term existence of <strong>the</strong>species. RGVital rates - rates of key demographic functions within a population, such as<strong>the</strong> birth rate and survival rate.Vole - any rodent of <strong>the</strong> genus Microtus and related genera, that resemblesrats or mice, but has a relatively short tail. NADWell distributed - a geographic distribution of habitats that maintains apopulation throughout a planning area and allows <strong>for</strong> interaction ofindividuals through periodic interbreeding and colonization of unoccupiedhabitats.West side <strong>for</strong>ests - <strong>the</strong> 11 national <strong>for</strong>ests within <strong>the</strong> range of <strong>the</strong> nor<strong>the</strong>rnspotted owl in Washington, Oregon, and Cali<strong>for</strong>nia that lie west of <strong>the</strong>Cascade Mountain Range crest. They are <strong>the</strong> Gif<strong>for</strong>d Pinchot, Mendocino,Mt. Baker-Snoqualmie, Mt. Hood, Olympic, Rogue River, Siskiyou,Siuslaw, Six Rivers, Umpqua, and Willamette National Forests. RGWetlands - areas that are inundated by surface water or groundwater with afrequency sufficient to support, and under normal circumstances do orwould support, a prevalence of vegetative or aquatic life that requiresaturated or seasonally saturated soil conditions <strong>for</strong> growth and reproduction(Executive Order 11990). RGWild and scenic rivers - those rivers or sections of rivers designated as suchby congressional action under <strong>the</strong> 1968 Wild and Scenic Rivers Act, assupplemented and amended, or those sections of rivers designated as661
wild, scenic, or recreational by an act of <strong>the</strong> legislature of <strong>the</strong> state orstates through which <strong>the</strong>y flow. Wild and scenic rivers may be classifiedand administered under one or more of <strong>the</strong> following categories:1. Wild River Areas - those rivers or sections of rivers that are free ofimpoundments and generally inaccessible except by trail, withwatersheds or shorelines essentially primitive and waters unpolluted.These represent vestiges of primitive America.2. Scenic River Areas - those rivers or sections of rivers that are free ofimpoundments, with watersheds still largely primitive and shorelineslargely undeveloped, but accessible in places by roads.3. Recreational River Areas - those rivers or sections of rivers that arereadily accessible by road or railroad, that may have some developmentalong <strong>the</strong>ir shorelines, and that may have undergone someimpoundment or diversion in <strong>the</strong> past. RGWilderness - areas designated by congressional action under <strong>the</strong> 1964 WildernessAct. Wilderness is defined as undeveloped federal land retaining itsprimeval character and influence without permanent improvements orhuman habitation. Wilderness areas are protected and managed topreserve <strong>the</strong>ir natural conditions, which generally appear to have beenaffected primarily by <strong>the</strong> <strong>for</strong>ces of nature, with <strong>the</strong> imprint of humanactivity substantially unnoticeable; have outstanding opportunities <strong>for</strong>solitude or <strong>for</strong> a primitive and confined type of recreation; include at least5,000 acres or are of sufficient size to make practical <strong>the</strong>ir preservation,enjoyment, and use in an unimpaired condition; and may contain featuresof scientific, educational, scenic, or historical value as well asecologic and geologic interest. RGWildfire - any wildland fire that is not a prescribed fire. RGWindfall - trees or parts of trees felled by high winds. See also blowdown andwindthrow.Windthrow - a tree or group of trees uprooted by <strong>the</strong> wind.Yarding - <strong>the</strong> moving of logs from <strong>the</strong> stump to a central concentration area orlanding. RGYUM (yarding of unmerchantable material) - moving unmerchantableportions of trees from <strong>the</strong> stump to a central concentration area.662,'. U S GOVERNMENT PRINTING OFFICE 1991-691-303/42,200 REGION 10