Conceptual Site Model - Argonne National Laboratory
Conceptual Site Model - Argonne National Laboratory Conceptual Site Model - Argonne National Laboratory
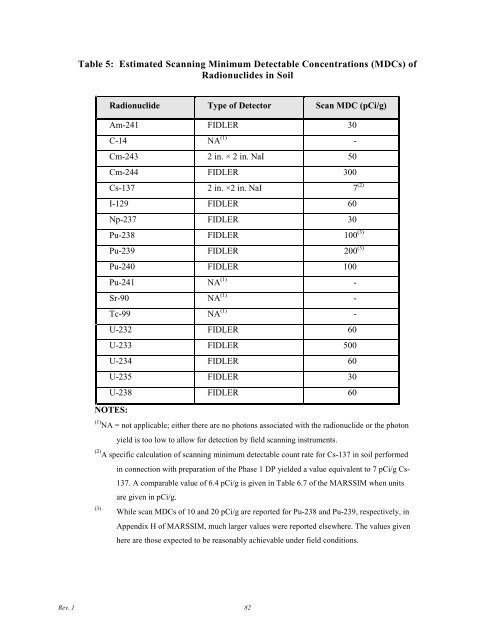
Table 5: Estimated Scanning Minimum Detectable Concentrations (MDCs) ofRadionuclides in SoilRadionuclide Type of Detector Scan MDC (pCi/g)Am-241 FIDLER 30C-14 NA (1) -Cm-243 2 in. × 2 in. NaI 50Cm-244 FIDLER 300Cs-137 2 in. ×2 in. NaI 7 (2)I-129 FIDLER 60Np-237 FIDLER 30Pu-238 FIDLER 100 (3)Pu-239 FIDLER 200 (3)Pu-240 FIDLER 100Pu-241 NA (1) -Sr-90 NA (1) -Tc-99 NA (1) -U-232 FIDLER 60U-233 FIDLER 500U-234 FIDLER 60U-235 FIDLER 30U-238 FIDLER 60NOTES:(1) NA = not applicable; either there are no photons associated with the radionuclide or the photonyield is too low to allow for detection by field scanning instruments.(2) A specific calculation of scanning minimum detectable count rate for Cs-137 in soil performed(3)in connection with preparation of the Phase 1 DP yielded a value equivalent to 7 pCi/g Cs-137. A comparable value of 6.4 pCi/g is given in Table 6.7 of the MARSSIM when unitsare given in pCi/g.While scan MDCs of 10 and 20 pCi/g are reported for Pu-238 and Pu-239, respectively, inAppendix H of MARSSIM, much larger values were reported elsewhere. The values givenhere are those expected to be reasonably achievable under field conditions.Rev. 1 82
WVDP Phase 1 CSAPperformance will be compared with FIDLER detector performance for an area of the premises known tohave Cs-137 surface soil contamination present. The methods for this comparison are explained in detailin Section 6.11. If the results are that the FIDLER provides sufficiently low MDC levels for Cs-137, onlya FIDLER will be deployed for the remainder of gross gamma survey work. Alternatively, if the 2 in. × 2in. detector proves capable of identifying Cs-137 at levels that would be CG w concerns and that theFIDLER cannot identify, then both a FIDLER and a 2 in. × 2 in. NaI detector will be used for GWS.Because of the range of field conditions and data collection requirements that fall under the CSAP,providing details about all potential detectors and their performance characteristics is beyond the scope ofthis document. However, for each field data collection activity conducted under the CSAP, a fieldsampling plan will be prepared. If the field work includes the collection of scanning data, the detector(s)to be used will be identified, their deployment configurations and protocols specified, their MDCsestimated, and appropriate QC details provided.11.3 BackgroundThe GWS data from the reference area will be used to evaluate the gross activity detector response forsurface soils with background conditions. Gross activity from a survey of the background area will exhibitvariability that is a product of both counting errors and the natural variability in gross activity present inbackground soils. Section 6.7.1 of MARSSIM provides a general methodology for identifying anomalousmeasurement results in the presence of background conditions. As an example, a measurement greaterthan three standard deviations above average background gross activity levels would be highly unlikelyunless either one was in an area with different background conditions or contamination was present.Because of the variety of surface cover that is present on the WVDP premises, background detectorresponses are expected to also vary significantly depending on the nature of the surface being scanned.While a surface soil reference area will be established and a background detector response developed foreach detector used on the WVDP premises (see Sections 8 and 11.5), this reference area background willbe directly applicable only to comparable areas of the WVDP premises where other types of ground coversuch as pavement or hardstand material are not present.Because of varying background conditions and because areas where contamination is present in surfacesoils may have more than one gamma-emitting radionuclide above background conditions, it will not bepossible to establish a unique field investigation level for determining when contamination is present thatRev. 1 83
- Page 48 and 49: WVDP Phase 1 CSAP• In areas where
- Page 50 and 51: WVDP Phase 1 CSAPsample indicate co
- Page 52 and 53: WVDP Phase 1 CSAP• Buried infrast
- Page 54 and 55: WVDP Phase 1 CSAP• In all cases,
- Page 56 and 57: WVDP Phase 1 CSAPOne sample will be
- Page 58 and 59: WVDP Phase 1 CSAP• A minimum of f
- Page 60 and 61: WVDP Phase 1 CSAPThe number of core
- Page 62 and 63: WVDP Phase 1 CSAPFor field or on-si
- Page 64 and 65: WVDP Phase 1 CSAP• Samples will b
- Page 66 and 67: WVDP Phase 1 CSAPThe detection limi
- Page 68 and 69: WVDP Phase 1 CSAPcollected and subm
- Page 70 and 71: WVDP Phase 1 CSAPHowever, this is n
- Page 72 and 73: WVDP Phase 1 CSAPof 15 cm and analy
- Page 74 and 75: WVDP Phase 1 CSAPscans will be empl
- Page 76 and 77: WVDP Phase 1 CSAPThis page intentio
- Page 78 and 79: WVDP Phase 1 CSAPperformance for th
- Page 80 and 81: WVDP Phase 1 CSAPThis page intentio
- Page 82 and 83: WVDP Phase 1 CSAP3. Utility Surveys
- Page 84 and 85: WVDP Phase 1 CSAPField notebooks wi
- Page 86 and 87: WVDP Phase 1 CSAP10.2 Groundwater S
- Page 88 and 89: WVDP Phase 1 CSAPphotographs are ta
- Page 90 and 91: WVDP Phase 1 CSAPthe course of fiel
- Page 92 and 93: WVDP Phase 1 CSAP10.6.2 Additional
- Page 94 and 95: WVDP Phase 1 CSAPplan will identify
- Page 96 and 97: WVDP Phase 1 CSAPFigure 7 WVDP Radi
- Page 100 and 101: WVDP Phase 1 CSAPpotentially exceed
- Page 102 and 103: WVDP Phase 1 CSAP• Each detector
- Page 104 and 105: WVDP Phase 1 CSAPThis page intentio
- Page 106 and 107: WVDP Phase 1 CSAP12.2 Standard Labo
- Page 108 and 109: WVDP Phase 1 CSAPThis page intentio
- Page 110 and 111: WVDP Phase 1 CSAPThis page intentio
- Page 112 and 113: WVDP Phase 1 CSAP• The data compl
- Page 114 and 115: WVDP Phase 1 CSAPThis page intentio
- Page 116 and 117: WVDP Phase 1 CSAPThis page intentio
- Page 118 and 119: WVDP Phase 1 CSAPVitrification Faci
- Page 120 and 121: WVDP Phase 1 CSAPA.4 Known and Susp
- Page 122 and 123: WVDP Phase 1 CSAPthe sanitary sewer
- Page 124 and 125: WVDP Phase 1 CSAPA.4.3.6Interceptor
- Page 126 and 127: WVDP Phase 1 CSAP1998, or 2008, and
- Page 128 and 129: WVDP Phase 1 CSAPcontaminated surfa
- Page 130 and 131: WVDP Phase 1 CSAPdata collection is
- Page 132 and 133: WVDP Phase 1 CSAParranged on a tria
- Page 134 and 135: WVDP Phase 1 CSAP• Slurry Wall Fo
- Page 136 and 137: WVDP Phase 1 CSAP• If contaminati
- Page 138 and 139: WVDP Phase 1 CSAPappears to extend
- Page 140 and 141: WVDP Phase 1 CSAPTable A.2 Sample N
- Page 142 and 143: WVDP Phase 1 CSAPFigure A.2 WMA 1 w
- Page 144 and 145: WVDP Phase 1 CSAPFigure A.4 North P
- Page 146 and 147: WVDP Phase 1 CSAPFigure A.6 WMA 1 A
Table 5: Estimated Scanning Minimum Detectable Concentrations (MDCs) ofRadionuclides in SoilRadionuclide Type of Detector Scan MDC (pCi/g)Am-241 FIDLER 30C-14 NA (1) -Cm-243 2 in. × 2 in. NaI 50Cm-244 FIDLER 300Cs-137 2 in. ×2 in. NaI 7 (2)I-129 FIDLER 60Np-237 FIDLER 30Pu-238 FIDLER 100 (3)Pu-239 FIDLER 200 (3)Pu-240 FIDLER 100Pu-241 NA (1) -Sr-90 NA (1) -Tc-99 NA (1) -U-232 FIDLER 60U-233 FIDLER 500U-234 FIDLER 60U-235 FIDLER 30U-238 FIDLER 60NOTES:(1) NA = not applicable; either there are no photons associated with the radionuclide or the photonyield is too low to allow for detection by field scanning instruments.(2) A specific calculation of scanning minimum detectable count rate for Cs-137 in soil performed(3)in connection with preparation of the Phase 1 DP yielded a value equivalent to 7 pCi/g Cs-137. A comparable value of 6.4 pCi/g is given in Table 6.7 of the MARSSIM when unitsare given in pCi/g.While scan MDCs of 10 and 20 pCi/g are reported for Pu-238 and Pu-239, respectively, inAppendix H of MARSSIM, much larger values were reported elsewhere. The values givenhere are those expected to be reasonably achievable under field conditions.Rev. 1 82


