Practice Test
Practice Test
Practice Test
You also want an ePaper? Increase the reach of your titles
YUMPU automatically turns print PDFs into web optimized ePapers that Google loves.
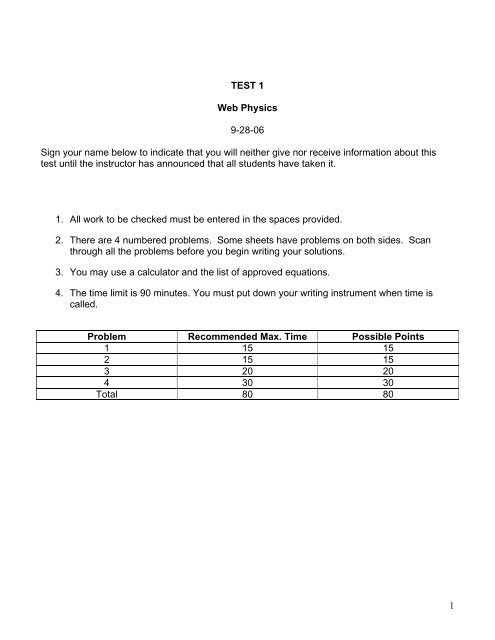
TEST 1Web Physics9-28-06Sign your name below to indicate that you will neither give nor receive information about thistest until the instructor has announced that all students have taken it.1. All work to be checked must be entered in the spaces provided.2. There are 4 numbered problems. Some sheets have problems on both sides. Scanthrough all the problems before you begin writing your solutions.3. You may use a calculator and the list of approved equations.4. The time limit is 90 minutes. You must put down your writing instrument when time iscalled.Problem Recommended Max. Time Possible Points1 15 152 15 153 20 204 30 30Total 80 801
1. A rocket sled on a straight, horizontal track accelerates uniformly from rest, achieving a velocity of 300 m/s in atime of 4.0 s. The velocity then remains constant for 2.0 s. Finally, the sled decelerates uniformly for 4.0 s at arate of 50 m/s².a. Draw a velocity vs. time graph of the motion of the rocket sled. (5 pts)300V (m/s)2001000 2 4 6 8 10t (s)b. Calculate the displacement of the sled in the following time intervals. You may simply write down youranswer. (5 pts)t = 0 to 4.0 s:t = 4.0 to 6.0 s:t = 6.0 to 10.0 s:c. Draw a position vs. time graph of the sled's motion. Scale the position axis. (5 pts)x (m)0 2 4 6 8 10t (s)2
2. A projectile is launched from point A with velocity, V o . Draw each of the following vectors with a lengthproportional to the magnitude of the velocity. This means you need to accurately determine the horizontal andvertical velocity components in order to draw the velocity vector with the correct direction and magnitude.a. the velocity vector at point B in the path (5 pts)b. the velocity vector at point C in the path (10 pts)Below the graph, describe in words how you determined each of the above velocities. While you may writedvats, your description must be primarily in sentence form. Four sentences should be sufficient.BCV oA3
3. A cannonball is fired from ground level toward a hill. The cannon is aimed at angle of 37° above the horizontal,and the ball leaves the barrel at a speed of 50 m/s. The top of the hill is 40 m higher than the top of thecannon.a. Draw your diagram and make your lists of givens. These will apply to all parts of this problem.Therefore, you only have to give this information once. (4 pts)b. Determine the two possible values of the vertical component of the cannonball's velocity as it strikesthe top of the hill. (6 pts)c. Determine the two possible values of the time interval between when the cannonball leaves the barreland it strikes the top of the hill. (6 pts)Continue this problem on the next page.4
d. Using your two values of the vertical component of velocity and the time interval between when theyoccur, show by direct calculation of a = ∆v/∆t that the vertical component of acceleration has theexpected value. (4 pts)4. The photograph (provided on the back of the cover page) is a multiple-image photograph of a plastic ballbouncing from left to right on a level table. The photograph is superimposed on a grid with x- and y-axes forease in taking position measurements. The images of the ball were taken with a light that produced flashes ata rate of 20.0 flashes/second. The images are numbered for convenience in referring to them. The x-axiscoincides with the table’s surface. Note that the ball was not in contact with the table for images 7 and 16.We will call the major divisions of the grid, gu (for grid units). With this unit, the entire grid is 22 gu long and 15gu high. In taking position measurements, read the grid scales to within 0.1 gu. That’s half of the smallestdivision.Use significant figures correctly in writing the results of calculations and measurements.Use g = 9.80 m/s².a. Suppose that measurements were taken of the horizontal position of the ball as a function of time fromimages 8 through 16. If a quadratic fit were performed on the horizontal positions as a function of time, tellhow you would use the results of the fit to show whether the horizontal velocity of the ball was constant.Explain your answer with reference to the appropriate dvat formula. (4 pts)b. With your pencil, place a dot at the bottom of each of the images 8 through 16 of the ball. Draw a smoothcurve through these points and extrapolate the curve down to intersect the table’s surface at y = 0. DONOT include image 7, as this was recorded before the ball bounced. (2 pts)c. Assume now that the horizontal velocity of the ball is uniform. Determine the horizontal velocity of the ballafter the first bounce. Take measurements to determine the magnitude of that velocity in gu/s to thegreatest accuracy you can. Specify clearly what measurements you take, and show your calculation of thehorizontal velocity below. (4 pts)5
d. Take measurements from the photograph to determine the maximum height reached by the ball after thefirst bounce. Remember, the table surface is at y = 0. Read positions from the bottom of the ball, and giveyour result in gu. (2 pts)e. The photograph is smaller than real life. The actual diameter of the ball is 0.0254 m. Use this in order todetermine a scale factor to convert distances measured on the photograph to actual distances. Brieflydescribe how you find the scale factor (1 sentence), and show your calculation. Give the scale factor inunits of meter/gu. (4 pts)f. Use your scale factor to convert your result from part c to units of m/s and your result from part d to units ofm. Give the converted values below. You need not show your work. (2 pts)Magnitude of horizontal velocity (m/s):Maximum height (m):Show your work for part g on the back of this page.g. Use the measurements that you’ve made up to this point to determine both the magnitude and direction ofthe initial velocity of the ball, that is, the velocity as the ball rebounded from the table between images 7and 8. Carry out the problem in an orderly manner. If you need to do scratch work, do it on separatepaper. It’s important that the instructor be able to follow your work. To that end, do the following:i. List the given information, identifying quantities with the usual symbols, including distinguishingsubscripts for horizontal and vertical quantities. A diagram isn’t needed, since the photo on the x-y gridserves that purpose. (3 pts)ii. State the goal. Make sure you know what you’re solving for. (1 pt)iii. Select appropriate dvats. Solve for the unknowns symbolically. Substitute values and units at the laststep. (8 pts)iv. Do your checks mentally rather than writing them.6


