Appendix D - Aquatic Assessment Report.pdf - Zitholele.co.za
Appendix D - Aquatic Assessment Report.pdf - Zitholele.co.za
Appendix D - Aquatic Assessment Report.pdf - Zitholele.co.za

Create successful ePaper yourself
Turn your PDF publications into a flip-book with our unique Google optimized e-Paper software.
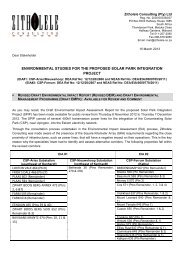
AQUATIC PES ASSESSMENT OF THE AQUATICRESOURCES ON THE ORANGE RIVER IN THE VICINITYOF A PROPOSED POWER LINE CROSSINGPrepared for:Jones and Wagenaar ServicesOctober 2012Prepared by: Scientific <strong>Aquatic</strong> ServicesLeandra Kruger<strong>Report</strong> authors S. van Staden (Pr. Sci. Nat)<strong>Report</strong> Reference SAS 212170Date October 2012Scientific <strong>Aquatic</strong> Services CCCC Reg No 2003/078943/23Vat Reg. No. 402023527391 Geldenhuis RoadMalvern East Ext 12007Tel: 011 616 7893Fax: 011 615 4106E-mail: admin@sasenvironmental.<strong>co</strong>.<strong>za</strong>
SAS PES Orange River October 2012Based on the impact assessment it is evident that there are nine possible impactsthat may have an effect on the overall aquatic integrity of the aquatic resources in thevicinity of the proposed Orange River Power line crossing. From the impact analysesit is evident that prior to mitigation, most of the impacts are low to medium high levelimpacts, while if mitigation takes place the majority of the impacts can be reduced tovery low level impacts while the impacts on form alien vegetation encroachment andincreased turbidity can be reduced to low levels.The report highlights key management and mitigation measures in order to preventand minimise impacts on the receiving aquatic environment.ii
SAS PES Orange River October 2012Table of ContentsExecutive Summary ..................................................................................................... i1 Introduction & Terms of Reference .................................................................... 12. S<strong>co</strong>pe of Work...................................................................................................... 52.1 Aims ............................................................................................................... 52.2 Assumptions and limitations ........................................................................... 53. <strong>Aquatic</strong> E<strong>co</strong>logical Description .......................................................................... 63.1 E<strong>co</strong>regions ..................................................................................................... 63.2 E<strong>co</strong>status ........................................................................................................ 63.3 Riparian Zone E<strong>co</strong>logy ................................................................................. 104 Methods of Investigation .................................................................................. 114.1 Visual <strong>Assessment</strong> ....................................................................................... 114.2 Biota Specific Water Quality ......................................................................... 114.3 Instream Habitat Integrity ............................................................................. 124.4 Habitat Suitability .......................................................................................... 134.5 <strong>Aquatic</strong> Macro-Invertebrates ........................................................................ 134.6 Fish <strong>co</strong>mmunity Integrity............................................................................... 164.7 Riparian Vegetation assessment .................................................................. 174.8 Crossing assessment ................................................................................... 184.9 Impact <strong>Assessment</strong> ...................................................................................... 194.9.1 Mitigation measure development .............................................................. 225 Results ................................................................................................................ 245.1 General E<strong>co</strong>logy of the Orange River ........................................................... 245.1.1 Physi<strong>co</strong>-Chemical Water Quality ........................................................... 245.1.3 <strong>Aquatic</strong> Macro-invertebrates .................................................................. 265.1.4 Fish Community Integrity ....................................................................... 285.1.5 Riparian vegetation Integrity .................................................................. 295.1.5 Summary of General System Characteristics ........................................ 295.2 Crossing Alternatives ................................................................................... 305.2.1 Crossing Alternative 1 .................................................................................. 30Instream Habitat Integrity ...................................................................................................... 325.2.2 Crossing Alternative 2 .................................................................................. 36Instream Habitat Integrity ...................................................................................................... 385.2.3 Crossing Alternative 3 .................................................................................. 42Instream Habitat Integrity ...................................................................................................... 445.2.4 Crossing Alternative 4 .................................................................................. 48Instream Habitat Integrity ...................................................................................................... 505.2.5 Crossing Alternative 5 .................................................................................. 54Instream Habitat Integrity ...................................................................................................... 566. IMPACT ASSESSMENT ..................................................................................... 596.1 Impact identification and assessment ........................................................... 596.2 Impact assessment <strong>co</strong>nclusion............................................................................... 727 Conclusions & Re<strong>co</strong>mmendations ................................................................... 758. References ......................................................................................................... 77<strong>Appendix</strong> A1 – Riparian Vegetation Index Data and Calculations: C1 ................. 88<strong>Appendix</strong> A2 – Riparian Vegetation Index Data and Calculations: C2 ................. 91<strong>Appendix</strong> A3 – Riparian Vegetation Index Data and Calculations: C3 ................. 94<strong>Appendix</strong> A4 – Riparian Vegetation Index Data and Calculations: C4 ................. 97iii
SAS PES Orange River October 2012<strong>Appendix</strong> A5 – Riparian Vegetation Index Data and Calculations: C5 ............... 100LIST OF TABLESTable 1: Geographic information pertaining to the assessment site ............................. 2Table 2: Classification of river health assessment classes in line with the RHP .................. 6Table 3: Summary of the e<strong>co</strong>logical status of quaternary catchment D73F based onKleynhans 1999 ................................................................................................................... 7Table 4: Classification of Present State Classes in terms of Habitat Integrity [Basedon Kemper 1999] ............................................................................................................... 13Table 5: Definition of Present State Classes in terms of SASS s<strong>co</strong>res as presented inDickens & Graham (2001) ................................................................................................. 15Table 6: Definition of Present State Classes in terms of FAII s<strong>co</strong>res ac<strong>co</strong>rding to theproto<strong>co</strong>l of Kleynhans (1999) ............................................................................................. 16Table 7: Definition of present state classes in terms or RVI-s<strong>co</strong>res, ac<strong>co</strong>rding to theproto<strong>co</strong>l of Kemper (2000). ................................................................................................ 18Table 8: Characteristics of an e<strong>co</strong>logically “ideal” river crossing site, ...................... 18Table 8: Criteria for assessing significance of impacts ............................................... 20Table 9: Significance rating matrix ................................................................................ 21Table 10: Positive/Negative Mitigation Ratings ............................................................. 21Table 11: Biota specific water quality data along the main drainage feature. .................... 24Table 12: A summary of the results obtained from the application of the IHASindex to the assessment site. ......................................................................................... 25Table 13: Biotope specific summary of the results obtained from the application of theSASS5 index to the CO3 site. ............................................................................................ 27Table 14: A summary of the results obtained from the application of the SASS5 andIHAS indices to the site. ..................................................................................................... 27Table 15: A summary of the results obtained from the application of the FAII index tothe site 28Table 16: Description of the location of the <strong>Assessment</strong> site in the study area ... 31Table 17: Dominant riparian vegetation species noted during the riparian vegetationassessment at C1. Exotic species are marked by an asterisk. ......................................... 34Table 18: suitability analyses of the C1 crossing alternative ................................. 34Table 19: Description of the location of the <strong>Assessment</strong> site in the study area ... 37Table 20: Dominant riparian vegetation species noted during the riparian vegetationassessment at C2. Exotic species are marked by an asterisk. ......................................... 40Table 21: suitability analyses of the C2 crossing alternative ................................. 40Table 22: Description of the location of the <strong>Assessment</strong> site in the study area ... 43Table 23: Dominant riparian vegetation species noted during the riparian vegetationassessment at C3. Exotic species are marked by an asterisk. ......................................... 46Table 24: suitability analyses of the C3 crossing alternative ................................. 46Table 25: Description of the location of the <strong>Assessment</strong> site in the study area ... 49Table 26: Dominant riparian vegetation species noted during the riparian vegetationassessment at C4. Exotic species are marked by an asterisk. ......................................... 52Table 27: suitability analyses of the C4 crossing alternative ................................. 52Table 28: Description of the location of the <strong>Assessment</strong> site in the study area ... 55iv
SAS PES Orange River October 2012Table 29: Dominant riparian vegetation species noted during the riparian vegetationassessment at C5. Exotic species are marked by an asterisk. ......................................... 58Table 30: suitability analyses of the C5 crossing alternative ................................. 58Table 31: Summary of impact significance. .................................................................. 73v
SAS PES Orange River October 2012LIST OF FIGURESFigure 1: Aerial photograph depicting the biomonitoring site selected in the vicinityof the study area. ............................................................................................................... 3Figure 2: Crossing points presented on a 1:50 000 topographic map. ........................ 4Figure 3: A map of the e<strong>co</strong>regions of the area. .............................................................. 9Figure 4: SASS5 Classification using biological bands calculated formpercentiles for the Nama Karoo e<strong>co</strong>region, Dallas, 2007 ............................................. 15Figure 5: Aerial photograph depicting the crossing Alternative C1 ........................... 30Figure 6: Upstream view of the C1 site, indicating extremely fast flowing whitewater and rocky substrate upstream of the crossing. .................................................. 31Figure 7: Downstream view of the C1 site showing the rocky rapids downstreamof the crossing and the limited bankside vegetation in some places. ........................ 31Figure 8: Integrated Habitat Integrity <strong>Assessment</strong> .................................................. 32Figure 9: Aerial photograph depicting the crossing point alternative C2 .................. 36Figure 10: Upstream view of the C2 site, indicating moderately deep system withslow flowing water. .......................................................................................................... 37Figure 11: Downstream view of the C2 site showing the abundant marginalvegetation at the site. ...................................................................................................... 37Figure 12: Integrated Habitat Integrity <strong>Assessment</strong> .................................................. 38Figure 13: Aerial photograph depicting the crossing Alternative C3 ......................... 42Figure 14: Upstream view of the C3 site, indicating some <strong>co</strong>nstruction activities atthe site. 43Figure 15: Downstream view of the C3 site showing the rocky rapids downstreamof the crossing. ................................................................................................................ 43Figure 16: Integrated Habitat Integrity <strong>Assessment</strong> .................................................. 44Figure 17: Aerial photograph depicting the crossing Alternative 4 ........................... 48Figure 18: Upstream view of the C4 site, indicating the impact from inundationcaused by a small weir. ................................................................................................... 49Figure 19: Downstream view of the C4 site showing the laminar flows in thesystem at this point. ........................................................................................................ 49Figure 20: Integrated Habitat Integrity <strong>Assessment</strong> .................................................. 50Figure 21: Aerial photograph depicting the crossing Alternative 5 ........................... 54Figure 22: Upstream view of the C5 site, indicating rocky rapids and abundantbankside vegetation <strong>co</strong>ver. ............................................................................................. 55Figure 23: Downstream view of the C5 site showing the slow flowing river andbankside <strong>co</strong>ver. ................................................................................................................ 55Figure 24: Integrated Habitat Integrity <strong>Assessment</strong> .................................................. 56LIST OF APPENDICES<strong>Appendix</strong> 1: IHAS s<strong>co</strong>re sheets September 2012<strong>Appendix</strong> 2: SASS5 s<strong>co</strong>re sheets September 2012<strong>Appendix</strong> 3: Fish assemblage Integrity Index Calculations<strong>Appendix</strong> 4: Riparian Vegeation Index S<strong>co</strong>resheetsvi
SAS PES Orange River October 2012vii
SAS PES Orange River October 20121 Introduction & Terms of ReferenceScientific <strong>Aquatic</strong> Services (SAS) was appointed by Jones and Wagener Consulting CivilEngineers to to undertake a riverine PES assessment as part of the environmental assessmentand authorisation process and project planning for the proposed development of a power linecrossing on the Orange River between Keimoes and Upington. A <strong>co</strong>re <strong>co</strong>mponent of the studywas to identify the most suitable crossing points based on the assessment of five proposedcrossing alternative <strong>co</strong>rridors, from an aquatic and riparian e<strong>co</strong>logical perspective. The subjectproperty is situated in the Northern Cape Province towards the southwest side of the town ofUpington.The proposed development activity would entail the following activities:‣ site preparation and clearing of the servitude;‣ <strong>co</strong>nstruction of the power line crossing with special mention of support towers;‣ rehabilitation activities in the vicinity of the crossing and areas affected by<strong>co</strong>nstruction; and‣ maintenance during the operational phase of the development.The riverine PES assessment was <strong>co</strong>nfined to the area in the immediate vicinity of the crossingalternatives on the Orange River and did not include the surrounding properties.The purpose of the aquatic e<strong>co</strong>logical assessment was to determine the E<strong>co</strong>logical Importanceand Sensitivity (EIS) and the Present E<strong>co</strong>logical Sate (PES) as well as risks to the receivingenvironment associated with the proposed project. The study area is located within the NamaKaroo aquatic e<strong>co</strong>region (quaternary catchment D73F). This report serves to document the<strong>co</strong>ndition at the time of sampling to indicate the state of the riverine e<strong>co</strong>logical integrity in earlyspring, at a time when low flows were being experienced.The following was <strong>co</strong>nsidered in the selection of suitable sites for assessing the level of aquatice<strong>co</strong>logical integrity on the Orange River:‣ The site location in relation to the existing infrastructure and activities in the area;‣ The site location was assessed as close as possible to the middle of each crossing<strong>co</strong>rridor alternative in order to be as representative as possible of each crossingalternative;‣ Consideration was given to the position of the proposed development site in order toassist in defining the Present E<strong>co</strong>logical State and any impacts in this area;1
SAS PES Orange River October 2012‣ Accessibility with a vehicle in order to allow for the transport of assessors andequipment;‣ Sites were selected where there were good habitat <strong>co</strong>nditions with a good level ofdiversity, suitable for supporting a diverse aquatic <strong>co</strong>mmunity.The five assessment points within each crossing <strong>co</strong>rridor are presented in the table below aswell as the figure below.Table 1:Geographic information pertaining to the assessment siteSiteDescriptionGPS <strong>co</strong>-ordinatesSouthEastCO1 Downstream point in the Orange River. S28°46’10.41” E20°42’15.57"CO2 Representative of the Orange River. S28°45’31.62” E20°48’56.03”CO3 <strong>Aquatic</strong> biomonitoring site. S28°42’51.97” E20°59’20.67”CO4 Representative of the Orange River. S28°35’47.32” E20°59’20.67”CO5 Upstream point below Upington. S28°30’32.79” E20°11’12.32”2
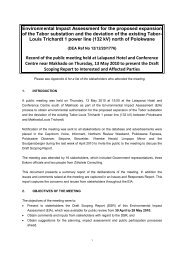
SAS PES Orange River October 2012Figure 1: Aerial photograph depicting the biomonitoring site selected in the vicinity of the study area.3
SAS <strong>Aquatic</strong> PES Sagewood Ext 12 February 2010Figure 2: Crossing points presented on a 1:50 000 topographic map.4
SAS PES Orange River October 20122. S<strong>co</strong>pe of Work2.1 AimsSpecific out<strong>co</strong>mes required from this report include the following:‣ define the Present E<strong>co</strong>logical State of the aquatic and riparian zone resources in thestudy area;‣ define the habitat and riparian zone <strong>co</strong>nditions of the Orange River in the vicinity of thefive crossing alternative <strong>co</strong>rridors;‣ determine most suitable crossing alternative over the Orange River;‣ define the impacts associated with the proposed development;‣ document the mitigatory measures deemed necessary to minimise the impact on theOrange River as a result of the proposed development2.2 Assumptions and limitationsThe following points serve to indicate the assumptions and limitations of this study.‣ Reference <strong>co</strong>nditions are unknown: The <strong>co</strong>mposition of aquatic biota in the studyarea prior to disturbance is unknown. For this reason, reference <strong>co</strong>nditions arehypothetical, and are based on professional judgement and/or inferred from dataavailable.‣ Temporal variability: The data presented in this report are based on a single site visit,undertaken in spring (19 September 2012). The effects of natural seasonal and longtermvariation in the e<strong>co</strong>logical <strong>co</strong>nditions and aquatic biota found in the streams aretherefore unknown except for data available from desktop sources for some aspects ofthe aquatic e<strong>co</strong>logy.‣ E<strong>co</strong>logical assessment timing: <strong>Aquatic</strong> and terrestrial e<strong>co</strong>systems are dynamic and<strong>co</strong>mplex; it is likely that aspects, some of which may be important, <strong>co</strong>uld have beenoverlooked. A more reliable assessment of the biota would require seasonal samplingwith sampling being undertaken under both low flow and high flow <strong>co</strong>nditions.‣ Access and proximity: The e<strong>co</strong>logical assessment is <strong>co</strong>nfined to representative pointswithin each crossing <strong>co</strong>rridor and does not include an assessment of the systemupstream and downstream of the <strong>co</strong>rridor areas and therefore some aspects, some ofwhich may be important, <strong>co</strong>uld have been overlooked.5
SAS PES Orange River October 20123. <strong>Aquatic</strong> E<strong>co</strong>logical Description3.1 E<strong>co</strong>regionsWhen assessing the e<strong>co</strong>logy of any area (aquatic or terrestrial), it is important to know whiche<strong>co</strong>region the study area is located within. This knowledge allows for improved interpretation ofdata to be made, since reference information and representative species lists are oftenavailable on this level of assessment to guide the assessment.The study area falls within the Nama Karoo aquatic E<strong>co</strong>region, which can be <strong>co</strong>nsidered to<strong>co</strong>ntain a relatively high level of aquatic biodiversity and a relatively sensitive aquatic<strong>co</strong>mmunity. The study area falls within the D73F quaternary catchment. Refer to Figure 2.3.2 E<strong>co</strong>statusWater resources are generally classified ac<strong>co</strong>rding to the degree of modification or level ofimpairment. The classes used by the South African River Health Program (RHP) are presentedin the table below and will be used as the basis of classification of the systems in this field anddesktop study, as well as the field studies.Table 2: Classification of river health assessment classes in line with the RHPClassABCDEFDescriptionUnmodified, natural.Largely natural, with few modifications.Moderately modified.Largely modified.Extensively modified.Critically modified.Studies undertaken by the Institute for Water Quality Studies assessed all quaternarycatchments as part of the Resource Directed Measures for Protection of Water Resources. Inthese assessments, the E<strong>co</strong>logical Importance and Sensitivity (EIS), Present E<strong>co</strong>logicalManagement Class (PEMC) and Desired E<strong>co</strong>logical Management Class (DEMC), were definedand serve as useful guidelines in determining the importance and sensitivity of aquatice<strong>co</strong>systems, prior to assessment, or as part of a desktop assessment.6
SAS PES Orange River October 2012This database was searched for the quaternary catchment of <strong>co</strong>ncern (C21C) in order to definethe EIS, PEMC and DEMC. The findings are based on a study undertaken by Kleynhans (1999)as part of “A procedure for the determination of the e<strong>co</strong>logical reserve for the purpose of thenational water balance model for South African rivers”. The results of the assessment aresummarised in the table below.Table 3: Summary of the e<strong>co</strong>logical status of quaternary catchment D73F based onKleynhans 1999Catchment Resource EIS PEMC DEMCD73FOrangeRiverHighCLASS B (Class C basedon desktop certainty)Class B: Sensitive systemsThe points below summarise the impacts on the aquatic resources in this quaternary catchment:‣ The aquatic resources within this quaternary catchment have been highly affected bybed modification due to sedimentation and the Neusberg weir in the catchment(immediately upstream of Crossing alternative 5).‣ Significant flow modifications have taken place due to the effects of water abstractionand urban runoff from surrounding farming practices.‣ High impacts have occurred as a result of introduced in-stream biota with specialmention of the fish Cyprinus carpio.‣ Impact due to inundation from the Neusberg weir (immediately upstream of Crossingalternative 5) is high.‣ Riparian zones and stream bank <strong>co</strong>nditions are <strong>co</strong>nsidered to be moderately impacteddue to alien vegetation encroachment.‣ An impact on the aquatic <strong>co</strong>mmunity, due to altered water quality, is deemed to affectthe catchment to a moderate degree due to the effects of general urban and rural runoffas well as agricultural effluent discharge.In terms of e<strong>co</strong>logical functions, importance and sensitivity, the following points summarise the<strong>co</strong>nditions in this catchment:‣ The riverine systems in this catchment have a high diversity of habitat types, limiting thee<strong>co</strong>logical sensitivity and importance of the resources in the area however pools runssponge areas occur in the area and increase the biodiversity of the system.‣ The site has a low importance in terms of <strong>co</strong>nservation due to the proximity to theNeusberg weir (immediately upstream of Crossing alternative 5).‣ The riverine resources have a low sensitivity to flow requirements.7
SAS PES Orange River October 2012‣ The area has a high importance in terms of migration of avifaunal species.‣ The area is of high importance in terms of rare and endemic species <strong>co</strong>nservation withspecial mention of the fish species Labeobarbus kimberleyensis and Simuliumgariepensis a black fly species.‣ The e<strong>co</strong>logy of the area is <strong>co</strong>nsidered to be moderately sensitive to changes in waterquality.‣ The area has a moderate importance as a source of refugia for aquatic species.‣ The catchment has a moderate importance in terms of species richness in the area.‣ The system is moderately important in terms of unique and endemic taxa <strong>co</strong>nservation.8
SAS PES Orange River October 2012C 5C 4C1 C 2C 3Figure 3: A map of the e<strong>co</strong>regions of the area.9
SAS PES Orange River October 20123.3 Riparian Zone E<strong>co</strong>logyEach crossing point was evaluated and the riparian vegetation <strong>co</strong>ndition was established.A “walk-about” was undertaken to assess the species <strong>co</strong>mposition, <strong>co</strong>mmunity structuresand the degree of exotic vegetation encroachment for each site during a field assessmentin September 2012. The species <strong>co</strong>mposition was then <strong>co</strong>mpared to the Lower GariepAlluvial Vegetation (Mucina & Rutherford, 2006) vegetation type in which the proposedcrossings of the Orange River will occur. By <strong>co</strong>mparing current vegetation <strong>co</strong>mposition tothis baseline information will give an indication of the e<strong>co</strong>logical integrity and level oftransformation of the riparian zone.Lower Gariep Alluvial Vegetation occurs in the Northern Cape Province. More specificallythe vegetation is associated with broad alluvium (floodplains and islands) of the Orange(Gariep) River between Groblershoop and the mouth into the Atlantic Ocean atOranjemund (Namibia). This river stretch is embedded within Desert vegetation types(Oranjemund to roughly Pofadder) and Nama-Karoo vegetation (further upstream as far asGroblershoop). Altitude ranging from0-1 000m.The vegetation type occurs on flat alluvial terraces and riverine islands supporting a<strong>co</strong>mplex of riparian thickets (dominated by Ziziphus mucronata, Euclea pseadebenus andTamarix usneoides), reed beds with Phragmites australis as well as flooded grasslandsand herb-lands populating sand banks and terraces within and along the river.The vegetation type is <strong>co</strong>nsidered endangered. A Target of 31% for <strong>co</strong>nservation of thevegetation type has been defined. Only about 6% statutorily <strong>co</strong>nserved in the Richtersveldand Augrabies Fall National Parks. Some 50% transformed for agricultural purposes(vegetables and grapes) or alluvial diamond mining. Prosopis species, Ni<strong>co</strong>tiana glaucaand Argemone ochroleuca are known to invade the alluvia in places.The following species are dominant within the vegetation type:Riparian thickets Small trees: Acacia karoo (d), Euclea pseudebenus (d), Salixmucronata subsp. mucronata (d), Schotia afra var. angustifolia (d), Ziziphus mucronata (d),Acacia erioloba, Combretum erythrophyllum, Ficus <strong>co</strong>rdata, Maerua gilgii, Prosopisglandulosa var. grandulosa, Rhus lancea. Tall Shrubs: Gymnosporia linearis (d), Tamarixusneoides (d), Ehretia rigida, Euclea undulate, Sisyndite spartea. Low Shrub: Asparaguslaricinus. Woody Climber: Asparagus retrofractus. Succulent Shrub: Lycium bosciifolium.Herb: Chenopodium olukondae.10
SAS PES Orange River October 2012Reed beds Megagraminoid: Phragmites australis (d).Flooded grasslands & herblands Low Shrubs: Tetragonia schenckii (d), Litogrynegariepina. Graminoids: Cynodon dactylon (d), Setaria verticillata (d), Cenchrus cilliaris,Cyperus laevigatus, Eragrostis echinochloidea, Leu<strong>co</strong>phrys meso<strong>co</strong>ma, Polypogonmonspeliensis, Stipagrostis namaquensis. Herbs: Amaranthus praetermissus, Coronopusintegrifolius, Frankenia pulverulenta, Gnaphalium <strong>co</strong>nfine, Pseadognaphalium luteo-album.4 Methods of Investigation4.1 Visual <strong>Assessment</strong>The site was investigated in order to identify visible impacts on the site with specificreference to impacts from surrounding activities. Both natural <strong>co</strong>nstraints placed one<strong>co</strong>system structure and function as well as anthropogenic alterations to the system wasassessed by observing <strong>co</strong>nditions and relating them to professional experience.Photographs of each site were taken to provide visual indications of the <strong>co</strong>nditions at thetime of assessment. Factors which were noted in the site-specific visual assessmentsincluded the following:‣ instream and riparian habitat diversity;‣ stream <strong>co</strong>ntinuity;‣ erosion potential;‣ depth flow and substrate characteristics;‣ signs of physical disturbance of the area;‣ other life forms reliant on aquatic e<strong>co</strong>systems;‣ signs of impact related to water quality;‣ Consideration of suitability for stream crossing purposes.4.2 Biota Specific Water QualityOn-site testing of biota specific water quality variables took place. Parameters measuredinclude pH, electrical <strong>co</strong>nductivity, dissolved oxygen <strong>co</strong>ncentration and temperature. Theresults of on-site biota specific water quality analyses were used to aid in the interpretationof the data obtained by the biomonitoring. Results are discussed against the guidelinewater quality values for aquatic e<strong>co</strong>systems (DWAF 1996 vol. 7).11
SAS PES Orange River October 20124.3 Instream Habitat IntegrityIt is important to assess the habitat of the site, in order to aid in the interpretation of theresults of the <strong>co</strong>mmunity integrity assessments by taking habitat <strong>co</strong>nditions and impactsinto <strong>co</strong>nsideration. The general habitat integrity of the site should be discussed based onthe application of the Intermediate Habitat Integrity <strong>Assessment</strong> for (Kemper; 1999). TheIntermediate Habitat Integrity <strong>Assessment</strong> (IHIA) proto<strong>co</strong>l, as described by Kemper (1999),should be used for site specific assessments. This is a simplified procedure, which isbased on the Habitat Integrity approach developed by Kleynhans (1996). The IHIA is<strong>co</strong>nducted as a first level exercise, where a <strong>co</strong>mprehensive exercise is not practical. TheHabitat Integrity of each site should be s<strong>co</strong>red ac<strong>co</strong>rding to 12 different criteria whichrepresent the most important (and easily quantifiable) anthropogenically induced possibleimpacts on the system. The instream and riparian zones should be analyzed separately,and the final assessment should be made separately for each, in ac<strong>co</strong>rdance withKleynhans’ (1999) approach to Habitat Integrity <strong>Assessment</strong>. Data for the riparian zoneare, however, primarily interpreted in terms of the potential impact on the instream<strong>co</strong>mponent. The assessment of the severity of impact of modifications is based on sixdescriptive categories with ratings. Analysis of the data should be carried out by weightingeach of the criteria ac<strong>co</strong>rding to Kemper (1999). By calculating the mean of the instreamand riparian Habitat Integrity s<strong>co</strong>res, an overall Habitat Integrity s<strong>co</strong>re can be obtained foreach site. This method describes the Present E<strong>co</strong>logical State (PES) of both the in-streamand riparian habitats of the site. The method classifies Habitat Integrity into one of sixclasses, ranging from unmodified/natural (Class A), to critically modified (Class F).12
SAS PES Orange River October 2012Table 4:Classification of Present State Classes in terms of Habitat Integrity[Based on Kemper 1999]Clas Description S<strong>co</strong>re (% ofstotal)A Unmodified, natural. 90-100B Largely natural, with few modifications. A small change in natural 80-90habitats and biota may have taken place but the basic e<strong>co</strong>systemfunctions are essentially unchanged.C Moderately modified. A loss and change of natural habitat and biota 60-79have occurred, but the basic e<strong>co</strong>system functions are stillpredominantly unchanged.D Largely modified. A large loss of natural habitat, biota and basic 40-59e<strong>co</strong>system functions has occurred.E Extensively modified. The loss of natural habitat, biota and basic 20-39e<strong>co</strong>system functions is extensive.F Critically modified. Modifications have reached a critical level and thelotic system has been modified <strong>co</strong>mpletely with an almost <strong>co</strong>mpleteloss of natural habitat and biota. In the worst instances, basice<strong>co</strong>system functions have been destroyed and the changes areirreversible.
SAS PES Orange River October 2012The assessment was undertaken ac<strong>co</strong>rding to the proto<strong>co</strong>l as defined by Dickens &Graham (2001). All work was undertaken by an accredited SASS5 practitioner.Interpretation of the results of biological monitoring depends, to a certain extent, oninterpretation of site-specific <strong>co</strong>nditions (Thirion et.al, 1995). In the <strong>co</strong>ntext of thisinvestigation it would be best not to use SASS5 s<strong>co</strong>res in isolation, but rather in<strong>co</strong>mparison with relevant habitat s<strong>co</strong>res. The reason for this is that some sites have a lessdesirable habitat or fewer biotopes than others do. In other words, a low SASS5 s<strong>co</strong>re isnot necessarily regarded as poor in <strong>co</strong>njunction with a low habitat s<strong>co</strong>re. Also, a highSASS5 s<strong>co</strong>re in <strong>co</strong>njunction with a low habitat s<strong>co</strong>re can be regarded as better than a highSASS5 s<strong>co</strong>re in <strong>co</strong>njunction with a high habitat s<strong>co</strong>re. A low SASS5 s<strong>co</strong>re together with ahigh habitat s<strong>co</strong>re would be indicative of poor <strong>co</strong>nditions. The IHAS Index is valuable inhelping to interpret SASS5 s<strong>co</strong>res and the effects of habitat variation on aquatic macroinvertebrate<strong>co</strong>mmunity integrity.The perceived reference state for the local streams was determined as a SASS5 s<strong>co</strong>re of118 and an ASPT of 6.0 based on general <strong>co</strong>nditions of streams in the Nama Karooe<strong>co</strong>region and based on local habitat and flow <strong>co</strong>nditions. Interpretation of the results inrelation to the reference s<strong>co</strong>res was made ac<strong>co</strong>rding to the classification of SASS5 s<strong>co</strong>respresented in the SASS5 methodology published Dickens & Graham (2001) as well asDallas 2007.14
SAS PES Orange River October 2012Figure 4:SASS5 Classification using biological bands calculated form percentilesfor the Nama Karoo e<strong>co</strong>region, Dallas, 2007Table 5:Definition of Present State Classes in terms of SASS s<strong>co</strong>res aspresented in Dickens & Graham (2001)Class Description SASSS<strong>co</strong>re%ASPTS<strong>co</strong>re %A Unimpaired. High diversity of taxa with 90-100 Variablenumerous sensitive taxa.80-89 >90B Slightly impaired. High diversity of taxa,but with fewer sensitive taxa.80-8970-7970-899076-90C Moderately impaired. Moderate diversityof taxa.60-7950-5950-797560-75D Largely impaired. Mostly tolerant taxa 50 – 59
SAS PES Orange River October 20124.6 Fish <strong>co</strong>mmunity IntegrityWhereas macro-invertebrate <strong>co</strong>mmunities are good indicators of localized <strong>co</strong>nditions in ariver over the short-term, fish being relatively long-lived and mobile;‣ are good indicators of long-term influences;‣ are good indicators of general habitat <strong>co</strong>nditions;‣ integrate effects of lower trophic levels and‣ are <strong>co</strong>nsumed by humans (Uys et al., 1996).The Fish Assemblage Integrity Index (FAII) was applied ac<strong>co</strong>rding to the proto<strong>co</strong>l ofKleynhans (1999). Fish species identified were <strong>co</strong>mpared to those expected to be presentat the site, which were <strong>co</strong>mpiled from a literature survey including Skelton 2007. Fishsamples were <strong>co</strong>llected by means of a fixed generator driven electro-fishing device.Table 6: Definition of Present State Classes in terms of FAII s<strong>co</strong>resac<strong>co</strong>rding to the proto<strong>co</strong>l of Kleynhans (1999)CLASSDESCRIPTIONRELATIVE FAIISCORE (% OFEXPECTED)A Unmodified, or approximates natural <strong>co</strong>nditions closely. 90-100B Largely natural, with few modifications. 80-89C Moderately modified. A lower than expected speciesrichness and the presence of most intolerant species.60-79D Largely modified. A clearly lower than expected speciesrichness and absence of intolerant and moderately tolerant 40-59speciesE Seriously modified. A strikingly lower than expected speciesrichness and a general absence of intolerant and moderately 20-39intolerant speciesF Critically modified. An extremely lowered species richnessand an absence of intolerant and moderately intolerant
SAS PES Orange River October 2012SPECIES NAMECOMMON NAMEINTOLERANCERATINGAustroglanis sclateri Rock catfish 2.7Barbus paludinosus Straightfin barb 1.8 WidespreadCOMMENTSRare, endemic to the Orange-Vaal systemBarbus anoplus Chubbyhead barb 2.6 WidespreadLabeobarbus aeneus Smallmouth yellowfish 2.5Widespread in the Orange-VaalsystemLabeobarbuskimberleyensisLargemouth yellowfish 2.5Labeo capensis Orange river mud fish 3.2Labeo umbratus Moggel 2.3PseudocrenilabrusphilanderSouthernmouthbrooder1.3Tilapia Sparrmanii Banded tilapia 1.3Clarias gariepinus Sharptooth catfish 1.2Widespread in the Orange-Vaalsystem but is be<strong>co</strong>ming scarceWidespread in the Orange-VaalsystemWidespread in the Orange-VaalsystemWidely distributed in southernAfricaWidely distributed in southernAfricaMost widely distributed fish inAfrica.Cyprinus carpio Carp 1.4 Widespread alien speciesMicropterus salmoides Largemouth bass 2.2 Widespread alien speciesGambussia affinis Mosquito fish 2 WidespreadTolerant: 1-2 moderately tolerant :> 2-3 Moderately Intolerant: >3-4 Intolerant: >4For the purposes of applying the FAII, species which were <strong>co</strong>nsidered unlikely to occur atthe site due to habitat and <strong>co</strong>ver <strong>co</strong>nditions, flow <strong>co</strong>nditions and due to historic impacts,were excluded from the reference list of fish species for the site.4.7 Riparian Vegetation assessmentA desktop study was undertaken for the study area to determine historic distributions andvegetation type and structure of the riparian area in the vicinity of the proposed crossings.This gave an indication as to what would be expected to occur on each site and, therefore,offer possible explanations for any anomalies that <strong>co</strong>uld potentially occur.The riparian vegetation assessment was <strong>co</strong>nducted ac<strong>co</strong>rding to the procedure describedby Kemper, 2001. The selected sites should be chosen to be relevant to the proposeddevelopment and to show any impacts that the licensed activity may be havingdownstream. The site assessment was <strong>co</strong>nducted over a distance of 100m on both banks,in order to assess species <strong>co</strong>mposition and <strong>co</strong>mmunity structures and include an17
SAS PES Orange River October 2012assessment with respect to the degree of exotic vegetation encroachment, dominance byrecruitment and by biomass.Table 7:Definition of present state classes in terms or RVI-s<strong>co</strong>res, ac<strong>co</strong>rding to theproto<strong>co</strong>l of Kemper (2000).Class Description S<strong>co</strong>re (% of total)A Unmodified, natural. 90-100B Largely natural, with few modifications. A small change in natural habitats and biota 80-90may have taken place but the basic e<strong>co</strong>system functions are essentially unchanged.C Moderately modified. A loss and change of natural habitat and biota have occurred, 60-79but the basic e<strong>co</strong>system functions are still predominantly unchanged.D Largely modified. A large loss of natural habitat, biota and basic e<strong>co</strong>system functions 40-59has occurred.E Extensively modified. The loss of natural habitat, biota and basic e<strong>co</strong>system20-39functions is extensive.F Critically modified. Modifications have reached a critical level and the lotic systemhas been modified <strong>co</strong>mpletely with an almost <strong>co</strong>mplete loss of natural habitat andbiota. In the worst instances, basic e<strong>co</strong>system functions have been destroyed andthe changes are irreversible.
SAS PES Orange River October 20124.9 Impact <strong>Assessment</strong>In order for the EAP to allow for sufficient <strong>co</strong>nsideration of all environmental impacts,impacts were assessed using a <strong>co</strong>mmon, defensible method of assessing significance thatwill enable <strong>co</strong>mparisons to be made between risks/impacts and will enable authorities,stakeholders and the client to understand the process and rationale upon whichrisks/impacts have been assessed. The method to be used for assessing risks/impacts isoutlined in the sections below.The first stage of risk/impact assessment is the identification of environmental activities,aspects and impacts. This is supported by the identification of receptors and resources,which allows for an understanding of the impact pathway and an assessment of thesensitivity to change. The definitions used in the impact assessment are presented below.‣ An activity is a distinct process or task undertaken by an organisation for which aresponsibility can be assigned. Activities also include facilities or infrastructure thatare possessed by an organisation.‣ An environmental aspect is an ‘element of an organi<strong>za</strong>tions activities, productsand services which can interact with the environment’ 1 . The interaction of an aspectwith the environment may result in an impact.‣ Environmental risks/impacts are the <strong>co</strong>nsequences of these aspects onenvironmental resources or receptors of particular value or sensitivity, for example,disturbance due to noise and health effects due to poorer air quality. In the casewhere the impact is on human health or well being, this should be stated. Similarly,where the receptor is not anthropogenic, then it should, where possible, bestipulated what the receptor is.‣ Receptors can <strong>co</strong>mprise, but are not limited to, people or human-made systems,such as local residents, <strong>co</strong>mmunities and social infrastructure, as well as<strong>co</strong>mponents of the biophysical environment such as wetlands, flora and riverinesystems.‣ Resources include <strong>co</strong>mponents of the biophysical environment.‣ Frequency of activity refers to how often the proposed activity will take place.‣ Frequency of impact refers to the frequency with which a stressor (aspect) willimpact on the receptor.1 The definition has been aligned with that used in the ISO 14001 Standard.19
SAS PES Orange River October 2012‣ Severity refers to the degree of change to the receptor status in terms of thereversibility of the impact; sensitivity of receptor to stressor; duration of impact(increasing or decreasing with time); <strong>co</strong>ntroversy potential and precedent setting;threat to environmental and health standards.‣ Spatial extent refers to the geographical scale of the impact.‣ Duration refers to the length of time over which the stressor will cause a change inthe resource or receptor.The significance of the impact is then assessed by rating each variable numericallyac<strong>co</strong>rding to the defined criteria. Refer to the table below. The purpose of the rating is todevelop a clear understanding of influences and processes associated with each impact.The severity, spatial s<strong>co</strong>pe and duration of the impact together <strong>co</strong>mprise the <strong>co</strong>nsequenceof the impact and when summed can obtain a maximum value of 15. The frequency of theactivity and the frequency of the impact together <strong>co</strong>mprise the likelihood of the impactoccurring and can obtain a maximum value of 10. The values for likelihood and<strong>co</strong>nsequence of the impact are then read off a significance rating matrix and are used todetermine whether mitigation is necessary 2 .The assessment of significance is undertaken twice. Initial, significance is based on onlynatural and existing mitigation measures (including built-in engineering designs). Thesubsequent assessment takes into ac<strong>co</strong>unt the re<strong>co</strong>mmended management measuresrequired to mitigate the impacts. Measures such as demolishing infrastructure, andreinstatement and rehabilitation of land, are <strong>co</strong>nsidered post-mitigation.The model out<strong>co</strong>me of the impacts was then assessed in terms of impact certainty and<strong>co</strong>nsideration of available information. The Precautionary Principle is applied in line withSouth Africa’s National Environmental Management Act (No. 108 of 1997) in instances ofuncertainty or lack of information, by increasing assigned ratings or adjusting final modelout<strong>co</strong>mes. In certain instances where a variable or out<strong>co</strong>me requires rational adjustmentdue to model limitations, the model out<strong>co</strong>mes have been adjusted.Table 9: Criteria for assessing significance of impactsLIKELIHOOD DESCRIPTORSProbability of impactRATINGHighly unlikely 1Possible 2Likely 32 Some risks/impacts that have low significance will however still require mitigation20
LIKELIHOOD (Frequency of activity +Frequency of impact)SAS PES Orange River October 2012Highly likely 4Definite 5Sensitivity of receiving environmentRATINGE<strong>co</strong>logy not sensitive/important 1E<strong>co</strong>logy with limited sensitivity/importance 2E<strong>co</strong>logy moderately sensitive/ /important 3E<strong>co</strong>logy highly sensitive /important 4E<strong>co</strong>logy critically sensitive /important 5CONSEQUENCE DESCRIPTORSSeverity of impactRATINGInsignificant / e<strong>co</strong>system structure and function unchanged 1Small / e<strong>co</strong>system structure and function largely unchanged 2Significant / e<strong>co</strong>system structure and function moderately altered 3Great / harmful/ e<strong>co</strong>system structure and function Largely altered 4Disastrous / e<strong>co</strong>system structure and function seriously to critically altered 5Spatial s<strong>co</strong>pe of impactRATINGActivity specific/ < 5 ha impacted / Linear features affected < 100m 1Development specific/ within the site boundary / < 100ha impacted / Linear features affected < 1000m 2Local area/ within 1 km of the site boundary / < 2000ha impacted / Linear features affected < 3000m 3Regional within 5 km of the site boundary / < 5000ha impacted / Linear features affected < 10 000m 4Entire habitat unit / Entire system/ > 5000ha impacted / Linear features affected > 10 000m 5Duration of impactRATINGOne day to one month 1One month to one year 2One year to five years 3Life of operation or less than 20 years 4Permanent 5Table 10: Significance rating matrixCONSEQUENCE (Severity + Spatial S<strong>co</strong>pe + Duration)1 2 3 4 5 6 7 8 9 10 11 12 13 14 152 4 6 8 10 12 14 16 18 20 22 24 26 28 303 6 9 12 15 18 21 24 27 30 33 36 39 42 454 8 12 16 20 24 28 32 36 40 44 48 52 56 605 10 15 20 25 30 35 40 45 50 55 60 65 70 756 12 18 24 30 36 42 48 54 60 66 72 78 84 907 14 21 28 35 42 49 56 63 70 77 84 91 98 1058 16 24 32 40 48 56 64 72 80 88 96 104 112 1209 18 27 36 45 54 63 72 81 90 99 108 117 126 13510 20 30 40 50 60 70 80 90 100 110 120 130 140 150Table 11: Positive/Negative Mitigation RatingsSignificance Rating Value Negative Impact ManagementRe<strong>co</strong>mmendationPositive Impact ManagementRe<strong>co</strong>mmendationVery high 126-150 Improve current management Maintain current management21
SAS PES Orange River October 2012High 101-125 Improve current management Maintain current managementMedium-high 76-100 Improve current management Maintain current managementMedium-low 51-75 Maintain current management Improve current managementLow 26-50 Maintain current management Improve current managementVery low 1-25 Maintain current management Improve current managementThe following points were <strong>co</strong>nsidered when undertaking the assessment:‣ Risks and impacts were analysed in the <strong>co</strong>ntext of the project’s area of influenceen<strong>co</strong>mpassing:Primary project site and related facilities that the client and its <strong>co</strong>ntractorsdevelops or <strong>co</strong>ntrols;Areas potentially impacted by cumulative impacts for further planneddevelopment of the project, any existing project or <strong>co</strong>ndition and otherproject-related developments; andAreas potentially affected by impacts from unplanned but predictabledevelopments caused by the project that may occur later or at a differentlocation.‣ Risks/Impacts were assessed for all stages of the project cycle including:Construction;Operation; andRehabilitation.‣ If applicable, transboundary or global effects were assessed;‣ Individuals or groups who may be differentially or disproportionately affected bythe project because of their disadvantaged or vulnerable status were assessed.‣ Particular attention was paid to describing any residual impacts that will occurafter rehabilitation.4.9.1 Mitigation measure developmentThe following points present the key <strong>co</strong>ncepts <strong>co</strong>nsidered in the development of mitigationmeasures for the proposed development.‣ Mitigation and performance improvement measures and actions that address therisks and impacts 3 are identified and described in as much detail as possible.‣ Measures and actions to address negative impacts will favour avoidance andprevention over minimi<strong>za</strong>tion, mitigation or <strong>co</strong>mpensation.3 Mitigation measures should address both positive and negative impacts22
SAS PES Orange River October 2012‣ Desired out<strong>co</strong>mes are defined, and have been developed in such a way as to bemeasurable events with performance indicators, targets and acceptable criteria thatcan be tracked over defined periods, with estimates of the resources (includinghuman resource and training requirements) and responsibilities for implementation.23
SAS PES Orange River October 20125 Results5.1 General E<strong>co</strong>logy of the Orange River5.1.1 Physi<strong>co</strong>-Chemical Water QualityThe table below re<strong>co</strong>rds the biota specific water quality of the assessment site.Table 12: Biota specific water quality data along the main drainage feature.SITE COND mS/m D.O. mg/l pH TEMP o CU/S 34.2 8.78 8.41 21.4D/S 39.8 8.12 8.34 21.7‣ General water quality can be <strong>co</strong>nsidered fair although some variation from theexpected natural <strong>co</strong>ndition is deemed likely;‣ The impact on water quality is deemed likely to <strong>co</strong>me from both industrial andurban activities as far upstream as Mpumalanga and Gauteng as well as impactsform agricultural runoff into the Vaal River, a major tributary of the Orange Riverand the Orange River itself;‣ Dissolved salts present in the system are slightly elevated from the natural<strong>co</strong>nditions but is not expected to impact on the aquatic <strong>co</strong>mmunity by toosignificantly in terms of osmotic stress.‣ Between the upstream and downstream site, <strong>co</strong>nductivity increases by 16.4%which exceeds the DWAF Target Water Quality Range (DWAF TWQR). Thissuggests that between the sites there is an input of salts, most likely from erosionand agricultural runoff entering the system.‣ The pH is slightly alkaline but can be regarded as suitable for supporting a diverseand sensitive aquatic <strong>co</strong>mmunity. The difference in pH between the sites arenegligible and falls within the DWAF TWQR for aquatic <strong>co</strong>mmunities.‣ The dissolved oxygen <strong>co</strong>ncentration is relatively good and can be regarded assuitable for supporting a diverse and sensitive aquatic <strong>co</strong>mmunity.‣ Dissolved oxygen <strong>co</strong>ncentrations decrease downstream by 7.5%, this still fallswithin the DWAF TWQR limit. The dissolved oxygen <strong>co</strong>ncentrations can beregarded as suitable for supporting a diverse and sensitive aquatic <strong>co</strong>mmunity.24
SAS PES Orange River October 2012‣ Temperature can be regarded as normal for the time of year and time ofassessment. The variation between the upstream and downstream sites canlargely be ascribed to natural diurnal variation.The Orange River can be best described as a strongly flowing river with high flow volumes.Significant variation in flow between the high and low flow seasons is also characteristic ofthe system. The river structure alternates between pools and glides with slow laminar flowand fast flowing turbulent rapids. Overall there is a wide diversity of instream habitats inthe system which allows for a diversity of instream taxa to be supported includingmammals such as otters (Aonyx capensis) reptiles (Viranus niloticus) as well as fish,aquatic macro-invertebrates and riparian vegetation. Some habitat for aquatic vegetationand frogs is also present although the species diversity of these groups is limited.The riverine habitat on the Orange River has seen some disturbance as a result ofagricultural development. In this regard specific mention is made of agricultural activitieswithin the floodplain and the associated <strong>co</strong>nstruction of levees along the active riverchannels.‣ From the results of the application of the IHIA to the crossing alternative sites, it isevident that there are several large impacts on the habitat of the area.‣ Instream impacts at the site included significant impacts in places from flow andbed modifications. Smaller impacts from water quality and channel modificationwere also noted.‣ The largest riparian zone impacts included flow bank erosion, alien vegetationencroachment and vegetation removal. Smaller impacts from flow modification andchannel modification on riparian vegetation structures were observed.The table below is a summary of the results obtained from the application of the IHASIndex to the assessment site in the study area used as a representative site for the OrangeRiver in the vicinity of the proposed project. This index determines habitat suitability, withparticular reference to the requirements of aquatic macro-invertebrates. The resultsobtained from this assessment will aid in interpretation of the SASS5 results.Table 13: A summary of the results obtained from the application of the IHASindex to the assessment site.SITECO3IHAS s<strong>co</strong>re 70%25
SAS PES Orange River October 2012SITEIHAS Adjustment s<strong>co</strong>re(illustrative purposes only)McMillan, 1998 IHASdescriptionStones habitatcharacteristicsVegetation habitatcharacteristicsOther habitatcharacteristicsIHAS general streamcharacteristicsCO3+13Habitat diversity and structure is adequate for supporting adiverse aquatic macro-invertebrate <strong>co</strong>mmunity.Good habitat was present at this site providing habitat forsuitably adapted macro-invertebrate families.Marginal vegetation was present both in and out of currentand had a fair amount of leafy material present to providehabitat and <strong>co</strong>ver for suitably adapted macro-invertebratefamilies.There was an abundance of gravel and sand depositspresent in the area providing good habitat for suitablyadapted macro-invertebrate families.The river at this point is wide and on average deepalthough, there is good diversity in depth and flow at thesite. The surrounding vegetation <strong>co</strong>nsists mainly of reedsand grasses and the dominant activity in the area isagriculture. Some dis<strong>co</strong>loration of the water in the systemhas occurred.‣ Habitat diversity and structure was <strong>co</strong>nsidered adequate for supporting a diverseaquatic macro-invertebrate <strong>co</strong>mmunity and as such a fairly diverse and sensitiveaquatic macro-invertebrate <strong>co</strong>mmunity can be expected provided that water qualityimpacts do not severely affect the system.5.1.3 <strong>Aquatic</strong> Macro-invertebratesThe results of the aquatic macro-invertebrate assessment ac<strong>co</strong>rding to the SASS5 indexare summarised in the tables below for a site assessed which was determined to berepresentative of the system in the vicinity of the proposed crossing alternatives. Table 14indicates the results obtained at the site per biotope sampled. Table 15 summarises thefindings of the SASS assessment based on the analyses of the data for the site, as well asinterpretation of the data for the site.26
SAS PES Orange River October 2012Table 14: Biotope specific summary of the results obtained from the applicationof the SASS5 index to the CO3 site.PARAMETER SITE STONES VEGETATIONSASS5 S<strong>co</strong>reGRAVEL,AND MUDSANDTOTAL12 34 60 77Taxa CO31 5 9 12ASPT 12.0 6.8 6.7 6.4Table 15: A summary of the results obtained from the application of the SASS5and IHAS indices to the site.Type of ResultCO3Biotopes sampledStones in current, marginal vegetation out of current, mud,sand and gravel.Sensitive taxa presentAtyidae; Heptageniidae; Leptophlebiidae;Tri<strong>co</strong>rythidaeSensitive taxa absentAeshnidae Chlorolestidae; Perlidae; Psephenidae; Athericidae;Nau<strong>co</strong>ridae; Chlorocyphidae; Hydracarina; GomphidaeAdjusted SASS5 s<strong>co</strong>re +13SASS5 % of reference s<strong>co</strong>re 65.3%ASPT % of reference s<strong>co</strong>re 106.7%Dickens and Graham, 2001SASS5 classificationClass C: Moderately impaired. Moderate diversity of taxa.Dallas 2007 classification Class A‣ The SASS data indicates that the aquatic macro-invertebrate <strong>co</strong>mmunity at the sitehas suffered some loss in integrity when <strong>co</strong>mpared to the reference s<strong>co</strong>re forpristine Nama Karoo E<strong>co</strong>region stream.‣ It must however be <strong>co</strong>nsidered that the aquatic assessment site was notnecessarily optimum for the assessment of the aquatic macro-invertebrate<strong>co</strong>mmunity due to the abundance of bedrock on the river bed and because of verystrong flows in the river making access to all sampling areas difficult.‣ At present, the site can be <strong>co</strong>nsidered as Class C (Moderately impaired) ac<strong>co</strong>rdingto the Dickens & Graham (2001) classification system, and as a Class A(Unimpaired) ac<strong>co</strong>rding the Dallas (2007) classification system.‣ In this situation the Dallas (2007) classification is likely to be more accurate since it<strong>co</strong>nsiders the aquatic macro-invertebrate <strong>co</strong>mmunity sensitivity more strongly.‣ If a balanced approach is <strong>co</strong>nsidered between the two classification systems thesystem can be defined as a Class B system indicating largely natural <strong>co</strong>nditionswith few modifications.‣ Further impacts on the system <strong>co</strong>uld potentially lead to further degradation of thesystem and, therefore, lead to a deviation from the PES of the system and reducede<strong>co</strong>logical functioning.27
SAS PES Orange River October 2012‣ Careful design and <strong>co</strong>nstruction will be required to limit the impact on the systemfrom developments in the area. Maintenance will also need to be well managed inthe operational phase of the development to prevent impacts on the system fromimpounding, erosion and altered bed and bank <strong>co</strong>nditions.5.1.4 Fish Community IntegrityThe fish <strong>co</strong>mmunity of the site was sampled for a period of one half hour. The table belowserves as a summary of the results obtained for the site.Table 16: A summary of the results obtained from the application of the FAIIindex to the siteSITEHabitat and <strong>co</strong>verSpecies present andnumber of individualsobtainedHealth and <strong>co</strong>nditionCO3Extensive habitat for fish is available at the site. There is a diversity of depth and flowclasses, providing excellent diversity of habitat for fish. The most abundant <strong>co</strong>ver typeis rocky substrate. Limited amounts of overhanging bankside vegetation are presentand some undercut root wads and reeds are present.Labeobarbus aeneus 8 150mm - 350mmLabeobarbus capensis 5 180mm – 250mmClarias gariepinus 1 370 mmNo impairment of fish health observed.Expected FAII s<strong>co</strong>re 135Observed FAII s<strong>co</strong>re 34.5Relative FAII s<strong>co</strong>re 25.6%FAII classification “Class E”. Seriously modified. A strikingly lower than expected species richness and a(Kleynhans, 1999)general absence of intolerant and moderately intolerant species‣ The FAII data indicates that the fish <strong>co</strong>mmunity at the site has suffered a seriousloss in integrity when <strong>co</strong>mpared to the reference s<strong>co</strong>re for pristine Nama KarooE<strong>co</strong>region stream.‣ Extensive habitat for fish is available at the site.‣ There is a diversity of depth and flow classes, providing excellent diversity ofhabitat for fish.‣ The lower than expected fish s<strong>co</strong>re can be ascribed to limitations in sampling dueto the strong currents at the assessment site and the inability to access areas in theriver for sampling. It is deemed highly likely that numerous additional species wouldhave been captured if safe access to sampling areas was possible.‣ Based on the above <strong>co</strong>nsideration, limited loss of diversity and sensitivity of the fish<strong>co</strong>mmunity is deemed likely at the current time despite the low yield (diversity andabundance) of the fish <strong>co</strong>mmunity observed28
SAS PES Orange River October 2012‣ The most abundant <strong>co</strong>ver type is rocky substrate and water <strong>co</strong>lumn depth. Limitedamounts of overhanging bankside vegetation are present and some undercut rootwads and reeds are present.5.1.5 Riparian vegetation IntegrityThe riverine and bankside vegetation of the Orange river can be <strong>co</strong>nsidered to be dynamicwith the sandy stream banks being <strong>co</strong>nstantly shifted during periods of high flow. Theunstable nature of the system leads to the proliferation of pioneering vegetation on thestream banks and also leads to <strong>co</strong>nstantly changing instream habitat. Alien vegetationencroachment in the area was noticeable with some areas being worse affected thanothers. Some loss of riparian vegetation due to impacts from agriculture, with specialmention of the clearing of areas for agriculture and the <strong>co</strong>nstruction of levees along theactive stream channels was evident.5.1.5 Summary of General System CharacteristicsBased on the <strong>co</strong>nsideration of the above factors the Orange River can be <strong>co</strong>nsidered to bea tolerant system that is adapted to <strong>co</strong>nstantly changing substrate and bankside <strong>co</strong>nditionsas well as <strong>co</strong>nstant variation in flow. The system is also tolerant to changes in water qualitywith special mention of temperatures, dissolved salt and turbidity levels as water<strong>co</strong>nstituents change through the system.The aquatic <strong>co</strong>mmunities of the system are however still intact with more sensitive aquaticmacro-invertebrate and fish populations still present and as such as much as the system is<strong>co</strong>nsidered to be tolerant it must also be <strong>co</strong>nsidered to be sensitive to impacts that occuron the system.It is therefore deemed essential that any proposed activities which <strong>co</strong>uld affect the systembe <strong>co</strong>mprehensively assessed to define and understand the impacts and in order to ensurethat suitable and sufficient mitigation measures are put in place to protect the systemthroughout the life of the project and associated infrastructure.29
SAS PES Orange River October 20125.2 Crossing Alternatives5.2.1 Crossing Alternative 1Figure 5: Aerial photograph depicting the crossing Alternative C130
SAS PES Orange River October 20125.2.1.1 Visual <strong>Assessment</strong> of Instream ConditionsA photographic re<strong>co</strong>rd of the site was made in order to provide a visual re<strong>co</strong>rd of the<strong>co</strong>ndition of the assessment site as observed during the field assessment. Thephotographs taken are presented below together with a table summarising theobservations for the various criteria made during the visual assessment undertakenon the site.Figure 6: Upstream view of the C1 site,indicating extremely fast flowing white water androcky substrate upstream of the crossing.Figure 7: Downstream view of the C1 siteshowing the rocky rapids downstream of thecrossing and the limited bankside vegetation insome places.SITETable 17:areaBraiding of the systemRiparian zonecharacteristicsAlgal presenceVisual indication of animpact on aquatic faunaDepth characteristicsFlow <strong>co</strong>nditionWater clarityWater odorErosion potentialDescription of the location of the <strong>Assessment</strong> site in the studyC1At this point the system mostly <strong>co</strong>nsists of one channel, which be<strong>co</strong>mes<strong>co</strong>nstricted at points leading to very fast flow in some areasThe riparian zone is wide. Some impact from alien vegetation encroachment hasoccurred. The existing weir causes upstream inundation which alters thevegetation characteristics in this area.No algal proliferation was evident at the current time.Water is turbid but not beyond the naturally expected <strong>co</strong>nditions for the area.The stream <strong>co</strong>nsists of deep pools, fast flowing rapids and fast glides.The river at this point is generally fast flowing with extremely fast flowing narrowrapids, fast riffles and glides and slower deeper pool areas and eddies.Water is dis<strong>co</strong>lored but can be <strong>co</strong>nsidered natural.NoneUnder high flow <strong>co</strong>nditions the system will erode rapidly due to the fast flow of thewater and the unstable sandy nature of the riparian zone. This can however beregarded as natural for the system in the area.31
6Vegetation removalWater abstractionAlien encroachmentFlow modificationBank erosionBed modificationWater abstractionChannel modificationFlow modificationWater qualityChannel modificationInundationWater qualityExotic macrophytesInundationExotic faunaTotal S<strong>co</strong>re (%)Solid waste disposalTotal S<strong>co</strong>re (%)ClassificationClassificationSAS PES Orange River October 20125.2.1.2 Habitat <strong>Assessment</strong>Instream Habitat IntegrityWeights 14 13 13 13 14 10 9 8 6REACHC11 4 3 0 0 6 0 0 3 0 91.4 A UnmodifiedNone Small Moderate Large Serious CriticalRiparian Zone Habitat IntegrityWeights 13 12 14 12 13 11 12 13REACHC11 14 18 14 2 3 6 3 0 52.8 D Largely modifiedNone Small Moderate Large Serious CriticalREACHINSTREAM RIPARIAN ZONE IHIACLASSHABITATSCOREC1 91.4 52.8 72.1 C Moderately modifiedFigure 8:Integrated Habitat Integrity <strong>Assessment</strong>‣ From the results of the application of the IHIA to the assessment site, it isevident that there are several large impacts on the habitat of the area withspecific mention of riparian zone impacts while instream impacts were morelimited.‣ Instream impacts at the site included moderate impacts from water quality,and water abstraction. Smaller impacts from exotic fauna and flowmodification were also noted. Overall, the site achieved a 91.4 % s<strong>co</strong>re for instream integrity. Indicating unmodified (Class A) <strong>co</strong>nditions.‣ The largest riparian zone impacts included vegetation removal, alienvegetation encroachment and bank erosion. Smaller impacts from channelmodification were observed. The site achieved a 52.8% s<strong>co</strong>re for riparianintegrity representing largely modified (Class D) <strong>co</strong>nditions.‣ The site obtained an overall IHIA rating of 72.1% s<strong>co</strong>re for riparian integrityrepresenting moderately modified (Class C) <strong>co</strong>nditions. The site, therefore,falls below the DEMC for the quaternary catchment from a habitat integrity32
SAS PES Orange River October 2012perspective. Measures to prevent further impacts on the system are thereforerequired and care should be taken to prevent impacts from any futuredevelopments.5.2.1.3 Riparian vegetation analysesOn this portion of the Orange, the river itself is anabranching with isolatedsmall islands in the main channel. The active river channel is approximately40 meters wide and the potential riparian zone width is approximately 75meters on the left hand bank, 40 meters on the right hand bank and 25 meterson the islands. The substrate is dominated by bedrock and gravel and sand.Various bare areas were noted, although this is a feature of the river and aresult of its natural flow level fluctuations and sediment deposition.A list of the floral species observed during the assessment is presented in thefollowing table but is briefly described below. The woody layer of the riparianvegetation was dominated by Ziziphus mucronata, Searsia lancea andTamarix usneoides. These species are all indicative of the Lower GariepAlluvial Vegetation, and as such the riparian zone vegetation can be<strong>co</strong>nsidered natural. The instream vegetation was dominated by Phragmitesaustralis. The grass <strong>co</strong>mponent <strong>co</strong>nsists mainly of Cynodon dactylon andStipagrostis namaquensis. Alien species included Ni<strong>co</strong>tiana glauca, Daturastramonium and Solanum sisymbrifolium. Moving downstream, this patternremains fairly <strong>co</strong>nstant, the only readily observable change is the density ofvegetation and <strong>co</strong>ver percentage. When <strong>co</strong>mparing the species list (especiallytrees and grasses) to the vegetation list for Lower Gariep Alluvial Vegetation,it be<strong>co</strong>mes clear that the species <strong>co</strong>mposition of the riparian zone is stilllargely intact, even though some impacts are evident due to agriculturalpractices adjacent to the river. The following table presents a list of vegetationen<strong>co</strong>untered on site.33
SAS PES Orange River October 2012Table 18: Dominant riparian vegetation species noted during the riparian vegetationassessment at C1. Exotic species are marked by an asterisk.Trees/shrubs Forbs Grasses/sedgesAcacia karrooNi<strong>co</strong>tiana glauca*Searsia lanceaTamarix usneoidesZiziphus mucronataSalix babylonica*Asclepias fruti<strong>co</strong>saBidens pilosa*Datura stramonium*Solanum sisymbrifolium*Veronica anagallis-aquatica*Cyperus marginatusCynodon dactylonJuncus effususStipagrostis namaquensisPanicum maximumPhragmites australisSetaria verticellataThe RVI for this site was 14.7 (out of a possible 20), a value which falls withinthe boundary of a class C (moderately modified) system. The reason for thissite receiving this value is mainly due to the relatively intact representativeLower Gariep Alluvial vegetation, the presence of larger woody species andmoderately high levels of habitat provision. Although some bare areas arepresent, it is most likely a natural feature of this highly dynamic system whichexperiences natural high flow level fluctuation and sediment deposition. Theresults for the RVI are presented in <strong>Appendix</strong> 1.5.2.1.4 Crossing suitability analysesThe table below presents the advantages and disadvantages of the proposedcrossing pointTable 19: suitability analyses of the C1 crossing alternativeC1 Advantages DisadvantagesThe river channel is not branched at thispointThe riparian zone substrate is unstable andprone to erosion and as such carefulplanning of foundations will be required andThe river is narrow at this point and willmost likely be easily spanned withtowers outside of the riparian zone of theriver and therefore no impact on theinstream habitat is deemed likelyThe riparian zone vegetation at this pointis a narrow strip along the river banksand impact thereon can be avoidedmeasures will be required to <strong>co</strong>ntrol erosionAlien vegetation is a problem in the areaand measures to <strong>co</strong>ntrol erosion will needto be ensured34
SAS PES Orange River October 20125.2.1.5 ConclusionThe narrow river channel with limited anabranching and lowered RVI s<strong>co</strong>re meansthat the proposed crossing will have less impact on the receiving riparianenvironment than most of the other crossing points. Due to the narrow width of theriver in this area the risk to the instream habitat and aquatic <strong>co</strong>mmunity is regardedas being limited provided that suitable mitigation is implemented. Based on thesecharacteristic, this crossing point is highly re<strong>co</strong>mmended as the best alternative tocross the Orange River.35
SAS PES Orange River October 20125.2.2 Crossing Alternative 2Figure 9: Aerial photograph depicting the crossing point alternative C236
SAS PES Orange River October 20125.2.2.1 Visual <strong>Assessment</strong> of Instream ConditionsA photographic re<strong>co</strong>rd of the site was made in order to provide a visual re<strong>co</strong>rd of the<strong>co</strong>ndition of the assessment site as observed during the field assessment. Thephotographs taken are presented below together with a table summarising theobservations for the various criteria made during the visual assessment undertakenon the site.Figure 10: Upstream view of the C2 site,indicating moderately deep system with slowflowing water.Figure 11: Downstream view of the C2 siteshowing the abundant marginal vegetation at thesite.SITETable 20:areaBraiding of the systemRiparian zonecharacteristicsAlgal presenceVisual indication of animpact on aquatic faunaDepth characteristicsFlow <strong>co</strong>nditionWater clarityWater odorErosion potentialDescription of the location of the <strong>Assessment</strong> site in the studyC2At this point the system <strong>co</strong>nsists of an anabranching channel with a large islandsplitting two main channels although some smaller channels are also evident.This increases the extent of the riparian areas on the subject property.The riparian zone is narrow due to the encroachment of agricultural activities onthe stream bank. This is particularly evident on the northern bank of the River.The riparian vegetation on the island banks is however extensive. Some impactfrom alien vegetation encroachment has occurred. Visually, the riparianvegetation looks to be in excellent <strong>co</strong>ndition.No algal proliferation was evident at the current time.Water is turbid but not beyond the naturally expected <strong>co</strong>nditions for the area.The river is dominated by deep relatively fast flowing glides at this point.The river at this point is generally fast flowing with limited diversity of flow in thearea.Water is dis<strong>co</strong>lored but can be <strong>co</strong>nsidered natural.NoneUnder high flow <strong>co</strong>nditions the system will be susceptible to erosion althoughbankside vegetation <strong>co</strong>ver is good the risk of erosion under high flow <strong>co</strong>nditionscan be <strong>co</strong>nsidered to be a natural characteristic of the system.37
6Vegetation removalWater abstractionAlien encroachmentFlow modificationBank erosionBed modificationWater abstractionChannel modificationFlow modificationWater qualityChannel modificationInundationWater qualityExotic macrophytesInundationExotic faunaTotal S<strong>co</strong>re (%)Solid waste disposalTotal S<strong>co</strong>re (%)ClassificationClassificationSAS PES Orange River October 20125.2.2.2Habitat <strong>Assessment</strong>Instream Habitat IntegrityWeights 14 13 13 13 14 10 9 8 6REACHC2 4 2 0 0 6 0 0 3 0 91.9 A UnmodifiedNone Small Moderate Large Serious CriticalRiparian Zone Habitat IntegrityWeights 13 12 14 12 13 11 12 13REACHCO2 17 14 14 2 3 13 3 0 46.1 D Largely modifiedNone Small Moderate Large Serious CriticalREACHINSTREAM RIPARIAN ZONE IHIACLASSHABITATSCOREC2 91.9 46.1 69 C Moderately modifiedFigure 12:Integrated Habitat Integrity <strong>Assessment</strong>‣ From the results of the application of the IHIA to the assessment site, it isevident that there are several large impacts on the habitat of the area withspecial mention of impacts on the riparian zone while instream habitatimpacts are limited.‣ Instream impacts at the site included some impacts from water abstraction,and water quality modification. Smaller impacts from exotic fauna and flowmodification were also noted. Overall, the site achieved a 91.9 % s<strong>co</strong>re for instream integrity. Indicating an unmodified (Class A) <strong>co</strong>nditions.‣ The largest riparian zone impacts included flow bank erosion, alien vegetationencroachment, vegetation removal as well as channel modification. Channelmodification is largely as a result of the <strong>co</strong>nstruction of levees to preventimpacts on adjacent vineyards and orchards. Smaller impacts from flowmodification and water quality modification were observed. The site achieveda 46.1% s<strong>co</strong>re for riparian integrity representing largely modified (Class D)<strong>co</strong>nditions.38
SAS PES Orange River October 2012‣ The site obtained an overall IHIA rating of 69% s<strong>co</strong>re for riparian integrityrepresenting moderately modified (Class C) <strong>co</strong>nditions. The site, therefore,falls below the DEMC for the quaternary catchment from a habitat integrityperspective. Measures to prevent further impacts on the system are thereforerequired and care should be taken to prevent impacts from any futuredevelopments.5.2.2.3 Riparian vegetation analysesOn this portion of the Orange, the river is anabranching with various islands inthe main channel. The active river channel is approximately 45 meters wideand the potential riparian zone is approximately 60 meters on the left handbank, 70 meters on the right hand bank and 100 meters on the islands. Thesubstrate is dominated by bedrock, gravel and sand. The riverbanks werevegetated and dominated by woody species and reeds.A list of the floral species observed during the assessment is presented in thefollowing table but is briefly described below. The woody layer of the riparianvegetation was dominated by Ziziphus mucronata, Searsia lancea andTamarix usneoides, although much denser than at C1. These species are allindicative of the Lower Gariep Alluvial Vegetation, and as such the vegetationcan be <strong>co</strong>nsidered natural. The instream and bankside vegetation wasdominated by Phragmites australis. As at C1, the grass <strong>co</strong>mponent <strong>co</strong>nsistsmainly of Cynodon dactylon and Stipagrostis namaquensis. Alien speciesincluded Ni<strong>co</strong>tiana glauca, Datura stramonium and Solanum sisymbrifolium.This vegetation structure remains <strong>co</strong>nstant for a <strong>co</strong>nsiderable distance upanddownstream, with vegetation density and abundance changing slightly.When <strong>co</strong>mparing the species list (especially trees and grasses) to thevegetation list for Lower Gariep Alluvial Vegetation, it be<strong>co</strong>mes clear that thespecies <strong>co</strong>mposition of the riparian zone is still largely intact, even thoughsome impacts are evident due to agricultural practices such as vineyardsadjacent to the river. The following table presents a list of vegetationen<strong>co</strong>untered on site.39
SAS PES Orange River October 2012Table 21: Dominant riparian vegetation species noted during the riparian vegetationassessment at C2. Exotic species are marked by an asterisk.Trees/shrubs Forbs Grasses/sedgesAcacia karrooNi<strong>co</strong>tiana glauca*Searsia lanceaTamarix usneoidesZiziphus mucronataSalix babylonica*Asclepias fruti<strong>co</strong>saBidens pilosa*Datura stramonium*Solanum sisymbrifolium*Veronica anagallis-aquatica*Cyperus marginatusCynodon dactylonJuncus effususStipagrostis namaquensisPanicum maximumPhragmites australisSetaria verticellataThe RVI for this site was 17.3 (out of a possible 20), a value which leads tothe area being classified as a class B (largely natural) river segment. Thereason for this site receiving this value is mainly due to the moderate to highabundances and diversity of indigenous species and representative LowerGariep Alluvial vegetation. The dense reed beds provide habitat for apotentially diverse faunal <strong>co</strong>mmunity and also provide valuable floodattenuation and water filtration services. The results for the RVI are presentedin <strong>Appendix</strong> 1.5.2.2.4 Crossing suitability analysesThe table below presents the advantages and disadvantages of the proposedcrossing point:Table 22: suitability analyses of the C2 crossing alternativeC2 Advantages DisadvantagesThe river channel branched at this pointbut support towers can be <strong>co</strong>nstructedon the river banks and the main islandwhich will limit the impact on theinstream e<strong>co</strong>logyThe river channel branched at this pointand support towers will have to be<strong>co</strong>nstructed on the river banks and the mainisland which will lead to an impact on theriparian vegetation of the system withThe riparian vegetation zone on themain river banks is narrow and theimpact of the support towers on theriparian vegetation and habitats can beavoidedThe instream habitat sensitivity at thispoint is limited in diversity and sensitivityand severe impacts on instream habitatis regarded as being limited.special mention of the island vegetationAlien vegetation is a problem in the areaand measures to <strong>co</strong>ntrol erosion will needto be ensuredRiparian vegetation at this point is in good<strong>co</strong>ndition and impacts <strong>co</strong>uld lead to analteration of the characteristics of theriparian zone vegetation40
SAS PES Orange River October 20125.2.2.5 ConclusionThe anabranching river channel and relatively high RVI s<strong>co</strong>re means that thisproposed crossing alternative will have a significantly higher impact on the receivingriparian zone environment than most of the other crossing points. Due to the ability toplace support towers on the river banks and islands as well as the limited diversityand sensitivity of the instream habitat the risk to the instream habitat and aquatic<strong>co</strong>mmunity is regarded as being limited, provided that suitable mitigation isimplemented. Based on these characteristics, this crossing point is notre<strong>co</strong>mmended as a suitable alternative to cross the Orange River unless measuresto minimise the impacts on the riparian vegetation can be implemented and thatriparian vegetation can be rehabilitated.41
SAS PES Orange River October 20125.2.3 Crossing Alternative 3Figure 13: Aerial photograph depicting the crossing Alternative C342
SAS PES Orange River October 20125.2.3.1 Visual <strong>Assessment</strong> of Instream ConditionsA photographic re<strong>co</strong>rd of the site was made in order to provide a visual re<strong>co</strong>rd of the<strong>co</strong>ndition of the assessment site as observed during the field assessment. Thephotographs taken are presented below together with a table summarising theobservations for the various criteria made during the visual assessment undertakenon the site.Figure 14: Upstream view of the C3 site,indicating some <strong>co</strong>nstruction activities at the site.Figure 15: Downstream view of the C3 siteshowing the rocky rapids downstream of thecrossing.SITETable 23:areaBraiding of the systemRiparian zonecharacteristicsAlgal presenceVisual indication of animpact on aquatic faunaDepth characteristicsFlow <strong>co</strong>nditionWater clarityWater odorErosion potentialDescription of the location of the <strong>Assessment</strong> site in the studyC2At this point the system mostly <strong>co</strong>nsists of a single channel to the west of theexisting road crossing, while to the east the system is anabranching.The riparian zone is wide. Some impact from alien vegetation encroachment hasoccurred with special mention of the Kikuyu lawn at the hotel to the east of theexisting road crossing.No algal proliferation was evident at the current time.Water is turbid but not beyond the naturally expected <strong>co</strong>nditions for the area.The stream <strong>co</strong>nsists of deep pools, fast flowing shallower rapids and fast glidesof moderate depth.The river at this point has a diversity of flow present but flow is generally fast.There are fast flowing rapids, fast riffles and glides and slower deeper pool areasand backwaters to the east of the existing bridge crossing.Water is dis<strong>co</strong>lored but can be <strong>co</strong>nsidered natural.NoneUnder high flow <strong>co</strong>nditions the system has the potential to erode due to the fastflow of the water and incised banks of the river. This can however be regarded asnatural for the system in the area. Some protection will be afforded by fairly goodbankside vegetation <strong>co</strong>ver43
5Vegetation removalWater abstractionAlien encroachmentFlow modificationBank erosionBed modificationWater abstractionChannel modificationFlow modificationWater qualityChannel modificationInundationWater qualityExotic macrophytesInundationExotic faunaTotal S<strong>co</strong>re (%)Solid waste disposalTotal S<strong>co</strong>re (%)ClassificationClassificationSAS PES Orange River October 20125.2.3.2 Habitat <strong>Assessment</strong>Instream Habitat IntegrityWeights 14 13 13 13 14 10 9 8 6REACHC3 4 12 7 6 6 0 0 5 0 75 C Moderately modifiedNone Small Moderate Large Serious CriticalRiparian Zone Habitat IntegrityWeights 13 12 14 12 13 11 12 13REACHC3 19 17 12 2 9 9 3 0 43.1 D Largely modifiedNone Small Moderate Large Serious CriticalREACHINSTREAM RIPARIAN ZONE IHIACLASSHABITATSCORECO3 75 43.1 59.1 D Largely modifiedFigure 16:Integrated Habitat Integrity <strong>Assessment</strong>‣ From the results of the application of the IHIA to the assessment site, it isevident that there are several large impacts on the habitat of the area withimpacts more prevalent in the riparian zone than the instream habitat.‣ Instream impacts at the site included large impacts from flow and bedmodifications. Smaller impacts from water quality and channel modificationwere also noted. Overall, the site achieved a 75 % s<strong>co</strong>re for in streamintegrity. Indicating moderately modified (Class C) <strong>co</strong>nditions.‣ The largest riparian zone impacts included flow modification bank erosion,alien vegetation encroachment and indigenous vegetation removal. Smallerimpacts from flow modification and channel modification were observed. Thesite achieved a 43.1% s<strong>co</strong>re for riparian zone integrity representing largelymodified (Class D) <strong>co</strong>nditions.‣ The site obtained an overall IHIA rating of 59.1% s<strong>co</strong>re for riparian integrityrepresenting largely modified (Class D) <strong>co</strong>nditions. The site, therefore, falls44
SAS PES Orange River October 2012below the DEMC for the quaternary catchment from a habitat integrityperspective. Measures to prevent further impacts on the system are thereforerequired and care should be taken to prevent impacts from any futuredevelopments. If the crossing was however to take place at this point theimpact on the riverine habitat would be reduced, due to the reduced level ofintegrity and sensitivity of the riverine habitat.5.2.3.3 Riparian vegetation analysesThe Orange River at this point is anabranching with islands scatteredthroughout the main channel to the east of the river crossing but <strong>co</strong>nsistslargely of a single channel to the west for the bridge. The active river channelis approximately 80 meters wide and the potential riparian zone isapproximately 40 meters on the left hand bank, 50 meters on the right handbank and 30 meters on the islands to the east of the existing bridge crossing.The substrate is dominated by bedrock, <strong>co</strong>bbles, gravel and sand. Theriverbanks were vegetated and dominated by woody species and reeds,although they were transformed in some areas by landscaping activities andbridge developments.The woody layer of the riparian vegetation was dominated by Ziziphusmucronata, Searsia lancea and Tamarix usneoides, in various densities.Although some areas have been transformed by landscaping and bridgedevelopment, the overall vegetation <strong>co</strong>mposition is indicative of the LowerGariep Alluvial Vegetation. The instream vegetation was dominated byPhragmites australis. The grass <strong>co</strong>mponent <strong>co</strong>nsists mainly of Cynodondactylon and Stipagrostis namaquensis, although the landscaped section<strong>co</strong>ntains the exotic Pennisetum clandestinum. Alien species includedEucalyptus camaldulensis, Ni<strong>co</strong>tiana glauca, Pennisetum clandestinum,Datura stramonium and Solanum sisymbrifolium. This vegetation structureremains <strong>co</strong>nstant for a <strong>co</strong>nsiderable distance up- and downstream, withvegetation density and abundance changing slightly. When <strong>co</strong>mparing thespecies list (especially trees and grasses) to the vegetation list for LowerGariep Alluvial Vegetation, it be<strong>co</strong>mes clear that the species <strong>co</strong>mposition ofthe riparian zone is still largely intact, even though some impacts are evident45
SAS PES Orange River October 2012due to landscaping activities and infrastructure <strong>co</strong>nstruction. The followingtable presents a list of vegetation en<strong>co</strong>untered on site.Table 24: Dominant riparian vegetation species noted during the riparian vegetationassessment at C3. Exotic species are marked by an asterisk.Trees/shrubs Forbs Grasses/sedgesAcacia karrooNi<strong>co</strong>tiana glauca*Searsia lanceaTamarix usneoidesZiziphus mucronataSalix babylonica*Eucalyptus camaldulensis*Asclepias fruti<strong>co</strong>saBidens pilosa*Datura stramonium*Solanum sisymbrifolium*Veronica anagallis-aquatica*Cyperus marginatusCynodon dactylonJuncus effususStipagrostis namaquensisPanicum maximumPhragmites australisSetaria verticellataPennisetum clandestinum*The RVI for this site was 13 (out of a possible 20), a value which falls withinthe boundary of a class C (moderately modified) system. The reason for thissite receiving this value is mainly due to the disturbances associated with thelandscaping activities and infrastructure upgrades. However the larger riparianzone is still representative of Lower Gariep Alluvial vegetation. The results forthe RVI are presented in <strong>Appendix</strong> 1.5.2.3.4 Crossing suitability analysesThe table below presents the advantages and disadvantages of the proposedcrossing pointTable 25: suitability analyses of the C3 crossing alternativeC2 Advantages DisadvantagesThe river channel to the west of theexisting bridge crossing is a singlechannel which can be spanned withsupport towers outside of the riparianzone on each bank.The river channel branched at this pointand support towers will have to be<strong>co</strong>nstructed on the river banks and the mainisland which will lead to an impact on theriparian vegetation of the system withThe river channel branched at this pointbut support towers can be <strong>co</strong>nstructedon the river banks and the main islandwhich will limit the impact on theinstream e<strong>co</strong>logy.The riparian vegetation zone on themain river banks is narrow and theimpact of the support towers on theriparian vegetation and habitats can bespecial mention of the island vegetation.Alien vegetation is a problem in the areaand measures to <strong>co</strong>ntrol erosion will needto be ensured.Riparian vegetation at this point is in good<strong>co</strong>ndition and impacts <strong>co</strong>uld lead to analteration of the characteristics of theriparian zone vegetation46
SAS PES Orange River October 2012C2 Advantages DisadvantagesavoidedThe instream habitat sensitivity at thispoint is limited in diversity and sensitivityand severe impacts on instream habitatis regarded as being limited.5.2.3.5 ConclusionThe anabranching river channel and relatively high RVI s<strong>co</strong>re means that thisproposed crossing alternative will have a significantly higher impact on the receivingriparian zone environment than the other crossing points if <strong>co</strong>nstruction is undertakento the east of the existing road bridge. If however the crossing is made to the west ofthe existing bridge crossing the impact on the Orange River e<strong>co</strong>logy can be largelyavoided. If <strong>co</strong>nstruction takes place to the east of the bridge a tower will most likelyneed to be placed on the island which will impact on the riparian vegetation of thesystem. The riparian vegetation of the islands is in good <strong>co</strong>ndition and the tower willhave a significant impact on the island riparian vegetation. The instream habitat inthis areas is of increased sensitivity in relation to the other sites further downstreamas well as in relation to crossing alternative 5 due to increased diversity andsensitivity of the instream habitat and the risk to the instream habitat and aquatic<strong>co</strong>mmunity is regarded as being relatively significant at this point. If this crossingpoint is selected measures will be required to prevent impacts on the instreamhabitats and associated <strong>co</strong>mmunities. Based on these findings, this crossing point isnot re<strong>co</strong>mmended as a suitable alternative to cross the Orange River unless it occursto the west of the existing road crossing. A crossing to the east of the existing roadcrossing is not deemed suitable unless extensive measures to minimise the impactson the riparian vegetation and instream habitat can be implemented and that riparianvegetation can be rehabilitated.47
SAS PES Orange River October 20125.2.4 Crossing Alternative 4Figure 17: Aerial photograph depicting the crossing Alternative 448
SAS PES Orange River October 20124.2.4.1 Visual <strong>Assessment</strong> of Instream ConditionsA photographic re<strong>co</strong>rd of the site was made in order to provide a visual re<strong>co</strong>rd of the<strong>co</strong>ndition of the assessment site as observed during the field assessment. Thephotographs taken are presented below together with a table summarising theobservations for the various criteria made during the visual assessment undertakenon the site.Figure 18: Upstream view of the C4 site,indicating the impact from inundation caused by asmall weir.Figure 19: Downstream view of the C4 siteshowing the laminar flows in the system at thispoint.SITETable 26:areaBraiding of the systemRiparian zonecharacteristicsAlgal presenceVisual indication of animpact on aquatic faunaDepth characteristicsFlow <strong>co</strong>nditionWater clarityWater odorErosion potentialDescription of the location of the <strong>Assessment</strong> site in the studyC4At this point the system is braided with two main channels. The main island islarge and is under cultivation. The two main river channels are furtheranabranched with small islands with natural riparian vegetation <strong>co</strong>ver.The riparian zone is narrow on the main stream banks and the large island due tothe effects of clearing for agriculture and the <strong>co</strong>nstruction of levees to protect theadjacent vineyards and orchards. Some impact from alien vegetationencroachment has occurred. The existing weir causes upstream inundation whichalters the vegetation characteristics in this area.No algal proliferation was evident at the current time.Water is turbid but not beyond the naturally expected <strong>co</strong>nditions for the area.The stream <strong>co</strong>nsists of deep pools, fast flowing rapids and fast glides.The river at this point is generally fast flowing with fast flowing narrow rapids, fastflowing glides.Water is dis<strong>co</strong>lored but can be <strong>co</strong>nsidered natural.NoneUnder high flow <strong>co</strong>nditions the system will erode rapidly due to the fast flow of thewater and the unstable sandy nature of the riparian zone. This can however beregarded as natural for the system in the area. The area does have goodbankside <strong>co</strong>ver which will protect the banks to some degree.49
Vegetation removalWater abstractionAlien encroachmentFlow modificationBank erosionBed modificationWater abstractionChannel modificationFlow modificationWater qualityChannel modificationInundationWater qualityExotic macrophytesInundationExotic faunaTotal S<strong>co</strong>re (%)Solid waste disposalTotal S<strong>co</strong>re (%)ClassificationClassificationSAS PES Orange River October 20125.2.4.2 Habitat <strong>Assessment</strong>Instream Habitat IntegrityWeights 14 13 13 13 14 10 9 8 6REACHC4 4 7 4 8 6 0 0 3 0 83.1 B Largely modifiedNone Small Moderate Large Serious CriticalRiparian Zone Habitat IntegrityWeights 13 12 14 12 13 11 12 13REACHC4 17 14 11 2 3 13 3 0 47.8 D Largely modifiedNone Small Moderate Large Serious Critical5REACHINSTREAM RIPARIAN ZONE IHIACLASSHABITATSCOREC4 83.1 47.8 65.4 C Moderately modifiedFigure 20:Integrated Habitat Integrity <strong>Assessment</strong>‣ From the results of the application of the IHIA to the assessment site, it isevident that there are several large impacts on the habitat of the area.Impacts on the riparian zone are particularly significant in relation to those inthe instream area.‣ Instream impacts at the site included large impacts from flow and channelmodifications. Smaller impacts from water quality modification were alsonoted. Overall, the site achieved an 83.1% s<strong>co</strong>re for in stream integrity.Indicating largely natural (Class B) <strong>co</strong>nditions.‣ The largest riparian zone impacts included flow bank erosion, vegetationremoval, channel modification and alien vegetation encroachment. Smallerimpacts from flow modification, and water quality modification were observed.The site achieved a 47.8% s<strong>co</strong>re for riparian integrity representing largelymodified (Class D) <strong>co</strong>nditions.50
SAS PES Orange River October 2012‣ The site obtained an overall IHIA rating of 65.4% s<strong>co</strong>re for riparian integrityrepresenting moderately modified (Class C) <strong>co</strong>nditions. The site, therefore,falls below the DEMC for the quaternary catchment from a habitat integrityperspective. Careful planning will be required in order to prevent impacts onthis stream segment which would lead to local deterioration of the system.5.2.4.3 Riparian vegetation analysesAt this assessment point, the Orange River is anabranching, with islandslocated in the main channel. The active river channel is approximately 45meters wide and the potential riparian zone is approximately 60 meters on theleft hand bank, 60 meters on the right hand bank and 60 meters on the islandsexcept for the main island where the extent of the riparian zone is limited dueto the agricultural activities on the island. The substrate is dominated bybedrock, <strong>co</strong>bbles, gravel and sand. The riverbanks were vegetated anddominated by indigenous woody species and reeds, with low levels ofdisturbance en<strong>co</strong>untered, most notably a weir which has caused low levels ofbank erosion.The woody layer of the riparian vegetation was dominated by Ziziphusmucronata, Olea europaea subsp. africana, Searsia lancea and Tamarixusneoides, and is mostly extremely dense. As a result of the low levels ofdisturbance, the overall vegetation <strong>co</strong>mposition is indicative of the LowerGariep Alluvial Vegetation. The instream vegetation was dominated byPhragmites australis. The grass <strong>co</strong>mponent <strong>co</strong>nsists mainly of Cynodondactylon and Stipagrostis namaquensis in areas where the woody layer is notvery dominant. Alien species included Ni<strong>co</strong>tiana glauca, Datura stramoniumand Solanum sisymbrifolium. The pattern of vegetation structure remains<strong>co</strong>nstant for a <strong>co</strong>nsiderable distance up- and downstream, with vegetationdensity and abundance changing slightly. When <strong>co</strong>mparing the species list(especially trees and grasses) to the vegetation list for Lower Gariep AlluvialVegetation, it be<strong>co</strong>mes clear that the species <strong>co</strong>mposition of the riparian zoneis still largely natural. The following table presents a list of vegetationen<strong>co</strong>untered on site.51
SAS PES Orange River October 2012Table 27: Dominant riparian vegetation species noted during the riparian vegetationassessment at C4. Exotic species are marked by an asterisk.Trees/shrubs Forbs Grasses/sedgesAcacia karrooNi<strong>co</strong>tiana glauca*Searsia lanceaTamarix usneoidesZiziphus mucronataSalix babylonica*Oleae europaea subsp.africanaAsclepias fruti<strong>co</strong>saBidens pilosa*Datura stramonium*Solanum sisymbrifolium*Veronica anagallis-aquatica*Cyperus marginatusCynodon dactylonJuncus effususStipagrostis namaquensisPanicum maximumPhragmites australisSetaria verticellataThe RVI for this site was similar to the C2 site and also calculated as 17.3 (outof a possible 20), which falls within the boundary of a class B (largely natural)system. The reason for this site receiving this value is mainly due to themoderate to high abundances and diversity of indigenous species andrepresentative Lower Gariep Alluvial vegetation. The dense reed beds providehabitat for a potentially diverse faunal <strong>co</strong>mmunity and also provide valuableflood attenuation and water filtration services. Although the weir has been<strong>co</strong>nstructed, it has only had a low impact on riparian vegetation. The resultsfor the RVI are presented in <strong>Appendix</strong> 1.4.2.4.4 Crossing suitability analysesThe table below presents the advantages and disadvantages of the proposedcrossing pointTable 28: suitability analyses of the C4 crossing alternativeC4 Advantages DisadvantagesThe river channel branched at this pointbut support towers can be <strong>co</strong>nstructedon the river banks and the main islandwhich will limit the impact on theinstream e<strong>co</strong>logyThe riparian vegetation zone on themain river banks is narrow and theimpact of the support towers on theriparian vegetation and habitats can beavoidedThe instream habitat sensitivity at thispoint is limited in diversity and sensitivityand severe impacts on instream habitatis regarded as being limited.The river channel branched at this pointand support towers will have to be<strong>co</strong>nstructed on the river banks and the mainisland which has the potential to an impacton the riparian vegetation of the system.Alien vegetation is a problem in the areaand measures to <strong>co</strong>ntrol erosion will needto be ensuredRiparian vegetation at this point is inreasonable <strong>co</strong>ndition and impacts <strong>co</strong>uldlead to an alteration of the characteristics ofthe riparian zone vegetation52
SAS PES Orange River October 20125.2.4.5 ConclusionThe anabranching river channel and relatively high RVI s<strong>co</strong>re means that thisproposed crossing alternative will have a significantly higher impact on the receivingriparian zone environment than most of the other crossing points. Due to the ability toplace support towers on the river banks and islands as well as the limited diversityand sensitivity of the instream habitat the risk to the instream habitat and aquatic<strong>co</strong>mmunity is regarded as being limited, provided that suitable mitigation isimplemented. Based on these characteristics, this crossing point is notre<strong>co</strong>mmended as a suitable alternative to cross the Orange River unless measuresto minimise the impacts on the riparian vegetation can be implemented and thatriparian vegetation can be rehabilitated.53
SAS PES Orange River October 20125.2.5 Crossing Alternative 5Figure 21: Aerial photograph depicting the crossing Alternative 554
SAS PES Orange River October 20125.2.5.1 Visual <strong>Assessment</strong> of Instream ConditionsA photographic re<strong>co</strong>rd of the site was made in order to provide a visual re<strong>co</strong>rd of the<strong>co</strong>ndition of the assessment site as observed during the field assessment. Thephotographs taken are presented below together with a table summarising theobservations for the various criteria made during the visual assessment undertakenon the site.Figure 22: Upstream view of the C5 site,indicating rocky rapids and abundant banksidevegetation <strong>co</strong>ver.Figure 23: Downstream view of the C5 siteshowing the slow flowing river and bankside <strong>co</strong>ver.SITETable 29:areaBraiding of the systemRiparian zonecharacteristicsAlgal presenceVisual indication of animpact on aquatic faunaDepth characteristicsFlow <strong>co</strong>nditionWater clarityWater odorErosion potentialDescription of the location of the <strong>Assessment</strong> site in the studyC4At this point the system is braided with two main channels. The main island islarge and is under cultivation. The two main river channels are largelyunbranched with small islands with natural riparian vegetation <strong>co</strong>ver.The riparian zone is narrow on the main stream banks and the large island due tothe effects of clearing for agriculture and the <strong>co</strong>nstruction of levees to protect theadjacent vineyards and orchards. Some impact from alien vegetationencroachment has occurred. The existing weir causes upstream inundation whichalters the vegetation characteristics in this area.No algal proliferation was evident at the current time.Water is turbid but not beyond the naturally expected <strong>co</strong>nditions for the area.The stream <strong>co</strong>nsists of deep pools, fast flowing rapids and fast glides.The river at this point is generally fast flowing with fast flowing narrow rapids, fastflowing glides.Water is dis<strong>co</strong>lored but can be <strong>co</strong>nsidered natural.NoneUnder high flow <strong>co</strong>nditions the system will erode rapidly due to the fast flow of thewater and the unstable sandy nature of the riparian zone. This can however beregarded as natural for the system in the area. The area does have goodbankside <strong>co</strong>ver which will protect the banks to some degree.55
5Vegetation removalWater abstractionAlien encroachmentFlow modificationBank erosionBed modificationWater abstractionChannel modificationFlow modificationWater qualityChannel modificationInundationWater qualityExotic macrophytesInundationExotic faunaTotal S<strong>co</strong>re (%)Solid waste disposalTotal S<strong>co</strong>re (%)ClassificationClassificationSAS PES Orange River October 20125.2.5.2 Habitat <strong>Assessment</strong>Instream Habitat IntegrityWeights 14 13 13 13 14 10 9 8 6REACHCO5 4 2 3 0 8 0 0 3 0 89.1 B Largely naturalNone Small Moderate Large Serious CriticalRiparian Zone Habitat IntegrityWeights 13 12 14 12 13 11 12 13REACHCO5 8 9 12 2 3 16 3 0 65.6 C Moderately modifiedNone Small Moderate Large Serious CriticalREACHINSTREAM RIPARIAN ZONE IHIACLASSHABITATSCORECO5 89.1 65.6 77.3 C Moderately modifiedFigure 24:Integrated Habitat Integrity <strong>Assessment</strong>‣ From the results of the application of the IHIA to the assessment site, it isevident that there are two large impacts on the habitat of the area withimpacts on the riparian zone being more significant than those on theinstream habitat.‣ Instream impacts at the site included some impacts from water abstractionand water quality modification. Smaller impacts from exotic fauna and bedmodification were also noted. Overall, the site achieved a 89.1% s<strong>co</strong>re for instream integrity. Indicating largely natural (Class B) <strong>co</strong>nditions.‣ The largest riparian zone impacts included flow bank erosion and channelmodification. Smaller impacts from indigenous vegetation removal, and exoticvegetation encroachment. The site achieved a 65.6% s<strong>co</strong>re for riparianintegrity representing moderately modified (Class C) <strong>co</strong>nditions.‣ The site obtained an overall IHIA rating of 77.3% s<strong>co</strong>re for riparian integrityrepresenting moderately modified (Class C) <strong>co</strong>nditions. The site, therefore,falls below the DEMC for the quaternary catchment from a habitat integrity56
SAS PES Orange River October 2012perspective. Prevention of further impacts in this area are required in order toimprove the habitat <strong>co</strong>nditions of the area. Due to the impacts in the area,however the impact of any proposed development in the area is of lowersignificance than in areas where the habitat is less impacted.5.2.5.3 Riparian vegetation analysesAs with all the other assessment points, the Orange River at this point isanabranching however the system is <strong>co</strong>mprised of two main channels at thispoint, with very few small islands scattered throughout the main channel. Theactive river channel is approximately 50 meters wide and the potential riparianzone is approximately 30 meters on the left hand bank and 30 meters on theright hand bank. The main island in the river has been transformed <strong>co</strong>mpletelyby vineyards and other forms of crop cultivation and thus has a very narrowfunctional riparian zone. The substrate <strong>co</strong>nsists of a mixture of bedrock, soil,<strong>co</strong>bbles, gravel and sand. The river banks have been severely transformed byearthworks and the <strong>co</strong>nstruction of levees for flood management purposes.This has caused vegetation transformation, erosion, incision and alien floralinvasion.The woody layer of the riparian vegetation was dominated by Ziziphusmucronata, Searsia lancea and Tamarix usneoides. Invasion by the alien treespecies Eucalyptus camaldulensis was moderate to high. Although somevegetation representative of Lower Gariep Alluvial Vegetation was present, itwas significantly more transformed than the other proposed crossing sites.The instream vegetation, as with the other proposed crossing sites, wasdominated by Phragmites australis. The grass <strong>co</strong>mponent <strong>co</strong>nsists mainly ofCynodon dactylon and Stipagrostis namaquensis, and it was notable thatCynodon dactylon was more prevalent than at the other proposed crossingsites due to this species being a known invader in disturbed areas. Alienspecies included Eucalyptus camaldulensis, Ni<strong>co</strong>tiana glauca, Daturastramonium and Solanum sisymbrifolium. The vegetation structure changeswhen moving upstream and downstream due to lower levels of vegetationtransformation. The following table presents a list of vegetation en<strong>co</strong>unteredon site.57
SAS PES Orange River October 2012Table 30: Dominant riparian vegetation species noted during the riparian vegetationassessment at C5. Exotic species are marked by an asterisk.Trees/shrubs Forbs Grasses/sedgesAcacia karrooNi<strong>co</strong>tiana glauca*Searsia lanceaTamarix usneoidesZiziphus mucronataSalix babylonica*Eucalyptus camaldulensis*Asclepias fruti<strong>co</strong>saBidens pilosa*Datura stramonium*Solanum sisymbrifolium*Veronica anagallis-aquatica*Cyperus marginatusCynodon dactylonJuncus effususStipagrostis namaquensisPanicum maximumPhragmites australisSetaria verticellataThe RVI for this site was 10.33 (out of a possible 20), a value which fallswithin the boundary of a class D (largely modified) system. The reason for thissite receiving this value is mainly due to the disturbances associated with theearthmoving and levee <strong>co</strong>nstruction activities. The crop cultivation activitieshave also largely transformed the island riparian vegetation. The results forthe RVI are presented in <strong>Appendix</strong> 1.5.2.5.4 Crossing suitability analysesThe table below presents the advantages and disadvantages of the proposedcrossing pointTable 31: suitability analyses of the C5 crossing alternativeC4 Advantages DisadvantagesThe river channel branched at this pointbut support towers can be <strong>co</strong>nstructedon the river banks and the main islandwhich will limit the impact on theinstream e<strong>co</strong>logyThe riparian vegetation zone on themain river banks is narrow and theimpact of the support towers on theriparian vegetation and habitats can beavoidedThe instream habitat sensitivity at thispoint is limited in diversity and sensitivityand severe impacts on instream habitatis regarded as being limited.The river channel branched at this pointand support towers will have to be<strong>co</strong>nstructed on the river banks and the mainisland which has the potential to an impacton the riparian vegetation of the system.Alien vegetation is a problem in the areaand measures to <strong>co</strong>ntrol erosion will needto be ensuredRiparian vegetation at this point is inreasonable <strong>co</strong>ndition and impacts <strong>co</strong>uldlead to an alteration of the characteristics ofthe riparian zone vegetation5.2.5.5 ConclusionThe anabranching river channel and relatively low RVI s<strong>co</strong>re means that thisproposed crossing alternative is the se<strong>co</strong>nd most suitable crossing point and willhave a significantly lower impact on the receiving riparian zone environment than all58
SAS PES Orange River October 2012of the other crossing points except for site C1. Due to the ability to place supporttowers on the river banks and island as well as the limited diversity and sensitivity ofthe instream habitat the risk to the instream habitat and aquatic <strong>co</strong>mmunity isregarded as being limited, provided that suitable mitigation is implemented. Based onthese characteristics, this crossing point is re<strong>co</strong>mmended as a suitable alternative tocross the Orange River provided that measures to minimise the impacts on theriparian vegetation can be implemented and that riparian vegetation can berehabilitated.6. IMPACT ASSESSMENT6.1 Impact identification and assessmentThe tables below serve to summarise the significance of potential impacts on theaquatic integrity of the proposed rehabilitation sites. A summary of all potential<strong>co</strong>nstruction, operational, rehabilitation and cumulative impacts is provided in Section6.1. The sections below present the impact assessment ac<strong>co</strong>rding to the methoddescribed in Section 4.7 of the Materials and Methods. In addition, it also indicatesthe required mitigatory measures needed to minimise the impact and presents anassessment of the significance of the impacts taking into <strong>co</strong>nsideration the availablemitigatory measures assuming that they are fully implemented.IMPACT 1: IMPACTS ON INSTREAM FLOWPre-Construction Construction OperationalPlacement of power line towers inthe active channels of the rivermay cause local changes toinstream flow patterns but notinstream flow.Vehicles accessing area throughriparian area and area of naturalbankside vegetation leading toaltered streamflow patternsPlacement of power line towers inthe active channels of the rivermay cause local changes toinstream flow patterns but notinstream flowIn<strong>co</strong>rrect rehabilitation andreshaping of the stream bed andbanksPlacement of power line towersin the active channels of theriver may cause local changesto instream flow patterns but notinstream flowImpacts on instream flow were seen to be characteristic of the aquatic resources inthis area. Numerous dams, weirs and bridges occur along the systems in the area asa result of increasing farming and mining activities.59
SAS PES Orange River October 2012ManagementProbabilityof ImpactSensitivityof receivingenvironmentSeverityDurationofimpactSpatialScaleLikelihood Consequence SignificanceUnmanaged 2 3 2 4 1 5 7 35(Low)Managed 1 3 1 1 1 4 3 12(Very Low)Prior to mitigation there is a possibility of this impact occurring through the placementof support towers within the active river channel or in the riparian zone. Within the<strong>co</strong>ntext the system with moderate level of e<strong>co</strong>logical sensitivity the severity of theimpact can be <strong>co</strong>nsidered limited with e<strong>co</strong>system structure and function beingunchanged. Without mitigation the duration of impact will be for the life of theinfrastructure. Prior to mitigation the impact can be <strong>co</strong>nsidered to be a low levelimpact. The impact will have a very limited extent of impact. With mitigation theprobability, severity and duration of the impact can be significantly reduced leading toan overall very low level impact.Re<strong>co</strong>mmended mitigation measures:‣ No support structures should be <strong>co</strong>nstructed within the riparian areas or withinthe active stream channel. If at all possible all support structures should bedeveloped above the 1: 50 year flood line and above the 1:10 year flood line asa minimum;‣ During <strong>co</strong>nstruction all building materials should be kept out of the riparianareas as well as the active stream channels;‣ All waste and remaining building materials should be removed from site on<strong>co</strong>mpletion of the project;‣ No vehicles should be allowed to indiscriminately drive through the riparianareas or within the active stream channels. Movement on all midstream islandswhere indigenous vegetation occurs must be prohibited or limited as far aspossible;‣ If it is inevitable that support towers are to be developed within the activechannels measures to ensure that the structures will cause limited turbulencemust be ensured;‣ The bed profile should be re-instated in such a way as to prevent incision anderosion in all areas that may be disturbed.60
SAS PES Orange River October 2012IMPACT 2: IMPACTS DUE TO SEDIMENTATION AND INCREASED TURBIDITYPre-Construction Construction OperationalInadequate design of access roadsas well as tower footprints.Disturbance of soils resulting inerosionErosion caused by altered flowaround the tower base.Inadequate planning of rehabilitation Removal of riparian vegetation Obstacles in the riparian zoneobstructing flow and causing a buildupof sediment.Obstacles in the riparian zoneobstructing flow and causing a buildupof sediment.Inadequate rehabilitation of theriparian zoneImpacts due to sedimentation can be significant and have the potential to affect thebiodiversity and functioning of the system although the Orange River can be<strong>co</strong>nsidered to be resilient to sedimentation in the vicinity of the study area. Specificissues can be impacts on taxa requiring a rocky substrate clear of sediment and taxarequiring fast flowing water with limited amounts of suspended solids. Withdisturbance of the soils associated with the project, there is a risk of sedimentation ofthe aquatic resources occurring. This impact is defined belowManagementProbabilityof ImpactSensitivityof receivingenvironmentSeverityDurationofimpactSpatialScaleLikelihood Consequence SignificanceUnmanaged 2 2 2 4 1 4 7 28(Low)Managed 1 2 1 1 1 3 3 9(Very Low)Prior to mitigation there is a possibility of this impact occurring through the placementof support towers within the active river channel or in the riparian banks. In additionthere is a risk that <strong>co</strong>nstruction access roads <strong>co</strong>uld lead to disturbances of vegetationand soils which in turn <strong>co</strong>uld lead to sedimentation. Within the <strong>co</strong>ntext the systemwith moderate level of e<strong>co</strong>logical sensitivity the severity of the impact can be<strong>co</strong>nsidered limited with e<strong>co</strong>system structure and function being unchanged. Withoutmitigation the duration of impact will be for the life of the infrastructure. Prior tomitigation the impact can be <strong>co</strong>nsidered to be a low level impact. The impact willhave a very limited extent of impact. With mitigation the probability, severity andduration of the impact can be significantly reduced leading to an overall very low levelimpact.Re<strong>co</strong>mmended mitigation measures:61
SAS PES Orange River October 2012‣ As far as possible no activities, with special mention of access roads, shouldoccur within the riparian zones of stream channels as well as the streamchannels themselves;‣ The duration in which soils are exposed during <strong>co</strong>nstruction activities shouldremain as short as possible;‣ Concurrent rehabilitation is to take place as far as possible and footprint areasshould be minimised as far as possible;‣ All areas affected by <strong>co</strong>nstruction should be rehabilitated upon <strong>co</strong>mpletion ofthe <strong>co</strong>nstruction phase of the development;‣ River banks must be appropriately re-profiled and re-vegetated with indigenousgrasses and trees such as (Searsia lancea, Searsia pyroides, Acacia karroo,Olea europaea subsp. africana and Cynodon dactylon and Panicum maximum)as required. Steep banks should be stabilised with hessian sheets.‣ Adequate stormwater management must be in<strong>co</strong>rporated into the design of theproposed upgrade in order to prevent erosion and the associatedsedimentation of the riparian and instream areas, as these systems haveaquatic <strong>co</strong>mmunities which rely on stream substrates clear of sediment and on,fast flowing water over rocky substrates.During the <strong>co</strong>nstruction and operational phases of the proposedupgrade, erosion berms should be installed to prevent gullyformation and siltation of the riparian resources. The followingpoints should serve to guide the placement of erosion berms:Where the track has slope of less than 2%, berms every 50mshould be installed.Where the track slopes between 2% and 10%, berms every 25mshould be installed.Where the track slopes between 10%-15%, berms every 20mshould be installed.Where the track has slope greater than 15%, berms every 10mshould be installed.62
SAS PES Orange River October 2012IMPACT 3: IMPACTS ON INSTREAM HABITAT AND REFUGIA FOR AQUATICSPECIESPre-Construction Construction OperationalPlanning of towers within channelswhich regularly be<strong>co</strong>meinundated.Direct impact on instreamhabitatsthe power linePlanning of <strong>co</strong>nstructiontemporary access roads throughchannels in the riverSedimentation may lead to a lossof deeper refuge pools anderosion impacts may lead to lossof overhanging vegetation.Erosion may cause the formationof large dongas leading to flowimpediments and loss of wetlandhabitat.Inadequate rehabilitation ofaccess roads and footprint areasOngoing use of access roadsduring the operational phase ofErosion caused by stormwaterrunoff causing siltation in adownstream direction.Impacts on instream habitat has the potential to be significant and has the potentialto affect the biodiversity and functioning of the system through the loss of instreamhabitat and refuge areas for aquatic biota. Disturbances caused by activities withinthe riparian zone, vegetation clearing and soil disturbance are the key activities which<strong>co</strong>uld lead to this impact.ManagementProbabilityof ImpactSensitivityof receivingenvironmentSeverityDurationofimpactSpatialScaleLikelihood Consequence SignificanceUnmanaged 2 3 2 4 1 5 7 35(Low)Managed 1 3 1 1 1 4 3 12(Very Low)Prior to mitigation there is a possibility of this impact occurring through the placementof support towers within the active river channel or in the riparian banks. In additionthere is a risk that <strong>co</strong>nstruction access roads <strong>co</strong>uld lead to disturbances of vegetationand soils which in turn <strong>co</strong>uld lead to sedimentation. During the operational phaseongoing use of access roads for maintenance may lead to impacts on instreamhabitat and refugia for aquatic biota. Within the <strong>co</strong>ntext the system with moderatelevel of e<strong>co</strong>logical sensitivity the severity of the impact can be <strong>co</strong>nsidered limited withe<strong>co</strong>system structure and function being unchanged. Without mitigation the durationof impact will be for the life of the infrastructure. Prior to mitigation the impact can be<strong>co</strong>nsidered to be a low level impact. The impact will have a very limited extent ofimpact. With mitigation the probability, severity and duration of the impact can besignificantly reduced leading to an overall very low level impact.63
SAS PES Orange River October 2012Re<strong>co</strong>mmended mitigation measures:‣ The time in which soils are exposed during <strong>co</strong>nstruction activities shouldremain as short as possible.‣ As small an area should be disturbed as possible.‣ No unnecessary support structures should be <strong>co</strong>nstructed within the riparianzones or active stream channels.‣ During <strong>co</strong>nstruction all <strong>co</strong>nstruction materials should be kept out of the riparianor wetland zones.‣ All waste and remaining building materials should be removed from site on<strong>co</strong>mpletion of the project.‣ No vehicles should be allowed to indiscriminately drive through the riparian orwetland zones.‣ In any areas where disturbance of river channels or bankside vegetationoccurs, bank and bed profile should be re-instated in such a way as reinstatepredevelopment habitat <strong>co</strong>nditions‣ Adequate erosion <strong>co</strong>ntrol and siltation <strong>co</strong>ntrol measures should be put in place.‣ Adequate stormwater management must be in<strong>co</strong>rporated into the design of any<strong>co</strong>nstruction access roads in order to prevent erosion and the associatedsedimentation of the riparian and instream areas, as these systems haveaquatic <strong>co</strong>mmunities which rely on stream substrates clear of sediment and on,fast flowing water over rocky substrates.During the <strong>co</strong>nstruction and operational phases of the proposedupgrade, erosion berms should be installed to prevent gully formationand siltation of the riparian resources. The following points shouldserve to guide the placement of erosion berms:Where the track has slope of less than 2%, berms every 50m shouldbe installed.Where the track slopes between 2% and 10%, berms every 25mshould be installed.Where the track slopes between 10%-15%, berms every 20m shouldbe installed.Where the track has slope greater than 15%, berms every 10m shouldbe installed.64
SAS PES Orange River October 2012IMPACT 4: IMPACTS ON INSTREAM MIGRATORY CORRIDORSPre-Construction Construction OperationalInadequate design of supporttowers and their placement withinareas which are regularlyinundated.Stream bed modifications due to<strong>co</strong>nstruction of temporary<strong>co</strong>nstruction access roadsStream bed modifications due toongoing use of temporary<strong>co</strong>nstruction access roads.Both aquatic species such as fish, with special mention of the Labeobarbus speciesand Labeo capensis as well as species with an affinity for riverine systems such ascertain avifaunal species, which may migrate along linear riverine features may besignificantly affected by impacts on the aquatic resources within the area. The areahas a moderate importance for the migration of aquatic species and unless, someimpact on the migratory routes of fish and other species may occur as a result ofactivities associated with the proposed <strong>co</strong>lliery development although the risk ofthese impacts are deemed unlikely.ManagementProbabilityof ImpactSensitivityof receivingenvironmentSeverityDurationofimpactSpatialScaleLikelihood Consequence SignificanceUnmanaged 2 3 1 5 3 5 9 45(Low)Managed 1 3 1 2 1 4 4 16(Very Low)In the absence of suitable management and mitigation measures, impacts affectinginstream migratory <strong>co</strong>rridors are deemed to be low and will be largely limited to the<strong>co</strong>nstruction phase of the project. Should adequate mitigatory measures beimplemented to ensure the preservation of instream migratory <strong>co</strong>rridors, impacts aredeemed to be insignificant.Re<strong>co</strong>mmended mitigation measures:‣ No dumping or fires should occur within the riparian areas.‣ Disturbance of the riparian areas should be avoided as far as possible.‣ No support structures should be <strong>co</strong>nstructed within the riparian areas or riverchannels.65
SAS PES Orange River October 2012IMPACT 5: IMPACTS ON TAXA SENSITIVE TO CHANGES IN WATER QUALITYPre-Construction Construction OperationalInappropriate positioning ofsupport towers.Poor design and positioning of<strong>co</strong>nstruction access roads.Direct impact on instreamhabitat due to access road<strong>co</strong>nstruction and placement ofsupport towersVegetation clearing and soildisturbance.Pollution such as litter and anyspills (both chemical andorganic) may occur during the<strong>co</strong>nstruction phase.Ongoing use of access roads formaintenance activitiesImpacts on instream water quality can be significant and has the potential to affectthe biodiversity and functioning of the system. Specific risks occur to taxa, whichhave an increased sensitivity to water quality changes, with special mention ofincreased dissolved salt loads as well as changes to the sediment load in the system.Disturbances caused by direct disturbance of instream habitats, vegetation clearingand soil disturbance are the key activities which <strong>co</strong>uld lead to this impact.ManagementProbabilityof ImpactSensitivityof receivingenvironmentSeverityDurationofimpactSpatialScaleLikelihood Consequence SignificanceUnmanaged 2 3 2 4 1 5 7 35(Low)Managed 1 3 1 1 1 4 3 12(Very Low)Prior to mitigation there is a possibility of this impact occurring through the placementof support towers within the active river channel or in the riparian banks. In additionthere is a risk that <strong>co</strong>nstruction access roads <strong>co</strong>uld lead to disturbances of vegetationand soils which in turn <strong>co</strong>uld lead to sedimentation. During the operational phaseongoing use of access roads for maintenance may lead to impacts on instreamhabitat which in turn may have a local impact on more sensitive aquatic taxa. Withinthe <strong>co</strong>ntext the system with moderate level of e<strong>co</strong>logical sensitivity the severity of theimpact can be <strong>co</strong>nsidered limited with e<strong>co</strong>system structure and function beingunchanged. Without mitigation the duration of impact will be for the life of theinfrastructure. Prior to mitigation the impact can be <strong>co</strong>nsidered to be a low levelimpact. The impact will have a very limited extent of impact. With mitigation theprobability, severity and duration of the impact can be significantly reduced leading toan overall very low level impact.66
SAS PES Orange River October 2012Re<strong>co</strong>mmended mitigation measures:‣ The time in which soils are exposed during <strong>co</strong>nstruction activities shouldremain as short as possible.‣ As small an area should be disturbed as possible. .‣ No unnecessary support structures should be <strong>co</strong>nstructed within the riparianzones or active stream channels.‣ During <strong>co</strong>nstruction all <strong>co</strong>nstruction materials should be kept out of the riparianor wetland zones.‣ All waste and remaining building materials should be removed from site on<strong>co</strong>mpletion of the project.‣ No dumping should take place in or near the <strong>co</strong>nstruction site.‣ All spills should be immediately cleaned up and treated ac<strong>co</strong>rdingly.‣ No fires should be permitted on site.‣ Appropriate sanitary facilities must be provided for the duration of the proposeddevelopment and all waste removed to an appropriate waste facility.IMPACT 6: IMPACTS DUE TO INUNDATIONPre-Construction Construction OperationalInappropriate positioning ofsupport towers.Ponding upstream of the proposedupgrade due to loss of stream flow.Poor design and positioning of Alteration of bed and bank profiles.<strong>co</strong>nstruction access roads.Alteration of instream habitat<strong>co</strong>nditionsAlteration of soil wetness profilesdue to changes in topographyOngoing use of access roads formaintenance activitiesThe proposed power line <strong>co</strong>nstruction, with special mention of the use of <strong>co</strong>nstructionaccess roads, has the potential to alter bed and bank profiles which in turn can leadto inundation of the riverine systems in the vicinity of the proposed upgrade.Inundation can affect instream habitat <strong>co</strong>nditions which in turn can affect aquaticbiota. Inundation can also affect bankside and riparian vegetation which can die backdue to altered soil wetness profiles.ManagementProbabilityof ImpactSensitivityof receivingenvironmentSeverityDurationofimpactSpatialScaleLikelihood Consequence SignificanceUnmanaged 2 2 1 2 1 4 4 16(Very low)Managed 1 2 1 1 1 3 3 9(Very Low)Prior to mitigation there is a possibility of this impact occurring through the placementof support towers within the active river channel or in the riparian banks. In addition67
SAS PES Orange River October 2012there is a risk that <strong>co</strong>nstruction access roads <strong>co</strong>uld lead to disturbances of vegetationand soils which in turn <strong>co</strong>uld lead to sedimentation. During the operational phaseongoing use of access roads for maintenance may lead to impacts on instreamhabitat and refugia for aquatic biota. Within the <strong>co</strong>ntext the system with moderatelevel of e<strong>co</strong>logical sensitivity the severity of the impact can be <strong>co</strong>nsidered limited withe<strong>co</strong>system structure and function being unchanged. Without mitigation the durationof impact will be for a few months during <strong>co</strong>nstruction. Prior to mitigation the impactcan be <strong>co</strong>nsidered to be a low level impact. The impact will have a very limited extentof impact. With mitigation the probability, severity and duration of the impact can besignificantly reduced leading to insignificant levels of significance.Re<strong>co</strong>mmended mitigation measures:‣ No unnecessary activities or structures should be allowed within the riparianzones and active river channels;‣ Any areas disturbed during <strong>co</strong>nstruction should ensure that natural drainagepatterns are re-instated as far as possible;‣ The natural drainage patterns must be en<strong>co</strong>uraged as far as possible.IMPACT 7: IMPACTS DUE TO CANALISATION AND EROSIONPre-Construction Construction OperationalPlanning of towers within channelswhich regularly be<strong>co</strong>meinundated.Direct impact on instreamhabitatsPlanning of <strong>co</strong>nstructiontemporary access roads throughchannels in the riverErosion may cause the formationof large dongas leadingcanalisation and erosion of thesystem.Inadequate rehabilitation ofaccess roads and footprint areasOngoing use of access roadsduring the operational phase ofthe power lineImpacts on instream habitat has the potential to be significant and has the potentialto affect the biodiversity and functioning of the system through the loss of instreamhabitat and refuge areas for aquatic biota. Disturbances caused by activities withinthe riparian zone, vegetation clearing and soil disturbance are the key activities which<strong>co</strong>uld lead to this impact.ManagementProbabilityof ImpactSensitivityof receivingenvironmentSeverityDurationofimpactSpatialScaleLikelihood Consequence SignificanceUnmanaged 2 3 2 5 2 5 9 45(Low)Managed 1 3 1 1 1 4 3 12(Very Low)68
SAS PES Orange River October 2012Prior to mitigation there is a possibility of this impact occurring through the placementof support towers within the active river channel or in the riparian banks. In additionthere is a risk that <strong>co</strong>nstruction access roads <strong>co</strong>uld lead to disturbances of vegetationand soils which in turn <strong>co</strong>uld lead to sedimentation. During the operational phaseongoing use of access roads for maintenance may lead to impacts on instreamhabitat and refugia for aquatic biota. Within the <strong>co</strong>ntext the system with moderatelevel of e<strong>co</strong>logical sensitivity the severity of the impact can be <strong>co</strong>nsidered limited withe<strong>co</strong>system structure and function being unchanged. Without mitigation the durationof impact <strong>co</strong>uld potentially occur beyond the life of the infrastructure. Prior tomitigation the impact can be <strong>co</strong>nsidered to be a low level impact. The impact willhave a limited extent of impact. With mitigation the probability, severity, extent andduration of the impact can be significantly reduced leading to an overall very low levelimpact.Re<strong>co</strong>mmended mitigation measures:‣ The time in which soils are exposed during <strong>co</strong>nstruction activities shouldremain as short as possible.‣ As small an area should be disturbed as possible. .‣ No unnecessary support structures should be <strong>co</strong>nstructed within the riparianzones or active stream channels.‣ During <strong>co</strong>nstruction all <strong>co</strong>nstruction materials should be kept out of the riparianor wetland zones.‣ All waste and remaining building materials should be removed from site on<strong>co</strong>mpletion of the project.‣ No vehicles should be allowed to indiscriminately drive through the riparian orwetland zones.‣ In any areas where disturbance of river channels or bankside vegetationoccurs, bank and bed profile should be re-instated in such a way as reinstatepredevelopment <strong>co</strong>nditions;‣ Adequate erosion <strong>co</strong>ntrol and siltation <strong>co</strong>ntrol measures should be put in place;‣ Adequate stormwater management must be in<strong>co</strong>rporated into the design of any<strong>co</strong>nstruction access roads in order to prevent erosion and the associatedsedimentation of the riparian and instream areas, as these systems haveaquatic <strong>co</strong>mmunities which rely on stream substrates clear of sediment and on,fast flowing water over rocky substrates;During the <strong>co</strong>nstruction and operational phases of the proposedupgrade, erosion berms should be installed to prevent gully formation69
SAS PES Orange River October 2012and siltation of the riparian resources. The following points shouldserve to guide the placement of erosion berms:Where the track has slope of less than 2%, berms every 50m shouldbe installed.Where the track slopes between 2% and 10%, berms every 25mshould be installed.Where the track slopes between 10%-15%, berms every 20m shouldbe installed.Where the track has slope greater than 15%, berms every 10m shouldbe installed.IMPACT 8: ALIEN VEGETATION ENCROACHMENTPre-Construction Construction OperationalInadequate design of proposedriver crossings and placement ofinfrastructureRemoval of indigenous vegetationFailure to develop an alienvegetation <strong>co</strong>ntrol strategy.Colonisation of disturbed riverbanks by invasive andopportunistic speciesFailure to effectively implementthe alien vegetation <strong>co</strong>ntrolstrategyEncroachment of terrestrialvegetationLoss of indigenous vegetationFailure to monitor efficiency ofalien <strong>co</strong>ntrol strategyConstruction and introduction of foreign material such as soils may lead to theintroduction of alien invader species, impacting on the floral characteristics of theriver banks; while <strong>co</strong>nstruction related activities <strong>co</strong>uld lead to vegetation disturbancethat may result in the proliferation of alien and invasive species. Pioneer alienspecies that are adapted to growth in bare soil areas, may proliferate on exposedsoils.Unmanaged alien plant invasions have the capacity to change the structure anddynamics of vegetation <strong>co</strong>mmunities and out-<strong>co</strong>mpete indigenous species, thuslowering species diversity and natural riparian habitat structures’.ManagementProbabilityof ImpactSensitivityof receivingenvironmentSeverityDurationofimpactSpatialScaleLikelihood Consequence SignificanceUnmanaged 5 3 4 5 3 8 12 96(Mediumhigh)Managed 2 3 2 3 1 5 6 30(Low)Alien or invader floral infestation is likely to occur if unmitigated, and may occur afterthe project is <strong>co</strong>mpleted and possibly affect the regional environment, resulting in a70
SAS PES Orange River October 2012medium high significance. If mitigation measures are effectively implemented, theprobability, severity, duration and scale of the impact can be reduced to result in alow significance.Re<strong>co</strong>mmended mitigation measures:‣ All tower footprint areas should remain as small as possible and should onlyencroach onto the river and banks if absolutely unavoidable.‣ Proliferation and a further increase of alien and invasive species are expectedwithin disturbed areas. These species should be eradicated and <strong>co</strong>ntrolled toprevent their spread beyond the site boundary. Seed dispersal within the toplayers of the soil within footprint areas, will have an impact on rehabilitation in thefuture and also needs to be <strong>co</strong>ntrolled.‣ Removal of the alien and weed species en<strong>co</strong>untered on the property in order to<strong>co</strong>mply with existing legislation (amendments to the regulations under theConservation of Agricultural Resources Act, 1983 and Section 28 of the NationalEnvironmental Management Act, 1998). Removal of species should take placethroughout the pre-<strong>co</strong>nstruction, <strong>co</strong>nstruction, operational, and rehabilitation/maintenance phases.‣ Species specific and area specific eradication re<strong>co</strong>mmendations:Care should be taken within riparian areas with the choice of herbicide toensure no additional impact due to the herbicide used.Footprint areas should be kept as small as possible when removing largetrees,No vehicles should be allowed to drive through riparian areas duringeradication of alien and weed species.IMPACT 9: IMPACT ON RIPARIAN VEGETATIONPre-Construction Construction OperationalIrresponsible design of rivercrossings and tower placementsIndiscriminate removal ofindigenous riparian vegetationEncroachment of terrestrialvegetationPlanning of <strong>co</strong>nstruction accessroads through riparian vegetationstandsColonisation of disturbed riverbanks by invasive andopportunistic speciesLoss of indigenous vegetationErosion due to exposed soils andineffective rehabilitationIneffective aftercare andmaintenanceIndiscriminate clearing of riparian vegetation will have an impact on the riparianvegetation <strong>co</strong>ndition resulting in erosion, habitat degradation and landscape functionreduction. Terrestrial vegetation encroachment is another highly significant problemin disturbed areas and this will need to be mitigated during the rehabilitation phaseand during aftercare and maintenance.71
SAS PES Orange River October 2012ManagementProbabilityof ImpactSensitivityof receivingenvironmentSeverityDurationofimpactSpatialScaleLikelihood Consequence SignificanceUnmanaged 5 3 3 5 2 8 10 96(Mediumhigh)Managed 3 3 2 3 1 6 6 36(Low)Indiscriminate <strong>co</strong>nstruction and vegetation clearing activities will have a definiteimpact on the receiving environment which may <strong>co</strong>ntinue perpetually and have alocal effect, resulting in a medium high impact significance. With mitigation, theprobability, severity and spatial scale of the impact can be reduced, resulting in a lowimpact significance.Re<strong>co</strong>mmended mitigation measures:‣ All <strong>co</strong>nstruction footprint areas should remain as small as possible and shouldnot encroach onto sensitive riparian areas unless absolutely unavoidable.‣ Proliferation of alien and invasive species is expected within disturbed areas.These species should be eradicated and <strong>co</strong>ntrolled to prevent their spreadbeyond the proposed <strong>co</strong>nstruction footprint areas. Alien plant seed dispersalwithin the top layers of the soil within footprint areas, that will have an impact onrehabilitation in the future, has to be <strong>co</strong>ntrolled.‣ All soils <strong>co</strong>mpacted as a result of <strong>co</strong>nstruction activities falling outside the<strong>co</strong>nstruction footprint areas should be ripped and profiled. Special attentionshould be paid to alien and invasive <strong>co</strong>ntrol within these areas. Alien andinvasive vegetation <strong>co</strong>ntrol should take place throughout all phases of the powerline development.‣ Upon <strong>co</strong>mpletion of the project, rehabilitation with indigenous species should beimplemented in all affected riparian areas.6.2 Impact assessment <strong>co</strong>nclusionBased on the above assessment it is evident that there are nine possible impactsthat may have an effect on the overall aquatic integrity of the aquatic resources in thevicinity of the proposed Orange River Power line crossing. The table belowsummarises the findings indicating the significance of the impacts before mitigationtakes place as well as the significance of the impacts if appropriate management andmitigation takes place. From the table it is evident that prior to mitigation, most of theimpacts are low to medium high level impacts, while if mitigation takes place themajority of the impacts can be reduced to very low level impacts.72
SAS PES Orange River October 2012Table 32: Summary of impact significance.No Impact Prior to mitigation Post mitigation1 Impact on instream flow Low Very low2 Impacts due to sedimentation Low Very low3 Impacts on instream habitat and refugia for aquatic species Low Very low4 Impacts on instream migratory <strong>co</strong>rridors Low Very low5 Impacts on taxa sensitive to changes in water quality Low Very low6 Impacts due to inundation Very low Very low7 Impacts due to canalisation and erosion Low Very low8 Alien vegetation encroachment Medium-high Low9 Impacts due to increased turbidity Medium-high LowThe points below serve to summarise the measures deemed necessary in order toensure protection of the riparian and aquatic resources and to ensure environmentalprotection during the <strong>co</strong>nstruction phase of the propose power line crossing.‣ Flow <strong>co</strong>ntinuity has already been affected due to channel and bedmodifications in the form of instream-barriers and the existing Neusberg weir.It is <strong>co</strong>nsidered essential that flow <strong>co</strong>ntinuity not be further altered in theOrange River during the <strong>co</strong>nstruction phase of the proposed development.This is necessary to ensure the ongoing viability of the aquatic <strong>co</strong>mmunitiesdownstream of the proposed power line crossing, which are dependent on thefair levels of flow in the system.‣ The power line crossing design must ensure that the creation of turbulent flowin the system is minimised, in order to prevent downstream erosion. Nosupport pillars should be <strong>co</strong>nstructed within the active channel.‣ The duration of impacts on the stream should be minimised as far as possibleby ensuring that the duration of time in which flow alteration and sedimentationwill take place is minimised.‣ During <strong>co</strong>nstruction, erosion berms should be installed to prevent gullyformation and siltation of the Orange River. This is necessary to ensure theongoing viability of the aquatic <strong>co</strong>mmunities downstream of the proposedcrossing which are dependent on <strong>co</strong>bble substrates which are free ofsediment deposition. There is already evidence of sedimentation at the siteand further degradation of the river in this regard must be minimised andavoided.‣ The following points should serve to guide the placement of erosion bermsduring the <strong>co</strong>nstruction phase of the power line crossing:73
SAS PES Orange River October 2012Where the track has slope of less than 2%, berms every 50m shouldbe installed.Where the track slopes between 2% and 10%, berms every 25mshould be installed.Where the track slopes between 10%-15%, berms every 20m shouldbe installed.Where the track has slope greater than 15%, berms every 10m shouldbe installed.‣ All areas affected by <strong>co</strong>nstruction should be rehabilitated upon <strong>co</strong>mpletion ofthe <strong>co</strong>nstruction phase of the power line crossing. Areas should be reseededwith indigenous grasses as required.‣ During the <strong>co</strong>nstruction phase, no vehicles should be allowed toindiscriminately drive through the riparian areas.‣ No dumping of waste should take place within the riparian zone.‣ No fires should be permitted near the bridge <strong>co</strong>nstruction area.‣ If any spills occur, they should be immediately cleaned up.‣ The characteristics of the stream bed are likely to be altered locally. Inparticular, the rock and rubble created during the <strong>co</strong>nstruction process islikely to have sharp edges, and not the smooth surfaces that are typicallyassociated with river rocks and pebbles. All rock and rubble must be removedfrom the active stream channel once <strong>co</strong>nstruction has been <strong>co</strong>mpleted.‣ All alien vegetation in the riparian zone should be removed upon <strong>co</strong>mpletionof <strong>co</strong>nstruction.‣ Throughout the <strong>co</strong>nstruction phase of the development, biomonitoring, usingthe same techniques as were used in this baseline report should beimplemented in order to monitor the effects of the development on the aquaticsystems present. <strong>Assessment</strong>s should be undertaken on a quarterly basis. Ifthe SASS and ASPT s<strong>co</strong>res decrease by more than 15%, it should serve asan indication that the system is suffering harm and measures to minimise theimpacts of the development on the system should be implemented.The points below serve to summarise the measures deemed necessary in order toensure protection of the riparian and aquatic resources and to ensure environmentalprotection during the operational phase of the proposed power line crossing.‣ Any areas where bank failure is observed, due to the effects of the power linecrossing, should be immediately repaired by reducing the gradient of thebanks to a 1:3 slope.74
SAS PES Orange River October 2012‣ Bank vegetation <strong>co</strong>ver should be monitored to ensure that sufficientvegetation is present to bind the bankside soils and prevent further banksideerosion.‣ For a minimum period of three years after <strong>co</strong>nstruction, active management ofthe crossing should take place to remove any recruited alien vegetation.7 Conclusions & Re<strong>co</strong>mmendationsBased on the findings of this assessment several <strong>co</strong>nclusions can be drawn on theE<strong>co</strong>logical Importance and Sensitivity and Present E<strong>co</strong>logical State of the system.Conclusions were drawn on the sensitivity of each proposed crossing alternative andthe suitability of each crossing alternative for the <strong>co</strong>nstruction of the crossing.The study then identified nine potential impacts that the <strong>co</strong>nstruction of the proposedpower line crossing will have on the receiving aquatic environment. The report thenhighlighted the key mitigation measures deemed necessary in order to prevent andmitigate impacts on the receiving aquatic environment.The Orange River is <strong>co</strong>nsidered to be a tolerant system that is adapted to <strong>co</strong>nstantlychanging substrate and bankside <strong>co</strong>nditions as well as <strong>co</strong>nstant variation in flow. Thesystem is also tolerant to changes in water quality with special mention oftemperatures, dissolved salt and turbidity levels as water <strong>co</strong>nstituents changethrough the system.The aquatic <strong>co</strong>mmunities of the system are however intact with more sensitiveaquatic macro-invertebrate and fish populations still present and as such as much asthe system is <strong>co</strong>nsidered to be tolerant, it must also be <strong>co</strong>nsidered to be sensitive toimpacts that occur on the system.It is therefore deemed essential that any proposed activities which <strong>co</strong>uld affect thesystem be <strong>co</strong>mprehensively assessed to define and understand the impacts and inorder to ensure that suitable and sufficient mitigation measures are put in place toprotect the system throughout the life of the project and associated infrastructure.Based on the <strong>co</strong>nsideration of habitat integrity and the characteristics of the crossingpoints with special mention of riverine structure and stream braiding, riparian zoneintegrity and instream habitat, two suitable crossing point alternatives were identified75
SAS PES Orange River October 2012and three sites were identified which were <strong>co</strong>nsidered less suitable as crossingpoints as follows:‣ Crossing alternative 1:highly suitable for proposed crossing‣ Crossing alternative 2:not suitable as a crossing point‣ Crossing alternative 3:moderately suitable as a crossing pointhowever the crossing should take placeto the west of the existing road bridge‣ Crossing alternative 4:suitable as a crossing point provided thatcare is taken with tower placement toprevent impacts on riparian vegetation‣ Crossing alternative 5:suitable as a crossing point provided thatcare is taken with tower placement toprevent impacts on riparian vegetationBased on the impact assessment it is evident that there are nine possible impactsthat may have an effect on the overall aquatic integrity of the aquatic resources in thevicinity of the proposed Orange River Power line crossing. From the impact analysesit is evident that prior to mitigation, most of the impacts are low to medium high levelimpacts, while if mitigation takes place the majority of the impacts can be reduced tovery low level impacts while the impacts on form alien vegetation encroachment andincreased turbidity can be reduced to low levels.The report highlights key management and mitigation measures in order to preventand minimise impacts on the receiving aquatic environment.76
SAS PES Orange River October 20128. ReferencesA<strong>co</strong>cks, J.P.H. (1988) Veld Types of South Africa. Memoirs of the BotanicalSurvey of South Africa No. 57. Botanical Research Institute, South Africa.Branch, B. (1998) Field Guide to Snakes and Other Reptiles of Southern Africa.Struik Publishers, Cape Town.Bredenkamp, G. and van Rooyen, N. 34. Rocky Highveld Grassland – GrasslandBiome. In: Low, A.B. and Rebelo, A.G. (eds) (1998) Vegetation of SouthAfrica, Lesotho and Swaziland. Department of Environmental Affairs &Tourism, Pretoria. pp 39.Bromilow, C. (2001) Problem Plants of South Africa. Bri<strong>za</strong> Publications, Pretoria.Carruthers, V. (2001) Frogs and Frogging in Southern Africa. Struik Publishers,Cape Town.Coates-Palgrave, K. (2000) Trees of Southern Africa – Se<strong>co</strong>nd Edition. StruikPublishers, Cape Town.Davis, B. and Day, J. (1998) Vanishing Waters. University of Cape Town Press,Cape Town, South Africa.Dippenaar-Schoeman, A.S. and Jocqué, R. (1997) African Spiders – AnIdentification Manual. Plant Protection Research Institute Handbook No. 9.Biosystematics Division, ARC – Plant Protection Research Institute, Pretoria.Dippenaar-Schoeman, A.S. (2002) Baboon and Trapdoor Spiders of SouthernAfrica. ARC Handbook, No. 13. Agricultural Research Council, Pretoria.Emery AJ, Lötter M, & Williamson SD (eds) (2002) Determining theConservation Value of Land in Mpumalanga. Mpumalanga ParksBoard.Filmer, M. and Duigan, L. (1991) Southern African Spiders – An IdentificationGuide. Struik Publishers, Cape Town.Friedmann, Y. and Daly, B, (editors) (2004) Red Data Book of the Mammals ofSouth Africa: A Conservation <strong>Assessment</strong>: CBSG Southern Africa,Conservation Breeding Specialist Group (SSC/IUCN). Endangered WildlifeTrust, South Africa.Gibbon, G., John Voelcker Bird Book Fund (2002) Roberts’ Multimedia Birds ofSouthern Africa – version 3. Southern African Birding CC, Westville, SouthAfrica.Grant, R. and Thomas, V. (1998). SAPPI Tree Spotting – Kwazulu-Natal, Coastand Midlands. Tree Identification Made Easy. Jacana Education (Pty)Ltd., Johannesburg.77
SAS PES Orange River October 2012Harrison, J. A., Allan, D. G., Underhill, L.G., Herrmans, M., Tree, A.J. Parker, V.,Brown C.J. (Eds.) 1997a. The Atlas of Southern African Birds. Volume1: Nonpasserines.Johannesburg: Birdlife South Africa.Harrison, J. A., Allan, D. G., Underhill, L.G., Herrmans, M., Tree, A.J. Parker, V.,Brown C.J. (Eds.) 1997a. The Atlas of Southern African Birds. Volume2:Passerines. Johannesburg: Birdlife South Africa.Henning, S. F. and Henning, G. A. (1989) South African red Data Book –Butterflies. South African National Scientific Programmes <strong>Report</strong> No. 158,Foundation for Research Development, Pretoria.Hockey, P.A.R., Dean, W.R.J. and Ryan, P.G. (Eds) (2005) Roberts’ Birds ofSouthern Africa. VII th Edition. The Trustees of the John Voelcker Bird BookFund, Cape Town.Kotze, D. Marneweck, G.C., Batchelor, A.L., Lindley, D.S. AND Collins, N.B. 2005:WET-E<strong>co</strong> Services: A technique for Rapidly Assessing E<strong>co</strong>systemServices. Dept. Tourism, Environmental and E<strong>co</strong>nomic Affairs, Free State.Marais, J. (2004). A Complete Guide to the Snakes of Southern Africa. StruikPublishers, Cape Town.Mpumalanga DACE, (2003). 2003 Mpumalanga State of the Environment <strong>Report</strong>.Mpumalanga Department of Agriculture, Conservation and Environment,Nelspruit.Natural Scientific Services. (2006). E<strong>co</strong>logical <strong>Assessment</strong> for a Proposed Coal Mineon the Farm Klippan 452 JS, Mpumalanga. Randburg, Johannesburg.Newman, K. (1998) SAPPI Newman’s Birds of Southern Africa. Southern BookPublishers, Halfway House (Midrand).Pooley, E. (1998) A Field Guide to Wild Flowers Kwazulu-Natal and the EasternRegion. Natal Flora Publications Trust.Pfab, M. (2001). Department policy, Final draft, Development Guidelines forRidges.<strong>pdf</strong>. Department of Agriculture, Conservation, Environment and LandAffairs.Ross, M. (2006). E<strong>co</strong>logical Survey for the Proposed Development of a CoalProcessing Plant on the Farm Weltevreden 428JS, Mpumalanga. Scientific<strong>Aquatic</strong> Services, Johannesburg.SANBI (2006) Vegetation Map of South Africa, Lesotho and Swaziland. Mucina,L. and Rutherford, M.C. (Editors). Strelitzia 19, South African NationalBiodiversity Institute, Kirstenbosch Research Centre, Claremont, SouthAfrica.SANBI (2007) The South African National Biodiversity Institute is thanked for the useof data from the National Herbarium, Pretoria (PRE) ComputerisedInformation System (PRECIS).78
SAS PES Orange River October 2012Schmidt, E., Lötter, M. and McClelland, W. (2002) Trees and Shrubs ofMpumalanga and Kruger National Park. Jacana Publishers,Johannesburg, South Africa.S<strong>co</strong>tt-Shaw, R. (1999) Rare and Threatened Plants of Kwazulu-Natal andNeighbouring Regions – A Plant Red Data Book. Biodiversity Division,Scientific Services Directorate, Kwazulu-Natal Nature Conservation Service,Pietermaritzburg.Skinner, J. D. and Smithers, R. H. N. (1990) The Mammals of the Southern AfricanSub Region. University of Pretoria, Pretoria.Stuart, C. and Stuart, T. (1993) Field Guide to the Mammals of Southern Africa.Struik Publishers, Cape Town.Stuart, C. and Stuart, T. (1994) A Field Guide to the Tracks and Signs ofSouthern and East African Wildlife. Southern Book Publishers, HalfwayHouse, South Africa.Threatened Species Programme (2005) Red Data List of South African PlantSpecies. Available online: http://www.redlist.org.Van Oudtshoorn, F. (1999) Guide to Grasses of Southern Africa. Bri<strong>za</strong>Publications, Pretoria.Van Wyk, B. and Malan, S. (1998) Field Guide to the Wild Flowers of theHighveld. Struik Publishers, Cape Town.Van Wyk, B. and Smith, G. (1996) Guide to the Aloes of South Africa. Bri<strong>za</strong>Publications, Pretoria.Van Wyk, B., van Oudtshoorn, B. and Gericke, N. (1997) Medicinal Plants of SouthAfrica. Bri<strong>za</strong> Publications, Pretoria.Van Wyk, B. van Wyk, P. and van Wyk, B. (2000) Photographic Guide to Trees ofSouthern Africa. Bri<strong>za</strong> Publications, Pretoria.Woodhall, S. (2005) Field Guide to Butterflies of South Africa. Struik Publishers,Cape Town.BOK, A., KOTZE, P., HEATH, R. and ROSSOUW, J. (2007). Guidelines for theplanning, design and operation of fishways in South Africa. WRC <strong>Report</strong>no. TT287/07. Water Research Commission, Pretoria, South Africa.CHUTTER, F. M. (1998) Research on the Rapid Biological <strong>Assessment</strong> of WaterQuality Impacts in Streams and Rivers. Water Research Commission. WRC<strong>Report</strong> No. 422/1/98, Water Research Commission, Pretoria, South Africa.D.W.A.F. (2005) River e<strong>co</strong>-classification: Manual for E<strong>co</strong>Status determination(version 1). Document no. KV 168/05, Department of Water Affairs andForestry, Pretoria.79
SAS PES Orange River October 2012KLEYNHANS, CJ. (1996). A qualitative procedure for the assessment of thehabitat integrity status of the Luvuvhu River (Limpopo System, SouthAfrica). Journal of <strong>Aquatic</strong> E<strong>co</strong>system Health 5:41-54.KLEYNHANS, CJ. (1997). An exploratory investigation of the InstreamBiological Integrity of the Cro<strong>co</strong>dile River, Mpumalanga, as based on the<strong>Assessment</strong> of Fish Communities. Draft <strong>Report</strong>, Department of WaterAffairs and Forestry, Institute for Water Quality Studies, Pretoria. 61 pp.KLEYNHANS, CJ. LOUW, MD. (2007). Module A: E<strong>co</strong>Classification andE<strong>co</strong>Status determination in River E<strong>co</strong>Classification: Manual forE<strong>co</strong>Status Determination (version 2). Joint Water Research Commissionand Department of Water Affairs and Forestry report. WRC <strong>Report</strong> No.TT329/08SKELTON PH. (2001). A <strong>co</strong>mplete guide to freshwater fishes of southern Africa.Struik Publishers (Pty) Ltd., Cape Town, South Africa. 395pp.80
SAS PES Orange River October 2012<strong>Appendix</strong> 1: IHAS s<strong>co</strong>re sheets September 201281
SAS PES Orange River October 201282
SAS PES Orange River October 2012<strong>Appendix</strong> 2: SASS5 s<strong>co</strong>re sheets September 201283
SAS PES Orange River October 201284
SAS PES Orange River October 2012<strong>Appendix</strong> 3: Fish assemblage Integrity IndexCalculations85
SAS PES Orange River October 201286
SAS PES Orange River October 2012<strong>Appendix</strong> 4:Riparian Vegeation Index S<strong>co</strong>resheets87
SAS ……………. October 2012<strong>Appendix</strong> A1 – Riparian Vegetation Index Data andCalculations: C1RIPARIAN VEGETATIONINDEX (RVI)A. Site detailsRiver: Orange River Date: 18/09/2012Site No: 1 Assessors:Site Name:Location (GPS): S28°46’10.41” Elevation:E20°42’15.57"C1E vdWesthuizenB. Riparian vegetation index detailsRVI s<strong>co</strong>re calculationThe RVI formula is:RVI = [(EVC) + (SI x PCIRS) +(RIRS)]Where:EVC = Extent of vegetation<strong>co</strong>verSI = Structural intactnessPCIRS = Percentage <strong>co</strong>verof indigenous riparianspeciesRIRS = Recruitment ofindigenous riparian speciesRiparian Vegetation IndexDetails: RVI S<strong>co</strong>re 14.7EVC S<strong>co</strong>re 8 PCIRS S<strong>co</strong>re 1.8SI S<strong>co</strong>re 0.94 RIRS S<strong>co</strong>re 5C. RVI S<strong>co</strong>re, assessment class and its descriptionRVI S<strong>co</strong>re <strong>Assessment</strong> Class Description19 to 20 A Unmodified <strong>co</strong>nditions, natural state17 to 18 B Largely natural with few modifications13 to 16 C Moderately modified9 to 12 D Largely modified5 to 8 E Extensive loss of the natural habitat0 to 4 FCritical level of modifications, almost a <strong>co</strong>mplete loss ofnatural habitatD. Riparian e<strong>co</strong>system state variablesChannel typeAnabranching88
SAS ……………. October 2012Width of potential riparian zoneSubstrateDisturbancesSurrounding land useDominant <strong>co</strong>verIndigenous species richnessExotic species richnessLHB = ca. 75m; RHB = ca. 40m Islands = ca. 25m50% bedrock, 40% rock and gravel, 10% sandErosion/ incisionAlien encroachmentAgricultureRural agriculturalApproximately: grass 20%; trees/shrubs 50%; reeds20%; forbs 10%Medium-High DiversityLow diversity; low abundanceEvidence of riparian e<strong>co</strong>systemfunctioning:Channel bank stabilityFlood attenuation potentialFiltering potential (water quality)Medium; most banks <strong>co</strong>vered in grasses, trees or reeds.Medium; the absence of dense reeds and extensiveriparian banks lessen flood attenuation potential.Medium; reeds and sedges presentHabitat provisionAvailable: Indigenous woody vegetation provide suitablehabitat for diversity of faunal and floral speciesRVI SCORE CALCULATIONSThe RVI formula is:RVI = [(EVC) + (SI x PCIRS) + (RIRS)]Where:EVC = Extent of vegetation <strong>co</strong>verSI = Structural intactnessPCIRS = Percentage <strong>co</strong>ver of indigenous riparian speciesRIRS = Recruitment of indigenous riparian speciesThe final s<strong>co</strong>re is out of 20 (<strong>co</strong>mparable to the six E<strong>co</strong>logical Reserve <strong>Assessment</strong> Classes)EVCEVC: determined by calculating the mean s<strong>co</strong>re of the EVC1 and EVC2, by two alternative methods:EVC1 - Combined vegetation <strong>co</strong>ver s<strong>co</strong>re out of 10 for the LHB, RHB & islands (if present)Percentage vegetation <strong>co</strong>ver (all vegetation)Percentage s<strong>co</strong>re 0% 1-5% 6-25% 26-50%51-75%76-100%EVC s<strong>co</strong>re 0 2 4 6 8 10 8EVC2 - Total site disturbance s<strong>co</strong>re (out of 10) Natural vs disturbed% s<strong>co</strong>re Disturbed NaturalEVC s<strong>co</strong>re 0 2 4 6 8 10 8EVC S<strong>co</strong>re (out of 10) = [(EVC1 +EVC2)/2]889
SAS ……………. October 2012SISI is determined with reference to the following s<strong>co</strong>ring table of vegetation distribution for Present StateVS Perceived Reference StatePerceived reference state vs present stateContinuous Clumped Scattered Sparse Trees 2Continuous 3 2 1 0 Shrubs 3Clumped 2 3 2 1 Reeds 3Scattered 1 2 3 2 Sedges 3Sparse 0 1 2 3 Grasses 3Bare ground 3SI S<strong>co</strong>re (out of 1) = [((SI1 + SI2 + SI3 + SI4 +SI5 + SI6) /6) * 0.33] 0.94PCIRSPercentage <strong>co</strong>ver of indigenous riparian species (PCIRS): S<strong>co</strong>ring system for the <strong>co</strong>ver of exotic species,terrestrial species & reedsCover s<strong>co</strong>re 0 VL L M H VHPCIRS subs<strong>co</strong>re0 1 2 3 4 5If no indigenous riparian spp are present at the site, the PCIRS (min) = 0Exotic species 2Terrestrial species 2Reeds 3PCIRS s<strong>co</strong>re (out of 5) = [(EVC/2) - ((exotics x 0.7) + (terrestrial x 0.1) + (reeds x 0.2))] 1.8RIRSRecruitment of indigenous riparian species (RIRS), the recruitment of positive significance and importanceat a site is that of indigenous riparian species, particularly the dominant species present (by biomass)Extent ofrecruitment0 VL L M H VHRIRS s<strong>co</strong>re 0 1 2 3 4 5RIRS VALUE 5RIPARIAN VEGETATION INDEXSCORE14.7 CLASS C90
SAS ……………. October 2012<strong>Appendix</strong> A2 – Riparian Vegetation Index Data andCalculations: C2RIPARIAN VEGETATIONINDEX (RVI)A. Site detailsRiver: Orange River Date: 18/09/2012Site No: 2 Assessors:Site Name:Location (GPS): S28°45’31.62” Elevation:E20°48’56.03”C2E vdWesthuizenB. Riparian vegetation index detailsRVI s<strong>co</strong>re calculationThe RVI formula is:RVI = [(EVC) + (SI x PCIRS) +(RIRS)]Where:EVC = Extent of vegetation<strong>co</strong>verSI = Structural intactnessPCIRS = Percentage <strong>co</strong>verof indigenous riparianspeciesRIRS = Recruitment ofindigenous riparian speciesRiparian Vegetation IndexDetails: RVI S<strong>co</strong>re 17.3EVC S<strong>co</strong>re 9 PCIRS S<strong>co</strong>re 3.3SI S<strong>co</strong>re 0.99 RIRS S<strong>co</strong>re 5C. RVI S<strong>co</strong>re, assessment class and its descriptionRVI S<strong>co</strong>re <strong>Assessment</strong> Class Description19 to 20 A Unmodified <strong>co</strong>nditions, natural state17 to 18 B Largely natural with few modifications13 to 16 C Moderately modified9 to 12 D Largely modified5 to 8 E Extensive loss of the natural habitat0 to 4 FCritical level of modifications, almost a <strong>co</strong>mplete loss ofnatural habitatD. Riparian e<strong>co</strong>system state variablesChannel typeAnabranching91
SAS ……………. October 2012Width of potential riparian zoneSubstrateDisturbancesSurrounding land useDominant <strong>co</strong>verIndigenous species richnessExotic species richnessEvidence of riparian e<strong>co</strong>systemfunctioning:Channel bank stabilityFlood attenuation potentialFiltering potential (water quality)LHB = ca. 60m; RHB = ca. 70m Islands = ca. 100m30% bedrock, 30% rock and gravel, 40% sandErosion/ incisionAlien encroachmentAgricultureRural agriculturalApproximately: grass 5%; trees/shrubs 45%; reeds 50%;Medium-High DiversityLow diversity; low abundanceModerate to high; most banks <strong>co</strong>vered in grasses, treesor reeds.Moderately high to high; the presence of dense reedsand extensive riparian banks increase flood attenuationpotential.Medium to high; reeds and sedges presentHabitat provisionAvailable: Indigenous woody and reed vegetationprovide suitable habitat for diversity of faunal and floralspeciesRVI SCORE CALCULATIONSThe RVI formula is:RVI = [(EVC) + (SI x PCIRS) + (RIRS)]Where:EVC = Extent of vegetation <strong>co</strong>verSI = Structural intactnessPCIRS = Percentage <strong>co</strong>ver of indigenous riparian speciesRIRS = Recruitment of indigenous riparian speciesThe final s<strong>co</strong>re is out of 20 (<strong>co</strong>mparable to the six E<strong>co</strong>logical Reserve <strong>Assessment</strong> Classes)EVCEVC: determined by calculating the mean s<strong>co</strong>re of the EVC1 and EVC2, by two alternative methods:EVC1 - Combined vegetation <strong>co</strong>ver s<strong>co</strong>re out of 10 for the LHB, RHB & islands (if present)Percentage vegetation <strong>co</strong>ver (all vegetation)Percentage s<strong>co</strong>re 0% 1-5% 6-25% 26-50%51-75%76-100%EVC s<strong>co</strong>re 0 2 4 6 8 10 10EVC2 - Total site disturbance s<strong>co</strong>re (out of 10) Natural vs disturbed% s<strong>co</strong>re Disturbed NaturalEVC s<strong>co</strong>re 0 2 4 6 8 10 8EVC S<strong>co</strong>re (out of 10) = [(EVC1 + 992
SAS ……………. October 2012EVC2)/2]SISI is determined with reference to the following s<strong>co</strong>ring table of vegetation distribution for Present StateVS Perceived Reference StatePerceived reference state vs present stateContinuous Clumped Scattered Sparse Trees 3Continuous 3 2 1 0 Shrubs 3Clumped 2 3 2 1 Reeds 3Scattered 1 2 3 2 Sedges 3Sparse 0 1 2 3 Grasses 3Bare ground 3SI S<strong>co</strong>re (out of 1) = [((SI1 + SI2 + SI3 + SI4 +SI5 + SI6) /6) * 0.33] 0.99PCIRSPercentage <strong>co</strong>ver of indigenous riparian species (PCIRS): S<strong>co</strong>ring system for the <strong>co</strong>ver of exotic species,terrestrial species & reedsCover s<strong>co</strong>re 0 VL L M H VHPCIRS subs<strong>co</strong>re0 1 2 3 4 5If no indigenous riparian spp are present at the site, the PCIRS (min) = 0Exotic species 1Terrestrial species 1Reeds 2PCIRS s<strong>co</strong>re (out of 5) = [(EVC/2) - ((exotics x 0.7) + (terrestrial x 0.1) + (reeds x 0.2))] 3.3RIRSRecruitment of indigenous riparian species (RIRS), the recruitment of positive significance and importanceat a site is that of indigenous riparian species, particularly the dominant species present (by biomass)Extent ofrecruitment0 VL L M H VHRIRS s<strong>co</strong>re 0 1 2 3 4 5RIRS VALUE 5RIPARIAN VEGETATION INDEXSCORE17.3 CLASS B93
SAS ……………. October 2012<strong>Appendix</strong> A3 – Riparian Vegetation Index Data andCalculations: C3RIPARIAN VEGETATIONINDEX (RVI)A. Site detailsRiver: Orange River Date: 18/09/2012Site No: 3 Assessors:Site Name:Location (GPS): S28°46’10.41” Elevation:E20°59’20.67”C3E vdWesthuizenB. Riparian vegetation index detailsRVI s<strong>co</strong>re calculationThe RVI formula is:RVI = [(EVC) + (SI x PCIRS) +(RIRS)]Where:EVC = Extent of vegetation <strong>co</strong>verSI = Structural intactnessPCIRS = Percentage <strong>co</strong>ver ofindigenous riparian speciesRIRS = Recruitment of indigenousriparian speciesRiparian Vegetation IndexDetails: RVI S<strong>co</strong>re 13EVC S<strong>co</strong>re 8PCIRSS<strong>co</strong>re 1.2SI S<strong>co</strong>re 0.83 RIRS S<strong>co</strong>re 4C. RVI S<strong>co</strong>re, assessment class and its descriptionRVI S<strong>co</strong>re <strong>Assessment</strong> Class Description19 to 20 A Unmodified <strong>co</strong>nditions, natural state17 to 18 B Largely natural with few modifications13 to 16 C Moderately modified9 to 12 D Largely modified5 to 8 E Extensive loss of the natural habitat0 to 4 FCritical level of modifications, almost a <strong>co</strong>mplete loss ofnatural habitatD. Riparian e<strong>co</strong>system state variablesChannel typeWidth of potential riparian zoneAnabranchingLHB = ca. 40m; RHB = ca. 50m Islands = ca. 30m94
SAS ……………. October 2012SubstrateDisturbancesSurrounding land useDominant <strong>co</strong>verIndigenous species richnessExotic species richnessEvidence of riparian e<strong>co</strong>systemfunctioning:Channel bank stabilityFlood attenuation potentialFiltering potential (water quality)50% bedrock, 40% rock and gravel, 10% sandLandscaping activitiesAlien encroachmentVegetation clearingInfrastructure upgradesResidential (Urban)Approximately: grass 25%; trees/shrubs 30%; reeds40%; forbs 5%Medium-High DiversityLow diversity; moderate abundanceModerate to high; most banks <strong>co</strong>vered in grasses, treesor reeds.Moderate to high; the presence of reeds and extensiveriparian banks increase flood attenuation potential.Medium; reeds and sedges presentHabitat provisionAvailable: Indigenous woody vegetation and reed bedsprovide suitable habitat for diversity of faunal and floralspecies.RVI SCORE CALCULATIONSThe RVI formula is:RVI = [(EVC) + (SI x PCIRS) + (RIRS)]Where:EVC = Extent of vegetation <strong>co</strong>verSI = Structural intactnessPCIRS = Percentage <strong>co</strong>ver of indigenous riparian speciesRIRS = Recruitment of indigenous riparian speciesThe final s<strong>co</strong>re is out of 20 (<strong>co</strong>mparable to the six E<strong>co</strong>logical Reserve <strong>Assessment</strong> Classes)EVCEVC: determined by calculating the mean s<strong>co</strong>re of the EVC1 and EVC2, by two alternative methods:EVC1 - Combined vegetation <strong>co</strong>ver s<strong>co</strong>re out of 10 for the LHB, RHB & islands (if present)Percentage vegetation <strong>co</strong>ver (all vegetation)Percentage s<strong>co</strong>re 0% 1-5% 6-25% 26-50%51-75%76-100%EVC s<strong>co</strong>re 0 2 4 6 8 10 10EVC2 - Total site disturbance s<strong>co</strong>re (out of 10) Natural vs disturbed% s<strong>co</strong>re Disturbed NaturalEVC s<strong>co</strong>re 0 2 4 6 8 10 6EVC S<strong>co</strong>re (out of 10) = [(EVC1 +EVC2)/2]895
SAS ……………. October 2012SISI is determined with reference to the following s<strong>co</strong>ring table of vegetation distribution for Present StateVS Perceived Reference StatePerceived reference state vs present stateContinuous Clumped Scattered Sparse Trees 2Continuous 3 2 1 0 Shrubs 2Clumped 2 3 2 1 Reeds 3Scattered 1 2 3 2 Sedges 3Sparse 0 1 2 3 Grasses 2Bare ground 3SI S<strong>co</strong>re (out of 1) = [((SI1 + SI2 + SI3 + SI4 +SI5 + SI6) /6) * 0.33] 0.83PCIRSPercentage <strong>co</strong>ver of indigenous riparian species (PCIRS): S<strong>co</strong>ring system for the <strong>co</strong>ver of exotic species,terrestrial species & reedsCover s<strong>co</strong>re 0 VL L M H VHPCIRS subs<strong>co</strong>re0 1 2 3 4 5If no indigenous riparian spp are present at the site, the PCIRS (min) = 0Exotic species 3Terrestrial species 3Reeds 2PCIRS s<strong>co</strong>re (out of 5) = [(EVC/2) - ((exotics x 0.7) + (terrestrial x 0.1) + (reeds x 0.2))] 1.2RIRSRecruitment of indigenous riparian species (RIRS), the recruitment of positive significance and importanceat a site is that of indigenous riparian species, particularly the dominant species present (by biomass)Extent ofrecruitment0 VL L M H VHRIRS s<strong>co</strong>re 0 1 2 3 4 5RIRS VALUE 4RIPARIAN VEGETATION INDEXSCORE13 CLASS C96
SAS ……………. October 2012<strong>Appendix</strong> A4 – Riparian Vegetation Index Data andCalculations: C4RIPARIAN VEGETATIONINDEX (RVI)A. Site detailsRiver: Orange River Date: 18/09/2012Site No: 4 Assessors:Site Name:Location (GPS): S28°45’31.62” Elevation:E20°59’20.67”C4E vdWesthuizenB. Riparian vegetation index detailsRVI s<strong>co</strong>re calculationThe RVI formula is:RVI = [(EVC) + (SI x PCIRS) +(RIRS)]Where:EVC = Extent of vegetation<strong>co</strong>verSI = Structural intactnessPCIRS = Percentage <strong>co</strong>verof indigenous riparianspeciesRIRS = Recruitment ofindigenous riparian speciesRiparian Vegetation IndexDetails: RVI S<strong>co</strong>re 17.3EVC S<strong>co</strong>re 9 PCIRS S<strong>co</strong>re 3.3SI S<strong>co</strong>re 0.99 RIRS S<strong>co</strong>re 5C. RVI S<strong>co</strong>re, assessment class and its descriptionRVI S<strong>co</strong>re <strong>Assessment</strong> Class Description19 to 20 A Unmodified <strong>co</strong>nditions, natural state17 to 18 B Largely natural with few modifications13 to 16 C Moderately modified9 to 12 D Largely modified5 to 8 E Extensive loss of the natural habitat0 to 4 FCritical level of modifications, almost a <strong>co</strong>mplete loss ofnatural habitatD. Riparian e<strong>co</strong>system state variablesChannel typeAnabranching97
SAS ……………. October 2012Width of potential riparian zoneSubstrateDisturbancesSurrounding land useDominant <strong>co</strong>verIndigenous species richnessExotic species richnessEvidence of riparian e<strong>co</strong>systemfunctioning:Channel bank stabilityFlood attenuation potentialFiltering potential (water quality)LHB = ca. 60m; RHB = ca. 60m Islands = ca. 60m30% bedrock, 500% rock and gravel, 20% sandErosion/ incisionAgricultureRural agriculturalApproximately: grass 5%; trees/shrubs 45%; reeds 50%;Medium-High DiversityLow diversity; low abundanceModerate to high; most banks <strong>co</strong>vered in grasses, treesor reeds.Moderately high to high; the presence of dense reedsand extensive riparian banks increase flood attenuationpotential.Medium to high; reeds and sedges presentHabitat provisionAvailable: Indigenous woody and reed vegetationprovide suitable habitat for diversity of faunal and floralspeciesRVI SCORE CALCULATIONSThe RVI formula is:RVI = [(EVC) + (SI x PCIRS) + (RIRS)]Where:EVC = Extent of vegetation <strong>co</strong>verSI = Structural intactnessPCIRS = Percentage <strong>co</strong>ver of indigenous riparian speciesRIRS = Recruitment of indigenous riparian speciesThe final s<strong>co</strong>re is out of 20 (<strong>co</strong>mparable to the six E<strong>co</strong>logical Reserve <strong>Assessment</strong> Classes)EVCEVC: determined by calculating the mean s<strong>co</strong>re of the EVC1 and EVC2, by two alternative methods:EVC1 - Combined vegetation <strong>co</strong>ver s<strong>co</strong>re out of 10 for the LHB, RHB & islands (if present)Percentage vegetation <strong>co</strong>ver (all vegetation)Percentage s<strong>co</strong>re 0% 1-5% 6-25% 26-50%51-75%76-100%EVC s<strong>co</strong>re 0 2 4 6 8 10 10EVC2 - Total site disturbance s<strong>co</strong>re (out of 10) Natural vs disturbed% s<strong>co</strong>re Disturbed NaturalEVC s<strong>co</strong>re 0 2 4 6 8 10 8EVC S<strong>co</strong>re (out of 10) = [(EVC1 +EVC2)/2]998
SAS ……………. October 2012SISI is determined with reference to the following s<strong>co</strong>ring table of vegetation distribution for Present StateVS Perceived Reference StatePerceived reference state vs present stateContinuous Clumped Scattered Sparse Trees 3Continuous 3 2 1 0 Shrubs 3Clumped 2 3 2 1 Reeds 3Scattered 1 2 3 2 Sedges 3Sparse 0 1 2 3 Grasses 3Bare ground 3SI S<strong>co</strong>re (out of 1) = [((SI1 + SI2 + SI3 + SI4 +SI5 + SI6) /6) * 0.33] 0.99PCIRSPercentage <strong>co</strong>ver of indigenous riparian species (PCIRS): S<strong>co</strong>ring system for the <strong>co</strong>ver of exotic species,terrestrial species & reedsCover s<strong>co</strong>re 0 VL L M H VHPCIRS subs<strong>co</strong>re0 1 2 3 4 5If no indigenous riparian spp are present at the site, the PCIRS (min) = 0Exotic species 1Terrestrial species 1Reeds 2PCIRS s<strong>co</strong>re (out of 5) = [(EVC/2) - ((exotics x 0.7) + (terrestrial x 0.1) + (reeds x 0.2))] 3.3RIRSRecruitment of indigenous riparian species (RIRS), the recruitment of positive significance and importanceat a site is that of indigenous riparian species, particularly the dominant species present (by biomass)Extent ofrecruitment0 VL L M H VHRIRS s<strong>co</strong>re 0 1 2 3 4 5RIRS VALUE 5RIPARIAN VEGETATION INDEXSCORE17.3 CLASS B99
SAS ……………. October 2012<strong>Appendix</strong> A5 – Riparian Vegetation Index Data andCalculations: C5RIPARIAN VEGETATIONINDEX (RVI)A. Site detailsRiver: Orange River Date: 18/09/2012Site No: 5 Assessors:Site Name:Location (GPS): S28°46’10.41” Elevation:E20°11’12.32”C5E vdWesthuizenB. Riparian vegetation index detailsRVI s<strong>co</strong>re calculationThe RVI formula is:RVI = [(EVC) + (SI x PCIRS) +(RIRS)]Where:EVC = Extent of vegetation <strong>co</strong>verSI = Structural intactnessPCIRS = Percentage <strong>co</strong>ver ofindigenous riparian speciesRIRS = Recruitment of indigenousriparian speciesRiparian Vegetation IndexDetails: RVI S<strong>co</strong>re 10.33EVC S<strong>co</strong>re 7PCIRSS<strong>co</strong>re 0.5SI S<strong>co</strong>re 0.66 RIRS S<strong>co</strong>re 3C. RVI S<strong>co</strong>re, assessment class and its descriptionRVI S<strong>co</strong>re <strong>Assessment</strong> Class Description19 to 20 A Unmodified <strong>co</strong>nditions, natural state17 to 18 B Largely natural with few modifications13 to 16 C Moderately modified9 to 12 D Largely modified5 to 8 E Extensive loss of the natural habitat0 to 4 FCritical level of modifications, almost a <strong>co</strong>mplete loss ofnatural habitatD. Riparian e<strong>co</strong>system state variablesChannel typeWidth of potential riparian zoneAnabranchingLHB = ca. 30m; RHB = ca. 30m100
SAS ……………. October 2012SubstrateDisturbancesSurrounding land useDominant <strong>co</strong>verIndigenous species richnessExotic species richnessEvidence of riparian e<strong>co</strong>systemfunctioning:Channel bank stabilityFlood attenuation potentialFiltering potential (water quality)30% bedrock, 40% rock and gravel, 30% sandEarthmoving activitiesAlien encroachmentVegetation clearingTopographic alterationRural agriculturalApproximately: grass 30%; trees/shrubs 325%; reeds40%; forbs 5%Moderate DiversityLow diversity; moderate to high abundanceModerate, evidence of stabilising activities observed.Very steep banks in some areas.Moderate; vegetation clearing has decreased floodattenuation potential.Medium; reeds presentHabitat provisionAvailable: Reed beds provide suitable habitat fordiversity of faunal and floral species.RVI SCORE CALCULATIONSThe RVI formula is:RVI = [(EVC) + (SI x PCIRS) + (RIRS)]Where:EVC = Extent of vegetation <strong>co</strong>verSI = Structural intactnessPCIRS = Percentage <strong>co</strong>ver of indigenous riparian speciesRIRS = Recruitment of indigenous riparian speciesThe final s<strong>co</strong>re is out of 20 (<strong>co</strong>mparable to the six E<strong>co</strong>logical Reserve <strong>Assessment</strong> Classes)EVCEVC: determined by calculating the mean s<strong>co</strong>re of the EVC1 and EVC2, by two alternative methods:EVC1 - Combined vegetation <strong>co</strong>ver s<strong>co</strong>re out of 10 for the LHB, RHB & islands (if present)Percentage vegetation <strong>co</strong>ver (all vegetation)Percentage s<strong>co</strong>re 0% 1-5% 6-25% 26-50%51-75%76-100%EVC s<strong>co</strong>re 0 2 4 6 8 10 8EVC2 - Total site disturbance s<strong>co</strong>re (out of 10) Natural vs disturbed% s<strong>co</strong>re Disturbed NaturalEVC s<strong>co</strong>re 0 2 4 6 8 10 6EVC S<strong>co</strong>re (out of 10) = [(EVC1 +EVC2)/2]7101
SAS ……………. October 2012SISI is determined with reference to the following s<strong>co</strong>ring table of vegetation distribution for Present StateVS Perceived Reference StatePerceived reference state vs present stateContinuous Clumped Scattered Sparse Trees 2Continuous 3 2 1 0 Shrubs 2Clumped 2 3 2 1 Reeds 2Scattered 1 2 3 2 Sedges 2Sparse 0 1 2 3 Grasses 2Bare ground 2SI S<strong>co</strong>re (out of 1) = [((SI1 + SI2 + SI3 + SI4 +SI5 + SI6) /6) * 0.33] 0.66PCIRSPercentage <strong>co</strong>ver of indigenous riparian species (PCIRS): S<strong>co</strong>ring system for the <strong>co</strong>ver of exotic species,terrestrial species & reedsCover s<strong>co</strong>re 0 VL L M H VHPCIRS subs<strong>co</strong>re0 1 2 3 4 5If no indigenous riparian spp are present at the site, the PCIRS (min) = 0Exotic species 3Terrestrial species 3Reeds 3PCIRS s<strong>co</strong>re (out of 5) = [(EVC/2) - ((exotics x 0.7) + (terrestrial x 0.1) + (reeds x 0.2))] 0.5RIRSRecruitment of indigenous riparian species (RIRS), the recruitment of positive significance and importanceat a site is that of indigenous riparian species, particularly the dominant species present (by biomass)Extent ofrecruitment0 VL L M H VHRIRS s<strong>co</strong>re 0 1 2 3 4 5RIRS VALUE 3RIPARIAN VEGETATION INDEXSCORE10.33 CLASS D102