Michigan - Building Energy Codes
Michigan - Building Energy Codes
Michigan - Building Energy Codes

Create successful ePaper yourself
Turn your PDF publications into a flip-book with our unique Google optimized e-Paper software.
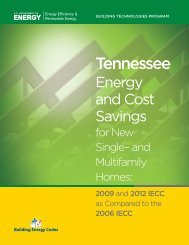
<strong>Michigan</strong> <strong>Energy</strong> and Cost Savingsfor New Single- and Multifamily Homes:2012 IECC as Compared to the<strong>Michigan</strong> Uniform <strong>Energy</strong> CodeFigure 1. <strong>Michigan</strong>Climate ZonesThe 2012 International <strong>Energy</strong>Conservation Code (IECC) yieldspositive benefits for <strong>Michigan</strong>homeowners.Moving to the 2012 IECC from the <strong>Michigan</strong> Uniform <strong>Energy</strong> Codeis cost-effective over a 30-year life cycle. On average, <strong>Michigan</strong>homeowners will save $10,081 with the 2012 IECC.Each year, the reduction to energy bills will significantly exceedincreased mortgage costs. After accounting for up-front costs andadditional costs financed in the mortgage, homeowners shouldsee net positive cash flows (i.e., cumulative savings exceedingcumulative cash outlays) in 1 year for the 2012 IECC. Averageannual energy savings are $604 for the 2012 IECC.2 2012 IECC AS COMPARED TO THE MICHIGAN UNIFORM ENERGY CODE
HighlightsCost-effectiveness against a <strong>Michigan</strong> Uniform<strong>Energy</strong> Code baseline:• Life-cycle cost savings, averaged across climatezones and building types, are $10,081 for the 2012IECC• Simple payback period is 3.5 years for the 2012 IECCConsumer savings compared to a <strong>Michigan</strong> Uniform<strong>Energy</strong> Code baseline:• Households save an average of $604 per year onenergy costs with the 2012 IECC• Net annual consumer savings, including energysavings, mortgage cost increases, and otherassociated costs in the first year of ownership,average $478 for the 2012 IECC• <strong>Energy</strong> costs, on average, are 30.9% lower for the2012 IECCCost-EffectivenessThe U.S. Department of <strong>Energy</strong> (DOE) evaluates the energycodes based on three measures of cost-effectiveness:• Life-Cycle Cost: Full accounting over a 30-yearperiod of the cost savings, considering energysavings, the initial investment financed throughincreased mortgage costs, tax impacts, andresidual values of energy efficiency measures• Cash Flow: Net annual cost outlay (i.e., differencebetween annual energy cost savings and increasedannual costs for mortgage payments, etc.)• Simple Payback: Number of years required forenergy cost savings to exceed the incremental firstcosts of a new codeLife-cycle cost is the primary measure by which DOEassesses the cost-effectiveness of the IECC. These savingsassume that initial costs are mortgaged, that homeownerstake advantage of the mortgage interest deductions, andthat long-lived efficiency measures retain a residual valueafter the 30-year analysis period. As shown in Table 1,life-cycle cost savings, averaged across climate zones are$10,081 for the 2012 IECC.Table 1. Average Life-Cycle Cost Savings from Compliance with the 2012 IECC, Relative to the <strong>Michigan</strong> Uniform <strong>Energy</strong> CodeLife-Cycle CostSavings ($)Net PositiveCash Flow (Years)Simple Payback(Years)2012 IECC $10,081 1 3.52012 IECC AS COMPARED TO THE MICHIGAN UNIFORM ENERGY CODE3
Consumer SavingsAnnual consumer cash flows impact the affordability ofenergy-efficient homes. Based on this analysis, <strong>Michigan</strong>homeowners, on average, should see annual energy costsavings of $604 per year and achieve a net cumulativesavings that accounts for an increased down paymentin addition to energy costs, mortgage costs, and taxrelatedcosts and benefits in 1 year when comparing the2012 IECC to the <strong>Michigan</strong> Uniform <strong>Energy</strong> Code. Table 2summarizes these results.Table 2. Impacts to Consumers’ Cash Flow from Compliance with the 2012 IECC Compared to the <strong>Michigan</strong> Uniform <strong>Energy</strong> CodeConsumers’ Cash Flow (Average)2012 IECCA Down payment and other up-front costs $228B Annual energy savings (year one) $604C Annual mortgage increase $124DNet annual cost of mortgage interest deductions,mortgage insurance, and property taxes (year one)$2E = [B-(C+D)] Net annual cash flow savings (year one) $478F = [A/E]Years to positive savings, including up-front costimpacts1The U.S. Department of <strong>Energy</strong> (DOE) provides estimates of energy and cost savings from code adoption:• National: <strong>Energy</strong> cost savings(only)• Climate Zone: <strong>Energy</strong> costsavings, life-cycle cost savings,and consumer cash flows• State: <strong>Energy</strong> cost savings,life-cycle cost savings, consumercash flows, and simple paybacksFor more information on how these estimates were developed, visit the DOE <strong>Building</strong> <strong>Energy</strong><strong>Codes</strong> website: www.energycodes.gov/development/residentialBUILDING TECHNOLOGIES PROGRAMEERE Information Center1-877-EERE-INFO (1-877-337-3463)www.eere.energy.gov/informationcenterJune 2012PNNL-21482For information on <strong>Building</strong> <strong>Energy</strong><strong>Codes</strong>, visit www.energycodes.gov4 2012 IECC AS COMPARED TO THE MICHIGAN UNIFORM ENERGY CODE
Technical Appendix AMethodologyAn overview of the methodology used to calculate these impacts is provided below. Further information as tohow these estimates were developed is available at the U.S. Department of <strong>Energy</strong>’s (DOE) <strong>Building</strong> <strong>Energy</strong><strong>Codes</strong> website. 1Cost‐EffectivenessPacific Northwest National Laboratory (PNNL) calculated three cost‐effectiveness metrics in comparing the 2012International <strong>Energy</strong> Conservation Code (IECC) and the <strong>Michigan</strong> Uniform <strong>Energy</strong> Code. These are: Life‐Cycle Cost (LCC): Full accounting over a 30‐year period of the cost savings, considering energysavings, the initial investment financed through increased mortgage costs, tax impacts, and residualvalues of energy efficiency measures Cash Flow: Net annual cost outlay (i.e., difference between annual energy cost savings and increasedannual costs for mortgage payments, etc.) Simple Payback: Number of years required for energy cost savings to exceed the incremental first costsof a new codeLCC is a robust cost‐benefit metric that sums the costs and benefits of a code change over a specified timeperiod. LCC is a well‐known approach to assessing cost‐effectiveness. DOE uses LCC for determining the costeffectivenessof code change proposals, and for the code as a whole, because it is the most straightforwardapproach to achieving the desired balance of short‐ and long‐term perspectives.The financial and economic parameters used for these calculations are as follows: New home mortgage parameters:o 5.0% mortgage interest rate (fixed rate)o Loan fees equal to 0.7% of the mortgage amounto 30‐year loan termo 10% down payment Other rates and economic parameters:o 5% nominal discount rate (equal to mortgage rate)o 1.6% inflation rateo 25% marginal federal income tax and 4.35% marginal state income taxo 0.9% property taxo Insulation has 60‐year life with linear depreciation resulting in a 50% residual value at the end ofthe 30‐year periodo Windows, duct sealing, and envelope sealing have a 30‐year life and hence no residual value atthe end of the analysis periodo Light bulbs have a 6‐year life and are replaced four times during the 30‐year analysis period<strong>Energy</strong> and Economic AnalysisThis analysis determined the energy savings and economic impacts of the 2012 IECC compared to the <strong>Michigan</strong>Uniform <strong>Energy</strong> Code. <strong>Energy</strong> usage was modeled using DOE’s <strong>Energy</strong>Plus software for two building types:1 www.energycodes.gov/development/residentialA.1 June 2012
1. Single‐Family: A two‐story home with a 30‐ft by 40‐ft rectangular shape, 2,400 ft 2 of floor area excludingthe basement, and windows that cover 15% of the wall area, equally distributed on all sides of the house2. Multifamily: A three‐story building with 18 units (6 units per floor), each unit having conditioned floorarea of 1,200 ft 2 and window area equal to approximately 10% of the conditioned floor area, equallydistributed on all sides of the buildingEach of these building types, single‐family and apartment/condo in a multifamily building, have four uniquefoundation types:1. Slab on grade2. Heated basement3. Unheated basement4. CrawlspaceEach building type also has four unique heating system types:1. Natural gas2. Heat pump3. Electric resistance4. OilThis results in 32 unique scenarios (2 x 4 x 4) for each of the three climate zones.PNNL incorporated the prescriptive requirements of the <strong>Michigan</strong> Uniform <strong>Energy</strong> Code and the 2012 IECC whenmodeling the impacts of changes to the code. Whenever possible, PNNL uses DOE’s <strong>Energy</strong>Plus model softwareto simulate changes to code requirements. However, in some cases, alternative methods are employed toestimate the effects of a given change. As an example, in order to give full consideration of the impacts of the2012 IECC requirement for insulating hot water pipes (or shortening the pipe lengths), a separate estimate wasdeveloped for hot water pipe insulation requirements in the 2012 IECC, which results in a 10% savings in waterheating energy use (Klein 2012).<strong>Energy</strong> and economic impacts were determined separately for each unique scenario, including the single‐familyand multifamily buildings, the four unique foundation types, and the four unique heating system types.However, the cost‐effectiveness results are reported as a single average for each climate zone and as an overallstate average. To determine this average, first the results were combined across foundation types and heatingsystem types for single‐family and multifamily prototypes as shown in Table A.1 and Table A.2 (single‐family andmultifamily have the same shares for foundation types). For example, the primary heating system type in newresidential units in <strong>Michigan</strong> is a natural gas furnace. Therefore, the combined average energy usage calculationswere proportionally weighted to account for the predominance of natural gas heating. Then single‐family andmultifamily results were combined for each climate zone in the state and the climate zone results werecombined to determine a state average weighted by housing starts from 2010 U.S. Census data as shown inTable A.3.A.2 June 2012
Table A.1.Heating Equipment SharesHeating SystemPercent ShareSingle‐FamilyMultifamilyNatural gas 76.2 96.5Heat pump 22.5 3.3Electric resistance 0.7 0.1Oil 0.5 0.1Table A.2.Foundation Type SharesFoundation Type Slab on Grade Heated Basement Unheated Basement CrawlspacePercent share 15.7 36.2 27.3 20.8Table A.3.Construction by <strong>Building</strong> Type and Climate ZoneClimate ZoneHousing StartsSingle‐FamilyMultifamily5 6041 8306 1426 847 236 12Differences Between the <strong>Michigan</strong> Uniform <strong>Energy</strong> Code and the 2012 IECCThe <strong>Michigan</strong> Uniform <strong>Energy</strong> Code is based on the 2009 IECC but does not require duct pressure testing. Allversions of the IECC have requirements that apply uniformly to all climate zones, and other requirements thatvary by climate zone. Highlights of the mandatory requirements across all buildings include: <strong>Building</strong> envelope must be caulked and sealed. The 2012 IECC adds a requirement that the buildingmust be tested and a level of leakage that is no more than a maximum limit must be achieved. Ducts and air handlers must be sealed. Testing against specified maximum leakage rates is required inthe 2012 IECC if any ducts pass outside the conditioned space (e.g., in attics, unheated basements). The2012 IECC leakage requirements are more energy efficient.Supply and return ducts in attics, and all ducts in crawlspaces, unheated basements, garages, orotherwise outside the building envelope must be insulated.For both the <strong>Michigan</strong> Uniform <strong>Energy</strong> Code and the 2012 IECC, a minimum percentage of the lightingbulbs or fixtures in the dwelling must be high‐efficacy lighting.A certificate listing insulation levels and other energy efficiency measures must be posted on or near theelectric service panel.A comparison of significant <strong>Michigan</strong> Uniform <strong>Energy</strong> Code and IECC requirements that do not vary by climatezone is contained in Table A.4. Of these, the most significant changes in the 2012 IECC compared to the<strong>Michigan</strong> Uniform <strong>Energy</strong> Code are the requirements for pressure testing of the building envelope and ducts/airhandlers, and for insulating service hot water pipes. The requirement for high‐efficacy lamps, while significant,A.3 June 2012
is somewhat abated by a superseding federal regulation banning the manufacture or import of less efficientlamps at common watt levels that takes effect in 2012 to 2014.Table A.4.Comparison of Major Requirements That Do Not Vary by Climate ZoneRequirement<strong>Building</strong> envelope sealingDucts and air handlers<strong>Michigan</strong> Uniform <strong>Energy</strong>CodeCaulked and sealed, verifiedby visual inspection against amore detailed checklistSealed, verified by visualinspection, or all ducts mustbe inside building envelope2012 IECCCaulked and sealed, verified by visualinspection and a pressure test against aleakage requirementSealed, verified by visual inspection, andpressure tested against a leakage requirement,or all ducts must be inside building envelopeSupply ducts in attics R‐8 R‐8Return ducts in attics and all ducts incrawlspaces, unheated basements, garages,or otherwise outside the building envelopeInsulation on hot water pipes for servicewater heating systemsInsulation on hot water pipes for hydronic(boiler) space heating systemsHigh‐efficacy lamps (percent of lighting inthe home)Certificate of insulation levels and otherenergy efficiency measuresR‐6 R‐6NoneR‐3 except where pipe run length is below adiameter‐dependent thresholdR‐3 R‐350% of lamps 75% of lamps or 75% of fixturesYesYesRequirements such as insulation levels and fenestration (window, door, and skylights) U‐factors can vary by theeight zones in the United States. Table A.5 shows these requirements. <strong>Michigan</strong> has three climate zones (Zones5, 6, and 7) as defined in the IECC.A.4 June 2012
Table A.5.Comparison of Major Requirements That Vary by Climate ZoneClimateZoneIECCCeiling(R‐value)Skylight(U‐factor)Fenestration (Windowsand Doors)U‐factorSHGCWoodFrame Wall(R‐value)ComponentsMassWall*(R‐value)Floor(R‐value)BasementWall**(R‐value)Tested MaxAir LeakageRate(air changesper hour)NRSlab***(R‐valueand depth)CrawlSpace**(R‐value)120090.330 0.75 NR13 3/4 13 NR2012 0.25 5NR NR22009 30 0.75 0.65 0.3NR13 4/6 13 NR2012 38 0.65 0.4 0.25 5NR NR32009 30 0.65 0.5 0.3 13 5/8NR19 5/13****2012 38 0.55 0.35 0.25 20 8/13 3NR 5/1342009 38 0.6NR 13 5/10NR0.3519 10/132012 49 0.55 0.40 20 8/13 310, 2 ft 10/1352009 38 0.6 0.3513/1710/13 NR10/13NR 203010, 2 ft2012 49 0.55 0.32 15/19 15/19 3 15/19620090.6 0.3520NR10/1349NR15/19 30 15/1910, 4 ft2012 0.55 0.32 20+5 3 15/197 and 820090.6 0.3521NR10/1349NR19/21 38 15/1910, 4 ft2012 0.55 0.32 20+5 3 15/19* The second number applies when more than half the insulation is on the interior side of the high mass material in the wall.** The first number is for continuous insulation (e.g., a board or blanket directly on the foundation wall) and the second number is for cavity insulation (i.e., if thereis a furred‐out wall built against the foundation wall). Only one of these two has to be met.*** The first number is R‐value. The second value refers to the vertical depth of the insulation around the perimeter.**** Basement wall insulation is not required in the warm‐humid region of Zone 3 in the southeastern United States.NR = not requiredSHGC = solar heat gain coefficientA.5 June 2012
While exemptions or allowances in the code are not included in this analysis, the code does allow for some ofthese depending on the compliance path. Examples include the following: One door and 15 ft 2 of window area are exempt Skylight U‐factors are allowed to be higher than window U‐factors Five hundred square feet or 20% of ceiling area of a cathedral ceiling, whichever is less, is allowed tohave R‐30 insulation in climate zones where more than R‐30 is required for other ceilingsIncremental First CostsTable A.6 shows the costs of implementing the prescriptive measures of the new code. Costs are provided forboth the reference home and apartment/condo, moving from the <strong>Michigan</strong> Uniform <strong>Energy</strong> Code to the 2012IECC. The costs derive from estimates assembled by Faithful + Gould (2012) and a number of other sources. 2The original cost data were based on a national average. The costs are adjusted downwards by 1.1% (multipliedby 0.989) to reflect local construction costs based on location factors provided by Faithful + Gould (2011).Table A.6.Total Construction Cost Increase for the 2012 IECC Compared to the <strong>Michigan</strong> Uniform <strong>Energy</strong> CodeUnheatedBasement orCrawlspace2,400 ft 2 House 1,200 ft 2 Apartment/CondoHeated Basementor Slab on GradeUnheated Basementor CrawlspaceHeated Basement orSlab on GradeZone 5 $1,919 $2,172 $1,079 $1,116Zone 6 $3,137 $3,137 $1,525 $1,525Zone 7 $3,137 $3,137 $1,525 $1,525ResultsLife‐Cycle CostTable A.7 shows the LCC savings (discounted present value) of the new code over the 30‐year analysis period.These savings assume that initial costs are mortgaged, that homeowners take advantage of the mortgageinterest tax deductions, and that efficiency measures retain a residual value at the end of the 30 years. Asshown in Table A.7, LCC savings averaged across climate zones are $10,081 for the 2012 IECC.Table A.7.Life‐Cycle Cost Savings Compared to the <strong>Michigan</strong> Uniform <strong>Energy</strong> CodeCode Zone 5 Zone 6 Zone 7 State Average2012 IECC $9,813 $10,874 $12,376 $10,081Cash FlowBecause most houses are financed, consumers will be very interested in the financial impacts of buying a homethat complies with the 2012 IECC requirements compared to the <strong>Michigan</strong> Uniform <strong>Energy</strong> Code. Mortgagesspread the payment for the cost of a house over a long period of time (the simple payback fails to account for2 The Faithful + Gould cost data and other cost data for energy efficiency measures are available on the “BC3” website athttp://bc3.pnnl.gov/.A.6 June 2012
the impacts of mortgages). In this analysis, a 30‐year fixed‐rate mortgage was assumed. It was also assumedthat homebuyers will deduct the interest portion of the payments from their income taxes.Table A.8 shows the impacts to consumers’ cash flow resulting from the improvements in the 2012 IECC. Upfrontcosts include the down payment and loan fees. The annual values shown in the table are for the first year.The savings from income tax deductions for the mortgage interest will slowly decrease over time while energysavings are expected to increase over time because of escalating energy prices. These tables also includeincreases in annual property taxes because of the higher assessed house values. The net annual cash flowincludes energy costs, mortgage payments, mortgage tax deductions, and property taxes but not the up‐frontcosts. The time to positive cash flow includes all costs and benefits, including the down payment and other upfrontcosts.As shown in Table A.8 , on average, there is a net positive cash flow to the consumer of $478 per year beginningin year one for the 2012 IECC. Positive cumulative savings, including payment of up‐front costs, are achieved in1 year.Table A.8.Impacts to Consumers’ Cash Flow from Compliance with the 2012 IECC Compared to the <strong>Michigan</strong> Uniform<strong>Energy</strong> CodeCost/Benefit Zone 5 Zone 6 Zone 7 State AverageA Down payment and other up‐front costs $203 $326 $327 $228B Annual energy savings (year one) $580 $683 $758 $604C Annual mortgage increase $110 $177 $177 $124DE=[B‐(C+D)]F=[A/E]Net annual cost of mortgage interest deductions,mortgage insurance, and property taxes (year one) $1 $2 $2 $2Net annual cash flow savings (year one)Years to positive savings, including up‐front costimpacts$469 $504 $579 $4781 1 1 1Note: Item D includes mortgage interest deductions, mortgage insurance, and property taxes for the first year. Deductions can partiallyor completely offset insurance and tax costs. As such, the "net" result appears relatively small or is sometimes even negative.Simple PaybackTable A.9 shows the simple payback period, which consists of the construction cost increase divided by first‐yearenergy cost savings. This calculation yields the number of years required for the energy cost savings to pay backthe initial investment. Simple payback does not consider financing of the initial costs through a mortgage orfavored tax treatment of mortgages.As Table A.9 shows, the simple payback period from moving to the 2012 IECC from the <strong>Michigan</strong> Uniform <strong>Energy</strong>Code averages 3.5 years across climate zones.A.7 June 2012
Table A.9.Simple Payback Period, Relative to the <strong>Michigan</strong> Uniform <strong>Energy</strong> Code (Years)Code Zone 5 Zone 6 Zone 7 State Average2012 IECC 3.3 4.5 4 3.5<strong>Energy</strong> Cost SavingsAll fuel prices were obtained from the DOE <strong>Energy</strong> Information Administration and are recent residential pricesspecific to <strong>Michigan</strong> (DOE 2012a, 2012b, 2012c). For this analysis, natural gas fuel prices were set to$0.971/therm. Electricity prices were set to $0.123/kWh for space heating and $0.131/kWh for air conditioning.Oil prices were set to $23.7/MBtu. <strong>Energy</strong> prices are assumed to escalate at the rates published in DOE’s Annual<strong>Energy</strong> Outlook (DOE 2012d).Table A.10 shows the estimated annual energy costs, including heating, cooling, water heating, and lighting perhome that result from meeting the requirements in the <strong>Michigan</strong> Uniform <strong>Energy</strong> Code and 2012 IECC. TableA.11 shows the total energy cost savings as both a net dollar savings and as a percentage of the total energyuse. 3 Results are averaged across home type (single‐ and multifamily), foundation type, and heating systemtypes.Table A.10. Annual <strong>Energy</strong> Costs for Different Versions of IECCHeating<strong>Michigan</strong> Uniform <strong>Energy</strong> CodeCoolingWaterHeatingLighting Total Heating Cooling2012 IECCWaterHeatingLightingZone 5 $1,200 $234 $284 $198 $1,916 $693 $218 $255 $170 $1,336Zone 6 $1,397 $166 $310 $207 $2,080 $781 $160 $279 $177 $1,397Zone 7 $1,606 $113 $327 $208 $2,254 $910 $113 $294 $179 $1,496State Average $1,246 $219 $290 $200 $1,955 $715 $205 $260 $171 $1,351TotalAs can be seen from Table A.11, energy cost savings per year for the 2012 IECC compared to the <strong>Michigan</strong>Uniform <strong>Energy</strong> Code range from $580 per year for Zone 5, up to $758 per year in Zone 7. On a percentagebasis, energy cost savings range from 30.3% to 33.6% with the 2012 IECC depending on climate zone.3 The percent savings is the annual energy cost savings for heating, cooling, water heating, and lighting divided by the totalbaseline annual energy cost for heating, cooling, water heating, and lighting.A.8 June 2012
Table A.11. Total <strong>Energy</strong> Cost Savings Compared to the <strong>Michigan</strong> Uniform <strong>Energy</strong> Code2012 IECCSavings ($/yr)Percent SavingsZone 5 $580 30.3Zone 6 $683 32.8Zone 7 $758 33.6State Average $604 30.9ReferencesFaithful + Gould. 2012. Residential <strong>Energy</strong> Efficiency Measures – Prototype Estimate and Cost Data. Portland,Oregon. http://bc3.pnnl.gov/wiki/index.php/DownloadsFaithful + Gould. 2011. Residential <strong>Energy</strong> Efficiency Measures – Locations Factors. Portland, Oregon.http://bc3.pnnl.gov/wiki/index.php/DownloadsKlein, G. 2012. Cost Estimation for Materials and Installation of Hot Water Piping Insulation. AffiliatedInternational Management, LLC, Newport Beach, California.U.S. Department of <strong>Energy</strong> (DOE). 2012a. Electric Power Monthly. DOE/EIA‐0226. Washington, D.C.http://www.eia.doe.gov/cneaf/electricity/epm/table5_6_a.htmlU.S. Department of <strong>Energy</strong> (DOE). 2012b. Natural Gas Monthly. DOE/EIA‐0130. Washington, D.C.http://www.eia.gov/oil_gas/natural_gas/data_publications/natural_gas_monthly/ngm.htmlU.S. Department of <strong>Energy</strong> (DOE). 2012c. Petroleum Marketing Monthly. DOE/EIA‐0380. Washington, D.C.http://www.eia.gov/petroleum/marketing/monthly/U.S. Department of <strong>Energy</strong> (DOE). 2012d. Annual <strong>Energy</strong> Outlook. DOE/EIA‐0383. Washington, D.C.A.9 June 2012