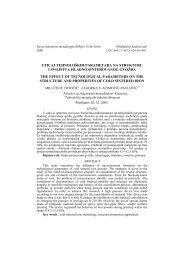
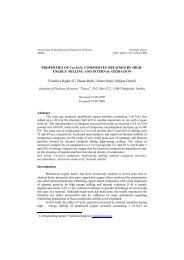
166MJoM METALURGIJA - JOURNAL <strong>OF</strong> METALLURGY, 14, (3) 2008intensity18001600140012001000800xxoozx - <strong>Sn</strong>o - <strong>Ag</strong> 3 <strong>Sn</strong>z - <strong>Ag</strong><strong>In</strong>600400200ozzxoxo030 40 50 602θFigure 4 - X-Ray difractograph for alloy B5 (<strong>Ag</strong>50<strong>In</strong>17<strong>Sn</strong>)The presence <strong>In</strong> 3 <strong>Sn</strong> phase in <strong>Sn</strong> matrix is typical for the alloys B1, in distinction toother alloys from section B (β-<strong>Sn</strong>, <strong>Ag</strong> 3 <strong>Sn</strong> and <strong>Ag</strong>-<strong>In</strong> phase). Concerning section A,alloys A3 and A4 have only β-<strong>Sn</strong> and <strong>Ag</strong> 3 <strong>Sn</strong> matrix, due to low content of indium.The obtained values for microhardness of <strong>Ag</strong>-<strong>In</strong>-<strong>Sn</strong> alloys (Figure 5) confirmedthe possibility of intermetallic compound formation in the microstructure (light phase).Generally, microhardness values for light phase are much higher than microhardnessfor tin matrix. These high values (100 ÷ 250 HV) indicate the presence of primarycrystals solution or intermetallic compound in the structure, which is already obtainedby results of XRD and SEM analysis.454035H µ30252055 60 65 70 75X <strong>Sn</strong>Figure 5. Microhardness for alloys in section A
<strong>STRUCTURAL</strong> <strong>CHARACTERISTICS</strong> <strong>OF</strong> <strong>SOME</strong> <strong>TERNARY</strong> <strong>Ag</strong>-<strong>In</strong>-<strong>Sn</strong> ALLOYS … 167On the other way, tin matrix has lower microhardness (20 ÷ 40 HV), and decreaseof microhardness is caused by increase of tin content in the alloy.CONCLUSIONBased on DTA curves, the information on characteristic peak temperatures ofinvestigated <strong>Ag</strong>-<strong>In</strong>-<strong>Sn</strong> alloys were obtained. Microstructure of each alloy from sectionsA and B, with constant molar ratio was determined by scanning electron microscopy.The composition of phases in the microstructure was determined by XRD analysis. Asconfirmation for previous structural investigations, the micro-hardness values forinvestigated <strong>Ag</strong>-<strong>In</strong>-<strong>Sn</strong> alloys, are presented.The indium content in alloy has great influence on the beginning and the end ofphase transformations. Considering the results, the most appropriate alloys amonginvestigated sections are the alloys from section A (<strong>In</strong>:<strong>Sn</strong>=1:4). The indium content inthese alloys is within 10 and 18 at%, which enables indium dissolution, and preventspartial alloy melting. The other reason for low content of indium is high cost price.Therefore, the alloys, which might be an alternative for the common Pb-<strong>Sn</strong>solders, are <strong>Ag</strong>-<strong>In</strong>-<strong>Sn</strong> alloys with high percent of tin, small percent of silver andindium. It is just a pre-request, having in mind a great influence of cooling rate andappropriate heat treatment on solder quality, as well as economic factors due to theindium and silver price at market, so further investigations should be carried out in thatdirection.REFERENCES[1] www.univie.ac.at/cost531[2] Korhonen T.M., Kivilahti J.K., JEM, 27(1998)149[3] T.B. Massalski, J.L. Muttay, L.H. Benett, H. Baker, Binary alloys phase diagrams,ASM, Metals Park, OH, 1990[4] Miki T., Ogava N., Nagasaka T., Hino M., Mater. Trans. 42(5)(2001)732[5] Zhang J., Calphad, 27(1)(2003)9[6] Ohnuma I., Cui Y., Liu X.J., et al., JEM, 29(2000)1113[7] Liu X.J., <strong>In</strong>ohana Y., Takaku Y., Ohnuma I., Kainuma R., Ishida K., Moser Z., GasiorW., Pstrus J., JEM, 31(2002)1139[8] Vassilev G., Dobrev E., Tedenac J.C., XXXIII Calphad Meeting Abstract PI-8,Krakow, Poland (2004); Vassilev G., Dobrev E., Tedenac J.C., Journal of Alloys andCompounds, (2005)-in print[9] M.R. Baren, <strong>In</strong>dium alloys and their engineering applications, Ed. C.E.T. White and H.Okamoto materials park, OH, ASM INTL, 1993, p. 15