Annual Report 2007 PDF - Storebrand
Annual Report 2007 PDF - Storebrand
Annual Report 2007 PDF - Storebrand

You also want an ePaper? Increase the reach of your titles
YUMPU automatically turns print PDFs into web optimized ePapers that Google loves.
<strong>Storebrand</strong> Life InsuranceNOK 16.6 billion of premium income<strong>Storebrand</strong> Life Insurance offers a wide range of productsfor occupational pensions, individual pension savings, lifeinsurance and health insurance for companies, public sectorentities and private individuals. <strong>Storebrand</strong> Life Insurance’sbranch in Sweden offers occupational pension products basedon Norwegian law in the Swedish market.<strong>Storebrand</strong> Life Insurance’s objective is to be the mostrespected and customer focused life insurance company inNorway by offering its customers the most attractive productsand the best advice and customer service.<strong>Storebrand</strong> InvestmentsNOK 10 billion increase in assets undermanagement<strong>Storebrand</strong> Investments offers a complete asset managementconcept with a clear socially responsible investmentprofile for institutional investors and the retail market. Assetmanagement products include discretionary management,specialist products and mutual funds. <strong>Storebrand</strong> Investments’objective is to be the preferred asset manager forlong-term savings and pension assets.Key figures (NOK million) <strong>2007</strong> 2006Operating profit 4 138 5 174Profit allocated to policyholders -2 797 -3 994- of which allocated to additionalstatutory reserves -400 -1 000Profit to owner- <strong>Storebrand</strong> Livsforsikring AS 1 341 1 180Profit to owner- <strong>Storebrand</strong> LivforsikringGroup 1 365 1 182Other activities 13 7IFRS effects 258 8Total for life insurance 1 635 1 198Net inflow of pension transfers 4 100 2 600Assets under management (excl. SPP) 197 000 172 000Total premium income(excl. premium reserves transfers) 16 600 13 100Key figures (NOK million) <strong>2007</strong> 2006Total revenue 331 399Total costs -259 -280Net financial/other 66 37Pre-tax profit 138 156Cost/income 65% 64%Development in investment return12%11.210%8% 8.87.6 7.67.37.26.9 6.96%6.47.18.36.58.97.36.6Total assets under managementNOK billion25020015016515915.813.29.725.312.910.120520.329.414.621724.630.320.022729.728.025.61004%2%50110.2 126.6140.6142.1144.10%2003 2004 2005 2006 <strong>2007</strong> Booked Value adjusted incl. bonds held to maturity Value adjusted excl. bonds held to maturity02003 2004 2005 2006 <strong>2007</strong> Group internal Real Estate (Group internal) External discretionary Mutual funds
<strong>Storebrand</strong> GroupGroup profit of NOK 2,020 millionFollowing the acquisition of SPP, the Swedish life insurance and pensions provider,<strong>Storebrand</strong> is now a leading provider of long-term savings and insurancein the Nordic market. The group consists of life insurance in Norway and Sweden,and property and casualty insurance, asset management and banking inNorway. <strong>Storebrand</strong> offers a comprehensive range of products to private individuals,companies, municipalities and the public sector.<strong>Storebrand</strong> can trace its history back to 1767. <strong>Storebrand</strong> has providedoccupational pensions to Norwegian employees since 1917, the sameyear SPP was established in Sweden. <strong>Storebrand</strong> Bank opened forbusiness in 1996, and in 2006 the group relaunched its property andcasualty insurance business as part of a comprehensive range ofservices for retail market customers.At the close of <strong>2007</strong>, the <strong>Storebrand</strong> group had 2,219 employeescompared with 1,455 at the start of the year. 600 of these areemployed in SPP.The average <strong>Storebrand</strong> employee is 42 years old and has worked forus for 10 years. The group employs virtually equal numbers of menand women.Corporate responsibility is an integral part of the group’s activities,and all assets and pension portfolios managed by <strong>Storebrand</strong> aresubject to strict ethical criteria. The group’s corporate responsibilitywork is based on a dedicated action plan.<strong>Storebrand</strong> strives for diversity. All <strong>Storebrand</strong> employees are treatedequally, regardless of gender, age, disability, religious beliefs, culturaldifferences or sexual orientation.Key figures <strong>2007</strong> 2006 2005Group profit (NOK million) 2 020 1 585 1 455<strong>Storebrand</strong> share (NOK):Closing price at 31.12. 56.7 79.3 58.25Market cap at 31.12. (NOK million) 25 510 19 811 15 059Dividend for the accounting year 1.20 1 1.8 4Earnings per ordinary share 7.95 6.03 5.41Total shareholder return (%) -13 44 131 The dividend is equivalent to NOK 2.18 per share in relation to the total number ofshares prior to the issue.More legs to stand on with SPPInsurance reserves by product (%)Combined525391413739536(NOK 165 bn) (NOK 102 bn) (NOK 267 bn) Defined benefit Defined contribution Unit linked<strong>Annual</strong> <strong>Report</strong> <strong>2007</strong>5
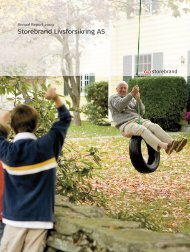
From Norwegianto NordicWith the acquisition of SPP, <strong>Storebrand</strong> has gone from being second largest inNorway to being number one in the Nordic region within the core area of lifeinsurance and pensions. In addition, we are building a solid platform for futuregrowth and development. The acquisition of SPP also indicates that we aremoving from national markets to a common Nordic domestic market within lifeinsurance and pensions.<strong>2007</strong> was a strong year for <strong>Storebrand</strong>. Theresults were satisfying, with a profit for theyear of NOK 2,020 million and a return onequity of 24 per cent. <strong>Storebrand</strong>’s competitivenessalso improved during the year. <strong>2007</strong>saw a net notified inflow of pension reservesof NOK 4.1 billion to <strong>Storebrand</strong> Life Insurance.The number of corporate customersincreased by 1,650 to 22,725.The asset management business increasedthe amount of assets under managementfrom NOK 217 billion to NOK 227 billion, thegroup has gained 9,155 new active retailbanking customers, and during the year itgained 13,8947 new P&C insurance customers.The number of customers with three ormore products in <strong>Storebrand</strong> has quadrupledfrom 2006 to <strong>2007</strong>.Major projects have been completed asplanned. Our extensive project in connectionwith the new life insurance act was deliveredas intended. The <strong>Storebrand</strong> Competitivenessproject has covered 43 departments through21 projects and realised productivity gainsof 24 per cent. The group’s most importantdevelopment goal is satisfied customers andonce again <strong>Storebrand</strong> has the market’s mostcontent occupational pension customers.Establishing accounts for and servicing themore than 16,000 corporate customers weacquired through the mandatory occupationalpension schemes has also been successful,as evident by <strong>Storebrand</strong>’s number oneranking in customer satisfaction surveys inthis market as well.At the same time, our role as a sociallyresponsible player was confirmed by <strong>Storebrand</strong>being named on the World EconomicForum’s list of the 100 most sustainable companiesin the world in <strong>2007</strong>, for the secondyear in a row.The SPP acquisition creates a significant basisfor synergies and increased value creation.The integration work is well underway,and the announced objectives of increasedearnings, lower cost consumption, and betterutilisation of the group’s total capitalhave been confirmed. At the same time, theexpansion of the group intensifies the needfor operational efficiency and coordinationacross the companies and departments. Theongoing <strong>Storebrand</strong> Competitiveness projecthas already been initiated in SPP. The goal of20 per cent increased productivity in all of theimportant processes in the group remains.SPP supplies <strong>Storebrand</strong> with 33 130 newcorporate customers and 553 500 retail customers.The total premium volume increasesby 44 per cent and total assets undermanagement grows by 73 per cent to NOK329 billion. We are acquiring a company thatis highly competent, has long traditions andis a well-embedded brand in its core market.Sweden is without doubt the Nordic region’slargest market for occupational pensions.The acquisition of SPP will establish theNordic region’s leading expert group withinthe field of pensions. We are creating newcareer and development opportunities foremployees on both sides of the borderand improving our ability to attract newemployees. <strong>Storebrand</strong>’s objective is to be aleader in occupational pensions and reinforcethe resources it allocates to innovation andthe development of the next generation ofproduct and service solutions.The <strong>Storebrand</strong> brand is built through theinteraction between our employees and ourcustomers. Motivated employees, who enjoytheir jobs and possess the right competence,form the core of our competitiveness. Weplan to continuously attract, develop andretain the right employees through our managementdevelopment programmes and ourfocus on competence development. Competence,the ability to innovate and a high levelof customer satisfaction are fundamental toour future growth and profitability.Idar Kreutzer, <strong>Storebrand</strong> Group CEO6 <strong>Annual</strong> <strong>Report</strong> <strong>2007</strong>
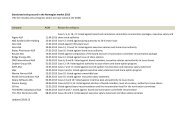
NOK 4.1billion<strong>Storebrand</strong> was the winnerin the transfer marketfor occupational pensionschemes in <strong>2007</strong>.The net inflow amounted toNOK 4.1 billion.Vision:<strong>Storebrand</strong>´s objectiveis to be the leadingand most respectedinstitution in the Nordicmarket for long-termsavings and insuranceCore values:ReliableEnablingEasy to relate toForward looking<strong>Annual</strong> <strong>Report</strong> <strong>2007</strong>7
Oslo 1947. Callisthenics at workCallisthenics have been part of the working dayin <strong>Storebrand</strong> ever since 1944. The photo shows<strong>Storebrand</strong>’s typists exercising to gramophonemusic. Photo: Aktuell / ScanpixHistory of <strong>Storebrand</strong>1767–1919: Roots• 1767In 1767, Den almindelige Brand-Forsikrings-Anstalt is established in Copenhagen toadminister the compulsory fire insurancescheme for properties in Norwegian towns.• 1814Following the split from Denmark, managementof the fire insurance scheme istransferred to Christiania, as the capitalof Norway was known at that time. Thescheme is later converted in 1913 intoa public sector company called NorgesBrannkasse.• 1847On 4 May 1847, the P&C insurance companyChristiania Almindelige Brandforsikrings-Selskab for Varer og Effecter is incorporatedby private subscription. The company sooncame to be known as just <strong>Storebrand</strong>.• 1861<strong>Storebrand</strong>’s owners establish Idun, thefirst privately owned life insurance companyin Norway.• 1867The P&C insurance company Norden is establishedas a competitor to <strong>Storebrand</strong>.• 1917Seven existing life insurance companiesjointly establish Norske Folk as a life insurancecompany. Idun is one of the initiative takers.1920–1969:Growth and consolidation• 1923<strong>Storebrand</strong> acquires nearly all of theshares in Idun. The rest, with a couple ofexceptions, are acquired during the 1970s.• 1925<strong>Storebrand</strong> changes its legal name fromChristiania Almindelige Forsikrings-Aksjeselskap(renamed in 1915) to ChristianiaAlmindelige Forsikrings-Aksjeselskap <strong>Storebrand</strong>.This name is kept until 1971.• 1936<strong>Storebrand</strong> acquires Europeiske – theleading travel insurance company inNorway.• 1962<strong>Storebrand</strong> initiates a new wave ofacquisitions and mergers by acquiringNorrøna, which was experiencing financialproblems.• 1963<strong>Storebrand</strong> and Idun are the first insurancecompanies to move into their newpremises in the restored Vest-Vika. Later,Brage-Fram and Norske Folk follow theirlead and move into the district furtherdown the road.<strong>Storebrand</strong> acquires Norske Fortuna.Brage and Fram merge to become Brage-Fram Livs og Pensjonsforsikring A/S andbecomes the country’s largest life insurancecompany.1970–1989: Group formation• 1978<strong>Storebrand</strong> bids farewell to its old logo –the stylised St. Hallvard, patron saint ofOslo – and introduces «the link» as aneasily recognisable trademark. The formalname of the holding company is changed toA/S <strong>Storebrand</strong>-gruppen.• 1982The Norden Group and <strong>Storebrand</strong> agreeto merge with effect from 1983.• 1984Norske Folk and Norges Brannkasse marketthemselves as a single entity underthe name UNI Forsikring.1990–1999: Crisis and change• 1990<strong>Storebrand</strong> and UNI Forsikring agree tomerge, and the merger receives regulatoryapproval in January 1991.• 1992UNI <strong>Storebrand</strong>’s negotiations withSkandia on establishing a major Norwegian-led,Nordic company fail to reachagreement.• 1996The company changes its name to <strong>Storebrand</strong>ASA and establishes <strong>Storebrand</strong>Bank AS.• 1998The company moves into new premiseson Filipstad Brygge.• 1999<strong>Storebrand</strong>, Skandia and Pohjola consolidatetheir P&C insurance activities in thenew Nordic, Swedish registered, company,If Skadeförsäkring AB. <strong>Storebrand</strong> sells itsstake five years later.2000–<strong>2007</strong>: New challenges• 2001Norwegian and international stock marketsfall sharply from September 2000 toFebruary 2003.• 2005The Storting, the Norwegian parliament,rules that all companies must have anoccupational pension scheme in place by<strong>2007</strong>. <strong>Storebrand</strong> responds to the challengewith its new product, <strong>Storebrand</strong>Folkepensjon.• 2006<strong>Storebrand</strong> decides to return to P&Cinsurance.• <strong>2007</strong><strong>Storebrand</strong> acquires SPP, the Swedish lifeinsurance and pensions provider, fromHandelsbanken and becomes the leadinglife insurance and pensions provider inthe Nordic region.8 <strong>Annual</strong> <strong>Report</strong> <strong>2007</strong>
Key figuresOperating profitNOK millionGroup profitNOK million6 0003 0005 5005 0004 5004 0003 5004 5514 7405 5494 8032 5002 0002 5552 0203 0002 5002 7111 5001 4531 5852 0001 0001 5008941 000500500002003 2004 2005 2006 <strong>2007</strong>2003 2004 2005 2006 <strong>2007</strong>Total AssetsNOK millionEquity capitalNOK million400 00020 000350 000381 74917 50019 241300 00015 000250 00012 500200 000150 000156 650177 099201 885222 78710 0007 5009 39610 1789 1088 900100 0005 00050 0002 500002003 2004 2005 2006 <strong>2007</strong>2003 2004 2005 2006 <strong>2007</strong>Key figures for the <strong>Storebrand</strong> groupNOK million <strong>2007</strong> 2006 2005 2004 2003Operating profit 4 803 5 549 4 740 4 551 2 711Group profit 2 020 1 585 1 453 2 555 894Total assets 381 749 222 787 201 885 177 099 156 650Equity capital 19 241 8 900 9 108 10 178 9 396No. of employees (full time equivalents) 2 151 1 429 1 295 1 224 1 263Capital ratio (%) 9.2% 10.6% 11.2% 15.3% 14.9%Figures for 2003 are historic NGAAP figures, while the figures for 2004–<strong>2007</strong> are prepared in accordance with IFRS.Key figures per shareAverage number of ordinary shares (1,000) 1 251 517 247 965 258 576 272 933 277 927Earnings per ordinary share 2 (NOK) 7.95 6.03 5.41 8.53 2.67Dividend per ordinary share (NOK) 1.20 3 1.80 4.00 7.00 0.801 Calculation is based on average number of shares outstanding.2 Calculation is based on profit for the year adjusted for the year’s legally required post-tax allocations to security reserves etc. for P&C insurance and the share of profit due to minorityinterests.3 In terms of the number of shares before the share issue, the dividend is equivalent to NOK 2.18 per share.<strong>Annual</strong> <strong>Report</strong> <strong>2007</strong>9
SPP acquisitionstarts a new erafor <strong>Storebrand</strong>On 3 September <strong>2007</strong>, <strong>Storebrand</strong> entered into an agreement with Handelsbankenfor the acquisition of SPP and related companies, including the assetmanagement business of SPP Fonder. The transaction was closed 21 December<strong>2007</strong>. SPP is a leading Swedish life insurance and occupational pension provider.SPP provides unit linked products, traditionalinsurance and defined benefit products aswell as consulting services covering occupationalpensions, and insurance and administrativesolutions for municipalities and otherorganisations.Clear trend for consolidation withinlife insurance and pensions market<strong>Storebrand</strong> sees the following industry trendswithin the life insurance and pensions marketin the Nordic region:• the development of more harmonised regulatoryregimes and similar products acrossthe Nordic region, as well as Europe, whichmakes cross-country synergies more visibleand easier to realise, especially within thegrowing markets for defined contributionand unit linked pension products;• the advantages of long-term economicsof scale within IT, underwriting, administration,product development and assetmanagement;• the advantages of revenue synergies fromusing the best product, personnel andprocesses from a combined entity;• the advantages of capital synergies arisingfrom geographic diversification of theportfolio, which is encouraged in SolvencyII; and• the enhanced strategic and financialflexibility resulting from larger marketcapitalisation.<strong>Storebrand</strong>’s acquisition of SPP has createdthe leading Nordic life insurance and pensionprovider and a strong platform for futuregrowth. <strong>Storebrand</strong> and SPP combined is aleading participant in the Nordic occupationalpensions market, building on the skill sets,experience, market position and productofferings of both businesses. The enlargedgroup will have a strong dual-home marketstructure evidenced by a 10 per cent marketshare in Sweden 1 and a 31 per cent marketshare in Norway for occupational pensionfunds under management as of 31 December<strong>2007</strong>. The combined entity is well positionedto participate in the further consolidation ofthe fast-growing Nordic life insurance andpensions sector.Expansion into a highly attractivegrowth market in SwedenThe Nordic life insurance and pension markethas historically enjoyed high growth with agrowth rate for total premium income of 8per cent 2 over the last 10 years (1997–2006),and 10 per cent within the occupational pensionsegment.The Swedish life insurance market has agrowth rate for total premium income of 9per cent over the last 20 years 3 .The growthwithin the occupational pensions segmenthas been even higher, with 13 per cent averageannual premium income growth between1998 and <strong>2007</strong> 4 . The total competitive marketin <strong>2007</strong> is estimated at SEK 139 billion (NOK10 <strong>Annual</strong> <strong>Report</strong> <strong>2007</strong>
<strong>Storebrand</strong> and SPP is a good strategicfit and provides advantages to bothcustomers and shareholders.Göran Holgerson (executive vicepresident, SPP) and Idar Kreutzer(CEO).Nordic Occupational Pensions is a Fast Growing MarketNordic Occupational Nordic Pensions Occupational is a Fast Pensions Growing is Market a Fast Growing MarketMarket volumetotal/occupational Market volume pensions Market (€bn), 2006 volumetotal/occupational 7/5 pensions 14/7 total/occupational (€bn), 2006 12/10pensions 3/0.4 (€bn), 20067/5 14/7 7/5 12/10 14/73/0.412/10 3/0.4Norway Sweden Denmark FinlandSwedish life insurance premiumsSEK Swedish billionsNorway Sweden Norway DenmarkSweden FinlandDenmark Finland life insurance Swedish premiums life insurance premiums200 SEK billionsSEK billions200200GrowthOccupational Pension175all Growth life:% Occupational CAGR 1997–<strong>2007</strong>GrowthPension Occupational Pension175all life:% CAGR 1997–<strong>2007</strong>175all life:14% CAGR 1997–<strong>2007</strong>8% CAGR14141508% CAGR8% CAGR12150129 15013 13121212512912913 13 13 1362101251256262101010098100910098875 65675 65 75 656637Growth occupational450 37Growth 37 pension: occupational Growth occupational45067450pension:pension:67 10% CAGR 6722522810% CAGR 10% CAGR22252522 2828000Norway 1 Sweden0 2 Denmark 3 Finland 30 1997 2006 0Norway 1 Sweden 2 Norway Denmark 1 Sweden 3 Finland 2 3 Denmark 3 Finland 1997 3 2006 1997 2006 Occupational pensions Other life Source: National Insurance associations Occupational pensions Occupational Other life pensions insurance Other life insurance1 Source: CAGR = National Gjennomsnittlig Insurance årlig Source: associations vekstrate National 2 Insurance CAGR for associations 1997-2005 på grunn av manglende data for 20061 CAGR = Gjennomsnittlig 1 årlig CAGR vekstrate = Gjennomsnittlig 2 CAGR årlig for 1997-2005 vekstrate på 2 grunn CAGR av for manglende 1997-2005 data på grunn for 2006 av manglende data for 2006CAGR- Compounded <strong>Annual</strong>Growth Rate1 <strong>2007</strong> figures for Norwayare preliminary2 <strong>2007</strong> growth figures areestimates based on quarterlystatistics from the SwedishInsurance Federation3 CAGR 1997–2006Source: National insuranceassociations<strong>Annual</strong> <strong>Report</strong> <strong>2007</strong>11
117 billion) based on premium income 5 . Thekey drivers behind this growth have been,among others, demographic changes, growthin employment, changes in the regulatoryframework and high wage growth.The main segments of the competitiveSwedish life insurance market are the tickthe-boxoccupational pensions market, theconventional occupational pensions market,and the private life insurance market, with ashare of the overall market of 20 per cent, 37per cent and 43 per cent respectively in <strong>2007</strong>(based on premium income in the competitivemarket and excluding capital insurancesolutions 6 ). The tick-the-box occupationalpension market consists of all companieswhich have a collective agreement with thetrade unions. The trade unions enter intoframe contracts with selected life insurancecompanies. These frame contracts restrictthe number of products that are availablefor each employee to choose from. Eachemployee selects the desired level of lifeinsurance coverage by ticking appropriateboxes on a form that is received either bymail or online. The conventional occupationalpensions market consists of companiesthat are not part of collective agreementswith the trade unions. In this market, eachcompany selects their own life insuranceproviders (life insurance companies or brokers),from which its employees select lifeinsurance products. The private life insurancemarket is made up of individuals that investin life insurance products above the levelsprovided by their employers.The occupational pensions market is likely toform an increasing share of the total Swedishlife insurance market. Occupational pensionshave seen more stable growth than other lifeinsurance segments, which have shown greatersensitivity to financial markets, tax legislationand other factors. In addition, the increasedsize of the unfunded Swedish municipalitiesmarket (estimated at SEK 300 billion 7 (NOK 252billion)) is a potential for further growth. Furthermore,the Swedish occupational pensionsmarket has evolved in recent years and becomeincreasingly complex. The <strong>Storebrand</strong> Group’s,including SPP, experience, scale and competencein all aspects of the Swedish insuranceindustry is expected to provide the basis forincreased market shares for SPP.As in most other countries, unit linkedproducts’ relative share of the market isexpected to increase at the expense of traditionalguaranteed life and pension products.Furthermore, the relative market share ofdefined contribution products is expected toincrease, while the relative share of definedbenefit products is expected to be reduced.Good strategic fit between<strong>Storebrand</strong> and SPPThe acquisition provides an opportunity tocapitalise on the complementary skills andexperience of the two groups.• <strong>Storebrand</strong> will use its experience in managingbroker relationships to significantlystrengthen SPP’s distribution capabilities inthe Swedish market.• <strong>Storebrand</strong>’s more than 15 years of experiencein the competitive pensions transfermarket in Norway will assist SPP when theSwedish market opens up for transfers of occupationalpensions (expected in May 2008).• SPP’s unit linked product scale and skillswill help <strong>Storebrand</strong> to further capitaliseon the shift in the Norwegian market fromtraditional life insurance products to unitlinkedproducts.• Develop SPP’s strong brand to expand itsasset management business.• Optimise SPP’s risk management and asset/liability management policies to improve returnsto customers and owners, and lowerasset management expenses.The history of the two companies is similarand both are significant participants in theirdomestic markets for occupational pensions.<strong>Storebrand</strong> and SPP have co-operated witheach other previously when founding Eurobenand were co-owners of Nordben. <strong>Storebrand</strong>expects the similarities between the two businessesto result in a smooth integration.The integration process has revealed that theinitial synergies from the acquisition wereconservatively estimated. <strong>Storebrand</strong> has thusannounced the following adjusted synergiesresulting from the transaction:• Cost synergies: Cost synergies are expectedto amount to approximately NOK150 million pre-tax per annum and areexpected to be phased in 35 per cent in2008, 75 per cent in 2009 and to take fulleffect in 2010.Good Strategic FitInsurance reserves by product (%)5952536(NOK 165 bn) (NOK 102 bn) (NOK 267 bn)• Defined benefit• Defined contributionCombined• Unit linked• Investment management synergies:<strong>Storebrand</strong> expects the integration ofSPP into its asset and liability managementprocesses and principles to increaseinvestment returns and improve results tothe owner by more than NOK 100 millionper annum.• Revenue synergies: <strong>Storebrand</strong> expectsto grow SPP’s revenue base to generatein excess of NOK 100 million in additionalnew business profit by 2010.• Tax benefits: Based on current tax legislation,<strong>Storebrand</strong> expects to extractapproximately NOK 120 million in tax synergiesper annum. The tax synergies areexpected to have full effect from 2008.• Distribution synergies: The relationshipwith Handelsbanken, an importantdistributor of <strong>Storebrand</strong>’s health insuranceproducts in the Swedish market, isexpected to be further strengthened bythe transaction.• Diversification benefits: the acquisition isalso expected to provide capital synergiesthrough diversification benefits. Theimportance of diversification benefits isfurther increased by the Solvency II regulatoryrequirements, which are currently beingprepared by the European Union and39Insurance reserves by country (%)3862• Norway141373• Sweden12 <strong>Annual</strong> <strong>Report</strong> <strong>2007</strong>
which are expected to be adopted by theEU in 2012 at the earliest.SPP Business DescriptionSPP is a leading Swedish life insurance andpension provider with a 10.1 per cent marketshare in the competitive Swedish occupationalpensions market in <strong>2007</strong>. SPP has a leadingposition in the conventional occupationalpension segment with a 12.6 per cent marketshare and in the tick-the-box market with a6.3 per cent market share. In addition, SPPhas a 3.5 per cent market share in the privatepension segment. Based on new sales ofoccupational pensions, the SPP Business hada market share in the Swedish occupationalpensions market of 12.7 per cent for <strong>2007</strong>.SPP also provides advanced consulting servicescovering occupational pensions, as wellas insurance and administrative solutionsfor municipalities and organisations. Salesmainly occur via SPP’s internal sales team,insurance agents and direct marketing.SPP was demutualised on 1 January 2006.The profit-sharing between SPP and thepolicyholders with respect to traditionallife insurance is stipulated in a well-definedmodel whereby SPP receives 10 per centof the return on the policyholders’ assets,subject to returns exceeding the guaranteedlevel. The administration and risk results arenot subject to profit-sharing and are fully atthe risk and benefit of the company.SPP is the only company represented withinall products and service areas in the Swedishmarket with both unit linked, traditionalinsurance with guaranteed interest rate, anddefined benefit products. SPP’s key productsare defined contribution pensions, definedbenefit pensions, unit linked pensions andoccupational health insurance products (disabilityinsurance).SPP has a strong brand and customer franchisein Sweden. SPP also has long-standingrelationships with unions, particularly whitecollar unions, and employer organisationssuch as Svenskt Näringsliv. Furthermore, SPPhas a strong position in fee-driven business,in particular pensions consulting andadministration and specialised products (forexample for top management and expatriates).As at 31 December <strong>2007</strong>, the SPP Businesshad AuM of SEK 152 billion (NOK 128 billion),of which SEK 93 billion (NOK 78 billion) weretraditional life assets, SEK 31 billion (NOK 26billion) were unit linked assets and SEK 28billion (NOK 24 billion) were in PPM (premiumpension) and other mutual funds (excludingunit linked). PPM is part of the Swedishpublic old-age pension system.SPP is Uniquely Positioned in the Swedish Occupational Pensions MarketSPPPension plans for expatriates, consulting andadministrative servicesSPPSkandia,AlectaDefined benefit plansSPPAMF, Folksam, LF,SEB, Skandia etcSolutions with guaranteed interest rate(traditional insurance)SPPDanica, AMF, Folksam,LF, SEB, Skandia etcUnit linked1 Source: Handelsbanken/SPP based on statistics from Sveriges Försäkringsförbund (The Swedish Insurance Federation).2 Compound average annual3 Source: Handelsbanken/SPP based on statistics from Svenska Försäkringsföreningen (The Swedish Insurance Association). Compound average annual4 <strong>2007</strong> growth figures are estimates based on quarterly statistics from Sveriges Försäkringsförbund (The Swedish Insurance Association).5 Source: Handelsbanken/SPP based on statistics from Sveriges Försäkringsförbund (The Swedish Insurance Federation).6 Source: Handelsbanken/SPP based on statistics from Sveriges Försäkringsförbund (The Swedish Insurance Federation).7 Source: Handelsbanken/SPP based on statistics from Sveriges Konmuner och Landsting.8 Source for market shares in this paragraph: Handelsbanken/SPP based on statistics from Sveriges Försäkringsförbund (The Swedish Insurance Federation).<strong>Annual</strong> <strong>Report</strong> <strong>2007</strong>13
CorporateresponsibilityWe believe that industry winners in the future willbe businesses that develop products and services ina way which unites global, social and environmentalchallenges with profitable growth. Our most importantcontribution to resolving society's challengesmust therefore come through our core activities.This year’s corporate responsibility articlecovers some of the highlights of <strong>2007</strong> as wellas our primary focus areas for 2008. For morecomprehensive information please see thegroup’s <strong>2007</strong>-2008 Corporate Responsibility<strong>Report</strong>, available on: www.storebrand.com.Corporate responsibility in SPPWhen <strong>Storebrand</strong> acquired SPP, the Swedishlife insurance and pensions provider, itadjusted its vision: <strong>Storebrand</strong> shall be theleading and most respected institution inthe Nordic market for long-term savings andinsurance.During 2008, we will systematically integratethe work on corporate responsibility in SPPby continuing to build on existing measuresand by implementing <strong>Storebrand</strong>’s standardsin SPP. We are already implementing ourgroup standard on responsible investmentsfor the administration of SPP’s assets.Organising Corporate Responsibility<strong>Storebrand</strong>’s focus on corporate responsibilityhas been further strengthened now thatthis area is directly represented in the executivemanagement. This will enable the ExecutiveVice President, Corporate Responsibility,to contribute to all important discussions inthe group. It signals increased strategic focusand strengthens the basis for further work inthis area.Responsible investments<strong>Storebrand</strong> started its work on responsibleinvestments in 1995. We are now one ofthe leading companies globally in this area.A separate department monitors all <strong>Storebrand</strong>’sinvestments focusing on areas suchas environmental degradation, corruption,labour and human rights, and weapons.All our funds and pension portfolios are subjectto comprehensive corporate responsibilitycriteria. We call these our group standardfor responsible investments (see figure nextpage). As of 1 January 2008, 91 companieswere excluded for unacceptable activitiesor engagements, or contributing to unacceptableactivities, in relation to the groupstandard. The objective is not to excludecompanies, but to promote more sustainablebusiness practices. In our experience, thereturn on investments has not been negativelyaffected by the restrictions concerninginvestment options to which our portfoliomanagers are subject.Microfinance involves providing financialservices to people who would not normallyhave access to bank savings, credit andinsurance. This has proved to be an effectivemeans of reducing poverty. <strong>Storebrand</strong> firstgot involved in microfinancing in 2005, andduring <strong>2007</strong> increased its investments fromUSD 9 million to USD 15 million. We have also14 <strong>Annual</strong> <strong>Report</strong> <strong>2007</strong>
<strong>Storebrand</strong> Group Standardon Responsible InvestmentsEnvironmentaldegradation(1)Labour rightsand humanrights(6)Corruption(10)Tobacco(11)10% worstperformers inhigh riskindustries(48)Landmines(2)Cluster munitions(8)Nuclear weapons(11)A total of 91 companies are excludedfrom all <strong>Storebrand</strong> funds andpension portfolios as of 1 January2008. The number of companiesexcluded is stated in brackets.Some companies are excluded inmore than one area.expanded the investment scope for this typeof investments from NOK 100 million to NOK500 million.In November <strong>2007</strong>, we launched a new ethicalhedge fund in partnership with the Swedishcompany Folksam and the Swiss companyHarcourt – Belair Sustainable Alternatives SRIFund. The fund meets strict ethical criteriaand our hope is that it will place corporateresponsibility even higher up on the agendawithin the area of hedge funds.Diversity<strong>Storebrand</strong> wants to recruit more peoplefrom groups that are underrepresented inthe labour market, including the disabledand people with diverse ethnic backgrounds.As a responsible and inclusive company, wehave therefore established a Diversity Committee.This systematic work on diversity isintended to ensure the company can reachnew customer groups and provide a betterservice to a steadily more diverse population.The committee will also continue our work ongender equality.New Health and Safety concept<strong>Storebrand</strong> wants to motivate and inspire itscustomers and employees to create healthpromoting and inclusive workplaces. If we,together with many of our customers, worktowards the same goal this will help reducesick leave, fewer people will be occupationallydisabled, and the average age of retirementmay increase. Fewer people will be on statebenefits, value creation in society will increase,and social costs may fall significantly.Good health and safety in the workingenvironment (HSE) is also profitable for ourcustomers, who will experience more satisfiedemployees, increased productivity andlower sick leave costs.<strong>Annual</strong> <strong>Report</strong> <strong>2007</strong>15
We measure our performance by Status 2006 Status <strong>2007</strong> Target 2008Shareholders Return on capital employed (annualised) 19% 24% 15%Percentage of post-tax group profit distributed as dividend 29.3% 27% > 30%Sound capital adequacy (<strong>Storebrand</strong> Bank) 11% 10.5% > 10%<strong>Storebrand</strong> Life Insurance solvency margin 174.6% 136% > 150%Dow Jones Sustainability Index and FTSE4Good Included Included IncludedCustomers Percentage of problem-free customer enquiries via internet 1 97% 98.2% 98%Proportion of tel. calls answered within 20 sec. (customer centre) 81% 73% 80%Proportion of tel. calls answered within 20 sec. (main switchboard) 91% 91% 90%Customer satisfaction - corporate market No. 1 in the sector No. 1 in the sector No. 1 in the sectorCustomer satisfaction - retail market 64 65 66Time taken to process complaints - 65% within 3 weeks 70% within 3 weeks 2<strong>Storebrand</strong> Life Insurance’s position within responsible investmentsAmong the globalleadersAmong the globalleaders1 Measures availability of customer/employee portal between 07:00 and 01:00.2 The target was new in 2006 and has been adjusted because it proved unrealistic and inappropriate to deal with all complaints within 3 weeks.3 Return compared to the Morgan Stanley Capital International World Index, annualised, last 5 years.4 The goal is reduced from 80% to 70% as this is deemed more realistic.5 The survey is only conducted every other year.6 Includes both self-certified and doctor-certified sick leave.7 Long-term target of 4% is maintained, but with an interim 2-year target of 4.8%.8 Only applies to properties with EOS (energy monitoring system, 14 of 19 properties).9 There are some uncertainties linked to this number as it is the first time <strong>Storebrand</strong> reports on air travel10 There are some uncertainties linked to this number as it is the first time <strong>Storebrand</strong> estimates our carbon footprintAmong the globalleadersInvestment return from <strong>Storebrand</strong> Global SRI relative to benchmark index 3 0.07% -6.4% Better than benchmarkindexInvestment in microfinance USD 9 million USD 15 million Increase, givensensible investmentopportunitiesCorporate responsibility criteria for P&C insurance - Started CompleteEmployees Percentage of management positions held by women 38% 37% 40%Male/female participation in management development programmes 52/48% 43/57% Within 40/60%Percentage of employees satisfied with personal development opportunities - 60% 70% 4Employee satisfaction among senior employees 80% - 5 90%Illness absence as an average annual percentage 6 5.1% 4.6% Max 4.8% (4%) 7Percentage of employees agreeing that <strong>Storebrand</strong> is a «great place to work» 90% 90% 85%Percentage of employees aware of what the ethical guidelines mean for 88% 86% 100%their everyday dutiesPercentage of employees who understand/are aware of <strong>Storebrand</strong>’s 75% 79% 80%corporate responsibilityAnti-corruption policy - Work started Developed and implementationstartedCode of conduct - Work started Developed and implementationstartedSuppliers Purchasing policy - Work started ImplementSociety asa wholeEnvironmentalissuesFinancial support for charitable organisations and other measures for NOK 3.35 million NOK 3.35 million Stablesociety as a wholeCharity partners’ satisfaction with <strong>Storebrand</strong> 85% Not measured 80%International collaboration: Membership of WBCSD, UNEP, GlobalCompact and TIMember Member MemberEnergy consumption (head office) Reduced by 14% Reduced by 15.8% Reduce by 5%Energy consumption (managed properties) Reduced by 9% Reduced by 0.1% Reduce by 5%Waste sorted by type (head office) 52% 55% 60%Waste sorted by type (tenants of managed properties 8 ) 40% 42% 50%Paper consumption (head office) 61 tonn 73.2 tonn Reduce by 10%Water consumption (head office) 27 618 m 3 26,766 m 3 Stable levelWater consumption (managed properties) 95 461 m 3 94,957 m 3 Monitor consumptionProportion of electronic equipment recycled or reused 100% 100% 100%«Living forest» certification for Værdalsbruket Certified Certified CertifiedAir travel - 13 729 one-way Measureflights 9Direct CO2 emissions (tonnes) - 3 800 tonnes 10 Measure16 <strong>Annual</strong> <strong>Report</strong> <strong>2007</strong>
In the autumn of 2005, we launched a HSEproduct for our corporate customers in theprivate and public sectors. In order to reachmore customers we developed our HSE provisionin <strong>2007</strong> to also include network groupsand experience sharing conferences, as wellas seminars and consulting services. We havealso commenced a HSE partnership withthe Confederation of Norwegian Enterprise(NHO).Best reporting on corporate governanceThe Norwegian Corporate Governance Board(NUES) presented <strong>Storebrand</strong> with the awardfor best reporting on corporate governancefor its 2006 <strong>Annual</strong> <strong>Report</strong>. <strong>Storebrand</strong> hasbeen a driving force behind the developmentof the corporate governance principles thatapply to Norwegian companies.The Norwegian Cancer Society – ournew principal partnerWorking with non-profit organisations hasbeen a mainstay of <strong>Storebrand</strong>’s sponsorshipstrategy for many years. During <strong>2007</strong>, we arrangedmany joint events with the NorwegianRed Cross and MOT. At the beginning of2008, we started a new principal partnershipwith the Norwegian Cancer Society. Thepartnership agreement aims to help preventcancer, primarily with respect to <strong>Storebrand</strong>’scustomers and employees. Through this partnership,we also want to offer informationand support to customers and employeeswho have cancer.A Christmas gift with a differenceOne very visible social initiative in <strong>2007</strong> wasthe Christmas gift <strong>Storebrand</strong> gave to fournon-profit organisations. An internal surveyrevealed that 70 per cent of our employeeswanted to give the money spent onChristmas gifts to good causes rather thanreceive a gift from the group themselves.The recipients of the gifts were the NorwegianCancer Society, the Church City Mission,the Salvation Army and the Norwegian RedCross. The organisations presented specificprojects they wanted support for during theChristmas season. All of the employees hadan opportunity to decide which organisationthey wanted to support. NOK 300,000 wasthus distributed to the organisations basedon the percentage of people who nominatedeach organisation.Increased climate focus<strong>2007</strong> was a year in which people focused onthe climate and the environment, as was thecase in <strong>Storebrand</strong>. As well as systematicallyworking to achieve the environmental targetswe have set for ourselves, including energy,paper and water consumption, waste sortingand recycling, we took new steps to reducethe burden our business operations place onthe environment.Environmental classification of carsIn June, we developed and launched, inpartnership with the environmental foundationGRIP, a unique environmental and safetyclassification system for all types of cars.<strong>Storebrand</strong> is thus the first company in Norwayto apply the EU environmental standardsfor the classification of cars. Consumers cantest their own cars on www.storebrand.no.Here they will automatically be told the environmentaland safety classification, at thesame time as they calculate their insurancepremium.First climate neutral financialinstitution<strong>Storebrand</strong> also signed up to the NorwegianClimate Campaign in <strong>2007</strong> – an actionprogramme for business organised by theNorwegian Ministry of the Environment. Wehave thus committed ourselves to estimatingour carbon footprint and to implement measures,and in the next phase wholly or partlycompensate for our own emissions throughthe voluntary purchase of climate quotas.Since the middle of the 1990s, we have donea lot as far as measures are concerned, bothinternally and in relation to establishing environmentalcriteria for our suppliers and thecompanies in which we invest. We have nowalso started drawing up our carbon footprintfor the company. Our first estimated footprintis based on energy consumption in all ofour offices, all the business flights we make,as well as company cars and travel allowances.We have also decided to purchase UNcertified climate quotas (certified emissionsreductions – CER) equivalent to our directemissions as early as from 2008, whichmakes <strong>Storebrand</strong> the first climate neutralfinancial institution in the Nordic region (seefact box).<strong>Storebrand</strong>'squota purchase:Wind power in India<strong>Storebrand</strong> has purchased UNcertified carbon emission creditsfrom a wind power project in Sataraand Supa in the Indian state ofMaharashtra in order to becomeclimate neutral.The project consists of windmillsconnected to an electricity supplygrid that supplies the state withrenewable electricity, which in turnreduces the need for fossil fuels.The project thus helps to reduceemissions of climate gases.The Norwegian Climate Campaign<strong>Annual</strong> <strong>Report</strong> <strong>2007</strong>17
<strong>Report</strong> of the Board of DirectorsMain featuresThe <strong>Storebrand</strong> group is made up of four business areas: life insurance,P&C insurance, asset management and banking. The group’s headoffice is located in Oslo and a nationwide network of offices has beenestablished in Norway. It has in addition established life insurance, assetmanagement and health insurance activities in Sweden. Following theacquisition of the Swedish life insurance and pensions provider SPP inDecember <strong>2007</strong>, <strong>Storebrand</strong> is now the Nordic region’s leading providerof life insurance and pensions. <strong>Storebrand</strong> offers a comprehensive rangeof products to retail customers, corporate customers, municipalities andthe public sector.The single most important event in <strong>2007</strong> for <strong>Storebrand</strong> was the acquisitionof SPP. On 3 September, <strong>Storebrand</strong> announced that it had signedan agreement with Handelsbanken concerning the take-over of Handelsbanken’ssubsidiary, the life insurance and pensions provider SPP, aswell as associated companies, including the fund management companySPP Fonder. The acquisition was approved by an extraordinary generalmeeting on 24 October <strong>2007</strong>. The transaction was completed on 21 December<strong>2007</strong>, once all the proper approvals from the authorities were inplace. In the opinion of the Board the acquisition will result in significantfuture synergies. The trends within the Nordic and European marketsfor life and pension insurance reinforce the basis for the establishmentof cross-boarder activities. The harmonisation of general conditions andproducts make the cross-boarder synergies clearer and easier to realise.In addition, geographic diversification produces capital synergies that willbe stimulated in future capital adequacy regulations. Concrete effectshave been defined in a number of areas that entail that <strong>Storebrand</strong>and SPP can benefit from each other’s strengths and experience. Forexample, SPP will be able to draw on <strong>Storebrand</strong>’s long experience inthe pensions transfer market when the Swedish market is expected topermit the transfer of pension schemes sometime in the spring of 2008.SPP’s long experience from the provision of unit linked and mutual fundproducts in Sweden will provide <strong>Storebrand</strong> with a better insight into andability to deliver in this market. Moreover, SPP’s mutual fund productsportfolio worth more than NOK 30 billion provides the group as a wholewith a good platform for extracting economies of scale in the long-term.bought their policies online and in 2008 the company will start sellingstandardised corporate products to defined target groups.Developments in the financial markets are of great importance to <strong>Storebrand</strong>and <strong>2007</strong> was characterised by volatile stock markets. There werealso major movements in the fixed income markets in <strong>2007</strong>. In the firsthalf of the year interest rates increased, but fell in the second half ofthe year, especially in the USA. This turbulence has continued into 2008.Despite the turbulent markets, the return on <strong>Storebrand</strong>’s assets wassatisfactory: the management of <strong>Storebrand</strong> Life Insurance’s assets in<strong>2007</strong> resulted in a value-adjusted return of 7.3% and a booked investmentreturn of 8.9%.Earnings performanceThe <strong>Storebrand</strong> group produces its consolidated accounts in accordancewith the EU-approved International Financial <strong>Report</strong>ing Standards (IFRS).The accounts of the holding company, <strong>Storebrand</strong> ASA, are producedin accordance with Norwegian accounting legislation, and the companyhas elected not to apply IFRS to the holding company’s unconsolidatedaccounts. The <strong>Storebrand</strong> group reports an operating profit of NOK 4,803million for <strong>2007</strong> compared with NOK 5,549 million for 2006. Group profitbefore tax and changes to security reserves was NOK 2,020 millioncompared with NOK 1,585 million in 2006. Earnings per share, basedon the average number of shares outstanding over the year, amountedto NOK 7.95 in <strong>2007</strong> compared with NOK 6.03 in 2006. No share of theprofit from SPP has been included in the <strong>2007</strong> accounts, since SPP hadno significant effect on the profit from the transaction date up to 31December <strong>2007</strong>.Group profitNOK million <strong>2007</strong> 2006Life insurance 1 635 1 198Asset management 138 156<strong>Storebrand</strong> Bank 235 190Other activities 12 41Group profit 2 020 1 585<strong>Storebrand</strong> started selling P&C insurance one year ago and has sincethen gained more than 16,000 retail customers. 59% of the customersThe operating profit generated by <strong>Storebrand</strong> Livsforsikring AS (<strong>Storebrand</strong>Life Insurance) before distribution between customers and theowner was NOK 4,138 million compared with NOK 5,175 million in 2006.The Board of Directors of <strong>Storebrand</strong>18 <strong>Annual</strong> <strong>Report</strong> <strong>2007</strong>Leiv L. Nergaard (63), partner, Norscan Partners AS.MBA, Norwegian School of Economics and Business Administration (NHH). 1969-2006 Norsk HydroASA, including 2002-2003 CEO Norsk Hydro Deutschland, 1991-2002 CFO Norsk Hydro, 1984-1991,various management positions in finance, accounting and strategy, Norsk Hydro. 1980-1984 CEO NotoddenFabrikker. 1997- board member and later Deputy Chairman and Chairman of the Board, <strong>Storebrand</strong>ASA (Chairman of the Board from 2000). <strong>2007</strong>- Chairman of the Board, Clean Marine AS. 2004-, boardmember, Yara International ASA (Chairman of Audit Committee from <strong>2007</strong>). 2004- Chairman of theBoard, GRIP. 2003- Chairman of the Board, Joma International AS. 2003-<strong>2007</strong> board member, Tinfos AS.2004- 2008 Chairman of the Board, <strong>Storebrand</strong> Life Insurance. 1997-2006 board member, Rieber &Søn ASA (Chairman of the Board from 2000). 1996-2002 board member, Prosessindustriens Landsforening(PIL). 1995-2002 board member, NHO. 1993-1996 board member, Freia Marabou Kraft AS.1990-1996 board member, Den Norske Turistforening. 1987-1996 board member, Alcatel ASA.
The company achieved an interest result, which is the return in excessof the interest guaranteed to customers, of NOK 7,887 million comparedwith NOK 5,523 million in 2006. The administration result was lower becausethe growth in costs was higher than the growth in the administrationpremium in <strong>2007</strong>. The risk result was somewhat lower than in 2006.The risk result improved for the individual sectors overall and for corporategroup insurance, non-life products were at around the same level asin 2006, while retail group pension insurance and group life experienceda minor decline. NOK 3.3 billion was allocated to the premium reserve in<strong>2007</strong> to take account of the population’s increased life expectancy. Theprofit allocated to the owner of <strong>Storebrand</strong> Life Insurance pursuant toIFRS was NOK 1,622 million, which is an improvement of NOK 432 millionon the previous year. The profit was affected by a one-time effect of NOK215 million. The one-time effect was due to a write-back of an earlierexpense booked against equity pursuant to IFRS and linked to pensioncosts included in the allocation of profit model in the life insurancecompany. The group’s 50% interest in <strong>Storebrand</strong> Helseforsikring provideda profit of NOK 13 million, which is an improvement of NOK 7 millioncompared with 2006. The total profit for the life insurance business wasthus NOK 1,635 million in <strong>2007</strong>.<strong>Storebrand</strong> Bank Group achieved an operating profit before loan lossesof NOK 157 million in <strong>2007</strong> compared with NOK 143 million in 2006. Loanand guarantee losses and write-downs represented a net write-back ofNOK 78 million, such that the bank’s total pre-tax profit was NOK 235 million.Net interest income experienced a downward trend in <strong>2007</strong>, mainlydue to pressure on margins, credit risk and increased competition in thelending market. Net fee and commission income increased as a resultof the successful launch of new savings products. The underlying cost/income ratio experienced a positive development, driven by the bank’sefficiency measures.<strong>Storebrand</strong> Kapitalforvaltning’s (<strong>Storebrand</strong> Investments’) profit wascharacterised by high fixed and volume-based income due to the high netinflow of assets under management. Performance-based revenues werelower than in 2006 due to the weaker investment returns. The companymaintained good control over its costs throughout the year and thushas a good platform for continued profitable operations in the future. Aspreviously stated, <strong>Storebrand</strong> Investments’ goal has been to achieve acosts/income rate of less than 75%. This goal has been achieved and thecompany achieved a profit of NOK 138 million in <strong>2007</strong>.Other activities primarily consist of the P&C business and the holdingcompany <strong>Storebrand</strong> ASA. The deficit experienced in <strong>2007</strong> in the P&Cbusiness amounting to NOK 18 million was expected and was due tostart-up costs associated with the new business in <strong>Storebrand</strong> Skade.IT investments and marketing costs from achieving the desired growthin sales particularly contributed to the deficit. Despite the deficit thecompany has maintained good control over costs and the result is in linewith expectations.<strong>Storebrand</strong> ASA achieved a pre-tax profit of NOK 696 million comparedwith NOK 1,020 million in 2006. The income from investments in subsidiariesamounted to NOK 672 million, which represents a fall of NOK364 million compared with 2006. <strong>Storebrand</strong> ASA does not present itscompany accounts pursuant to IFRS. A dividend payment of NOK 534million was booked against equity as per 31 December <strong>2007</strong>, while it isstill included in equity in the consolidated accounts, which are producedpursuant to IFRS. The dividend payment will be booked in the consolidatedaccounts once it has been approved by the annual general meetingin 2008.Other: In addition to the profit reported from <strong>Storebrand</strong> Skade and<strong>Storebrand</strong> ASA, <strong>Storebrand</strong> Leieforvaltning AS and <strong>Storebrand</strong> Felix Kursog Konferansesenter AS together reported a profit totalling NOK 12 million,after eliminations, and a profit contribution of NOK 5 million.In accordance with Norwegian accounting legislation, the Board confirmsthat the company meets the requirements for producing the accounts onthe basis of a going concern assumption.Business areasLife insurance: Good results from the management of customers’ assetsare the most important element for profitability with respect to savingsrelated products. The company achieved a good booked return in <strong>2007</strong>.Net gains on securities amounting to NOK 4,278 million were achieved in<strong>2007</strong> compared with NOK 3,402 million in 2006.The retail market achieved good sales of pension, savings and risk productsin <strong>2007</strong>.In May <strong>2007</strong>, <strong>Storebrand</strong> Life Insurance became the first company inNorway to launch its own cancer insurance. After two campaign periods,Birgitte Nielsen (44), partner, JMI Invest II AS.General Management Programme, CEDEP/Insead. 1986 Bachelor of Commerce, international relations.1993 Bachelor of Commerce, economics and finance. 2003-2006 advisor, Nielsen + Axelsson Asp.1992-2003 latest as CP/CFO, FLS Industries AS. 1983-1992 Danske Bank, 1990-1992 as VP. 2006- boardmember, JMI Invest II AS. 2006- board member, Netconcept AS. 2006- board member, Novenco AS.2006- board member, Arkil AS. 2005- board member, Buy-Aid. 2005- board member, IDEAS AS.2005- board member, <strong>Storebrand</strong> ASA. 2005- board member, Faber AS. 2005- board member,Energinet.dk. 2004- board member, Team Denmark. 2004- board member, Royal Greenland.<strong>Annual</strong> <strong>Report</strong> <strong>2007</strong> 19
more than 3,900 policies have been sold, and its introduction is regardedas successful.Investment return12%This can be seen from the substantial growth in both volumes and thenumber of customers. The lending portfolio increased from NOK 31.2billion to NOK 37.1 billion in <strong>2007</strong>. The positive growth in the number ofcustomers experienced by the bank after it became a ‘no-fees’ bank in2005 continued in <strong>2007</strong>.10%8%6%4%2%0%7.38.811.26.47.67.26.97.66.97.18.36.58.97.36.6<strong>Storebrand</strong> Bank has developed its good position within the propertysegment for corporate customers. A new strategy has been developed forthe area. The main goal of this strategy is to expand the range of productsfor the customers in order to increase the proportion of non-balancesheet driven income. <strong>Storebrand</strong> Bank wants to be a complete provider offinancial services to property investors in key districts. <strong>Storebrand</strong> Marketswas established as a new business area in <strong>2007</strong> to ensure there is sufficientstrength behind the property venture. The business area has been built froma combination of existing business within foreign currency, stockbrokingand structured savings products. <strong>Storebrand</strong> Bank ASA has acquired HadrianNæringsmegling and established a small corporate team with competence inbusiness property in order to offer a more complete range of services.2003 2004 2005 2006 <strong>2007</strong> Booked Value-adjusted excl. unrealised gains on financial fixed assets Value-adjusted incl. unrealised gains on financial fixed assetsGross lendingNOK billion40Following the introduction of mandatory occupational pensions (OTP) themarket for occupational pensions will primarily be a transfer market, amarket <strong>Storebrand</strong> is well equipped for. <strong>Storebrand</strong> was again the winnerin the transfer market for occupational pension schemes in <strong>2007</strong> with anet inflow of assets of NOK 4.1 billion.A new insurance act came into effect on 1 January 2008. The new actentails extensive changes for the insurance sector and <strong>Storebrand</strong> hasworked intensively to ensure it is as well equipped as possible for thisrestructuring. The objective of the new insurance act is to achieve greaterpredictability and transparency in the pricing of pension products, and tocreate a clearer difference between the customers’ and the companies’own assets. The general rule in the new legislation is that prices shall beset with final effect and paid in advance.35302520151050 Retail12.211.510.59.824.919.616.214.22004 2005 2006 <strong>2007</strong> CorporateBanking: The bank primarily focused on growth and improving profitabilitythroughout <strong>2007</strong>. <strong>Storebrand</strong> Bank’s position as a ‘no-fees’ bankand its competitiveness within home mortgages have been maintained.As part of its commitment to developing attractive products, <strong>Storebrand</strong>Bank ASA launched the <strong>Storebrand</strong> Eiendomsfond (a real estate mutualfund) in 2005 and <strong>Storebrand</strong> Optimér in 2006 (a product that combinesbarbara rose milian thoralfsson (49), Director, Fleming Invest AS.MBA, Graduate School of Business, Columbia University, New York. 2001-2005 CEO, NetComAS. 1995-2001 CEO, Midelfart & Co. AS. 1998-1995 EVP Sales and Marketing, Midelfart & Co AS.1987-1988 Product Manager, AS Denofa and Lilleborg Fabrikker. 1984-1987 Product Manager,General Foods Corp., New York. 1983 marketing, Pepsi Cola Company, New York. 1981-1983marketing assistant, General Foods Corp., New York. 2006- board member, SCA AB. 2006- boardmember, <strong>Storebrand</strong> ASA. 2006- board member, Norfolier AS. 2006- board member, TandbergASA. 2005- board member, Stokke AS. 2005- council member, SOS Barnebyer. 2005- boardmember, Fleming Invest AS. 2003- board member and member of audit committee, ElectroluxAB. 2002- board member, Rieber & Søn ASA. 2000-2005 member of Board of Representatives,<strong>Storebrand</strong> ASA.20<strong>Annual</strong> <strong>Report</strong> <strong>2007</strong>
equity and real estate investments in a single portfolio). The funds performedwell in <strong>2007</strong>.Asset management: At the end of <strong>2007</strong>, <strong>Storebrand</strong> Investments wasmanaging NOK 227 billion in mutual funds and individual portfolios forinsurance companies, pension funds, municipalities, institutional investorsand retail customers.In the retail market <strong>Storebrand</strong> Investments has turned a net departureof NOK 300 million in 2006 into a net inflow of NOK 300 million in <strong>2007</strong>.The inflow was greatest in the fixed income funds. <strong>Storebrand</strong> Investmentshas a market share of 8.1% of the total assets under managementfor Norwegian retail customers, an increase from 7.3% in 2006. In<strong>2007</strong>, <strong>Storebrand</strong> Investments gained 44 new institutional customers. Itsstrong position within the municipality, pension fund and organisationsegments has been maintained. These customers will continue to beimportant and great emphasis is placed on good customer service. Thestrategy of directing the sales focus at private investment companies hasbeen successful and will be continued in 2008. In <strong>2007</strong>, the unit of highlyqualified investment advisers responsible for the company’s institutionalcustomers in cooperation with the department for operational servicesachieved a breakthrough with respect to sales of investment supportservices, SIOS (<strong>Storebrand</strong> Investment Operation Services).Property and casualty insurance: <strong>Storebrand</strong> Skadeforsikring wasre-established in the autumn of 2006. The new business area providesstandard P&C insurance products in the retail market. Apart from thenew business, <strong>Storebrand</strong> Skadeforsikring bears fronting responsibilityfor the risk associated with policies taken out before the transfer of theP&C insurance business to If in 1999 and the run-off of its own reinsurancebusiness and managing other companies’ run-off business througha subsidiary, Oslo Reinsurance Company. The retail P&C insurance marketcontinues to be characterised by satisfactory profitability. However, inthe company’s opinion the competition was somewhat tougher in <strong>2007</strong>.<strong>Storebrand</strong> Skadeforsikring has helped to set a new standard for onlinesales solutions within P&C insurance, and more players are now offeringnew and improved solutions in this area. It is anticipated that the proportionof online sales will increase dramatically in the years ahead. <strong>2007</strong>was a year characterised by strong growth in <strong>Storebrand</strong> Skadeforsikring.The annual premium increased from NOK 8 million to NOK 121 million. Itis anticipated that the growth will continue in 2008 and that the annualTotal assets under managementNOK billion25022721720529.724.620020.328.030.316529.415915.825.613.215020.09.714.625.312.910.1100142.1140.6144.150 110.2 126.602003 2004 2005 2006 <strong>2007</strong> Group internal Real estate (group internal) External discretionary Mutual fundspremium will more than double during the course of the year. At the sametime as there has been significant growth, the company has focused onprofitable growth. So far the development in claims suggests that the companyis well positioned to succeed in this area. A claims ratio of 70% in thenew business is regarded as satisfactory during the start-up phase.Risk management<strong>Storebrand</strong> has through the products and policies it has signed with customersestablished liabilities that generate risks. These vary in nature dependingon the product area. Various types of insurance risk are associatedwith the life insurance and P&C insurance business areas. <strong>Storebrand</strong>’sfinancial assets fluctuate in value due to the risk associated with thefinancial markets – including equities, property, interest rate and credit risk.The banking business area also generates credit risk, and there are solvencyand operational risks associated with the operation of the businessareas. Continuous monitoring and active management of risk is therefore acentral and integral feature of the group’s activities and organisation.Identifying and managing operational risk forms an integral part ofmanagement responsibility in the organisation. In addition to this, thegroup’s executive management conducts an annual risk assessment thatSigurdur Einarsson (48), Executive Chairman, Kaupthing Bank.Master’s degree in Economics (Cand. Polit.), University of Copenhagen. 1994, AuthorisedSecurities Dealer in the European Economic Area (EEA). 1997-2003, CEO, Kaupthing Bank.1996-1997, Deputy Managing Director, Kaupthing Bank. 1994-1996, Executive Director, CapitalMarkets, Kaupthing Bank. 1988, Deputy to the Director of the International Department andDeputy to the Director of the Treasury Department, Islandsbanki hf. (now Glitnir banki hf.).1982-1988, various positions, International Department and Financial Department, Den DanskeBank. 1993-1997, assistant professor, University of Iceland. Board member, various subsidiariesof Kaupthing Bank. Board member in Norvestia and <strong>Storebrand</strong> ASA. 1996-1997, Vice Chairman,Iceland Stock Exchange<strong>Annual</strong> <strong>Report</strong> <strong>2007</strong> 21
esults in a summary of risks and pertinent improvement measures. Thissummary is presented to and dealt with by the Board.A significant proportion of savings-related life insurance productsincorporate a guaranteed minimum annual return, currently just over 3.5%on average. The average guaranteed return will fall over time since theannual guarantee for new policies cannot exceed 2.75%. The life insurancecompany’s financial risk principally relates to its ability to generatean annual investment return at least equal to the guaranteed minimum.This places particular demands on how the life insurance company allocatesits investments between securities and other assets, and on thequality of the company’s risk management. Rising interest rates over thecourse of <strong>2007</strong> have helped to strengthen the life insurance company’srisk-bearing capacity. The company has invested a significant part ofits financial fixed assets in bonds classified as ‘hold to maturity’, whichgenerate a running yield in excess of 5%.At the end of 2004, the Norwegian parliament approved a number ofmajor changes to the Insurance Activities Act. One important aspect ofthe changes is that insurance companies must, for certain product areas,charge the cost of the interest rate guarantee included in products toRisk capital as % of policyholders’ funds excluding additionalstatury reserves14%12%10%8%6%4%2%0%8.9 bn2.11.61.63.2 3.22003 2004 2005 2006 <strong>2007</strong> Additional statutory reserves Adjustment core capital margin3.013.6 bn15.5 bn11.1 bn2.62.82.10.84.21.31.8 1.13.03.82.43.516.8 bn3.9 Market value adjustment reserve Profit accrued2.6the customer in advance. The new operational rules came into effect on1 January 2008. The allocation of financial assets follows the company’sinvestment policy. The investment policy establishes guidelines for thecomposition of financial assets by setting limits and rules for the company’srisk management. The policy also includes limits and guidelines forcredit and counterparty exposure, foreign exchange risk and the use ofderivatives. The objective of active risk management is to maintain soundrisk-bearing capacity and to continuously adjust financial risk exposureto the company’s solidity. The company expects this to generate a goodinvestment return, both in individual years and over time.The total risk capital of the life insurance company declined by NOK 1.3billion in <strong>2007</strong>. Additional statutory reserves increased by NOK 0.2 billionwhile the market value adjustment reserve was reduced by NOK 2 billion.Insurance policies are long-term agreements, and involve uncertaintywith respect to calculating future mortality and disability rates. The lifeinsurance company uses tariffs based on historical statistical data that arenotified to the authorities. The company follows developments in mortalityand disability rates very closely, and adjusts its reserves in accordance withthese trends. New premium and reserve tariffs that take into account theincreased life expectancy of insured people that has been observed inrecent years are being introduced in 2008. NOK 3.3 billion was allocated inthe accounts as per 31 December <strong>2007</strong> in connection with this.<strong>Storebrand</strong> Life Insurance has practised a policy of solvency-based riskmanagement in connection with the instability in the financial markets atthe beginning of 2008 and thus significantly reduced the proportion ofequities in the customers’ investment portfolios.SPP is to a large extent exposed to the same types of risk as <strong>Storebrand</strong>Life Insurance, however the terms contained in the insurance products aresomewhat different. SPP offers insurance products with a guaranteed returnon received premiums and mutual fund products in which the customerbears the financial risk. SPP’s defined benefit products also include inflationadjustment and parts of the portfolio are thus subject to inflation risk.On 1 January 2006, SPP was restructured such that the company assumedsome of the financial risk the customers previously bore. Thismeans that latent deficits could arise with respect to certain customers.The company makes provisions in the accounts to meet these and monitorsthe ongoing risk, including by using ‘Value at Risk’ measurements.Erik Haug Hansen (53), employee elected.Sales Manager, Corporate Market, <strong>Storebrand</strong> Life Insurance. Higher insurance qualification,University of Oslo. 1979-1985 Ajungilak AS. 1977-1979 Consultant, Fred. Olsen Spedisjon AS.2004- board member, <strong>Storebrand</strong> ASA. 1998-2002, board member, <strong>Storebrand</strong> Life Insurance.22<strong>Annual</strong> <strong>Report</strong> <strong>2007</strong>
In order to manage the exposure to various types of market risk thecompany stipulates a reference portfolio in its investment policy and thepertinent ongoing risk management that is practised. The risk managementis exercised by adjusting the customers’ portfolios and the company’s ownassets. This could involve changes in the allocation of risk-bearing assetsor utilising derivatives. The company’s investment policy also includeslimits and guidelines for credit and counterparty risk. Liquidity risk is estimatedby a significant portion of the financial investments being placed inlisted securities with good liquidity.In order to ensure that the insurance company has adequate capitalto service its obligations, the Swedish supervisory authority, Finansinspektionen,requires that insurance companies stress test all of theirbusiness activities pursuant to a predefined template. The stress testscover both assets and liabilities in the balance sheet, but are defined differentlyfor defined benefit pensions and defined contribution pensionswith guarantees. This is known in Sweden as traffic light reporting. Thecapital requirements during the stress tests can be reduced by availablerisk capital (known as ‘conditional bonuses’ in Sweden), which thusresults in a net requirement of equity.The life insurance group’s risk capital reports NOK 2.4 billion frominterest-adjusted conditional bonuses in SPP.<strong>Storebrand</strong> Bank ASA’s financial risk primarily consists of credit, liquidity,interest rate and foreign currency risk. Credit risk is regarded as themost important. The Board places weight on the bank having a low levelof financial risk.The bank has standard procedures for reviewing its lending and all newlending is approved in accordance with the bank’s credit policy. The bankmonitors its credit risk through a risk classification system. Lending tocorporate customers over a certain limit requires the approval of a creditcommittee chaired by the CEO, or by the bank’s Board. Credit risk ismonitored through a risk classification system that ranks each customerby ability to pay, financial situation and collateral.The volume of non-performing and loss-exposed loans totalled NOK 448million, equivalent to a reduction of NOK 85 million and 1.2% of grosslending over the course of <strong>2007</strong>. The bank’s total lending write-downsamounted to NOK 305 million at the end of <strong>2007</strong>, of which NOK 58 millionrelated to grouped write-downs.<strong>Storebrand</strong> has established sound liquidity buffers in <strong>Storebrand</strong> Bankand other group companies, and continuously monitors liquidity relativeto internal limits. Committed credit facilities with other banks have alsobeen established which the group companies can draw on if necessary.The bank manages its exposure in the fixed income market such thesensitivity to interest rates is as low as possible. The bank also practisesa policy of full hedging and all instruments with an interest rate fixingperiod in excess of six months are subject to a specific hedging policy.The main risk for the newly established P&C business is that it willinitially have a small portfolio to absorb claims. This could mean thatsingle large claims may have a disproportionate impact on profit. Thelargest claims will typically arise from liability cover in motor insurance.Special reinsurance cover has been taken out in order to offset this risk.Oslo Reinsurance Company ASA has been in run-off since 1994. The company’srisk exposure has reduced significantly over this period. The levelof reserves is determined by actuarial principles.In 2000, <strong>Storebrand</strong> Skadeforsikring AS transferred all its run-off landbasedNorwegian non-life insurance and all direct marine insurance to Ifthrough a 100% reinsurance arrangement. The result is that the companyhas retained fronting responsibility for run-off business, but has no commercialresponsibility unless If becomes insolvent. This risk is thereforelimited to a credit exposure to If. If has a Standard & Poor’s rating of’A’, which suggests that this represents a very limited risk exposure for<strong>Storebrand</strong>.The <strong>Storebrand</strong> Skadeforsikring group’s securities portfolio primarilyconsists of low risk, interest-bearing securities. The assessment of shareprice risk, interest rate risk, credit risk and foreign currency risk is centralto the risk management of the securities portfolio in <strong>Storebrand</strong> Skadeforsikringand the exposure is monitored pursuant to set limits.Capital situationThe level of equity and debt in the company is managed relative tofinancial risk and capital requirements in the business. The goal of capitalmanagement is to ensure an effective capital structure and preserve anappropriate balance between internal goals in relation to the statutoryand rating companies’ requirements. The group has set long-term targetsCamilla M. Grieg (44), CEO, Grieg Shipping Group AS.Authorised Financial Analyst (AFA), NHHK/NFF. 1989 MBA, University of San Francisco. 1986Cand. Mag., University of Bergen. 1998-2006 CEO, Grieg Shipping AS. 1995-1998 director, GriegShipping AS. 1993-1995 corporate market analyst, Star Shipping. 1990-1993, financial analyst,Bergen Fonds AS. <strong>2007</strong>- Chairman of the Board, Bergen Shipowning Association. Board member,Grieg Shipping Group AS, Star Shipping AS, Grieg Maturitas AS, GCRieber AS, <strong>Storebrand</strong> ASA.2005-2006, board member, Rieber Shipping AS. 2000-2005, board member, Serac AS<strong>Annual</strong> <strong>Report</strong> <strong>2007</strong> 23
whereby the capital adequacy in its banking activities should be more than10% and the solvency margin in the life insurance company should be atleast 150%. As per 31 December <strong>2007</strong>, <strong>Storebrand</strong> Bank’s capital adequacywas 10.5% and the solvency margin in <strong>Storebrand</strong> Life Insurance was 136%.There has been a reduction in the solvency margin in the life insurancecompany due to the acquisition of SPP and the consolidation effects thatfollow from the acquisition. The solvency margin in SPP was 178% at theend of <strong>2007</strong>. <strong>Storebrand</strong> Livsforsikring AS also has a goal of maintainingan A rating, which was achieved at the end of <strong>2007</strong>. The holding companyaims to have a net debt ratio of zero over the longer term.<strong>Storebrand</strong> ASA bought back 1.0 million of its own shares in <strong>2007</strong> at atotal cost of NOK 93 million. The company sold 236,300 shares as part ofthe company’s share purchase programme for employees, raising a totalof NOK 15 million. <strong>Storebrand</strong> ASA held 5.3 million of its own shares atthe close of <strong>2007</strong>. In connection with the acquisition of SPP, <strong>Storebrand</strong>ASA conducted a share issue that resulted in a net increase in equity ofNOK 8,670 million. 200,090,786 shares were issued at a subscriptionprice of NOK 45 per share. The group’s equity increased by NOK 10,431million during the course of <strong>2007</strong> and amounted to NOK 19,421 million atthe end of the year.The group’s capital base, which consists of equity, subordinated loancapital, the market value adjustment reserve and additional statutory reserves,amounted to NOK 34.1 billion as per 31 December <strong>2007</strong> comparedwith NOK 24.1 billion at the end of 2006. The group’s total capital base,including SPP’s ‘conditional bonuses’, as per 31 December <strong>2007</strong> amountedto NOK 47.8 million. The group’s capital adequacy was 9.2% as per 31December <strong>2007</strong>, and its core capital adequacy was 6.3%. The authorities’requirements are 8% for capital adequacy and 4% for core capital.<strong>Storebrand</strong> ASA had total liquid assets of more than NOK 1.7 billion at theclose of <strong>2007</strong>, and also has available an undrawn long-term credit facilityof EUR 225 million. <strong>Storebrand</strong> ASA has a bond issue of NOK 1.6 billion thatfalls due in 2009 and 2011. <strong>Storebrand</strong> ASA took out a loan of EUR 580million in connection with the acquisition of SPP. The loan will be repaidwhen <strong>Storebrand</strong> Life Insurance issues new subordinated debt in 2008.At the close of <strong>2007</strong>, <strong>Storebrand</strong> Livsforsikring AS was rated A and A2respectively by Standard & Poor’s and Moody’s. <strong>Storebrand</strong> ASA wasrated BBB+ and Baa2 respectively by Standard & Poor’s and Moody’s.Standard & Poor’s confirmed the ratings of <strong>Storebrand</strong> Livsforsikring ASand <strong>Storebrand</strong> ASA in connection with the acquisition of SPP, howeverthe rating outlooks were changed from stable to negative. Moody’s ratinghas a stable outlook.<strong>Storebrand</strong> Bank’s rating was upgraded in <strong>2007</strong> by Moody from Baa2 toA2 (stable outlook). Standard & Poor’s rating for <strong>Storebrand</strong> Bank wasBBB+ (positive outlook).Corporate responsibilityThe industry winners in the future will be businesses that develop productsand services in a way which unites global, social and environmentalchallenges with profitable growth. <strong>Storebrand</strong>’s most important contributionto resolving the challenges faced by society must therefore bemade through our core activities. The group has ensured that the focuson corporate responsibility will be strengthened further by ensuring thatthe area is directly represented in the executive management team fromJanuary 2008.The <strong>2007</strong>-2008 Corporate Social Responsibility <strong>Report</strong> describes the workdone to achieve the goals we have set for ourselves (see se www.storebrand.no/samfunnsansvar).Some of the highlights in <strong>2007</strong>, including thestatus of the around 40 goals we have set ourselves, are described in thearticle on corporate responsibility on page 14.Among the highlights we should like to emphasise are the increased investmentsin microfinancing, the launch of an ethical hedge fund and ourcontinued listing on sustainability indices, the Dow Jones SustainabilityIndex, FTSE4Good and Global 100, which is a list of the 100 most sustainablecompanies in the world. Development measures associated with theenvironment and the area of HR are described below.The environment: <strong>2007</strong> was a year in which people focused on theclimate and the environment, including in <strong>Storebrand</strong>. As well as systematicallyworking to achieve the environmental targets we have set forourselves, including with respect to energy, paper and water consumption,waste sorting and recycling, <strong>Storebrand</strong> took new steps to reducethe burden our business operations place on the environment. In June,we developed and launched, in partnership with the environmentalHalvor Stenstadvold (63), independent advisor.MSc Political Science, University of Oslo. 1996-2006 member of Orkla’s executive management,1988-1996 various management positions Orkla ASA. 1981-1984 Parliamentary Secretary Ministryof Consumer affairs and Government Administration. 1979-1988 Bank manager, Kreditkassen,Oslo. 1975-1979 Deputy Mayor and later Mayor of the Municipality of Bærum. 1974-1979consultant, The Federation of Norwegian Industries. 1972-1974 assistant lecturer, University ofOslo. 2002- board member, Statkraft Group. 2000- board member, <strong>Storebrand</strong> ASA. 2005-<strong>2007</strong>Chairman of the Board, The Oslo Stock Exchange (Chairman from 2006).1994-2000 Chairman ofthe Executive Board, The Research Council of Norway, 1994-2000 member of Board of Representatives,<strong>Storebrand</strong> ASA. 1986-1990 Chairman of the Board of NRK24<strong>Annual</strong> <strong>Report</strong> <strong>2007</strong>
foundation GRIP, a unique environmental and safety classification systemfor all types of cars. <strong>Storebrand</strong> is thus the first company in Norwayto comply with the EU environmental standard for the classification ofcars. <strong>Storebrand</strong> became the first financial institution to sign up to theThe Norwegian Climate Campaign in <strong>2007</strong> – an action programme forbusiness organised by the Norwegian Ministry of the Environment. Inaddition to actively working to reduce our CO2 emissions, developingproducts and services that help increase awareness of climate challengesand reducing emissions, <strong>Storebrand</strong> has decided to purchase UN certifiedclimate quotas equivalent to our direct emissions as early as 2008. On 1January 2008, <strong>Storebrand</strong> thus became the first climate neutral financialplayer in the Nordic region.Human resources and organisation: Employment in the group, afterthe acquisition of SPP, totalled 2,219 employees at the end of the yearcompared with 1,455 at the start of the year. Employment is virtuallyequally split between male and female employees. The average age ofthe group’s employees is 42, with an average length of service of 10years. All <strong>Storebrand</strong> employees are treated equally, regardless of gender,age, disability, religious beliefs, cultural differences or sexual orientation.With effect from 2006, <strong>Storebrand</strong> has included the following statementin all its recruitment advertising: “We are committed to diversity, andencourage applications from all qualified candidates regardless of age,gender, disability or cultural background”.Skills and training: <strong>Storebrand</strong> places great weight on the developmentof its employees at all levels and we intensified this work in <strong>2007</strong>. Toolsfor surveying competence and development plans for employees havebeen fully developed, and managers have undergone specific training inperformance management and attaining goals. Managerial developmenthas received extra attention in <strong>2007</strong>. The company’s managers undergomandatory managerial training modules and an internal mentor programmefor new managers has been introduced. Besides this, a specialtraining programme is offered to young employees showing promise –the Young Professionals Programme (YPP). A significant increase in competencehas been achieved within professional training. Our professionalemployees have, due to statutory changes within financial advice (MiFID)and occupational pensions (new insurance act), undergone skills trainingwithin these fields as well.Gender equality/diversity: <strong>Storebrand</strong> is fully committed to increasingthe number of women in senior management. In <strong>2007</strong>, 44% of the membersof the Board of <strong>Storebrand</strong> ASA were women. 37% of the group’smanagers are female. Women made up 11% of the group’s executivemanagement in <strong>2007</strong>. This proportion has increased to 20% followingchanges to the group management model made in January 2008.<strong>Storebrand</strong> implemented targeted measures in the period to encouragemore women to take on management responsibility. This included thecompany’s active participation in an external mentoring programme forfemale staff. 43% of the participants in internal development programmeswere women. In 2006, the group participated in Futura, the NorwegianFinancial Services Association’s management training programme forwomen. This continued in <strong>2007</strong> and in 2008 the effort has been doubled.<strong>Storebrand</strong> insists that external recruitment consultants put forward bothmale and female candidates on short lists for management recruiting.Employee benefits, such as flexible working hours, extending full salaryfor sick leave to include attending to children or parents, and full salaryduring maternity leave, are seen as important measures in encouraginggender equality. <strong>Storebrand</strong> produces salary statistics at specified managementlevels to facilitate the comparison of salaries between male andfemale employees.<strong>Storebrand</strong> has its own diversity committee, which in addition to workingon gender equality also systematically works to include people fromgroups that are underrepresented in the labour market, including disabledpeople and groups from diverse ethnic backgrounds.Senior policy: <strong>Storebrand</strong> is committed to offering a good senior policy.The group employed 34 employees over the pension age of 65 in <strong>2007</strong>compared with 21 in 2006. 30 new members of staff over the age of 45were recruited in <strong>2007</strong>. An increasing number (40%) of senior employeeswant to continue working after turning 65 years old, and 75% of all employeesresponded in the annual employee satisfaction survey that thestaff are treated fairly regardless of age. <strong>Storebrand</strong> holds a significantnumber of seminars about senior policy for external parties every year.Ethical guidelines: <strong>Storebrand</strong> updated its ethical guidelines in <strong>2007</strong>,and developed new handbooks, which are also available online. In addition,ethical issues were a standard agenda item at all gatherings for newemployees. Employees can seek advice anonymously from an ethics pageon the <strong>Storebrand</strong> Intranet, and the company publishes its replies for allAnn-Mari Gjøstein (45), employee elected.Senior employee representative. Market Economist, BI Norwegian School of Management.2001-<strong>2007</strong>, training manager and course consultant, <strong>Storebrand</strong> Bank. 1997-2001, financialadvisor and funds advisor DnB. <strong>2007</strong>- board member, <strong>Storebrand</strong> ASA.<strong>Annual</strong> <strong>Report</strong> <strong>2007</strong> 25
employees to see. This can also be used by employees to anonymouslycommunicate concerns directly to the Board of Directors.<strong>Storebrand</strong>’s ethical guidelines are distributed to and reviewed by alladvisers in the group.Sick leave: <strong>Storebrand</strong> has systematically worked to reduce sick leaveover many years, and the group has participated in the ‘Inclusive workplace’scheme since 2002. Sick leave in the group in <strong>2007</strong> was 4.6%compared with 5.1% in 2006. The target for 2008 is a sick leave rate of4%. Internal guidelines, “If you fall ill”, have been produced to supportthis work.Board of Directors: Camilla M. Grieg was elected as a new board memberto replace Mette K. Johnsen, who had been a member since 2003. SigurdurEinarsson replaces Knut G. Heje as per 1 January 2008.Board of Representatives: Ole Enger, Eli Sætersmoen and Petter Jansenretired from the Board of representatives. Terje Venold was appointed asthe new chairman of the Board of Representatives. Trond Bjørgan andKaren Helene Ulltveit-Moe, both deputy members, became full members.Elin Korvald, Henrik O. Madsen and Einar Gaustad were elected as newdeputy members.Election Committee: Terje Venold was elected as the new chairman.Control Committee: Carl Graff-Wang and Jon Ansteinsson retired fromthe Control Committee. Ole Klette was elected as a new member.No injuries to people, property damage or accidents of significance werereported within <strong>Storebrand</strong> in <strong>2007</strong>.Corporate governance<strong>Storebrand</strong> established its policy on corporate governance in 1998.The Board reviews these principles every year. In order to strengthen<strong>Storebrand</strong>’s work on corporate governance further, a special CorporateGovernance Committee was established in 2006. The Norwegian Codeof Practice for Corporate Governance was first published in December2004, and was most recently revised on 4 December <strong>2007</strong>. <strong>Storebrand</strong>meets the recommendations set out in the Code in all major respects.The question of whether to elect a Deputy Chairman for the Board of<strong>Storebrand</strong> ASA was considered in 2006, but such an appointment wasnot considered necessary.Further information on <strong>Storebrand</strong>’s policies and procedures for corporategovernance can be found in a separate article on pages 31–35.The Board carried out an evaluation of its work in <strong>2007</strong> in which theexecutive management team also participated. The Board held 21 meetingsand one Board conference in <strong>2007</strong>. The work of the Board is subjectto a specific mandate. The Board has established advisory committees onremuneration and internal audit.During <strong>2007</strong>, the following changes in the membership of <strong>Storebrand</strong>’scorporate bodies took place:The Board wishes to thank the retiring members of the Board of Representatives,the Election Committee and the Control Committee for thevaluable contributions they have made to the company.Future prospectsIn recent years, <strong>Storebrand</strong> has achieved solid profitability and strongcompetitiveness in an attractive and growing market for long-term savingsand insurance. The acquisition of SPP expands the group’s marketarea from one covering Norway to one covering the Nordic region. <strong>Storebrand</strong>has built up a solid financial and market basis for further positivegrowth. The company’s future results will depend on developments ina number of areas, including social and macroeconomic developments,general conditions and the competitive situation in the sector.The social developments in relation to <strong>Storebrand</strong>’s areas of focus areregarded as positive. Changes in pension systems have increased thepublic’s interest in pensions and other welfare benefits, and sales oflong-term savings and insurance products and services are also beinginfluenced by demographic trends. Increased life expectancy combinedwith people’s wish to maintain a high standard of living during theirretirement is creating demand for <strong>Storebrand</strong>’s products.The macroeconomic trends in the world generally, and in Norway and theNordic region in particular, affect the financial markets, employment ratesand income levels in the retail and corporate markets. These will in turnaffect interest rates and share prices, the number of members in pensionschemes, and the amount of money available for savings in society asKnut Dyre Haug (52), employee elected.Assistant Director, Retail Market, <strong>Storebrand</strong> Life Insurance. Officer’s Training School, authorisedinsurance advisor. 2000- <strong>Storebrand</strong> Life Insurance. 1998-1999 Markets Director, Sparebank1Livsforsikring. 1978-1998 various positions, <strong>Storebrand</strong> Life Insurance. 1990-2006 lecturer andauthor, BI Banking & Finance and BI Insurance. 2002- head of project committee for authorisations,FNH. <strong>2007</strong>-, Chairman of the Board, Boligstiftelsen Ungdomsboliger in Asker. <strong>2007</strong>- boardmember, Asker and Bærum housing cooperative. <strong>2007</strong>- member, Board for Banking, Insuranceand Finance Studies.26<strong>Annual</strong> <strong>Report</strong> <strong>2007</strong>
a whole. <strong>Storebrand</strong> has, through active risk management and adjustingits level of risk capital, prepared itself for possible instability in the stockand fixed income markets. It considers the macroeconomic situation inthe Nordic region strong, despite the increased uncertainty in the globaleconomy throughout <strong>2007</strong> and at the start of 2008.On 1 January 2008, the general conditions for life insurance in Norwaychanged considerably with the introduction of new regulations for life insurance.The regulations significantly affect <strong>Storebrand</strong>’s business modeland the traditional pension products. <strong>Storebrand</strong> has worked intensivelyto adapt products and systems to the new regime, and provide extensiveguidance to customers in connection with the transition. <strong>Storebrand</strong> believesthat the new regulatory framework represents a positive development,and will permit greater flexibility and improve the group’s quality ofearnings.The strong inflow of customers to <strong>Storebrand</strong> in recent years confirmsthe group’s competitiveness, and provides a sound basis for a good levelof sales going forward. In <strong>2007</strong>, <strong>Storebrand</strong> launched a major initiativein the Norwegian market that will last for several years aimed atcross-selling the group’s products and encouraging the group’s existingcustomers to buy additional products. This initiative addresses both theretail market and individual employees in companies that have pensionarrangements with <strong>Storebrand</strong>. The key goal in the Swedish market is tostrengthen SPP’s competitiveness further.<strong>Storebrand</strong> has experienced accelerating pressure on margins in certainproduct areas, including in the lending market and in the market for mandatoryoccupational pensions in Norway. <strong>Storebrand</strong> is prepared for anyfurther pressure on margins and continuously works to improve operationalefficiency. Greater efficiency will ensure that <strong>Storebrand</strong> can handleincreasing business volumes without an equivalent increase in costs. Anextensive programme of further product improvement is underway, andwill be rolled out across the entire Norwegian group during 2008. <strong>Storebrand</strong>anticipates significant effects from this. Productivity improvementsand synergies have also been defined with respect to SPP’s business.At the start of 2008, <strong>Storebrand</strong> looks forward to an important year,especially with respect to the integration of SPP. The acquisition hasresulted in the establishment of the leading Nordic provider of life insuranceand pensions, and a strong platform for further growth. The acquisitionmakes it possible to take advantage of the complementary skillsand experience in both companies, and through this achieve the plannedsynergies that follow from the transaction.<strong>Storebrand</strong>’s vision is to be the Nordic region’s leading and most respectedpartner within long-term savings and insurance. The group’s financialgoals have been adjusted as a consequence of the acquisition of SPP.<strong>Storebrand</strong> has, because of its long traditions and experienced andmotivated employees, a good basis for successfully achieving the group’sgoals.Application of the profit for the year<strong>Storebrand</strong> ASA recorded a profit of NOK 696 million for <strong>2007</strong>. During itsdiscussion of the profit for the year in <strong>2007</strong>, the Board of <strong>Storebrand</strong> ASAadopted a new dividend policy with an increased distribution ratio. Thenew dividend policy is as follows: “The dividend policy shall contributetowards providing shareholders with a competitive return and optimisingthe company’s capital structure. The dividend to shareholders willnormally represent more than 35% of the full-year profit after tax, butbefore amortisation costs. The Board wishes to have a dividend policywith a long-term horizon, and will aim for stable year-on-year growth individend per share.”Based on <strong>Storebrand</strong>’s dividend policy, the Board of <strong>Storebrand</strong> ASArecommends that the annual general meeting approve a dividend ofNOK 1.20 per share, excluding the company’s holding of bought backshares, equivalent to NOK 534 million. The proposed dividend is basedon the number of shares prior to the acquisition of SPP and the associatedrights issue, since the acquisition took place at the end of <strong>2007</strong>.The dividend is equivalent to NOK 2.18 per share in relation to the totalnumber of shares prior to the issue.Amounts in NOK million:To other equity: 162.6Provision for dividend: 533.6Distributable reserves amounted to NOK 3,728 million as per 31 December<strong>2007</strong>.Oslo, 12 February 2008Translation – not to be signedLeiv L. NergaardChairman of the BoardHalvor Stenstadvold Sigurdur Einarsson Camilla M. Grieg Barbara Rose Milian ThoralfssonBirgitte Nielsen Knut Dyre Haug Ann-Mari Gjøstein Erik Haug Hansen Idar KreutzerChief Executive Officer<strong>Annual</strong> <strong>Report</strong> <strong>2007</strong>27
Shareholder mattersThe share capital, rights issue and sharesShares in <strong>Storebrand</strong> ASA are quoted on the Oslo Stock Exchange(OSE) with the ticker code STB. <strong>Storebrand</strong> ASA’s share capital at thestart of <strong>2007</strong> was NOK 1,249 million. In connection with the acquisitionof SPP, the company’s extraordinary general meeting held on 24October <strong>2007</strong> voted to conduct a rights issue of 200,090,786 newshares. Following the issue the share capital on 31 December <strong>2007</strong>amounted to NOK 2,249.5 million made up of 449,909,891 shareseach with a par value of NOK 5.The annual general meeting held on 25 April <strong>2007</strong> granted a mandateto the Board to buy back up to 10% of its own shares. <strong>Storebrand</strong> hasused this mandate and as of 31 December <strong>2007</strong> the company held5,263,700 of its own shares equivalent to 1.17% of the total sharecapital. The company has not issued any options that could diluteshare capital.Shareholders<strong>Storebrand</strong> ASA is one of the largest companies listed on the OSEmeasured by the number of shareholders. The company has shareholdersfrom almost all the municipalities in Norway and from 41countries. In terms of market capitalisation, <strong>Storebrand</strong> was the 12thlargest company listed on the OSE at the close of <strong>2007</strong>.Share purchase arrangements for employeesEvery year since 1996 <strong>Storebrand</strong> ASA has given its employees anopportunity to purchase shares in the company through a share purchasescheme. The objective of the scheme is to involve employeesmore closely in the company’s value creation. Employees were alsooffered an opportunity to purchase shares in <strong>Storebrand</strong> in <strong>2007</strong>. InMarch <strong>2007</strong>, each employee was offered the opportunity to buy between100 and 500 shares at NOK 65.11 per share. 46% of employeesparticipated and purchased a total of 236,300 shares. See note 15 forinformation about the shares held by senior management.Foreign ownershipAs of 31 December <strong>2007</strong>, total foreign ownership amounted to 75.7%.as compared to 70.6% at the end of 2006.Geographic distribution of sharesAt 31.12.<strong>2007</strong> At. 31.12.2006Norway 24.30% Norway 29.39%Great Britain 20.86% Great Britain 21.47%Iceland 17.61% USA 16.96%Luxembourg 11.89% Luxembourg 10.14%USA 8.60% Germany 5.47%38 other countries 16.70% 36 other countries 16.57%Turnover in the <strong>Storebrand</strong> shareAlmost 540 million <strong>Storebrand</strong> shares changed hands in <strong>2007</strong> whichwas a small reduction compared to 2006. The value of shares tradedin <strong>2007</strong> was NOK 39,338 million approximately equal to the samelevel as last year. This made <strong>Storebrand</strong> the 19th most traded share20 largest shareholders at 31 December <strong>2007</strong>Shareholder Account type 1 No. of shares % CountryGjensidige Forsikring ORD 48 782 290 10.84 NORKaupting Bank HF ORD 44 964 004 9.99 ISLFortis Global Custod ORD 24 909 453 5.54 ISLFolketrygdfondet ORD 22 593 091 5.02 NORExista BV ORD 21 134 610 4.70 NLDABN Amro Bank Luxemb. ORD 20 000 000 4.45 LUXFidelity Funds – Europe ORD 18 604 952 4.14 LUXExista BV ORD 14 962 554 3.33 NLDBank of New York NOM 12 644 900 2.81 GBRState Street Bank & Trust NOM 11 730 556 2.61 USAGoldman Sachs International NOM 9 061 796 2.01 GBRKaupting Bank NOM 8 098 802 1.80 LUXBank of New York ORD 7 871 137 1.75 USACitibank N.A.London NOM 7 809 664 1.74 GBRCitibank N.A.London NOM 7 224 356 1.61 GBRCredit Agricole Inv. Bank NOM 5 749 569 1.28 FRA<strong>Storebrand</strong> ORD 5 263 700 1.17 NORJP Morgan Chase Bank NOM 5 059 892 1.12 GBRDresdner Kleinwort S. Principal Acc. ORD 4 939 815 1.10 GBRArion Costody NOM 4 174 108 0.93 ISL1 NOM indicates client account28 <strong>Annual</strong> <strong>Report</strong> <strong>2007</strong>
on the OSE in <strong>2007</strong> in terms of value. In relation to the average totalnumber of shares, the turnover rate for <strong>Storebrand</strong>’s share was 186%.Analysis of shareholders by number or shares and ownershipat 31 December <strong>2007</strong>Share price developmentThe <strong>Storebrand</strong> share produced a total return (including dividend) of-13% over the course of <strong>2007</strong>. The OSE benchmark index (OSEBX)rose by 11% over the same period. Over the last three years, the<strong>Storebrand</strong> share has produced a total return of 41%. while theOSEBX index showed a return of 107% for the same period.Dividend policyBased on the company’s dividend policy, the Board of <strong>Storebrand</strong> ASArecommends that the annual general meeting approve a dividend ofNOK 1.20 per share, excluding the company’s holding of bought backshares equivalent to NOK 534 million. The proposed dividend is basedon the number of shares prior to the acquisition of SPP and the associatedrights issue, since the acquisition took place at the end of<strong>2007</strong>. The dividend is equivalent to NOK 2.18 per share in relation tothe total number of shares prior to the issue.18 00016 00014 00012 00010 0008 0006 0004 0002 000014 6171–200shares9 255201–1 000shares1 9580.20 0.92 0.461 001–10 000shares6.3846110 001–500 000shares4.5430 54500 001–1 000 000shares83.961 000 001–> 10 mill.shares9080706050403020100The Board of Directors of <strong>Storebrand</strong> ASA has approved a newdividend policy that envisages distributing a higher proportion ofearnings. The new dividend policy is as follows: “The dividend policyshall contribute towards giving shareholders a competitive return andtowards optimising the company’s capital structure. The dividend toshareholders will normally represent over 35% of the full-year profitafter tax, but before amortisation costs. The Board wishes to have adividend policy with a long-term horizon, and will aim for stable yearon-yeargrowth in dividend per share.” No. of shareholder Ownership interestShare price development350300250RISK adjustment(Only relevant for Norwegian shareholders)RISK amounts for shares in <strong>Storebrand</strong> ASA:200150As at RISK amount NOK As at RISK amount NOK01.01.1993 -2.59 01.01.2000 0.4910001.01.1994 0.12 01.01.2001 1.8801.01.1995 0.84 01.01.2002 4.995001.01.1996 -0.14 01.01.2003 4.52001.01.1997 0.75 01.01.2004 -2.2101.01.1998 0.31 01.01.2005 -6.70Dec. 97Dec. 98Dec. 99Dec. 00Dec. 01Dec. 02Dec. 03Dec. 04Dec. 05Dec. 06Dec. 0701.01.1999 -0.89 01.01.2006 -4.24 <strong>Storebrand</strong> adjusted for dividend OSEBXWhen shares are sold, the opening value/purchase price of the shareswill be adjusted by the total of the RISK amounts during the period ofownership. An overview and summary of RISK-values together with selectedhistorical acquisition values can be found at www.storebrand.no/ir.On 1 January 2006, new rules came into force in Norway concerningthe taxation of dividends and gains on shares held by privateindividuals. The new rules are termed the “shareholder model” andreplace the previous RISK and tax credit systems. Under the newshareholder model, the amount of a dividend, less a standard deduction,is taxable, currently at 28%. If shares are sold, any unutilisedstandard deduction can be deducted from the gain on sale. Thestandard deduction is calculated on the basis of the cost price of theshare multiplied by the average three-month interest rate on treasurybills, which is effectively the risk-free rate of interest. The interest ratefor calculating deductions in <strong>2007</strong> is set at 3.3%.ComplianceAs one of the country’s leading financial institutions, <strong>Storebrand</strong> isdependent on maintaining an orderly relationship with the financialmarkets and supervisory authorities. The company therefore places<strong>Annual</strong> <strong>Report</strong> <strong>2007</strong>29
particular emphasis on ensuring that its routines and guidelines satisfythe formal requirements imposed by the authorities on securitiestrading. In with connection this, the company has produced internalguidelines on trading in the company’s shares by insiders based oncurrent legislation and regulations. The company has its own compliancesystem to ensure that the guidelines are followed.Shareholders’ contact with the companyShareholders should generally contact the administrator of their shareaccount with queries and notices of changes, e.g. changes of address.<strong>Storebrand</strong>’s own shareholders’ office can also provide guidanceand information (Tel: (+47) 22 31 26 20).Investor Relations<strong>Storebrand</strong> places great importance on comprehensive and efficientcommunication with financial markets. Maintaining a continuous dialoguewith shareholders, investors and analysts both in Norway andinternationally is a high priority. The group has a separate investor relationsunit responsible for establishing and coordinating contact withanalysts, the stock exchange, shareholders, investors and others.All interim reports, press releases and presentations of interim reportsare published on the <strong>Storebrand</strong> website: www.storebrand.no.General meetings<strong>Storebrand</strong> has one class of shares, each carrying one vote. Thecompany holds its AGM each year before the end of June. Shareholderswho wish to participate in a general meeting must notify thecompany no later than 16:00 three business days before the meeting.Shareholders who do not give notice of attendance will be able toattend, but not vote.Financial calendar for <strong>Storebrand</strong> 200823 April : AGM24 April : Ex dividend30 April : 1st quarter results 200812 August: 2nd quarter results 200820 October: 3rd quarter results 2008February 2009: 4th quarter results 2008<strong>Storebrand</strong> share (NOK) <strong>2007</strong> 2006 2005 2004 2003Highest closing price 87.37 68.30 55.87 49.15 36.63Lowest closing price 54.60 48.10 39.49 33.94 17.22Closing price on 31.12. 56.70 66.62 48.94 49.15 36.38Market cap 31.12. (NOK million) 25 510 19 811 15 059 16 274 12 040Dividend for the accounting year 1.20 1 1.80 4.00 7.00 0.80<strong>Annual</strong> turnover (1,000 shares) 540 207 564 195 516 323 471 331 372 970Average daily turnover (1,000 shares) 2 161 2 248 2 041 1 863 1 492<strong>Annual</strong> turnover (NOK million) 39 338 39 825 30 318 22 149 12 842Rate of turnover (%) 186 222 187 169 134No. of ordinary shares at 31.12. (1,000) 449 910 249 819 258 526 278 181 278 070Earnings per ordinary share 7.95 6.03 5.41 8.49 2.67Total return (%) -13 44 13 38 67Historic share prices have been adjusted to take account of the split between shares and subscription rights implemented in <strong>2007</strong>.1In terms of the number of shares before the share issue, the dividend is equivalent to NOK 2.18 per share.30 <strong>Annual</strong> <strong>Report</strong> <strong>2007</strong>
Corporate governanceAs a large stock exchange listed company and an important participant in society, <strong>Storebrand</strong> iscommitted to building good relationships with its stakeholders, who include shareholders, corporatebodies, management, employees, customers, lenders, and society as a whole. Corporategovernance plays a central role in this objective, and defines the legal and operational frameworkby which <strong>Storebrand</strong> directs and controls its activities in order to create value for its stakeholders.The Norwegian Code of Practice for Corporate Governance addresses the following major topics:1) Implementation and reporting on corporategovernance6) General meetings 11) Remuneration of the board of directors2) Business 7) Nomination committee 12) Remuneration of the executive management3) Equity and dividends 8) Corporate assembly and board of directors:composition and independence13) Information and communications4) Equal treatment of shareholdersand transactions with close associates9) The work of the board of directors 14) Take-overs5) Freely negotiable shares 10) Risk management and internal control 15) AuditorThe full text of the Norwegian Code of Practice for Corporate Governance is available on the Oslo Stock Exchange's website: www.oslobors.no/ob/cg.<strong>Storebrand</strong> meets the requirements of the Norwegian Code of Practice for Corporate Governance. Deviations from the Code of Practice – neither the law nor the Articles of Associationrequire that a Deputy Chairman of the Board of <strong>Storebrand</strong> ASA be elected.In order to strengthen <strong>Storebrand</strong>’s work on corporate governancefurther, a special Corporate Governance Committee was establishedin 2006. The committee is responsible for ensuring good corporategovernance practice across the <strong>Storebrand</strong> group.In December 2004, a broadly based working group published a NorwegianCode of Practice for Corporate Governance. <strong>Storebrand</strong> hasbeen actively involved in developing the Norwegian Code of Practice.The Code of Practice takes into account international developmentsand other national codes, but is built on national considerations suchas Norwegian legislation and practice. The Code of Practice is updatedannually, most recently on 4 December <strong>2007</strong>. The rules of the OsloStock Exchange make it compulsory for listed companies to issue anannual statement of practice in accordance with the Norwegian Codeof Practice for Corporate Governance.An account of the major features of <strong>Storebrand</strong>’s corporate governanceis provided below. The account deals with a number of issuesthat are not included in the Code of Practice, but which we considerto be central to the discussion of corporate governance. The headingsused below refer to the equivalent sections of the Code of Practice,with comments on any deviations from the Code. We have chosento deal with certain other issues related to corporate governanceelsewhere. This applies to the account of the use of financial riskmanagement (pages 55–59), shareholder matters (sections 3, 4 and 5of the CoP), and corporate responsibility (pages 14–17).<strong>Storebrand</strong>’s principles for corporate governance correspond in all materialrespects with the Norwegian Code of Practice (CoP).IMPLEMENTING AND REPORTING THE GROUP’SOBJECTIVES, STRATEGIES AND VALUES(CoP sections 1 and 2)The Articles of Association of <strong>Storebrand</strong> ASA stipulate that it is theholding company of a financial institution and its objective is to manageits equity interests in the group in compliance with the relevantlegislation. The Articles of Association are available in their entiretyon the group’s website: www.storebrand.no.<strong>Storebrand</strong> launched its own principles for corporate governance in1998, and views the Norwegian Code of Practice as a natural extensionof its own principles. The Board of Directors (the Board) has resolvedthat the company shall adhere to the Norwegian Code of Practice, andits statement on adherence to the Code of Practice can be found onpage 26. An account of the definition and implementation of <strong>Storebrand</strong>’scorporate values can be found in the Corporate Responsibility<strong>Report</strong> and Action Plan for <strong>2007</strong>–2008, and also on pages 14–17 ofthis annual report. The group has produced guidelines for businessethics. Monitoring and compliance with these guidelines is subject toa thorough internal process. Further information in this respect can befound on page 26, and also in the Corporate Responsibility <strong>Report</strong> andAction Plan for <strong>2007</strong>–2008. Further information on the company’s objectivesand main strategies can be found on pages 38–39. In addition,<strong>Storebrand</strong> keeps the market advised of its objectives and strategiesthrough investor presentations held in connection with presentationsof its interim and annual accounts and other specialised presentations,such as the capital market days that are held every second year.Deviations from sections 1 and 2 of the Code of Practice: None<strong>Annual</strong> <strong>Report</strong> <strong>2007</strong>31
SHAREHOLDER MATTERS (CoP sections 3, 4 and 5)The Board continually monitors the company’s capital adequacy in thelight of its objectives, strategy and risk profile. The Board has establisheda clear and consistent dividend policy. The decision on payment of adividend is made by the <strong>Annual</strong> General Meeting (AGM), based on aproposal put forward by the Board. <strong>Storebrand</strong> ASA has only one classof shares, and Norwegian legislation does not permit shareholders toaccumulate votes from one matter in order to cast additional votes foranother matter (cumulative voting). <strong>Storebrand</strong> has no specific restrictionson ownership of shares or voting rights in the company other thanthe restrictions imposed by the Financial Institutions Act. All shares haveequal rights, and are freely negotiable. The Articles of Association do notimpose any limitations on the negotiability of <strong>Storebrand</strong> shares.For a complete account of shareholder matters, see pages 28–30.Deviations from sections 3,4 and 5 of the Code of Practice: NoneSTOREBRAND’S CORPORATE BODIES<strong>Annual</strong> General Meeting (CoP section 6)<strong>Storebrand</strong> ASA holds its AGM no later than the end of June eachRemuneration CommitteeCorporate BodiesGeneral meetingBoard of RepresentativesBoard of DirectorsChief ExecutiveOfficerControl FunctionExternal AuditorControl CommitteeAudit CommitteeInternal Auditoryear. The <strong>2007</strong> AGM was held on 25 April. In addition, an extraordinarygeneral meeting was held on 24 October <strong>2007</strong> in connectionwith the acquisition of SPP. All shareholders with known addressreceive written notice of the AGM by post, sent out no later than 14days before the AGM. The notice calling the meeting includes supportingpapers for all resolutions that will be considered by the meeting,including the candidates nominated by the Election Committee.The notice calling the meeting and supporting papers are publishedon the group’s website 21 days before the general meeting.All shareholders are entitled to attend general meetings, and arrangementsare also made for proxy voting. Shareholders can only exercisetheir formal rights through the general meeting. Norwegian law doesnot permit shareholders to exercise their rights through what is knownas ”written consent” (formal group action outside the general meeting).Deviations from section 6 of the Code of Practice: NoneElection Committee (CoP section 7)<strong>Storebrand</strong> ASA’s Articles of Association regulate the company’sElection Committee, which has four members. In accordance with theprovisions of the Articles of Association approved by the AGM, thechairman of the Board of Representatives is a permanent memberof the Election Committee and its chairman. The other members areelected by the AGM. The company’s employees elect an observer tothe committee, who participates as a full member in making recommendationsfor the election of the Chairman of the Board. TheElection Committee is independent of the company’s Board andmanagement, and its composition ensures a broad representationof shareholder interests. The Election Committee reviews the annualappraisal of the work of the Board, and is responsible for proposingcandidates to the Board of Representatives, the Board of Directors,the Control Committee and the Election Committee, and the remunerationof the members of these bodies. The Election Committeeapplies specific criteria, and works in accordance with a formal mandate.The members of the <strong>Storebrand</strong> ASA Election Committee arealso members of the election committees for <strong>Storebrand</strong> LivsforsikringAS (<strong>Storebrand</strong> Life Insurance) and <strong>Storebrand</strong> Bank ASA.Deviations from section 7 of the Code of Practice: <strong>Storebrand</strong>’sArticles of Association stipulate that the chairman of the Board ofRepresentatives is a permanent member of the Election Committeeand is the committee’s chairman. This means that the chairman of theElection Committee is not directly elected to this position by the AGM.However, the AGM elects 2/3 of the Board of Representatives, whichelects the chairman. The arrangement is therefore assumed to satisfythe principle that the composition of an election committee should bedecided by the AGM.Board of Representatives (CoP section 8)The Board of Representatives in <strong>Storebrand</strong> ASA is a legal requirement,and has 18 members, of which 12 are elected by the AGMand six by the group’s employees. Members are each elected for atwo-year term of office so that half the members retire each year.It is a statutory requirement that the members elected by the AGMshall reflect the company’s interest groups, customer structure and itsfunction in society. A broad cross-section of shareholders is representedthrough elections to the Board of Representatives.The duties of the Board of Representatives include making recommendationsto the AGM on the Board’s proposal for the annual reportand accounts, electing the six shareholder nominated directors, includingthe Chairman, to the Board of Directors, determining the feespaid to the directors, issuing the mandate for the work of the ControlCommittee and considering reports from the Control Committee. TheBoard of Representatives is entitled to make recommendations to theBoard of Directors on any matter.Deviations from section 8 of the Code of Practice: None32 <strong>Annual</strong> <strong>Report</strong> <strong>2007</strong>
Board of Directors (CoP section 8)The Board of Directors of <strong>Storebrand</strong> ASA (the Board) has nine members,who up to now have been elected for a two-year term of office.From 2008 it will be proposed that the company’s Articles of Associationbe amended such that the members of the Board are electedfor a one-year term of office. Six members are elected by the Boardof Representatives after considering recommendations made by theElection Committee. Three members are elected by and from the employees.The Chief Executive Officer of <strong>Storebrand</strong> ASA (the group’sCEO) is not a member of the Board. None of the members electedby the Board of Representatives have any employment, professionalor consultancy relationship with the group other than their appointmentto the Board. CVs for the members of the Board are providedon pages 18–26 and on the group’s website. The Board of <strong>Storebrand</strong>ASA satisfies the requirements concerning the independence of theBoard stipulated in the Norwegian Code of Practice.Deviations from section 8 of the Code of Practice: NoneThe work of the Board of Directors (CoP section 9)The Board meets at least nine times each year. In <strong>2007</strong>, the Boardheld 21 meetings and one Board conference. The attendance recordsof individual Board members can be found on the group’s website.The work of the Board is subject to a specific mandate. In order toensure sound and well-considered decisions, meetings of the Boardare well prepared so that all members can participate in the decisionmaking process. The Board prepares an annual schedule for itsmeetings and the issues to be considered. The agenda is set by theChairman based on the approved schedule for the year and a list ofmatters carried forward from previous meetings. Time is made availableat every second Board meeting to discuss matters without themanagement present. The Board is entitled to appoint external adviserswhenever it considers this necessary.The Board conducts an annual appraisal of its work, which is madeavailable to the Election Committee for consideration in their work oncandidates for the Board.Board committees (CoP section 9)The Board has established a Remuneration Committee and an AuditCommittee. Each comprises two shareholder elected and one employeeelected Board member. This helps to ensure thorough andindependent attention to matters such as financial reporting and theremuneration of senior employees. The committees assist the Boardby preparing matters for consideration, but decisions are taken by theentire Board. Both committees are able to hold meetings and considermatters without involvement from the company’s management.The Remuneration Committee monitors the remuneration of thegroup’s senior managers, and assists the Board in setting terms andconditions for the group’s CEO. The Remuneration Committee held sixmeetings in <strong>2007</strong>.The Audit Committee assists the Board by reviewing, evaluating andwhere necessary proposing appropriate measures in respect of thegroup’s overall controls, financial and operational reporting, riskmanagement and internal and external auditing. The Audit Committeeheld six meetings in <strong>2007</strong>. The external and internal auditors participatein the meetings.Deviations from section 9 of the Code of Practice: There is no requirementin legislation or the company’s Articles of Association for theappointment of a Deputy Chairman to the Board of <strong>Storebrand</strong> ASA.The Board may elect a Deputy Chairman if it so requires. The questionof electing a Deputy Chairman was considered in 2006, but wasnot considered necessary. The Board considers that such an appointmentcould cause undesirable differentiation between members of theBoard. When necessary, for example due to the absence of the electedChairman or because the Chairman is unable to participate in a particularmatter, the Board considers it sensible and appropriate to elect oneof its members as chairman of the meeting in question as required.Control CommitteeThe Control Committee of <strong>Storebrand</strong> ASA is a legal requirement, andhas five members elected by the AGM. The committee is independentof the company’s Board and management. Members are elected fora two-year term of office. The Control Committee is responsible forensuring that the entire group conducts its activities in a prudentand proper manner. Particular attention is paid to close collaborationwith the control committees of the group companies. The committeeensures that the group adheres to all relevant legislation andregulations, and that it operates in accordance with the Articles ofAssociation and resolutions passed by the group’s corporate bodies.The committee is entitled to look into any matter, and has accessto all relevant documentation and information. The committee hasthe power to demand information from any employee and anymember of the company’s corporate bodies. The Control Committeemet 10 times in <strong>2007</strong> and submitted a report on its work to theBoard of Representatives on 6 March <strong>2007</strong>. <strong>Storebrand</strong> Livsforsikring,<strong>Storebrand</strong> Skadeforsikring and <strong>Storebrand</strong> ASA have identical controlcommittees. <strong>Storebrand</strong> Bank has its own control committeeGROUP MANAGEMENTInternal management bodiesThe Chairman of the Board of <strong>Storebrand</strong> ASA is also the Chairmanof the Board of <strong>Storebrand</strong> Livsforsikring (<strong>Storebrand</strong> Life Insurance).<strong>Storebrand</strong> ASA’s CEO is the chairman of the boards of <strong>Storebrand</strong>Kapitalforvaltning (<strong>Storebrand</strong> Investments) and <strong>Storebrand</strong> Bank. Theother members of the boards of <strong>Storebrand</strong> Life Insurance, <strong>Storebrand</strong>Bank and <strong>Storebrand</strong> Investments are drawn from the group’s senioremployees, employee representatives, and external members withexpertise relevant to the business of the company in question.<strong>Storebrand</strong> relaunched its P&C insurance business in 2006, and thegroup’s Chief Financial Officer is the Chairman of the Board of the P&Cinsurance company. The acquisition of SPP Livförsäkring was completedon 21 December <strong>2007</strong>. As a consequence of this, a new group managementmodel was introduced with effect from 14 January 2008.<strong>Annual</strong> <strong>Report</strong> <strong>2007</strong>33
The Board has issued a written mandate setting out the managementresponsibilities of the CEO of <strong>Storebrand</strong> ASA. The role of the group’sCEO does not give rise to any conflicts of interest.<strong>Storebrand</strong>’s executive management is charged with implementingthe strategies approved by the Board, and is directly responsiblefor the group’s overall profitability and for making optimal use ofresources across the entire group. <strong>Storebrand</strong> works systematically tobuild up the system value of expertise across the group, and annuallycarries out succession planning for the entire executive managementteam which is dealt with by the Board. In addition, in order to ensurecontinuity of expertise in key positions, all the members of the executivemanagement team are subject to a written agreement to givesix months’ notice of termination of employment. Information on theexecutive management team can be found on page 36.Strategy andplanningCustomersDo we meetcustomers’demand foravailability, serviceand quality?Employee appraisalsand remunerationFinanceDo we meet ourowners’expectations forreturn?Skills/GrowthDo we meet theneed for continousimprovement?ProcessesDo we meet therequirements ofcost efficiency inour internalprocesses?Risk evaluationManagement reporting<strong>Storebrand</strong> CompassThe group’s management and monitoring of the business areas takesplace largely through the subsidiaries’ board meetings, executivemanagement meetings, business reviews and process reviews.Relationship between <strong>Storebrand</strong>’s corporate bodiesand control functions (CoP sections 10 and 15)The internal audit function in <strong>Storebrand</strong> is founded on a corporategovernance model, whereby management is based on group-widepolicies and internal regulations in areas such as ethics, informationmanagement and information security, as well as a value basedsystem for financial and operational risk. The group has a commoninternal audit function which carries out an independent review ofthe robustness of the management model. The internal auditor isappointed by and reports to the boards of the respective groupcompanies.and a risk assessment carried out by the group’s senior management.Internal audit produces quarterly reports for the boards. <strong>Report</strong>s fromspecial investigations initiated by internal audit or management inrespect of possible breaches of ethical rules are immediately reportedto the chairman of the Audit Committee and the group’s CEO, withcopies to the heads of Legal Services and Human Resources. Internalaudit is subject to a formal mandate in accordance with current legislation,regulations and international standards. The Control Committeeis entitled to use the resources of internal audit as required.Deloitte has been elected by <strong>Storebrand</strong> ASA’s AGM as the company’sexternal auditor. The Board of <strong>Storebrand</strong> ASA has appointed KPMG asthe company’s internal auditor. The other companies in the group usethe same external and internal auditors as <strong>Storebrand</strong> ASA.In addition to its own controlling bodies and external audit, the groupis subject to statutory supervision by Kredittilsynet (the FinancialSupervisory Authority of Norway). Kredittilsynet is responsible forsupervising financial institutions to ensure that they operate in aprudent and proper manner in accordance with legislation, businessobjectives and the Articles of Association. Kredittilsynet supervises allof <strong>Storebrand</strong>’s activities.The external auditor is elected by the AGM, and is responsible forthe financial audit of the group. The external auditor issues the auditreport concerning the annual accounts, performs a limited audit ofthe interim accounts, attends the Board meetings that approve thequarterly interim accounts, all meetings of the Control Committee,and attends meetings of the Audit Committee as appropriate. In<strong>2007</strong>, the Board decided that the external auditor must rotate thepartner responsible for the audit assignment every seven years. Theexternal auditor’s work and independence is evaluated every year bythe Board’s Audit Committee.<strong>Annual</strong> programs for internal audit work are determined by the boardsof the group companies, based on the auditor’s recommendations<strong>Storebrand</strong>’s value-based management system(CoP section 10)The management system is central to the internal audit function andis intended to ensure a correlation between targets and actions atall levels of the group and the overall objective of value creation. Thesystem is based on a balanced scorecard where the four dimensionsof finance, customers, processes and skills/growth reflect both shorttermand long-term value creation in the group.Each business area carries out an annual strategy and planning processused to produce a rolling three-year plan for the group, includingdetailed targets, strategies and budgets. The Board of <strong>Storebrand</strong>ASA is involved throughout the strategy and planning process.Risk evaluation and internal control reporting form an integral partof the strategy and planning process. The management teams workactively to identify areas of risk and measures to promote the company’sstrategy and objectives. This work is summarised in an internalcontrol report submitted to the Audit’s Committee and the boards.34 <strong>Annual</strong> <strong>Report</strong> <strong>2007</strong>
<strong>Storebrand</strong>’s management reporting system, <strong>Storebrand</strong> Compass,provides management and the Board with monthly reports onfinancial and operational performance relative to approved targets.The system highlights parameters that fall short of targets so thatappropriate measures can be implemented.The appraisal and remuneration of <strong>Storebrand</strong> employees forms anintegral part of the value-based management system, and is designedto ensure that the group’s strategies are implemented. Bonus paymentsare dependent on both the overall level of value creation andindividual performance. <strong>Storebrand</strong>’s remuneration systems followinternationally recognised principles. Remuneration does not includeshare options. Historical data on share options can be found in theannual reports for 2004 and earlier years.Management through group-wide policies and guidelinesGroup-wide policies have been approved for the following functionsin the <strong>Storebrand</strong> group: accounting, finance and risk management,investor relations, corporate communications, branding, IT, humanresources, legal services and corporate responsibility.Internal guidelines have been established for share trading by employeesand insiders. The <strong>Storebrand</strong> group’s Intranet also provides bothrules and practical guidance on the security of information, contingencyplanning, money laundering and financial crime.Business ethics and “whistle blowing”<strong>Storebrand</strong> has established ethical rules for the group and its employees.Business ethics and ethical dilemmas are a standard feature ofseminars for all new employees, and are discussed annually by all departments.Employees can seek advice anonymously from a businessethics page on the <strong>Storebrand</strong> Intranet, and can refer any concernsdirectly to the chairman of <strong>Storebrand</strong> ASA’s Audit Committee.Deviations from sections 10 and 15 of the Code of Practice: NoneRemuneration of the Board and executive management(CoP sections 11 and 12)The remuneration of the members of the Board is decided annually bythe AGM. The fees paid to the members of the Board are not linkedto profits, option programs or similar arrangements. The members ofthe Board do not receive incentive-based remuneration, but receivea fixed annual fee plus an additional payment for each Board meetingin excess of 11 meetings in any one year. The shareholder electedmembers of the Board do not participate in the company’s pensionarrangements. None of the shareholder-elected members of the Boardcarry out any duties for the company other than their appointment tothe Board. More detailed information on the remuneration, loans andshareholdings of the members of the Board can be found in notes 12(Group) and 15 (ASA) of the notes to the accounts. Members of theBoard are encouraged to hold shares in the company.each year, and from <strong>2007</strong> will be submitted to the AGM for requiredapproval. The guidelines are available on the group’s website. The salaryand other remuneration of the CEO are decided by the Board. Moredetailed information on the remuneration, loans and shareholdings ofthe members of the executive management can be found in notes 12(Group) and 15 (ASA) of the notes to the accounts. Members of theexecutive management are encouraged to hold shares in the company.Deviations from sections 11 and 12 of the Code of Practice: NoneInformation and communications (CoP section 13)The Board has issued guidelines for the company’s reporting of financialand other information and for contact with shareholders otherthan through the AGM. The group’s financial calendar is publishedboth on the Internet and in the company’s annual report. All reportingis based on the principle of openness and takes into account theneed for the equal treatment of all participants in the securities markets,and the rules concerning good stock exchange practice. Furtherinformation can be found on pages 28–30.Deviations from section 13 of the Code of Practice: NoneTake-overs (CoP section 14)The Articles of Association do not impose any restrictions on thepurchase of shares in <strong>Storebrand</strong>. The Board has determined guidingprinciples on how a take-over bid will be handled. The Board willensure that all shareholders are treated equally and have an opportunityto consider the presented bid. The Board will, as far as possible,obtain information about the bidder and make this available to allshareholders. The Board will also consider the bid and seek to issuea statement on the Board’s assessment of the bid. The Board will inthe event of any take-over bid seek, to the extent possible, to maximisethe shareholders’ assets.Deviations from section 14 of the Code of Practice: NoneOther mattersAs one of the largest investors in the Norwegian stock market, <strong>Storebrand</strong>has considerable potential influence over listed companies,and pays great attention to exercising its ownership on the basisof straightforward and consistent ownership principles. <strong>Storebrand</strong>applies the Norwegian Code of Practice for Corporate Governance inthis role, which represent a natural extension of the principles it firstestablished in 1998. <strong>Storebrand</strong> has issued guidelines with respect toemployees holding non-executive appointments in companies outsidethe group. The guidelines include restrictions on the number of suchappointments any employee may hold.Further information on <strong>Storebrand</strong>’s Corporate Governance can befound on www.storebrand.no/ir, including information on members of<strong>Storebrand</strong>’s corporate bodies, the company’s Articles of Associationand further information on its ownership principles as an investor.Guidelines for the remuneration of members of the executive managementhave previously been submitted to the AGM for information<strong>Annual</strong> <strong>Report</strong> <strong>2007</strong>35
Sitting from the left: Roar Thoresen, Göran Holgerson, Odd Arild Grefstad, Idar Kreutzer, Maalfrid Brath, Hans Aasnæsand Anders Røed. Standing from the left: Egil Thompson, Elin M. Myrmel-Johansen and Lars Aa. Løddesøl.<strong>Storebrand</strong>’s Executive ManagementRoar Thoresen (50), Executive Vice President, Chief OperatingOfficer. Programme for Executive Development (PED), IMD Lausanne,Master of Science, Naval Technology, Norwegian Institute of Technology(NTH), 2002–2006 Executive Vice President, Strategic Business Development,<strong>Storebrand</strong> ASA, 1989–2002 Consultant, Managing Partner andCEO, PA Consulting AS, 1986–1989 Vice President, Mandator AS.Göran Holgerson (47), Executive Vice President, SPP, ManagingDirector, SPP. A-Levels, Bromma Gymnasium. 2006–<strong>2007</strong> Head of BusinessArea SPP and Deputy Managing Director, SPP, 2003–2006 ManagingDirector, SPP, 2002–2004 Integration Director, Handelsbanken Lifeand SPP, 1998–2002 Deputy Managing Director, Handelsbanken Lifewith responsibility for conversion to a plc.Odd Arild Grefstad (42), Executive Vice President, Chief FinancialOfficer. State Authorised Public Accountant and Authorised FinancialAnalyst (AFA), Norwegian School of Economics and Business Administration(NHH), 1998– 2002 Head of Business Control, <strong>Storebrand</strong> ASA,1997–1998 Group Controller, Life Insurance, <strong>Storebrand</strong> ASA, 1994–1997Vice President, Internal Audit, <strong>Storebrand</strong> ASA, 1989–1994 Arthur Andersen& Co.Idar Kreutzer (45), CEO. Master’s degree in economics and businessadministration, Norwegian School of Economics and Business Administration(NHH), 1995–2000 CFO <strong>Storebrand</strong>, 1992–1995 various positionswithin corporate finance and internal audit <strong>Storebrand</strong>, 1988–1991Director, Medinor Project, 1986–1987 Political Advisor, City of Oslo.Maalfrid Brath (42), Executive Vice President, Business Development.State Authorised Accountant, Norwegian School of Economicsand Business Administration (NHH) and Master of General Business,Norwegian School of Management (BI), 2004–<strong>2007</strong> Executive VicePresident, Retail Market, <strong>Storebrand</strong>, 2002–2004 Executive Vice President,<strong>Storebrand</strong> Private Sector Distribution, 1999–2002 Senior VicePresident, <strong>Storebrand</strong> Livsforsikring AS, 1997–2002 Managing Director,<strong>Storebrand</strong> Fondsforsikring AS, 1995–1996 Vice President, Internal Audit,<strong>Storebrand</strong> ASA, 1989–1995 Arthur Andersen & Co.Hans Aasnæs (44), Executive Vice President, Long Term Savingsand Asset Management, Managing Director, <strong>Storebrand</strong> Investments.Agronomist, Agricultural University of Norway, Advanced Studies BusinessAnalysis, Norwegian School of Economics and Business Administration(NHH), Authorised Financial Analyst (AFA), programme for Executivedevelopment (IMD), 2001–2005 Investment Director, <strong>Storebrand</strong>Investments, 1994–2001 Head of Norwegian and International Equities,<strong>Storebrand</strong> Investments, 1990–1994 Derivatives Specialist, Orkla Finans.Anders Røed (39), Chief Marketing Officer, Master’s degree in economicsand business administration, Norwegian School of Management(BI) and Ecole Superieur de Commerce de Paris (ESCP). 2004–<strong>2007</strong>Market ing Director, <strong>Storebrand</strong> ASA, 2000–2004 Marketing Director,TINE BA, 2000 Sales Director, TINE BA, 1998–2000 Marketing Manager,TINE BA.Egil Thompson (43), Executive Vice President, Corporate Communications.Master of Science in Political Science, University of Oslo,1999–2000 Deputy Director, Corporate Communications, <strong>Storebrand</strong>ASA, 1994–1999 journalist and head of editorial staff Aftenposten,1990–1994 journalist, NTB.Elin M. Myrmel-Johansen (34), Executive Vice President, CorporateResponsibility. Master of Science in Political Science, University ofBergen, Master of Science in Comparative Politics, LSE, UK, 2005–2008Manager, Corporate Responsibility, <strong>Storebrand</strong>, 2004–2005 InternalBrand Manager, <strong>Storebrand</strong>, 2002–2003 Acting Manager, CorporateResponsibility, <strong>Storebrand</strong>.Lars Aa. Løddesøl (43), Executive Vice President, Life and PensionNorway, Managing Director, <strong>Storebrand</strong> Life Insurance. Master ofGeneral Business, Norwegian School of Management (BI), MBA, Thunderbird(AGSIM), USA, 2004–<strong>2007</strong> Executive Vice President, CorporateLife (2003-2004 Senior Vice President, <strong>Storebrand</strong> Bank), 2001–2004Executive Vice President, Finance Director, <strong>Storebrand</strong> ASA, 1994–2001Vice President, Citibank International plc, 1990–1994 Asst. Treasurer,Scandinavian Airlines Systems.36 <strong>Annual</strong> <strong>Report</strong> <strong>2007</strong>
Management report:Financial performance andbusiness developmentThis report provides an account of the <strong>Storebrand</strong> group’s financial performance and businessdevelopment in <strong>2007</strong> set against the background of historical performance and the trendsapparent at the start of 2008. The strategic background for the acquisition of SPP can be foundin a separate article earlier in this report.This report should be read in conjunction with the information provided in the <strong>Report</strong> of the Board of Directors, the consolidated accounts andnotes to the accounts. Further information on the accounts and notes to the accounts for subsidiaries can be found in the subsidiaries’ annualreports.Key figures – strategic and financial developmentSummary of key figuresAll amounts in NOK million unless otherwise stated <strong>2007</strong> 2006 2005 2004 2003Group Group profit 2 020 1 585 1 453 2 555 894LifeInsuranceEarnings per ordinary share 7.95 6.03 5.41 8.53 2.67Return on equity 1 24% 19% 17% 27% 9%Ordinary dividend per share 1.20 1.80 1.50 1.20 0.80Extraordinary dividend per share 2.50 5.80Average number of shares (in million) 251.5 248.0 258.6 272.9 277.9Capital ratio 9.2% 10.6% 11.2% 15.3% 14.9%Total policyholders' funds (traditional life insurance) 241 757 146 155 134 515 121 066 108 760Total policyholders' funds (unit linked and defined contribution pension) 39 208 7 364 5 719 4 476 3 975Total premium income (excl. policy transfers) excl. SPP 16 578 13 069 16 805 15 822 9 754Balance of pension transfers (incl. unit linked) excl. SPP 1 056 5 260 564 -758 1 493Operating costs at % of policyholders' funds 2 excl. SPP 1.21% 1.10% 1.10% 0.96% 1.00%Booked investment return excl. SPP 8.86% 7.12% 6.89% 6.41% 7.26%Value-adjusted investment return(excl. unrealised gains on hold to maturity bonds) excl. SPP 7.26% 8.28% 7.55% 7.19% 8.84%Risk capital in excess of minimum requirement(excl. unrealised gains on hold to maturity bonds) excl. SPP 15 512 16 773 13 583 11 053 8 941Bank Net interest margins 1.07% 1.32% 1.59% 1.69% 1.85%Cost/ income 70% 76% 62% 84% 87%Deposits/ loans 47% 43% 42% 48% 55%Gross lending 37 096 31 181 26 758 24 047 22 661Retail mortgages as proportion of total lending 64% 54% 55% 55% 48%Volume of non-performing and loss-exposed loans 448 533 754 909 1 717Loan loss provisions as % of non-performing and loss-exposed loans 68% 81% 64% 62% 49%<strong>Storebrand</strong> Total funds under management 227 356 216 900 204 800 165 000 158 800InvestmentsOf which funds under management for external clients 57 661 54 800 49 700 25 400 38 500Percentage of total funds under management invested in equities 23% 22% 23% 21% 17%Ratio of external funds under management retail/ institutional clients (%) 14 / 86 19 / 81 20 / 80 26 / 74 17 / 83Total net new business 2 867 3 200 23 300 1 600 800Cost/ income 3 65% 64% 91% 86% 93%Figures for 2004-<strong>2007</strong> are based on IFRS. Figures for 2003 are based on NGAAP.1 Post-tax profit/ (Opening equity – provision for dividend – 50% of own shares pruchased during the year)2 <strong>2007</strong> includes 14 basis points and 2005 includes 10 basis points of non-recurring costs in respect of pensions3 Including net financial income and other income.<strong>Annual</strong> <strong>Report</strong> <strong>2007</strong>37
The group’s strategic developmentThe overall strategy has been expanded to include Nordic lifeinsurance and pensions. With SPP as an integrated part of the business,the <strong>Storebrand</strong> group’s vision has changed to: “<strong>Storebrand</strong>´sobjective is to be the leading and most respected institution in theNordic market for long-term savings and insurance.”This vision indicates that <strong>Storebrand</strong>’s long-term ambition is to be aleading Nordic player within the group’s core areas.At the same time, the group is determined to be a “respected institution”.This means that the growth targets will be attained by continuingthe work on customer satisfaction with competent, motivatedstaff and by taking its corporate responsibilities seriously.• Investment advice for affluent retail customers• The sale of financial services through direct channels• The corporate responsibility profile of the products and the groupThe implementation of the new corporate structure in January 2008 isan important means of realising this customer oriented focus withinthe aforementioned areas.Aggressive adaptation to important changes in regulatoryframework: The major changes taking place in the regulatory frameworkwill affect nearly all parts of <strong>Storebrand</strong>. The biggest changesare taking place within the area of life insurance and a brief descriptionof the most important regulatory changes and <strong>Storebrand</strong>’sresponses is provided below.A vision has been defined for SPP that results in a differentgeographic and product-related scope compared with the group’svision: “SPP shall be Sweden’s leading and most respected institutionwithin pensions”. SPP’s vision means that it should deliver the sameenhanced value as the rest of the group.The market for financial services is becoming increasingly complex,as can been seen from the changes in customer composition, thecompetitive situation and the general conditions. The customershave differing needs, and their priorities vary as far as products andservices models are concerned. The general conditions are undergoingsignificant change, exemplified by the new legislation for life insurancein Norway, the international Solvency II regulations, the opening up ofthe transfer market for occupational pensions in Sweden and stricterrequirements concerning competence within investment advice (MiFiD).Pensions reform in Norway: In the spring of <strong>2007</strong>, the Norwegianparliament adopted new principles for earning and drawing a stateretirement pension. The settlement agreed in the spring of <strong>2007</strong>clarifies how pension rights will be earned and how the new statepension can be drawn. The government has also announced that itintends to conduct an overall assessment of the need for changes inthe laws governing occupational pensions in the private sector. Thepension reform comes into force in 2010, and the occupational pensionslegislation must be amended to take account of the changesto the national insurance pension scheme. <strong>Storebrand</strong>’s goal is toincrease its competitiveness as a consequence of this by developingnew customer solutions and good customer communication. Asfar as expectations are concerned, the sector will in general have ashort space of time in which to adapt between the stipulation of theregulations and their implementation.<strong>Storebrand</strong> has positioned itself in recent years to meet these challenges,and to take advantage of the new opportunities the marketoffers. The overall strategy has remained the same and within ourcore activities our attention has been focused on the following areas:• Satisfactory financial situation• Continuous efficiency improvements• Satisfied customers and profitable products• Competent and motivated staff• Continuing our work on corporate responsibilityStrategic priorities: The <strong>Storebrand</strong> group is facing continuouschanges in the competition situation and general conditions. Thisis making great demands with respect to changes in the organisation,core processes and IT systems. <strong>Storebrand</strong> has focused on crossselling, competitiveness (productivity) and the new life insurance actthroughout <strong>2007</strong>. This work will be continued in 2008, but there willbe greater emphasis on the group’s opportunities for growth. The followingareas have the greatest strategic value for the group:Solvency II: In <strong>2007</strong>, the draft EU framework directive for Solvency IIwas presented to the European Parliament and the Council of Europeby the European Commission. The implementation date is expected tobe 2012 at the earliest. However, companies that wish to use internalmodels to assess the capital required to operate their businessshould have a system like this up and running a few years prior to theimplementation of all the regulations. One of the key principles ofSolvency II is that both the company’s assets and liabilities should bevalued at their fair value on an ongoing basis. <strong>Storebrand</strong> has playedan active role in understanding and producing information about, andpossible solutions to, the particular challenges Norway faces due tothe Solvency II regulations. A good network of contacts has beenestablished with the relevant agencies in Norway and the EU, and thework on producing good adaptations to the regulations will continueduring the period up to their implementation. In order to ensurethey are well prepared and understand the implications of SolvencyII, <strong>Storebrand</strong> and SPP are actively participating in various quantitativestudies being conducted for the entire European insurance sector(QIS).• Financial security and pension savings products for the employeesof corporate customers (pension schemes) and the retail marketStatutory, individual tax-stimulated pension saving in Norway:A draft new act concerning individual pension saving (IPS) will be38 <strong>Annual</strong> <strong>Report</strong> <strong>2007</strong>
presented and dealt with in the Norwegian parliament, before thesummer of 2008. <strong>Storebrand</strong> has actively worked with the politicalparties in this case and was represented on the Banking Law Commission’sworking group (“Think Tank”) which drafted the new act.The main features of the new regulations appear to be that individualswill have an annual savings limit of NOK 15,000 and that the taxdeduction will represent 28 per cent of the amount paid in. The draftact facilitates individual additional savings for the group pensionschemes. This provides important opportunities for <strong>Storebrand</strong>, whichhas about 200,000 mandatory occupational pension scheme (OTP)members with defined contribution pensions. In addition, the draftact allows more transfers and the merging of different types of pensionrights (IPA, IPS and paid-up policies). This provides further newopportunities for <strong>Storebrand</strong>.The opening up of the transfer market for occupationalpensions in Sweden: In <strong>2007</strong>, the Swedish government allowed certainoccupational pension schemes to be transferred between playersin the market. However, because of a fear of tax leaks to othercountries, the ability to transfer was stopped until the tax authoritieshad come up with satisfactory solutions. In December <strong>2007</strong>, theauthorities reported that satisfactory reporting routines had beenestablished and that the transfer of contributions-based occupationalpensions would be permitted from May 2008. <strong>Storebrand</strong> expects thecompetition dynamic in the Swedish occupational pension market tobe significantly affected, which SPP will target aggressively.New regulations for life insurance were introduced in Norway at thestart of 2008. These are described in more detail on pages 49–50.Capital efficiency: <strong>Storebrand</strong>’s subsidiaries currently have sufficientcapital resources for the growth expected over the next fewyears. <strong>Storebrand</strong> ASA (the holding company) aims to achieve zeronet indebtedness over time. This implies that liquid assets shall beequivalent to the level of interest-bearing liabilities. Maintaining anefficient capital base is one of the essential factors in ensuring thatthe company is able to generate a satisfactory annual profit relativeto the group’s equity (return on equity). Due to the acquisition ofSPP, the life insurance activities, including occupational pensions, nowconstitute a relatively large proportion of <strong>Storebrand</strong>’s exposure andcapital, and asset management is even more important. Basel 2 andSolvency II entail a greater emphasis on financial capital managementsince assets and liabilities must be valued at their fair value.Increased focus on corporate responsibility: <strong>Storebrand</strong> has systematicallyworked on corporate responsibility for more than 13 years.We have set new targets and developed group standards for corporateresponsibility in <strong>Storebrand</strong> by continuously developing and improving.<strong>Storebrand</strong> is well positioned and among the leading companies inNorway and the world in this area, which its qualification for the DJSI,FTSE4Good, Global 100 and Global Challenges Index confirms. <strong>Storebrand</strong>has also ensured that the group is among the world’s leaderswithin socially responsible investments. In its future work, <strong>Storebrand</strong>will prioritise maintaining its leading position, and profiting furtherfrom this in its sales work. This work includes clear goals and followup,improved customer communication and product development.Financial objectives for the group<strong>Storebrand</strong> has published financial objectives for the group and foreach business area. This provides the basis for setting targets foreach department and employee. <strong>Storebrand</strong> has communicated itsfinancial objectives to the capital market. The group’s financial goalswere adjusted in February 2008 due to the acquisition of SPP. Theadjusted objectives represent a sound and efficient use of capital,increased productivity, and growth in profitability and dividendsReturn on equity after tax 1 15%<strong>Annual</strong> dividend as percentage of group profit 1 after tax >35%Capital adequacy – banking >10%Life insurance company solvency margin >150%Life insurance company ratingA levelAdministration result for products not subject to profit sharing(traditional group pension Norway)>0Cost/income (C/I) <strong>Storebrand</strong> Investments in 2009
the year. It was therefore consolidated into the accounts based onthe equity in the SPP group as per 31 December <strong>2007</strong>. The acquisitiontherefore has no effect on the profit in <strong>2007</strong>. The <strong>Storebrand</strong> LifeInsurance group’s balance sheet as per 31 December <strong>2007</strong> is <strong>Storebrand</strong>Holding AB’s balance sheet with the consolidation of underlyingcompanies.Group profit in <strong>2007</strong>NOK million <strong>2007</strong> 2006 2005 2004 2003Life insurance 1 635 1 198 1 229 941 800Asset management 138 156 24 47 22Banking 235 190 241 121 -137Other activities 1 12 41 -41 1 446 209Group profit 2 020 1 585 1 453 2 555 894Change in P&C security9 0 10 16 66reserves etc.Profit before tax 2029 1 585 1 463 2 571 960Tax -20 -79 -41 -218 -169Profit for the year 2 009 1 506 1 422 2 353 791Figures for 2004–<strong>2007</strong> are based on IFRS. Figures for 2003 are based on NGAAP.1 Includes NOK 1,571 million of profit contribution from the sale of shares in If Skadeförsäkringin 2004.Strong group profit. The group reported a profit of NOK 2,020 millionfor <strong>2007</strong> compared to NOK 1,585 million in 2006. Earnings pershare, based on the average number of shares outstanding, amountedto NOK 7.95 in <strong>2007</strong> and NOK 6.03 in 2006. Further informationabout the individual business areas can be found on pages 41–55.Capital situation<strong>Storebrand</strong> pays particular attention to the active management of itsequity and borrowings. This management is tailored to the business’financial risk and capital requirements in which the composition of itsbusiness areas and their growth will be an important driver for thegroup’s capital requirements. The goal of the capital managementis to ensure an effective capital structure and reserve an appropriatebalance between internal goals in relation to regulatory and the ratingcompanies’ requirements.The group has set long-term targets for the capital ratio of its bankingactivities to be 10 per cent and the life insurance solvency marginto be at least 150 per cent. <strong>Storebrand</strong> Life Insurance also aims to berated at the A level. The holding company aims to have a net debtratio of zero over the longer term.<strong>Storebrand</strong> ASA (the holding company) held liquid assets of NOK 1.7billion at the close of <strong>2007</strong>. <strong>Storebrand</strong> ASA also has an undrawnlong-term committed credit facility of EUR 225 million. At the end ofthe year, <strong>Storebrand</strong> ASA had a net debt ratio of 22 per cent. Theincrease in relation to 2006 was due to the taking out of a syndicatedloan for NOK 4.6 billion in connection with the acquisition ofSPP. The loan will be repaid when <strong>Storebrand</strong> Livsforsikring AS takesup a new subordinated loan in the market. The solvency margin in the<strong>Storebrand</strong> Life Insurance group at the end of the year was 136 percent. The reduction in the solvency margin was due to the acquisitionof SPP and consolidation effects due to the acquisition. <strong>Storebrand</strong>Bank’s capital adequacy was 10.5 per cent and was thus above theinternal target of 10 per cent.The table below shows the development in key capital figures for thegroup:<strong>Storebrand</strong>'s capitalsituation – key figures <strong>2007</strong> 2006 2005 2004 2003<strong>Storebrand</strong> group:Capital adequacy: 9.2% 10.6% 11.2% 15.3% 14.9%Core capital adequacy: 6.3% 7.7% 7.8% 10.9% 9.9%<strong>Storebrand</strong> ASA:Net debt ratio 1 : 22% -4% -9% -29% 15%<strong>Storebrand</strong> Life Insurancegroup:Capital adequacy: 10.0% 9.7% 11.0% 14.5% 15.9%Core capital adequacy: 5.9% 6.5% 7.0% 9.0% 9.4%Solvency margin: 136.1% 174.6% 175.9% 174.3% 158.8%SPP:Solvency margin: 178% 310% 140% 139% 124%<strong>Storebrand</strong> Bank ASA:Capital adequacy: 10.5% 11.0% 10.4% 13.8% 12.3%Core capital adequacy: 7.9% 8.8% 8.2% 11.6% 9.8%1 Net debt ratio is debt minus liquid assets divided by assets minus liquid assets.Calculated in accordance with IFRS (2003 is based on NGAAP).<strong>Storebrand</strong> ASA’s dividend policy shall contribute towards givingshareholders a competitive return and optimising the company’scapital structure. The Board of Directors of <strong>Storebrand</strong> ASA has recommendedthat the 2008 AGM should approve a dividend paymentfor <strong>2007</strong> of NOK 1.20 per share, representing a total distribution ofNOK 534 million. The dividend has been proposed on the basis of thenumber of shares prior to the acquisition and accompanying shareissue, which took place at the end of the <strong>2007</strong>. Seen in relation tothe number of shares prior to the issue the dividend is equivalent toNOK 2.18 per share.<strong>Storebrand</strong> ASA repurchased 1 million of its own shares in <strong>2007</strong> atan average price of NOK 92.88 per share, representing a total costof NOK 93 million. The shares were purchased through the stockexchange over eight trading days. The company sold 236,300 sharesin connection with the share purchase scheme for employees, raisinga total of NOK 15 million.In connection with the acquisition of SPP, <strong>Storebrand</strong> ASA conducteda share issue in December that resulted in a net increase in equityamounting to NOK 8,670 million. 200,090,786 new shares were issuedat a subscription price of NOK 45 per share. The share capitalwas correspondingly raised to 449.9 million shares. In <strong>2007</strong>, the annualgeneral meeting gave the Board authority to purchase up to 1040 <strong>Annual</strong> <strong>Report</strong> <strong>2007</strong>
per cent of its own shares until the annual general meeting in 2008.At the end of <strong>2007</strong>, <strong>Storebrand</strong> owned 5.3 million of its own shares.TaxIn recent years, the <strong>Storebrand</strong> group has experienced low tax costs.In Norway, the normal tax rate for limited companies is 28 per cent,while the effective tax rate for the group in <strong>2007</strong> was 1 per cent.<strong>Storebrand</strong>’s tax rate is affected by several factors that result in adeparture from the normal tax rate. The largest deviations are associatedwith the activities of <strong>Storebrand</strong> Life Insurance, which haspermanent differences linked to investments in shares within theEEA area. According to the taxation exemption principle, gains anddividends from such shares are not taxable, and similarly losses onsuch shares are not tax deductible. Given the group’s sizeable taxlosses carried forward and the low tax rate expected for the life insuranceactivities in normal financial market conditions, it is unlikely that<strong>Storebrand</strong> will pay any tax for several years.At the end of <strong>2007</strong>, there was a basis for entering into the balancesheet a deferred tax asset of NOK 11.5 billion. Please refer to note 7in the consolidated annual accounts.Tax losses carried forward wasNOK 12 billion and tax allowances was NOK 1.4 billion. Tax allowancescan be carried forward for 10 years, but expire if not used within thisperiod. The deferred tax asset is recognised in the balance sheet whenit is likely that the companies in the group will in the future have a sufficienttaxable basis to utilise the tax asset. The basis for the deferredtax asset has been written down by more than NOK 12 billion in theannual accounts for <strong>2007</strong>, and this is due to the uncertainty aboutwhether future taxable income will reach a level that will allow the taxlosses carried forward to be used. The consolidated accounts contain anet deferred tax asset of NOK 0.4 billion, which was due to a deferredtax asset arising in connection with the acquisition of SPP.<strong>Storebrand</strong> has acquired a major business in Sweden with the acquisitionof SPP. The losses carried forward cannot be utilised acrossnational borders and the Swedish business will be assessed on anindependent basis when it comes to tax. SPP was purchased by aSwedish holding company financed by both equity and a subordinatedloan. The tax rate and payable tax in the Swedish business will beaffected by the interest costs of the loan in the holding company, theorganisation of the asset management business and the amortisationof intangible assets. It is expected that the tax costs for the Swedishbusiness will be limited.INFORMATION ABOUT THE BUSINESS AREASLife insurance activitiesAcquisition of SPPOn 3 September <strong>2007</strong>, <strong>Storebrand</strong> signed an agreement with Handelsbankenconcerning the take-over of SPP as well as associatedcompanies, including the fund management company SPP Fonderand Euroben. The acquisition was approved by <strong>Storebrand</strong>’s Boardof Representatives and an extraordinary general meeting in October<strong>2007</strong>. Approval was granted by the Ministry of Finance on 16 November<strong>2007</strong>. The transaction was completed on 21 December <strong>2007</strong>.SPP is a leading Swedish life insurance and occupational pensionsprovider. SPP provides unit-linked products, traditional insurance anddefined benefit pension products, as well as advice services thatcover occupational pensions and insurance, and administration solutionsfor municipalities and other organisations. With the acquisitionof SPP, <strong>Storebrand</strong> will create the leading life insurance and pensionsprovider in the Nordic region with proforma premium income for <strong>2007</strong>amounting to NOK 27 billion. <strong>Storebrand</strong> has a two-year option totake-over Handelsbanken’s remaining occupational pension businessin Handelsbanken Liv, and has signed a three-year agreement to bethe exclusive provider of occupational pensions in Handelsbanken’snetwork of branches.No significant accounting effects occurred between the time thetransaction was concluded and up to 31 December <strong>2007</strong>. It wastherefore consolidated into the accounts based on the equity in theSPP group as per 31 December <strong>2007</strong>. The acquisition therefore has noeffect on the profit in <strong>2007</strong>.The trends within the Nordic and European markets for life andpension insurance reinforce the basis for establishing transnationalactivities. The harmonisation of general conditions and productsmake the transnational synergies clearer and easier to realise.In addition, the new regulations result in capital synergies fromgeographic diversification. Concrete effects have been defined in anumber of areas that entail that <strong>Storebrand</strong> and SPP can benefit fromeach other’s strengths and experience. For example, SPP will be ableto draw on <strong>Storebrand</strong>’s long experience in the pensions transfermarket when the Swedish market is expected to permit the transferof pension schemes in the spring of 2008. SPP’s product scale andlong experience from the provision of unit-linked products will benefit<strong>Storebrand</strong> during the Norwegian market’s transition from traditionalpolicies to unit-linked products. Please also refer to the separatearticle about SPP on pages 10–13.<strong>Storebrand</strong> Life Insurance (Norwegian activities)Market and strategyThe strong position will be developed further. <strong>Storebrand</strong> Life Insuranceis one of the leading companies in Norway for pensions andlife insurance products for private individuals, companies and publicsector bodies. The company has a market share of 29 per cent interms of policyholders’ funds in the Norwegian life insurance market.This market is expected to grow significantly, and <strong>Storebrand</strong> intendsto develop its position by delivering customer-oriented and attractiveproduct solutions.Norway’s most satisfied customers: <strong>Storebrand</strong> Life Insurance’sobjective is to be recognised by customers as the most respected andcustomer-focused life insurance company in Norway. <strong>Storebrand</strong>’scompetitive position was confirmed by the number of major new customersit won in <strong>2007</strong>, as well as the high level of customer satisfactionreported by the Norwegian Customer Barometer survey.<strong>Annual</strong> <strong>Report</strong> <strong>2007</strong>41
Group pension insurance represents the major part of activitiesas measured in terms of both policyholders’ funds and profit tothe owner. Group pension insurance accounted for 76 per cent of<strong>Storebrand</strong>’s policyholders’ funds as per 31 December <strong>2007</strong>, while individualpensions and life insurance products represented 24 per centof total policyholders’ funds. In terms of profit to the owner, grouppension insurance contributed 65 per cent, personal life insuranceproducts contributed 29 per cent and group life insurance contributed6 per cent in <strong>2007</strong>.With the introduction of mandatory occupational pensions (OTP) in2006, when around 700,000 employees received occupational pensions,the majority of employees in the private sector are now coveredby defined contributions based occupational pension schemes.The last few years have been characterised by an increasing transitionfrom defined benefit based pension to defined contributions basedpensions. The most important factor for companies that implementthis restructuring is more predictable costs.Defined contribution pensions accounted for only 2 per cent of theoccupational pensions market in 2002. During <strong>2007</strong>, the number ofemployees covered by defined contribution schemes surpassed thenumber covered by defined benefit schemes. However, in terms ofthe value of accumulated pension assets, defined benefit schemeswill continue to dominate for the foreseeable future.The market for paid-up policies is set to grow strongly in future yearsbecause of the introduction of mandatory employers’ pensions andincreasing numbers of companies switching from defined benefit todefined contribution schemes. Paid-up policies are individual insurancepolicies that are issued when a group defined benefit scheme is woundup or when an employee leaves a company with a defined benefitscheme. This market is expected to become more competitive, and hasattracted new participants. <strong>Storebrand</strong> intends to respond aggressivelyto this competition, offering a competitive product and long experiencein managing pension assets to ensure financial security for thecustomer. In recent years, <strong>Storebrand</strong> has made significant savings inthe cost of managing paid-up policies through improved efficiency.The Norwegian pension reform will be implemented in 2010. The pensionssettlement agreed in the Norwegian parliament in the spring of<strong>2007</strong>, clarifies how pension rights will be earned and how the newstate pension can be drawn. The government has presented proposalamendments to legislation that will implement the settlement. Thejob of adapting to the new state pension will start once these legislativeamendments have been passed. Among the changes that willaffect the occupational pension schemes are the new earnings rulesthat will make one’s final pay level less relevant as a basis for a pension,and a flexible retirement age.The pensions settlement agrees to introduce a new scheme for taxstimulatedindividual pension saving (IPS). The annual savings limitwill be NOK 15,000 and the tax rules will be the same as for earlierindividual pension saving (the IPA scheme), i.e. a tax credit equivalentto 28 per cent of the paid in amount. Payments will be taxed aspension income. People will be able to link individual pension savingto the occupational pension scheme. This enables, for example,employees with OTP to simply supplement the employer’s saving onan individual basis. The scheme will apply with affect from the 2008tax year. A group project has been set up to establish IPS and ensurea good market position.<strong>Storebrand</strong> wants to stimulate an increased focus on health, safetyand the environment (HSE) by our customers’ in both the private andthe public sector. A systematic focus on HSE results in better satisfactionand improved life quality for employees. The corporate customerswill experience better value creation and lower sick leave costs, aswell as lower insurance premiums. Lower sick leave and fewer newpeople on disability pensions will also result in substantial savings forsociety as a whole. Our HSE advice helps corporate customers to improvetheir working environments and reduce sick leave. In the caseof the public sector, <strong>Storebrand</strong> has established an HSE and seniorpolicy fund. The fund can be used for various HSE measures, as wellas training and education. In addition, <strong>Storebrand</strong> offers health insuranceand HSE advice to municipalities and other public sector entities.Throughout <strong>2007</strong>, <strong>Storebrand</strong> has increased the number of productsbought by each individual customer and this work on cross-sales willcontinue in 2008. Customer satisfaction, customer loyalty and the durationof customer relationships increases with the number of products.The increase in the number of product relationships will resultin more satisfied customers and at the same time increase earnings.Gaining 200,000 new OTP customers during the course of the lasttwo years has provided us with a very good basis for succeeding withcross-sales. The new IPS product will be an important cross-salesproduct in 2008 and beyond.The introduction of the EU directive “Markets in Financial InstrumentsDirective” (MiFiD) on 1 November <strong>2007</strong> is affecting players inthe savings market. The directive provides consumers in the savingsmarket with greater protection and prohibits providing advice withouta licence. Advisers are also obliged to investigate the customer’sfinancial situation and conduct various tests to assess which productsare best suited for the customer. In the second half of the year,<strong>Storebrand</strong> actively worked to implement the MiFiD regulations, andthe new routines have been well received by advisers and customers.Work on improving the efficiency of customer service and settlementsystems continued in <strong>2007</strong>. The objective of this program is toaddress efficiency in all units before the start of 2009. The targetis to improve efficiency by more than 20 per cent in all these units.Improvements of over 30 per cent have already been achieved insome of the business processes. Improving efficiency also plays a rolein ensuring that the company can cope with growth in the companywhile at the same time improving customer satisfaction.42 <strong>Annual</strong> <strong>Report</strong> <strong>2007</strong>
Financial results for <strong>2007</strong>The total contribution of profit from the life insurance activities togroup profit pursuant to IFRS amounted to NOK 1,635 million in <strong>2007</strong>compared with NOK 1,198 million in 2006. The following table showsthe breakdown of this profit contribution between the life insurancebusiness areas.The following sections provide an account of the financial results of<strong>Storebrand</strong> Life Insurance. This is followed by the financial results ofSPP and other life insurance activities. Finally, information is providedon embedded value figures for <strong>Storebrand</strong> Life Insurance in accordancewith the principles for Market Consistent Embedded Value.Norwegian insurance companies are not currently permitted toprepare their accounts in accordance with IFRS. Except as otherwiseAnalysis of results by class of insurance <strong>Storebrand</strong> Livsforsikring ASNOK millionGrouppensionretailGrouppensioncorporateGrouplifeinsuranceIndividualendowmentinsuranceIndividualpensioninsuranceNon-lifeinsurance1. Financial income 9 147 1 532 70 1 354 1 975 19 14 097 11 191 9 123Total<strong>2007</strong>Total2006Total20052. Guaranteed yield -4 052 -616 -4 -623 -915 -6 209 -5 668 -4 764- of which transferred to premium reserve -131 -20 -7 -158 0 -1253. Interest result 5 095 917 66 731 1 060 19 7 887 5 523 4 3594. Risik premium 511 87 424 409 -94 161 1 499 1 303 1 2455. Risik supplement -314 -63 -375 -272 56 -124 -1 092 -998 -7986. Net reinsurance etc. -96 0 -27 -4 0 -36 -163 -84 -847. Risk result 101 24 23 133 -38 2 244 220 3638. Administration premium 611 106 64 251 188 36 1 257 1 154 1 0249. Operating expenses -873 -134 -77 -430 -311 -102 -1 927 -1 705 -1 35410. Administration result -261 -28 -13 -180 -122 -66 -669 -551 -33011. Change security fund -13 -2 -3 -1 1 -18 -18 -11Reserve strengthening -2 605 -350 -350 -3 30512. Gross result by sector (3+7+10+11) 2 316 561 74 683 550 -46 4 138 5 175 4 38113. Transferred to policyholders' funds -1 565 -436 -437 -360 -2 797 -3 994 -3 215To(-)/from(+) owner's equity:-net return on share capital 1 672 579 491-0.40% of policyholders' funds 613 567 521-risk margin earned by owner's equity 50 49 47-other 6 -15 10714. Pre-tax profit 1 341 1 181 1 1671 Includes: Security reserve, subordinated loan capital, book equity and liability itemsOf which: products with investment choice <strong>2007</strong>NOK mill.GrouppensionIndividualendowmentIndividualpension TotalTotal2006Interest result -2.8 -0.8 -2.6 -6.2 63.1Risk result -0.2 0.4 1.0 1.2 3.4Administration result -58.3 7.9 11.9 -38.5 -142.8Transfer to security fund -0.7 0.2 -0.5 -0.5Gross result by sector -61.3 6.8 10.5 -44.0 -76.8Surplus/deficit on result elements solely for the company›s account<strong>Annual</strong> <strong>Report</strong> <strong>2007</strong>43
stated, the following comments apply to accounting figures preparedin accordance with Norwegian accounting legislation and accountingregulations for insurance companies.Financial results for life insuranceNOK million <strong>2007</strong> 2006<strong>Storebrand</strong> Life Insurance group 1 365 1 182IFRS effects 258 8Other life insurance business 13 7Total for life insurance 1 635 1 198Analysis of results – explanatory notes: The interest result is thedifference between the net booked return, including interest costs onsubordinated loan capital, and the guaranteed return on policies. Theaverage guaranteed return on insurance policies in <strong>2007</strong> was 3.5 percent. The risk result arises because of the incidence of mortality anddisability during the period differing from that assumed for the premiumtariffs. The administration result shows the difference betweenthe administration premium charged and actual operating costs.Good operating result and profit for owner: Operating profit for<strong>2007</strong> was NOK 4,138 million compared with a profit of NOK 5,175million in 2006. The profit allocated to policyholders was NOK 2,797million (including NOK 400 million allocated to additional statutory reserves)and the profit to the owner was NOK 1,365 million. The goodresult for policyholders means that pensions currently in paymentand fully paid-up pension policies will be adjusted. NOK 152 millionof the owner’s profit comes from risk coverage products not subjectto profit sharing compared with NOK 135 million in 2006. In addition,insurance products with investment choice generated a loss ofNOK 44 million compared with a loss of NOK 77 million in 2006. Newpremium and allocation tariffs are being introduced in 2008 that takeinto account the increased life expectancy among policyholders thathas been observed in recent years. The premium reserves increasedby NOK 3,305 million in <strong>2007</strong>, which contributed to the reducedoperating profit.After IFRS effects of NOK 258 million, the <strong>Storebrand</strong> Life Insurancegroup produced a pre-tax profit in <strong>2007</strong> of NOK 1,623 million. Theprofit was affected by a one-time effect of NOK 215 million that wasdue to a write-back of an earlier expense booked against equity pursuantto IFRS and linked to pension costs included in the allocation ofprofit model in the life insurance company. The profit is equivalent toa 28 per cent return on equity for <strong>Storebrand</strong> Life Insurance in <strong>2007</strong>,which is somewhat better than the return on equity in 2006 and2005.Growth in premium income in most areas: The total premium incomefor <strong>2007</strong>, excluding premium reserve transfers, was NOK 16,578million. This represents an increase of 27 per cent on 2006 whenthe total premium income was NOK 13,069 million. Within policieswith investment choice, group pension insurance was up by 66 percent due to the increase in customers within mandatory occupationalpensions (OTP), while there was a fall in individual policies of 21 percent. In the case of group pension policies involving defined benefitschemes and group life insurance there were increases of 21 per centand 8 per cent, respectively. Individual endowment insurance increasedby 28 per cent. Individual annuity/personal pension productsincreased by 94 per cent compared with 2006. P&C insurance (withinthe life insurance regulations) increased by 6 per cent.Good net pension transfer inflows. <strong>Storebrand</strong> Life Insurancesaw net inflows of pension reserves of NOK 1,056 million in <strong>2007</strong>.Pensions sold well in the corporate market and reported but yet tobe recognised transfers amount to NOK 3.1 billion. The retail marketexperienced good sales of pension, savings and risk products.Satisfactory investment return, solidity and risk capital.<strong>Storebrand</strong> Life Insurance produced a satisfactory investment returnin <strong>2007</strong>. The booked investment return for 2006 was 8.9 per centcompared with 7.1 per cent for 2006. The value-adjusted return oncurrent asset investments was 7.3 per cent compared with 8.3 percent in 2006. The value-adjusted return including financial fixed assetswas 6.6 per cent in <strong>2007</strong> compared with 6.5 per cent in 2006.At the close of <strong>2007</strong> unrealised gains on current asset investmentstotalled NOK 3,889 million, while unrealised gains on bonds held tomaturity totalled NOK 40 million. The overall increase in unrealisedgains in <strong>2007</strong> was NOK 3,086 million.The life insurance company’s risk bearing capacity was satisfactory atthe close of <strong>2007</strong>. The solvency margin was 136.1 per cent comparedwith 174.6 per cent at the close of 2006. Capital adequacy in <strong>2007</strong>was 10.0 per cent while the minimum required is 8 per cent. Primarycapital in the capital adequacy and solvency margin capital increaseddue to the share issue and subordinated loan, but was reduced byintangible assets from the SPP transaction.Development in investment returns:12%11.210%8% 8.88.98.37.6 7.67.37.27.17.36.9 6.96%6.46.56.64%2%0%2003 2004 2005 2006 <strong>2007</strong> Booked Value adjusted excl. bonds held to maturity Value adjusted incl. bonds held to maturity44 <strong>Annual</strong> <strong>Report</strong> <strong>2007</strong>
Risk result: The risk result for <strong>2007</strong> was NOK 244 million comparedwith NOK 220 million in 2006. The increase of NOK 24 million relatesto the improved results for the individual sectors as a whole and forthe public sector group pensions. The P&C insurance sectors wereat around the same level as the year before, while there was a smallreduction for retail market group pension insurance and group lifeinsurance.Costs: The administration result showed a loss of NOK 669 million,which represents a deterioration of NOK 118 million from 2006. Theadministration result for products with profit sharing amounted tominus NOK 359 million.<strong>Storebrand</strong> Life Insurance incurred operating costs of NOK 1,927 millionin <strong>2007</strong> compared with NOK 1,755 million in 2006. The difference ofNOK 172 million was principally caused by reduced result-dependentinvestment management fees and an increase following the recognitionin the profit and loss account of estimate deviations in our ownpension scheme. Policyholders’ funds, excluding insurance productswith investment choice, increased by 7 per cent in <strong>2007</strong>. Costs relativeto average policyholders’ funds were 1.21 per cent in <strong>2007</strong> comparedwith 1.10 per cent in 2006. <strong>Storebrand</strong> Life Insurance aims to improvethe efficiency of its working processes to provide a foundation formanaging future growth without an equivalent increase in costs. Thecustomer fund for policies involving investment choice increased by 21per cent in <strong>2007</strong> and amounted to NOK 8,929 million.Additional statutory reserves strengthened: Additional statutoryreserves are conditionally allocated policyholders’ funds that act asrisk capital to absorb price fluctuations in the investment portfolio.These strengthened by NOK 400 million in <strong>2007</strong> to stand at NOK5,757 million at the end of <strong>2007</strong>. This combined with the strength ofrisk management systems ensures that <strong>Storebrand</strong> Life Insurance isagain well equipped to generate a good investment return in 2008.Risk capital in NOK mill. and % of customers’ fundsexcl. additional statutory reserves:14%12%10%8%6%4%2%08,9 bn2.11.63.21.611,1 bn2.13.22003 2004 2005 2006 <strong>2007</strong> Market value adjustment reserve Adjusted core capital margin13,6 bn2.61.33.91.8 1.13.516,8 bn3.00.84.23.02.4 2.6 Additional statutory reserves Profit accrued15,5 bn1 Including NOK 0.6 billion of additional statutory reserves in excess of one year’s interestguarantee.Changes to the investment portfolio: It is <strong>Storebrand</strong> Life Insurance’sinvestment strategy to make efficient use of risk capital in order to optimisethe expected investment return for the company and its policyholders.The company accordingly increased its equity exposure, includingderivatives, from 28 to 26 per cent over the course of <strong>2007</strong>. The proportionof Norwegian shares in the equity portfolio decreased in <strong>2007</strong> fromaround 15 to 4 per cent. The proportion of the portfolio allocated toPrivate Equity increased to just under 4 per cent. Hedging programs wereagain used for the equity portfolio in <strong>2007</strong> to limit the effect on riskcapital in the event of a sudden sharp fall in the financial markets.The proportion of the portfolio invested in international bonds heldas current assets was somewhat lower than the target allocationthroughout <strong>2007</strong>, reflecting the low level of international interestrates at the start of the year. The increases in interest rates seen2.83.8Investment return and asset allocation <strong>Storebrand</strong> Livsforsikring AS<strong>2007</strong> 2006(NOK million)Asset allocationAsset allocationPortfoliosReturn % Market value % Exposure 1 Market value Exposure 1Total invested assets 7.3% 166 294Securities 7.3% 126 874 82.2% 83.1% 85.1% 85.3%Shares 9.8% 34 712 22.5% 26.3% 24.8% 25.5%Bonds 3.8% 30 100 19.5% 18.5% 20.4% 20.2%Money market in total 3.1% 16 556 10.7% 10.2% 9.3% 9.2%Hold to maturity bonds 5.4% 45 506 29.5% 28.0% 30.6% 30.4%Real estate 24.7% 25 279 16.4% 15.6% 13.4% 13.2%Loans 5.5% 2 188 1.4% 1.3% 1.5% 1.5%1 Exposure is adjusted for derivative holdings in separate portfolios<strong>Annual</strong> <strong>Report</strong> <strong>2007</strong>45
oth in Norway and internationally in <strong>2007</strong>, with the exception of theUSA, caused a fall in the value of bonds in the short-term. Over thelong-term, rising interest rates will lead to an increased return fromthe investment portfolio and increase the company’s risk bearingcapacity. The money market portfolio responds relatively quickly toincreases in short-term interest rates. In total, the company’s moneymarket and bond investments are robust with respect to changes ininterest rates.A smaller proportion of the company’s unrealised gains on bondscomes from the portfolio of government and government guaranteedbonds held to maturity. The hold to maturity portfolio represented22 per cent of total investment assets at the close of <strong>2007</strong>, with anaverage duration of around 4 years and an average effective yield inexcess of 5.4 per cent of booked value.The allocation of assets to real estate increased over the course of<strong>2007</strong> from around 13 to 15.6 per cent. The value of the real estateportfolio was written up by NOK 2,975 million in <strong>2007</strong>, partly due toan increase in the value of the portfolio and partly against the backgroundof inflation adjustment.Financial results spp (including Euroben)The result described below consists of the SPP group as well asEuroben, and does not include the result from the asset managementactivities.SEK million <strong>2007</strong> 2006Administration income 1 006 938Administration cost -888 -893Administration result 118 45Risk result 217 352Financial result -435 1 582Other 289 238Pre-tax profit 189 2 217Tax 43 -40Profit after tax 232 2 178The administration result was SEK 118 million in <strong>2007</strong> compared withSEK 45 million in 2006. This was due to an increase in costs associatedwith marketing and consultancy help, among other things. Therisk result for <strong>2007</strong> was SEK 217 million compared with SEK 352 millionin 2006. The reduction since 2006 is explained by a lower result fromsickness insurance due to the reduced premiums at the start of <strong>2007</strong>.The risk result also includes value changes in allocations for sicknessinsurance. Changes in the market value due to increased interestrates also contributed to the lower result compared with 2006. Theadministration and risk result are recognised in their entirety as theowner’s pursuant to the profit sharing model in SPP.The total return in SPP’s investment portfolio was 0.4 per cent in<strong>2007</strong> compared with 6.8 per cent in 2006. In total, the owner’s shareof the financial result was a loss of SEK 435 million for <strong>2007</strong>. Themarket trend in the fourth quarter combined with the portfolio andhedging structure in SPP contributed to the negative result. The newinvestment strategy and portfolio structure is designed to neutralisethe effects of an equivalent market trend in the future.Other result elements amounted to SEK 289 million for <strong>2007</strong> comparedwith SEK 238 million for 2006. This result consists of the returnon equity, costs of subordinated loans, and write-downs with respectto intangible assets.Premium income saw an improvement in <strong>2007</strong> and increased by 7per cent from 2006 to SEK 8,561 million. New policies increased bySEK 2.4 billion during the course of <strong>2007</strong>, an increase of 21 per cent.“Conditional bonuses” (the policyholders’ buffer capital) at the endof <strong>2007</strong> amounted to SEK 13,865 million. Euroben has corresponding“conditional bonuses” which amounted to SEK 2,442 million atthe end of the year. The total insurance reserves at the end of <strong>2007</strong>amounted to SEK 125 billion (NOK 112 billion), of which SEK 31 billion(NOK 27 billion) was placed in mutual funds.The solvency margin at the end of <strong>2007</strong> was 178 per cent. The fallfrom 310 per cent from the end of the previous year was primarilydue to the payment of extraordinary dividends to Handelsbankenduring the year. The insurance reserves for traditional business weredistributed as follows: 66 per cent of the assets in interest-bearingsecurities and the remainder primarily in Swedish and internationalequities.Financial results for other life insurance activities<strong>Storebrand</strong> Helseforsikring AS: <strong>Storebrand</strong> Helseforsikring, inwhich <strong>Storebrand</strong> ASA owns 50 per cent, reported an operating profitof NOK 25 million for <strong>2007</strong> compared with NOK 17 million in 2006.The company offers treatment insurance in the corporate and retailmarkets. Premium income for health insurance products increasedby 18 per cent in relation to 2006, and totalled NOK 199 million for<strong>2007</strong>. The growth in premiums earned for own account was equallydivided between Norway and Sweden.EV – Market Consistent Embedded ValueThis section provides information on the disclosure of the embeddedvalue (EV) <strong>2007</strong> for <strong>Storebrand</strong> Life Group. It includes businesswritten in <strong>Storebrand</strong> Livsforsikring AS (SBL) and the recently acquiredSwedish life insurance business SPP (including Euroben Ltd.).<strong>Storebrand</strong> adopted the European EV Principles for the year-ends2004 to 2006. During <strong>2007</strong>, the methodology has been revised fromthe previously applied top-down approach to allowing for risk via abottom-up market consistent approach.An EV is an actuarially determined estimate of the value of thecompany excluding any value attributable to future new business.The calculation of EV requires the use of a number of assumptionswith respect to the business, operating and economic conditions, and46 <strong>Annual</strong> <strong>Report</strong> <strong>2007</strong>
other factors, some of which are determined by economic conditionsand financial markets. <strong>Storebrand</strong> has published a separate EV reportwith more detailed information. <strong>Storebrand</strong>’s EV report is developedin collaboration with the actuarial firm Tillinghast and in accordancewith the principles of the CFO Forum.Overview of results. The results in this section are presented inNOK. An exchange rate of 0.84 has been applied to amounts in SEKconsistent with the annual accounts of <strong>Storebrand</strong> Group.EV analysis <strong>2007</strong>EEV for 2006New legislation / market-consistentRestated EEV 2006Effect of look-throughRestated EEV 2006 – after look-throughUnwinding14 5442 01916 5631 94318 506880The total EV as at 31 December <strong>2007</strong> for the life insurance businessof <strong>Storebrand</strong> Group after capital movements is NOK 29,940 million.The present value of future profits amounts to NOK 28,412 million(including look-through profits of NOK 4,156 million), while shareholdersurplus is NOK 7,478 million and cost of capital is NOK 248million. The EV is reduced by a cost of volatility of NOK 5,701 million.Value of new business written in <strong>2007</strong>Operating assumption changes and variancesEconomic assumption changes and variancesEEV <strong>2007</strong> before capital movementsDividend / capital transfersEEV <strong>2007</strong> – before consolidation of SPP5031 1844221 115-31220 804NOK million MCEV <strong>2007</strong>Total shareholder surplus at market value 7 478Cost of capital -248Present value of future profits 24 256Cost of volatility -5 701Look-through profits 4 156Total embedded value 29 940Additional capitalDeduction of book value of SPPEmbedded value of SPP (incl Euroben)Look-through synergy effectsEEV <strong>2007</strong> – <strong>Storebrand</strong> Life Insurance Group8 948-13 83213 13488729 940As an effect of the holding company structure in Sweden, whereby part ofthe profits can be transferred to the group as a tax-free group contribution,it is currently expected that the effective tax rate for profits arising inSPP will be zero. Therefore, a tax rate of 0% has been applied for SPP. Thecurrent tax legislation in Norway leads to an effective tax rate of 0% forprofits arising in SBL and the group’s asset management company.<strong>2007</strong> embedded value earnings analysis. The EV and EV earningsshown in this section represent SBL only, unless stated otherwise.The movement from 31 December 2006 to 31 December <strong>2007</strong> showsEV earnings of NOK 2,609 million (before acquisition of SPP, synergyeffects, dividend and other capital transfers and after taking intoaccount look-through profits for SBL). This represents a return onopening EV of 14 per cent.The interest on opening value only represents the unwinding of therisk-free rate used to discount future profits, and is applied to therestated EV at 31 December 2006 (after look-through).The value of new business written in <strong>2007</strong> (based on year-end <strong>2007</strong>assumptions) increases the EV by NOK 503 million. The value of newbusiness is based on a marginal approach, meaning that the changein cost of volatility of the in-force business at year-end due to writingnew business is attributed to the new business.EV historyNOK million SBL SPP Life GroupEEV 2005 EEV 2006 MCEV 2006 MCEV <strong>2007</strong> MCEV <strong>2007</strong> MCEV <strong>2007</strong>Total shareholder surplus at market value 5 512 5 977 5 977 6 931 5 431 7 478Cost of capital -711 -986 -102 -106 -142 -248Present value of future profits 8 614 10 813 13 831 16 864 7 392 24 256Cost of volatility -1 158 -1 259 -3 143 -4 863 -839 -5 701Look-through profits - - 1 943 2 863 1 292 4 156Tax -232 0 0 0 0 0Total embedded value 12 025 14 544 18 506 21 690 13 134 29 940<strong>Annual</strong> <strong>Report</strong> <strong>2007</strong>47
Operating variances and assumption changes mainly relate tothe following: Within non participating business changes in expensesand charges have a negative effect, while shareholder margin onfee based business has increased due to change in reserving bases.The net effect of this is an increase in EV of NOK 0.7 billion. Overalldecrement experience in group pension business has been betterthan expected with a positive impact of NOK 0.4 billion on the EV.Economic assumption changes and variances can be split intothe following main effects: The increase in interest rates in <strong>2007</strong>has lead to higher expected returns and higher expected profits forthe shareholders. This is partially offset by the fact that profits arediscounted using the higher interest rates. The net effect increases EVby NOK 1.2 billion. At the same time the implied equity volatility hasincreased leading to a higher cost of volatility, having a negative EVeffect of NOK 1.2 billion. In aggregate, the impact of these effects isan increase in the EV of only NOK 42 million.Of the total shareholder profit for the year <strong>2007</strong> of NOK 1.3 billion,NOK 1.0 billion has been retained in the shareholder capital and NOK0.3 billion has been paid out as a dividend.The impact of the acquisition of SPP in late <strong>2007</strong> can be divided intothe following components:Value of new business (VNB). As SPP was acquired close to end-ofyear,no separate analysis has been performed on the value of newbusiness.The value of new business shown below relates only to the new businesswritten in SBL.Value of new business (VNB):NOK million VNB <strong>2007</strong>Present value of future profits comprising 518- fee based business 260- 20/80 portfolio 104- 35/65 portfolio 53- non-participating business 101Cost of capital -1Cost of volatility 1 -107Look-through profits 93Value of new business 5031 Cost of volatiltiy is calculated on marginal methodSensitivities for <strong>Storebrand</strong> Group. The sensitivities reflectchanges EV based on changes in assumptions.• The issue of additional capital of the net sum NOK 8.9 billion• The deduction of the book value of SPP in SBL’s accounts of NOK13.8 billion• In the next step, the EV of SPP of NOK 13.1 billion at 31 December<strong>2007</strong> is added• As the last step, synergy effects have been taken into account toreflect the proportional decrease of expenses in <strong>Storebrand</strong>’s assetmanagement company due to the additional assets under managementfrom SPP which will be transferred before the end of 2008.The increase of the EV of NOK 0.9 billion only reflects the higherassumed look-through profits induced by the business of SBL.EV sensitivities:NOK million Total MCEV Change Change in %Base 29 940 503Value of newbusiness 2 Change Change in %1. Interest rates +1% 1 31 412 1 472 4.9% 501 -2 -0.4%2. Interest rates -1% 1 27 094 -2 846 -9.5% 472 -31 -6.2%3. Equity market values -10% 2 28 354 -1 586 -5.3% 498 -5 -0.9%4. Equity and property market values -10% 27 724 -2 216 -7.4% 404 -98 -19.6%5. Salary and expense inflation + 0.5% 30 360 420 1.4% 529 27 5.3%6. Maintenance expenses -10% 30 598 659 2.2% 517 14 2.7%7. Mortality rates -5% – annuity business 29 263 -677 -2.3% 503 0 0.0%8. Mortality rates -5% – life business 30 109 169 0.6% 523 20 3.9%9. Lapse rates +10% 29 111 -829 -2.8% 465 -38 -7.5%1 Change in market value of unit funds not considered2 Value of new business for SBL only48 <strong>Annual</strong> <strong>Report</strong> <strong>2007</strong>
New Norwegian life insurance legislationThe new Insurance Activities Act and regulations came into forceon 1 January 2008. The new Act will entail considerable changes forthe life insurance companies. <strong>Storebrand</strong> has worked intensively tostrengthen its competitiveness by taking advantage of the opportunitiesthat have been opened up. The overall objective of the newlegislation is to make the pricing of insurance products more predictableand transparent, and to create a clearer distinction between theassets of the insurance company and its policyholders. The centralprinciple of the new regulations requires that premiums must be fixedwith final effect and paid in advance.New opportunities in asset managementBefore the new regulations came into force, <strong>Storebrand</strong> decided onbehalf of its customers how the pension assets would be managedand all the assets were in the same portfolio. Under the new actcorporate customers with defined benefit based pension schemes willhave more say about the classes of equities and risk. The new legislationalso allows the group portfolio to be divided into sub-portfolioswith different equity compositions and risks.Policies with a low interest rate guarantee and high risk capital (additionalstatutory reserves and unrealised gains) may therefore beable to maintain a higher exposure to equities in their portfolio at thesame price as similar policies that have a higher level of guaranteedinterest or lower buffer capital. The basis for pricing the interest rateguarantee is the risk to which the available equity is exposed. A customercan choose an investment profile with a low equity exposureand therefore lower risk of losses, though this may also result in alower expected return. A higher exposure to equities would result in ahigher expected return and higher contributions to the premium fund,but also a higher price for the interest rate guarantee. Under the newact, a shortfall in the return on the customer’s policy can be met fromits additional statutory reserves, and the new rules allow greater flexibilityin building up the level of additional statutory reserves.Corporate customers that choose a special investment portfolio willhave greater freedom of choice. They can choose between standardisedrisk profiles or almost freely choose investments within thelimits that follow at any given time from the act and regulations. Thecorporate customers can thus define their investment policy almostas if the management was taking place via a pension fund.The new legislation also permits a new type of long-term policy. Theinterest rate guarantee has so far been linked to a single financialyear, but it will now be possible to agree a guaranteed return forperiods of up to five years. The premium for a guaranteed returnover a number of years will be lower than for annual guarantees overthe same period. The employer’s liabilities must still be supportedby sufficient insurance reserves and if necessary, equity can be usedto ensure satisfactory reserves during the agreed guarantee period.The regulations governing guaranteed returns over a number of yearsprovide greater room for reaching agreements between the customersand the company, meaning one can, among other things, agreethat the customer will assume a greater portion of the risk in returnfor a reduced premium.New rules for the use of profitsThe new insurance act means that in the case of group defined benefitpensions and newly established guaranteed individual products,the profit shall go to the customer. The various elements of thepension provision are priced separately in advance and every priceelement can contain a profit element for the insurance company.In the case of old and new paid-up policies, a modified profit sharingregime has been introduced, which means that the company canretain 20 per cent of the profit, which here is made up of the sum ofthe interest and risk results from the paid-up policies. The modifiedprofit sharing model means that any negative risk result will be deductedfrom the customer’s interest profit. In addition, the companyreceives all of the return on capital in the balance sheet that doesnot belong to the customers.Individual products that were provided by the company prior to thecoming into force of the act can be continued in accordance withthe profit rules that applied prior to 2008, and <strong>Storebrand</strong> intends tocontinue managing these assets in accordance with this regime.New rules for premium paymentsPremium for the interest rate guarantee:The premium shall be calculated for one year at a time and paid inadvance, unless agreement has been reached to pay it in instalments.The corporate customer pays for the interest rate guarantee in advanceeach year. This means that the profit in the company cannot be obtainedin arrears by retaining parts of the interest profit from the group pensionpolicies. It will still be possible to make statutory provisions that in yearswith low rates of return can be used to offset a shortfall in return betweenzero per cent and the guaranteed return. The statutory reserves must bedistributed across the individual policies. The insurance act stipulates themaximum size of additional statutory reserves. The owner carries all thedownside risk, and must carry reserves against the policy if the bufferis not sufficient or not available. The price charged for the guaranteedinterest rate will depend on factors such as the level of buffer capital associatedwith the policy, the level of exposure to equities in the portfolio,the level of the guaranteed interest rate and the current market situation,including the level of interest rates. Before 2008, there was no specificpremium for the interest rate guarantee and it was paid for through theallocation of profit between the company and its policyholders.Risk premium:The corporate customer will receive any surplus from the risk resultachieved on insurance cover for death, disability and dependants inthe pension policy, but the insurance company will itself be responsiblein principle for meeting any deficit vis-à-vis the risk result. Thereis, however, provision for up to half of any risk surplus on a particular<strong>Annual</strong> <strong>Report</strong> <strong>2007</strong>49
line of insurance to be held in a risk equalisation fund. Deficits in subsequentyears can then be met out of the equalisation fund beforethe insurance company is required to contribute from its own equity.Premium for pension scheme administration:Administration costs must be charged in advance every year with finaleffect for the corporate customer. The insurance company must thenmeet any deficit in the administration result, and similarly any surplusis retained by the company. Where a policy’s assets are managed inthe investment trust portfolio, the price of asset management mustalso be shown as a separate element of the overall charge.Allocation of reserves prior to implementationof the new legislation 31-12-<strong>2007</strong>77 %1 %22 % Without profit-sharing (retail) Without profit-sharing (corporate) With profit-sharing (retail) With profit-sharing (corporate)form of increased volumes, the realisation of synergies and increasedvalue creation in the asset management activities in the years ahead.<strong>Storebrand</strong> Investments’ objective is to be the preferred manager forlong-term savings and pension assets. It will achieve this by continuingto develop its current asset management concept, extending intospecialised investment areas and developing particular expertise inmajor asset management functions. The company had NOK 227 billionof assets under management at the close of <strong>2007</strong>. This is made up ofdiscretionary portfolios and mutual funds marketed under the brandnames <strong>Storebrand</strong> and Delphi.Attractive products: <strong>Storebrand</strong> Investments offers a full range ofsavings and investment products, from equity and bond funds forpersonal saving to advanced specialist funds for professional investors.All the funds that <strong>Storebrand</strong> manages itself are subject toguidelines concerning corporate responsibility and are managed by awell-established team of investment managers consisting of managerswith extensive experience. In <strong>2007</strong>, Delphi Verden (World) wasranked as the best global equity fund measured by return. The purposeof the fund is to achieve the highest possible return by utilisingthe whole world as its investment universe. The fund’s investmentstrategy is based on trend analyses. The fund has a cutting edgeinvestment strategy that focuses on the sectors that are consideredthe best at any given time.Allocation of reserves following implementationof the new legislation 01-01-200831 %22 %47 %Asset management activities Without profit-sharing (retail) Without profit-sharing (corporate) With profit-sharing (retail) With profit-sharing (corporate)Market and strategy<strong>Storebrand</strong> Investments offers a complete asset management conceptthat includes discretionary portfolio management of Norwegian andinternational securities, global special products with absolute returntargets, as well as effective management of market risk. Today,<strong>Storebrand</strong> Investments is Norway’s leading private asset manager.<strong>Storebrand</strong>’s acquisition of SPP provides great opportunities in theMeeting new customer requirements: <strong>Storebrand</strong> Investments expectsto see increasing demand from its customers for new types ofproducts. Innovation is important and <strong>Storebrand</strong> Investments offersboth sophisticated savings products and simple guaranteed products.Over the course of <strong>2007</strong>, the company has developed several newproducts to meet the needs of its customers. Guaranteed savingsproducts have particularly been in focus due to the new insurancelaw. <strong>Storebrand</strong> Garantikonto was launched on 4 January 2008and guarantees the customer a minimum return on paid in funds.The funds are invested in a portfolio, which is actively managed by<strong>Storebrand</strong> Investments and primarily comprises equities, bonds andproperty.Institutional customers: In <strong>2007</strong>, <strong>Storebrand</strong> Investments gained 44new institutional customers. A special key customer unit containinghighly qualified investment advisers serves institutional customers.Investment strategies are tailored in consultation with the customersto meet the customers’ financial objectives, investment horizons andrisk profiles. Our strong positions within the municipality, pensionfund and organisation segments were maintained in <strong>2007</strong>, and ouremphasis was on good customer service. The strategy of directing thesales focus at private investment companies has been successful andwill be continued in 2008.In <strong>2007</strong>, the business area, in cooperation with the department foroperational services, experienced a positive trend with respect tosales of investment support services, <strong>Storebrand</strong> Investment OperationServices. Many new customers chose to utilise <strong>Storebrand</strong> Invest-50 <strong>Annual</strong> <strong>Report</strong> <strong>2007</strong>
ments’ system platform for management carried out by the customeritself or other external managers during the year.Automation: <strong>Storebrand</strong> Investments constantly strives to simplify itsprocedures, and standardise and automate its work processes frominvestment decisions through to settlement, control and reporting.This focus has improved both the cost effectiveness and scalabilityof its activities, and ensured a robust and flexible asset managementplatform that can produce stand-alone asset management productsas well as manage the complex and flexible investment profiles offeredthrough defined contribution pension schemes. Throughout<strong>2007</strong>, the company focused strongly on limiting the complexityand ensuring the scalability of operations. This has been especiallyimportant with respect to the successful implementation of the newinsurance act.The acquisition of SPP facilitates the further utilisation of the operationalefficiency in <strong>Storebrand</strong> Investments, including the potential forextracting significant synergies.A good return, but not at any price: <strong>Storebrand</strong> is conscious ofhow its own and its customers’ funds are managed. <strong>Storebrand</strong>wants to use its role as an investor and owner in such away that inthe long-term the company can contribute to a more sustainabledevelopment. The objective of this work is not to exclude companies,but to encourage changes for the better. <strong>Storebrand</strong> has developedanalysis methods for selecting the best companies based on corporateresponsibility criteria. The goal is to achieve the best possiblereturn, but not at any price, and in <strong>Storebrand</strong>’s experience the returnon investments has not been negatively affected by the corporateresponsibility requirements. <strong>Storebrand</strong> will not invest in companieswho contribute to violations of human rights, breaches of labourrights, corruption, serious environmental damage, or the productionof landmines, cluster bombs, nuclear weapons and tobacco.The company will also refrain from investing in companies that areamong the 10 per cent worst in the most high-risk industries, orwhich in some other way have unacceptable business practices. Thecriteria apply to both shares and bonds in Norway and internationally.A special team in <strong>Storebrand</strong> Investments monitors these criteria.More than 2,600 companies are monitored continuously and, as per31 December <strong>2007</strong>, 87 companies have been excluded pursuant tothe <strong>Storebrand</strong>’s group standard for corporate responsibility criteria.<strong>Storebrand</strong>’s group standard for socially responsible investments willalso be implemented for the assets associated with SPP.Financial results for <strong>2007</strong><strong>Storebrand</strong>’s asset management activities produced an overall pre-taxprofit of NOK 138 million in <strong>2007</strong> compared with NOK 156 million in2006. The result was affected by high fixed and volume based incomedue to the increase in assets under management. Nonetheless, totalincome has fallen compared with 2006 due to low performancebasedincome during the period. Good costs control resulted in lowtotal costs and produced a solid operating margin.Asset management activitiesNOK mill. <strong>2007</strong> 2006Total revenue 331 399Total costs -259 -280Net financial items 14 7<strong>Storebrand</strong> Alternative Investments 52 30Pre-tax profit 138 156Income: The company’s income primarily comes from managementfees, fixed and performance-based, and sales commission. Totalincome fell by 17 per cent compared with 2006. The primary explanationfor this is the low level of performance-based income. Performance-basedfees were lower than 2006 and this fall can be ascribedto the relatively low return in discretionary portfolios. A significantincrease in assets under management has contributed to an increasein fixed and volume based fees of NOK 47 million. This constitutes anincrease of 18 per cent compared with the year before. <strong>Storebrand</strong>Alternative Investments (SAI) contributed a profit of NOK 52 millionto the asset management activities compared with NOK 30 million in2006.Costs: Total costs fell by 8 per cent compared with 2006. This reductioncan primarily be ascribed to lower result-based costs that arelargely associated with the performance-based income. The operatingcosts rose by 3 per cent, which is equivalent to NOK 6 million.The increase in costs was largely due to items that are driven by theincrease in assets under management. Systematic and focused workhas successfully helped the company improve the operating margin.Fixed costs as a share of the fixed and volume-based income haveimproved from 79 per cent in 2006 to 69 per cent in <strong>2007</strong>. Total costsas share of total income (including SAI) have however increased from64 per cent in 2006 to 65 per cent in <strong>2007</strong>. This was due to lowertotal income due to lower performance-based fees than in 2006.Increase in assets under management: Assets under managementincreased by NOK 10 billion in <strong>2007</strong>. The total assets under managementamounted to NOK 227 billion at the end of the year. The inflowof assets under management was especially affected by developmentsin the property market as well as the inflow of capital duringthe year. Despite the tax benefits from saving in equity funds and thepositive development in the equity markets in recent years, the levelof interest in equity funds in the retail market is still low in Norwaycompared with Sweden and Denmark. Norwegian retail customershad placed NOK 142 billion in mutual securities funds at the end ofthe year. The net realisation in the retail market amounted to NOK6.4 billion in <strong>2007</strong>.<strong>Storebrand</strong> Investments turned a net outflow of NOK 300 million in2006 into a net inflow of NOK 300 million in <strong>2007</strong>. The fixed incomefunds saw the greatest inflow with a net inflow of NOK 700 million in<strong>2007</strong> compared with a net outflow of NOK 130 million in 2006. Thetotal assets under management from the Norwegian retail marketcustomers amounted to NOK 11.4 billion as per 31 December <strong>2007</strong>.<strong>Annual</strong> <strong>Report</strong> <strong>2007</strong>51
<strong>Storebrand</strong> Investments’ market share of Norwegian registered mutualsecurities funds at the close of <strong>2007</strong> was 9.8 per cent, which is aslight fall from 2006. The assets managed by <strong>Storebrand</strong> in Norwegianregistered mutual funds increased by NOK 4.3 billion (12 percent).for <strong>Storebrand</strong> Life Insurance. The return on this portfolio was weakin <strong>2007</strong>. This was principally due to the relatively weak return in thefixed income and money market portfolios and the weak results inportfolios exposed to the North American equity market. However,the relative return on Norwegian equities has been strong.Total assets under management and the asset allocationTotal assets under managementNOK mill.250227.4216.9204.929.724.520020.328.0158.816529.430.315012.215.820.025.69.714.625.312.910.1100The performance of <strong>Storebrand</strong>’s funds was varied in <strong>2007</strong>. Thereturn was good in the money markets and the fixed income funds. Inaddition, Norwegian equities and Delphi Verden pulled the return up.The return on <strong>Storebrand</strong> Verdi was 16.6 per cent in <strong>2007</strong>, while thereturn on Delphi Verden was 12.5 per cent.Increased margins: <strong>Storebrand</strong> Investments’ experienced a furtherimprovement in operating margins. The assets under managementincreased by 5 per cent, while the operating costs only rose by 3 percent, as illustrated in the graph below. A solid underlying operatingmargin provides a good basis for future growth and the utilisation ofthe potential associated with the SPP transaction.500110.2 126.6 140.6142.1144.12003 2004 2005 2006 <strong>2007</strong>Margin development <strong>Storebrand</strong> InvestmentsMargin development <strong>Storebrand</strong> Investments18 bp Group internal Real estate External discretionary Mutual funds16 bpAsset allocation14 bp12 bp1414141312121457,1 %31-12-<strong>2007</strong>25,6 %17,5 %11,2 %4,6 %30,3 %37,8 %5,8 %15,8 %7,3 %22,6 % Norwegian equities International equities Alpha Norwegian bonds International bonds Credit bonds Norwegian money market International money market Hold to maturity Real estate OtherReturn: The <strong>2007</strong> stock exchange year started with growth, butchanged in character due to the instability in the credit markets in thelast six months of the year. The situation at the end of the <strong>2007</strong> is asubstantially more uncertain market than was the case at the sametime the year before.<strong>Storebrand</strong> Investments’ performance in <strong>2007</strong> was lower than theresults for 2006. <strong>Storebrand</strong> Investments manages NOK 145 billion1110 bp1098 bp6 bp2003 2004 2005 2006 <strong>2007</strong> Income CostsBankingMarket and strategyA modern bank: <strong>Storebrand</strong> Bank ASA’s objective is to be the “thesmart choice for the modern customer”. The bank aims to be seen asa bank that is easy to relate to, with popular products at competitiveprices. The banking group has total assets of NOK 41.9 billion and 215employees.A year characterised by progress: <strong>2007</strong> was characterised byprogress for <strong>Storebrand</strong> Bank, with respect to both the competitivesituation and profitability. The bank maintained its position as a ‘nofees’bank, while significantly strengthening its competitive position52 <strong>Annual</strong> <strong>Report</strong> <strong>2007</strong>
for residential mortgage lending. This resulted in significant growth inboth business volumes and customer numbers. The lending portfolioincreased from NOK 31.2 billion in 2006 to NOK 37.1 billion in <strong>2007</strong>.The upward trend in customer numbers that started with the launchof free daily banking in 2005 continued in <strong>2007</strong>. At year end <strong>2007</strong>the bank had 70,710 retail customer accounts and total assets of NOK41.9 billion. The quality of the total lending portfolio at the end ofthe year was good.The bank holds a strong position within the corporate customersegment with respect to the professional property market, includingproperty developers and owners. This position improved in <strong>2007</strong>,while at the same time a new strategy was drawn up for the areawith the primary goal of expanding the range of services for corporatecustomers. <strong>Storebrand</strong> Bank’s objective is to be a completeprovider of financial services to property investors in key districts.<strong>Storebrand</strong> Markets: <strong>Storebrand</strong> Markets was established as a newbusiness area in <strong>2007</strong> to ensure sufficient strength behind the propertyventure, increase the range of products and thus increase othernon-balance sheet driven income. The 2,0 business area includes theproduct areas currency, stockbroking and structured savings products,as well as commercial real estate brokering through Hadrian EiendomAS. In addition to this comes corporate finance 1,5 advice with a focuson business property. In February 2008, <strong>Storebrand</strong> Bank ASA startedoffering online share trading.1,0Financial results for <strong>2007</strong>The <strong>Storebrand</strong> Bank group reported a profit before loan losses ofNOK 156.8 million in <strong>2007</strong>, compared 0,5 with NOK 143 million in 2006.Loan and guarantee losses and write-downs represented a net writebackof NOK 78.2 million (net write-back 0,0 of NOK 47 million in 2006).The profit for the year for the banking group was NOK 169.6 million,compared with NOK 147.3 million in 2006.<strong>Storebrand</strong> BankNOK million <strong>2007</strong> 2006Net interest income 413 419Net fee and commission income 58 32Other income 46 47Operating expenses -360 -355Loan losses and write-downs 78 47Pre-tax profit 235 190Post-tax profit 170 147Lower net interest income: Net interest income amounted to NOK413.2 million (NOK 418.8 million). Net interest income as a percentageof average total assets amounted to 1.07 per cent (1.32 per cent) in<strong>2007</strong>. Net interest income showed a falling trend in <strong>2007</strong>, mainly dueto pressure on margins, credit instability and increased competition inthe lending market.Net interest margin2.00%1.50%1.00%0.50%0%1.411Q 20061.312Q 20061.363Q 20061.224Q 2006 Net interest income / Avg. total assets1.08 1.06 1.07 1.051Q <strong>2007</strong>2Q <strong>2007</strong>3Q <strong>2007</strong>4Q <strong>2007</strong>46 00041 00036 00031 00026 00021 000Net fee and commission income/other operating income: Netfee and commission income amounted to NOK 57.9 million in <strong>2007</strong>,compared with NOK 31.9 million in 2006. The increase results fromthe successful launch of new savings products. Other operating incomeamounted to NOK 45.9 million, compared with NOK 46.8 millionin 2006.Operating expenses: Operating expenses totalled NOK 360.2 million(NOK 354.5 million), equivalent to 69.7 per cent of total operatingincome compared with 71.3 per cent in 2006. The underlying cost/income experienced a positive development, driven by the bank’sefficiency measures and increased income.The bank is committed to a continuous program of measures toreduce operating expenses relative to its total assets and revenue. Aspart of this, the bank has implemented measures to ensure continuousimprovement and greater efficiency for its internal processes.Non-performing, loss-exposed loans and loan lossesIn <strong>2007</strong>, there was a continued fall in the total non-performingand loss-exposed volume from NOK 533 million to NOK 448 million.The volume of non-performing and loss-exposed loans with identifiedimpairment amounted at the end of <strong>2007</strong> to NOK 297.2 million(NOK 423.7 million). This represents a reduction of NOK 126.5 millioncompared with 31 December 2006. From 31 December 2005 to 31December <strong>2007</strong>, the fall in non-performing and loss-exposed loanswith identified impairment was NOK 343.9 million. The volume ofnon-performing and loss-exposed loans is normal and the increasein non-performing and loss-exposed loans where no impairment hasbeen identified is mostly explained by the entire customer commitmentbeing classified as non-performing, including in the case of verysmall outstanding items. At the end of the fourth quarter, the volumeof non-performing and loss-exposed loans with no impairments<strong>Annual</strong> <strong>Report</strong> <strong>2007</strong>53
identified was NOK 151.2 million (NOK 109.0 million) of which NOK 44million related to customers with outstanding amounts of less thanNOK 1,000. The net volume of non-performing and loss-exposedloans (after individual write-downs) amounted at the end of <strong>2007</strong>to NOK 201.3 million (NOK 172.7 million). Gross non-performing andloss-exposed loans represented 1.2 per cent of gross lending (1.7 percent) at the close of the year. The reduction reflects the reduced levelof risk in the lending portfolio.Losses and write-downs on loans and guarantees represented a netwrite-back of NOK 78.2 million in <strong>2007</strong>. By the close of the year,write-downs of individual loans in the balance sheet totalled NOK247.1 million, a reduction of NOK 112.9 million from 31 December2006. As per 31 December <strong>2007</strong>, grouped write-downs totalled NOK58.1 million (NOK 73.3 million): equivalent to 0.16 per cent (0.24 percent) of gross lending. The bank updated its model for calculatinggrouped write-downs during <strong>2007</strong>. Today’s model is based on thebank’s own classification and takes more account of macroeconomicfactors than before.Development in non-performing and loss exposed loansand provisioning ratio600500400300200100072%142 90 642Q 200680%3Q 200685%4Q 20061Q <strong>2007</strong>2Q <strong>2007</strong>3Q <strong>2007</strong>4Q <strong>2007</strong> Depreciation Amortised cost Loss provisions / NPLs (right axis)76%90%80%70%60%50%40%30%20%<strong>Storebrand</strong> 90 % Bank group’s total assets increased in line with thegrowth in its lending portfolio throughout the year and amounted toNOK 80 41.9 % billion as per 31 December <strong>2007</strong>. The bank’s deposit-toloanratio was 47.1 per cent compared with 43.4 per cent in 2006.The bank 70 % has a balanced and appropriate funding structure, andbases its funding on ordinary customer deposits, issuing securities60 %and borrowing from the Norwegian and international capital markets.At the close of <strong>2007</strong>, the bank had available unused committed credit50 %facilities equivalent to EUR 400 million.40 %<strong>Storebrand</strong> Bank group’s net primary capital amounted to NOK 2.798billion 30 at % the close of <strong>2007</strong>. This represents a capital adequacy of 10.584%5581%58 50360 358 360 317 297 253 247Capital adequacy83%per cent and a core capital adequacy of 7.9 per cent. <strong>Storebrand</strong> BankASA had sound capital adequacy and liquidity at the close of <strong>2007</strong>.Implementation of Basel IIOn 1 January 2008, <strong>Storebrand</strong> Bank ASA started submitting reportsin accordance with the standard method pursuant to the new capitaladequacy regulations (Basel II). The bank’s objective is to use theinternally developed credit models to calculate capital requirementspursuant to Basel II and to continuously develop the models furtherfor the retail and corporate units so it can apply to the FinancialSupervisory Authority of Norway for IRB status at a later point intime.The adaptation to Basel II entails major investments in systems andmodels as well as organisational changes and changes to centralbusiness processes, but will result in significant business gains.The preparations for Basel II support the bank’s strategy and competitiveposition. Increased automation, improved decision support anduse of customer data in market modelling pave the way for rapid butcontrolled growth. The systems developments driven by the Basel IIregulations are of general commercial benefit for price setting, financialmanagement and marketing. Making proper use of the migrationto the new regime will ensure that the bank retains a competitiveposition relative to its competitors.Strategy and prospects for 2008<strong>Storebrand</strong> Bank ASA will continue its work to create a competitiveposition through growth, continuous improvement, a high level ofcustomer satisfaction and increased cross-sales. The bank’s positionas the “smart choice for the modern customer” will be sustainedand developed further through product development and improvedcustomer processes.<strong>Storebrand</strong> Bank ASA has been granted a licence to establish <strong>Storebrand</strong>Kredittforetak AS, which will issue bonds with pre-emptiverights. This is important with respect to both the competition situationand liquidity management.Other activitiesOther activities principally comprise <strong>Storebrand</strong> ASA (holding company),and <strong>Storebrand</strong> Skadeforsikring.<strong>2007</strong> 2006<strong>Storebrand</strong> ASA 1 1 057 1 012<strong>Storebrand</strong> Skadeforsikring -18 21Other companies/eliminations 2 -1 027 -990Pre-tax profit 12 411 Including dividends/group contributions from subsidiaries2 Including elimination of dividends/group contributions from subsidiaries<strong>Storebrand</strong> ASA (holding company)The following table shows the profit before tax of <strong>Storebrand</strong> ASA in20 %54 <strong>Annual</strong> <strong>Report</strong> <strong>2007</strong>
accordance with IFRS. The statutory accounts of <strong>Storebrand</strong> ASA areprepared in accordance with Norwegian accounting legislation andNGAAP and can be found on page 110. <strong>Storebrand</strong> ASA reported profitbefore tax in accordance with IFRS of NOK 1,057 million for <strong>2007</strong>compared with NOK 1,012 million for 2006.NOK million <strong>2007</strong> 2006Group contributions and dividends 1 033 1 028Interest income 117 73Interest expense -114 -77Gains/losses on securities 85 70Other financial items 2 0Net financial items 90 66Operating costs -66 -82Pre-tax profit 1 057 1 012Group contributions and dividends consist of the return on capitalinvested in subsidiaries. In <strong>2007</strong>, these were on a par with the level in2006. Pursuant to IFRS, group contributions and dividends are recognisedas income in the year they are approved by the annual generalmeeting. This means that group contributions and dividends recognisedas income in <strong>2007</strong> comes from the profit from the subsidiariesin 2006. NOK 885 million was recognised in income in <strong>2007</strong> from<strong>Storebrand</strong> Life Insurance, compared with NOK 775 million in 2006.<strong>Storebrand</strong> ASA’s operating costs were 20 per cent lower in <strong>2007</strong>than in 2006. The company achieved its target of reducing operatingcosts by NOK 50 million from the 2003 level.the Norwegian Consumer Council’s comprehensive test of vehicleinsurance policies on 20 December <strong>2007</strong>, as well as tests in anotherNorwegian newspaper, Aftenposten, on 20 February <strong>2007</strong> and 21 May<strong>2007</strong>.Other activities: Oslo Reinsurance Company, 100 per cent owned by<strong>Storebrand</strong> Skadeforsikring AS, is principally involved in the run-off ofits own reinsurance business and managing other companies’ run-offbusiness. Alongside its new activities and Oslo Re, the other activitiesof <strong>Storebrand</strong> Skadeforsikring AS are the run-off of its gross insurancecommitments (fronting responsibility), which are reinsured withIf Skadeförsäkring.Financial results for <strong>2007</strong><strong>Storebrand</strong> Skadeforsikring including Oslo Reinsurance Company ASAexperienced an operating loss of NOK 18 million in <strong>2007</strong>, comparedwith NOK 21 million the year before.Monitoring value drivers – <strong>Storebrand</strong>’s value-basedmanagement system<strong>Storebrand</strong>’s strategic planning process brings together targets, actionplans, reporting and employee remuneration, as described in thearticle on corporate governance on pages 31–35.In addition to monitoring financial and accounting results, <strong>Storebrand</strong>also monitors the group’s performance in relation to defined valuedrivers. This lets the Board and management identify trends at an earlystage, implement measures and focus on long-term value creation.Net financial items were positive in <strong>2007</strong>, and were 36 per centhigher than the year before. This was principally due to gains fromthe sale of shares, as well as unrealised share price gains on theshares the company owns in Oslo Børs VPS Holding ASA.<strong>Storebrand</strong> SkadeforsikringFuture-oriented P&C insurance company: <strong>Storebrand</strong> Skadeforsikringoffers standard P&C insurance to the Norwegian retail market.Online sales are the company’s most important sales channel with59 per cent of sales coming via the online sales solution in <strong>2007</strong>. Thedistribution costs and correct risk prices allow the company to offerquality products at advantageous prices.Strong performance: The performance of the P&C business is positive,both with respect to the growth in customers and P&C business.The new business area, which started up at the end of 2006, hasbeen well received in the market. During <strong>2007</strong>, the number of customersgrew from 2,044 to 15,938 and the annual premium representedby the portfolio increased from NOK 8 million to NOK 121 million.The claim ratio for the year was 70 per cent.Price winner: <strong>Storebrand</strong> Skadeforsikring won most media pricetests in <strong>2007</strong>. Among other things, the company won four out of fivesurveys of insurance prices in the Norwegian newspaper Dagbladet,The monthly management report, <strong>Storebrand</strong> Compass, reports onthe performance of key figures and value drivers relative to targetsfor each business area. <strong>Storebrand</strong> Compass is based on balancedscorecard management principles, with the value drivers divided intothe areas of finance, customers and processes, as well as learningand growth. The table on page 56 shows, as examples, selectedparameters in the categories of finance and customers together withan evaluation of the company’s performance in these areas in <strong>2007</strong>.Financial risk management<strong>Storebrand</strong> assumes financial risk in the ordinary course of its corebusiness activities. Good risk management and control of risk exposureis essential in order to attain the group’s financial goals andensure that the group has the financial strength to withstand adversedevelopments and limit the losses these may cause.Risk management: Life insurance<strong>Storebrand</strong>’s investment policy establishes guidelines for the compositionof the financial assets with the objective of achieving thehighest possible return on customers’ pension assets until theyare paid as benefits. The objective is to achieve the highest possiblereturn for customers, pensioners and owners in the long-term.Through this <strong>Storebrand</strong> assumes risk in the ordinary course of itsbusiness activities. Risk management is practised in order to achieve<strong>Annual</strong> <strong>Report</strong> <strong>2007</strong>55
Performance for selected value driversFinance<strong>2007</strong> 2006 2005 PerformanceRanking of life company's investment return relative to selected competitors (1–5) 1 3 2 3 Room for improvementGrowth in SBL premium income excl. transfers, last year (NOK million) 3 509 -3 737 984 Very goodProfit from products not subject to profit-sharing (NOK million) 144 135 122 Very goodGrowth in net interest income, last year (NOK million) -6 -28 7 Room for improvementGrowth in investement management fees from external clients, last year (SBK) (NOK million) 38 36 -28 Very goodCustomersMarket share (new business) 2- Occupational pensions (benefit/contribution) excluding transfers 37% 32% 43% Very good- Corporate group life 18% 23% 40% Room for improvement- Long-term pensions savings and mutual funds 3 8% 7% 6% Satisfactory- Individual endowment policies 30% 25% 59% Satisfactory- Personal risk products 9% 10% 12% Room for improvementTransfer of pension business (NOK million) 1056 5 260 712 Very goodCustomer satisfaction – Norsk Kundebarometer Survey 4 70 70 67 Very goodNumber of products per retail customer 1.8 1.5 1.35 Room for improvementNumber of new banking customers (gross) 5 11 556 9 631 5 427 Very goodBrand preferance 6 14.1 N/A N/A Room for improvement1 Investment return III. <strong>Storebrand</strong>'s ranking in terms of Investment return III vs. SpareBank 1, Nordea, Vital and KLP as at Q4 <strong>2007</strong>.2 Norwegian Financial Services Association and Norwegian Mutual Fund Association statistics at Q3 <strong>2007</strong>.3 Equity/combination funds, Unit Linked and Annuity/IPA weighted by total market sales volumes.4 Scale from 0–100 showing whether corporate customers are satisfied with product delivery, whether we meet their expectations and their experience of <strong>Storebrand</strong> relative to ourcompetitors.5 Both retail and corporate customers. Measures number of new customers6 New value driver, monthly measurement, carried out by TNS Gallup. Preference stated as a percentage share of those who would choose <strong>Storebrand</strong> (prefer) within five areas (average ofthese five areas): banking, life insurance, P&C insurance, pension saving and direct fund saving.the outlined goal in a controlled manner. The dominant risk factor in<strong>Storebrand</strong> Life Insurance is financial risk and in the Norwegian businessthis is primarily associated with achieving the annual guaranteedreturn, which is just over 3.5 per cent on average. In SPP’s activities,the long-term pension liabilities are a key source of financial risk. Theannual guaranteed interest rate and the long-term pension liabilitiesindicate how the capital in <strong>Storebrand</strong>’s customer and owner portfoliosshould be invested in various securities and asset classes.The investment portfolio is subject to a range of quantitative andqualitative limits, and risk is measured and monitored continuouslyusing a range of reports, models and tests. For instance, “ConditionalValue at Risk” is used as a method for calculating the potential forloss on a one-year horizon for a given probability, including worstcaselosses. This is evaluated in the light of the guaranteed annualreturn, the long-term pension liabilities and the company’s risk capitalfinanced by policyholders and the owner. This measurement ofrisk is known as coherent and is thus suitable for comparing the riskin <strong>Storebrand</strong>’s Norwegian and Swedish business.The expected return on the investment portfolio is calculated on thebasis of asset allocation and the expected return on asset classes.This is based on historic return, expected risk premium and forwardprices. Expected return on the portfolios for the next few years iscalculated to be between 6 per cent and 7 per cent. Continuous activerisk management, together with hedging transactions, reduce thelikelihood of a low investment return. If investment return is insufficientto meet the guaranteed interest rate in Norway or market movementsare such that the current value of the pension liabilities inSweden increase, the shortfall will be met by using buffer capital builtup from previous surpluses. The owner is responsible for meeting anyremaining shortfall if the built up buffer capital is insufficient. Theaverage guaranteed interest rate in Norway and Sweden is expectedto fall in future years since new contracts are subject to a lower guaranteedinterest rate than the average of the current portfolio. Theguaranteed rate on new contracts in Norway and Sweden is 2.75 percent and 2.5 per cent, respectively.A new Insurance Activities Act came into force in Norway on 1 January2008. This entails that company assets and customers’ assets can56 <strong>Annual</strong> <strong>Report</strong> <strong>2007</strong>
no longer be managed in the same portfolio. Moreover, customers’assets are divided into two main categories: collective and those withan investment choice. The traditional guaranteed interest rate appliesto all the customers in the collective portfolio, while the investmentchoice category includes both traditional defined benefit pensions, towhich the guaranteed interest rate applies, and defined contributionpensions without a guaranteed interest rate. The investment strategyand risk management have been tailored to the new frameworkwith varying assets allocation and risk management measures beingpractised for the different portfolios. In the case of the collectiveportfolio, the Norwegian authorities specify that the company’s riskcapital is the total of the market value adjustment reserve, additionalstatutory reserves, core capital in excess of the regulatory minimumand accrued earnings. This risk exposure is monitored using a stresstest that estimates potential losses in the event of extreme marketmovements. In the case of the portfolio of assets with an investmentchoice, any guaranteed interest rate is linked to the value-adjustedreturn. The portfolio thus does have an eligible market value adjustmentreserve element as part of its risk capital. On the other hand,the guarantee period is extended to five years unlike the collectiveportfolio. The risk management is designed to reflect these differences.In the case of the Swedish activities in SPP the portfolio is dividedinto defined benefit pensions, defined contribution pensions andunit-linked policies. Both the defined benefit pensions and the definedcontribution pensions in SPP have associated guarantees. Thisresults in the generation of financial risk in the event of falling stockmarkets and falling interest rates. In the case of some policies, a riskalso arise from strongly rising interests rates. Due to the somewhatmore complex financial risk picture in SPP than in the Norwegian activities,the risk the customer portfolio represents against the equityis also managed through derivative transactions in SPP’s companyportfolio. The investment strategy and risk management in SPP comprisesthree main pillars. Asset allocation that results in a good returnover time for customers and the owner, the continuous implementationof risk management measures in the customer portfolios, andtailored hedging of certain selected insurance policies in the company’sportfolio.As part of the risk management, <strong>Storebrand</strong> continuously monitorsthat all statutory requirements, such as, for example, capital adequacy,solvency margins and the traffic light tests in Sweden, aremet with a satisfactory margin. The Board adopts limits for these andother risk goals for the company. Monitoring, management reportsand reporting the risk in the life insurance companies to the authoritiestakes place periodically and on a daily basis if necessary.Financial markets can fluctuate dramatically in a short space of timeand thus affect the company’s risk exposure. <strong>Storebrand</strong> continuallymanages its risk exposure to keep it within limits approved by theBoard of Directors in several ways. Firstly, considerable importanceis attached to building up sufficient risk capital to absorb losses.Secondly, risk exposure is diversified as much as possible by investingin assets that are not expected to cause losses at the same time.Thirdly, risk is managed dynamically in relation to the company’srisk bearing capacity by buying and selling securities with differentlevels of risk tailored to the customer portfolio to which the assets’portfolio belongs. Fourthly, financial hedging instruments, such asoptions and forward exchange contracts, are used. This combinationpermits good control of the life insurance company’s total exposureto financial risk. The principles apply to both the Norwegian and theSwedish activities.Life insurance policies are long-term commitments, and there arerisks associated with the assumptions made about life expectancyand disability. Premiums paid by policyholders and the investmentreturns achieved may therefore not be sufficient to meet thepayments guaranteed in the future. Mortality, disability and otherinsurance risks are monitored by using actuarial analyses, includingstress testing the existing portfolio of policies. The company hasarranged reinsurance cover for death and disability risk in the eventof unexpectedly large losses or a large number of losses caused by asingle event.The income of <strong>Storebrand</strong>’s life insurance companies is linked to thestatutorily defined income model that applies to the various productareas and policy portfolios. Following the introduction of the new actrelating to insurance activities three different models apply to Norwegianactivities involving return guarantees: the old model appliesto the existing individual portfolio which, in broad terms, involves anupper limit of contributions to the owner of 35 per cent of the profit.Modified profit sharing has been introduced for the paid-up policiesportfolio that limits the contribution to the owner to 20 per cent ofthe result that exceeds the guaranteed interest, and for the majorityof the portfolio, advance pricing has been introduced for the guaranteedinterest premium, administration premium and biometric risk. Inthe case of the Swedish activities in SPP, a profit sharing model hasbeen established in which 10 per cent of the entire return belongs tothe owner, assuming that this exceeds the return guaranteed for theindividual policy.For Norwegian life insurance companies, the annual guaranteed interestrate included in long-term insurance policies creates a number ofchallenges with respect to interest rate risk. In the short-term, themost apparent risk is that the company’s investments will fall in valueif bond prices are reduced by an increase in interest rates. In thelonger term, however, a low level of interest rates could make fulfillingthe guaranteed interest rate on existing contracts a challenge. Thereis a risk that over time this could result in the company’s profit andthe customers’ return weakening and insufficient risk capacity to buildup risk capital and provide adequate pension savings. Falling interestrates are the most challenging scenario in the long-term, for boththe Norwegian and the Swedish activities. However, it is necessary toweigh measures against this risk scenario against the short-term riskthat the annual guaranteed interest rate represents. It is also worth<strong>Annual</strong> <strong>Report</strong> <strong>2007</strong>57
mentioning that customers’ are exposed to a risk of increasing inflationgiven that their pension savings must sustain their purchasingpower.Rising market interest rates in <strong>2007</strong> have improved the risk situationin this area, but <strong>Storebrand</strong> takes a serious view of the consequencesthat low interest rates in the future may represent over the longerterm, and has implemented measures to limit this risk. The mostimportant measure is that the group has invested in bonds to be heldto maturity that generate a higher return than current interest rates.These bonds will produce a stable book investment return of 5 percent to 6 per cent for a number of years.The company pays great attention to closely evaluating investmentopportunities that offer a higher return, but these are balancedagainst the risk of losses and falls in the value of such investments.Real estate is an asset class that offers a relatively high future runningyield, but where the risk of loss or depreciation is higher thanfor government bonds. Other alternative investment classes includeinfrastructure and natural resources (forestry, commodities, etc).Moreover, <strong>Storebrand</strong> believe that some exposure to emerging marketsthough both interest and equity investments is sensible. All suchinvestments present challenges in relation to <strong>Storebrand</strong>’s sociallyresponsible investment criteria and require painstaking work. <strong>Storebrand</strong>continually develops its investment portfolio to include suchnew alternative asset classes.sharing in Norwegian insurance companies. <strong>Storebrand</strong> is of the viewthat an uncritical acceptance of the proposed regulations may haveunfortunate consequences for policyholders and owners, and couldcontribute to non-optimal asset allocation in the Norwegian financialmarket with the accompanying negative effects. <strong>Storebrand</strong> is thereforeactively working to contribute to an appropriate formulation andintroduction of Solvency II in Norway.Risk management: Asset management<strong>Storebrand</strong> actively manages a large portion of its assets. This meansthat its fund managers are allowed a degree of freedom with theobjective of producing a better return than the market. The group’sasset management activities are structured into a number of specialistteams so that each team concentrates solely on taking advantageof investment opportunities in a specific area, subject to clearlydefined investment criteria and risk limits. Performance, risk exposureand investment profile are continuously monitored. In addition, theco-variance of the teams’ exposure is monitored to ensure the greatestpossible independence in order to achieve the highest possiblerisk-adjusted return.A separate team is responsible for managing market risk. This team’sduties include currency hedging, programme trading, hedging transactions,SRI criteria and liquidity transactions. This structure permitsthe more efficient use of resources and greater control over activerisk positions in the group’s investment portfolioThe Norwegian Financial Supervisory Authority new stress test isbeing implemented in the sector and is part of the new risk-basedsupervision methodology that the Norwegian Financial SupervisoryAuthority is currently developing for Norwegian financial institutions.The test will not indicate capital requirements, rather it is meant tocontribute to better risk management by insurance companies andforms part of the preparations for the new European solvency regulations,Solvency II, that are expected to be implemented in 2012 at theearliest. Similar stress testing, called traffic light testing, has beenintroduced in Sweden. The stress tests cover both the assets and theliabilities sides of the balance sheet and provide a net capital requirementfor the business. One important difference between the Swedishand Norwegian models is that the profit sharing in Sweden isconditional, and a so-called “conditional bonus” can thus be utilisedto reduce the capital requirement during the stress tests.In short, Solvency II will require the market value of insurers’ liabilitiesto be assessed via discounting using the current risk-free interest rateapplicable at any time with the relevant period for the insurance policies.The assets and liabilities will be subjected to a common stresstest and the result of this will provide information about the risksituation in the companies, and indications concerning the reservesneeded and the capitalisation of the companies. Introducing sucha regime in Norway involves challenges related to the limited sizeof the Norwegian government bond market, the weak correlationbetween Norwegian and foreign interest rates, the relationship to thenew Insurance Activities Act, the unique Norwegian rules on transfersof insurance business, and the arrangements for unconditional profitRisk management: Banking<strong>Storebrand</strong> Bank ASA places great importance on maintaining closerelationships with its corporate customers and monitoring credit risk,and has credit review policies in place. A significant proportion of<strong>Storebrand</strong> Bank’s corporate lending is linked to real estate in thegreater Oslo area. <strong>Storebrand</strong> follows economic conditions and thereal estate market in this region closely.Lending to corporate customers over a certain limit requires the approvalof a credit committee chaired by the bank’s managing director,or from the bank’s Board. Credit risk is monitored through a risk classificationsystem that ranks each customer by ability to pay, financialcondition and collateral. All loans on the bank’s watch list are reviewedat least quarterly in respect of the condition of the borrowerand collateral, and of the steps being taken to protect the bank’s position.The total risk in the portfolio has been falling strongly in recentyears and the proportion of long-term repayment loans within 80 percent of the valuation of the collateral has increased significantly.Separate credit approval processes are now used for retail lending onthe basis of credit scoring, combined with case-by-case evaluation ofthe borrower’s ability to repay. The increase in retail lending is regardedas very important for the bank as a whole with respect to reducing thebank’s risk. Approximately 98 per cent of lending to retail customers iswell secured by mortgages or the bank’s own equity linked bonds.The bank manages its exposure to counterparty risk when placingits liquidity or through other exposure on the basis of the counter-58 <strong>Annual</strong> <strong>Report</strong> <strong>2007</strong>
party’s credit rating and size. The bank places great importance onthe quality of its counterparties, and it limits its exposure to any onecounterparty in order to avoid loss and ensure high liquidity in itsholdings of securities.The work on developing the framework for comprehensive riskmanagement in the group forms part of the continuous developmentof <strong>Storebrand</strong>’s value-based management system, and improves thebasis for making decisions concerning the management of the group.Liquidity risk refers to the risk that the bank is not able to meet allits financial liabilities as they fall due for payment. <strong>Storebrand</strong> Bankmaintains sufficient liquidity to support balance sheet growth and torepay funding and deposits as they mature. The bank manages itsliquidity position on the basis of rolling short-term, medium term andlong-term liquidity gaps that show the mismatch between expectedinward and outward cash flows on the balance sheet date.<strong>Storebrand</strong> Bank has established good liquidity buffers, and continuouslymonitors liquidity reserves against internal limits. Committedcredit lines from other banks are also available to the bank if necessary.<strong>Storebrand</strong> Bank ASA also maintains relationships with a numberof international banks, ensuring access to the international capitalmarket and providing greater diversity in the group’s funding.Market risk is the risk that unexpected and adverse movements ininterest or exchange rates reduce the value of the bank’s assets.<strong>Storebrand</strong> Bank manages its exposure to interest rate risk so thatnet interest rate exposure is low. All instruments with an interest ratefixing period in excess of six months are subject to a specific hedgingpolicy for economic risk. Moreover, interest rate hedging transactionsmust be structured so that they do not have a material accounting effect.For exchange rate risk, it is the policy of the bank to fully hedgeall exposures arising in connection with foreign currency investments,lending and borrowing. Hedging is primarily done through rollingforeign exchange forward contracts.Overall risk management for the groupIn recent years, <strong>Storebrand</strong> has invested significant resources in developinga framework for effective and comprehensive managementof the group’s overall risk. Methods and modelling systems have beendeveloped for the life insurance activities in Norway and Sweden thathandle risk management and reporting based on integrated balancesheet management. This allows the liabilities and assets of the lifeinsurance company to be evaluated in relation to changes in exogenousvariables such as interest rate levels, and take into account theestablished management principles for handling financial risk. Themodels are used for reporting European Embedded Value. In <strong>2007</strong>,they were developed further into methods that are used consistentlyin the market and with respect to the implementation of the new actrelating to insurance activities in Norway. The framework enables consistentcalculations and analyses, and facilitates integrated managementof the risk, capital and value in the business. Correspondingly,in connection with the Basel II regulations the banking business hasdeveloped methods and systems for identifying and managing risk inthe group.<strong>Annual</strong> <strong>Report</strong> <strong>2007</strong>59
Members of <strong>Storebrand</strong>’scorporate bodiesBOARD OF REPRESENTATIVESChairman:Terje R. VenoldDeputy Chairman:Inger Lise GjørvMembers (elected by shareholders):Arvid GrundekjønJohan H. Andresen jr.Merete Egelund ValderhaugVibeke Hammer MadsenTrond BjørganKaren Helene Ulltveit-MoeStein Erik HagenMargareth ØvrumOlaug SvarvaRoar EngelandMembers (elected by employees):Rune PedersenArild ThoresenUnn Kristin JohnsenPaul Eggen jr.Tor HaugomRandi PaulsrudDeputy members(elected by shareholders):Lars TronsgaardMarius SteenElin KorvaldHenrik O. MadsenEinar GaustadDeputy members(elected by employees):Per-Erik HaugeTrond ThireBOARD OF DIRECTORSOF STOREBRAND ASAChairman:Leiv L. NergaardBoard members:Halvor StenstadvoldSigurdur EinarssonBirgitte NielsenCamilla M. GriegBarbara R. M. ThoralfssonBoard members (elected by employees):Ann-Mari GjøsteinErik Haug HansenKnut Dyre HaugREMUNERATION COMMITTEEChairman:Leiv L. NergaardMembers:Birgitte NielsenAnn-Mari GjøsteinAUDIT COMMITTEEChairman:Halvor StenstadvoldMembers:Barbara R. M. ThoralfssonErik Haug HansenCONTROL COMMITTEEChairman:Elisabeth WilleMembers:Harald MoenIda Hjort KrabyOle KletteELECTION COMMITTEEChairman:Terje R. VenoldMembers (elected by shareholders):Dag J. OpedalJohan H. Andresen jr.Olaug SvarvaObserver (elected by employees):Randi Paulsrud60 <strong>Annual</strong> <strong>Report</strong> <strong>2007</strong>
Contents – Accounts and Notes to the accounts <strong>Storebrand</strong> GroupProfit and Loss Account <strong>Storebrand</strong> Group 62Balance Sheet <strong>Storebrand</strong> Group 63Cash flow statement <strong>Storebrand</strong> Group 64<strong>Storebrand</strong> Group equity reconciliation 65Accounting Principles <strong>2007</strong> 66Note 1:Important accounting estimatesand judgements 71Note 2: Acquisition of new business 72Note 3: Segment reporting 74Note 4: Other income 76Note 5: Operating costs 76Note 6: Other costs 76Note 7: Tax 76Note 8: Intangible assets and goodwill 78Note 9: Tangible fixed assets 78Note 10:Tangible fixed assets– operational leasing 79Note 11: Pensions 79Note 12:Remuneration of senior employeesand elected officers of the company 81Note 13: Investments in associated companies 84Note 14: Joint ventures 85Note 15:Contingent liabilities andconditional assets 85Note 16: Investment properties 85Note 17: Capital adequacy 86Note 18: Number of employees 86Note 19:Note 20:Note 21:Note 22:Net income analysed by class offinancial instrument 87Lending losses/write-back of earlierlosses 88Classificationof financial assets and liabilities 88Fair value of financial assetsand liabilities 89Note 23: Collateral 90Note 24: Contingent liabilities 90Note 25: Stock lending 90Note 26: Hedge accounting 91Note 27: Bonds at amortised cost 92Note 28: Shares and other equity investments 92Note 29:Note 30:Bonds and otherfixed-income securities 93Assets in life insurance withinvestment choice 94Note 31: Financial derivatives 94Note 32: Financial liabilities 95Note 33: Further information on financial risk 96Note 34: Credit risk 98Note 35: Liquidity risk 99Note 36: Interest rate risk 100Note 37: Currency risk 101Note 38: Technical insurance information 102Contents – Accounts and Notes to the accounts <strong>Storebrand</strong> ASAProfit and Loss Account <strong>Storebrand</strong> ASA 110Balance Sheet <strong>Storebrand</strong> ASA 111Cash flow statement <strong>Storebrand</strong> ASA 112Accounting Principles <strong>2007</strong> 113Note 1:Income frominvestments in subsidiaries 114Note 2: Personnel expenses 114Note 3: Pension costs and pension liabilities 114Note 4:Remuneration of theChief Executive Officer andelected officers of the company 116Note 5: Tax 117Note 6:Holding company’s shares insubsidiaries and associated companies 118Note 7: Shares and other equity investments 118Note 8: Commercial paper and bonds 118Note 9: Financial derivatives 119Note 10: Financial risk 119Note 11: Real estate and operating assets 120Note 12: Equity capital 121Note 13: Bonds issued 121Note 14: Shareholders 121Note 15:Holdings of shares in <strong>Storebrand</strong> ASAby executive managementand members of corporate bodies 122Note 16: Number of employees 123Note 17: Guarantees issued 123Auditor's report for <strong>2007</strong> 124<strong>Storebrand</strong> Group companies 125Terms and expressions 126<strong>Annual</strong> <strong>Report</strong> <strong>2007</strong>61
Profit and Loss Account <strong>Storebrand</strong> Group1 January – 31 DecemberNOK million Note <strong>2007</strong> 2006 2005Net premium income 38 19 743.6 19 539.1 19 383.4Net interest income - banking 19 413.2 418.8 447.3Net income and gains from financial assets at fair value:- shares and other equity investments 19 658.0 6 057.5 7 439.9- bonds and other fixed-income securities 19 123.9 1 356.1 1 585.4- financial derivatives 19 4 649.0 673.3 -1 619.9- income from financial assets with investment choice 19 353.4 685.4 721.3Net income from bonds at amortised cost 19 2 235.2 2 397.2 2 409.9Net Income from investment properties 16 4 387.5 1 997.5 885.7Profit from investments in associated companies 13 -19.6 19.1 6.8Other income 4 853.1 930.9 464.4Total income 33 397.3 34 074.9 31 724.2Insurance claims for own account -17 669.3 -14 493.0 -10 823.1Change in insurance reserves -9 951.1 -9 238.8 -12 422.8Interest expense 19 -318.2 -212.9 -197.1Loan losses/write backs of earlier losses 20 78.2 47.0 34.4Operating costs 5 -2 581.6 -2 520.7 -2 169.4Other costs 6 -188.0 -79.8 -255.9Total costs -30 630.0 -26 498.2 -25 833.9To/from market value adjustment reserve 38 2 036.0 -2 027.3 -1 150.1Operating profit/loss 4 803.3 5 549.4 4 740.2To/from additional statutory reserves – life insurance 38 -400.0 -1 000.0 -950.0Funds allocated to policyholders – life insurance -2 383.5 -2 964.1 -2 336.8Group profit/loss 2 019.8 1 585.3 1 453.4Changes in security reserves etc. – P&C insurance 9.1 -0.2 10.0Profit/loss from ordinary activities before tax 2 028.9 1 585.1 1 463.4Tax charge 7 -20.1 -79.3 -41.1Profit/loss for the period 2 008.8 1 505.8 1 422.3Profit is due to:Minority interest's share of profit 3.1 9.5 3.6Majority interest's share of profit 2 005.7 1 496.3 1 418.7Total 2 008.8 1 505.8 1 422.3Earnings per ordinary share (NOK) 7.95 6.03 5.41Average number of shares as basis for calculation (million) 251.5 248.0 258.6<strong>Storebrand</strong> has not issued any options or other financial instruments that could cause dilution of its shares.62<strong>Annual</strong> <strong>Report</strong> <strong>2007</strong>
Balance Sheet <strong>Storebrand</strong> Group31 DecemberNOK million Note <strong>2007</strong> 2006 2005AssetsDeferred tax asset 7 234.9 207.0 290.0Intangible assets 8 10 189.7 540.7 508.2Pension assets 11 205.0 58.4 57.0Tangible fixed assets 9 1 103.2 842.9 752.0Investments in associated companies 13 174.6 237.1 138.3Bonds at amortised cost 21,22,27 40 380.1 43 098.8 40 671.6Lending to financial institutions 21,22,35 374.1 114.9 41.7Lending to customers 21,22,35 39 493.5 33 087.6 26 942.1Reinsurers' share of technical reserves 38 1 501.3 1 828.3 2 401.9Real estate at fair value 16 21 358.6 17 447.0 13 503.6Other assets 221.6 73.1 150.7Due from customers and other current receivables 21,22 6 512.6 5 046.5 6 278.0Financial assets at fair value:- Shares and other equity participations 21,22,28 73 661.1 46 604.0 39 589.1- Bonds and other fixed-income securities 21,22,29,35,36 112 025.6 50 782.7 57 539.3- Derivatives 21,31,35,36 4 774.1 2 117.7 1 481.1- Life insurance assets with investment choice 21, 30 39 083.4 7 364.1 5 719.4- Other financial assets 21,22 4 853.4Other current assets 33.0 119.8 52.1Bank deposits 21,22 25 569.0 13 216.0 5 768.7Total assets 381 748.8 222 786.6 201 884.8Equity and liabilitiesPaid in capital 11 711.7 3 045.2 3 081.8Retained earnings 7 362.1 5 817.1 6 007.7Value adjustment fund 44.6 24.0 12.0Minority interests 122.2 13.5 6.8Total equity 19 240.6 8 899.8 9 108.3Subordinated loan capital 21,22,32 5 213.8 3 711.7 3 524.9Market value adjustment reserve 38 3 853.7 5 889.7 3 862.5Insurance reserves – life insurance 38 241 744.7 146 203.4 134 621.7Reserve for life insurance with investment choice 38 39 208.2 7 364.1 5 719.4Premium and claims reserves – P&C insurance 38 1 998.8 2 297.3 2 998.5Security reserves, etc – P&C insurance 38 31.8 40.9 40.7Pension liabilities 11 1 121.0 870.9 715.4Deferred tax 7 630.8 116.5 189.6Financial liabilities:- Liabilities to financial institutions 21,22,32 3 064.5 2 786.0 1 464.6- Deposits from banking customers 21,22,32 17 469.6 13 533.7 11 187.0- Securities issued 21,22,32 23 327.9 16 395.3 15 653.7- Derivatives 21,22,31,35,36 3 644.6 1 797.2 1 719.4Other current liabilities 21,22 21 198.8 12 880.1 11 079.2Total equity and liabilities 381 748.8 222 786.6 201 884.8Oslo, 12 February 2008Translation – not to be signedLeiv L. NergaardChairman of the BoardHalvor Stenstadvold Sigurdur Einarsson Camilla M. Grieg Barbara Rose Milian ThoralfssonBirgitte Nielsen Knut Dyre Haug Ann-Mari Gjøstein Erik Haug Hansen Idar KreutzerChief Executive Officer<strong>Annual</strong> <strong>Report</strong> <strong>2007</strong>63
Cash flow statement for <strong>Storebrand</strong> Group1 January – 31 DecemberNOK million <strong>2007</strong> 2006 2005Cash flow from operational activitiesNet premiums received – direct insurance 20 323.1 10 691.8 16 116.4Net claims and benefits paid – direct insurance -15 241.7 -13 321.7 -8 629.9Net claims and benefits paid – reinsurance -0.2 5 051.0 -3.9Net receipts/payments – policy transfers 915.8 505.1Interest, commission and fees received from customers 2 179.5 1 388.0 1 229.9Interest, commission and fees paid to customers -1 725.2 -927.8 -651.9Net receipts/payments – lending to customers -6 185.1 -6 025.3 -3 055.5Net receipts/payments – loans to and claims on other financial institutions -234.9 -52.1 153.7Net receipts/payments – customer deposits with the banking activities 3 988.4 2 517.0 84.2Net receipts/payments – deposits from Norges Bank and other financial institutions 279.0 1 321.7 -687.2Net receipts/payments – securities in the trading portfolio:- Shares and other equity participations 3 350.1 -1 853.9 -7 447.6- Bonds and other fixed-income securities 926.5 8 671.7 -3 787.5- Financial derivatives and other financial instruments -3 998.0 505.8 2 806.7- Dividend receipts from the trading portfolio 8.4 3.2 36.4Net receipts – discretionary asset management and funds management 363.4 369.3Payments to third parties for goods and services -504.3 2 932.0 1 713.3Net receipts/payments – real estate activities 555.7 -2 015.9 -315.2Payments to employees, pensioners, employment taxes, etc -1 283.8 -1 124.4 -1 078.9Payments of tax, duties, etc -82.1 -83.6 25.8Net receipts/payments – other operational activities 5.2 -0.9 0.4Net cash flow from operational activities 3 639.9 8 045.8 -2 985.8Cash flow from investment activitiesNet receipts from sales of subsidiaries 4.3 261.7 250.2Net payments upon purchase/capitalisation of subsidiaries -13 829.8Payments on purchase of real estate -316.9 -12.4Net receipts/payments on sale/purchase of fixed assets etc. -108.4 -104.1 -40.9Net cash flow from investment activities -14 250.8 157.6 196.9Cash flow from financing activitiesRepayment of long term lending -421.0 -0.5 -79.5Receipts from taking up term loans 4 596.1 1.3 1 578.2Receipts from issue of short-term debt instruments/loans 743.8 182.2Payments on short-term debt instruments/loans -737.4Receipts from issue of subordinated loan capital 256.0 100.3 6.9Interest payments on subordinated loans -347.0 -80.0 -255.3Receipts from issue of bond loans and other long term funding 2 006.2 1 462.3 3 007.6Receipts from issue of new share capital 8 670.4 0.7Payments on redemption of share capital -106.6 -502.8 -1 017.8Dividend/group contribution payments -450.6 -999.3 -1 823.4Net cash flow from financing activities 14 947.3 -756.1 1 599.7Net cash flow for the period 4 336.5 7 447.3 -1 189.1Net movement in cash and cash equivalent assets 4 336.5 7 447.3 -1 189.1Cash/cash equivalents at start of the period for new companies 8 016.5Cash and cash equivalent assets at start of the period 13 216.0 5 768.7 6 957.8Cash and bank deposits at the end of the period 25 569.0 13 216.0 5 768.764<strong>Annual</strong> <strong>Report</strong> <strong>2007</strong>
<strong>Storebrand</strong> Group equity reconciliationNOK millionPaid-incapitalValueadjustmentfundMajority's share of equityRevenue &costs appliedto equityOther equityOtherequityTotal otherequityMinorityinterestsTotal equityEquity at 31.12.04 3 133.2 7.2 -180.6 7 215.9 7 035.3 2.0 10 177.7Profit and loss account items applied directly to equity:Pension experience adjustments -49.7 -49.7 -0.1 -49.8Revaluation of properties for own use 4.8 4.8Restatement differences -1.6 -1.6 -1.6Profit for the period 1 418.7 1 418.7 3.6 1 422.3Total revenue and costs for the period 4.8 -51.3 1 418.7 1 367.4 3.5 1 375.7Equity transactions with owners:IAS 39 effects -1.6 -1.6 -1.6Own shares -51.4 -567.1 -567.1 -618.5Dividend paid -1 823.4 -1 823.4 -1.7 -1 825.1Other -2.9 -2.9 3.0 0.1Equity at 31.12.05 3 081.8 12.0 -231.9 6 239.6 6 007.7 6.8 9 108.3Profit and loss account items applied directly to equity:Pension experience adjustments -239.7 -239.7 -239.7Revaluation of properties for own use 12.0 12.0Restatement differences 11.8 11.8 11.8Profit for the period 1 496.3 1 496.3 9.5 1 505.8Total revenue and costs for the period 12.0 -227.9 1 496.3 1 268.4 9.5 1 289.9Equity transactions with owners:Own shares -36.6 -466.2 -466.2 -502.8Dividend paid -999.3 -999.3 -2.9 -1 002.2Other 6.5 6.5 0.1 6.6Equity at 31.12.06 3 045.2 24.0 -459.8 6 276.9 5 817.1 13.5 8 899.8Profit and loss account items applied directly to equity:Pension experience adjustments 143.8 143.8 143.8Revaluation of properties for own use 20.6 8.0 8.0 28.6Restatement differences -30.1 -30.1 -30.1Hedging booked against equity -25.6 -25.6 -25.6Profit for the period 215.0 1 790.7 2 005.7 3.1 2 008.8Total revenue and costs for the period 20.6 311.1 1 790.7 2 101.8 3.1 2 125.5Equity transactions with owners:Own shares -3.8 -72.2 -72.2 -76.0Share issue 9 004.0 9 004.0Share issue costs -333.7 -333.7Dividend paid -442,0 -442,0 -9,0 -451,0Purchase of minority interests -56.4 -56.4 114.3 57.9Other 13.8 13.8 0.3 14.1Equity at 31.12.07 11 711.7 44.6 -148.7 7 510.8 7 362.1 122.2 19 240.6<strong>Annual</strong> <strong>Report</strong> <strong>2007</strong>65
Notes GroupAccounting PrinciplesThe accounting principles used for the preparation of the consolidated accountsare described below. The principles are applied consistently to similar transactionsand to other events involving similar circumstances.Basic principlesThe consolidated accounts of <strong>Storebrand</strong> ASA are prepared in accordance withthe EU-approved International Financial <strong>Report</strong>ing Standards (IFRS) and accompanyinginterpretations, as well as the other Norwegian obligations to disclosethat follow from the Accounting Act, the Stock Exchange Regulations and thestock exchange's rules. The accounts are prepared in accordance with the historiccost principle, with the exception of:• Investment properties which are valued at fair value• Properties which are valued at fair value• Financial instruments which are valued at fair valueUse of estimates in preparing the annual accountsThe preparation of the accounts in accordance with IFRS requires the managementto make valuations, estimates and assumptions that affect assets, liabilities,revenue, costs, the notes to the accounts and information on potentialliabilities. The final values realised may differ from these estimates.Changes to accounting principlesNo changes to the accounting principles were made in <strong>2007</strong>.Standards and interpretations of existing standards and where <strong>Storebrand</strong> andhas not chosen early applicationThe following standards and interpretations, approved by the EU, which are notmandatory for annual accounts prepared as per 31 February <strong>2007</strong> have not beenadopted by <strong>Storebrand</strong>: IFRS 8 Operating segments, revised IAS 23 Borrowing costs,new IAS 1 Presentation of financial statements and IFRIC 11, 12, 13 and 14.ConsolidationThe consolidated financial statements combine <strong>Storebrand</strong> ASA and companieswhere <strong>Storebrand</strong> ASA has the power to exercise a controlling influence.A controlling influence is normally achieved where the group owns, directly orindirectly, more than 50 per cent of the shares in a company and the group hasthe power to exercise control over the company. Minority interests are includedin the group’s equity capital.The acquisition method of accounting is used to account for the purchase of subsidiaries.Investments in associated companies (normally investments of between20 per cent and 50 per cent of the associated companies’ equity capital) wherethe company exercises significant influence are consolidated in accordance withthe equity method. Interests in joint ventures are consolidated in accordancewith the proportional consolidation method, i.e. by including the proportion ofrevenue, costs, assets and liabilities in the appropriate lines in the accounts.Presentation currency and currency convertion of foreign companiesThe group’s presentation currency and functional currency is the Norwegiankrone (NOK). Foreign companies included in the group that use a differentfunctional currency are translated to NOK by converting the profit and lossaccount at the average exchange rate for the accounting year and convertingthe balance sheet at the exchange rate at close of the accounting year. Anyconvertion differences are booked directly to equity.Elimination of internal transactionsInternal receivables and payables, internal profits and losses, interest anddividends, etc between group companies are eliminated in the consolidatedaccounts. Transactions between <strong>Storebrand</strong> Livsforsikring AS and other units inthe group that affect the profit sharing between customers and owners of thelife insurance company are not eliminated.Consolidation of fund investmentsIn the consolidated accounts, fund investments are consolidated if they areconsidered to be of particular importance for <strong>Storebrand</strong>’s investment needsand <strong>Storebrand</strong> holds more than 50 per cent of the units in the fund and inaddition is the fund manager.Integration of businessThe acquisition method is used when business is acquired. The acquisition costis measured at its fair value after taking into account any equity instruments aswell as direct expenses with respect to the acquisition. Any share issue expensesare not included in the acquisition cost, but are charged to equity.Identified materials and intangible assets and liabilities that have been takenover are valued as their fair value at the time of acquisition. If the acquisitioncost exceeds the value of the identified assets and liabilities, the difference isrecognised in the accounts as goodwill. If the acquisition costs is less than theidentified assets and liabilities, the difference is recognised in the profit andloss account at the time of the transaction. In the event of acquisitions of lessthan a 100 per cent interest, 100 per cent of the extra value is recognised inthe balance sheet, with the exception of goodwill of which only <strong>Storebrand</strong>'sshare is recognised.Segment reportingThe group is organised into life insurance activities, banking activities, assetmanagement activities and other activities, which include P&C insurance. Segmentinformation is presented for both business areas and geographic areas.Business areas are the group’s primary reporting segments. Financial informationin respect of these segments is presented in note 3.Tangible fixed assetsThe group’s tangible fixed assets comprise equipment, fixtures and fittings,vehicles, IT systems and properties used by the group for its own activities.Equipment, fixtures and fittings, vehicles and IT systems are valued at acquisitioncost reduced by accumulated depreciation and any write-downs.Properties used for the group’s own activities are valued at written up valueless accumulated depreciation and write-downs. The fair value of these propertiesis tested annually in the same way as described for investment properties.Increases in the value of properties used for the group’s own activities are notrecognised in the profit and loss account but are recognised as a change in therevaluation reserve that forms part of equity. Any write-down of the value ofsuch a property is first applied to the revaluation reserve for increases in thevalue of the property in question. If the write-down exceeds the revaluationreserve for the property, the excess is recognised in the profit and loss account.Straight-line depreciation is applied over the following periods:Properties15–50 yearsEquipment, fixtures and fittings 4 yearsVehicles 6 yearsIT systems 3–8 yearsThe depreciation period and the method of depreciation are reviewed annuallyto ensure that the method and period used correspond with the financial lifetimeof the asset in question. This also applies to the disposal value. Propertiesare split into components if different parts have different periods of expectedcommercial life. The depreciation period and method of depreciation are evaluatedseparately for each component.Consideration is given to writing down the value of an asset if there are indicationsof a fall in its value.Investment propertiesProperties leased to tenants outside the group are classified as investmentproperties. In the case of properties occupied partly by the group for its ownuse and partly let out to tenants, the identifiable tenanted portion is treated asan investment property.Investment properties are valued at fair value. Fair value is assessed on eachreporting date. Changes in value are recognised in the profit and loss account.Each investment property is valued separately by discounting the future netincome stream by the appropriate yield requirement for the investment inquestion. The net income stream takes into account current and future lossof income due to vacancy, essential investment and an estimate of futurechanges in market rent. The yield requirement is determined on the basis ofthe expected future risk-free interest rate plus an individually determined riskpremium dependent on the rental situation and the location and standard ofthe property. Valuation is also compared against observed market prices.66<strong>Annual</strong> <strong>Report</strong> <strong>2007</strong>
When an investment property is first capitalised it is valued at acquisition cost,i.e. the purchase price plus costs directly attributable to the purchase.If an investment property becomes a property used by the group for its ownactivities, the cost price for the property in own use is deemed to be fair valueat the time of reclassification. If a property previously used by the group for itsown activities is rented to external tenants, the property is reclassified as aninvestment property and any difference between book value and fair value atthe time of reclassification is recognised as a valuation change to propertiescarried at written-up value. (See the description for properties held as fixed assets.)Changes in fair value that arise following the reclassification are appliedto profit and loss.Operational leasesLeases in which the majority of the risk is borne by the contractual oppositeparty are classified as operational leases. Operational leases are not included inthe balance sheet.Intangible assetsIntangible assets with limited useable lifetimes are valued at acquisition cost reducedby accumulated depreciation and any write-downs. The depreciation periodand the method of depreciation are reviewed annually. New intangible assets areonly capitalised if it can be demonstrated that it is likely that the group will gainfuture commercial benefit that is directly applicable to the asset in question. Inaddition, it must be possible to estimate the cost price of the asset reliably. Thevalue of an intangible asset is tested for impairment if there are indications of a fallin its value; otherwise intangible assets are subject to write-downs and reversals ofwrite-downs in the same manner described for tangible fixed assets.Intangible assets with unspecified usable lifetimes are not written down, butare tested for impairment annually and at other times if there are indications ofa fall in their value with a consequent need for a write-down.GoodwillExcess value arising from the acquisition of business activities that cannot beallocated to specific asset or liability items at the date of acquisition is classifiedas goodwill in the balance sheet.Goodwill is not amortised, but is tested annually for impairment. If the relevantdiscounted cash flow is lower than the book value, goodwill is written down tofair value. Write-downs of goodwill are never reversed, even if there is informationin future periods that the impairment no longer exists or is of a lesseramount. Gains or losses on the sales of companies in the group include thegoodwill related to the company in question.Pension liabilities for own employees<strong>Storebrand</strong>’s pension scheme for its own employees is a defined benefit pensionscheme. Pension costs and pension liabilities for defined benefit pensionschemes are calculated using a linear accrual of entitlement to pension andexpected final salary, based on assumptions for discount rate, future salaryincreases, pensions and benefits from the national insurance fund, the futurereturn on pension assets and actuarial assumptions on mortality, disability andearly leavers. The discount rate is equivalent to the risk-free interest rate takinginto account the average remaining period for accrual of pension entitlement.The net pension cost for the period is made up of the sum of pension entitlementaccrued in the period, interest cost on the calculated pension liability andthe expected return on pension assets.The effect of differences between assumptions and actual experience (experienceadjustments) and changes in assumptions are applied directly to equity.The effect of changes to the pension scheme are recognised in the profit andloss account as they are incurred, unless the change is conditional on futureaccrual of pension entitlement. In such a case, the effect is amortised linearlyover the time until the entitlement is fully earned. Employer’s social securitycontributions are included in pension liability and in experience adjustmentsshown in equity.<strong>Storebrand</strong> has both insured and uninsured pension arrangements. The insuredscheme in Norway is insured with <strong>Storebrand</strong> Livsforsikring AS (<strong>Storebrand</strong> LifeInsurance), which is a company in the <strong>Storebrand</strong> group. Premiums paid onbehalf of <strong>Storebrand</strong> employees in Norway are eliminated from consolidatedpremium income.TaxThe tax charge in the profit and loss account consists of tax payable for the accountingyear and changes in deferred tax. Deferred tax and deferred tax assetsare calculated on the basis of differences between accounting and tax valuesof assets and liabilities. Deferred tax assets are recorded in the balance sheetto the extent it is considered likely that the companies in the group will havesufficient taxable profit in the future to make use of the tax asset.Provision for dividendPursuant to IAS 10, which deals with events after the balance sheet date, theproposed dividend shall be classified as equity until such time as it is approvedby the general meeting.Accounting for insurance businessThe accounting standard IFRS 4 addresses the accounting treatment of insurancepolicies. The <strong>Storebrand</strong> group’s insurance policies fall within the scopeof the standard. The accounting reserves required in respect of insurancepolicies are the subject of specific Norwegian legislation and are in accordancewith IFRS 4.Life insurancePremium incomeNet premium income comprises premium amounts that fall due during the year,transfers of premium reserve and premiums on reinsurance ceded. Accrual ofpremiums earned is made through allocations to the premium reserve in theinsurance fund.Claims paidClaims for own account comprise claims settlements paid out less reinsurancereceived, premium reserves transferred to other companies, reinsurance cededand changes in claims reserves. Claims not settled or paid out are provided forby allocation to the claims reserve as part of allocations to technical insurancereserves.Transfers of premium reserves, etcTransfers of premium reserves resulting from transfers of policies betweeninsurance companies are booked to profit and loss as premiums for own accountin the case of reserves received and claims for own account in the caseof reserves paid out. The recognition of cost/income takes place at the datethe insured risk is transferred. The premium reserve in the insurance fund isreduced/increased at the same date. The premium reserve transferred includesthe policy’s share in additional statutory reserves, the market value adjustmentreserve and the year’s profit. Transferred additional statutory reserves are notshown as part of premium income but are reported separately as changes ininsurance reserves. Transfer amounts are classified as current assets/liabilitiesuntil such time as the transfer takes place. Interest arising in the time taken tocomplete transfers is recognised as part of the item ‘other insurance relatedincome and expenses’.Profit allocated to insurance policyholdersThe guaranteed yield on the premium reserve and on the premium fund isrecognised in the profit and loss account as part of the item ‘changes in insurancereserves’. Other profit allocated to customers is shown under the item‘funds transferred to policyholders’.Premium reservePremium reserve represents the present value (discounted at a rate equivalent tothe guaranteed interest rate) of the company’s total insurance obligations includingadministration costs in accordance with the individual insurance policies, afterdeducting the present value of future premiums. In the case of individual accountpolicies with flexible premium payments, the total policy value is included in thepremium reserve. The premium reserve is equivalent to 100 per cent of the guaranteedsurrender/transfer value of insurance policies prior to any charges for earlysurrender/transfer and the policies’ share of the market value adjustment reserve.The premium reserve is calculated using the same assumptions as those used tocalculate premiums for individual insurance policies, i.e. assumptions on mortalityand disability rates, interest rates and costs. Premium tariffs are based on theobserved level of mortality and disability in the population with the addition ofsecurity margins that take into account, inter alia, expected future developments inthis respect.<strong>Annual</strong> <strong>Report</strong> <strong>2007</strong>67
Notes <strong>Storebrand</strong> GroupThe premium reserve includes reserve amounts for future administration costs forall lines of insurance including settlement costs (administration reserve). In thecase of paid-up policies, the present value of all future administration costs isprovided in full in the premium reserve. In the case of policies with future premiumpayments, deduction is made for the proportion of future administration costsexpected to be financed by future premium receipts.Additional statutory reservesThe company is permitted to make additional statutory allocations to theinsurance fund in order to ensure the solidity of its life insurance business.The maximum additional statutory reserve is set at the difference between thepremium reserve calculated on the basis of a 3.5 per cent guaranteed return onpolicies outstanding, and the premium reserve calculated on the basis of theactual guaranteed return in the policies. Kredittilsynet (the Financial SupervisoryAuthority of Norway) has specified a limit for the additional statutory reservesthat apply to each policy defined as the premium reserve for the policy multipliedby twice the basic interest rate for the policy.The company is permitted to apply a higher multiple of the basic interest ratethan that defined by Kredittilsynet. The allocation to additional statutory reservesis a conditional allocation to policyholders that is recognised in the profitand loss account as a statutory reserve and accordingly reduces net profit.Additional statutory reserves can be used to meet a shortfall in the guaranteedreturn. This is shown in the profit and loss account after the technical (insurance)result as amounts released from additional statutory reserves to meetthe shortfall in guaranteed return. The amount released cannot exceed theequivalent of one year’s interest rate guarantee.Premium fundThe premium fund contains premiums prepaid by policyholders as a result oftaxation regulations for individual and group pension insurance and allocatedprofit share. Credits and withdrawals are not booked through the profit and lossaccount but are taken directly to the balance sheet.Pensioners’ surplus fundThe pensioners’ surplus fund contains surplus premium reserve amounts allocatedin respect of pensions in payment that are part of group pension policies.The fund is applied each year as a single premium payment to secure additionalbenefits for pensioners.Claims reserveAmounts reserved for claims either not yet reported or not yet settled (IBNRand RBNS). The reserve only covers amounts which might have been paid in theaccounting year had the claim been settled.Security reserveThe security reserve is a statutory reserve to cover unexpected insurancerisks. The calculations are made by an actuary in accordance with regulationspublished by Kredittilsynet. It is possible to increase the reserve by 50 per centabove the minimum allocation. In special situations Kredittilsynet may permit allor part of the reserve be used to cover a fall in the value of bonds or of sharesclassified as current assets. In the accounts the entire reserve is shown as amandatory reserve.Sales costsSales costs in the Norwegian life insurance business are recognised as costs,while in the Swedish subsidiaries sales costs are recognised in the balancesheet. Pursuant to IFRS 4 non-uniform accounting principles can be used forinsurance policies in subsidiaries.Unit Linked/defined contribution pensionsFinancial assets are valued at market value. The level of technical reservesrequired in respect of such policies is determined by the market value of thefinancial assets. Unit Linked products are not exposed to any investment riskon customers’ funds since they do not guarantee any minimum return. The soleexception is in the event of death, when the deceased’s estate is entitled to arefund of premiums paid for annuity insurance.Sufficiency testIn accordance with IFRS 4 <strong>Storebrand</strong> Life Insurance has carried out a sufficiencytest to ensure that the level of premium reserves is sufficient relative toinsurance liabilities to customers.SPPLife insurance reserves:The life insurance reserve consists of the current value of the company'sguaranteed liabilities. The majority (approx. 95 per cent) of the company's liabilitiesrelate to occupational pensions. Cautious estimates must be used whencalculating occupational pensions, which entails, among other things, the useof risk free market interest rates as discounting rates. Other assumptions arediscounted at the highest interest rate set by Finansinspektionen (the SwedishFinancial Supervisory Authority).The life insurance reserve is calculated for each policy evaluated at the relevantrisk free interest rate. The estimated assumptions concerning tax on returns,expenses, mortality and other risk elements affect the value of the life insurancereserve.The guaranteed interest rate and the other assumptions are agreed when thepolicy is signed. In its insurance portfolio the company has interest guaranteesthat vary between 2.25 per cent and 5.2 per cent. The dominant interest guaranteesin the portfolio are those with 3.5 per cent, 3.0 per cent and 5.2 percent guarantees. These are responsible for 47 per cent, 23 per cent and 19 percent respectively of the total portfolio.Assumptions concerning expenses are product specific and largely reflect thepercentage-wise expenses that are extracted. The assumptions concerning taxvary on the basis of when the policy was signed and are based on the tax ratethat applied at the time. Assumptions concerning tax and expenses reduce theadded guaranteed interest.Death risk:Assumptions concerning mortality vary depending on the various policies thatare signed. The assumptions that are used as the basis are based on generalsector statistics. The assumptions that were used until 1990 are used for themajority of the portfolio. During the year, the sector issued new general mortalitystatistics, the so-called ‹DUS 06›. SPP expects to be able to start using DUS06 in its calculations during the course of 2009 or 2010.Reserves for unfixed insurance instances:The reserves for claims that have been incurred consist of reserves for disabilitypensions, established claims, unestablished claims and claims processingreserves. When assessing the reserves for disability pensions a risk free marketinterest rate is used, which takes into account future index adjustment of thepayments. Unestablished insurance instances are insurance instances that havenot been reported yet, but which, using statistical methods, are calculated tohave been incurred (IBNR). The claims processing reserve is the calculated operatingcosts that the company incurs to adjust the unadjusted claims.Conditional Bonus reservesConditional bonus reserves represent that part of the insurance capital which isnot subject to guarantees. Included in this is capital set aside by the companyas reserves to secure future guarantees.Property and casualty insuranceInsurance premiums are recognised as income in pace with the period of insurance.Costs are recognised when they are incurred.The company maintains the following reserves:Reserve for unearned premium for own account concerns ongoing policies thatare in force at the time the accounts were closed.The claims reserve is a reserve for expected claims that have been notified butnot settled. The reserve also covers expected claims for losses that have beenincurred, but have not been reported at the expiry of the accounting period.The reserve includes the full amount of claims reported but not completed. Acalculated provision is made in the reserve for claims incurred but not reported(IBNR) and claims reported but not settled (RBNS).The insurance companies in the group are subject to their own specific legalrequirements for technical insurance reserves, including administration reserves,security reserves, and guarantee reserves. In <strong>Storebrand</strong>'s consolidatedaccounts, which are prepared in accordance with IFRS, security reserves withhigh security margin natural disaster fund, administration reserve and guaranteereserves are not treated as liabilities.68<strong>Annual</strong> <strong>Report</strong> <strong>2007</strong>
Financial instrumentsGeneral principles and definitionsRecognition and derecognitionFinancial assets and liabilities are included in the balance sheet from such timeas <strong>Storebrand</strong> becomes party to the instrument’s contractual terms and conditions.Normal purchases and sales of financial instruments are booked on thetransaction date. When a financial asset or a financial liability is first recognisedin the accounts, it is valued at fair value. First time recognition includes transactioncosts directly related to the acquisition or issue of the financial assetor the financial liability if it is not a financial asset or a financial liability at fairvalue in the profit and loss account.Financial assets are derecognised when the contractual right to the cash flowfrom the financial asset expires, or when the company transfers the financialasset to another party in a transaction by which all, or virtually all, the risk andreward associated with ownership of the asset is transferred.Definition of amortised costSubsequent to inception, hold to maturity financial assets, loans and receivablesas well as financial liabilities not at fair value in the profit and lossaccount, are valued at amortised cost using the effective interest method. Thecalculation of the effective interest rate involves estimating all cash flows andall contractual terms of the financial instruments (for example early repayment,call options and equivalent options). The calculation includes all fees and marginspaid or received between the parties to the contract that are an integralpart of the effective interest rate, transaction costs and all other premiums ordiscounts.Definition of fair valueFair value is the amount for which an asset could be exchanged, or a liabilitysettled, between knowledgeable, independent parties in an arm’s lengthtransaction. For financial assets that are listed on a stock exchange or anotherregulated market place, fair value is determined as the bid price on the lasttrading day up to and including the balance sheet date, and in the case of anasset that is to be acquired or a liability that is held, the offer price.If a market for a financial instrument is not active, fair value is determined byusing valuation techniques. Such valuation techniques make use of recent arm’slength market transactions between knowledgeable and independent partieswhere available, reference to the current fair value of another instrument thatis substantially the same, discounted cash flow analysis, and options pricingmodels. If a valuation technique is in common use by participants in the marketand this method has proved to provide reliable estimates of prices actuallyachieved in market transactions, this method is used.The fair value of loans, which is recognised at amortised cost, is estimated onthe basis of the current market rate of interest on similar lending. Write-downsof loans are taken into account both in the amortised cost and when estimatingfair value. When estimating the fair value of a loan, consideration is also givento the development of the associated credit risk in general.Impairment of financial assetsIn the case of financial assets that are not recognised at fair value, considerationis given on each balance sheet date to whether there are objective signsthat the value of a financial asset or a group of financial assets is impaired.If there is objective evidence that impairment has occurred, the amount of theloss is measured as the difference between the asset’s book value and thepresent value of estimated cash flows (excluding future credit losses that havenot occurred) discounted at the financial asset’s original effective interest rate(i.e. the effective interest rate calculated at the time of inception). The bookvalue of the asset is reduced either directly or by using a provision account. Theamount of the loss is recognised in the profit and loss account.Losses that are expected to occur as a result of future events are not includedin the accounts; regardless of how likely it is that the loss will occur.Classification and measurement of financial assets and liabilitiesFinancial assets are classified into one of the following categories:• available for sale• at fair value through profit or loss in accordance with the fair value option(FVO)• hold to maturity investments• loans and receivablesAvailable for saleA financial asset is classified as available for sale if it is:– acquired or incurred principally for the purpose of selling or repurchasing itin the near term, is part of a portfolio of identified financial instruments thatare managed together and for which there is evidence of a recent actualpattern of short-term profit-taking,or– it is a derivative except for a derivative that is a designated as an effectivehedging instrument.With the exception of derivatives, only a limited proportion of <strong>Storebrand</strong>’sfinancial assets fall into this category.Available for sale financial assets are measured at fair value on the balancesheet date. Changes in fair value are recognised in the profit and loss account.At fair value in the profit and loss account in accordance with the fair valueoptionUpon first recognition, any financial asset or liability can be classified at fairvalue in the profit and loss account if it is the case that:– such classification reduces a mismatch that would otherwise have occurredin measurement or recognition as a result of different rules for measurementof assets and liabilities- the financial assets form part of a portfolio that is managed and reported ona fair value basisA significant proportion of <strong>Storebrand</strong>’s holdings of financial instruments fallinto this category.The accounting treatment is equivalent to that for available for sale assets.Hold to maturity investmentsHold to maturity investments are non-derivative financial assets with fixed ordeterminable payments and fixed maturity that the company has the intentionand ability to hold to maturity, with the exclusion of:– assets that are designated at inception as assets at fair value in the profitand loss account– assets that are defined as loans and receivables.Hold to maturity investments are valued at amortised cost, using the effectiveinterest method. All investments in this category are owned by <strong>Storebrand</strong> LifeInsurance.Loans and receivablesLoans and receivables are non-derivative financial assets with fixed or determinablepayments that are not quoted in an active market, with the exception ofsuch assets that the company intends to sell immediately or in the short termthat are classified as available for sale and such assets that the company designatesat inception as assets at fair value in the profit and loss account.Loans and receivables are valued at amortised cost using the effective interestmethod. Assets in this category relate principally to loans made by <strong>Storebrand</strong>Bank.Loans and receivables that are designated as hedged items are subject to measurementin accordance with the requirements of hedge accounting.Stock lendingA stock loan involves a transfer of shares from <strong>Storebrand</strong> to a borrower in returnfor the borrower pledging security in the form of cash or securities. At thematurity of the stock loan, the identical securities are returned to <strong>Storebrand</strong>.The borrower is required to compensate the lender for various events relatedto the shares lent, such as distributions of subscription rights, dividends etc.The borrower is entitled to exercise the voting rights of the shares during theperiod of the stock loan. Shares lent by <strong>Storebrand</strong> are not removed from the<strong>Storebrand</strong> balance sheet, and fees earned on stock lending are recognisedto income as they are received. Reinvested collateral is recognised at its grossvalue in the balance sheet under the individual asset.DerivativesDerivatives are defined as follows:A derivative is a financial instrument or other contract within the scope of IAS39 with all three of the following characteristics:– its value changes in response to the change in a specified interest rate,financial instrument price, commodity price, foreign exchange rate, index of<strong>Annual</strong> <strong>Report</strong> <strong>2007</strong>69
Notes <strong>Storebrand</strong> Groupprices or rates, credit rating or credit index, or other variable (sometimescalled the ‘underlying’)– it requires no initial net investment or an initial net investment that issmaller than would be required for other types of contracts that would beexpected to have a similar response to changes in market factors– it will be settled at a future dateAccounting treatment of derivatives that are not hedgingDerivatives that do not meet the criteria for hedge accounting are treated asavailable for sale financial instruments. The fair value of such derivatives is classifiedas either an asset or a liability with changes in fair value in the profit andloss account.The major part of derivatives used routinely for asset management fall into thiscategory.Accounting treatment of derivatives for hedgingFair value hedging<strong>Storebrand</strong> uses fair value hedging, where the items hedged are financial assetsand financial liabilities measured at amortised cost. Derivatives that fall withinthis category are recognised at fair value in the profit and loss account, whilechanges in the value of the hedged item that relate to the risk hedged areapplied to the book value of the item and are recognised in the profit and lossaccount.Hedge accounting is principally used for interest rate hedging of fixed ratefunding and lending carried out by <strong>Storebrand</strong> Bank. In view of the unified principlesfor measuring hedged items and hedging instruments in the other partsof the group, this hedging reflects the group’s ordinary valuation rules.Cash flow hedgingChanges in the fair value of a derivate earmarked as a hedging instrument incash flow hedging are included directly in equity to the extent the hedging iseffective. Otherwise the change in fair value is recognised in the profit and lossaccount.Once the hedging instrument no longer fulfils the criteria for hedge accounting,expires or is sold, is ended or is exercised, the hedge accounting ceases. Accumulatedgains or losses that are included in equity are kept there until theplanned transaction takes place. If the hedging object is a non-financial assetor liability, earlier losses/gains are included in the equity transferred to thevalue recognised in the balance sheet for the asset or liability. In other casesthe amount that is included in the equity is transferred to the profit and lossaccount during the same period in which the hedging object affects the result.<strong>Storebrand</strong> has chosen to use hedge accounting for cash flow during the period11 December <strong>2007</strong> and 20 December <strong>2007</strong> for the purchases of the shares inSPP.Hedging of net investmentsHedging of net investments in foreign businesses is recognised in the accountsin the same was as cash flow hedging. Gains and losses with respect to thehedging instrument that relates to the effective part of the hedging is recogniseddirectly against equity, while gains and losses that relate to the ineffectivepart are recognised in the accounts in the profit and loss account immediately.<strong>Storebrand</strong> utilises the rules concerning the hedging of net investments concerningequity investments in <strong>Storebrand</strong> Holding AB.Market value adjustment reserveNet unrealised gains/losses for the current year on financial assets at fair valueare applied to the market value adjustment reserve in the balance sheet andare therefore not included in the profit for the year. If the total portfolio offinancial current assets shows a cumulative unrealised loss, this loss is chargedto the profit and loss account. If specific financial current assets are consideredto have suffered a permanent loss in value, the change in value of the financialasset in question is charged to profit and loss. The market value adjustmentreserve applies only to <strong>Storebrand</strong> Life Insurance. In accordance with the accountingstandard for insurance policies (IFRS 4) the market value adjustmentreserve is shown as a liability.Net unrealised gains/losses for the current year on financial current assetsdenominated in foreign currencies that can be attributed to movements in exchangerates are not transferred to the market value adjustment reserve if theinvestment is hedged against currency movements. Similarly, the change in thevalue of the hedging instrument is not transferred to the market value adjustmentreserve, but is charged directly to profit and loss. The foreign exchangerisk associated with investments denominated in foreign currencies is to a verylarge extent hedged through foreign exchange contracts on a portfolio basis.Financial liabilitiesSubsequent to inception, all financial liabilities are measured at amortised costusing the effective interest method.Structured products<strong>Storebrand</strong> Bank has issued equity index linked bonds. These products principallycomprise the issue of a bond and the sale of an equity index option. Atthe time of issue, the equity index option is measured at fair value since theoption is a derivative that is not closely related to the bond issue. The bondsissued are simultaneously measured at amortised cost. No gain is recognised inrespect of structured gains at the time of issue (‹day 1 gains›).Commercial paper/BondsThe accounting treatment applied is the same as for structured products.Interest income and interest expense bankingInterest income and interest expense are charged to profit and loss at amortisedcost using the effective interest method. The effective interest methodincludes set-up charges.Income recognition for asset management activitiesAsset management fees and performance fees are recognised when the incomecan be measured reliably and it is likely that <strong>Storebrand</strong> Kapitalforvaltning ASwill receive the commercial benefit arising from the transaction. In accordancewith the contractual agreements for performance fees, performance fees arerecognised to income at year-end.Commissions paid to distributors of securities funds are reported in the profitand loss account as a reduction in management fees and sales commission.The total loss or gain in equity is recognised in the profit and loss accountwhen the foreign business is sold or run-off.70<strong>Annual</strong> <strong>Report</strong> <strong>2007</strong>
01 Important accounting estimates and judgementsEstimates and judgements are continually evaluated on the basis of historical experience and anticipated future events. In the future, actual experiencemay deviate from these accounting estimates, but the estimates are based on best judgement at the time the accounts are produced. The estimates andassumptions that have a significant risk of causing a material adjustment to the balance sheet values of assets and liabilities are discussed below.Investment propertiesInvestment properties are valued on the basis of a long-term yield requirement specific to the property in question. Market yield requirements wereobtained from two external market actors in Q4 <strong>2007</strong>. The overall return is made up of the direct yield earned and increases in value. A small change inthe yield requirement has a relatively large effect on the calculated value. Every property has been valued individually using internal calculation models asper 31 December <strong>2007</strong>. In the work on valuations we refer to Investment Property Databank LTD, which produces statistical information that covers realestate worth over NOK 70 billion in Norway. These statistics thus provide a very good basis for the valuation of the property portfolio.Fixed assetsGoodwill is tested annually for impairment. Consolidated goodwill subject to impairment testing relates almost exclusively to the banking activities, wheregoodwill had a book value of NOK 422 million at 31 December <strong>2007</strong>. The recoverable amount is calculated as the net discounted present value of futurecash flows based on the group's rolling planning process as approved by the Board of Directors, which covers a future period of 3 years. In addition, thecalculations take into account estimated cash flows in years 4-9 based on annual growth rates varying between 2.5 per cent and 3 per cent. A 10 percent discount rate is applied, and the calculation assumes that no tax will be payable before 2010. The goodwill from the acquisition of SPP, which in aninterim acquisition analysis amounts to NOK 887 million, had not been tested for impairments as per 31 December <strong>2007</strong>.Following the acquisition of SPP, a provisional purchase analysis has been performed, which is used as a basis for the accounts. Immaterial assets havebeen acquired in the form of brands customers lists, etc. Intangible assets were acquired with the acquisition of SPP in the form of brand names, customerlists, etc, as well as added value with respect to insurance policies (“value of business in force”). The added value with respect to insurance policies(value of business in force), which amounted to NOK 7.7 billion, will, based on the expected duration of the insurance policies, be amortised over 20years. The value of this intangible item will be assessed in connection with the pertinent insurance policies with respect to whether the total values aresufficient to meet the pertinent insurance liabilities, cf. the sufficiency test for insurance liabilities in IFRS 4.Fixed assets and intangible assets, of which intangible assets mainly relate to customised software developed in-house, are reviewed annually to ensurethat the depreciation period and method of depreciation used correspond with commercial reality for the asset in question. This also applies to thedisposal value. The value of an asset is written down if there are indications of a fall in its value. The future commercial life of the various intangible assetswas tested in <strong>2007</strong>, and some changes were made. Properties used for the group’s own activities are valued at written-up value less accumulateddepreciation and write-downs. The fair value of these properties is tested annually in the same way as described for investment properties. See note 9.Fair value of financial instrumentsThe fair value of financial instruments that are not traded in an active market (for example unlisted derivatives, shares and bonds) is determined byusing valuation techniques. There will be some uncertainty about whether the value used reflects the best estimate of fair value vis-à-vis all securitiesthat are valued on the basis of sources other than observable market prices. This uncertainty is normally very limited for the majority of the securities inwhich <strong>Storebrand</strong> invests. For parts of the securitised bonds there is more uncertainty associated with the establishment of the fair value than for otherfinancial instruments in which fair value is established with the help of valuation methods. <strong>Storebrand</strong> utilises prices from external price suppliers or pricesdirectly from the investment banks in those cases the price suppliers do not supply prices when valuing securitised bonds. For that part of the securitisedbonds that lie in international bonds, valuations are also obtained from managers.Financial assets – impairmentIn the case of financial assets that are not recognised at fair value, consideration is given on each balance sheet date as to whether there are objectivesigns that the value of a financial asset or a group of financial assets is impaired.<strong>Storebrand</strong> Bank makes use of both individual loan write-downs and write-downs of groups of loans. Grouped write-downs are calculated separately forcorporate lending and retail lending. In the case of corporate lending, the objective criteria for determining write-down amounts are judged to be closelycorrelated with changes in the risk classification of lending relationships. This classification takes the form of three scores in respect of the borrower'sdebt service capacity, the loan to value ratio and commercial risk factors. In the case of retail lending, the objective criteria for determining write-downamounts are judged to be closely correlated with default status and the historic payment record. Default status for loans not subject to individual writedownsis divided into 30-90 days and over 90 days. The payment record is updated quarterly in line with the overall performance of the portfolio. Seealso notes 20 and 34.Technical insurance reserves:Life insurance: The major areas of risk and uncertainty in life insurance are associated with the incidence of death and disability. Most lines of life insuranceinclude cover for disability through either disability pensions, exemptions from premiums or lump sum disability payments. Pension insurance providescover for the surviving partner of the assured, with payments starting in the event of the death of the assured. Changes to the rules for paymentfrom the national social security scheme for disability benefits, etc may have a significant effect on insurance companies in terms of the number of claimsfor disability and disability reserves. In terms of death benefits, increasing life expectancy will affect future expected payments and reserves, althoughreserves are currently considered to be sufficient.The company's premium tariffs do not include any assumptions on inflation or voluntary termination/transfers. In 2008, new premium and reserves tariffsare being introduced that take account of the increased life expectancy among insured parties that has been observed in recent years. The completeconversion has not been carried out yet, and the effect of the tariff change therefore cannot be quantified accurately, but on the basis of interim calculationsthe premium reserves were strengthened by NOK 3.3 billion as per 31 December <strong>2007</strong>. The company also manages its exposure to insurance riskthrough its reinsurance program. A significant proportion of the company's insurance liabilities are subject to an annual interest guarantee. If the companyproduces a return lower than the guaranteed interest rate, up to one year's guaranteed interest can be met out of additional statutory reserves. Thecompany maintains additional statutory reserves in excess of one year's guaranteed interest.<strong>Annual</strong> <strong>Report</strong> <strong>2007</strong>71
Notes <strong>Storebrand</strong> GroupP&C insurance: The main risk for the newly established P&C business is that it will initially have a small portfolio with which to absorb claims. This canmean that large, single claims may have a disproportionate impact on profit. In order to offset this risk, <strong>Storebrand</strong> has arranged reinsurance. The commercialoperations of Oslo Reinsurance Company are concentrated on the run-off of its existing reinsurance portfolios, either by paying claims that arereported to the company or by seeking to extricate itself from policies by negotiating a settlement amount with the insured party (cedent) by commutingthe cover. Most will be run-off during the course of 2008. For further information on insurance risk, see note 38.PensionsThe discounted current value of pension liabilities depends on the economic and demographic assumptions used in the calculation. The assumptions usedmust be realistic, mutually consistent and kept up to date in that they should be based on uniform expectations of future economic conditions.The applied discount rate represents a major assumption for the calculation of pension liabilities. Norwegian insurance companies must base their calculationof discount rate on the return on Norwegian government bonds. With the exception of pensioners of the holding company <strong>Storebrand</strong> ASA, thepayment horizon for pensions paid by <strong>Storebrand</strong> is estimated to be around 25 years, and there are no Norwegian government bonds with such a longmaturity. The fixing of the discount rate and the other financial and demographic assumptions as per 31 December <strong>2007</strong> was based on the guidelinesissued by the Norwegian Accounting Standards Board (NASB). The fixed discount rate of 4.70 per cent is almost equal to the bond yield for 10-yeargovernment bonds.The calculation of pension liabilities as per 31 December <strong>2007</strong> was carried out by an actuary. The calculation includes 1,551 active members and 2,231pensioners. Risk table K2005 has been used.<strong>Storebrand</strong> changed its accounting principles for the accounting recognition of actuarial gains and losses (experience adjustments) in 2006, and suchadjustments are now applied directly to equity. Prior to this change, experience adjustments were amortised over the average remaining period for accrualof pensions entitlement to the extent that the effect exceeded 10 per cent of the higher of either pension liability or pension assets. For further information,see note 11.Deferred taxA number of companies in the group, including <strong>Storebrand</strong> Livsforsikring AS, have sizeable tax losses carried forward. In order to capitalise the tax assetassociated with tax losses carried forward, it is necessary to establish that the company in question will have taxable profits in the future. In a normalyear, companies in the group such as <strong>Storebrand</strong> Livsforsikring AS will have significant tax-free income arising from holdings of shares within the EEA area,and this income does not increase taxable profit. A number of companies in the group have therefore decided to write-down their deferred tax assets.See also note 7.Earn-out in the event of acquisitionsIn some cases the acquisition of companies involves some agreed deferred settlement in the form of earn-out. In line with IFRS the discount rate shouldbe added to the acquisition cost of the investment. The discounted earn-out thus affects the magnitude of the extra/shortfall in market value thatis allocated. The calculated earn-out is normally based on estimates associated with future results in the business being acquired. If the estimate ischanged, this will affect the acquisition cost and thus also the extra/shortfall in market value used as the basis. A discount factor of 12–15 per cent perannum before tax is used as the basis for discounting for the <strong>2007</strong> accounting year.02 Acquisition of new businessOn 3 September <strong>2007</strong>, an agreement was signed between <strong>Storebrand</strong> Livsforsikring AS and Handelsbanken (Sweden) concerning the acquisition of SPPLivförsäkring AB, its subsidiaries, and some other companies directly owned by Handelsbanken. The purchase sum amounted to SEK 16.2 billion in total,while transactions costs of SEK 265 million were activated as part of the cost price of the shares. The purchase sum amounted to NOK 13.8 billion. Thetransaction was concluded on 21 December <strong>2007</strong>. Since no significant effects arose during the period up to 31 December <strong>2007</strong>, SPP was from an accountingpoint of view consolidated on the basis of its equity as per 31 December <strong>2007</strong>. The acquisition therefore had no effect of the profit in <strong>2007</strong>.<strong>Storebrand</strong> Holding AB, which is a wholly owned subsidiary of <strong>Storebrand</strong> Livsforsikring AS, was established in connection with the purchase of the sharesin SPP. The shares in SPP were purchased by <strong>Storebrand</strong> Holding AB. <strong>Storebrand</strong> Holding AB was financed with SEK 8.265 billion in equity and a SEK 8.2billion subordinated loan from <strong>Storebrand</strong> Livsforsikring AS. The investment was financed by <strong>Storebrand</strong> ASA conducting a pre-emption rights issue worthNOK 9 billion. In addition, <strong>Storebrand</strong> ASA raised a bridging loan of EUR 580 million, due for repayment in September 2008.An interim acquisition analysis has been conducted, which is used as a basis for the annual accounts as per 31 December <strong>2007</strong> and is presented below.An estimated market value of the acquired insurance contracts was used in the identification of the extra value that was significantly lower than the bookvalue. The difference between the book value and the market value represents the value of the existing portfolio (called the “value of business-in-force”or “VIF”). This value represents around NOK 7.7 billion and is recognised in the balance sheet as an intangible asset. Based on the expected duration ofthe insurance contracts this item will provisionally be amortised over a period of 20 years. This intangible value will be assessed in connection with therelevant insurance contracts with respect to whether the total value is sufficient to meet the relevant insurance liabilities, cf. the sufficiency test in IFRS 4insurance contracts.The intangible assets acquired in addition to VIF represent goodwill totalling NOK 900 million, as well as other intangible assets of NOK 1 billion in theform of brand names, customer lists, etc. Goodwill is not amortised. Instead it is subjected to regular testing for impairment. In the case of other intangibleassets, the amortisation period is calculated by referring to future earnings and linear amortisation of around 10 years has been used. Intangible assetsare included at their gross value with deferred tax. Changes can be expected in the acquisition analysis in 2008, as the work on identifying positive/negative adjustments to values was not completed at the time the annual accounts were finalised.72<strong>Annual</strong> <strong>Report</strong> <strong>2007</strong>
Interim acquisition analysisNOK millionTransaction valuesentered in thebalance sheetTotal fair valueAdjustments tofair valueIntangible assets 1 706.7 8 704.5 7 997.8Financial assets 119 967.5 119 967.5Other assets 9 350.6 9 350.6Total assets 130 024.8 138 022.6 7 997.8Technical insurance reserves 1 -109 522.9 -109 522.9Deferred tax liability -566.2 -566.2Long-term liabilities -1 344.2 -1 569.1 -224.9Current liabilities -13 418.6 -13 418.6Net assets 5 739.1 12 945.8 7 206.7Goodwill 886.5 886.5Net assets 5 739.1Purchase sum 13 832.31In the acquisition analysis VIF is classified as intangible assetsThe purchase sum was paid in cashProforma profit and loss account <strong>2007</strong> for <strong>Storebrand</strong> including SPPA proforma profit and loss account has been prepared below in connection with <strong>Storebrand</strong>’s acquisition of SPP, including subsidiaries as well as otherunits included in the acquisition of SPP.The proforma profit and loss account was prepared to show what the result could have been if the acquisition had actually taken place as per 1 January<strong>2007</strong>. Proforma information is not necessarily indicative of future results. Proforma information describes a hypothetical situation and does not describethe <strong>Storebrand</strong> group’s actual financial position or the actual merger of activities that has taken place. The proforma information is also based on severaluncertain estimates and assumptions. The proforma information is based on a simplified statement of the results in <strong>Storebrand</strong> and SPP for the period1 January <strong>2007</strong> up to 31 December <strong>2007</strong>.<strong>Storebrand</strong>’s accounting principles pursuant to IFRS have been used in the preparation of the proforma profit. Known significant differences between IFRSand other accounting principles have been adjusted in the preparation of the proforma profit.NOK million<strong>Storebrand</strong>groupSPPProformaadjustmentsNote referenceProformaexpanded groupInterest result 7 887 214 -437 2 7 663Risk result 244 188 432Administration result -669 72 -597Other -3 030 10 3 -3 020Amortisation of intangible assets (VIF, etc) -500 4 -500Inflow of assets to insurance customers within life insurance -2 797 -309 -3 106Total life insurance activities 1 635 164 -927 872Banking activities 235 235Asset management activities 138 206 5 344Other activities 12 12Group profit/loss 2 020 164 -721 1 463Changes in security reserve etc. – non-life 9 9Pre-tax profit 2 029 164 -721 1 472Tax -20 37 158 6 176Profit/loss 2 009 201 -563 1 1 648More information about proforma, assumptions and adjustments:1. An average conversion rate for converting from Swedish SEK to Norwegian NOK of 0.8667 was used, based on exchange rates from Norges Bank.2. The interest result includes interest costs associated with the external loan financing of the acquisition in which the loan in the calculations amountsto NOK 4,618 million (hybrid loan capital and other subordinated loan capital). The estimated interest costs amount to NOK 321 million and are basedon interest rates of around 6.8 per cent to around 7.1 per cent. The estimated reduced financial income associated with the use of NOK 390 millionof own funds amounts to NOK 35 million, in which the return interest rate is calculated at around 8.9 per cent. The amount also includes a calculatedreduced return of NOK 67 million (3.85 per cent) for the entire year, related to the fact that SPP took out SEK 2 billion prior to the acquisition takingplace. Moreover, an estimated reduced return of NOK 15 million is included in <strong>Storebrand</strong> associated with the financing of the share issue costs.<strong>Annual</strong> <strong>Report</strong> <strong>2007</strong>73
Notes <strong>Storebrand</strong> Group3. The item Other also includes a write-back of individual amortisation costs in SPP, as well as increased costs associated with VAT based on interimestimates.4. The item Amortisation of intangible assets includes the amortisation of extra value associated with the acquired insurance contracts (“value ofbusiness in force” -VIF) of around NOK 398 million, which corresponds to linear amortisation over 20 years. It also includes the amortisation of otherintangible assets of around NOK 102 million, which corresponds to a liner amortisation period over 10 years. These amortisation costs are based on anentirely interim acquisition analysis.5. The item Asset management activities includes interim estimated increased net income associated with the asset management activities of aroundNOK 206 million. <strong>Storebrand</strong> will take over the management of assets one year after the take-over.6. <strong>Storebrand</strong> Holding AB was financed with both equity and a subordinated loan of SEK 8.2 billion. A reduced tax cost of net NOK 158 million has beenestimated for the <strong>Storebrand</strong> group for <strong>2007</strong>. The reduced tax costs will be affected by the interest costs, organisation of the asset managementactivities, and the amortisation of intangible assets, etc. This is an interim calculation.7. It is assumed that the currency exposure associated with the investment in SPP and issued loans was hedged using relevant derivatives. It is assumedthat hedge accounting was used.8. One-time effects associated with the separation of IT systems and investments in IT are expected. The above profit does not include such costs,including estimations of the amounts associated with the amortisation of such IT investments and synergy effects.9. It is assumed that no effects associated with the results from SPP or items associated with the acquisition and financing have affected the lifeinsurance customers’ profits (including the market value adjustment reserve) in <strong>Storebrand</strong> Livsforsikring AS.Aqusition of Hadrian Eiendom<strong>Storebrand</strong> Bank ASA has purchased 90.9% of the shares in Hadrian Eiendom AS, a commercial real estate broker and advisor. The purchase price for theshares was NOK 46.9 million.03 Segment reportingLife insuranceProducts with profit sharing Products without profit sharing BankingNOK million <strong>2007</strong> 2006 2005 <strong>2007</strong> 2006 2005 <strong>2007</strong> 2006 2005Revenue from external customers 28 147 29 536 27 885 4 183 3 655 2 724 513 495 540Revenue from other group companies 1 125 117 88 4 2 1Group profit 1 508 1 109 1 065 127 89 164 235 190 241Assets 285 931 172 204 157 330 48 893 10 635 8 104 41 887 34 156 29 430Liabilities 272 371 166 490 151 840 46 440 10 247 7 792 39 848 32 496 27 683Asset management Other/eliminations GroupNOK million <strong>2007</strong> 2006 2005 <strong>2007</strong> 2006 2005 <strong>2007</strong> 2006 2005Revenue from external customers 332 246 169 223 143 406 33 397 34 075 31 724Revenue from other group companies 1 69 196 93 -198 -316 -182Group profit 138 156 24 11 41 -41 2 020 1 585 1 453Assets 451 458 296 4 587 5 305 6 718 381 749 222 758 201 878Liabilities 251 234 140 3 599 4 393 5 315 362 508 213 859 192 770Geographic segmentNorway Sweden Other countriesNOK million <strong>2007</strong> 2006 2005 <strong>2007</strong> 2006 2005 <strong>2007</strong> 2006 2005Revenue from external customers 33 221 33 977 31 645 175 96 78 2 2 1Revenue from other group companies 1Group profit 2 071 1 584 1 456 -52 -4 1 1 1Assets 236 040 222 711 201 835 138 982 45 41 6 727 2 3Liabilities 223 885 213 854 192 760 132 160 5 8 6 463 1 21 Revenue from other group companies<strong>Storebrand</strong> Investments manages financial assets for other group companies. Asset management fees are made up of a fixed management fee and a performance-related fee.Performance-related fees apply to the portfolios qualifying for such fees at any given time.<strong>Storebrand</strong> Life Insurance earns revenue from other group companies for sales and management of products. These services are priced on commercial terms.Life insuranceRevenue from external customers includes total premium income, including savings premiums and transfers of premium reserves from other companies,net investment return and other income.74<strong>Annual</strong> <strong>Report</strong> <strong>2007</strong>
Products with profit sharingProducts with profit sharing include individual endowment insurance with a savings element, personal pension insurance and group pension insurance,including paid up policies.Products without profit sharingThis segment comprises defined contribution pensions and related risk cover, individual insurance with investment choice, and annually renewableproducts including group life insurance, health insurance, child insurance, industrial injuries and others.BankingThe banking business includes the following areas:Corporate: The segment contains loans to and deposits from corporate customers of <strong>Storebrand</strong> Bank principally relating to business property developersand property investors. The associated company Seilduksgagten 25/31 AS is included in the Corporate segment. The bank’s interest is 50% and the lossfor <strong>2007</strong> was NOK 0.5 million.Retail: Deposits from and loans to retail customers, including credit cards. Lending is principally residential mortgage lending.The bank›s interest in Evoco Financial Production UAB in Lithuania amounts to 50%, and is included in the Retail segment. The ownership interest isbooked as a jointly controlled business. The loss for <strong>2007</strong> amounted to NOK 0.2 million.Markets: This is a new business area from and including Q3 <strong>2007</strong> and will also include newly started business in line with the bank›s licences pursuantto the Securities Trading Act. The area also contain all structured products, real estate investment funds and the savings product <strong>Storebrand</strong> Optimér,which were previously reported under the Savings segment, and the stockbrokering business, which was previously a separate segment. The area alsoincludes Hadrian Eiendom AS in which the bank had 90.9% interest at the end of <strong>2007</strong>.Real estate broking: This segment solely comprises Ring Eiendomsmegling AS, in which the bank had a 70% interest at the close of <strong>2007</strong>.Asset managementAsset management company. Manages assets in mutual securities funds and client portfolios for insurance companies, pension funds, municipalities,institutional investors and retail customers.Other/eliminationsPrincipally comprises the holding company <strong>Storebrand</strong> ASA and <strong>Storebrand</strong> Skadeforsikring. <strong>Storebrand</strong> started selling P&C insurance products in the retailmarket in 2006. This completes the group›s product range, and strengthens its business in the retail market.Geographic segmentThe business in Sweden is principally life insurance.Key figuresNOK million <strong>2007</strong> 2006 2005GroupEarnings per ordinary share (NOK) 7.95 6.03 5.41Equity 19 241 8 900 9 108Capital adequacy 9.2% 10.6% 11.2%<strong>Storebrand</strong> Life Insurance 1Premiums for own account 19 717 19 619 19 227- of which products with investment choice 2 125 1 763 992Policyholder's funds incl. accrued profit 280 975 153 568 140 276Investment yield I 2 8.9% 7.1% 6.9%Investment yield II 2 7.3% 8.3% 7.6%Capital adequacy (<strong>Storebrand</strong> Life Insurance group) 10.0% 9.7% 10.9%Operating costs as a % of policyholders' funds 1.2% 1.1% 1.1%<strong>Storebrand</strong> BankInterest margin % 1.1% 1.3% 1.6%Cost/income % 69.7% 71.3% 61.8%Non-interest income/total income % 20.1% 15.8% 17.4%Net lending 36 791 30 748 26 286Capital adequacy 10.5% 11.0% 10.5%<strong>Storebrand</strong> Investments (asset management)Total assets under management 227 356 216 902 204 825Assets under management for external clients 57 661 54 825 49 1761 Key figures are presented in accordance with NGAAP, except for premiums and policyholders› funds that are presented in accordance with IFRS.2 Investment yield I: Realised financial income including revaluations (positive or negative) of real estate.Investment yield II: Like Investment yield I but including change in unrealised gains on financial current assets.<strong>Annual</strong> <strong>Report</strong> <strong>2007</strong>75
Notes <strong>Storebrand</strong> Group04 Other incomeNOK million <strong>2007</strong> 2006 2005Fee and commission income, banking 139.8 112.3 44.5Fee and commission expense, banking -81.9 -80.3 -26.9Net fee and commission income, banking 57.9 32.0 17.6Management fees, asset management activities 383.3 228.8 169.6Interest income on bank deposits 310.4 127.0 110.2Revenue from real estate broking 14.2 14.2 9.3Interest from lending, insurance activities 150.9 73.7 21.0Currency gains/losses, banking -248.0 138.4 -145.0Other insurance related income 57.9Interest income, insurance 28.1 35.0 19.7Other financial income 45.3 158.2 135.0Other revenue from companies other than banking and insurance 53.1 123.6 127.0Total other income 853.1 930.9 464.4Total fee and commission income from financial instruments not at fair value totalled NOK 39.4 million in <strong>2007</strong>.Total fee and commission expenses on financial instruments not at fair value totalled NOK 23.3 million in <strong>2007</strong>.05 Operating costsSB Life SB Bank Other <strong>Storebrand</strong> GroupNOK million <strong>2007</strong> <strong>2007</strong> <strong>2007</strong> <strong>2007</strong> 2006 2005Personnel costs -894.4 -142.0 -262.2 -1 298.6 -1 175.9 -991.4Depreciation -77.6 -21.3 -19.3 -118.2 -88.0 -81.0Other operating costs -843.4 -197.0 -124.5 -1 164.9 -1 256.8 -1 097.0Total operating costs -1 815.4 -360.3 -406.0 -2 581.6 -2 520.7 -2 169.406 Other costsNOK million <strong>2007</strong> 2006 2005Pooling -100.7 -33.1 -69.4Interest costs, insurance -42.2 -26.2 -29.5Currency losses, banking and insurance -9.9 -12.8 -28.8Insurance related costs -20.1Loss on repaying borrowings -113.1Other costs -15.1 -7.7 -15.1Total other costs -188.0 -79.8 -255.907 TaxTax charge to profitNOK million <strong>2007</strong> 2006 2005Tax payable for the period -0.3 -8.0 -2.9Change in deferred tax -19.8 -71.3 -38.2Total tax charge -20.1 -79.3 -41.176<strong>Annual</strong> <strong>Report</strong> <strong>2007</strong>
Reconciliation of expected and actual tax chargeNOK million <strong>2007</strong> 2006 2005Ordinary pre-tax profit 2 028.8 1 585.3 1 463.4Expected tax on income at nominal rate -568.1 -443.9 -409.8Tax effect of:- realised/unrealised shares 1 086.9 1 537.3 1 318.3- dividends received 228.7 436.2 129.5- associated companies -14.1 11.4 5.1- permanent differences 52.2 47.0 54.4- write-down of deferred tax assets -805.7 -1 667.3 -1 138.6Tax charge -20.1 -79.3 -41.1Effective tax rate -1.0% -5.0% -2.8%Calculation of deferred tax assets and deferred tax on temporary differences and losses carried forward:NOK million <strong>2007</strong> 2006 2005Tax increasing temporary differencesSecurities 548.1 26.1 30.6Real estate 3 461.9 763.3 1 050.1Operating assets 4.9 4.8 616.3Pre-paid pensions 204.7 58.4 60.4Gains/losses account 785.7 982.1 1 255.1Other 2 324.5 479.4 123.5Total tax increasing temporary differences 7 329.8 2 314.1 3 136.0Tax reducing temporary differencesSecurities -4 369.3 -2 006.2 -1 635.4Real estate -100.6Operating assets -77.9 -97.1 -157.7Provisions -23.5 -97.0 -75.9Accrued pension liabilities -930.9 -576.3 -711.5Gains/losses account -70.5 -62.9 -61.1Other -28.3 -30.4 -12.6Total tax reducing temporary differences -5 500.4 -2 869.9 -2 754.8Losses carried forward -12 027.4 -8 697.0 -5 680.6Allowances carried forward -1 357.4 -1 352.0 -1 358.4Total losses and allowances carried forward -13 384.8 -10 049.0 -7 039.0Basis for net deferred tax/tax assets -11 555.4 -10 604.8 -6 657.8Write-down of basis for deferred tax assets 12 969.2 10 281.4 6 299.2Net basis for deferred tax/tax assets 1 413.8 -323.4 -358.6Net deferred tax asset/liability in the balance sheet 395.9 -90.5 -100.4Booked in the balance sheet:Deferred tax assets 234.9 207.0 290.0Deferred tax 630.8 116.5 189.6Deferred tax assets have been written down as a result of uncertainty as to whether future taxable income will be sufficient for all losses carried forwardto be used for business in Norway. The primary reason behind this is the exemption from taxation for share dividends and gains/losses on shares in theEEA area, and it is expected that the group will continued to derive income from such investments in future years. Allowances carried forward date fromthe years 1998–2003, and must be used within 10 years. Deferred tax has arisen in Sweden due to the acquisition of SPP.<strong>Annual</strong> <strong>Report</strong> <strong>2007</strong>77
Notes <strong>Storebrand</strong> Group08 Intangible assets and goodwillNOK millionBrandnamesITsystemsOtherintangiblesSPP 1 VIF 2 GoodwillAcquisition cost 1.1. 257.6 611.9 869.5 785.1 782.6Additions in the period:Developed in-house 23.6 23.6 28.0 0.1Purchased separately 43.8 43.8 41.6 22.7Acquired through mergers, acquisitions, etc 30.7 989.6 7 714.9 907.1 9 642.3 0.5Disposals in the period -8.2 -0.4 -8.6 -5.4Effect of hedge accounting -20.0 -20.0Acquisition cost 31.12. 30.7 316.8 989.6 7 714.9 1 498.6 10 550.6 855.2 800.0Total<strong>2007</strong>Total2006Total2005Accumulated depreciation and write-downs 1.1. -162.7 -157.5 -320.2 -278.0 -262.4Depreciation in the period -40.7 -40.7 -36.4 -34.3Disposals in the period 4.9Accumulated depreciation and write-downs 31.12. -203.4 -157.5 -360.9 -314.4 -291.8Book value 31.12. 30.7 113.4 989.6 7 714.9 1 341.1 10 189.7 540.7 508.2Intangible assets are depreciated linearly over 3–10 years.1 Intangible assets in connection with the acquisition of SPP are associated with brand name, customer lists and the option for further acquisitions from Handelsbanken. Theacquisition analysis is not final. The distribution of the various elements will be made once this has been completed.2 VIF – “value of business in force” is depreciated over 20 years.Analysis of goodwill by business acquisitionNOK millionAcquisitioncost 1.1.Acc. writedowns1.1Balance sheetvalue 1.1.Additions/disposalsWrite-downsBalance sheetvalue 31.12.<strong>Storebrand</strong> Bank ASA 563.2 -140.8 422.4 422.4Acquisition of SPP 866.5 866.5Delphi Fondsforvaltning AS 48.3 -16.7 31.6 31.6Hadrian Eiendom AS 20.1 20.1Skansen Eiendomsmegling AS 0.5 0.5Sjølyst Eiendom AS 0.4 0.4 -0.4Total 611.9 -157.5 454.4 886.7 1 341.1Goodwill is not amortised, but is tested annually for impairment.09 Tangible fixed assetsProperties and operational assetsNOK million Equipment VehiclesFixtures &TotalFittings Property 1 <strong>2007</strong>Book value at 1.1. 27.6 9.8 27.1 770.1 834.6 749.3 742.9Additions 11.9 18.6 6.0 36.6 101.4 37.1Additions through acquisitions/mergers 2.1 2.1Disposals -0.2 -1.4 -1.6 -4.4 -2.9Changes to value in the balance sheet 21.5 21.5 48.1 24.5Depreciation -16.7 -3.4 -1.4 -22.4 -43.9 -51.6 -52.0Other changes 254.0 254.0 2.4Book value at 31.12 24.9 24.9 31.7 1 021.8 1 103.2 842.9 752.0Acquisition cost opening balance 86.8 11.3 302.8 774.8 1 175.6 1 576.6 1 110.9Acquisition cost closing balance 121.2 29.0 308.8 773.9 1 233.0 1 740.5 873.3Accumulated depreciation and write-downs opening balance -59.2 -1.6 -275.4 -43.8 -379.9 5.8 -407.7Accumulated depreciation and write-downs closing balance -96.3 -6.6 -274.4 -298.2 -675.4 -8.6 -177.4Revaluation fund opening balance 24.0Changes in the period 20.6Revaluation fund closing balance 44.61 Properties for own use, also see note 16.Total2006Total200578<strong>Annual</strong> <strong>Report</strong> <strong>2007</strong>
For each class of fixed assets:Depreciation method:Depreciation plan and financial lifetime:EquipmentVehiclesFixtures and fittingsReal estateLinear4 years6 years4 years15 years10 Tangible fixed assets – operational leasingMinimum future payments on operational leases for fixed assets are as follows:NOK millionMinimum lease paymentless than 1 yearMinimum lease payment1–5 yearsMinimum lease paymentgreater than 5 yearsMinimum future lease payments 65.1 195.8 5.7Of which future lease income 7.2 6.0NOK million <strong>2007</strong> 2006 2005Lease payments through profit and loss account 44.1 40.9 39.1Future lease income through profit and loss account 16.7 19.2 23.8Assets leased in by company relate to leasing of cars and copying machines, and leases of office premises. Assets leased out by the company relate tooffice premises in Oslo and Bergen.Lease contracts for cars are normally for 36 months. Lease contracts for copying machines expire in 2012 and 2010.Lease contracts for office premises and leasing out offices in Aker Brygge (Oslo) expire first half of 2008.Other leases on office premises are for 3–7 years with options for renewal.11 Pensions<strong>Storebrand</strong>Employees are insured through a defined benefit pension equivalent to 70 per cent of pensionable salary at the time of retirement. The ordinary retirementage is 65. Staff pensions are provided by a group pension scheme with <strong>Storebrand</strong> Livsforsikring AS. Pension payments from this scheme come intoeffect from the pension age, which is 67 for employees and 65 for underwriters. Pension payments to employees between 65 and 67 are paid directly bythe company. The pension terms follow from the pension decisions in the <strong>Storebrand</strong> group.The company is obliged to have an occupational pension scheme pursuant to the Act relating to Mandatory Occupational Pensions. The company›spension scheme satisfies the requirements of this act.SPPThe pension plan for employees in SPP follows the plan for bank employees in Sweden. The ordinary retirement age is 65 in accordance with the pensionagreement between the Employer’s Association of the Swedish Banking Institutions (BAO) and the Union of Finance Sector Employees and between BAOand SACO (the Swedish Confederation of Professional Associations). The amount is 10 per cent of the annual salary up to 7.5 income base amounts.The retirement pension is 65 per cent of the annual salary for the portion of salary between 7.5–20 income base amounts, and 32.5 per cent of annualsalary between 20–30 income base amounts. No retirement pension is paid for the portion of salary in excess of 30 income base amounts.Reconciliation of pension assets and liabilities in the balance sheet:NOK million <strong>2007</strong> 2006 2005Present value of insured pension benefit obligations including employer's NI contributions 2 893.6 3 105.5 2 762.4Pension assets as fair value -2 759.8 -2 747.3 -2 599.4Net pension liability/surplus for the insured schemes 133.8 358.1 163.0Present value of the uninsured pension benefit obligations including employer's NI contributions 558.1 454.3 495.4Net pension liabilities concerning SPP 225.0Net pension liabilities in the balance sheet 916.9 812.5 658.4Booked in the balance sheet:<strong>2007</strong> 2006 2005Pension assets 205.0 58.4 57.0Pension liabilities 1 121.0 870.9 715.4NOK million <strong>2007</strong> 2006 2005Accumulated experience adjustments included in equity 176.8 465.8 226.1<strong>Annual</strong> <strong>Report</strong> <strong>2007</strong>79
Notes <strong>Storebrand</strong> GroupEquity in the group in <strong>2007</strong> was positively affected by a net amount of NOK 215 million. This was due to the write back of previous expenses because theseexpenses were actually included in the profit sharing model in <strong>Storebrand</strong> Livsforsikring AS in which the charge against the group›s equity was less than hadbeen charged.Changes in the net defined benefit pension liability in the period:NOK million <strong>2007</strong> 2006 2005Net pension liability at 1.1. including provision for employer's national insurance contributions 3 559.2 3 257.8 3 307.0Net pension cost recognised in the period including provision for employer's NI contributions 124.4 111.6 88.9Interest on pension liabilities 141.5 144.1 143.1Experience adjustments -164.6 252.1 -18.3Pensions paid -208.2 -205.9 -207.8Changes to the pension scheme -55.1Net pension liabilities concerning SPP 479.0Net pension liability at 31.12. 3 931.3 3 559.8 3 257.8Changes in the fair value of pension assets in the period:NOK million <strong>2007</strong> 2006 2005Fair value of pension assets at 1.1. 2 723.1 2 599.9 2 627.0Expected return 145.3 151.4 145.5Experience adjustments -9.6 23.8 -37.6Premium paid 82.9 147.9 83.1Pensions paid -180.8 -175.8 -173.2Changes to the pension scheme -45.3Net pension assets concerning SPP 254.0Net pension assets at 31.12. 3 014.8 2 747.3 2 599.4Pension assets are based on the financial investments held by <strong>Storebrand</strong> Livsforsikring and SPP which had the followingcomposition as at 31.12.:<strong>Storebrand</strong> Livsforsikring ASSPP<strong>2007</strong> 2006 2005 <strong>2007</strong>Properties and real estate 13% 11% 10%Bonds held to maturity 23% 28% 28%Secured and other lending 2% 1% 1%Shares and other equity participations 30% 29% 27% 42%Bonds 26% 28% 29% 53%Commercial paper 1% 4%Other short-term financial assets 5% 2% 1% 5%Total 100% 100% 100% 100%The table shows the percentage asset allocation of pension assets managed by <strong>Storebrand</strong> Livsforsikring and SPP at year-end. The book (realised)investment return on assets managed by <strong>Storebrand</strong> Livsforsikring was 8.9% in <strong>2007</strong>, 7.1% in 2006 and 6.9% in 2005.Net pension cost booked to profit and loss account, specified as follows:NOK million <strong>2007</strong> 2006 2005Current service cost including employer's national insurance contributions 129.8 76.6 81.4Interest on pension liabilities 135.9 143.6 143.1Expected return on pension assets -144.3 -150.6 -151.5Experience adjustments 0.1 -1.3Changes to the pension scheme -9.8Accrued employer's national insurance contributions 22.0 14.9 12.7Net pension cost booked to profit and loss account in the period 143.5 84.5 74.6The net pension cost is included in operating costs.80<strong>Annual</strong> <strong>Report</strong> <strong>2007</strong>
Main assumptions used when calculating net pension liability at 31.12.:For <strong>Storebrand</strong>For SPP31.12 <strong>2007</strong> 31.12 2006 31.12 2005 31.12 <strong>2007</strong>Financial:Discount rate 4.7% 4.3% 4.7% 3.8%Expected return on pension fund assets in the period 5.8% 5.6% 6.0%Expected earnings growth 4.3% 4.3% 3.0% 3.5%Expected annual increase in social security pensions 4.3% 4.3% 3.0% 3.0%Expected annual increase in pensions in payment 1.9% 1.7% 2.0% 2.0%Disability table KU K63 K63Mortality table K2005 K63 K63 P94Actuarial assumptions:Standardised assumptions on mortality/disability and other demographic factors as produced by the Norwegian Financial Services Association. Averageemployee turnover rate of 2–3% of entire workforce.Net pension liability at 31.12.:NOK million <strong>2007</strong> 2006 2005Discounted current value of defined benefit pension liabilities 3 676.7 3 559.8 3 257.8Fair value of pension assets 2 759.8 2 747.3 2 599.4Deficit 916.9 812.5 658.412 Remuneration of senior employees and elected officers of the companyNOK '000sOrdinarysalaryBonuspaidOtherbenefits 1Postterminationsalary (months)Pensionaccrued forthe yearDiscountedpresent valueof pensionLoanInterest rateat 31.12.07RepaymentperiodSenior employeesIdar Kreutzer 3 602 2 249 250 24 675 10 342 10 800 4.76–5.59 2037Hans Henrik Klouman 6 4 269 1 423 132 24 1 109 6.00 2025Odd Arild Grefstad 2 322 1 553 225 18 469 5 896 4 391 4.76–5.89 2024Maalfrid Brath 2 338 1 123 183 18 508 6 132 4 895 4.76–5.54 2035Egil Thompson 1 561 420 161 18 390 3 216 712 4.76 2021Lars Aa. Løddesøl 2 355 1 234 163 18 685 4 381 4 357 4.76–5.54 2029Klaus-Anders Nysteen 1 905 187 154 18 769 984 3 446 4.76–5.55 2026Roar Thoresen 2 612 1 600 146 18 801 4 599 1 694 4.76 2032Hans Aasnæs 2 546 2 875 156 18 686 8 778 1 700 4.76 2027Total <strong>2007</strong> 23 509 12 663 1 570 4 984 44 328 33 104Total 2006 24 556 15 398 5 392 5 572 42 677 30 764No. ofshares held 2Bonusbank 3Return onshares bank 4Idar Kreutzer 54 160 4 308 -331Hans Henrik Klouman 6 4 516 2 393 -205Odd Arild Grefstad 8 323 1 695 -151Maalfrid Brath 4 831 1 122 -165Egil Thompson 3 660 401 -48Lars Aa. Løddesøl 4 933 1 336 -179Klaus-Anders Nysteen 1 813 -3 -66Roar Thoresen 2 796 1 309 -246Hans Aasnæs 14 695 1 464 -398Total <strong>2007</strong> 99 727 14 024 -1 789Total 2006 45 111 15 038 4 304<strong>Annual</strong> <strong>Report</strong> <strong>2007</strong>81
Notes <strong>Storebrand</strong> GroupNOK '000s Remuneration Bonus bank 3 shares held 2No. ofBoard of DirectorsLeiv L. Nergaard 5 620 109 090Halvor Stenstadvold 282 6 645Knut G. Heje 236 15 467Mette K. Johnsen 112Erik Haug Hansen 276 95 3 981 1 030Nina Elisabeth Smeby 104 125 1 696Birgitte Nielsen 280Barbara Rose Milian Thoralfsson 138 1 849Knut Dyre Haug 248 220 2 979 1 441Camilla Grieg 197Ann-Mari Gjøstein 162 258Total <strong>2007</strong> 2 655 315 140 394 4 167Total 2006 2 332 243 57 129 4 842LoanControl CommitteeElisabeth Wille 200 747Harald Moen 164 595Carl Graff-Wang 61Ida Hjort Kraby 160Jon Ansteinsson 109Ole Klette 107Total <strong>2007</strong> 801 1 342Total 2006 761 4101 Comprises company car, telephone, insurance, concessionary interest rate, other contractual benefits and compensation on termination of employment.2 The summary shows the number of shares owned by the individual, as well as his or her close family and companies where the individual exercises significant influence(cf.Accounting Act § 7-26).3 Outstanding at 31.12.<strong>2007</strong>. Senior executives are contractually entitled to performance related bonuses related to the group›s value-based management system. The group’svalue creation finances the overall amount of the bonus, but individual performance determines what proportion of the bonus is allocated. The bonus allocated to an individualis credited to a bonus account, and 1/3 of the balance on the bonus account is paid each year. When the bonus accounts were introduced, <strong>Storebrand</strong> created an initialdeposit. If the employee leaves the company, the positive amount of the initial deposit will be retained by <strong>Storebrand</strong>. The balance of the bonus account is exposed 50% to<strong>Storebrand</strong>›s share price and 50% to the best interest rate paid by <strong>Storebrand</strong> Bank. Over time the balances in the ”share bank“ and ”interest bank“ will grow separately.4 The return on the ”share bank“ shows the annual gain in value of the individual›s bonus account caused by the performance of the <strong>Storebrand</strong> share price in <strong>2007</strong> adjusted fordividend.5 Directors' fees from <strong>Storebrand</strong> ASA and <strong>Storebrand</strong> Livsforsikring AS.6 Left on 01.09.07Loans to employees of the group total NOK 1,588 million.STOREBRAND ASA – THE BOARD OF DIRECTOR'S STATEMENTOn the fixing of the salary and other remuneration for senior employeesThe Board's declarationThe Board of <strong>Storebrand</strong> ASA will submit a statement to the annual general meeting on the salary and other remuneration of senior employees, cf.Section 6-16a of the Public Limited Liabilities Companies Act, based on the group's previously adopted guidelines concerning remuneration for senioremployees in <strong>Storebrand</strong>.The Board's Remuneration CommitteeThe Board of <strong>Storebrand</strong> ASA has had a special Remuneration Committee since 2000. The Remuneration Committee is tasked with providing recommendationsto the Board concerning all matters to do with the company's remuneration of the CEO. The Committee shall remain informed about and suggestguidelines for the fixing of remuneration for senior employees in the group. In addition the Committee is the advisory body for the CEO in relation toremuneration regimes that cover all senior employees, including <strong>Storebrand</strong>'s bonus system and pension scheme.Guidelines for the fixing of salary and other remuneration for senior employees in <strong>Storebrand</strong><strong>Storebrand</strong> aims to base remuneration on competitive and stimulating principles that help to attract, develop and retain highly qualified staff. The aim isfor total remuneration to move towards a lower proportion of fixed salary and a higher proportion of bonus over time. The salaries of senior employeesare fixed on the basis of a position›s responsibilities and complexity. Regular comparisons are made with corresponding positions in the market in orderto adjust the pay level to the market. <strong>Storebrand</strong> does not wish to be a pay leader in relation to fixed pay in the sector.Senior employees in <strong>Storebrand</strong> can, in addition to their fixed salary, receive remuneration in the form of an annual bonus, participation in the group›sgroup pension scheme, usual benefits in the form of free newspapers, telephone, company car scheme, and other personal benefits. Senior employeesmay also be entitled to an arrangement in which their salary is paid after the end of their employment. This guarantees salary less other income for aspecific period of up to 24 months after the end of their employment.82<strong>Annual</strong> <strong>Report</strong> <strong>2007</strong>
The bonus systemThe <strong>Storebrand</strong> group's bonus scheme, which is offered in addition to basic pay, is a performance-related bonus scheme linked to the group’s value-basedmanagement system. The value creation of the group finances the overall amount of the bonus, but the employees’ performance determines how large aproportion of the financed bonus is awarded. The bonus entitlement is credited to a bonus account. The amount credited to the bonus bank is exposed50 per cent to <strong>Storebrand</strong>’s share price and 50 per cent to the bank interest rate paid. 1/3 of the balance on the bonus account is paid each year.Share programme for employeesLike other employees in <strong>Storebrand</strong>, senior employees have an opportunity to purchase up to 1,000 shares in <strong>Storebrand</strong> ASA at a discount. The discountin excess of NOK 1,500 is reported as pay. The scheme is subject to a minimum contractual period.The senior employee remuneration policy practised in <strong>2007</strong>In <strong>2007</strong>, senior employee remuneration in <strong>Storebrand</strong> was fixed according to the guidelines described above. None of the group’s executive managementreceived pay increases during the ordinary pay adjustment.The executive management receive on average less than 25 per cent expected variable remuneration calculated in relation to fixed remuneration.Shares in <strong>Storebrand</strong> ASA held by members of the Board of RepresentativesArvid GrundekjønInger Lise GjørvStein Erik HagenTerje R. Venold 924Margareth ØvrumOlaug SvarvaJohan H. Andresen jr.Vibeke Hammer MadsenMerete Egelund ValderhaugRoar EngelandRune Pedersen 1 682Tor Haugom 5Randi Paulsrud 545Karen Helene Ulletveit-MoeTrond BjørganArild ThoresenPaul Eggen jr.Unn Kristin JohnsenTotal <strong>2007</strong> 3 156Total 2006 761Total 2005 2 028No loans have been made to any member of the Control Committee. Loans to members of the Board of Representatives total NOK 8.1 million.The remuneration paid to auditors was as follows (excl. VAT):NOK million <strong>2007</strong> 2006 2005Statutory audit 6.8 5.9 6.0Other reporting duties 3.5 0.2 0.7Tax advice 0.7 1.2Other non-audit services 5.2 1.7 6.1Of which remuneration paid to Deloitte AS (excl. VAT):<strong>2007</strong> 2006 2005Statutory audit 6.8 5.9 6.0Other reporting duties 3.5 0.2 0.7Tax advice 0.7 1.2Other non-audit services 1 5.2 1.7 6.11 Other non-audit services primarily relate to agreed inspection services in connection with <strong>Storebrand</strong>›s acquisition of SPP Livforsäkring and associated companies. Of theamount approximately NOK 1.3 million was fees to Deloitte in Sweden and Denmark.<strong>Annual</strong> <strong>Report</strong> <strong>2007</strong>83
Notes <strong>Storebrand</strong> Group13 Investments in associated companiesMain accounting figures for associated companies – figures shown are for 100 % of the company.NOK million <strong>2007</strong> 2006 2005RevenueNordben Life and Pension Insurance Co. Ltd. 70.8 64.8Caveo ASA 93.0Norsk Pensjon AS 0.4Inntre Holding AS 240.7 210.7 185.1Bertil O Steen Finans AS 52.4Seilduksgaten 25/31 AS 2.6 2.8 3.1Utenlandsmegleren AS 3.4 3.9Profit/lossNordben Life and Pension Insurance Co. Ltd. 20.0 31.0Caveo ASA -14.2Norsk Pensjon AS -5.9Inntre Holding AS 19.5 9.7 4.3Bertil O Steen Finans AS 35.3Seilduksgaten 25/31 AS -1.2 -1.2 -0.3Utenlandsmegleren AS -0.2 -0.6AssetsNordben Life and Pension Insurance Co. Ltd. 7 108.0 6 417.0Caveo ASA 108.1 165.4Norsk Pensjon AS 15.1Inntre Holding AS 182.0 160.6 149.3Bertil O Steen Finans AS 52.8Seilduksgaten 25/31 AS 24.0 24.2 24.9Utenlandsmegleren AS 2.5 3.1LiabilitiesNordben Life and Pension Insurance Co. Ltd. 6 804.8 6 165.1Caveo ASA 57.9 48.3Norsk Pensjon AS 8.1Inntre Holding AS 51.0 43.5 38.5Bertil O Steen Finans AS 9.4Seilduksgaten 25/31 AS 24.0 23.2 22.7Utenlandsmegleren AS 3.1 3.4Ownership interests in associated companiesNOK millionOwnershipinterestAcquisitioncostBalance sheetvalue at 1.1Additions/disposalsShare ofprofitNordben Life and Pension Insurance Co. Ltd 1 75% 29.5 75.8 -82.2 6.4Balance sheetvalue 31.12Caveo ASA 2 49% 124.1 89.3 34.7 -30.3 93.7Norsk Pensjon AS 25% 2.5 2.5 2.5 -1.4 3.6Inntre Holding AS 34% 2.2 40.2 6.4 46.6Active Travel Norway AS 40% 2.0 2.0 2.0Seilduksgaten 25/31 AS 50% 30.0 29.2 -0.5 28.7Utenlandsmegleren AS 34% 0.3 0.3 -0.3Total 190.6 237.1 -42.8 -19.6 174.61 <strong>Storebrand</strong> Livsforsikring AS directly owns 25% of the shares in Nordben Life and Pension Insurance CO. Ltd. and SPP owns 50% of the Shares in Nordben, meaning the group’stotal interest has increased to 75% with the acquisition of SPP. 25% of the result in the company has been included in <strong>2007</strong> according to the equity method, while the balancesheet has been consolidated in its entirety.2 Goodwill has been written down by NOK 23.6 million.84<strong>Annual</strong> <strong>Report</strong> <strong>2007</strong>
14 Joint VenturesJoint ventures are businesses the group operates together with external parties.The consolidated accounts include the following companies with the amounts shown:NOK million <strong>2007</strong> 2006 2005Revenue<strong>Storebrand</strong> Helseforsikring AS 102.3 85.0 70.8Evoco Financial Production Services UAB 3.0Fair Financial Ireland plc. 1 43.0 182.7Sjølyst Eiendom AS 2 145.0Group profit<strong>Storebrand</strong> Helseforsikring AS 13.0 6.5 5.3Evoco Financial Production Services UAB -0.9Fair Financial Ireland plc. -4.8 10.4Sjølyst Eiendom AS 30.0Assets<strong>Storebrand</strong> Helseforsikring AS 142.0 119.9 99.0Evoco Financial Production Services UAB 1.7Fair Financial Ireland plc. 326.2Sjølyst Eiendom AS 727.0 330.0Liabilities<strong>Storebrand</strong> Helseforsikring AS 85.0 80.6 72.9Evoco Financial Production Services UAB 1.6Fair Financial Ireland plc. 307.0Sjølyst Eiendom AS 417.012The company was sold in 2006The company was sold in <strong>2007</strong>15 Contingent liabilities and conditional assets<strong>Storebrand</strong> ASA has issued the following guarantees:Currency Terms Accounts provisionInstitute of London Underwriters (ILU) 1 USD Unlimited1Counter indemnity of Oslo Reinsurance Company ASA , which is 100% owned by <strong>Storebrand</strong> Skadeforsikring AS.16 Investment propertiesThe following amounts are included in the profit and loss account:NOK million <strong>2007</strong> 2006 2005Rental income from investment properties 1 615.3 1 246.8 977.4Operating costs (including maintenance and repairs)for investment properties that produced rental income in the period. -180.6 -156.5 -128.3Total 1 434.7 1 090.3 849.1Change in fair value of investment properties 2 952.8 907.2 36.6Total income from investment properties 4 387.5 1 997.5 885.7<strong>Annual</strong> <strong>Report</strong> <strong>2007</strong>85
Notes <strong>Storebrand</strong> GroupValues booked in the balance sheetNOK million <strong>2007</strong> 2006 2005Book value at 1.1. 17 447.0 13 503.6 12 240.7Additions from new purchases 753.8 3 387.5 962.3Additions caused by supplementary expenditure 896.3 151.0 264.0Disposals -442.0 -502.2Net revaluation/write-downs 2 703.5 907.2 36.6Book value at 31.12. 21 358.6 17 447.0 13 503.6Type of property<strong>2007</strong> 2006 2005Averagerental persquare metreRemainingterm of leasecontract<strong>2007</strong>Space(squaremetres)OccupancyrateOffices (including parking and storage) 11 305.1 9 648.4 7 643.7 1 468.0 4.6 637 479 98.1Shopping centres (including parking andstorage) 9 504.2 7 312.0 5 464.1 1 518.0 4.0 390 078 99.1Car parks 549.3 486.5 395.8 1 077.0 9.0 44 085 100.0Total investment properties 21 358.6 17 447.0 13 503.6 1 071 642Properties for own use 1 005.4 769.9 657.7 1 926.0 2.1 59 945 100.0Total properties 22 364.0 18 216.9 14 161.3 1 926.0 1 131 587The group entered into commitments in <strong>2007</strong> to purchase properties for NOK 167 million, but completion of these contracts and transfer of risk does nottake place until 2008.17 Capital adequacyNOK millionSB LifeGroupP&C Group<strong>2007</strong> 2006 2005SB BankGroup SB ASA Group Group GroupRisk-weighted calculation base 137 941.1 126.9 26 101.9 17 023.0 164 983.4 105 270.3 95 163.0Equity 15 374.2 253.2 2 065.7 15 462.4 18 482.1 8 737.4 8 173.2Other core (Tier 1) capital 2 437.0 2 437.0Perpetual subordinated loans 275.6 275.6 275.1 229.2Goodwill and other intangible assets -9 610.5 -81.2 -288.3 -10 406.8 -731.9 -827.8Deductions -65.0 -249.9 -314.9 -222.2 -131.9Net core (Tier 1) capital 8 135.7 172.0 2 053.0 15 212.5 10 473.0 8 058.4 7 442.7Tier 2 Capital 5 764.4 683.7 4 834.3 3 332.0 3 245.5Deductions -65.0 -65.0 -192.0 -18.8Net core (Tier 2) capital 5 699.4 683.7 4 769.3 3 140.0 3 226.7Net primary capital 13 835.1 172.0 2 736.7 15 212.5 15 242.3 11 198.4 10 669.4Capital adequacy in % 10.0% 135.5% 10.5% 89.4% 9.2% 10.6% 11.2%The statutory capital adequacy requirement is 8%. The capital adequacy is calculated according to the principles used in the company accounts, and notpursuant to IFRS.18 Number of employees<strong>2007</strong> 2006 2005Number of employees at 31.12. 1 2 219 1 455 1 321Average number of employees 1 597 1 388 1 305Fulltime equivalent positions at 31.12. 1 2 151 1 429 1 295Average number of fulltime equivalents 1 556 1 362 1 2601 The SPP group is included in <strong>2007</strong> with 555 employees and 537 fulltime equivalent, but is not included in the calculation of the average number.86<strong>Annual</strong> <strong>Report</strong> <strong>2007</strong>
19 Net income analysed by class of financial instrumentNet interest income from banking activitiesNOK million <strong>2007</strong> 2006 2005Interest income 1 1 992.3 1 220.0 1 027.1Interest expense 2 -1 579.1 -801.2 -579.8Net interest income from banking activities 413.2 418.8 447.312Interest income from financial instruments not at fair value totalled NOK 1,861.3 million in <strong>2007</strong> (compared with NOK 1,141.5 million in 2006).Interest expense on financial instruments not at fair value totalled NOK 1,506.4 million in <strong>2007</strong> (compared with NOK 780.3 NOK million in 2006).Net income and gains from financial assets at fair valueNOK million <strong>2007</strong> 2006 2005Dividends from shares and other equity investments 870.8 747.8 646.9Net gains/losses on disposal of shares, other equity investments and equity derivatives 3 431.5 3 628.9 4 149.3Net unrealised gains/losses on shares and other equity investments -3 644.4 1 680.8 2 643.7Total shares and other equity investments 658.0 6 057.5 7 439.9- of which FVO (fair value option) 823.1 6 066.0 7 509.9Interest income 2 170.9 1 817.7 1 610.2Net gains/losses on disposal of fixed-income securities and interest rate derivatives -560.1 -348.0 27.8Net unrealised gains/losses on fixed-income securities -1 487.0 -113.5 -52.6Total bonds, bond funds and other fixed-income securities 123.9 1 356.1 1 585.4- of which FVO (fair value option) -714.1 814.6 1 413.4Interest -2.1 53.8 8.5Net gains/losses on disposal of financial derivatives 4 223.7 66.0 -390.5Net unrealised gains/losses on financial derivatives 427.4 553.5 -1 237.9Total financial derivatives 4 649.0 673.3 -1 619.9Income from financial assets with investment choice FVO 353.4 685.4 721.3Net income and gains from financial assets at fair value 5 430.9 8 087.0 7 405.4- of which FVO (fair value option) 462.4 7 566.0 9 644.6Net income from bonds at amortised costNOK million <strong>2007</strong> 2006 2005Interest income from bonds held to maturity 1 595.0 1 739.9 1 879.7Interest income from other bonds at amortised cost 640.2 657.3 530.1Net income from bonds at amortised cost 2 235.2 2 397.2 2 409.9Interest expenseNOK million <strong>2007</strong> 2006 2005Interest expense – subordinated loans -197.1 -135.2 -141.6Interest expense – funding -114.1 -76.7 -50.6Interest expense on other financial indebtedness -7.0 -1.0 -4.9Total interest expense 2 -318.2 -212.9 -197.1<strong>Annual</strong> <strong>Report</strong> <strong>2007</strong>87
Notes <strong>Storebrand</strong> Group20 Lending losses/write-back of earlier lossesNOK million <strong>2007</strong> 2006 2005Write-downs/write-backs of lending, guarantees, etc for the periodChange in individual loan write-downs for the period 113.0 29.6 107.5Change in grouped loan write-downs for the period 15.2 15.9 26.5Other corrections to write-downs -0.9 22.4 -19.3Change in individual guarantee write-downs for the period 4.0Realised losses on loans where provisions have previously been made -59.6 -17.2 -81.9Realised losses on loans where no provisions have previously been made -1.0 -6.2 -0.9Recovery of loan losses realised previously 7.5 2.4 2.5Write-downs/write-backs for the period 78.2 47.0 34.4Income recognised interest on loans for which write-downs have been made 4.0 7.5 15.3Provisions for credit lossesNOK million <strong>2007</strong> 2006 2005Write-downs of individual loans at 1.1. 360.0 389.6 501.0Losses realised in the period for which individual write-downs have previously been made -59.6 -17.2 -81.9Write-downs of individual loans in the period 12.0 43.1 66.8Reversals of write-downs of individual loans in the period -66.1 -59.6 -103.4Other corrections to write-downs 0.7 4.0 7.1Write-downs of individual loans at 31.12. 247.0 360.0 389.6Grouped write-downs of loans, guarantees etc. at 1.1. 73.3 89.2 115.7Grouped write-downs in the period -15.2 -15.9 -26.5Grouped write-downs of loans, guarantees, etc at 31.12. 58.1 73.3 89.221 Classification of financial assets and liabilitiesNOK millionLoans andreceivablesHold tomaturityFair value,tradingFair value,FVOAmortisedcostFinancial assetsBank deposits 25 569.0 25 569.0Shares and other equity instruments 2 033.3 71 627.8 73 661.1Bonds and other fixed-income securities 12 919.7 27 460.4 7 963.8 104 061.8 152 405.7Lending to financial institutions 374.1 374.1Lending to customers 39 177.0 316.5 39 493.5Customer receivables and other short-term receivables 6 512.6 6 512.6Other financial assets 1 1 515.3 3 338.1 4 853.4Derivatives 4 774.1 4 774.1Life insurance assets with investment choice 39 083.4 39 083.4Total financial assets <strong>2007</strong> 86 067.7 27 460.4 14 771.2 218 427.5 0.0 346 726.8Total financial assets 2006 51 206.5 29 922.3 16 807.2 90 319.7 13 176.5 201 432.2TotalFinancial liabilitiesSubordinated loan capital 5 213.8 5 213.8Liabilities to financial institutions 3 064.5 3 064.5Deposits from banking customers 137.4 17 332.2 17 469.6Securities issued 1 118.9 22 209.0 23 327.9Derivatives 3 644.6 3 644.6Other current liabilities 2 3 891.1 17 307.7 21 198.8Total financial liabilities <strong>2007</strong> 7 535.7 1 256.3 65 127.2 73 919.2Total financial liabilities 2006 4 811.5 9 865.4 1 196.3 35 230.7 51 103.988<strong>Annual</strong> <strong>Report</strong> <strong>2007</strong>
1 Specification of other financial assetsNOK million <strong>2007</strong>Receivables in connection with reverse repo 1 515.3Investment portfolio Nordben 3 338.1Total 4 853.42 Specification of other current liabilitiesNOK million <strong>2007</strong>Repo SPP 10 901.6Short positions 3 891.1Other current liabilities 6 406.1Total 21 198.822 Fair value of financial assets and liabilitiesNOK millionBalancesheet value<strong>2007</strong> 2006 2005Fair valueBalancesheet valueFair valueBalancesheet valueFair valueAssetsBank deposits 25 569.0 25 569.0 13 216.0 13 216.0 5 768.7 5 768.7Financial assets at fair value:Shares and other equity instruments 73 661.1 73 661.1 46 604.0 46 604.0 39 589.1 39 589.1Bonds and other fixed-income securities 112 025.6 112 025.6 50 782.7 50 782.7 57 539.3 57 539.3Derivatives 4 774.1 4 774.1 2 117.7 2 117.7 1 481.1 1 481.1Life insurance assets with investment choice 39 083.4 39 083.4 7 364.1 7 364.1 5 719.4 5 719.4Other financial assets 4 853.4 4 853.4Loans and receivables:Loans to and due from financial institutions, amortised cost 374.1 374.1 114.9 114.9 41.7 41.7Loans to customers, fair value 3 019.3 3 019.3 2 598.3 2 598.3 908.9 908.9Loans to customers, amortised cost 36 474.2 36 473.1 30 489.3 30 484.4 26 033.2 26 033.2Customer receivables and other short-term receivables 6 512.6 6 512.6 5 046.5 5 046.5 6 278.0 6 278.0Other bonds at amortised cost 12 919.7 12 447.8 13 176.5 13 086.4 9 259.5 9 898.9Bonds held to maturity 27 460.4 27 972.3 29 922.3 31 108.9 31 412.1 34 346.1Total assets 346 726.8 346 765.7 201 432.3 202 523.9 184 031.0 187 604.4Financial liabilities:Derivatives, trading 3 644.6 3 644.6 1 797.2 1 797.2 1 719.4 1 719.4Securities issued, fair value 1 118.9 1 118.9 1 196.0 1 196.0Securities issued, amortised cost 22 209.0 21 994.9 15 199.3 15 153.6 15 653.7 15 647.9Liabilities to financial institutions, amortised cost 3 064.5 3 034.7 2 786.0 2 786.0 1 464.6 1 464.4Deposits from banking customers, fair value 137.4 137.4Deposits from banking customers, amortised cost 17 332.2 17 332.2 13 533.7 13 532.8 11 187.0 11 187.0Other current liabilities 21 198.8 20 776.3 12 880.1 12 880.1 11 079.2 11 079.2Total other financial liabilities 68 705.4 68 039.0 47 392.3 47 345.7 41 103.9 41 097.9Subordinated loan capital, amortised cost 5 213.8 5 191.9 3 711.7 3 786.9 3 524.9 3 615.3Total financial liabilities 73 919.2 73 230.9 51 104.0 51 132.6 44 628.8 44 713.2<strong>Annual</strong> <strong>Report</strong> <strong>2007</strong>89
Notes <strong>Storebrand</strong> Group23 CollateralCollateral pledged and receivedNOK million <strong>2007</strong> 2006 2005Collateral for Futures trading -2 135.0 115.1 1 429.5Collateral pledged in connection with repo -9 386.3Received collateral for Security Lending Programme J.P. Morgan 758.4Received collateral for Security Lending Programme Handelsbanken 2 487.1Total contingent liabilities -8 275.8 115.1 1 429.5NOK million <strong>2007</strong> 2006 2005Booked value of bonds pledged as collateral for the bank's lending from Norges Bank 2 461.1 1 698.6 1 703.1Total 2 461.1 1 698.6 1 703.1Securities pledged as collateral are linked to lending access in Norges Bank for which, pursuant to the regulations, the loans must be fully guaranteedwith collateral in interest-bearing securities and/or the bank’s deposits in Norges Bank .<strong>Storebrand</strong> Bank ASA has a F loan for NOK 550 million in Norges Bank as per 31.12.<strong>2007</strong>.24 Contingent liabilitiesCollateral pledged and receivedNOK million <strong>2007</strong> 2006 2005Guarantees 378.6 290.2 237.1Uncalled residual liabilities concerning Limited Partnership 4 661.0 4 237.0 2 982.0Undrawn amounts of committed lending facilities 2 241.9 1 687.4 1 285.7Other liabilities 46.0Total contingent liabilities 7 327.5 6 214.6 4 504.8Guarantees principally concern payment guarantees and contract guarantees.Undrawn credit facilities concern granted and undrawn overdrafts and credit cards, as well as unused facility for credit loans secured by property.25 Stock lendingStock lendingNOK million Fair value <strong>2007</strong>Total stock lending 1 307.3Received collateral for Security Lending Programme J.P. Morgan 758.4Received collateral for Security Lending Programme Handelsbanken 2 487.1Received collateral reinvested in bonds 423.3Stock lending by countryNOK million Fair value <strong>2007</strong>UK 71.2Japan 321.5France 246.3Australia 100.2USA 393.9Spain 58.0Germany 24.7Other 91.6Total 1 307.390<strong>Annual</strong> <strong>Report</strong> <strong>2007</strong>
Gain/loss on fair value hedging: 2 <strong>2007</strong> 2006 2005Stock lending by currencyNOK million Fair value <strong>2007</strong>USD 424.7EUR 391.2JPY 321.5AUD 100.2GBP 28.7Other 41.1Total 1 307.326 Hedge accounting<strong>Storebrand</strong> Bank ASA<strong>Storebrand</strong> Bank uses fair value hedging to hedge interest rate risk. The effectiveness of hedging is monitored at the individual security level, except forstructured bond loans where effectiveness is monitored at the portfolio level. Each portfolio consists of swaps and hedged objects with maturity withinthe same six-month period.<strong>2007</strong> 2006 2005Contract/ Fair value 1 Contract/ Fair value 1 Contract/ Fair value 1nominalnominalnominalNOK million value Assets Liabilities value Assets Liabilities value Assets LiabilitiesInterest rate swaps 3 257.0 99.1 3 802.0 0.3 79.5 3 166.0 17.1 4.3Total interest rate derivatives 3 257.0 99.1 3 802.0 0.3 79.5 3 166.0 17.1 4.3Total derivatives 3 257.0 99.1 3 802.0 0.3 79.5 3 166.0 17.1 4.3<strong>2007</strong> 2006 2005Contract/ Hedging value 1, 3 Contract/ Hedging value 1, 3 Contract/ Hedging value 1, 3nominalnominalnominalMill. kroner value Assets Liabilities value Assets Liabilities value Assets LiabilitiesUnderliggende objekter 3 232.7 3 089.5 3 695.1 132.8 3 418.0 3 159.1 142.9 2 964.0Sikringseffektivitet – prospektiv 94% 111% 96% 81% 91%Sikringseffektivitet – retrospektiv 108% 116% 101% 87% 95%NOK million Gain/loss Gain/loss Gain/lossOn hedging instruments -24.1 -85.1 -57.9On items hedged 19.2 83.3 61.1123Book value at 31.12.Amounts are included in the accounts in the item “Net interest income”.Fair value for hedge accounting is calculated on the basis of the original spread, which takes into accounting amortisation, commission income and costs, as well as optioncosts in connection with structured products.Hedging effectiveness is measured on the basis of a 2% interest rate shock at the level of the individual security. In future periods, hedging effectivenesswill be measured using the simplified Dollar Offset method for calculating both prospective and retrospective effectiveness.<strong>Storebrand</strong> Life InsuranceIn <strong>2007</strong>, <strong>Storebrand</strong> used hedge accounting in connection with the acquisition of SPP. Cash flow hedging of the currency risk associated with <strong>Storebrand</strong>’sexpected acquisition of SPP amounting to SEK 16.4 billion was booked from 11 December. The hedge accounting ceased on 20 December when the transactionwas concluded. The spot element in forward exchange agreements was used as the hedging instrument and the effective share of the hedging instruments,amounting to NOK 20 million, which was recognised in equity during the hedging period, and upon the cessation of the hedge accounting chargedagainst equity and reduced goodwill.Cash flow hedging of the currency risk associated with <strong>Storebrand</strong>’s net investment in SPP of SEK 16.4 billion has been used since 20 December. The spotelement in forward exchange agreements has been used as the hedging instrument. The effective share of the hedging instruments recognised in equity in<strong>2007</strong> is NOK 160.8 million and the hedging efficiency is 100%. The hedging object has had an unrealised loss of NOK 186.4 million in the same period, suchthat the net amount recognised in equity in <strong>2007</strong> is NOK 25.6 million.<strong>Annual</strong> <strong>Report</strong> <strong>2007</strong>91
Notes <strong>Storebrand</strong> GroupMillionHedging instrumentNominalamount SEKBook valueNOKMaturity dateForward rate agreements 16 200.0 108.3 19.03.08The difference between the booked value of NOK 108.3 million and the amount of NOK 160.8 million included in the equity is due to an unrealised lossof NOK 52.5 million on the interest rate element during the whole period and the currency element during the period prior to using hedge accounting.27 Bonds at amortised costNOK millionNominalvalue<strong>2007</strong> 2006 2005Acquisitioncost Book value Fair value Book value Fair value Book value Fair valueBonds held to maturity 26 891.0 27 745.7 27 460.4 27 972.3 29 922.3 31 108.9 31 412.1 34 346.1Other bonds at amortised cost 12 886.8 12 930.4 12 919.7 12 447.8 13 176.5 13 086.4 9 259.5 9 898.9Total bonds 39 777.8 40 676.1 40 380.1 40 420.1 43 098.8 44 195.3 40 671.6 44 245.0Interest accrued but not due 1 102.6 1 216.0 1 115.0Total incl. interest accrued but not due 39 777.8 40 676.1 41 482.7 40 420.1 44 314.8 44 195.3 41 786.6 44 245.0Analysis by sector:Public sector 27 110.3 28 043.3 27 724.0 28 274.6 29 507.6 30 726.2 30 613.2 33 553.5Financial institutions 12 316.5 12 280.7 12 305.1 11 794.3 13 240.1 13 110.5 9 550.9 10 155.0Other issuers 351.0 352.1 351.0 351.2 351.1 358.6 507.4 536.5Total 39 777.8 40 676.1 40 380.1 40 420.1 43 098.8 44 195.3 40 671.6 44 245.0Modified duration 4.04 4.54 4.74Average effective yield 5.38 5.42 5.22 4.65 5.50 3.72The effective yield for each security is calculated using the booked value and the observed market price. Calculated effective yields are weighted to givean average effective yield on the basis of each security’s share of the total interest rate sensitivity. Sectoral allocation is based on the issuer.28 Shares and other equity investmentsNOK millionAcquisitioncost<strong>2007</strong> 2006 2005Fair valueFair valueincl. indirectinvestmentsin fundsFair valueFair valueincl. indirectinvestmentsin fundsFair valueFair valueincl. indirectinvestmentsin fundsListed shares Norway 5 682.6 6 404.5 6 357.9 6 567.0 6 618.6 8 266.0 8 307.0Listed shares within EEA 12 202.0 11 661.1 14 266.4 6 855.2 7 642.6 7 703.1 6 499.1Listed shares outside EEA 9 275.4 8 710.7 15 974.6 12 426.2 18 990.9 9 703.6 17 592.1Unlisted shares Norway 1 065.6 1 100.4 1 144.6 601.6 622.7 285.4 321.4Unlisted shares within EEA 1 103.9 1 390.3 1 390.3 158.3 164.1 274.3 274.7Unlisted shares outside EEA 1 043.6 1 087.1 1 087.1 1 040.5 1 040.9 80.5 116.7Fund units managed by SB Investments Norway 11 645.7 11 993.5 2 056.9 11 586.7 4 054.7 8 431.7 1 546.5Other fund units Norway 296.8 320.7 320.7 159.1 159.1 11.5 11.5Other fund units within EEA 13 364.6 12 945.2 13 015.0 2 773.3 2 874.4 2 022.5 2 109.6Other fund units outside EEA 17 888.5 18 047.6 18 047.6 4 435.9 4 435.9 2 810.5 2 810.5Total shares 73 568.6 73 661.1 73 661.1 46 604.0 46 604.0 39 589.1 39 589.192<strong>Annual</strong> <strong>Report</strong> <strong>2007</strong>
29 Bonds and other fixed-income securitiesNOK millionCommercialpaper Bonds Total Bond funds<strong>2007</strong> 2006 2005Securitylending,collateral,cashreinvestedin interestbearingsecuritiesTotal includingbondfundsTotalincludingbond fundsTotalincludingbond fundsCommercial paper,bonds and bond funds, fair value 12 920.2 97 862.5 110 782.8 819.5 423.3 112 025.6 50 782.7 57 539.3Of which listed 10 943.4 88 457.8 99 401.2 0.8 99 402.0 35 740.3 32 355.3Direct investmentsin bonds and commercial paper 12 920.3 97 862.5 110 782.7 51.2 423.3 111 257.2 49 638.2Indirect investments in commercial paper andbonds through funds managed by <strong>Storebrand</strong> 50.9 -1 872.3 -1 821.4 -1 821.4 -3 095.2Other indirect investments 729.4 729.4 827.9Interest accrued but not due 18.0 1 409.1 1 427.0 1 427.0 424.1Base amountfor analysis by sector and currency 12 989.2 97 399.2 110 388.4 780.6 423.3 111 592.3 47 795.1Public sector 6 362.6 45 858.0 52 220.6 60.9 52 281.5 13 611.7Financial institutions 3 778.0 27 285.3 31 063.3 719.7 423.3 32 206.3 25 113.1Other issuers 2 848.6 24 255.9 27 104.5 27 104.5 9 070.3Total 12 989.2 97 399.2 110 388.4 780.6 423.3 111 592.3 47 795.1NOK 3 173.9 24 779.0 27 952.9 69.5 28 022.4 24 167.2EUR 79.3 16 064.7 16 144.0 104.3 16 248.3 14 368.7USD 840.7 5 265.9 6 106.6 606.9 423.3 7 136.8 6 459.2DKK 145.2 145.2 145.2 145.7GBP 1 207.4 1 207.4 1 207.4 1 267.1CAD 409.1 409.1 409.1 298.2SEK 8 895.3 48 566.4 57 461.7 57 461.7 134.4JPY 820.9 820.9 820.9 808.7CHF 91.0 91.0 91.0 103.3AUD 49.6 49.6 49.6 42.6Total 12 989.2 97 399.2 110 388.4 780.6 423.3 111 592.3 47 795.1Norwegian activitiesModified duration 0.33 1.95 1.73Average effective yield 5.72 4.65 4.68Swedish activitiesModified duration 0.22 5.29 4.53Average effective yield 4.36 4.13 4.17The effective yield for each security is calculated using the observed market price.Calculated effective yields are weighted to give an average effective yield on the basis of each security’s share of the total interest rate sensitivity.<strong>Annual</strong> <strong>Report</strong> <strong>2007</strong>93
Notes <strong>Storebrand</strong> Group30 Assets in life insurance with investment choiceNOK millionFair value<strong>2007</strong> 2006 2005Equity funds 4 562.5 3 028.7 2 601.3Bond funds 326.4 127.0 119.1Money market funds 817.9 1 094.7 1 098.4Combination funds 20 087.1 2.0 1.6Units in investment portfolios 13 289.5 3 111.8 1 899.0Total 39 083.4 7 364.1 5 719.4The above amount includes investments in Portfolio Bond (Euroben Ltd., Ireland) of NOK 4,363.1 million.These assets will be transferred to Handelsbanken in 2008. The transfer is conditional on a licence.31 Financial derivativesNominal volumeFinancial derivative contracts are related to underlying amounts which are not capitalised in the balance sheet. In order to quantify a derivative position,reference is made to underlying concepts such as nominal principal, nominal volume, etc. Nominal volume is arrived at differently for different classes ofderivatives, and gives an indication of the size of the position and risk the derivative creates. Gross nominal volume principally indicates the size of theexposure, whilst net nominal volume gives an indication of the risk exposure. However nominal volume is not a measure which necessarily provides acomparison of the risk represented by different types of derivatives. Unlike gross nominal volume, the calculation of net nominal volume also takes intoaccount which direction of market risk exposure the instrument represents by differentiating between long (asset) positions and short (liability) positions.A long position in an equity derivative produces a gain in value if the share price increases. For interest rate derivatives, a long position produces a gain ifinterest rates fall, as is the case for bonds. A long position in a currency derivative produces a gain if the currency strengthens against the NOK.Figures for average gross nominal volume are based on daily calculations of gross nominal volume.NOK millionGross nom.volumeAveragenom. volumeNet nom.volumeFair valueEquity options 35 398.0 22 247.5 -6 580.7 1 798.5 317.7Equity index forwards 1 654.6Equity index futures 15 262.6 13 734.9 11 545.4 40.4 37.8Total equity derivatives <strong>2007</strong> 50 660.6 37 637.0 4 964.7 1 838.9 355.5Total equity derivatives 2006 25 039.7 22 516.6 -3 726.8 805.5 469.9Total equity derivatives 2005 22 654.1 18 937.4 -10 990.9 590.9 404.9Forward rate agreements 875 219.2 763 736.8 -128 917.3 240.2 193.8Interest rate futures 10 270.8 14 568.5 5 891.9 13.8 10.4Fair value – hedgingAsset Liability Asset LiabilityInterest rate swaps 155 435.4 136 658.6 79 062.1 1 324.5 2 090.6 91.2Interest rate options 31 772.6 31 014.8 28 279.5 82.8 26.7Total interest rate derivatives <strong>2007</strong> 1 072 698.0 945 978.7 -15 683.8 1 661.4 2 321.5 91.2Total interest rate derivatives 2006 595 134.4 600 119.3 123 821.2 735.1 856.8 0.3 79.5Total interest rate derivatives 2005 475 549.1 379 060.1 171 865.8 717.3 497.0 17.1 4.3Foreign exchange forwards 141 871.7 123 785.4 -43 748.5 1 221.0 875.9Currency optionsBasis swaps 301.2Total currency derivatives <strong>2007</strong> 141 871.7 124 086.6 -43 748.5 1 221.0 875.9Total currency derivatives 2006 69 480.5 63 525.2 -50 375.3 490.1 393.3Total currency derivatives 2005 59 108.1 55 370.2 -44 874.4 120.2 681.7Credit derivatives 13 224.3 16 769.3 4 986.3 52.8 91.8Total credit derivatives <strong>2007</strong> 13 224.3 16 769.3 4 986.3 52.8 91.8Total credit derivatives 2006 19 148.7 28 435.7 5 083.8 86.9 77.1Total credit derivatives 2005 31 329.8 22 444.3 2 658.1 72.4 128.4Total derivatives <strong>2007</strong> 1 278 454.6 1 124 471.6 -49 481.3 4 774.1 3 644.7 91.2Total derivatives 2006 708 803.3 714 596.8 74 802.9 2 117.7 1 797.2 0.3 79.5Total derivatives 2005 588 641.1 475 812.0 118 658.6 1 481.1 1 719.4 17.1 4.3Investments in credit derivatives relates only to indirect investments in securities funds managed by <strong>Storebrand</strong> Investments.The above table includes net positions in indirect investments.94<strong>Annual</strong> <strong>Report</strong> <strong>2007</strong>
32 Financial liabilitiesSubordinated loan capital<strong>2007</strong> 2006 2005NOK million Currency Interest rate in % Amount NOK Amount NOK Amount NOKPerpetual subordinated bond issue 2004 NOK 5,9% 108.8 108.5 108.1Perpetual subordinated bond issue 2004 NOK 3 months NIBOR + 1.5% 166.8 166.6 166.4Subordinated loan 2002-2012, call <strong>2007</strong> NOK 3 months NIBOR + 2% 100.0 100.0Subordinated loan 2003-2013, call 2008 NOK 3 months NIBOR + 2.25% 54.5 100.0 100.0Subordinated loan 2005-2015, call 2010 NOK 3 months NIBOR + 0.70% 175.0 175.0 175.0Subordinated loan 2006-2016, call 2011 NOK 3 months NIBOR + 0.57% 99.8 99.8Subordinated loan 2003-2023, call 2008 EUR 6 months EURIBOR + 2.2% 1 476.4 1 526.7 1 481.1Subordinated loan 2004-2014, call 2009 EUR 3 months EURIBOR + 0.9% 1 388.7 1 435.1 1 394.3Subordinated loan <strong>2007</strong> - 2017, call 2012 NOK 3 months NIBOR + 0.58% 249.6Subordinated loan <strong>2007</strong> - 2012, call 2012 NOK 3 months NIBOR + 1.65% 150.0Subordinated loan 2002, perpetual, period of notice 5 years SEK 3 months STIBOR + 2.0% 840.1Subordinated loan 2002, perpetual, period of notice 5 years SEK 3 months STIBOR + 2.0% 504.1Total 5 213.8 3 711.7 3 524.9Liabilities to financial institutionsNOK million <strong>2007</strong> 2006 2005Loans and deposits from credit institutions without notice or fixed term 2.9 8.9 76.5Loans and deposits from credit institutions with notice or fixed term 3 061.6 2 777.1 1 388.1Total 3 064.5 2 786.0 1 464.6Deposits from banking customersNOK million <strong>2007</strong> 2006 2005Corporate customers 7 447.0 5 578.0 4 524.2Retail customers 9 251.4 7 569.8 6 380.8International 771.2 385.9 282.0Total 17 469.6 13 533.7 11 187.0Liabilities created by issuing securitiesNOK million <strong>2007</strong> 2006 2005Commercial paper 4 474.6 3 727.8 4 465.2Bonds 18 853.2 12 667.5 11 188.5Total 23 327.9 16 395.3 15 653.7<strong>Annual</strong> <strong>Report</strong> <strong>2007</strong>95
Notes <strong>Storebrand</strong> GroupLiabilities created by issuing securities<strong>2007</strong>NOK million Nominal value Book valueOwn issued bonds:SEK FRN April <strong>2007</strong> – October 2009, 3 months STIBOR + 0.10 845.5 845.5EUR FRN May <strong>2007</strong> – November 2008, 3 months EURIBOR + 0.10 3 582.5 3 582.5NOK FRN June 2005 – June 2008, 3 months NIBOR + 0.12 1 500.0 1 500.2NOK FRN December 2003 – December 2008, 3 months NIBOR + 0.45 1 000.0 1 001.3NOK FRN January 2005 – January 2010, 3 months NIBOR + 0.19 1 500.0 1 501.7NOK Fixed rate November 2005 – November 2010, 4.25% 970.0 969.7NOK Fixed rate January 2006 – March 2009, 3.70% 1 053.0 1 047.5NOK Fixed rate January <strong>2007</strong> – June 2010, 5.00% 750.0 750.7NOK FRN August 2006 – August 2009, 3 months NIBOR + 0.06 1 220.0 1 219.7NOK – September 2009, 3 months NIBOR + 0.20 830.0 830.0NOK – September 2011, 3 months NIBOR + 0.30 750.0 749.6EUR – September 2008, 3 months EURIBOR + 0.55 4 609.8 4 588.8Total bonds issued 18 610.8 18 587.1Other bond issues (equity index bonds + hedge fund bonds) 1 594.6 1 522.0Total bonds 20 205.4 20 109.1Own bonds bought back 999.0 999.9Other bonds bought back (equity index bonds + hedge fund bonds) 255.8 247.2Total bonds bought back 1 254.8 1 247.1Accrued expenses -8.7Net holding of bonds 18 950.6 18 853.3Own commercial paper issued 4 947.0 4 944.5Commercial paper bought back 440.0 469.9Net holding of commercial paper 4 507.0 4 474.6Total holding of bonds and commercial paper 23 457.6 23 327.933 Further information on financial risk<strong>Storebrand</strong>General information<strong>Storebrand</strong> Life Insurance’s financial risk is principally associated with its ability to meet the annual return guarantee. This makes great demands on howthe capital is invested in different securities and assets, and how the company practises its risk management.The composition of the financial assets is determined by the company’s investment strategy. The investment strategy establishes guidelines for the compositionof financial assets through principles and limits for the company’s risk management. The investment strategy also includes limits and guidelinesfor credit and counterparty exposure, currency risk and the use of derivates. The objectives of this active risk management are to maintain good risk bearingcapacity and to continuously adapt the financial risk to the company’s financial strength. Given the risk the company is exposed to and with the aid ofthe risk management that is practised, the company expects to produce good returns, both in individual years and over time.Liquidity risk<strong>Storebrand</strong> has established good liquidity buffers in the group companies, and continuously monitors liquidity reserves against internal limits. Committedcredit lines from banks have also been established that the companies can draw on if necessary. <strong>Storebrand</strong> Bank manages its liquidity position on thebasis of a rolling liquidity gap and long-term funding indicators. The liquidity gap measures liquidity in excess of the minimum requirement over the next90 days. The minimum requirement takes into account all deposit maturities and an exceptional outflow of customer deposits at 25% annually. Long-termfunding indicators are calculated in accordance with the Kredittilsynet’s guidelines, and show the mismatch between expected future inward and outwardcash flows. <strong>Storebrand</strong> Life Insurance has NOK 11 billion invested in the money market and can therefore meet claims of an equivalent amount at shortnotice. In addition, the company has sizeable investments in bonds, equities and other liquid investments that can be liquidated if required.Market riskMarket risk relates to the risk that the value of the group’s assets might be reduced by unexpected and unfavourable movements in the market. At theclose of <strong>2007</strong>, <strong>Storebrand</strong> had sufficient risk capital to absorb a fall in market values equivalent to the company’s stress test. The stress test assumes96<strong>Annual</strong> <strong>Report</strong> <strong>2007</strong>
an unexpected simultaneous increase in interest rates of 1 percentage point internationally and 2 percentage points in Norway, combined with a sharpfall in share prices and property values. Market risk is monitored continuously using a range of statistical tools and tests. For instance, <strong>Storebrand</strong> uses‘Conditional Value at Risk’ as a method for calculating the potential for loss for the investment portfolio on a one-year horizon for a given probability.This method also takes into account the size of worst-case losses. <strong>Storebrand</strong> Life Insurance is contractually committed to guarantee an annual return forall its savings customers, currently around 3.5% on overage. The guaranteed annual return places particular demands on how the capital is invested indifferent securities and assets. Following the introduction of the new Insurance Activities Act, <strong>Storebrand</strong> Life Insurance’s company assets and customerassets have been spilt. The investment strategy and thus the market risk for the different sub-portfolios in <strong>Storebrand</strong> Life Insurance are tailored to therisk tolerances <strong>Storebrand</strong> Life Insurance applies to the various products, policies and the company’s primary capital. Given the current investment portfolio,the annual return will normally fluctuate between 2% and 11%. Smaller portions of the portfolio are invested in profiles with somewhat lower andsomewhat higher market risk. The share capital is invested such that it is exposed to a low level of risk, but is exposed to assets and instruments thatmean it can also keep pace with the growth in the customer funds due to returns and inflation. Active risk management and hedging transactions reducethe likelihood of a low investment return. If investment return is not sufficient to meet the guaranteed interest rate, the shortfall will be met by using riskcapital built up from previous surpluses. The owner is responsible for meeting any shortfall that cannot be covered from risk capital. The average guaranteedinterest rate is expected to fall in future years. New contracts include a guaranteed interest rate of 2.75%. Under current legislation and regulations,the technical insurance reserves that <strong>Storebrand</strong> Life Insurance is required to hold are not affected by changes in market interest rates. <strong>Storebrand</strong> Bankmanages its interest rate risk through swap agreements to minimise the effect of a change in interest rates on its deposits and lending. It is <strong>Storebrand</strong>’spolicy to fully hedge currency risks associated with international investments. Currency position limits are set for investment management to ensure effectivepractical implementation of currency hedging. Currency hedging is mainly carried out through rolling short-term forward foreign exchange contracts.Credit riskMaximum limits for credit exposure to individual debtors and for overall credit exposure to rating categories for <strong>Storebrand</strong> Life Insurance and other companiesin the group are set by the board. Particular attention is paid to ensuring diversification of credit exposure to avoid concentrating credit exposureon any particular debtors or sectors. <strong>Storebrand</strong> Investments monitors changes in the credit standing of debtors. <strong>Storebrand</strong> uses published credit ratingswherever possible, supplemented by the company’s own credit evaluation where there are no published ratings. All credit approvals by <strong>Storebrand</strong> Bankover a certain limit require the approval of a credit committee chaired by the bank’s managing director, or by the bank’s board of directors. Credit risk ismonitored through a risk classification system that ranks each customer by ability to pay, financial condition and collateral. The risk classification systemestimates the likelihood of a borrower defaulting (ability to pay/financial condition) and the likely loss given default (collateral). All loans on the bank’swatch list are reviewed at least quarterly in respect of the condition of the borrower and collateral, and of the steps being taken to protect the bank’sposition. Retail lending is assessed on the basis of credit scoring, combined with case-by-case evaluation of the borrower’s ability to repay. Lending isprincipally secured by charges over residential property or structured products.SPPGeneral informationIn the case of the Swedish activities in SPP the portfolio is divided into defined benefit pensions, defined contribution pensions and unit-linked policies.Both the defined benefit pensions and the defined contribution pensions in SPP have associated guarantees. This results in the generation of financialrisk in the event of falling stock markets and falling interest rates. In the case of some policies, a risk also arises from strongly rising interests rates. Dueto the somewhat more complex financial risk picture in SPP than in the Norwegian activities, the risk the customer portfolio represents against the equityis also managed through derivative transactions in SPP’s company portfolio. The investment strategy and risk management in SPP comprises three mainpillars. Asset allocation that results in a good return over time for customers and the owner, the continuous implementation of risk management measuresin the customer portfolios, and tailored hedging of certain selected insurance policies in the company’s portfolio.Financial riskIn traditional insurance with guaranteed interest, the insurance company bears the risk of the policyholder not achieving the guaranteed return on paidpremiums. If the total return exceeds the guaranteed yield, the return is allocated such that the policyholder receives 90 per cent and SPP 10 per cent.In the case of savings in unit-linked insurance, the policyholder accepts the entire financial risk, whereas in the case of asset management the companyis exposed to market risk, liquidity risk, credit risk and operational risk. Falling equity markets and falling interest rates in particular generate financial risksince these could result in a transfer of capital from the company’s equity to customers’ assets in the event of large market movements. If an insurancecontract with SPP has less earned capital than what is expected to be adequate given the applicable interest rate, an equity contribution is allocatedthat reflects this deficit. This allocation is recognised in the profit and loss account and called the net deferred capital contribution. SPP’s financial riskmanagement counters this effect by making investments that counter the changes in the net deferred capital contribution that could occur in differentscenarios. SPP uses financial derivatives in the company portfolio and the customer portfolio to achieve this. The company thus continuously carries outintegrated asset and liability management.Liquidity riskLiquidity risk is the risk that the company will not be able to meet its payment obligations when they fall due, or that the company will not be able to sellsecurities at acceptable prices. This risk is limited by a substantial part of the assets being invested in listed securities with good liquidity.Credit riskCredit risk is the risk that a counterparty is unable to meet his obligations. Creditworthiness is determined using both internal and external credit checks.Placements in fixed-income securities with a lower rating than “BBB” require the approval of the Board. The determination is made to avoid having toogreat a concentration on individual issuers. The group has framework agreements with all counterparties to reduce their risk with respect to outstandingderivative transactions. These regulate how collateral against changes in market values, calculated on a daily basis, should be pledged placed.Market riskMarket risk is the risk of price changes in the financial markets, i.e. the interest rate, currency, equity, commodity or property markets, affecting the valueof the company’s financial instruments. The company’s chief financial officer, in consultation with an allocation committee, continuously defines a referenceportfolio to manage the exposure to different market risks. Stress tests are continuously conducted using historical changes to assess the possibleeffects on the company’s capital base.<strong>Annual</strong> <strong>Report</strong> <strong>2007</strong>97
Notes <strong>Storebrand</strong> Group34 Credit riskAnalysis of credit risk by ratingShort-term holdings of interest-bearing securitiesCategory of issuer or guarantorNOK millionAAAFair valueAAFair valueAFair valueBBBFair valueNIGFair valueTotalFair valuePublic sector 25 003.1 3 032.5 4 234.6 141.9 5 848.9 38 261.0Financial institutions 1 902.0 8 235.5 9 261.2 10 058.6 1 434.9 30 892.1Other issuers 40 595.9 156.2 410.6 940.4 336.2 42 439.1Total <strong>2007</strong> 67 500.9 11 424.2 13 906.3 11 140.9 7 619.9 111 592.3Total 2006 17 046.7 3 921.2 17 951.1 6 869.8 1 178.3 46 967.2Total 2005 19 578.6 7 006.7 21 788.2 6 183.5 1 473.9 56 030.8Long-term holdings of interest-bearing securitiesCategory of issuer or guarantorNOK millionAAAAmortisedvalueAAAmortisedvalueAAmortisedvalueBBBAmortisedvalueNIGAmortisedvalueTotalAmortisedvaluePublic sector 31 953.4 1 334.1 2 032.8 35 320.3Financial institutions 1 692.0 3 441.3 1 029.1 6 162.4Total <strong>2007</strong> 33 645.4 4 775.4 2 032.8 1 029.1 41 482.7Total 2006 34 520.4 7 394.9 2 399.0 44 314.3Total 2005 30 366.3 9 264.0 1 041.3 40 671.6Rating classes are based on Standard & Poor’s ratings.NIG = Non-Investment GradeLending<strong>2007</strong> 2006 2005Risk groupNOK millionLendingUndrawncommittedfacilitiesGuaranteesTotalexposureWrite-downsof individualloansWritedownsofguaranteesGroupedwritedownsResidualexposureResidualexposureResidualexposureLow risk 37 675.2 2 238.1 373.0 40 286.3 -18.1 40 268.2 31 417.3 25 822.4Medium risk 1 246.6 10.8 2.0 1 259.4 -0.3 1 259.2 516.2 1 087.1High risk 188.7 1.1 3.2 193.0 -0.6 192.4 14.3 195.9Unclassified 239.7 1.3 0.4 241.4 241.4 2 939.7 335.2Not allocated -34.7 -34.7Loans in defaultand loss-exposed lending 448.3 448.3 -247.1 -4.4 196.9 173.8 357.0Total 39 798.6 2 251.3 378.6 42 428.5 -247.1 -58.0 42 123.4 35 061.2 27 797.6Grouped write-downs 58.1Individual write-downs 247.1Book valueof lending at 31.12.07 39 493.5NOK million <strong>2007</strong> 2006 2005Loans in defaultLoans in default without identified impairment 151.2 109.0 112.9Loans in default and loss-exposed loans with identified impairment 297.2 423.7 641.1Gross loans in default 448.3 532.7 754.0Individual write-downs 247.1 360.0 389.6Net loans in default 201.3 172.7 364.498<strong>Annual</strong> <strong>Report</strong> <strong>2007</strong>
Fair value of loans in default and loans past maturity not written down in <strong>Storebrand</strong> Bank ASANOK millionLoans pastmaturitynot writtendown,overdue30–90 daysLoans in defaultwithoutidentifiedimpairment,overduemore than90 daysLoans withidentifiedimpairment,overduemore than90 daysTotal grossloans indefault andloans pastmaturitynot writtendownIndividualwrite-downsFair valueloans indefault andloans pastmaturitynot writtendown <strong>2007</strong>Fair valueloans indefault andloans pastmaturitynot writtendown 2006Fair valueloans indefault andloans pastmaturitynot writtendown 2005Wage-earners 281.5 140.0 178.3 599.7 -136.1 463.7 353.7 233.9Commercial services and realestate operations 79.1 10.3 62.7 152.1 -26.2 125.9 153.7 112Others 9.9 0.9 104.1 114.9 -84.8 30.1 21.4 18.5Total 370.5 151.2 345.1 866.7 -247.1 619.6 528.8 364.4Analysis of net lendingNOK million <strong>2007</strong> 2006 2005Analysis by sector and industry:Commercial services and real estate operations 13 687.5 12 253.2 9 013.1Retail customers 25 617.5 20 400.0 17 295.4Others 188.5 434.0 633.6Total 39 493.5 33 087.2 26 942.135 Liquidity riskAmounts reported include accrued interestResidual contractual period for financial assetsNOK millionNocontractualmaturity dateUp to 1monthLeading to financial institutions 374,11–3months3 months–1 year 1–5 yearsMore than5 years Total valueLending to customers -42.6 2 268.6 198.2 1 502.3 3 197.4 32 388.3 39 512.3Bonds at amortised cost 829.9 1 159.6 20 339.4 19 153.8 41 482.7Bonds and other fixed-income securities 1 3 715.5 2 363.7 8 335.0 8 163.2 45 804.4 43 210.6 111 592.3Fixed-term deposits 98.2 98.2Derivatives 2 1 374.7 -7.9 72.6 311.6 -584.6 1 166.5Total <strong>2007</strong> 3 672.9 6 479.3 9 355.2 10 897.6 69 652.8 94 168.2 194 226.0Total 2006 414.6 5 210.2 3 720.6 6 362.2 38 513.5 73 326.6 127 547.8Total 2005 4 622.2 4 404.6 15 224.0 37 613.4 65 164.0 127 028.2Residual contractual period for financial liabilitiesNOK millionNocontractualmaturity dateUp to 1month1–3months3 months–1 year 1–5 yearsMore than5 years Total valueSubordinated loan capital 4 225.8 54.5 933.5 5 213.8Liabilities to credit institutions 653.0 100.0 318.4 1 993.2 3 064.5Deposits from banking customers 15 544.0 1 471.9 268.8 182.6 2.3 17 469.6Securities issued 650.0 8 304.5 5 767.8 8 605.7 23 327.9Total <strong>2007</strong> 4 225.8 16 901.5 9 876.4 6 036.6 9 106.7 2 929.0 49 075.8Total 2006 14 504.2 974.1 4 941.3 11 684.6 4 322.6 36 426.7Total 2005 11 208.5 1 398.7 5 153.2 8 615.7 5 454.0 31 830.01 Bonds and other fixed-income securities without contractual maturity dates consist of bond funds, security lending collateral reinvested in interest-bearing securities andbonds in Nordben Life and Pension Insurance Co. Ltd.2 In this note, derivatives are presented net.Residual contractual period provides only limited information on the company’s liquidity risk since the majority of investment assets can be realised in thesecondary market earlier than expiry of the contractual period.Other short term liabilities of NOK 21.2 billion are due within one year.<strong>Annual</strong> <strong>Report</strong> <strong>2007</strong>99
Notes <strong>Storebrand</strong> Group36 Interest rate riskPeriod to next interest rate fixing for financial assetsNOK millionNocontractualmaturity dateUp to 1month1–3months3 months–1 year 1–5 yearsMore than5 years Total valueLeading to financial institutions 374.1 374.1Lending to customers 1 36 002.7 787.0 1 659.9 521.3 410.7 130.6 39 512.3Bonds at amortised cost 829.9 1 159.6 20 381.5 19 111.8 41 482.7Bonds and other fixed-income securities 2 3 715.5 10 240.6 28 364.4 6 982.9 27 034.2 35 254.7 111 592.3Fixed-term deposits 98.2 98.2Derivatives 3 1 075.0 -548.6 -14 157.2 2 040.4 8 952.8 3 804.0 1 166.5Total <strong>2007</strong> 40 793.2 10 951.3 16 697.0 10 704.2 56 779.2 58 301.2 194 226.0Total 2006 30 670.9 7 785.8 6 464.8 10 611.9 30 735.6 41 278.9 127 547.8Total 2005 7 674.6 39 344.9 15 667.7 24 119.7 40 221.3 127 028.21 Deposits and lending with no contractual fixed interest rate period are classified in this column according to the guidelines for reporting public bank statistics.2 Bonds and other fixed-income securities without no contractual fixed interest rate period consist of bond funds, security lending collateral reinvested in interest-bearing securitiesand bonds in Nordben Life and Pension Insurance Co. Ltd.3 In this note, derivatives are presented netPeriod to next interest rate fixing for financial liabilitiesNOK millionNocontractualmaturity dateUp to 1month1–3months3 months–1 year 1–5 yearsMore than5 years Total valueSubordinated loan capital 397.5 4 709.3 107.0 5 213.8Liabilities to financial institutions 652.9 2 411.6 3 064.5Deposits from banking customers 14 738.4 831.5 1 543.5 173.6 182.6 17 469.6Securities issued 7 586.0 11 148.3 3 654.4 939.3 23 327.9Total <strong>2007</strong> 14 738.4 9 467.9 19 812.6 3 935.0 1 121.9 49 075.8Total 2006 13 202.1 3 454.9 8 113.2 8 653.7 3 002.7 36 426.7Total 2005 12 680.3 7 758.7 5 010.9 1 935.2 4 444.9 31 830.0Other short term liabilities of NOK 21.2 billion have fixed interest rates that expire within one year.Interest rate sensitivityNOK millionNocontractualmaturity dateUp to 1month1–3months3 months–1 year 1–5 yearsMore than5 years Total valueShort-term holdings of financial assetsAUD 1.7 -0.1 -0.7 -1.1 -0.2CAD 0.2 0.9 -0.9 -2.8 -17.0 -19.6CHF -0.1 -0.1EUR 2.7 13.7 -29.4 -225.7 -202.3 -441.0GBP 0.5 5.6 -0.4 -14.1 -70.8 -79.2JPY 0.5 4.9 -12.1 -88.1 -94.8NOK 0.4 -39.7 -36.9 20.1 -41.0 -548.3 -645.4SEK -1.0 -10.1 -18.6 -587.4 -2 726.7 -3 343.8USD 3.5 26.9 -6.3 -38.9 -113.9 -128.7Other currencies 0.4 3.3 -0.5 -3.7 -6.4 -6.9Total short-term holdings of financial assets 0.4 -32.9 9.9 -36.2 -926.4 -3 774.6 -4 759.7Long-term holdings of financial assetsEUR 2.6 2.6NOK 6.2 -9.1 -627.1 -1 041.1 -1 671.1SEK -15.1 -15.1Total long-term holdings of financial assets 2.6 -8.9 -9.1 -627.1 -1 041.1 -1 683.5Total quantified interest rate sensitivity <strong>2007</strong> 0.4 -30.2 1.1 -45.3 -1 553.5 -4 815.7 -6 443.2Total quantified interest rate sensitivity 2006 -5.6 1.6 -65.8 -557.0 -2 780.9 -3 407.7Total quantified interest rate sensitivity 2005 -10.9 -21.0 -244.1 -380.2 -2 814.4 -3 470.5100<strong>Annual</strong> <strong>Report</strong> <strong>2007</strong>
Interest rate sensitivity is a measure of interest rate risk based on how changes in interest rates will affect the market value of bonds, interest rate derivativesand other interest rate sensitive financial items. This summary shows how the values of financial current assets and financial fixed assets (bondsheld to maturity) at 31 December <strong>2007</strong> would be affected by an increase of 1 percentage point in all interest rates. <strong>Storebrand</strong> creates interest ratepositions through its assets in order to partly offset the interest rate risk implicit in the company’s insurance obligations. However, the interest rate riskrepresented by insurance policies cannot be calculated and quantified in the same way as interest rate risk for financial items.37 Currency riskFinancial assets and liabilities in foreign currencyNOK millionBalance sheetitems excl. currencyderivatives Currency forwards Net positionNet balancesheet value Net sales in currency in NOK Of which SPP in NOKAUD 156.5 -150.6 5.9 28.3CAD 219.9 -209.6 10.3 56.6CHF 222.6 -198.2 24.4 116.7 81.9DKK 328.2 -297.4 30.9 32.9 3.0EUR 2 708.7 -2 446.1 262.5 2 083.5 1 827.7GBP 408.5 -367.7 40.8 442.1 56.7HKD 441.9 -405.4 36.5 25.4 3.0JPY 86 892.8 -73 278.8 13 614.1 658.7 611.5SEK 71 417.6 12 304.8 83 722.4 70 337.2 70 333.9USD 5 966.4 -5 138.7 827.9 4 497.9 3 923.3ZAR 1.7 1.7 1.3 1.3Other 27.6 5.9Total short-term foreign currency 78 308.1 76 848.2EUR -920.2 941.5 21.3 178.3SEK 16 508.7 -16 055.6 453.1 380.7Other 14.0 -14.0 0.3Total long-termforeign currency – financial 559.3Insurance liabilities SPP – SEK -130 365.1 -109 522.9 -109 522.9Total long-term foreign currency -108 963.6 -109 522.9Total net currency position <strong>2007</strong> -30 655.5 -32 674.7Total net currency position 2006 727.6Total net currency position 2005 869.8The group actively hedges the major part of its foreign currency risk. Currency risk arises from investments in international securities, and to a lesserextent from subordinated loans denominated in foreign currencies. Currency risk is hedged through forward foreign exchange contracts at the portfoliolevel, and currency positions are regularly monitored within specified total limits Short positions are closed no later than the business day following thedate on which they arise. In addition, there are separate limits for creating active currency positions. These positions are included in the note relatingto short-term debt instruments and bonds. The currency positions outstanding at 31 December <strong>2007</strong> are typical of the group’s small limits for currencypositions.SPPSPP practices currency hedging to a certain extent with respect to its international investments. In the case of equities the currency hedging will bebetween 50% and 100%, and for other classes actively hedges the major part of its foreign currency risk.<strong>Annual</strong> <strong>Report</strong> <strong>2007</strong>101
Notes <strong>Storebrand</strong> Group38 Technical insurance informationTechnical insurance reservesSpecification of balance sheet items in respect of life insurance and non-life insurance:NOK millionGrouppensioninsuranceprivatesectorGrouppensioninsurancepublicsectorGrouplifeinsuranceIndividualendowmentinsuranceIndividualannuity/pensioninsuranceP&CinsuranceSPP groupandNordbenLife &PensionReinsurers' share of technicalinsurance reserves 1 501.3 1 501.3 1 828.3 2 401.9Receivables in respect ofinsurance policies 2.0 2.0 0.3 32.1 36.4 64.9 69.1Total assets 2.0 2.0 0.0 0.3 0.0 1 533.4 0.0 1 537.7 1 868.8 2 459.4Premium reserve 97 752.7 16 139.8 430.3 14 691.8 23 039.0 100 712.2 252 765.8 140 506.8 129 737.5- of which RBNS 251.7 66.3 39.2 19.0 7.5 383.7 376.5 132.9- of which IBNR 7.9 2.1 188.0 21.7 20.0 239.7 217.2 163.0- of which premiumincome received in advance 676.8 0.1 52.0 17.8 61.8 808.5 807.9 780.6Additional statutory reserves 3 948.7 449.9 369.6 989.1 5 757.3 5 550.6 4 537.5Pensioners' surplus reserve 62.9 62.9 280.0 215.0Premiumeserve/deposit reserve 5 433.6 886.0 180.6 6 500.2 6 668.4 5 357.0Other technical reserves 13 699.4 13 699.4Claims reserve 46.1 12.7 172.9 210.3 14.3 1 513.5 1 969.8 382.6 334.9- of which RBNS 45.3 12.5 136.4 104.5 4.3 303.0 231.4 174.1- of which IBNR 0.8 0.2 36.5 105.8 10.0 153.3 150.5 160.8Security reserve – life insurance 131.7 23.0 19.8 14.0 8.9 197.4 179.0 159.2Total reserves – life insurance 107 375.7 17 511.4 623.0 15 285.7 24 231.9 0.0 115 925.2 280 952.9 153 567.4 140 341.1Premium and claims reserves– non-life 1 998.8 1 998.8 2 297.3 2 998.5Security reserve etc. – non-life 31.8 31.8 40.9 40.7Total reserves – non-life 0.0 0.0 0.0 0.0 0.0 2 030.6 0.0 2 030.6 2 338.2 3 039.2Insurancefund reserves <strong>2007</strong> 107 375.7 17 511.4 623.0 15 285.7 24 231.9 2 030.6 282 983.4Insurancefund reserves 2006 95 306.0 15 555.0 522.8 17 325.5 24 858.1 2 309.6 155 905.6Insurancefund reserves 2005 86 778.0 9 723.1 816.4 20 015.0 24 420.0 3 089.5 143 380.3Provisions after applicationof sufficiency test 0.0 0.0 0.0Reinsurance liabilities 61.4 31.6 2.1 42.5 137.6 122.2 188.5Insurance liabilities <strong>2007</strong> 107 437.1 17 511.4 654.6 15 287.8 24 231.9 2 073.1 283 121.0Insurance liabilities 2006 95 352.1 15 555.0 561.3 17 323.5 24 858.1 2 386.3 156 027.8Insurance liabilities 2005 86 810.5 9 723.1 851.5 20 017.4 24 420.1 3 165.3 143 568.8Life insurance:The item ‘Reserves – life insurance’ includes NOK 7.9 billion that the company assumes will be paid as claims or benefits (excluding repurchase andpayment) in 2008 by <strong>Storebrand</strong> Livsforsikring AS and 3.6 billion by SPP.P&C insurance:The item ‘Reinsurers’ share of technical insurance reserves’ includes NOK 365 million that the company assumes will fall due in 2008. The item ‘Reserves– P&C insurance’ includes NOK 287 million that the company assumes will fall due in 2008.Totalgroup<strong>2007</strong>Total2006Total2005102<strong>Annual</strong> <strong>Report</strong> <strong>2007</strong>
Changes in insurance liabilities – life insuranceInsurance liabilitiesNOK millionPremiumreserveReservefor UnitLinkedPremiumreserveDepositreserveAdditionalstatutoryreserves<strong>2007</strong> 2006 2005Securityreserve<strong>Storebrand</strong><strong>2007</strong>SPP groupandNordbenLife &Pension<strong>Storebrand</strong>group<strong>2007</strong> Total TotalBalance at 1.1. 133 700.9 7 364.1 6 772.8 5 550.7 179.0 153 567.5 153 567.5 140 341.1 125 594.8+ Gross premium income 17 283.0 2 497.7 140.3 19 921.0 19 921.0 19 772.8 19 379.2- Gross claims -15 922.4 -1 283.7 -1 725.0 -178.7 -19 109.8 -19 109.8 -14 774.9 -11 894.7+ Guaranteed interestrate/unit linked return 5 570.1 353.4 157.6 6 081.1 6 081.1 5 605.1 5 447.0- Administrationcontribution -1 083.2 -82.1 -1 165.3 -1 165.3 -1 086.0 -1 017.9- Risk result -369.2 -1.2 -17.3 -387.7 -387.7 -302.3 -453.4+/- Transfers and additionsto reserves 3 477.8 80.6 -115.7 -137.7 3 305.0 3 305.0 17.7+ Share of profit 1 232.0 1 165.5 400.0 18.4 2 815.9 2 815.9 3 994.0 3 286.1Acquired business 115 925.2 115 925.2Balance at 31.12. 143 889.0 8 928.8 6 255.2 5 757.3 197.4 165 027.7 115 925.2 280 952.9 153 567.5 140 341.1Market value adjustment reserveNOK million <strong>2007</strong> 2006 2005 Change <strong>2007</strong> Change 2006 Change 2005Equities 4 365.7 6 150.7 3 639.0 -1 785.0 2 511.7 1 502.1Interest bearing -512.0 -261.0 223.5 -251.0 -484.4 -352.0Gains/losses/write-downs – current assets 3 853.7 5 889.7 3 862.5 -2 036.0 2 027.3 1 150.1Gains/losses – bonds held to maturity 1 40.0 1 096.6 3 573.4 -1 056.6 -2 476.8 -639.0Total 3 893.7 6 986.3 7 435.9 -3 092.6 -449.6 511.21Unrealised gains on hold to maturity bonds are not included in the accounts.Changes in insurance liabilities – P&C insuranceNOK million <strong>2007</strong> 2006 2005Reinsurers’ share of technical insurance reservesBalance at 01.01. 1 828.3 2 390.3 2 804.9Change in premium and claims reserves -327.1 -555.5 -426.8Currency movements 0.1 -6.6 25.2Other changes -1.4Balance at 31.12. 1 501.3 1 828.3 2 401.9Insurance liabilitiesBalance at 01.01. 2 338.2 2 870.3 3 399.9Change in premium and claims reserves -252.0 -522.2 -413.2Change in security reserve -6.3 5.6 -0.5Currency movements -49.4 -15.5 52.6Other changes 0.4Balance at 31.12. 2 030.6 2 338.2 3 039.2In Autumn 2006, <strong>Storebrand</strong> relaunched sales of P&C insurance products to the Norwegian retail market. Premium and claims reserves for own accountfor the newly established P&C business amounted to NOK 82 million at the close of <strong>2007</strong>.The major part of insurance liabilities at year-end relate to the run-off business of Oslo Reinsurance Company and <strong>Storebrand</strong> Skadeforsikring. Premium,and claims reserves for 2005 include NOK 169 million in respect of Fair Forsikring, which was sold in 2006.<strong>Annual</strong> <strong>Report</strong> <strong>2007</strong>103
Notes <strong>Storebrand</strong> GroupProfit and loss account items:Analysis of net premium incomeNOK million <strong>2007</strong> 2006 2005Group pension insurance – private sector 10 512 8 486 6 929Group pension insurance – public sector 2 585 5 812 1 867Group life insurance 538 496 467Individual endowment insurance 4 197 3 486 8 547Individual annuity and pension insurance 1 584 980 1 226P&C insurance 328 280 347Total 19 744 19 539 19 383Life insurance – profit sharing between policyholders and the owner<strong>Storebrand</strong> Life Insurance offers both products subject to profit sharing with policyholders and products not subject to profit sharing. Products not subjectto profit-sharing are defined contribution pensions, personal insurance policies with investment choice, group life insurance, annual risk policies (includingnon-life cover) in the life account, and annual policies in connection with group pension insurance that do not include entitlement to paid-up value. Theprofit or loss earned on these products is entirely for the account of the owner.For products subject to profit sharing, the profit is in principle allocated between policyholders and the owner in accordance with the company’s internalprofit-sharing model. The profit to the owner is made of three elements: net return on the company’s equity, a return of up to 0.40 per cent of policyholders’funds (subject to investment return being sufficiently higher than the guaranteed return to permit this) and a risk margin of 12 per cent of actualrisk premium (subject to the risk surplus being sufficient to permit this). Under current legislation, the owner’s share of profit cannot exceed 35 per cent.The proportion of profit allocated to each customer is determined on the basis of the contribution the customer’s policies have made to the total profitavailable for sharing. The amount allocated to the individual customer therefore depends on the product group(s) to which the customer’s policy/policiesbelongs.For individual endowment insurance (life account) policies, profit allocations are accumulated on each policy and are paid out together with the sumassured. In the cases of traditional individual endowment insurance and individual annuity and pension insurance, the profit allocated is applied toincreasing the insured benefit. Individual policies based on group schemes are handled in an equivalent manner. In the case of group pension insurance,the profit allocated is credited to the surplus on the scheme’s premium reserve and pensioners’ surplus reserve in accordance with the legislation on occupationalpensions.Profit-sharing modelNOK million <strong>2007</strong> 2006 2005- net return on the company’s equity 1 672 579 491- 0.40 per cent of policyholders' funds 613 567 521- equity servicing risk 50 49 47- products not subject to profit-sharing 100 58 159- other 187 -62 5Profit to owner 1 622 1 191 1 2241Includes security reserve, subordinated loan capital, book equity and liability itemsIn the short-term the company has built up the level of additional statutory reserves to an amount equivalent to the guaranteed return for one year,which corresponds to the short-term target. On 21 January 2008, the Ministry of Finance circulated proposed amendments to the regulations for comment.These permit differentiated allocation to additional statutory reserves such that policies without additional statutory reserves can be built up to 1per cent of the premium reserve without other policies needing to build up additional statutory reserves. <strong>Storebrand</strong> assumes that this limit may be raisedto 2 per cent as a result of the comments process and has suggested that NOK 325 million be allocated in order to build up policies with lower statutoryadditional reserves to a level of a minimum of 2 per cent of the premium reserve, in addition it is proposed that NOK 75 million be allocated and distributedover all policies. If the limit is not raised to 2 per cent, the excess allocation will also be distributed over all policies. The additional statutory reservespursuant to this would amount to NOK 5,757 million, or around 4.0 per cent of the premium reserve.104<strong>Annual</strong> <strong>Report</strong> <strong>2007</strong>
Risk exposure/sensitivity<strong>Storebrand</strong> Life InsuranceThe following table shows the net annual risk premium for the most common types of cover. The premiums apply to persons of normal health and risk.Mortality and disabilityNet annual risk premium for a sum assured of NOK 100,000.In the case of disability pension policies, the premium shown is for an annual disability pension of NOK 10,000 paid until 67 years of age.MenWomen30 years 45 years 60 years 30 years 45 years 60 yearsLife cover, individual endowment insurance 122 324 1 416 61 162 711Disability lump sum, individual 273 590 352 1 367Disability pension, individual 248 639 1 975 371 1 577 2 490Critical illness, non-smoker, individual 171 515 1 804 171 515 1 804Life cover, group life insurance 55 146 821 33 88 493Life cover, group pension insurance 48 146 743 23 77 403Disability pension, group pension 511 734 642 1 029 1 386 878Tariffs for group life insurance and certain risk insurances within group pensions also depend on industry/occupation in addition to age and gender. Grouplife insurance also applies tariffs based on claims experience.For individual insurance, the premiums for life and accident cover are based on tariffs produced by insurance companies on the basis of their sharedexperience: namely T1984 for endowment insurance and R1963 for pensions insurance. Disability premiums are based on the company’s own experience,and were last amended in 2002.The company’s standard tariff for group life insurance, both for life and disability cover, is based on the company’s own experience and was last amendedin 2003.Premiums for group pension insurance follow the new industry tariff K2005 with security margins that take into account the reduction in mortality amongpolicyholders observed in recent years. Premiums for disability pensions are based on the company’s own experience. Expense premiums are determinedannually with a view to securing full cover for the next year’s expected costs.The company’s tariffs do not involve any assumptions about inflation or voluntary termination/transfers.Basic interest rateKredittilsynet sets the highest basic interest rate permitted for new policies and for new members/new accrual of benefits in group pension insurance.The highest basic interest rate for new policies was set at 3 per cent in 1993 and subsequently reduced in 2005 to 2.75 per cent for policies entered intoafter 1 January 2006. The highest basic interest rate for new members/new accrual of benefits in group pension insurance was reduced from 4 per centto 3 per cent with effect from renewals in 2004.The following table shows the proportions of insurance fund reserves at 31 December <strong>2007</strong> relating to policies with various basic annual interest rates:Guaranteed interest rate <strong>2007</strong> 2006 20056% 0.6% 0.7% 0.8%5% 0.8% 0.9% 1.1%4% 58.8% 61.0% 66.2%3,4% 4.5% 4.9% 4.6%3% 28.2% 27.2% 23.4%2,75% 2.7% 0.9% 0.0%0% 4.4% 4.4% 3.9%The above table includes the premium reserve, deposit reserve and pensioners’ surplus reserve with 3 per cent and additional statutory reserves with 0%.The total average guaranteed interest rate for all lines of insurance has decreased from 3.83 per cent in 2000 to 3.52 per cent in <strong>2007</strong>. The guaranteedinterest rate must be delivered on an annual basis. If the company’s investment return in a year is lower than the guaranteed interest rate, current legislationpermits the equivalent of up to one year’s guaranteed return for the individual policy to be covered by transfers from the policy’s additional statutoryreserves. Any negative return must be met from the company’s equity.Average guaranteed interest rate <strong>2007</strong> 2006 2005Individual endowment insurance 3.1% 3.2% 3.2%Individual pension insurance 3.6% 3.6% 3.7%Group pension insurance 3.6% 3.6% 3.7%Group life insurance 0.7% 0.8% 0.9%P&C insurance 0.0% 0.0% 0.0%Total 3.52% 3.57% 3.64%<strong>Annual</strong> <strong>Report</strong> <strong>2007</strong>105
Notes <strong>Storebrand</strong> GroupNew business written in <strong>2007</strong> is subject to a 2.75 per cent basic interest rate. In the case of policies transferred to the company, the basic interest rate isdetermined by the rate applied to the policy by the insurance company from which the business is transferred, subject to a maximum of 4 per cent.Premiums and reserves for pension entitlements earned in <strong>2007</strong> in group pension insurance are calculated on the basis of a 3 per cent basic interest rate.Insurance risk:Most of the company’s lines of insurance include cover for disability through either a disability pension, exemptions from premiums or one-off payments.Individual policies and group life policies also include life cover. Group pension insurance also provides widow or widower’s pensions with payment commencingon the death of the insured.Changes to the rules for payment from the national social security scheme for disability benefits etc. may have a significant effect on insurance companiesin terms of the number of claims for disability and disability reserves. This currently relates principally to group pension insurance for the publicsector, where insurance benefits are fully linked to national social security scheme benefits. Future changes to occupational pensions legislation may alsocause changes in this respect for private sector occupational pensions. The premium tariffs will normally be amended to take account of such changes.In terms of death benefits, increasing life expectancy will affect future expected payments and reserves, although reserves are currently considered to besufficient.Right to transfer insurance between companies:The right to transfer insurance between companies, subject to two months’ notice for policies where the transfer value exceeds NOK 300 million, canrepresent a liquidity risk for smaller life insurance companies if one or more customers elect to transfer large policies to other companies in the space ofa short time. The fee that can be charged for transfers is limited to NOK 5,000. For large insurance companies, if transfers out exceed transfers in for anextended period, this will have an adverse effect on future cash flow.Risk management – <strong>Storebrand</strong> Life Insurance:Evaluation of insurance risk (underwriting):When writing individual risk cover, the customer is subject to a health check. The result of the health check is reflected in the level of the premium quoted.When arranging group policies with risk cover, all employees of small companies are subject to a health check, while for companies with a substantialnumber of employees <strong>Storebrand</strong> requires declarations of fitness for work. Underwriting also takes into account the company’s industrial category, sectorand sickness record.Control and monitoring of insurance risk:Insurance risk is separately monitored for every line of insurance in the current insurance portfolio. The risk result for each product group is broken downinto the elements of death, accident and disability. The development of risk result is followed throughout the year. For each type of risk, the ordinary riskresult for a period represents the difference between the risk premiums the company has collected for the period and the sum of provisions and paymentsthat must be made for insured events that occur in the period. The risk result takes into account insured events that have not yet been reportedbut which the company, on the basis of its experience, assumes have occurred.Reinsurance:The company also manages its insurance risk through a variety of reinsurance programs. Through catastrophe reinsurance (excess of loss) the companycovers losses (single claims and reserves provision) where a single event causes more than 3 deaths or disability. This cover is also subject to an upperlimit. Surplus reinsurance on life policies covers death and disability risk that exceeds the maximum risk amount for own account the company is permittedto carry by its articles of association. The company’s maximum risk amount for own account is relatively high, and the risk reassured is thereforerelatively modest. The company’s risk within workmen’s compensation insurance is covered by both quota reinsurance and “excess of loss” cover purchasedby the company. In connection with the relaunch of P&C insurance, the company purchased “excess of loss” cover for unlimited liability for motorinsurance and included travel insurance in the catastrophe reinsurance cover.Sufficiency test:<strong>Storebrand</strong> is required by IFRS 4 to carry out a sufficiency test to ensure that the company has sufficient margins in the various constituent elements thatmake up the company’s reserves. IFRS permits two alternative methods for the sufficiency test. Where a company has an established form of analysisthat demonstrate the margins in the various constituent elements, Section 16 of the standard allows this analysis to continue to be used to demonstratethat the test is satisfied. Where a company has not established such analysis, it is required to discount future cash flows to present value in accordancewith IAS37.In <strong>2007</strong>, <strong>Storebrand</strong> continued its existing practice from the year before and conducted a test pursuant to Section 16. The required analysis is carried outon the basis of Norwegian principles for premium reserves and applies conservative calculation elements. The established form of analysis is based onthe assumptions used for the calculation of Embedded Value in which we use the best estimates for the future base elements based on current experience.The sufficiency test is carried out by analysing the current margins between the assumptions used for setting reserves and the assumptions in theEmbedded Value analysis.<strong>Storebrand</strong> satisfies the test, as it did in 2006. The test has no profit and loss account effects on the <strong>2007</strong> accounts.Property and casualty insurancePremiums written by the newly established P&C business in <strong>2007</strong> totalled NOK 118.2 million. Of this, the premium earned was NOK 66.6 million and thecost of claims in <strong>2007</strong> was NOK 46.0 million. No premiums were received in respect of the run-off business which is 100 per cent reinsured by If.Risk exposure and insurance risk – <strong>Storebrand</strong> Skadeforsikring ASThe main risk for the newly established P&C business is that it will initially have a small portfolio to absorb claims. This can mean that single largeclaims may have a disproportionate impact on profit. The largest claims will typically arise from liability and motor insurance. In order to offset this risk,<strong>Storebrand</strong> has arranged reinsurance with a deductible of NOK 5 million per loss and unlimited capacity. In addition, the risk exposure arising from travelinsurance may increase sharply in the event of possible catastrophes such as the tsunami in South East Asia in 2004. Travel insurance is therefore nowalso included in the group’s catastrophe reinsurance. We will monitor this portfolio carefully in 2008, and may consider laying off cumulative risk withreinsurers. In 2008, XL cover has been taken out that is intended to cover claims in all sectors apart from liability. This involves an excess amount of NOK5 million. The cover has a capacity of NOK 25 million.106<strong>Annual</strong> <strong>Report</strong> <strong>2007</strong>
In 2000, <strong>Storebrand</strong> Skadeforsikring transferred all its run-off land-based Norwegian non-life insurance and all direct marine insurance to If through a100 per cent reinsurance arrangement. The result is that the company has retained fronting responsibility, but has no commercial responsibility for thebusiness transferred unless If becomes insolvent. This risk is therefore limited to a credit exposure to If. If has a Standard & Poor’s rating of ’A’, whichsuggests that this represents a very limited risk exposure for <strong>Storebrand</strong>.Risk exposure and insurance risk – Oslo Reinsurance CompanyThe company’s commercial operations are concentrated on the run-off of its existing reinsurance portfolios, either by paying claims that are reported tothe company or by seeking to extricate itself from policies by negotiating a settlement amount with the insured party (cedent) by commuting the cover.The portfolios with the largest remaining risk exposure are liability insurance and cover for large market losses in the 1980s. In addition, certain typesof claim have shown an adverse development over the last 10 years, principally claims related to asbestos and environmental damage, but also othertypes of health-related claims. For these types of cover, the company estimates its liabilities by evaluating each cedent’s exposure for the types of claimmentioned and evaluating the claims history. The company has some degree of reinsurance for its own risks, but this cover is largely commuted and coveris not complete for asbestos, environmental and health claims.Insurance riskThe principal source of insurance risk lies in the risk of increasing asbestos-related claims. The company has strived for some considerable time to reducethis risk by entering into commutation agreements with insured parties/cedents, and this has resulted in a significant reduction in exposure to this typeof claim.In <strong>2007</strong>, Oslo Reinsurance Company received authorisation for a Scheme of Arrangement (SoA) in English law. This means that all of the company’s creditors,with some exceptions, should have sent their claims to the company by the end of December <strong>2007</strong>. With the help of a process described in the SoAdocuments it will be determined how much the company must pay to its individual creditors. During the course of 2008, Oslo Reinsurance Company willthus have paid its share of the majority of the claims and the remainder will be individual portfolios or possibly individual creditors that it was inappropriateto include in the SoA process.Actual claims experience compared with earlier forecasts<strong>Storebrand</strong> Skadeforsikring AS has reinsured all its insurance risk with respect to the run-off portfolio, and its claims performance is therefore largelydependent on the requirements imposed by Kredittilsynet for the minimum level of claims reserves that must be held for the various lines of insurance.<strong>Storebrand</strong> Skadeforsikring AS’ active portfolio achieved a small run-off gain in <strong>2007</strong> for 2006.Oslo Reinsurance Company’s claims experience over recent years has largely been affected by the extent to which the company has succeeded in commutingits incoming reinsurance contracts, i.e. reaching agreement on early settlement of its liability to policyholders (cedents). The company has beenparticularly active in commuting policies in liability-related lines, and this has caused a reduction in exposure and IBNR requirements.SPP insurance risksThe company’s risk with respect to savings in life insurance partly comes from investment yield from assets under management and partly from thepolicyholders’ life and health. The uncertainty surrounding the policyholders’ life and health is called insurance risk and can be divided into the followingmain categories:• death – payment to the policyholder’s surviving relatives• pension – payment for as long as the policyholder lives• disability – payment in the event of illness or occupational disabilityA policy often contains a combination of the three different insurance risks. In a mutual life insurance company it is the insurance group that is responsiblefor these risks since in this case the policyholder fulfils the role of both owner and customer. In a private limited company like SPP it is not thepolicyholders who are liable for the risk result, but the company.Limiting insurance riskBefore a risk policy – products that ensure financial compensation in the event of death and illness/disability – is granted, SPP conducts a medical insurancerisk assessment of the policyholder. The purpose of this is to determine whether and on which terms the policyholder can take out a policy basedon the policyholder’s health status. This is necessary in order to enable the company to offer policies with the correct level of premium in the long-term.The desired policy should satisfy the policyholder’s insurance needs and debt servicing capacity. The assessment of risk therefore also includes an examinationof debt servicing capacity.Future risksLife expectancy in Sweden is increasing sequentially (mortality is sinking). This is positive for life cover. On the other hand it may become a financialburden in the case of pension insurance (accident cover).The Swedish Insurance Research Council (FTN), which is a sector organisation, conducted an analysis of mortality in 2006 that makes it possible to look atmortality forecasts that take account of changes in the level of change trends. Such a forecast is crucial when it comes to the setting prices for both lifecover and pension insurance. Insurance products are usually designed in such a way that the premium calculation for the entire period of cover is basedon mortality/life expectancy at the time the policy was taken out.The future is unpredictable as far as disability insurance is concerned. Changes in new incidences of disability are taking place much faster than changesin mortality/life expectancy. One of the reasons for this is the problems involved with determining the causes of and the degree of disability on theground. The quickly increasing level of disability in the first few years of 2000 resulted in premium increases within the sector. Many insurance companieswere doubtful about offering voluntary disability cover in the future. However, since 2005 the number of disability incidences has fallen in a more balancedtrend that resulted in SPP reducing the risk premiums for disability cover. This resulted in a lower risk result for <strong>2007</strong>.The majority of SPP risk policies are annual. In other words, the company can change the premium every year. Errors in the estimate of the premium forlife and disability cover can therefore be corrected, which has a rapid effect on the company’s risk result.<strong>Annual</strong> <strong>Report</strong> <strong>2007</strong>107
Notes <strong>Storebrand</strong> GroupRisk exposureIn order to ensure that insurance companies have adequate capital to meet their insurance obligations, Finansinspektionen (the Swedish Financial SupervisoryAuthority) requires that the sector stress test all of its insurance business using the so-called traffic light calculations. The elements tested are thepremium income side and the insurance liabilities. In <strong>2007</strong>, it was announced that companies would be also required to stress changes with respect toinsurance liabilities in risk policies. This also applies to so-called cancellation risk, which is the risk that a policyholder will terminate the policy and thusstop paying premiums. The level of stress testing generally follows the guidelines issued by CEIOPS (the Committee of European Insurance and OccupationalPensions Supervisors) and their work on Solvency II.A 20 per cent fall in mortality would entail an annual risk result that was approx. SEK 95 million lower for SPP. If the probability of reactivation in theevent of disability sinks by 20 per cent, this would entail an annual risk result that was approx. SEK 25 million lower. SPP’s cancellation risk is very smallsince the majority of the policy portfolio cannot be repurchased.The insurance risk constitutes a significant proportion of the total capital requirement that results from the stress test. In total the stress test affects therisk result in the amount of SEK 120 million. With an expected risk result of approx. SEK 200 million, this means that the majority of the risk result willthus be consumed if the basis for the stress test should become a reality. The stress tests are based on a 1:200 scenario, or a confidence level of 99.5per cent.Risk resultThe risk result is divided into the survival, mortality and disability results, as well as pooling and reinsurance. Pooling and reinsurance are risk-reducingitems. The risk result thus results in the following magnitudes:NOK mill.Survival result -121Mortality result 100Disability result 232Reinsurance -24Pooling 1 1Other -31 Pooling is a form of reinsurance at a global level. In the case of larger groups with activities in multiplecountries there is a possibility that the group will balance its risk result via pooling by offsetting lossesin one country against gains in another country.The survival result consists of the added mortality cross subsidy that is added to the policy according to the basis for calculating the premium less the assetsthat are released by a death. If the sum of the added mortality cross subsidy and the sum of the released assets are equally large, the risk result willbe zero. If more people die than expected, the risk result will be positive. On the other hand if fewer die, the risk result will be negative.The mortality result consists of the paid risk premiums and payments in the event of death. If the paid risk premiums equal the payments in the event ofdeath, then the risk result will be zero. If more people die than expected, the risk result will be negative, and if fewer die then it will be positive.The disability result consists of the number of new disability incidences as well as the run-off of the portfolio of those who are already disabled. The latteris called the run-off result. The disability result consists of the risk premiums paid in the year and the allocations to the reserve for new incidences ofdisability. The reserve that is allocated is a cash value that represents the expected repayments, taking into account the expected level of reactivation andmortality. If the reserve and the paid risk premium are equally large, then the disability result will be zero. If the number of new incidences of disability ishigher than expected, then the risk result will be negative since the allocations will be higher than the paid risk premiums. If the number of new disabilityincidences is lower than expected, then the risk result will be positive since the allocations will be lower than the paid risk premiums.The run-off result consists of the allocated reserves for disability claims and the dissolution of the reserves in the event of reactivation. If greater reactivationtakes place and thus more of the reserve is released then expected, then the run-off result will be positive. If the opposite occurs, it will benegative.The insurance company utilises reinsurance to dampen the fluctuations in the risk result. In other words to avoid larger fluctuations in the risk result thanthe company believes are financially justifiable. The company does not want to take some risks and these are covered partly or wholly through reinsurance.ProfitSPP GroupNOK mill. <strong>2007</strong> 2006Administration result 96 36Risk result 185 306Interest result -389 1 368Other 226 211Pre-tax profit 118 1 921Tax 38 -40Profit for the year 156 1 881Ekskl. Euroben Ltd.108<strong>Annual</strong> <strong>Report</strong> <strong>2007</strong>
Definitions of the various part resultsThe administration result is the difference between the fees charged for the policies to cover the company’s administration costs and the actual administrationcosts. The fees can be based on the policy’s capital, premium or number. The administration result is for the account of the company.The risk result consists of the fees the company charges to cover the insurance risk and the actual costs of this. The insurance risks are the death, longlife and disability risks. The risk result is for the account of the companyThe interest result consists of the difference between the return on the assets being managed on behalf of the policyholders and the share of thereturn allocated to the policyholders. In the case of unit-linked policies the customers’ assets change with the return regardless of whether the return ispositive or negative. The financial result from unit-linked policies equals zero. In the case of guaranteed interest there are two amounts that affect theinterest result: the allocation of the return between the customers and the owner, and the capital contribution necessary to pay the guaranteed interest.If the total return exceeds the guaranteed interest, which is between 2.5 per cent and 5.2 per cent, the return is shared. In this case the customers receive90 per cent, though at least the guaranteed interest, and the company receives 10 per cent. The company’s portion of the total return is in thesescircumstances recognised as income in the interest result. The customers’ guaranteed capital shall at least receive the guaranteed interest on the assets.If the value of a customer’s policy should be lower than the guaranteed value, the company must contribute capital up to the guaranteed value.The item other consists of return on assets not owned by the insurance customers, immaterial assets and interest rate costs on loans issued bythe company.<strong>Annual</strong> <strong>Report</strong> <strong>2007</strong>109
Profit and Loss Account <strong>Storebrand</strong> ASA1 January – 31 DecemberNOK million Note <strong>2007</strong> 2006 2005Operating incomeIncome from investments in subsidiaries 1 672.2 1 036.2 1 026.5Net income and gains from financial assets at fair value:- shares and other equity investments 97.1 74.9 199.9- bonds and other fixed-income securities 91.3 65.3 62.2- financial derivatives/other financial instruments -0.4 -1.6 10.9Other financial income 23.4 7.5 2.7Total operating income 883.6 1 182.3 1 302.2Interest costs 13 -114.1 -77.1 -53.0Other financial costs -7.5 -3.2 -118.7Operating costsSalary and personnel expenses 2.3.4 -1.1 -11.6 -20.6Depreciation 11 -0.2 -0.1 -0.7Other operating costs -64.5 -70.1 -100.5Total operating costs -65.8 -81.8 -121.8Total costs -187.4 -162.1 -293.5Profit before tax 696.2 1 020.2 1 008.7Tax 5Profit for the year 696.2 1 020.2 1 008.7Year-end appropriationsOther equity -162.6 -578.6 1.9Provision for dividend payment -533.6 -441.6 -1 010.6Total year-end appropriations -696.2 -1 020.2 -1 008.7Payments of dividend/group contribution booked as equity transaction 202.7 200.0110<strong>Annual</strong> <strong>Report</strong> <strong>2007</strong>
Balance Sheet <strong>Storebrand</strong> ASA31 DecemberNOK million Note <strong>2007</strong> 2006 2005Fixed assetsPension assets 3 249.9 222.2 183.2Tangible fixed assets 11 36.5 36.2 37.7Shares in subsidiaries 6 15 182.8 5 976.1 5 967.1Total fixed assets 15 469.2 6 234.5 6 188.0Current assetsIntra-group receivables 15 736.4 1 039.5 1 031.3Lending 15 4 604.5Other current receivables 60.4 41.9 73.0Trading portfolio investments:- shares and other equity investments 7.10 143.9 271.4 119.3- bonds and other fixed-income securities 8.10 1 366.9 1 919.6 2 394.6- financial derivatives/other financial instruments 1.3Bank deposits 257.7 90.9 92.9Total current assets 7 169.8 3 363.3 3 712.4Total assets 22 639.0 9 597.8 9 900.4Equity and liabilitiesShare capital 2 249.5 1 249.1 1 292.6Own shares -26.3 -22.5 -29.4Premium reserve 9 488.5 1 818.6 1 818.6Total paid in equity 12 11 711.7 3 045.2 3 081.8Other equity 3 727.9 3 636.0 3 510.5Total equity capital 12 15 439.6 6 681.2 6 592.3Long-term liabilities and commitmentsPension liabilities 3 184.5 192.5 212.0Securities issued 13 1 579.6 1 998.6 1 996.5Total long-term liabilities and commitments 1 764.1 2 191.1 2 208.5Current liabilitiesSecurities issued 13 4 588.8Intra-group liabilities 15 202.7 198.4Other financial liabilities 9.10 1.6 0.3Provision for dividend 12 533.6 441.6 1 010.6Other provisions 20.3 11.3 20.8Other current liabilities 88.3 73.9 68.2Total current liabilities 5 435.3 725.5 1 099.6Total equity capital and liabilities 22 639.0 9 597.8 9 900.4Guarantees issued: see note 17Oslo, 12 February 2008Translation – not to be signedLeiv L. NergaardChairman of the BoardHalvor Stenstadvold Sigurdur Einarsson Camilla M. Grieg Barbara Rose Milian ThoralfssonBirgitte Nielsen Knut Dyre Haug Ann-Mari Gjøstein Erik Haug Hansen Idar KreutzerChief Executive Officer<strong>Annual</strong> <strong>Report</strong> <strong>2007</strong>111
Cash flow statement <strong>Storebrand</strong> ASA1 January – 31 DecemberNOK million <strong>2007</strong> 2006 2005Cash flow from operational activitiesInterest, commission and fees received from customers 115.2 73.5 82.9Interest, commission and fees paid to customers -117.5 -77.3 -72.7Shares and other equity investments 216.5 43.9 -933.0Bonds and other fixed-income securities 549.6 358.9 909.1Financial derivatives and other financial instruments -22.6 -11.5Dividend receipts from the trading portfolio 8.0 2.2 2.5Payments to third parties for goods and services -114.8 -92.1 -143.6Payments to employees, pensioners, employment taxes, etc -48.3 -7.3 -58.9Dividends received from subsidiaries 1 032.6 1 028.1 733.1Net cash flow from operational activities 1 641.3 1 307.3 507.9Cash flow from investment activitiesNet receipts from sale of subsidiaries 247.0Net payments on purchase/capitalisation of subsidiaries -13 801.6 -55.0 398.7Net payments/receipts on purchase/sale of fixed assets, etc -0.9 0.8Net cash flow from investment activities -13 802.5 192.8 398.7Cash flow from financing activitiesRepayment of long term lending -419.7 -79.0Receipts from taking up term loans 4 594.8 1 577.8Receipts from taking up subordinated loans 10.0Receipts from issue of new capital 8 670.4Payments on redemption of share capital -75.9 -502.8 -618.5Dividend/group contribution payments -441.6 -999.3 -1 823.4Net cash flow from financing activities 12 328.0 -1 502.1 -933.1Net cash flow for the period 166.8 -2.0 -26.5Net movement in cash and cash equivalent assets 166.8 -2.0 -26.5Cash and cash equivalent assets at start of the period 90.9 92.9 119.4Cash and bank disposits at the end of the period 257.7 90.9 92.9112<strong>Annual</strong> <strong>Report</strong> <strong>2007</strong>
Notes to the accounts of <strong>Storebrand</strong> ASAAccounting Principles <strong>2007</strong>The accounts of <strong>Storebrand</strong> ASA have been prepared in accordance withthe Accounting Act and generally accepted accounting principles in Norway.<strong>Storebrand</strong> has elected not to use IFRS for the company’s unconsolidatedaccounts.Use of estimates and assumptionsThe preparation of the annual accounts has involved the use of estimates andassumptions that have affected assets, liabilities, revenue, costs and informationon potential liabilities. Future events may cause these estimates to change.Such changes will be recognised in the accounts when there is a sufficient basisfor using new estimates.Classification and valuation principlesAssets and liabilities have been valued in accordance with the general valuationrules of the Accounting Act. Assets intended for permanent ownership anduse are classified as fixed assets, while assets and receivables due for paymentwithin one year are classified as current assets. Equivalent principles have beenapplied to liability items.Dividends and group contributionIn the company’s unconsolidated accounts, investments in subsidiaries andassociated companies are valued at acquisition cost reduced by any writedowns.The main income of <strong>Storebrand</strong> ASA is the return on capital invested insubsidiaries. Group contributions and dividends received in respect of these investmentsare therefore recorded as operating income. Proposed and approveddividends and group contributions from subsidiaries are recognised in theunconsolidated accounts of <strong>Storebrand</strong> ASA as income in the accounting year.This treatment can only be applied to income earned by subsidiaries during<strong>Storebrand</strong>’s ownership. Otherwise, receipts are recognised as equity transactions,and the value of the investment in the subsidiary is reduced by theamount of the group contribution or dividend received.Tangible fixed assetsTangible fixed assets for own use are valued at acquisition cost less accumulateddepreciation. Fixed assets are written down if the value in the balance sheetexceeds the recoverable value of the asset.Pension liabilities in respect of own employeesThe company uses the Norwegian standard for pensions accounting NRS 6A,which permits the use of IAS 19 (International Financial <strong>Report</strong>ing Standards).The net pension cost for the period consists of the sum of pension liabilitiesaccrued in the period (current service cost), the interest charge on the calculatedliability and the expected return on pension fund assets.Pension costs and pension liabilities for defined benefit schemes are calculatedusing a linear profile for the accrual of pension entitlement and expected finalsalary as the basis for calculating the benefit obligation, based on assumptionsabout discount rate, future increases in salary, pensions and social securitypension benefits, the future return on pension assets and actuarial assumptionsabout mortality, staff turnover etc. The discount rate used is the risk-freeinterest rate appropriate for the remaining maturity. Where a scheme is funded,the pension assets are valued at fair value and deducted to show the netliability in the balance sheet.The effect of differences between assumptions and actual experience (experienceadjustments) and changes in assumptions is amortised over the remainingperiod for accrual of pensions entitlement to the extent that it exceeds 10% ofthe higher of either the pension liability or pension assets (corridor approach).The effect of changes to the pension scheme is charged to the profit andloss account as incurred, unless the change is conditional on future accrual ofpension entitlement. If this is the case, the effect is allocated on a linear basisover the period until the entitlement is fully earned. The employers’ nationalinsurance contributions are included as part of the pension liability, and areincluded in both the balance sheet value of pension liabilities and in experienceadjustments.TaxThe tax cost in the profit and loss account consists of tax payable for theaccounting year and changes in deferred tax. Deferred tax and deferred taxassets are calculated on the basis of differences between accounting and taxvalues of assets and liabilities. Deferred tax assets are recorded in the balancesheet to the extent it is considered likely that the company will have sufficienttaxable profit in the future to make use of the tax asset. Deferred tax is applieddirectly to equity to the extent that it relates to items that are themselvesdirectly applied to equity.Foreign currencyCurrent assets and liabilities are converted at the exchange rate on the balancesheet date. Shares held as fixed assets are converted at the exchange rate onthe date of acquisition.Financial instrumentsInvestments in shares in subsidiaries and associated companies are valued atcost price less any write-down of value. The need for any write-down is assessedat the end of each accounting period in the same way as for other fixedassets.Other shares and interests are valued at their fair value. Where the share orinterest in question is listed on a stock exchange or other regulated market, fairvalue is determined as the bid price on the last trading day immediately prior toor on the date of the balance sheet.Purchases of the company’s own shares are treated as an equity transaction,and the holding of own shares is reported as a reduction in equity.Bonds and other fixed income securitiesFinancial assets and liabilities are included in the balance sheet from such timeas <strong>Storebrand</strong> becomes party to the instrument’s contractual terms and conditions.Normal purchases and sales of financial instruments are booked on thetransaction date. When a financial asset or a financial liability is first recognisedin the accounts, it is valued at fair value plus, in the case of a financial asset ora financial liability that is not a financial asset or a financial liability at fair valuein the profit and loss account, transaction costs directly related to the acquisitionor issue of the financial asset or the financial liability.Financial assets are derecognised when the contractual right to the cash flowfrom the financial asset expires, or when the company transfers the financialasset to another party in a transaction by which all, or virtually all, the risk andreward associated with ownership of the asset is transferred.Bonds and other fixed income securities are recognised at fair value for instrumentsthat satisfy the criteria in section 5-8 of the Accounting Act. Fair valueis the amount for which an asset could be exchanged, or a liability settled,between knowledgeable, willing parties in an arm’s length transaction. Forfinancial assets that are listed on a stock exchange or another regulated marketplace, fair value is determined as the bid price on the last trading day up toand including the balance sheet date, and in the case of an asset that is to beacquired or a liability that is held, the offer price.Financial derivativesFinancial derivatives that satisfy the criteria in section 5-8 of the AccountingAct are recognised at fair value. Financial derivatives are designated as financialassets or financial liabilities at fair value in the profit and loss account.Bond loansBond loans are valued at amortised cost using the effective yield method. Theamortised cost includes the transaction costs on the date of issue.LendingLending in the balance sheet is recognised at nominal value and converted tothe exchange rate on the balance sheet day.<strong>Annual</strong> <strong>Report</strong> <strong>2007</strong>113
Noter <strong>Storebrand</strong> ASA01 Income from investments in subsidiariesNOK million <strong>2007</strong> 2006 2005<strong>Storebrand</strong> Livsforsikring AS 268.0 885.3 775.4<strong>Storebrand</strong> Kapitalforvaltning AS 92.4 134.8 26.6<strong>Storebrand</strong> Bank ASA 278.2 222.4<strong>Storebrand</strong> Felix Kurs og Konferansenter AS 4.8 1.0<strong>Storebrand</strong> Alternative Investments ASA 1 28.8 15.1 2.1Total 672.2 1 036.2 1 026.51 Group contribution booked as equity transaction22.702 Personnel expensesNOK million <strong>2007</strong> 2006 2005Ordinary wages and salaries -7.0 -8.4 -18.6Employer's social security contributions -1.5 -5.4 -4.8Pension costs 18.2 12.1 13.4Other benefits -10.7 -9.9 -10.6Total -1.1 -11.6 -20.603 Pension costs and pension liabilitiesEmployees are insured through a defined benefit pension equivalent to 70 per cent of pensionable salary at the time of retirement. The ordinary retirementage is 65. Staff pensions are provided by a group pension scheme with <strong>Storebrand</strong> Livsforsikring AS. Pension payments from this scheme come intoeffect from the pension age, which is 67 for employees and 65 for underwriters. Pension payments to employees between 65 and 67 are paid directly bythe company. The pension terms follow from the pension decisions in the <strong>Storebrand</strong> group.The company is obliged to have an occupational pension scheme pursuant to the Act relating to Mandatory Occupational Pensions. The company's pensionscheme satisfies the requirements of this act.Reconciliation of pension assets and liabilities in the balance sheet:NOK million <strong>2007</strong> 2006 2005Present value of insured pension benefit obligations inc. employer's social security payments 1 753.5 1 914.4 1 905.0Pension assets at fair value -1 957.7 -1 972.8 -1 962.0Net pension liability/surplus for the insured schemes -204.2 -58.4 -57.0Present value of uninsured pension benefit obligations including employment taxes 203.2 200.0 223.7Experience adjustments not applied to profit and loss -64.5 -171.3 -137.8Net pension liabilities in the balance sheet -65.4 -29.7 28.8Booked in the balance sheet:Pension assets 249.9 222.2 183.2Pension liabilities 184.5 192.5 212.0Reconciliation to show the change in defined benefit pension liability in the period:NOK million <strong>2007</strong> 2006 2005Net pension liability at 1.1. including provision for employment taxes 2 114.4 2 128.6 2 205.5Pension cost including provision for employment taxes 3.0 2.4 4.9Interest on pension liability 82.1 94.5 97.8Experience adjustments -59.6 72.7 15.5Pensions paid -183.2 -183.7 -195.1Net pension liability at 31.12. 1 956.8 2 114.4 2 128.6114<strong>Annual</strong> <strong>Report</strong> <strong>2007</strong>
Reconciliation to show the change in fair value of pension assets in the period:NOK million <strong>2007</strong> 2006 2005Fair value of pension assets at 1.1. 1 972.8 1 962.0 2 033.3Expected return 105.4 112.6 117.4Experience adjustments 48.1 38.8 -35.9Premiums paid in 24.3 11.9Pensions paid -168.6 -164.8 -164.7Net pension assets at 31.12. 1 957.7 1 972.8 1 962.0Pension assets are based on the financial investments held by <strong>Storebrand</strong> Livsforsikring which had the followingcomposition as at 31.12.:<strong>2007</strong> 2006 2005Properties and real estate 13% 11% 10%Bonds held to maturity 23% 28% 28%Secured and other lending 2% 1% 1%Shares and other equity participations 30% 29% 27%Bonds 26% 28% 29%Commercial paper 1% 4%Other short-term financial assets 5% 2% 1%Total 100% 100% 100%The table shows the percentage asset allocation of pension assets managed by <strong>Storebrand</strong> Livsforsikring AS at year-end. The book (realised) investmentreturn on assets managed by <strong>Storebrand</strong> Livsforsikring AS was 8.9% in <strong>2007</strong>, 7.1% in 2006 and 6.9% in 2005.Net pension cost recognised in the profit and loss account during the period:NOK million <strong>2007</strong> 2006 2005Current service cost including employment taxes 5.4 5.9 6.2Interest on pension liabilities 81.9 94.5 97.8Expected return on pension scheme assets -105.4 -112.6 -117.4Net pension cost recognised in the profit and loss account during the period -18.2 -12.1 -13.4Net pension cost is included in operating costs.Main assumptions used when calculating net pension liability at 31.12.:<strong>2007</strong> 2006 2005Financial assumptions:Discount rate 4.7% 4.3% 4.7%Expected return on pension fund assets in the period 5.8% 5.6% 6.0%Expected earnings growth 4.3% 4.3% 3.0%Expected annual increase in social security pensions 4.3% 4.3% 3.0%Expected annual increase in pensions in payment 1.9% 1.7% 2.0%Actuarial assumptions:Standardised assumptions on mortality/disability and other demographic factors as produced by the Norwegian Financial Services Association.Average employee turnover rate of 2-3% of entire workforce.Net pension liability at 31.12.NOK million <strong>2007</strong> 2006 2005Present value of defined benefit pension obligations 1 956.8 2 114.4 2 128.6Pension assets at fair value 1 957.7 1 972.8 1 962.0Deficit -0.9 141.6 166.6<strong>Annual</strong> <strong>Report</strong> <strong>2007</strong>115
Notes <strong>Storebrand</strong> ASA04 Remuneration of the Chief Executive Officer and elected officers of the companyNOK ’000s <strong>2007</strong> 2006 2005Chief Executive OfficerSalary 3 602 3 539 3 404Bonus (performance-based) 2 248 1 822 1 489Total remuneration 5 850 5 361 4 893Other taxable benefits 249 232 207Pension expenses 1 675 726 706Board of Representatives 592 534 436Control Committee 2 801 798 872Chairman of the Board 475 399 480Board of Directors including the Chairman 2 466 2 360 2 075Remuneration of the auditorStatutory audit 2 063 2 237 2 167Other reporting services 2 644 61Taxation advice 52Other non-audit services 3 4 744 71 2 6601 Pension expenses relate to accrual for the year.2 The Control Committee covers all the Norwegian companies in the group which are required to have a control committee, except for <strong>Storebrand</strong> Bank ASA and Oslo ReinsuranceCompany ASA which have their own control committees. For further information on senior employees, the Board of Directors and the Control Committee, see note 12 to theaccounts of the <strong>Storebrand</strong> Group.3 Other non-audit services primarily relate to agreed inspection services in connection with <strong>Storebrand</strong>’s acquisition of SPP Livförsäkring and associated companies. Of theamount approximately NOK 1.3 million was fees to Deloitte in Sweden and Denmark.STOREBRAND ASA – THE BOARD OF DIRECTOR'S STATEMENTON THE FIXING OF THE SALARY AND OTHER REMUNERATION FOR SENIOR EMPLOYEESThe Board’s declarationThe Board of <strong>Storebrand</strong> ASA will submit a statement to the annual general meeting on the salary and other remuneration of senior employees, cf.Section 6-16a of the Public Limited Liabilities Companies Act, based on the group's previously adopted guidelines concerning remuneration for senioremployees in <strong>Storebrand</strong>.The Board’s Remuneration CommitteeThe Board of <strong>Storebrand</strong> ASA has had a special Remuneration Committee since 2000. The Remuneration Committee is tasked with providing recommendationsto the Board concerning all matters to do with the company's remuneration of the CEO. The Committee shall remain informed about and suggestguidelines for the fixing of remuneration for senior employees in the group. In addition the Committee is the advisory body for the CEO in relation toremuneration regimes that cover all senior employees, including <strong>Storebrand</strong>'s bonus system and pension scheme.Guidelines for the fixing of salary and other remuneration for senior employees in <strong>Storebrand</strong><strong>Storebrand</strong> aims to base remuneration on competitive and stimulating principles that help to attract, develop and retain highly qualified staff. The aim isfor total remuneration to move towards a lower proportion of fixed salary and a higher proportion of bonus over time. The salaries of senior employeesare fixed on the basis of a position's responsibilities and complexity. Regular comparisons are made with corresponding positions in the market in orderto adjust the pay level to the market. <strong>Storebrand</strong> does not wish to be a pay leader in relation to fixed pay in the sector.Senior employees in <strong>Storebrand</strong> can, in addition to their fixed salary, receive remuneration in the form of an annual bonus, participation in the group'sgroup pension scheme, usual benefits in the form of free newspapers, telephone, company car scheme, and other personal benefits. Senior employeesmay also be entitled to an arrangement in which their salary is paid after the end of their employment. This guarantees salary less other income for aspecific period of up to 24 months after the end of their employment.The bonus systemThe <strong>Storebrand</strong> group's bonus scheme, which is offered in addition to basic pay, is a performance-related bonus scheme linked to the group's value-basedmanagement system. The value creation of the group finances the overall amount of the bonus, but the employees' performance determines how large aproportion of the financed bonus is awarded. The bonus entitlement is credited to a bonus account. The amount credited to the bonus bank is exposed50 per cent to <strong>Storebrand</strong>'s share price and 50 per cent to the bank interest rate paid. 1/3 of the balance on the bonus account is paid each year.Share programme for employeesLike other employees in <strong>Storebrand</strong>, senior employees have an opportunity to purchase up to 1,000 shares in <strong>Storebrand</strong> ASA at a discount. The discountin excess of NOK 1,500 is reported as pay. The scheme is subject to a minimum contractual period.The senior employee remuneration policy practised in <strong>2007</strong>In <strong>2007</strong>, senior employee remuneration in <strong>Storebrand</strong> was fixed according to the guidelines described above. None of the group's executive managementreceived pay increases during the ordinary pay adjustment.The executive management receive on average less than 25 per cent expected variable remuneration calculated in relation to fixed remuneration.116<strong>Annual</strong> <strong>Report</strong> <strong>2007</strong>
Idar Kreutzer is Chief Executive Officer of <strong>Storebrand</strong> ASA and <strong>Storebrand</strong> Livsforsikring AS, and the figures provided in the notes are for total remunerationfrom the group. He is entitled to 24 months' salary following the expiry of the normal notice period. All forms of work-related income from othersources, including consultancy assignments, will be deducted from such payments. Kreutzer is entitled to a performance-related bonus based on thegroup’s ordinary bonus scheme which is linked to the group's value-based management system. The group’s value creation finances the overall amountof the bonus, but individual performance determines allocation. Kreutzer's individual bonus entitlement is credited to a bonus account, and 1/3 of thebalance on the bonus account is paid each year. The amount credited to the bonus bank is exposed 50% to <strong>Storebrand</strong>'s share price and 50% to the bestinterest rate paid by <strong>Storebrand</strong> Bank.The CEO is a member of the <strong>Storebrand</strong> pension scheme. The discounted present value of his pension entitlement amounts to NOK 10.305 TaxNOK million <strong>2007</strong> 2006 2005Profit before tax 696.2 1 020.2 1 008.7- Dividend -279.0 -903.6 -1 012.5+/- Shares realised -153.1 58.1 -466.5+/- Permanent differences -246.8 -231.0 42.4+/- changes in temporary timing differences -48.5 -106.2 -194.9Tax base for the year -31.2 -162.5 -622.8Payable taxChange in deferred taxTax 0.0 0.0 0.0Calculation of deferred tax assets and deferred tax<strong>2007</strong> 2006 2005Tax increasing timing differencesPre-paid pensions 249.9 222.2 182.6Total tax increasing timing differences 249.9 222.2 182.6Tax reducing timing differencesSecurities -3.3 -1.9 -31.8Operating assets -36.2 -45.4 -58.2Provisions -3.7 -8.7 -13.0Accrued pension liabilities -184.5 -192.5 -212.1Total tax reducing timing differences -227.7 -248.5 -315.1Net temporary differences before losses carried forward 22.2 -26.3 -132.5Losses carried forward -1 211.4 -1 180.2 -1 017.7Allowances carried forward -660.1 -660.1 -660.1Write-down of deferred tax assets 1 1 849.3 1 866.6 1 810.3Net tax increasing/(reducing) timing differences 0.0 0.0 0.0Deferred tax/Deferred tax assets 0.0 0.0 0.01The balance sheet value of deferred tax assets has been written down. This is because future income from subsidiaries will principally be in the form of dividends rather thantaxable group contribution. Unused allowances carried forward arose in the years 1998 - 2003, and must be used within 10 years.Reconciliation of tax charge and ordinary profit<strong>2007</strong> 2006 2005Pre-tax profit 696.2 1 020.2 1 008.7Expected tax at nominal rate (28%) -194.9 -285.7 -282.4Tax effect of:- dividends received 78.1 253.0 283.5- gains on shares 42.9 -16.3 130.6- permanent differences 69.1 64.7 -11.9- write-down of deferred tax assets 4.8 -15.8 -119.8Tax 0.0 0.0 0.0Effective tax rate 0% 0% 0%<strong>Annual</strong> <strong>Report</strong> <strong>2007</strong>117
Notes <strong>Storebrand</strong> ASA06 Holding company's shares in subsidiaries and associated companiesNOK millionRegisteredofficerSharecapitalNo. of shares’(1,000s)Par valueNOKInterest/votes in %Subsidiaries<strong>Storebrand</strong> Livsforsikring AS Oslo 1 980.4 19 804 100 100.0% 11 703.2<strong>Storebrand</strong> Bank ASA 1 Oslo 916.6 64 037 14 100.0% 2 866.4<strong>Storebrand</strong> Kapitalforvaltning AS Oslo 50.0 50 1 000 100.0% 162.4<strong>Storebrand</strong> Skadeforsikring AS Oslo 7.8 13 807 0.56 100.0% 324.0<strong>Storebrand</strong> Leieforvaltning AS Oslo 10.0 100 100 100.0% 10.0<strong>Storebrand</strong> Felix kurs og konferanse AS Oslo 1.0 1 1 000 100.0% 8.6<strong>Storebrand</strong> Alternative Investments AS 1. 2 Oslo 2.0 101 11 100.0% 38.2BookvalueAssociated/jointly controlled companies<strong>Storebrand</strong> Helseforsikring AS Oslo 31.0 16 1 000 50.0% 70.0AS Værdalsbruket 3 Værdal 4.8 2 625 24.9%Total 15 182.81 <strong>Storebrand</strong> ASA has provided a group contribution as a capital payment of NOK 200.3 million to <strong>Storebrand</strong> Bank AS and NOK 2.4 million to <strong>Storebrand</strong> Alternative InvestmentAS.2 In <strong>2007</strong>, <strong>Storebrand</strong> ASA purchased a minority interest of 44% for a cash remuneration of NOK 22.2 million. The final purchase sum depends on the company's earnings in theyears ahead, and the provision for Earn-out is NOK 34.9 million. In <strong>2007</strong>, a received group contribution of NOK 22.7 million was booked as an equity transaction as a reductionin the book value of the shares. The total received group contribution was NOK 51.5 million.3 74.9% is owned by <strong>Storebrand</strong> Livsforsikring AS. The minority interest amounts to 0.2%.07 Shares and other equity investmentsShares and other equity investmentsNOK million Acqstn. cost Fair valueListed Norwegian shares 86.2 143.5Unlisted Norwegian shares 0.1Unlisted shares outside the EEA 0.9 0.3Total shares 87.0 143.908 Commercial paper and bondsBonds and other fixed-income securitiesNOK million Commercial paper Bonds TotalCommercial paper and bonds 254.6 1 112.3 1 366.9Of which listed 859.7 859.7Acquisition cost 254.9 1 113.6 1 368.5Nominal value 255.0 1 105.9 1 360.9Direct investments in bonds and commercial paper 254.6 1 112.3 1 366.9Interest accrued but not paid 3.0 5.9 8.9Base figure for allocation by sector and currency 257.6 1 118.2 1 375.8Public sector 130.2 37.2 167.4Financial institutions 127.4 968.7 1 096.2Other issuers 112.3 112.3Total 257.6 1 118.2 1 375.8NOK 257.6 1 118.2 1 375.8Modified duration 0.48 0.16 0.22Average effective yield 6.12 6.27 6.21118<strong>Annual</strong> <strong>Report</strong> <strong>2007</strong>
09 Financial derivativesNOK millionGross nom.volumeAveragevolumeAveragevolumeFair valueForward rate agreements 4 300.0 2 251.3 1.1Interest rate swaps 625.0 13.2 625.0 0.6Forward foreign exchange contracts 1.0Basis swaps 301.2Total derivatives 4 925.0 2 566.7 625.0 1.6AssetLiability10 Financial riskCredit risk by ratingShort-term holdings of interest-bearing securitiesCategory of issuer or guarantorNOK millionAAAFair valueAAFair valueAFair valueBBBFair valueTotalFair valuePublic sector 130.2 41.6 37.2 209.0Financial institutions 331.7 248.6 453.4 62.4 1 096.1Other issuers 70.7 70.7Total <strong>2007</strong> 461.9 290.2 561.3 62.4 1 375.8Total 2006 687.0 268.0 857.4 107.2 1 919.6Total 2005 715.6 479.7 1 066.8 132.5 2 394.6Liquidity riskAmounts reported include accrued interestResidual contractual period for financial assetsNOK millionNo agreedmaturity dateUp to 1month1–3months3 months– 1 year 1–5 yearsMore than5 yearsLeading to financial institutions 4 609.8 4 609.8Bonds and other fixed-income securities 257.6 1 059.3 58.9 1 375.9Derivatives 1 -0.9 -0.4 -0.4 -1.6Total <strong>2007</strong> 4 609.0 257.3 1 058.9 58.9 5 984.1Total 2006 200.0 718.7 950.0 58.9 1 927.6Total 2005 79.6 40.0 1 228.5 996.4 204.1 2 548.6Totalvalue1Figures for derivatives are net figures in this note.Residual contractual period for financial assetsNOK millionNo agreedmaturity dateUp to 1month1–3months3 months– 1 year 1–5 yearsMore than5 yearsSecurities issued 4 588.8 1 579.6 6 168.4Total <strong>2007</strong> 4 588.8 1 579.6 6 168.4Total 2006 419.7 1 578.9 1 998.6Total 2005 1 996.5 1 996.5TotalvalueInterest rate riskPeriod to next interest rate fixing for financial assetsNo agreedNOK millioninterest fixingperiodUp to 1month1–3months3 months– 1 year 1–5 yearsMore than5 years Total valueLending to group companies 4 609.8 4 609.8Bonds and other fixed-income securities 257.6 1 059.3 58.9 1 375.8Derivatives 1 -226.4 -174.7 399.5 -1.6Total <strong>2007</strong> 4 383.4 82.9 1 458.8 58.9 5 984.1Total 2006 104.4 1 095.7 710.1 17.4 1 927.6Total 2005 286.8 747.1 1 345.8 168.9 2 548.61 Figures for derivatives are net figures in this note<strong>Annual</strong> <strong>Report</strong> <strong>2007</strong>119
Noter <strong>Storebrand</strong> ASAPeriod to next interest rate fixing for financial liabilitiesNOK millionNo agreedmaturity dateUp to 1month1–3months3 months– 1 year 1–5 yearsMore than5 years Total valueSecurities issued 4 588,8 1 579,6 6 168,4Total <strong>2007</strong> 4 588,8 1 579,6 6 168,4Total 2006 1 998,6 1 998,6Total 2005 1 786,8 209,7 1 996,5Interest rate sensitivityNOK millionShort-term holdings of financial assetsNo agreedmaturity dateUp to 1month1–3months3 months– 1 year 1-5 yearsMore than5 years Total valueNOK -0.1 -1.1 -2.4 -3.8 -3.9 -11.2Total short-term holdings of financial assets -0.1 -1.1 -2.4 -3.8 -3.9 -11.2Long-term holdings of financial assetsNOK 2.7 2.7EUR 2.6 -10.1 -7.5Long-term holdings of financial assets 2.6 -7.3 -4.7Total quantified interest rate sensitivity <strong>2007</strong> 2.5 -8.4 -2.4 -3.8 -3.9 -16.0Total quantified interest rate sensitivity 2006 -0.1 -2.0 -5.2 -3.9 -11.2Interest rate sensitivity is a measure of interest rate risk based on how changes in interest rates will affect the market value of bonds, interest rate derivativesand other interest rate sensitive financial items. This summary shows how the values of financial current assets and financial fixed assets (bondsheld to maturity) at 31 December <strong>2007</strong> would be affected by an increase of 1 percentage point in all interest rates. <strong>Storebrand</strong> creates interest ratepositions through its assets in order to partly offset the interest rate risk implicit in the company›s insurance obligations. However, the interest rate riskrepresented by insurance policies cannot be calculated and quantified in the same way as Interest rate risk for financial items.Currency risk<strong>Storebrand</strong> ASA has a deposit and a loan in the same currency. This is for EUR 580 million.11 Real estate and operating assetsNOK millionRealestatementEquipment, vehicles,fixtures and fittingsAcquisition cost at 1.1. 34.5 281.8 316.3Accumulated depreciation -22.2 -257.9 -280.1Book value at 1.1 12.3 23.9 36.2Additions 0.9 0.9DisposalsDepreciation/write-down for the year -0.5 -0.2 -0.7Book value at 31.12 11.8 24.7 36.5TotalStraight line depreciation periods for operating assets are as follows:Equipment, fixtures and fittings:Vehicles:IT systems:4 years6 years3 years120<strong>Annual</strong> <strong>Report</strong> <strong>2007</strong>
12 EquityNOK millionShareCapital 1OwnsharesSharepremiumOtherequityEquity<strong>2007</strong> 2006 2005Equity at 1.1. 1 249.1 -22.5 1 818.6 3 636.0 6 681.2 6 592.3 7 194.5Profit for the year 696.2 696.2 1 020.2 1 008.7Share issue 2 1 000.4 7 669.9 8 670.3Own shares bought back 3 -5.0 -88.0 -93.0 -502.8 -618.5Over/under provision for dividend -0.4 -0.4 11.3 17.0Allocated to dividend 4 -533.6 -441.6 -1 010.6Employee share issue 1.2 17.7 18.9 1.7 1.2Equity at 31.12. 2 249.5 -26.3 9 488.5 4 261.5 15 439.6 6 681.2 6 592.31 449,909,891 shares with a nominal value of NOK 5 each.2 A share issue was conducted and registered in December <strong>2007</strong> in which 200,090,786 shares were issued. The subscription price was3 NOK 45 per share, and the issue costs of NOK 333.7 million were deducted form the share premium reserve.4 In <strong>2007</strong>, 1,000,000 of the company's own shares were bought back, and of these 236,300 were sold to employees. As per 31 December <strong>2007</strong>, the company held 5,263,700of its own shares. The shares were bought back in order to maintain the correct capital structure for the group and because it was advantageous for shareholders.5 No divided has been set aside for the company's holdings of its own shares.13 Bonds issuedNOK million Interest rate Currency <strong>2007</strong> 2006 2005Bond loan 2005/2009 3 months NIBOR+0.20% NOK 830.0 829.6 829.2Bond loan 2005/2011 3 months NIBOR+0.30% NOK 749.6 749.3 748.9Bond loan 2002/<strong>2007</strong> 7.18% NOK 210.3 209.7Bond loan 2002/<strong>2007</strong> 3 months NIBOR+0.80% NOK 209.4 208.8Total 1 1 579.6 1 998.6 1 996.51Loans are booked at amortised cost.<strong>Storebrand</strong> ASA has taken out a syndicated loan of EUR 580 million, equivalent to NOK 4,588.8 million. The loan is booked at amortised cost, and loancosts of NOK 15.8 million have been activated with respect to the loan. The loan falls due for repayment in September 2008. The loan is subject to aninterest rate of three months EURIBOR +0.55%.Interest expense on bonds issued and other loans -114.1 -77.1 -53.0<strong>Storebrand</strong> ASA has an undrawn committed credit facility of EUR 225 million14 Shareholders20 largest shareholdersHolding in % Holding in %Gjensidige Forsikring 10.84 Kaupting Bank 1.80Kaupting Bank HF 9.99 Bank of New York 1.75Fortis Global Custod 5.54 Citibank N.A.London 1.74Folketrygdfondet 5.02 Citibank N.A.London 1.61Exista BV 4.70 Credit Agricole Inv. Bank 1.28ABN Amro Bank Luxemb. 4.45 <strong>Storebrand</strong> 1.17Fidelity Funds – Europe 4.14 JP Morgan Chase Bank 1.12Exista BV 3.33 Dresdner Kleinwort S. Principal Acc. 1.10Bank of New York (NOM) 2.81 Arion Costody 0.93State Street Bank & Trust 2.61 Foreign ownership of total shares 75.7 %Goldman Sachs International 2.01<strong>Annual</strong> <strong>Report</strong> <strong>2007</strong>121
Noter <strong>Storebrand</strong> ASA15 Holdings of shares in <strong>Storebrand</strong> ASA by executive management and members of corporate bodiesNo. of sharesowned 1Senior employeesIdar Kreutzer 54 160Hans Henrik Klouman 4 516Odd Arild Grefstad 8 323Maalfrid Brath 4 831Egil Thompson 3 660Lars Aa. Løddesøl 4 933Roar Thoresen 2 796Hans Aasnæs 14 695Klaus Anders Nysteen 1 813Board of DirectorsLeiv L. Nergaard 109 090Halvor Stenstadvold 6 645Knut G. Heje 15 467Mette K. JohnsenErik Haug Hansen 3 981Nina Elisabeth Smeby 125Barbara Rose Milian Thoralfsson 1 849Knut Dyre Haug 2 979Camilla GriegAnn-Mari Gjøstein 258Birgitte NielsenControl CommitteeOle KletteElisabeth Wille 747Harald Moen 595Ida Hjort KrabyCarl Graff-WangJon AnsteinssonBoard of RepresentativesArvid GrundekjønMerete Egelund ValderhaugRandi Paulsrud 545Stein Erik HagenTerje R. Venold 924Karen Helene Ulletveit -MoeTrond BjørganArild ThoresenOlaug SvarvaJohan H. Andresen jr.Roar EngelandPaul Eggen jr.Inger Lise GjørvMargrethe ØvrumVibeke Hammer MadsenTor Haugom 5Unn Kristin JohnsenRune Pedersen 1 6821 The summary shows the number of shares owned by the individual, as well as his or her close family and companieswhere the individual, as well as his or her close family exercises significant influence (cf. Accounting Act7-26).122<strong>Annual</strong> <strong>Report</strong> <strong>2007</strong>
Transactions between group companiesNOK million <strong>2007</strong> 2006 2005Profit and loss account items:Group contribution and dividends from subsidiaries 672.2 1 036.2 1 026.5Purchase and sale of services (net) -22.8 -33.7 -50.1Balance sheet items:Subordinated loans to group companies 1 4 604.5Due from group companies 736.4 1 039.5 1 031.3Payable to group companies 202.7 198.41Subordinated loan to <strong>Storebrand</strong> Livsforsikring AS of EUR 580 million. The lender has the right to repay the loan with 5 days notice, and the loan is subjectto an interest rate of 3 months EURIBOR + 2.5%.16 Number of employees<strong>2007</strong>No. of employees at 31.12. 9No. of full time equivalent positions at 31.12. 9Average number of employees 817 Guarantees issued<strong>Storebrand</strong> ASA has issued the following guarantees:Currency Terms Accounts provisionInstitute of London Underwriters (ILU) 1 USD Unlimited1 Counter indemnity of Oslo Reinsurance Company ASA, which is 100% owned by <strong>Storebrand</strong> Skadeforsikring AS.<strong>Annual</strong> <strong>Report</strong> <strong>2007</strong>123
Auditor’s report for <strong>2007</strong>To the <strong>Annual</strong> Shareholders’ Meeting of <strong>Storebrand</strong> ASAWe have audited the annual financial statements of <strong>Storebrand</strong> ASA as of 31 December <strong>2007</strong>, showing a profit of MNOK 696,2 for the parentcompany and a profit of MNOK 2.008,8 for the group. We have also audited the information in the Board of Directors’ report concerning thefinancial statements, the going concern assumption and the proposal in the financial statements for the allocation of the profit. The annualfinancial statements comprise the parent company’s financial statements and the group accounts. The parent company’s financial statementscomprise the balance sheet, the statements of income and cash flows and the accompanying notes. The rules of the Norwegian AccountingAct and generally accepted accounting practice in Norway have been applied to prepare the parent company’s financial statements. The groupaccounts comprise the balance sheet, the statements of income and cash flows, the statement of changes in equity and the accompanyingnotes. International Financial <strong>Report</strong>ing Standards as adopted by the EU have been applied to prepare the group accounts. These financialstatements are the responsibility of the Company’s Board of Directors and Managing Director. Our responsibility is to express an opinion onthese financial statements and on other information according to the requirements of the Norwegian Act on Auditing and Auditors.We have conducted our audit in accordance with the Norwegian Act on Auditing and Auditors and generally accepted auditing practice in Norway,including standards on auditing adopted by Den norske Revisorforening. These auditing standards require that we plan and perform theaudit to obtain reasonable assurance about whether the financial statements are free of material misstatement. An audit includes examining,on a test basis, evidence supporting the amounts and disclosures in the financial statements. An audit also includes assessing the accountingprinciples used and significant estimates made by management, as well as evaluating the overall financial statement presentation. To the extentrequired by law and generally accepted auditing practice, an audit also comprises a review of the management of the Company’s financialaffairs and its accounting and internal control systems. We believe that our audit provides a reasonable basis for our opinion.In our opinion,• the parent company’s financial statements are prepared in accordance with law and regulations and give a true and fair view of the financialposition of the Company as of 31 December <strong>2007</strong>, and the results of its operations and its cash flows for the year then ended, in accordancewith generally accepted accounting practice in Norway• the group accounts are prepared in accordance with law and regulations and give a true and fair view of the financial position of the Groupas of 31 December <strong>2007</strong>, and the results of its operations and its cash flows and the changes in equity for the year then ended, in accordancewith International Financial <strong>Report</strong>ing Standards as adopted by the EU• the Company’s management has fulfilled its duty to see to proper and well arranged recording and documentation of accounting informationin accordance with law and generally accepted bookkeeping practice in Norway• the information in the Board of Directors’ report concerning the financial statements, the going concern assumption and the proposal in thefinancial statements for the allocation of the profit, is consistent with the financial statements and complies with law and regulations.Oslo, 12 February 2008Deloitte ASTranslation – not to be signedIngebret G. Hisdal (signed), State Authorised Public Accountant (Norway)<strong>Storebrand</strong> ASA – Control Committee’s Statement for <strong>2007</strong>At its meeting on 26 February 2008, the Control Committee of<strong>Storebrand</strong> ASA reviewed the Board of Directors’ proposed annualreport and accounts for <strong>2007</strong> for <strong>Storebrand</strong> ASA and the <strong>Storebrand</strong>Group.With reference to the auditor’s report of 12 February 2008, theControl Committee recommends that the proposed annual reportand accounts be adopted as the <strong>Annual</strong> <strong>Report</strong> and Accounts of<strong>Storebrand</strong> ASA and <strong>Storebrand</strong> Group for <strong>2007</strong>.<strong>Storebrand</strong> ASA – Board of Representatives’ Statement for <strong>2007</strong>The Board of Directors’ proposed annual report and accounts, togetherwith the Auditor’s report and the Control Committee’s statement have,in the manner required by law, been presented to the Board of Representatives.The Board of Representatives recommends that the <strong>Annual</strong>General Meeting approve the Board of Directors proposed <strong>Annual</strong><strong>Report</strong> and Accounts of <strong>Storebrand</strong> ASA and the <strong>Storebrand</strong> Group.The Board of Representatives raises no objections to the Board’s proposalregarding the allocation of the profit for the year of <strong>Storebrand</strong> ASA.Oslo, 26 February 2008Translation – not to be signedOslo, 11 March 2008Translation – not to be signedElisabeth Wille (Signed)Chair of the Control CommitteeTerje R. Venold (Signed)Chairman of the Board of Representatives124<strong>Annual</strong> <strong>Report</strong> <strong>2007</strong>
<strong>Storebrand</strong> Group companiesReg. org. no.Interest<strong>Storebrand</strong> ASA 916 300 484<strong>Storebrand</strong> Livsforsikring AS 958 995 369 100.0%<strong>Storebrand</strong> Holding AB 100.0%SPP Livförsäkring AB 100.0%Euroben Ltd. 100.0%<strong>Storebrand</strong> Eiendom AS 972 415 731 100.0%<strong>Storebrand</strong> Pensjonstjenester AS 931 936 492 100.0%Aktuar Systemer AS 968 345 540 100.0%<strong>Storebrand</strong> Eiendom Holding AS 989 976 265 100.0%<strong>Storebrand</strong> Finansiell Rådgivning AS 989 150 200 100.0%Nordben Life and Pension Insurance Co. Ltd. 1 75.0%AS Værdalsbruket 2 920 082 165 74.9%Caveo ASA 984 846 347 48.8%Norsk Pensjon AS 890 050 212 25.0%Foran Real Estate 77.7%Active Travel Norway AS 985 874 077 40.2%<strong>Storebrand</strong> Bank ASA 953 299 216 100.0%<strong>Storebrand</strong> I AS 990 645 558 100.0%<strong>Storebrand</strong> Kredittforetak AS 990 645 515 100.0%Filipstad Tomteselskap AS 984 133 561 100.0%Filipstad Eiendom AS 985 710 783 100.0%Ring Eiendomsmegling AS 987 227 575 91.8%Seilduksgaten 25-31 AS 976 698 983 50.0%Evoco Financial Production Services UAB 50.0%Hadrian Eiendom AS 976 145 364 90.9%<strong>Storebrand</strong> Kapitalforvaltning AS 930 208 868 100.0%<strong>Storebrand</strong> Luxembourg S.A. 99.8%<strong>Storebrand</strong> Alternative Investments AS 3 984 331 339 100.0%<strong>Storebrand</strong> International Private Equity AB 100.0%<strong>Storebrand</strong> Skadeforsikring AS 930 553 506 100.0%Oslo Reinsurance Company ASA 815 832 272 100.0%Oslo Reinsurance Company (UK) Ltd. 100.0%<strong>Storebrand</strong> Helseforsikring AS 980 126 196 50.0%<strong>Storebrand</strong> Leieforvaltning AS 911 236 184 100.0%As of 31.12.<strong>2007</strong>, <strong>Storebrand</strong> Livsforsikring AS owned 40% of UNI Norden Personforsäkring AB. The company has since been wound up.As of 31.12.<strong>2007</strong>, <strong>Storebrand</strong> ASA owned 100% of <strong>Storebrand</strong> Felix kurs- og konferansesenter AS. The company was sold in January2008.1 SPP Livförsäkring AB owns 50% and <strong>Storebrand</strong> Livsforsikring AS owns 25%2 <strong>Storebrand</strong> ASA owns 24.9% and <strong>Storebrand</strong>'s total ownership share is 99.8%.3 The company was converted to a limited company as per 22.01.2008.<strong>Annual</strong> <strong>Report</strong> <strong>2007</strong>125
Terms and expressionsGeneralDuration:The average remaining term of cash flow on interest bearing securities.Modified duration is calculated on the basis of duration and is anexpression of sensitivity to changes in underlying interest rates.Earnings per ordinary share:The calculation of earnings per ordinary share is based on profit aftertax adjusted for changes in statutory security reserves after tax inrespect of non-life insurance. These statutory reserves include securityand administration reserves, natural disaster fund as well as theguarantee reserve. The number of shares used in the calculation istaken as the average number of ordinary shares outstanding over thecourse of the year. In case of new issues of shares, the new sharesare included from the date of subscription.Equity capital:Equity capital consists of share capital subscribed and accrued earnings.Share capital subscribed is recorded as share capital and sharepremium reserve. Accrued earnings are recorded as other equity.Subordinated loan capital:Subordinated loan capital is loan capital which ranks after all otherdebt. Subordinated loan capital forms part of Tier 2 capital in thecalculation of capital adequacy.Capital adequacyCapital adequacy ratio:Eligible primary capital as a percentage of the risk-weighted balancesheet. Individual assets and off-balance sheet items are given a riskweighting based on the estimated credit risk they represent.Primary capital:Primary capital is capital eligible to fulfil the capital requirementsunder the authorities’ regulations. Primary capital may comprise Tier 1capital and Tier 2 capital.Life insuranceAdministration result:The difference between actual costs and those assumed for thepremium tariffs.Annuity/pension insurance:Individual life insurance where the annuity/pension amount is paid ininstalments from an agreed age during the life of the insured. Suchinsurance can be extended to include spouse, child and disabilitypensions.Average yield:Average yield is an expression for the average return the companyhas obtained on the policyholders’ fund during the year. Averageyield should be seen as a gross yield before deducting costs, and isaccordingly not comparable with the interest return reported by otherfinancial institutions. Average yield is calculated in accordance withrules set by Kredittilsynet.Conditional bonus:The conditional bonus is that part of the insurance capital in SPPthat is not guaranteed. The conditional bonus increases or decreasesin relation to the total yield. It can be both negative and positive.However, the bonus cannot exceed more than 15 per cent of thetotal insurance capital. When the bonus is higher, the excess part isconverted into guaranteed bonus. This applies to insurance with individuallycalculated bonus. Similar principles apply to other policies.Cost ratio:Operating costs as a percentage of average customer funds.Endowment insurance:Individual life insurance where the insured amount is payable oneither the expiry of the insurance period or the death of the insuredif earlier. Such insurance can be extended to provide disability pensionsor disability insurance.Tier 1 capital:Tier 1 capital is part of primary capital and consists of equity capitalless the minimum requirement for reinsurance provisions in P&C insurance,goodwill, other intangible assets and net prepaid pensions.Group life insurance:Group life insurance in which an insured sum is payable on the deathof a member of the group. Such insurance can be extended to coverdisability insurance.Tier 2 capital:Tier 2 capital is part of primary capital and consists of subordinated loancapital. In order to be eligible as primary capital, Tier 2 capital cannotexceed Tier 1 capital. Perpetual subordinated loan capital, together withother Tier 2 capital, cannot exceed 100 per cent of Tier 1 capital, whilstdated subordinated loan capital cannot exceed 50 per cent of Tier 1capital. To be fully eligible as primary capital, the remaining term mustbe at least five years. If the remaining term is less, the eligible portion isreduced by 20 per cent for each year.Group pension insurance:A group pension insurance scheme where pensions are paid ininstalments from an agreed age, during the life of the insured. Suchinsurance normally includes spouse, child and disability pensions.Interest result:The result arising from financial income deviating from that assumedfor the premium tariffs.Operating profit:Operating profit from the year’s operations including the share due toinsurance customers.126<strong>Annual</strong> <strong>Report</strong> <strong>2007</strong>
Return on capital:Return on capital shows net realised income from financial assets andchanges in the value of real estate, expressed as a percentage of theyear’s average total assets in accordance with rules set by Kredittilsynet.Value-adjusted return on capital shows the total of realisedincome from financial assets, changes in the value of real estate andthe year’s change in unrealised gains or losses, expressed as a percentageof the year’s average total assets at market value.Premium allocation (allocations for premium income received in advance):That part of the premiums written that is not earned by the end ofthe accounting year.Premiums earned:This is accrual accounting for premiums written and constitutes thepremium for that part of the policy’s agreement period that fallswithin the accounting year.Risk result:The result arising from the incidence of mortality and/or disabilityduring a period deviating from the assumptions used for the premiumtariffs.Premiums written:Premiums for all insurances policies signed during the course of theaccounting year. The agreement falls partly within and partly outsidethe accounting year.Solvency margin requirement:An expression of the risk associated with the insurance-relatedliabilities. Calculated on the basis of the insurance fund and the riskpolicies total for each insurance sector.Unit-Linked:Life insurance offering investment choice whereby the customer caninfluence the level of risk and return by selecting in which funds assetsare to be invested.P&C insuranceClaims ratio:Claims incurred as a percentage of premiums earned.Claims reserve (allocations for unsettled claims):Reserve for future compensation payments for claims that have beenincurred at the end of the accounting year but have not been settledwith final effect. The reserve also includes an estimate of the compensationfor claims that have been incurred but not yet reported tothe company.Combined ratio:The sum of the cost ratio and the claims ratio.Banking<strong>Annual</strong> percentage rate (APR):The true interest rate calculated when all borrowing costs are expressedas an annual payment of interest in arrears. In calculating theAPR, allowance must be made for whether interest is paid in advanceor arrears, the number of interest periods during the year and all feesand commissions.Instalment loan:An instalment loan is a loan on which the borrower makes regularpartial repayments of principal in equal amounts throughout therepayment period. The borrower pays the sum of a fixed instalmentamount and a reducing interest amount at each instalment date. Paymentsaccordingly reduce over the life of the loan assuming a fixedinterest rate.Level repayment loan:Periodic payments (representing both capital and interest) on a levelrepayment loan remain constant throughout the life of the loan.Real rate of interest:The return produced after allowing for actual or expected inflation.Preferably expressed as a nominal rate less the rate of inflation.Cost percentage:Operating expenses as a percentage of premiums written.Cost portion:Operating expenses as a percentage of premiums earned.F.o.a.:Abbreviation for the term ‘for own account’, i.e. before additions/deductionsfor reinsurance.Incurred claims:The sum of total claims amount for losses incurred in the period regardlessof whether or not they have been reported to the companyand any changes in losses which occurred in earlier periods.Net interest income:Total interest income less total interest expense. Often expressed as apercentage of average total assets (net interest margin).Financial derivativesThe term ‘financial derivatives’ embraces a wide range of financialinstruments for which the current value and future price movementsare determined by equities, bonds, foreign currencies or other traditionalfinancial instruments. Derivatives require less capital than is thecase for traditional financial instruments such as equities and bonds,and are used as a flexible and cost effective supplement to traditionalinstruments in portfolio management. Financial derivatives can beused to hedge against unwanted financial risks, or to create a desiredrisk exposure in place of using traditional financial instruments.Insurance (technical) profit/loss:Premium income less claims and operating costs.<strong>Annual</strong> <strong>Report</strong> <strong>2007</strong>127
Terms and expressionsBasis swaps:A basis swap is an agreement to exchange principle and interestrate terms in a foreign currency. At the maturity of the contract, theprincipal and interest rate terms are exchanged back to the originalcurrency. Basis swaps are used for hedging subordinated loans.Credit derivatives:Credit derivatives are financial contracts that transfer all or part of thecredit risk associated with loans, bonds or similar instruments fromthe purchaser of the protection (seller of the risk) to the seller of theprotection (purchaser of the risk). Credit derivatives are tradable instrumentsthat make it possible to transfer the credit risk associatedwith particular assets to a third party without selling the assets.Foreign exchange options:A foreign exchange option confers a right (but not an obligation)to buy or sell a currency at a predetermined exchange rate. Foreignexchange options are used for hedging subordinated loans.Share options:The purchase of share options confers a right (but not an obligation)to buy or sell shares at a pre-determined price. Share options may berelated to stock market indices as well as to specific individual stocks.The sale of share options implies the equivalent one-sided obligation.In the main, exchange traded and cleared options are used.Stock futures (stock index futures):Stock futures contracts can be related to individual shares, but arenormally related to stock market indices. Stock futures contracts arestandardised futures contracts, which are exchange traded, and aresubject to established clearing arrangements. Profits and losses onfutures contracts are recognised daily, and are settled on the followingday.Forward foreign exchange contracts/ foreign exchange swaps:Forward foreign exchange contracts/foreign exchange swaps relateto the purchase or sale of a currency for an agreed price at a futuredate. These contracts are principally used to hedge the currency exposurearising from currency denominated securities, bank deposits,subordinated loans and insurance reserves. These contracts alsoinclude spot foreign exchange transactions.Forward Rate Agreements (FRA):FRAs are agreements to pay or receive the difference between anagreed fixed rate of interest and the actual rate for a fixed amountand period of time. This difference is settled at the start of the futureinterest period. FRA contracts are particularly appropriate to the managementof short-term interest rate exposure.Interest rate futures:Interest rate futures contracts are related to government bond ratesor short-term reference interest rates. Interest rate futures arestandardised contracts which are exchange traded and are subjectto established clearing arrangements. Profits and losses on futurescontracts are recognised daily, and are settled on the following day.Interest rate options:Interest rate options can be related to either bond yields or moneymarket rates. The purchase of interest rate options related to bonds(also known as bond options) confers a right (but not an obligation)to buy or sell bonds at a pre-determined price. Interest rate optionscan be used as a flexible instrument for the management of bothlong and short-term interest rate exposure.Interest rate swaps/asset swaps:Interest rate swaps/asset swaps are agreements between two partiesto exchange interest rate terms for a specified period. This is normallyan agreement to exchange floating rate payments for fixed rate payments,and this instrument is used in the management of long terminterest rate risk.128<strong>Annual</strong> <strong>Report</strong> <strong>2007</strong>
Branch offices in Norway(incl. insurance agents)Tromsø, Harstad, Narvik, Fauske, Bodø, Finnsnes,Mo i Rana, Namsos, Steinkjer, Trondheim,Orkanger, Kristiansund, Molde, Ålesund,Ulsteinvik, Isdalstø, Nyborg, Bergen, Stord,Husnes, Førde, Haugesund, Stavanger,Sandnes, Flekkefjord, Mandal, Kristiansand,Arendal, Gjerstad, Porsgrunn, Larvik, Bø,Sandefjord, Tønsberg, Drammen, Asker, Sandvika,Lysaker, Oslo, Hokksund, Hønefoss, Gjøvik,Hamar, Lillehammer, Jessheim, Skjetten, Ski,Haslum, Sarpsborg, Fredrikstad.Branch offices in SwedenUmeå, Sundsvall, Stockholm, Ørebro, Linköping,Gøteborg, Malmø.Head office:Other group companies:<strong>Storebrand</strong>Filipstad Brygge 1P O Box 1380 VikaN-0114 OsloNorwayTel: +47 22 31 50 50www.storebrand.noSPPTorsgatan 1410539 StockholmSwedenTel: +46 8 451 7000www.spp.se<strong>Storebrand</strong> Livsforsikring SverigeSwedish branch officeKungsgatan 12–14, level 7P O Box 5541S-114 85 StockholmSwedenTel: +46 8 700 22 00www.storebrand.se<strong>Storebrand</strong> Kapitalforvaltning ASNorgeSwedish branch officeKungsgatan 12–14, level 7P O Box 5541S-114 85 StockholmSwedenTel: +46 8 614 24 00www.storebrand.se<strong>Storebrand</strong> Helseforsikring ASFilipstad Brygge 1P O Box 1382 VikaN-0114 OsloNorwayTel: 22 31 13 30www.storebrandhelse.noDKV HälsaSwedish branch office of<strong>Storebrand</strong> Helseforsikring ASRålambsvägen 17, 14th floor, DNHusetP O Box 34242S-100 26 StockholmSwedenTel: +46 8 619 6200www.storebrandhalsa.comOslo Reinsurance Company ASARuseløkkveien 14P O Box 1753 VikaN-0122 OsloNorwayTel: +47 22 31 50 50www.oslore.no
Concept, design and production: signatur.no / Photos: Olav Heggø (Fotovisjon AS), Scanpix, <strong>Storebrand</strong> and Signatur.