Basic Tables2000 FSM <strong>Census</strong> of <strong>Chuuk</strong> <strong>State</strong>Table B19b. Income in 1999 by Municipality of Usual Residence, <strong>Chuuk</strong>: 2000 - continued[For definitions of terms and meanings of symbols, see text]────────────────────┬───────────────────────────────────────────────────────────────────│FaichukHousehold Income ├────────┬──────┬──────┬──────┬──────┬───────┬───────┬───────┬──────Family Income │ │ │ │ Roma-│Fana- │ │ │ │Income by Type │ Total│ Eot│ Udot│ num │panges│ Wonei│ Paata│ Tol│ Polle────────────────────┴────────┴──────┴──────┴──────┴──────┴───────┴───────┴───────┴──────Householdswith income. 1,590 36 182 102 88 135 157 682 208Less than $1,000 .. 558 5 37 36 43 71 34 264 68$1,000 to $1,999 .. 308 12 41 21 9 30 15 132 48$2,000 to $2,999 .. 183 - 24 15 10 7 16 80 31$3,000 to $3,999 .. 121 4 34 6 2 1 17 40 17$4,000 to $4,999 .. 82 2 12 3 3 4 9 38 11$5,000 to $7,499 .. 164 6 18 8 6 12 26 72 16$7,500 to $9,999 .. 69 4 10 7 2 6 12 20 8$10,000 to $12,499. 35 - 4 2 3 - 7 14 5$12,500 to $14,999. 21 1 1 1 2 1 6 7 2$15,000 to $19,999. 22 1 1 2 2 2 5 9 -$20,000 to $24,999. 10 - - - 2 1 4 2 1$25,000 to $34,999. 10 - - 1 3 - 2 3 1$35,000 to $49,999. 5 1 - - - - 3 1 -$50,000 or more . . 2 - - - 1 - 1 - -Median (dollars). . 1,769 3,250 2,542 1,714 1,111 951 3,794 1,583 1,750Mean (dollars). . . 3,391 4,926 3,240 3,092 4,842 2,353 6,323 2,910 2,823FAMILY INCOMEFamilieswith income. 1,560 36 179 102 88 134 156 667 198Less than $1,000 .. 537 5 36 36 43 70 34 253 60$1,000 to $1,999 .. 305 12 40 21 9 30 15 131 47$2,000 to $2,999 .. 182 - 24 15 10 7 16 80 30$3,000 to $3,999 .. 119 4 33 6 2 1 16 40 17$4,000 to $4,999 .. 81 2 12 3 3 4 9 37 11$5,000 to $7,499 .. 163 6 18 8 6 12 26 71 16$7,500 to $9,999 .. 68 4 10 7 2 6 12 19 8$10,000 to $12,499. 35 - 4 2 3 - 7 14 5$12,500 to $14,999. 21 1 1 1 2 1 6 7 2$15,000 to $19,999. 22 1 1 2 2 2 5 9 -$20,000 to $24,999. 10 - - - 2 1 4 2 1$25,000 to $34,999. 10 - - 1 3 - 2 3 1$35,000 to $49,999. 5 1 - - - - 3 1 -$50,000 or more. .. 2 - - - 1 - 1 - -Median (dollars) .. 1,797 3,250 2,563 1,714 1,111 957 3,813 1,615 1,830Mean (dollars) . .. 3,429 4,926 3,259 3,092 4,842 2,370 6,342 2,938 2,931INCOME BY TYPEPersons 15+ yrswith income . . 4,323 84 388 230 294 658 298 1,709 662Mean income($). 1,247 2,111 1,520 1,371 1,449 483 3,331 1,161 887Earnings . . . . .. 2,029 67 339 133 119 67 183 756 365Mean income($). 1,999 1,946 1,558 1,579 2,320 2,711 4,310 1,967 1,241Wages and salary. 625 34 114 39 26 40 40 271 61Mean income($). 4,021 3,400 2,784 3,829 5,198 4,313 5,520 4,283 3,957Own business. . . 1,459 35 231 95 103 28 156 504 307Mean income($). 1,057 423 912 638 1,369 326 3,641 648 689Interest & div . .. 45 1 1 - 6 - 6 30 1Mean income($). 1,161 15,000 1,440 - 722 - 2,453 539 600S.S. & other govt . 177 13 22 13 5 6 9 93 16Mean income($). 1,877 2,050 1,556 3,748 5,420 1,347 2,232 1,532 1,563Remittances. . . .. 2,880 7 52 95 226 619 174 1,181 526Mean income($). 296 256 439 538 518 204 521 283 206From inside FSM . 2,596 5 41 81 202 603 162 1,025 477Mean income($). 191 270 397 313 320 94 344 179 191From outside FSM. 1,462 2 19 57 76 591 102 507 108Mean income($). 244 223 346 452 689 117 341 297 157Other income . . .. 116 2 2 9 4 29 54 15 1Mean income($). 856 1,740 1,470 628 388 64 1,455 329 330────────────────────────────────────────────────────────────────────────────────────────Source: 2000 FSM <strong>Census</strong>236 <strong>Chuuk</strong> Branch Statistics Office, Division of Statistics, FSM Department of Economic Affairs
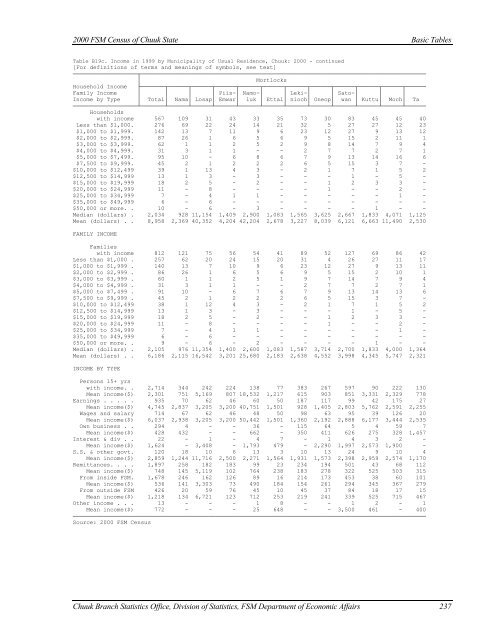
2000 FSM <strong>Census</strong> of <strong>Chuuk</strong> <strong>State</strong>Basic TablesTable B19c. Income in 1999 by Municipality of Usual Residence, <strong>Chuuk</strong>: 2000 - continued[For definitions of terms and meanings of symbols, see text]───────────────────┬────────────────────────────────────────────────────────────────────────────────────│MortlocksHousehold Income ├───────┬──────┬──────┬──────┬──────┬──────┬──────┬──────┬──────┬──────┬──────┬──────Family Income │ │ │ │ Piis-│ Namo-│ │ Leki-│ │ Sato-│ │ │Income by Type │ Total│ Nama│ Losap│ Emwar│ luk │ Ettal│ nioch│ Oneop│ wan │ Kuttu│ Moch│ Ta───────────────────┴───────┴──────┴──────┴──────┴──────┴──────┴──────┴──────┴──────┴──────┴──────┴──────Householdswith income 567 109 31 43 33 35 73 30 83 45 45 40Less than $1,000. 276 69 22 24 14 21 32 5 27 27 12 23$1,000 to $1,999. 142 13 7 11 9 6 23 12 27 9 13 12$2,000 to $2,999. 87 26 1 6 5 6 9 5 15 2 11 1$3,000 to $3,999. 62 1 1 2 5 2 9 8 14 7 9 4$4,000 to $4,999. 31 3 1 1 - - 2 7 7 2 7 1$5,000 to $7,499. 95 10 - 6 8 6 7 9 13 14 16 6$7,500 to $9,999. 45 2 1 2 2 2 6 5 15 3 7 -$10,000 to $12,499 39 1 13 4 3 - 2 1 7 1 5 2$12,500 to $14,999 13 1 3 - 3 - - - 1 - 5 -$15,000 to $19,999 18 2 5 - 2 - - 1 2 3 3 -$20,000 to $24,999 11 - 8 - - - - 1 - - 2 -$25,000 to $34,999 7 - 4 1 1 - - - - - 1 -$35,000 to $49,999 6 - 6 - - - - - - - - -$50,000 or more. . 10 - 6 - 3 - - - - 1 - -Median (dollars) . 2,034 928 11,154 1,409 2,900 1,083 1,565 3,625 2,667 1,833 4,071 1,125Mean (dollars) . . 8,958 2,369 40,352 4,204 42,204 2,678 3,227 8,039 6,121 6,663 11,490 2,530FAMILY INCOMEFamilieswith income 812 121 75 56 54 41 89 52 127 69 86 42Less than $1,000 . 257 62 20 24 15 20 31 4 26 27 11 17$1,000 to $1,999 . 140 13 7 10 9 6 23 12 27 9 13 11$2,000 to $2,999 . 86 26 1 6 5 6 9 5 15 2 10 1$3,000 to $3,999 . 60 1 1 2 5 1 9 7 14 7 9 4$4,000 to $4,999 . 31 3 1 1 - - 2 7 7 2 7 1$5,000 to $7,499 . 91 10 - 6 7 6 7 9 13 14 13 6$7,500 to $9,999 . 45 2 1 2 2 2 6 5 15 3 7 -$10,000 to $12,499 38 1 12 4 3 - 2 1 7 1 5 2$12,500 to $14,999 13 1 3 - 3 - - - 1 - 5 -$15,000 to $19,999 18 2 5 - 2 - - 1 2 3 3 -$20,000 to $24,999 11 - 8 - - - - 1 - - 2 -$25,000 to $34,999 7 - 4 1 1 - - - - - 1 -$35,000 to $49,999 6 - 6 - - - - - - - - -$50,000 or more. . 9 - 6 - 2 - - - - 1 - -Median (dollars) . 2,105 976 11,354 1,400 2,600 1,083 1,587 3,714 2,700 1,833 4,000 1,364Mean (dollars) . . 6,186 2,115 16,542 3,201 25,680 2,183 2,638 4,552 3,998 4,345 5,747 2,321INCOME BY TYPEPersons 15+ yrswith income. . 2,714 344 242 224 138 77 383 267 597 90 222 130Mean income($) 2,301 751 5,169 807 18,532 1,217 615 903 851 3,331 2,329 778Earnings . . . . . 935 70 62 46 60 50 187 117 99 42 175 27Mean income($) 4,745 2,837 3,205 3,200 40,751 1,501 928 1,405 2,803 5,762 2,591 2,255Wages and salary 714 67 62 46 48 50 98 63 95 39 126 20Mean income($) 6,037 2,938 3,205 3,200 50,442 1,501 1,360 2,192 2,888 6,177 3,444 2,535Own business . . 294 4 - - 36 - 115 64 5 4 59 7Mean income($) 428 432 - - 662 - 350 411 626 275 328 1,457Interest & div . . 22 - 1 - 4 7 - 1 4 3 2 -Mean income($) 1,624 - 3,408 - 1,793 479 - 2,290 1,997 2,573 1,900 -S.S. & other govt. 120 18 10 6 13 3 10 13 24 9 10 4Mean income($) 2,859 1,244 11,716 2,500 2,271 1,564 1,931 1,573 2,398 2,959 2,574 1,170Remittances. . . . 1,897 258 182 183 99 23 234 194 501 43 68 112Mean income($) 748 145 5,119 102 764 238 183 278 322 525 503 315From inside FSM. 1,678 246 162 126 89 16 214 173 453 38 60 101Mean income($) 536 141 3,303 73 490 184 154 261 294 345 367 279From outside FSM 426 20 59 76 45 10 45 37 84 18 17 15Mean income($) 1,218 134 6,721 123 712 253 219 241 339 525 715 467Other income . . . 13 - - - 1 8 - - 1 2 - 1Mean income($) 772 - - - 25 648 - - 3,500 461 - 400────────────────────────────────────────────────────────────────────────────────────────────────────────Source: 2000 FSM <strong>Census</strong><strong>Chuuk</strong> Branch Statistics Office, Division of Statistics, FSM Department of Economic Affairs 237
- Page 5:
iii
- Page 12 and 13:
Preface2000 FSM Census of Chuukx
- Page 14 and 15:
Table of contents2000 FSM Census of
- Page 16 and 17:
LIST OF TEXT TABLESTABLEPageChapter
- Page 18 and 19:
List of Text Table2000 FSM Census o
- Page 20 and 21:
LIST OF FIGURESFIGUREPageFigure 1.1
- Page 22 and 23:
List of Basic-Tables2000 FSM Census
- Page 24 and 25:
MAP OF FSMxxiiChuuk Branch Statisti
- Page 27 and 28:
2000 FSM Census of Chuuk StateExecu
- Page 29 and 30:
CHAPTER 1INTRODUCTIONThe creation o
- Page 31 and 32:
2000 FSM Census of Chuuk StateChapt
- Page 33 and 34:
2000 FSM Census of Chuuk StateChapt
- Page 35 and 36:
2000 FSM Census of Chuuk StateChapt
- Page 37 and 38:
2000 FSM Census of Chuuk StateChapt
- Page 39 and 40:
2000 FSM Census of Chuuk StateChapt
- Page 41 and 42:
2000 FSM Census of Chuuk StateChapt
- Page 43 and 44:
2000 FSM Census of Chuuk State Chap
- Page 45:
2000 FSM Census of Chuuk StateChapt
- Page 48 and 49:
Chapter 2. Age and Sex Structure200
- Page 50 and 51:
Chapter 2. Age and Sex Structure200
- Page 52 and 53:
Chapter 2. Age and Sex Structure200
- Page 55 and 56:
CHAPTER 3HOUSEHOLDS, FAMILIES, AND
- Page 57 and 58:
2000 FSM Census of Chuuk StateChapt
- Page 59 and 60:
2000 FSM Census of Chuuk StateChapt
- Page 61:
2000 FSM Census of Chuuk StateChapt
- Page 64 and 65:
Chapter 4. Fertility2000 FSM Census
- Page 66 and 67:
Chapter 4. Fertility2000 FSM Census
- Page 68 and 69:
Chapter 4. Fertility2000 FSM Census
- Page 71 and 72:
CHAPTER 5MORTALITYIntroductionAs re
- Page 73 and 74:
2000 FSM Census of Chuuk StateChapt
- Page 75:
2000 FSM Census of Chuuk StateChapt
- Page 78 and 79:
Chapter 6. Migration2000 FSM Census
- Page 80 and 81:
Chapter 6. Migration2000 FSM Census
- Page 82 and 83:
Chapter 6. Migration2000 FSM Census
- Page 84 and 85:
Chapter 6. Migration2000 FSM Census
- Page 86 and 87:
Chapter 7. Religion, Ethnicity, and
- Page 88 and 89:
Chapter 7. Religion, Ethnicity, and
- Page 90 and 91:
Chapter 7. Religion, Ethnicity, and
- Page 92 and 93:
Chapter 8. Education2000 FSM Census
- Page 94 and 95:
Chapter 8. Education2000 FSM Census
- Page 96 and 97:
Chapter 8. Education2000 FSM Census
- Page 98 and 99:
Chapter 8. Education2000 FSM Census
- Page 100 and 101:
Chapter 8. Education2000 FSM Census
- Page 103 and 104:
CHAPTER 9ECONOMIC ACTIVITYIntroduct
- Page 105 and 106:
2000 FSM Census of Chuuk StateChapt
- Page 107 and 108:
2000 FSM Census of Chuuk StateChapt
- Page 109 and 110:
2000 FSM Census of Chuuk StateChapt
- Page 111 and 112:
2000 FSM Census of Chuuk StateChapt
- Page 113 and 114:
2000 FSM Census of Chuuk StateChapt
- Page 115 and 116:
2000 FSM Census of Chuuk StateChapt
- Page 117 and 118:
CHAPTER 10INDUSTRY AND OCCUPATIONIn
- Page 119 and 120:
2000 FSM Census of Chuuk StateChapt
- Page 121 and 122:
2000 FSM Census of Chuuk StateChapt
- Page 123 and 124:
2000 FSM Census of Chuuk StateChapt
- Page 125 and 126:
2000 FSM Census of Chuuk StateChapt
- Page 127 and 128:
2000 FSM Census of Chuuk StateChapt
- Page 129 and 130:
CHAPTER 11INCOMEIntroductionThe 200
- Page 131 and 132:
2000 FSM Census of Chuuk StateChapt
- Page 133 and 134:
2000 FSM Census of Chuuk StateChapt
- Page 135 and 136:
2000 FSM Census of Chuuk StateChapt
- Page 137:
2000 FSM Census of Chuuk StateChapt
- Page 140 and 141:
Chapter 12. Housing2000 FSM Census
- Page 142 and 143:
Chapter 12. Housing2000 FSM Census
- Page 144 and 145:
Chapter 12. Housing2000 FSM Census
- Page 146 and 147:
Chapter 12. Housing2000 FSM Census
- Page 148 and 149:
Chapter 12. Housing2000 FSM Census
- Page 150 and 151:
Chapter 12. Housing2000 FSM Census
- Page 152 and 153:
Chapter 12. Housing2000 FSM Census
- Page 154:
Chapter 12. Housing2000 FSM Census
- Page 157 and 158:
BIBLIOGRAPHYArriaga, E.E., (1983).
- Page 159:
2000 FSM Census of Chuuk StateBibli
- Page 162 and 163:
Basic Tables2000 FSM Census of Chuu
- Page 164 and 165:
Basic Tables2000 FSM Census of Chuu
- Page 166 and 167:
Basic Tables2000 FSM Census of Chuu
- Page 168 and 169:
Basic Tables2000 FSM Census of Chuu
- Page 170 and 171:
Basic Tables2000 FSM Census of Chuu
- Page 172 and 173:
Basic Tables2000 FSM Census of Chuu
- Page 174 and 175:
Basic Tables2000 FSM Census of Chuu
- Page 176 and 177:
Basic Tables2000 FSM Census of Chuu
- Page 178 and 179:
Basic Tables2000 FSM Census of Chuu
- Page 180 and 181:
Basic Tables2000 FSM Census of Chuu
- Page 182 and 183:
Basic Tables2000 FSM Census of Chuu
- Page 184 and 185:
Basic Tables2000 FSM Census of Chuu
- Page 186 and 187:
Basic Tables2000 FSM Census of Chuu
- Page 188 and 189:
Basic Tables2000 FSM Census of Chuu
- Page 190 and 191:
Basic Tables2000 FSM Census of Chuu
- Page 192 and 193:
Basic Tables2000 FSM Census of Chuu
- Page 194 and 195:
Basic Tables2000 FSM Census of Chuu
- Page 196 and 197:
Basic Tables2000 FSM Census of Chuu
- Page 198 and 199:
Basic Tables2000 FSM Census of Chuu
- Page 200 and 201:
Basic Tables2000 FSM Census of Chuu
- Page 202 and 203:
Basic Tables2000 FSM Census of Chuu
- Page 204 and 205:
Basic Tables2000 FSM Census of Chuu
- Page 206 and 207:
Basic Tables2000 FSM Census of Chuu
- Page 208 and 209:
Basic Tables2000 FSM Census of Chuu
- Page 210 and 211:
Basic Tables2000 FSM Census of Chuu
- Page 212 and 213:
Basic Tables2000 FSM Census of Chuu
- Page 214 and 215: Basic Tables2000 FSM Census of Chuu
- Page 216 and 217: Basic Tables2000 FSM Census of Chuu
- Page 218 and 219: Basic Tables2000 FSM Census of Chuu
- Page 220 and 221: Basic Tables2000 FSM Census of Chuu
- Page 222 and 223: Basic Tables2000 FSM Census of Chuu
- Page 224 and 225: Basic Tables2000 FSM Census of Chuu
- Page 226 and 227: Basic Tables2000 FSM Census of Chuu
- Page 228 and 229: Basic Tables2000 FSM Census of Chuu
- Page 230 and 231: Basic Tables2000 FSM Census of Chuu
- Page 232 and 233: Basic Tables2000 FSM Census of Chuu
- Page 234 and 235: Basic Tables2000 FSM Census of Chuu
- Page 236 and 237: Basic Tables2000 FSM Census of Chuu
- Page 238 and 239: Basic Tables2000 FSM Census of Chuu
- Page 240 and 241: Basic Tables2000 FSM Census of Chuu
- Page 242 and 243: Basic Tables2000 FSM Census of Chuu
- Page 244 and 245: Basic Tables2000 FSM Census of Chuu
- Page 246 and 247: Basic Tables2000 FSM Census of Chuu
- Page 248 and 249: Basic Tables2000 FSM Census of Chuu
- Page 250 and 251: Basic Tables2000 FSM Census of Chuu
- Page 252 and 253: Basic Tables2000 FSM Census of Chuu
- Page 254 and 255: Basic Tables2000 FSM Census of Chuu
- Page 256 and 257: Basic Tables2000 FSM Census of Chuu
- Page 258 and 259: Basic Tables2000 FSM Census of Chuu
- Page 260 and 261: Basic Tables2000 FSM Census of Chuu
- Page 262 and 263: Basic Tables2000 FSM Census of Chuu
- Page 266 and 267: Basic Tables2000 FSM Census of Chuu
- Page 268 and 269: Basic Tables2000 FSM Census of Chuu
- Page 270 and 271: Basic Tables2000 FSM Census of Chuu
- Page 272 and 273: Basic Tables2000 FSM Census of Chuu
- Page 274 and 275: Basic Tables2000 FSM Census of Chuu
- Page 276 and 277: Basic Tables2000 FSM Census of Chuu
- Page 278 and 279: Basic Tables2000 FSM Census of Chuu
- Page 280 and 281: Basic Tables2000 FSM Census of Chuu
- Page 282 and 283: Basic Tables2000 FSM Census of Chuu
- Page 284 and 285: Basic Tables2000 FSM Census of Chuu
- Page 286 and 287: Basic Tables2000 FSM Census of Chuu
- Page 288 and 289: Basic Tables2000 FSM Census of Chuu
- Page 290 and 291: Basic Tables2000 FSM Census of Chuu
- Page 292 and 293: Questionnaire2000 FSM Census of Chu
- Page 294 and 295: Questionnaire2000 FSM Census of Chu
- Page 296 and 297: Questionnaire2000 FSM Census of Chu