Basic Tables2000 FSM <strong>Census</strong> of <strong>Chuuk</strong> <strong>State</strong>Table B14d. Labor Force Characteristics by Municipality of Usual Residence, <strong>Chuuk</strong>: 2000 - continued[For definitions of terms and meanings of symbols, see text]────────────────────────────────┬───────────────────────────┬───────────────────────────┬──────────────────│ Pattiw │ Namonwito │ Halls├─────┬────┬─────┬────┬─────┼─────┬─────┬────┬────┬─────┼────┬────┬───┬────Labor Force Status │ │ │ Pol-│Pol-│Tama-│ │ │ │Una-│Pihe-│Nom-│Fan-│ │Mur-Subsistence Activity│Total│Houk│ owat│ lap│ tam│Makur│Onoun│Onou│ nu│ rarh│win │ anu│Ruo│illo────────────────────────────────┴─────┴────┴─────┴────┴─────┴─────┴─────┴────┴────┴─────┴────┴────┴───┴────LABOR FORCE STATUSPersons 15+ years . . . . . 3,640 252 633 533 200 86 321 79 99 130 447 215 297 348In labor force . . . . . . . . . 1,729 171 50 159 111 66 203 50 57 59 295 132 176 200Percent . . . . . . . . . 47.5 67.9 7.9 29.8 55.5 76.7 63.2 63.3 57.6 45.4 66.0 61.459.3 57.5Employed . . . . . . . . . . 1,080 161 44 27 76 66 153 47 20 59 148 48 112 119Formal work . . . . . . . 315 25 9 15 19 23 28 16 19 14 42 21 39 45Agriculture/Fishing . . . 765 136 35 12 57 43 125 31 1 45 106 27 73 74Subsistence . . . . . . 625 136 35 12 7 43 125 31 1 45 67 26 67 30Market Oriented . . . . 140 - - - 50 - - - - - 39 1 6 44Unemployed . . . . . . . . . 649 10 6 132 35 - 50 3 37 - 147 84 64 81Percent of labor force. . 37.5 5.8 12.0 83.0 31.5 - 24.6 6.0 64.9 - 49.8 63.636.4 40.5Not in labor force . . . . . . . 1,911 81 583 374 89 20 118 29 42 71 152 83 121 148Could have taken a job . . . 34 - 1 1 1 - 12 - - 17 - - 2 -Not available for work . . . 1,877 81 582 373 88 20 106 29 42 54 152 83 119 148Females 15+ years . . . . . 1,817 142 332 262 96 39 171 41 46 64 218 97 138 171In labor force . . . . . . . . . 740 94 18 51 52 30 109 23 19 26 114 47 74 83Percent . . . . . . . . . 40.7 66.2 5.4 19.5 54.2 76.9 63.7 56.1 41.3 40.6 52.3 48.553.6 48.5Employed . . . . . . . . . . 445 90 16 4 40 30 76 21 6 26 42 15 46 33Formal work . . . . . . . 53 5 2 1 3 3 3 4 5 2 2 7 6 10Agriculture/Fishing . . . 392 85 14 3 37 27 73 17 1 24 40 8 40 23Subsistence . . . . . . 335 85 14 3 4 27 73 17 1 24 26 8 38 15Market Oriented . . . . 57 - - - 33 - - - - - 14 - 2 8Unemployed . . . . . . . . . 295 4 2 47 12 - 33 2 13 - 72 32 28 50Percent of labor force. . 39.9 4.3 11.1 92.2 23.1 - 30.3 8.7 68.4 - 63.2 68.137.8 60.2Not in labor force . . . . . . . 1,077 48 314 211 44 9 62 18 27 38 104 50 64 88Could have taken job . . . . 22 - - 1 - - 10 - - 10 - - 1 -Not available for work . . . 1,055 48 314 210 44 9 52 18 27 28 104 50 63 88With own children under 6 yrs. . 504 41 70 59 33 14 52 12 21 19 61 33 38 51In labor force . . . . . . . . 263 31 9 6 23 14 41 10 5 10 37 20 30 27With own children 6-17 yrs only. 581 48 81 72 32 15 63 12 16 19 77 37 44 65In labor force . . . . . . . . 297 34 11 6 22 14 50 11 7 10 39 19 34 40SUBSISTENCE ACTIVITYTotal, for home use . . . 692 136 35 12 57 43 124 31 1 45 73 27 73 35Gardening . . . 428 97 26 3 42 29 92 15 - 30 41 - 48 5Fishing . . . 351 58 25 12 25 18 45 13 1 21 47 27 30 29Animal raising . . . 314 72 30 6 34 37 72 - - 27 15 6 3 12Other . . . 227 49 16 11 3 3 94 23 - - 26 - - 2. . .Total, sold any . . . 140 - - - 50 - - - - - 39 1 6 44Gardening. . . . . . . . . . . . 41 - - - 37 - - - - - 2 - 1 1Fishing . . . 86 - - - 21 - - - - - 23 1 4 37Animal raising . . . 32 - - - 29 - - - - - 1 - - 2Other . . . 23 - - - 3 - - - - - 13 - 1 6. . .Total, gave away . . . 151 1 - - 35 - 19 - - - 42 2 28 24Gardening . . . 91 1 - - 20 - 4 - - - 28 - 28 10Fishing . . . 67 - - - 13 - 6 - - - 36 1 - 11Animal raising . . . 19 - - - 15 - - - - - - - - 4Other. . . . . . . . . . . . . . 26 - - - - - 17 - - - 4 1 - 4. . .Females, for home use . 369 85 14 3 37 27 73 17 1 24 28 8 40 12Gardening . . 284 78 12 1 32 19 50 13 - 19 18 - 38 4Fishing . . . 61 10 4 3 5 3 5 - 1 3 10 8 3 6Animal raising . . . 204 55 13 - 25 25 55 - - 17 5 4 1 4Other. . . . . . . . . . . . . . 140 30 5 3 3 2 63 17 - - 15 - - 2. . .Females, sold any . 57 - - - 33 - - - - - 14 - 2 8Gardening . . . 32 - - - 29 - - - - - 1 - 1 1Fishing . . . 7 - - - 5 - - - - - - - - 2Animal raising . . . 21 - - - 20 - - - - - - - - 1Other. . . . . . . . . . . . . . 22 - - - 3 - - - - - 13 - 1 5Females, gave away. . . . . 98 1 - - 25 - 15 - - - 18 - 25 14Gardening. . . . . . . . . . . . 72 1 - - 18 - 3 - - - 15 - 25 10Fishing. . . . . . . . . . . . . 20 - - - 3 - 2 - - - 14 - - 1Animal raising . . . . . . . . . 17 - - - 15 - - - - - - - - 2Other. . . . . . . . . . . . . . 21 - - - - - 14 - - - 3 - - 4───────────────────────────────────────────────────────────────────────────────────────────────────────────Source: 2000 FSM <strong>Census</strong>214 <strong>Chuuk</strong> Branch Statistics Office, Division of Statistics, FSM Department of Economic Affairs
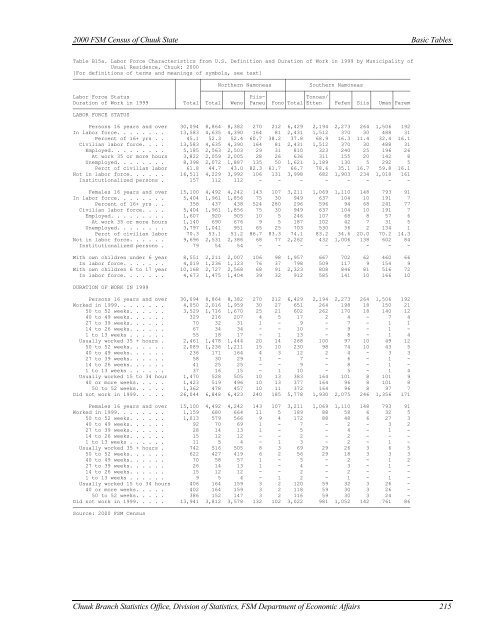
2000 FSM <strong>Census</strong> of <strong>Chuuk</strong> <strong>State</strong>Basic TablesTable B15a. Labor Force Characteristics from U.S. Definition and Duration of Work in 1999 by Municipality ofUsual Residence, <strong>Chuuk</strong>: 2000[For definitions of terms and meanings of symbols, see text]────────────────────────────────┬───────┬──────────────────────────┬───────────────────────────────────────│ │ Northern Namoneas │ Southern Namoneas│ ├──────┬──────┬──────┬─────┼─────┬───────┬──────┬─────┬──────┬─────Labor Force Status │ │ │ │ Piis-│ │ │Tonoas/│ │ │ │Duration of Work in 1999 │ Total│ Total│ Weno│ Paneu│ Fono│Total│Etten │ Fefen│ Siis│ Uman│Parem────────────────────────────────┴───────┴──────┴──────┴──────┴─────┴─────┴───────┴──────┴─────┴──────┴─────LABOR FORCE STATUSPersons 16 years and over 30,094 8,864 8,382 270 212 6,429 2,194 2,273 264 1,506 192In labor force. . . . . . . . 13,583 4,635 4,390 164 81 2,431 1,512 370 30 488 31Percent of 16+ yrs . . 45.1 52.3 52.4 60.7 38.2 37.8 68.9 16.3 11.4 32.4 16.1Civilian labor force. . . . 13,583 4,635 4,390 164 81 2,431 1,512 370 30 488 31Employed. . . . . . . . . 5,185 2,563 2,503 29 31 810 323 240 25 196 26At work 35 or more hours 3,822 2,059 2,005 28 26 636 311 155 20 142 8Unemployed. . . . . . . . 8,398 2,072 1,887 135 50 1,621 1,189 130 5 292 5Perct of civilian labor 61.8 44.7 43.0 82.3 61.7 66.7 78.6 35.1 16.7 59.8 16.1Not in labor force. . . . . . 16,511 4,229 3,992 106 131 3,998 682 1,903 234 1,018 161Institutionalized persons . 157 112 112 - - - - - - - -Females 16 years and over 15,100 4,492 4,242 143 107 3,211 1,069 1,110 148 793 91In labor force. . . . . . . . 5,404 1,961 1,856 75 30 949 637 104 10 191 7Percent of 16+ yrs . . 358 437 438 524 280 296 596 94 68 241 77Civilian labor force. . . . 5,404 1,961 1,856 75 30 949 637 104 10 191 7Employed. . . . . . . . . 1,607 920 905 10 5 246 107 68 8 57 6At work 35 or more hours 1,140 690 676 9 5 187 102 42 7 31 5Unemployed. . . . . . . . 3,797 1,041 951 65 25 703 530 36 2 134 1Perct of civilian labor 70.3 53.1 51.2 86.7 83.3 74.1 83.2 34.6 20.0 70.2 14.3Not in labor force. . . . . . 9,696 2,531 2,386 68 77 2,262 432 1,006 138 602 84Institutionalized persons . 79 54 54 - - - - - - - -With own children under 6 year 8,551 2,211 2,007 106 98 1,957 667 702 62 460 66In labor force. . . . . . . 4,019 1,236 1,123 76 37 798 509 117 9 154 9With own children 6 to 17 year 10,168 2,727 2,568 68 91 2,323 808 846 81 516 72In labor force. . . . . . . 4,673 1,475 1,404 39 32 912 585 141 10 166 10DURATION OF WORK IN 1999Persons 16 years and over 30,094 8,864 8,382 270 212 6,429 2,194 2,273 264 1,506 192Worked in 1999. . . . . . . . 4,050 2,016 1,959 30 27 651 264 198 18 150 2150 to 52 weeks. . . . . . 3,529 1,716 1,670 25 21 602 262 170 18 140 1240 to 49 weeks. . . . . . 329 216 207 4 5 17 2 4 - 7 427 to 39 weeks. . . . . . 70 32 31 1 - 9 - 7 - 1 114 to 26 weeks. . . . . . 67 34 34 - - 10 - 9 - 1 -1 to 13 weeks . . . . . . 55 18 17 - 1 13 - 8 - 1 4Usually worked 35 + hours . 2,461 1,478 1,444 20 14 268 100 97 10 49 1250 to 52 weeks. . . . . . 2,089 1,236 1,211 15 10 230 98 74 10 43 540 to 49 weeks. . . . . . 236 171 164 4 3 12 2 4 - 3 327 to 39 weeks. . . . . . 58 30 29 1 - 7 - 6 - 1 -14 to 26 weeks. . . . . . 41 25 25 - - 9 - 8 - 1 -1 to 13 weeks . . . . . . 37 16 15 - 1 10 - 5 - 1 4Usually worked 15 to 34 hour 1,470 528 505 10 13 383 164 101 8 101 940 or more weeks. . . . . 1,423 519 496 10 13 377 164 96 8 101 850 to 52 weeks. . . . . 1,362 478 457 10 11 372 164 96 8 97 7Did not work in 1999. . . . . 26,044 6,848 6,423 240 185 5,778 1,930 2,075 246 1,356 171Females 16 years and over 15,100 4,492 4,242 143 107 3,211 1,069 1,110 148 793 91Worked in 1999. . . . . . . . 1,159 680 664 11 5 189 88 58 6 32 550 to 52 weeks. . . . . . 1,013 579 566 9 4 172 88 48 6 27 340 to 49 weeks. . . . . . 92 70 69 1 - 7 - 2 - 3 227 to 39 weeks. . . . . . 28 14 13 1 - 5 - 4 - 1 -14 to 26 weeks. . . . . . 15 12 12 - - 2 - 2 - - -1 to 13 weeks . . . . . . 11 5 4 - 1 3 - 2 - 1 -Usually worked 35 + hours . 742 516 505 8 3 69 29 26 3 6 550 to 52 weeks. . . . . . 622 427 419 6 2 56 29 18 3 3 340 to 49 weeks. . . . . . 70 58 57 1 - 5 - 2 - 1 227 to 39 weeks. . . . . . 26 14 13 1 - 4 - 3 - 1 -14 to 26 weeks. . . . . . 15 12 12 - - 2 - 2 - - -1 to 13 weeks . . . . . . 9 5 4 - 1 2 - 1 - 1 -Usually worked 15 to 34 hours 406 164 159 3 2 120 59 32 3 26 -40 or more weeks. . . . . 402 164 159 3 2 118 59 30 3 26 -50 to 52 weeks. . . . . 386 152 147 3 2 116 59 30 3 24 -Did not work in 1999. . . . . 13,941 3,812 3,578 132 102 3,022 981 1,052 142 761 86───────────────────────────────────────────────────────────────────────────────────────────────────────────Source: 2000 FSM <strong>Census</strong><strong>Chuuk</strong> Branch Statistics Office, Division of Statistics, FSM Department of Economic Affairs 215
- Page 5:
iii
- Page 12 and 13:
Preface2000 FSM Census of Chuukx
- Page 14 and 15:
Table of contents2000 FSM Census of
- Page 16 and 17:
LIST OF TEXT TABLESTABLEPageChapter
- Page 18 and 19:
List of Text Table2000 FSM Census o
- Page 20 and 21:
LIST OF FIGURESFIGUREPageFigure 1.1
- Page 22 and 23:
List of Basic-Tables2000 FSM Census
- Page 24 and 25:
MAP OF FSMxxiiChuuk Branch Statisti
- Page 27 and 28:
2000 FSM Census of Chuuk StateExecu
- Page 29 and 30:
CHAPTER 1INTRODUCTIONThe creation o
- Page 31 and 32:
2000 FSM Census of Chuuk StateChapt
- Page 33 and 34:
2000 FSM Census of Chuuk StateChapt
- Page 35 and 36:
2000 FSM Census of Chuuk StateChapt
- Page 37 and 38:
2000 FSM Census of Chuuk StateChapt
- Page 39 and 40:
2000 FSM Census of Chuuk StateChapt
- Page 41 and 42:
2000 FSM Census of Chuuk StateChapt
- Page 43 and 44:
2000 FSM Census of Chuuk State Chap
- Page 45:
2000 FSM Census of Chuuk StateChapt
- Page 48 and 49:
Chapter 2. Age and Sex Structure200
- Page 50 and 51:
Chapter 2. Age and Sex Structure200
- Page 52 and 53:
Chapter 2. Age and Sex Structure200
- Page 55 and 56:
CHAPTER 3HOUSEHOLDS, FAMILIES, AND
- Page 57 and 58:
2000 FSM Census of Chuuk StateChapt
- Page 59 and 60:
2000 FSM Census of Chuuk StateChapt
- Page 61:
2000 FSM Census of Chuuk StateChapt
- Page 64 and 65:
Chapter 4. Fertility2000 FSM Census
- Page 66 and 67:
Chapter 4. Fertility2000 FSM Census
- Page 68 and 69:
Chapter 4. Fertility2000 FSM Census
- Page 71 and 72:
CHAPTER 5MORTALITYIntroductionAs re
- Page 73 and 74:
2000 FSM Census of Chuuk StateChapt
- Page 75:
2000 FSM Census of Chuuk StateChapt
- Page 78 and 79:
Chapter 6. Migration2000 FSM Census
- Page 80 and 81:
Chapter 6. Migration2000 FSM Census
- Page 82 and 83:
Chapter 6. Migration2000 FSM Census
- Page 84 and 85:
Chapter 6. Migration2000 FSM Census
- Page 86 and 87:
Chapter 7. Religion, Ethnicity, and
- Page 88 and 89:
Chapter 7. Religion, Ethnicity, and
- Page 90 and 91:
Chapter 7. Religion, Ethnicity, and
- Page 92 and 93:
Chapter 8. Education2000 FSM Census
- Page 94 and 95:
Chapter 8. Education2000 FSM Census
- Page 96 and 97:
Chapter 8. Education2000 FSM Census
- Page 98 and 99:
Chapter 8. Education2000 FSM Census
- Page 100 and 101:
Chapter 8. Education2000 FSM Census
- Page 103 and 104:
CHAPTER 9ECONOMIC ACTIVITYIntroduct
- Page 105 and 106:
2000 FSM Census of Chuuk StateChapt
- Page 107 and 108:
2000 FSM Census of Chuuk StateChapt
- Page 109 and 110:
2000 FSM Census of Chuuk StateChapt
- Page 111 and 112:
2000 FSM Census of Chuuk StateChapt
- Page 113 and 114:
2000 FSM Census of Chuuk StateChapt
- Page 115 and 116:
2000 FSM Census of Chuuk StateChapt
- Page 117 and 118:
CHAPTER 10INDUSTRY AND OCCUPATIONIn
- Page 119 and 120:
2000 FSM Census of Chuuk StateChapt
- Page 121 and 122:
2000 FSM Census of Chuuk StateChapt
- Page 123 and 124:
2000 FSM Census of Chuuk StateChapt
- Page 125 and 126:
2000 FSM Census of Chuuk StateChapt
- Page 127 and 128:
2000 FSM Census of Chuuk StateChapt
- Page 129 and 130:
CHAPTER 11INCOMEIntroductionThe 200
- Page 131 and 132:
2000 FSM Census of Chuuk StateChapt
- Page 133 and 134:
2000 FSM Census of Chuuk StateChapt
- Page 135 and 136:
2000 FSM Census of Chuuk StateChapt
- Page 137:
2000 FSM Census of Chuuk StateChapt
- Page 140 and 141:
Chapter 12. Housing2000 FSM Census
- Page 142 and 143:
Chapter 12. Housing2000 FSM Census
- Page 144 and 145:
Chapter 12. Housing2000 FSM Census
- Page 146 and 147:
Chapter 12. Housing2000 FSM Census
- Page 148 and 149:
Chapter 12. Housing2000 FSM Census
- Page 150 and 151:
Chapter 12. Housing2000 FSM Census
- Page 152 and 153:
Chapter 12. Housing2000 FSM Census
- Page 154:
Chapter 12. Housing2000 FSM Census
- Page 157 and 158:
BIBLIOGRAPHYArriaga, E.E., (1983).
- Page 159:
2000 FSM Census of Chuuk StateBibli
- Page 162 and 163:
Basic Tables2000 FSM Census of Chuu
- Page 164 and 165:
Basic Tables2000 FSM Census of Chuu
- Page 166 and 167:
Basic Tables2000 FSM Census of Chuu
- Page 168 and 169:
Basic Tables2000 FSM Census of Chuu
- Page 170 and 171:
Basic Tables2000 FSM Census of Chuu
- Page 172 and 173:
Basic Tables2000 FSM Census of Chuu
- Page 174 and 175:
Basic Tables2000 FSM Census of Chuu
- Page 176 and 177:
Basic Tables2000 FSM Census of Chuu
- Page 178 and 179:
Basic Tables2000 FSM Census of Chuu
- Page 180 and 181:
Basic Tables2000 FSM Census of Chuu
- Page 182 and 183:
Basic Tables2000 FSM Census of Chuu
- Page 184 and 185:
Basic Tables2000 FSM Census of Chuu
- Page 186 and 187:
Basic Tables2000 FSM Census of Chuu
- Page 188 and 189:
Basic Tables2000 FSM Census of Chuu
- Page 190 and 191:
Basic Tables2000 FSM Census of Chuu
- Page 192 and 193: Basic Tables2000 FSM Census of Chuu
- Page 194 and 195: Basic Tables2000 FSM Census of Chuu
- Page 196 and 197: Basic Tables2000 FSM Census of Chuu
- Page 198 and 199: Basic Tables2000 FSM Census of Chuu
- Page 200 and 201: Basic Tables2000 FSM Census of Chuu
- Page 202 and 203: Basic Tables2000 FSM Census of Chuu
- Page 204 and 205: Basic Tables2000 FSM Census of Chuu
- Page 206 and 207: Basic Tables2000 FSM Census of Chuu
- Page 208 and 209: Basic Tables2000 FSM Census of Chuu
- Page 210 and 211: Basic Tables2000 FSM Census of Chuu
- Page 212 and 213: Basic Tables2000 FSM Census of Chuu
- Page 214 and 215: Basic Tables2000 FSM Census of Chuu
- Page 216 and 217: Basic Tables2000 FSM Census of Chuu
- Page 218 and 219: Basic Tables2000 FSM Census of Chuu
- Page 220 and 221: Basic Tables2000 FSM Census of Chuu
- Page 222 and 223: Basic Tables2000 FSM Census of Chuu
- Page 224 and 225: Basic Tables2000 FSM Census of Chuu
- Page 226 and 227: Basic Tables2000 FSM Census of Chuu
- Page 228 and 229: Basic Tables2000 FSM Census of Chuu
- Page 230 and 231: Basic Tables2000 FSM Census of Chuu
- Page 232 and 233: Basic Tables2000 FSM Census of Chuu
- Page 234 and 235: Basic Tables2000 FSM Census of Chuu
- Page 236 and 237: Basic Tables2000 FSM Census of Chuu
- Page 238 and 239: Basic Tables2000 FSM Census of Chuu
- Page 240 and 241: Basic Tables2000 FSM Census of Chuu
- Page 244 and 245: Basic Tables2000 FSM Census of Chuu
- Page 246 and 247: Basic Tables2000 FSM Census of Chuu
- Page 248 and 249: Basic Tables2000 FSM Census of Chuu
- Page 250 and 251: Basic Tables2000 FSM Census of Chuu
- Page 252 and 253: Basic Tables2000 FSM Census of Chuu
- Page 254 and 255: Basic Tables2000 FSM Census of Chuu
- Page 256 and 257: Basic Tables2000 FSM Census of Chuu
- Page 258 and 259: Basic Tables2000 FSM Census of Chuu
- Page 260 and 261: Basic Tables2000 FSM Census of Chuu
- Page 262 and 263: Basic Tables2000 FSM Census of Chuu
- Page 264 and 265: Basic Tables2000 FSM Census of Chuu
- Page 266 and 267: Basic Tables2000 FSM Census of Chuu
- Page 268 and 269: Basic Tables2000 FSM Census of Chuu
- Page 270 and 271: Basic Tables2000 FSM Census of Chuu
- Page 272 and 273: Basic Tables2000 FSM Census of Chuu
- Page 274 and 275: Basic Tables2000 FSM Census of Chuu
- Page 276 and 277: Basic Tables2000 FSM Census of Chuu
- Page 278 and 279: Basic Tables2000 FSM Census of Chuu
- Page 280 and 281: Basic Tables2000 FSM Census of Chuu
- Page 282 and 283: Basic Tables2000 FSM Census of Chuu
- Page 284 and 285: Basic Tables2000 FSM Census of Chuu
- Page 286 and 287: Basic Tables2000 FSM Census of Chuu
- Page 288 and 289: Basic Tables2000 FSM Census of Chuu
- Page 290 and 291: Basic Tables2000 FSM Census of Chuu
- Page 292 and 293:
Questionnaire2000 FSM Census of Chu
- Page 294 and 295:
Questionnaire2000 FSM Census of Chu
- Page 296 and 297:
Questionnaire2000 FSM Census of Chu