Chuuk State Census Report - pacificweb.org
Chuuk State Census Report - pacificweb.org Chuuk State Census Report - pacificweb.org
Basic Tables2000 FSM Census of Chuuk StateTable B12d. School Enrollment and Educational Attainment by Municipality of Usual Residence, Chuuk: 2000[For definitions of terms and meanings of symbols, see text] - cont'd────────────────────────────────┬───────────────────────────┬───────────────────────────┬──────────────────│ Pattiw │ Namonwito │ Halls├─────┬────┬─────┬────┬─────┼─────┬─────┬────┬────┬─────┼────┬────┬───┬────│ │ │ Pol-│Pol-│Tama-│ │ │ │Una-│Pihe-│Nom-│Fan-│ │Mur-Education│Total│Houk│ owat│ lap│ tam│Makur│Onoun│Onou│ nu│ rarh│win │ anu│Ruo│illo────────────────────────────────┴─────┴────┴─────┴────┴─────┴─────┴─────┴────┴────┴─────┴────┴────┴───┴────SCHOOL ENROLLMENT AND TYPE OF SCHOOLPersons 3+ yearsand enrolled in school . . 2,070 165 459 100 132 58 279 61 44 75 209 104 183 201Preprimary school. . . . . . . . 97 13 23 17 8 3 19 - - - 5 3 1 5Public school. . . . . . . . . 83 13 18 17 8 3 10 - - - 5 3 1 5Elementary school, 1st to 8th. . 1,178 112 214 65 87 39 131 44 37 55 124 57 97 116Public school. . . . . . . . . 1,153 111 203 65 87 39 127 44 37 55 123 57 94 111High school, 9th to 12th grade . 677 38 156 17 33 14 118 15 7 16 78 44 80 61Public school. . . . . . . . . 667 38 151 17 33 14 117 15 7 14 78 43 80 60College. . . . . . . . . . . . . 118 2 66 1 4 2 11 2 - 4 2 - 5 19Public school. . . . . . . . . 118 2 66 1 4 2 11 2 - 4 2 - 5 19Females 3+ yearsand enrolled in school . . 1,002 75 222 57 66 29 133 38 23 38 99 47 79 96Preprimary school. . . . . . . . 42 7 12 8 1 2 7 - - - 1 1 1 2Public school. . . . . . . . . 35 7 8 8 1 2 4 - - - 1 1 1 2Elementary school, 1st to 8th. . 566 51 90 41 50 19 56 26 18 29 63 31 40 52Public school. . . . . . . . . 555 51 84 41 50 19 54 26 18 29 62 31 39 51High school, 9th to 12th grade . 336 16 88 8 13 8 63 10 5 8 35 15 35 32Public school. . . . . . . . . 330 16 85 8 13 8 63 10 5 6 35 14 35 32College. . . . . . . . . . . . . 58 1 32 - 2 - 7 2 - 1 - - 3 10Public school. . . . . . . . . 58 1 32 - 2 - 7 2 - 1 - - 3 10EDUCATIONAL ATTAINMENTPersons 25+ years . . . . . 2,328 150 405 362 129 49 188 46 63 83 312 141 182 218None . . . . . . . . . . . . . . 358 29 65 23 22 18 16 9 7 7 66 29 31 36Elementary: 1 to 4 grade. . . . 42 3 1 2 2 - 12 2 3 - 12 2 1 25 and 6 grade . . . 53 6 9 1 - - 9 - 1 14 8 1 4 -7 grade . . . . . . 77 5 38 1 - - 7 - 3 5 4 5 7 28 grade . . . . . . 224 18 35 64 8 1 16 4 9 5 22 17 17 8High school: 9 grade . . . . . . 143 6 20 21 3 1 11 7 8 3 22 5 17 1910 grade . . . . . . 199 14 19 30 9 4 28 3 4 7 22 13 20 2611 grade . . . . . . 145 6 42 - 2 1 12 6 - 11 12 9 25 1912 grade,no diploma. 216 15 18 9 28 10 20 8 18 6 25 36 10 13High school graduate . . . . . . 466 32 65 122 40 5 32 3 6 16 65 1 24 55Some college, no degree. . . . . 247 7 62 67 9 6 16 1 1 5 31 14 15 13Associate degree, occupational . 90 8 24 7 6 2 6 3 2 3 13 1 5 10Associate degree, academic . . . 31 - 4 3 - 1 3 - - - 3 7 4 6Bachelor's degree. . . . . . . . 28 1 3 9 - - - - - - 6 - 2 7Graduate/professional degree . . 9 - - 3 - - - - 1 1 1 1 - 2Percent high school graduate . . 37.4 32.0 39.0 58.3 42.6 28.6 30.3 15.2 15.9 30.1 38.1 17.027.5 42.7Percent bachelor's degree. . . . 1.6 .7 .7 3.3 - - - - 1.6 1.2 2.2 .7 1.1 4.1Females 25+ years . . . . . 1,178 83 219 182 61 22 103 20 30 44 148 69 93 104None . . . . . . . . . . . . . . 232 22 46 14 13 10 12 5 4 5 39 17 21 24Elementary: 1 to 4 grade. . . . 25 3 1 1 - - 8 1 2 - 7 2 - -5 and 6 grade . . . 33 2 5 1 - - 5 - - 9 7 - 4 -7 grade . . . . . . 43 3 25 - - - 3 - 1 2 2 3 2 28 grade . . . . . . 149 12 29 39 5 - 12 3 4 4 17 9 10 5High school: 9 grade . . . . . . 73 4 10 14 1 1 7 4 5 3 7 1 10 610 grade . . . . . . 121 10 12 20 5 3 23 3 4 5 9 5 7 1511 grade . . . . . . 63 3 20 - 1 - 3 2 - 2 7 5 9 1112 grade,no diploma. 95 5 8 4 18 4 9 - 7 2 9 20 3 6High school graduate . . . . . . 209 11 28 61 17 2 16 - 3 9 27 1 16 18Some college, no degree. . . . . 81 4 26 19 - 1 3 - - 2 9 4 7 6Associate degree, occupational . 34 3 7 3 1 - 1 2 - 1 7 - 3 6Associate degree, academic . . . 11 - 1 2 - 1 1 - - - 1 2 1 2Bachelor's degree. . . . . . . . 8 1 1 4 - - - - - - - - - 2Graduate/professional degree . . 1 - - - - - - - - - - - - 1Percent high school graduate . . 29.2 22.9 28.8 48.9 29.5 18.2 20.4 10.0 10.0 27.3 29.7 10.129.0 33.7Percent bachelor's degree. . . . .8 1.2 .5 2.2 - - - - - - - - - 2.9Persons 18 to 24 years. . . 211 18 64 1 11 2 26 4 2 9 7 12 33 22Percent high school graduate . . 31.3 5.6 42.2 - 36.4 50.0 26.9 50.0 - 33.3 28.6 -12.1 68.2───────────────────────────────────────────────────────────────────────────────────────────────────────────Source: 2000 FSM Census206 Chuuk Branch Statistics Office, Division of Statistics, FSM Department of Economic Affairs
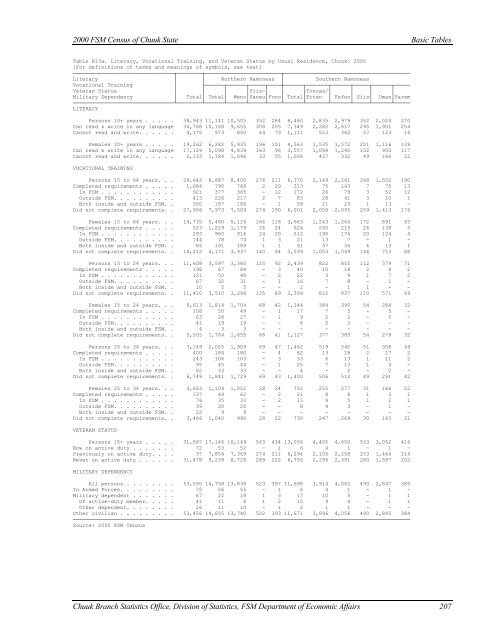
2000 FSM Census of Chuuk StateBasic TablesTable B13a. Literacy, Vocational Training, and Veteran Status by Usual Residence, Chuuk: 2000[For definitions of terms and meanings of symbols, see text]────────────────────────────────┬────────┬────────────────────────┬────────────────────────────────────────Literacy │ │ Northern Namoneas │ Southern NamoneasVocational Training │ ├──────┬──────┬─────┬────┼──────┬───────┬──────┬─────┬──────┬─────Veteran Status │ │ │ │Piis-│ │ │Tonoas/│ │ │ │Military Dependency │ Total│ Total│ Weno│Paneu│Fono│ Total│Etten │ Fefen│ Siis│ Uman│Parem────────────────────────────────┴────────┴──────┴──────┴─────┴────┴──────┴───────┴──────┴─────┴──────┴─────LITERACYPersons 10+ years . . . . . 38,943 11,141 10,505 352 284 8,460 2,835 2,979 352 2,024 270Can read & write in any language 34,768 10,168 9,655 308 205 7,349 2,282 2,617 295 1,901 254Cannot read and write. . . . . . 4,175 973 850 44 79 1,111 553 362 57 123 16Females 10+ years . . . . . 19,262 6,282 5,935 196 151 4,563 1,535 1,572 201 1,116 139Can read & write in any language 17,129 5,098 4,839 163 96 3,557 1,098 1,240 152 950 117Cannot read and write. . . . . . 2,133 1,184 1,096 33 55 1,006 437 332 49 166 22VOCATIONAL TRAININGPersons 15 to 64 years. . . 29,642 8,887 8,400 276 211 6,370 2,149 2,261 268 1,502 190Completed requirements . . . . . 1,684 790 768 2 20 313 75 143 7 75 13In FSM . . . . . . . . . . . . 921 377 365 - 12 172 26 79 3 52 12Outside FSM. . . . . . . . . . 413 226 217 2 7 83 28 41 3 10 1Both inside and outside FSM. . 350 187 186 - 1 58 21 23 1 13 -Did not complete requirements. . 27,958 7,973 7,509 274 190 6,001 2,058 2,095 259 1,413 176Females 15 to 64 years. . . 14,735 5,400 5,116 166 118 3,663 1,243 1,264 172 891 93Completed requirements . . . . . 523 1,229 1,179 26 24 624 240 215 26 138 5In FSM . . . . . . . . . . . . 293 960 916 24 20 512 190 174 20 124 4Outside FSM. . . . . . . . . . 144 78 74 1 3 21 13 7 - 1 -Both inside and outside FSM. . 86 191 189 1 1 91 37 34 6 13 1Did not complete requirements. . 14,212 4,171 3,937 140 94 3,039 1,003 1,049 146 753 88Persons 15 to 24 years. . . 11,608 3,597 3,380 125 92 2,439 822 855 112 579 71Completed requirements . . . . . 198 87 84 - 3 40 10 18 2 8 2In FSM . . . . . . . . . . . . 121 50 48 - 2 22 3 9 1 7 2Outside FSM. . . . . . . . . . 67 32 31 - 1 16 7 8 - 1 -Both inside and outside FSM. . 10 5 5 - - 2 - 1 1 - -Did not complete requirements. . 11,410 3,510 3,296 125 89 2,399 812 837 110 571 69Females 15 to 24 years. . . 5,613 1,814 1,704 68 42 1,144 384 390 54 284 32Completed requirements . . . . . 108 50 49 - 1 17 7 5 - 5 -In FSM . . . . . . . . . . . . 63 28 27 - 1 9 2 2 - 5 -Outside FSM. . . . . . . . . . 41 19 19 - - 8 5 3 - - -Both inside and outside FSM. . 4 3 3 - - - - - - - -Did not complete requirements. . 5,505 1,764 1,655 68 41 1,127 377 385 54 279 32Persons 25 to 34 years. . . 7,149 2,025 1,909 69 47 1,462 519 540 51 308 44Completed requirements . . . . . 400 184 180 - 4 62 13 28 2 17 2In FSM . . . . . . . . . . . . 243 106 103 - 3 33 6 13 1 11 2Outside FSM. . . . . . . . . . 95 45 44 - 1 25 7 13 1 4 -Both inside and outside FSM. . 62 33 33 - - 4 - 2 - 2 -Did not complete requirements. . 6,749 1,841 1,729 69 43 1,400 506 512 49 291 42Females 25 to 34 years. . . 3,603 1,104 1,052 28 24 751 255 277 31 166 22Completed requirements . . . . . 137 64 62 - 2 21 8 8 1 3 1In FSM . . . . . . . . . . . . 76 35 33 - 2 13 4 5 1 2 1Outside FSM. . . . . . . . . . 39 20 20 - - 8 4 3 - 1 -Both inside and outside FSM. . 22 9 9 - - - - - - - -Did not complete requirements. . 3,466 1,040 990 28 22 730 247 269 30 163 21VETERAN STATUSPersons 15+ years . . . . . 31,587 17,146 16,149 563 434 13,056 4,405 4,650 533 3,052 416Now on active duty . . . . . . . 72 53 52 - 1 6 4 1 - 1 -Previously on active duty. . . . 37 7,854 7,369 274 211 6,294 2,105 2,258 253 1,464 214Never on active duty . . . . . . 31,478 9,239 8,728 289 222 6,756 2,296 2,391 280 1,587 202MILITARY DEPENDENCYAll persons . . . . . . . . 53,595 14,758 13,838 523 397 11,698 3,914 4,062 490 2,847 385In Armed Forces. . . . . . . . . 72 56 55 - 1 6 4 1 - 1 -Military dependent . . . . . . . 67 22 18 1 3 17 10 5 - 1 1Of active-duty member. . . . . 41 11 8 1 2 15 9 4 - 1 1Other dependent. . . . . . . . 26 11 10 - 1 2 1 1 - - -Other civilian . . . . . . . . . 53,456 14,655 13,740 522 393 11,671 3,896 4,056 490 2,845 384───────────────────────────────────────────────────────────────────────────────────────────────────────────Source: 2000 FSM CensusChuuk Branch Statistics Office, Division of Statistics, FSM Department of Economic Affairs 207
- Page 184 and 185: Basic Tables2000 FSM Census of Chuu
- Page 186 and 187: Basic Tables2000 FSM Census of Chuu
- Page 188 and 189: Basic Tables2000 FSM Census of Chuu
- Page 190 and 191: Basic Tables2000 FSM Census of Chuu
- Page 192 and 193: Basic Tables2000 FSM Census of Chuu
- Page 194 and 195: Basic Tables2000 FSM Census of Chuu
- Page 196 and 197: Basic Tables2000 FSM Census of Chuu
- Page 198 and 199: Basic Tables2000 FSM Census of Chuu
- Page 200 and 201: Basic Tables2000 FSM Census of Chuu
- Page 202 and 203: Basic Tables2000 FSM Census of Chuu
- Page 204 and 205: Basic Tables2000 FSM Census of Chuu
- Page 206 and 207: Basic Tables2000 FSM Census of Chuu
- Page 208 and 209: Basic Tables2000 FSM Census of Chuu
- Page 210 and 211: Basic Tables2000 FSM Census of Chuu
- Page 212 and 213: Basic Tables2000 FSM Census of Chuu
- Page 214 and 215: Basic Tables2000 FSM Census of Chuu
- Page 216 and 217: Basic Tables2000 FSM Census of Chuu
- Page 218 and 219: Basic Tables2000 FSM Census of Chuu
- Page 220 and 221: Basic Tables2000 FSM Census of Chuu
- Page 222 and 223: Basic Tables2000 FSM Census of Chuu
- Page 224 and 225: Basic Tables2000 FSM Census of Chuu
- Page 226 and 227: Basic Tables2000 FSM Census of Chuu
- Page 228 and 229: Basic Tables2000 FSM Census of Chuu
- Page 230 and 231: Basic Tables2000 FSM Census of Chuu
- Page 232 and 233: Basic Tables2000 FSM Census of Chuu
- Page 236 and 237: Basic Tables2000 FSM Census of Chuu
- Page 238 and 239: Basic Tables2000 FSM Census of Chuu
- Page 240 and 241: Basic Tables2000 FSM Census of Chuu
- Page 242 and 243: Basic Tables2000 FSM Census of Chuu
- Page 244 and 245: Basic Tables2000 FSM Census of Chuu
- Page 246 and 247: Basic Tables2000 FSM Census of Chuu
- Page 248 and 249: Basic Tables2000 FSM Census of Chuu
- Page 250 and 251: Basic Tables2000 FSM Census of Chuu
- Page 252 and 253: Basic Tables2000 FSM Census of Chuu
- Page 254 and 255: Basic Tables2000 FSM Census of Chuu
- Page 256 and 257: Basic Tables2000 FSM Census of Chuu
- Page 258 and 259: Basic Tables2000 FSM Census of Chuu
- Page 260 and 261: Basic Tables2000 FSM Census of Chuu
- Page 262 and 263: Basic Tables2000 FSM Census of Chuu
- Page 264 and 265: Basic Tables2000 FSM Census of Chuu
- Page 266 and 267: Basic Tables2000 FSM Census of Chuu
- Page 268 and 269: Basic Tables2000 FSM Census of Chuu
- Page 270 and 271: Basic Tables2000 FSM Census of Chuu
- Page 272 and 273: Basic Tables2000 FSM Census of Chuu
- Page 274 and 275: Basic Tables2000 FSM Census of Chuu
- Page 276 and 277: Basic Tables2000 FSM Census of Chuu
- Page 278 and 279: Basic Tables2000 FSM Census of Chuu
- Page 280 and 281: Basic Tables2000 FSM Census of Chuu
- Page 282 and 283: Basic Tables2000 FSM Census of Chuu
2000 FSM <strong>Census</strong> of <strong>Chuuk</strong> <strong>State</strong>Basic TablesTable B13a. Literacy, Vocational Training, and Veteran Status by Usual Residence, <strong>Chuuk</strong>: 2000[For definitions of terms and meanings of symbols, see text]────────────────────────────────┬────────┬────────────────────────┬────────────────────────────────────────Literacy │ │ Northern Namoneas │ Southern NamoneasVocational Training │ ├──────┬──────┬─────┬────┼──────┬───────┬──────┬─────┬──────┬─────Veteran Status │ │ │ │Piis-│ │ │Tonoas/│ │ │ │Military Dependency │ Total│ Total│ Weno│Paneu│Fono│ Total│Etten │ Fefen│ Siis│ Uman│Parem────────────────────────────────┴────────┴──────┴──────┴─────┴────┴──────┴───────┴──────┴─────┴──────┴─────LITERACYPersons 10+ years . . . . . 38,943 11,141 10,505 352 284 8,460 2,835 2,979 352 2,024 270Can read & write in any language 34,768 10,168 9,655 308 205 7,349 2,282 2,617 295 1,901 254Cannot read and write. . . . . . 4,175 973 850 44 79 1,111 553 362 57 123 16Females 10+ years . . . . . 19,262 6,282 5,935 196 151 4,563 1,535 1,572 201 1,116 139Can read & write in any language 17,129 5,098 4,839 163 96 3,557 1,098 1,240 152 950 117Cannot read and write. . . . . . 2,133 1,184 1,096 33 55 1,006 437 332 49 166 22VOCATIONAL TRAININGPersons 15 to 64 years. . . 29,642 8,887 8,400 276 211 6,370 2,149 2,261 268 1,502 190Completed requirements . . . . . 1,684 790 768 2 20 313 75 143 7 75 13In FSM . . . . . . . . . . . . 921 377 365 - 12 172 26 79 3 52 12Outside FSM. . . . . . . . . . 413 226 217 2 7 83 28 41 3 10 1Both inside and outside FSM. . 350 187 186 - 1 58 21 23 1 13 -Did not complete requirements. . 27,958 7,973 7,509 274 190 6,001 2,058 2,095 259 1,413 176Females 15 to 64 years. . . 14,735 5,400 5,116 166 118 3,663 1,243 1,264 172 891 93Completed requirements . . . . . 523 1,229 1,179 26 24 624 240 215 26 138 5In FSM . . . . . . . . . . . . 293 960 916 24 20 512 190 174 20 124 4Outside FSM. . . . . . . . . . 144 78 74 1 3 21 13 7 - 1 -Both inside and outside FSM. . 86 191 189 1 1 91 37 34 6 13 1Did not complete requirements. . 14,212 4,171 3,937 140 94 3,039 1,003 1,049 146 753 88Persons 15 to 24 years. . . 11,608 3,597 3,380 125 92 2,439 822 855 112 579 71Completed requirements . . . . . 198 87 84 - 3 40 10 18 2 8 2In FSM . . . . . . . . . . . . 121 50 48 - 2 22 3 9 1 7 2Outside FSM. . . . . . . . . . 67 32 31 - 1 16 7 8 - 1 -Both inside and outside FSM. . 10 5 5 - - 2 - 1 1 - -Did not complete requirements. . 11,410 3,510 3,296 125 89 2,399 812 837 110 571 69Females 15 to 24 years. . . 5,613 1,814 1,704 68 42 1,144 384 390 54 284 32Completed requirements . . . . . 108 50 49 - 1 17 7 5 - 5 -In FSM . . . . . . . . . . . . 63 28 27 - 1 9 2 2 - 5 -Outside FSM. . . . . . . . . . 41 19 19 - - 8 5 3 - - -Both inside and outside FSM. . 4 3 3 - - - - - - - -Did not complete requirements. . 5,505 1,764 1,655 68 41 1,127 377 385 54 279 32Persons 25 to 34 years. . . 7,149 2,025 1,909 69 47 1,462 519 540 51 308 44Completed requirements . . . . . 400 184 180 - 4 62 13 28 2 17 2In FSM . . . . . . . . . . . . 243 106 103 - 3 33 6 13 1 11 2Outside FSM. . . . . . . . . . 95 45 44 - 1 25 7 13 1 4 -Both inside and outside FSM. . 62 33 33 - - 4 - 2 - 2 -Did not complete requirements. . 6,749 1,841 1,729 69 43 1,400 506 512 49 291 42Females 25 to 34 years. . . 3,603 1,104 1,052 28 24 751 255 277 31 166 22Completed requirements . . . . . 137 64 62 - 2 21 8 8 1 3 1In FSM . . . . . . . . . . . . 76 35 33 - 2 13 4 5 1 2 1Outside FSM. . . . . . . . . . 39 20 20 - - 8 4 3 - 1 -Both inside and outside FSM. . 22 9 9 - - - - - - - -Did not complete requirements. . 3,466 1,040 990 28 22 730 247 269 30 163 21VETERAN STATUSPersons 15+ years . . . . . 31,587 17,146 16,149 563 434 13,056 4,405 4,650 533 3,052 416Now on active duty . . . . . . . 72 53 52 - 1 6 4 1 - 1 -Previously on active duty. . . . 37 7,854 7,369 274 211 6,294 2,105 2,258 253 1,464 214Never on active duty . . . . . . 31,478 9,239 8,728 289 222 6,756 2,296 2,391 280 1,587 202MILITARY DEPENDENCYAll persons . . . . . . . . 53,595 14,758 13,838 523 397 11,698 3,914 4,062 490 2,847 385In Armed Forces. . . . . . . . . 72 56 55 - 1 6 4 1 - 1 -Military dependent . . . . . . . 67 22 18 1 3 17 10 5 - 1 1Of active-duty member. . . . . 41 11 8 1 2 15 9 4 - 1 1Other dependent. . . . . . . . 26 11 10 - 1 2 1 1 - - -Other civilian . . . . . . . . . 53,456 14,655 13,740 522 393 11,671 3,896 4,056 490 2,845 384───────────────────────────────────────────────────────────────────────────────────────────────────────────Source: 2000 FSM <strong>Census</strong><strong>Chuuk</strong> Branch Statistics Office, Division of Statistics, FSM Department of Economic Affairs 207


