Basic Tables2000 FSM <strong>Census</strong> of <strong>Chuuk</strong> <strong>State</strong>Table B01b. Age by Municipality of Usual Residence, <strong>Chuuk</strong>: 2000 - continued[For definitions of terms and meanings of symbols, see text]──────────────────────────────┬─────────────────────────────────────────────────────────│Faichuk├─────┬─────┬──────┬─────┬──────┬─────┬──────┬──────┬─────│ │ │ │Roma-│Fana- │ │ │ │Age │Total│ Eot│ Udot│ num │panges│Wonei│ Paata│ Tol│Polle──────────────────────────────┴─────┴─────┴──────┴─────┴──────┴─────┴──────┴──────┴─────All persons. . . . . . ..14,049 382 1,774 1,011 681 1,271 1,950 5,129 1,851Less than 5 years . . . . . .. 2,234 44 258 173 111 181 327 801 3395 to 9 years . . . . . . . .. 2,131 42 277 159 104 171 308 789 28110 to 14 years. . . . . . . .. 1,954 50 259 131 100 176 257 725 25615 to 19 years. . . . . . . .. 1,647 55 225 108 68 162 215 611 20320 to 24 years. . . . . . . .. 1,318 49 179 88 54 142 171 451 18425 to 29 years. . . . . . . .. 1,072 40 149 85 43 106 154 359 13630 to 34 years. . . . . . . .. 786 21 98 69 51 61 123 267 9635 to 39 years. . . . . . . .. 661 16 70 53 41 61 94 228 9840 to 44 years. . . . . . . .. 588 23 74 41 32 58 84 214 6245 to 49 years. . . . . . . .. 490 12 51 22 19 59 69 208 5050 to 54 years. . . . . . . .. 328 7 45 23 23 31 39 130 3055 to 59 years. . . . . . . .. 222 5 29 16 12 11 31 88 3060 to 64 years. . . . . . . .. 188 3 22 11 6 17 24 77 2865 to 69 years. . . . . . . .. 169 4 18 12 12 19 22 58 2470 to 74 years. . . . . . . .. 109 4 5 11 2 8 17 45 1775 to 79 years. . . . . . . .. 90 6 9 6 2 3 7 46 1180 to 84 years. . . . . . . .. 35 - 2 - - 4 6 22 185+ years . . . . . . . . . .. 27 1 4 3 1 1 2 10 5Median. . . . . . . . . . . .. 17.1 20.0 17.1 17.0 16.9 18.3 16.9 17.0 16.2Males . . . . . . . . . . 7,163 208 948 509 331 652 957 2,642 916Less than 5 years . . . . . .. 1,163 23 135 85 53 98 160 441 1685 to 9 years. . . . . . . . .. 1,084 26 150 84 41 86 152 406 13910 to 14 years. . . . . . . .. 1,050 26 145 78 52 102 125 391 13115 to 19 years. . . . . . . .. 834 34 120 47 32 78 103 325 9520 to 24 years. . . . . . . .. 691 28 101 46 33 74 88 227 9425 to 29 years. . . . . . . .. 539 21 82 33 21 48 81 182 7130 to 34 years. . . . . . . .. 393 13 46 36 24 35 59 132 4835 to 39 years. . . . . . . .. 329 8 34 29 22 28 43 118 4740 to 44 years. . . . . . . .. 280 10 45 23 10 27 40 92 3345 to 49 years. . . . . . . .. 243 6 24 12 9 29 39 103 2150 to 54 years. . . . . . . .. 146 3 20 9 12 15 14 61 1255 to 59 years. . . . . . . .. 109 3 16 6 7 8 20 36 1360 to 64 years. . . . . . . .. 91 1 11 6 4 7 7 39 1665 to 69 years. . . . . . . .. 91 1 13 7 7 10 12 31 1070 to 74 years. . . . . . . .. 48 2 2 3 2 5 4 23 775 to 79 years. . . . . . . .. 38 2 3 3 1 1 5 16 780 to 84 years. . . . . . . .. 18 - - - - - 3 14 185+ years . . . . . . . . . .. 16 1 1 2 1 1 2 5 3Median. . . . . . . . . . . .. 16.7 19.3 16.8 15.8 18.0 17.6 17.0 16.3 16.1Females . . . . . . . . . 6,886 174 826 502 350 619 993 2,487 935Less than 5 years . . . . . .. 1,071 21 123 88 58 83 167 360 1715 to 9 years . . . . . . . .. 1,047 16 127 75 63 85 156 383 14210 to 14 years. . . . . . . .. 904 24 114 53 48 74 132 334 12515 to 19 years. . . . . . . .. 813 21 105 61 36 84 112 286 10820 to 24 years. . . . . . . .. 627 21 78 42 21 68 83 224 9025 to 29 years. . . . . . . .. 533 19 67 52 22 58 73 177 6530 to 34 years. . . . . . . .. 393 8 52 33 27 26 64 135 4835 to 39 years. . . . . . . .. 332 8 36 24 19 33 51 110 5140 to 44 years. . . . . . . .. 308 13 29 18 22 31 44 122 2945 to 49 years. . . . . . . .. 247 6 27 10 10 30 30 105 2950 to 54 years. . . . . . . .. 182 4 25 14 11 16 25 69 1855 to 59 years. . . . . . . .. 113 2 13 10 5 3 11 52 1760 to 64 years. . . . . . . .. 97 2 11 5 2 10 17 38 1265 to 69 years. . . . . . . .. 78 3 5 5 5 9 10 27 1470 to 74 years. . . . . . . .. 61 2 3 8 - 3 13 22 1075 to 79 years. . . . . . . .. 52 4 6 3 1 2 2 30 480 to 84 years. . . . . . . .. 17 - 2 - - 4 3 8 -85+ years . . . . . . . . . .. 11 - 3 1 - - - 5 2Median. . . . . . . . . . . .. 17.6 21.2 17.3 17.9 15.8 19.0 16.9 17.9 16.4────────────────────────────────────────────────────────────────────────────────────────Source: 2000 FSM <strong>Census</strong>134 <strong>Chuuk</strong> Branch Statistics Office, Division of Statistics, FSM Department of Economic Affairs
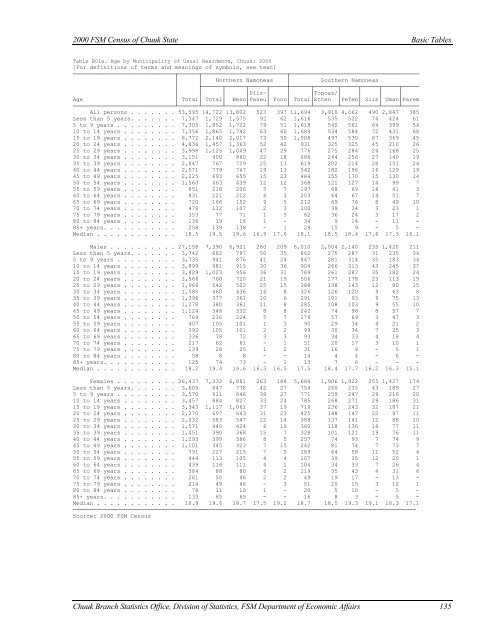
2000 FSM <strong>Census</strong> of <strong>Chuuk</strong> <strong>State</strong>Basic TablesTable B01a. Age by Municipality of Usual Residence, <strong>Chuuk</strong>: 2000[For definitions of terms and meanings of symbols, see text]──────────────────────────────┬──────┬─────────────────────────┬──────────────────────────────────────│ │ Northern Namoneas │ Southern Namoneas│ ├──────┬──────┬─────┬─────┼──────┬───────┬─────┬─────┬─────┬─────│ │ │ │Piis-│ │ │Tonoas/│ │ │ │Age│ Total│ Total│ Weno│Paneu│ Fono│ Total│Etten │Fefen│ Siis│ Uman│Parem──────────────────────────────┴──────┴──────┴──────┴─────┴─────┴──────┴───────┴─────┴─────┴─────┴─────All persons . . . . . . . 53,595 14,722 13,802 523 397 11,694 3,910 4,062 490 2,847 385Less than 5 years. . . . . . . 7,347 1,729 1,575 92 62 1,616 535 522 74 424 615 to 9 years . . . . . . . . . 7,305 1,852 1,722 79 51 1,618 540 561 64 399 5410 to 14 years . . . . . . . . 7,356 1,865 1,742 63 60 1,689 534 584 72 431 6815 to 19 years . . . . . . . . 6,772 2,140 2,017 73 50 1,508 497 530 67 369 4520 to 24 years . . . . . . . . 4,836 1,457 1,363 52 42 931 325 325 45 210 2625 to 29 years . . . . . . . . 3,998 1,125 1,049 47 29 776 275 284 24 168 2530 to 34 years . . . . . . . . 3,151 900 860 22 18 686 244 256 27 140 1935 to 39 years . . . . . . . . 2,847 767 729 25 13 619 202 214 28 151 2440 to 44 years . . . . . . . . 2,571 779 747 19 13 542 182 196 16 129 1945 to 49 years . . . . . . . . 2,225 693 655 15 23 484 155 170 15 130 1450 to 54 years . . . . . . . . 1,560 463 439 12 12 368 121 127 14 99 755 to 59 years . . . . . . . . 851 218 206 5 7 197 68 69 16 41 360 to 64 years . . . . . . . . 831 221 212 6 3 203 64 67 14 51 765 to 69 years . . . . . . . . 720 166 152 9 5 212 69 76 8 49 1070 to 74 years . . . . . . . . 478 112 107 2 3 100 39 34 3 23 175 to 79 years . . . . . . . . 353 77 71 1 5 82 36 24 3 17 280 to 84 years . . . . . . . . 136 19 18 1 - 34 9 14 - 11 -85+ years. . . . . . . . . . . 258 139 138 - 1 29 15 9 - 5 -Median . . . . . . . . . . . . 18.5 19.5 19.6 16.9 17.6 18.1 18.5 18.4 17.6 17.3 16.1Males . . . . . . . . . . 27,158 7,390 6,921 260 209 6,010 2,004 2,140 235 1,420 211Less than 5 years. . . . . . . 3,742 882 797 50 35 862 275 287 31 235 345 to 9 years . . . . . . . . . 3,735 941 876 41 24 847 281 314 35 183 3410 to 14 years . . . . . . . . 3,899 981 915 30 36 904 266 313 43 245 3715 to 19 years . . . . . . . . 3,429 1,023 956 36 31 789 261 287 35 182 2420 to 24 years . . . . . . . . 2,566 760 720 21 19 506 177 178 23 113 1525 to 29 years . . . . . . . . 1,966 542 502 25 15 388 138 143 12 80 1530 to 34 years . . . . . . . . 1,580 460 436 16 8 326 126 120 9 63 835 to 39 years . . . . . . . . 1,396 377 361 10 6 291 101 93 9 75 1340 to 44 years . . . . . . . . 1,278 380 361 11 8 285 108 103 9 55 1045 to 49 years . . . . . . . . 1,124 348 332 8 8 242 74 96 8 57 750 to 54 years . . . . . . . . 769 236 224 5 7 179 57 69 3 47 355 to 59 years . . . . . . . . 407 105 101 1 3 90 29 34 4 21 260 to 64 years . . . . . . . . 392 105 101 2 2 99 30 34 7 25 365 to 69 years . . . . . . . . 336 78 72 3 3 93 34 33 4 18 470 to 74 years . . . . . . . . 217 62 61 - 1 51 20 17 3 10 175 to 79 years . . . . . . . . 139 28 25 1 2 31 16 9 - 5 180 to 84 years . . . . . . . . 58 8 8 - - 14 4 4 - 6 -85+ years. . . . . . . . . . . 125 74 73 - 1 13 7 6 - - -Median . . . . . . . . . . . . 18.2 19.4 19.6 16.3 16.5 17.5 18.4 17.7 16.2 16.3 15.1Females . . . . . . . . . 26,437 7,332 6,881 263 188 5,684 1,906 1,922 255 1,427 174Less than 5 years. . . . . . . 3,605 847 778 42 27 754 260 235 43 189 275 to 9 years . . . . . . . . . 3,570 911 846 38 27 771 259 247 29 216 2010 to 14 years . . . . . . . . 3,457 884 827 33 24 785 268 271 29 186 3115 to 19 years . . . . . . . . 3,343 1,117 1,061 37 19 719 236 243 32 187 2120 to 24 years . . . . . . . . 2,270 697 643 31 23 425 148 147 22 97 1125 to 29 years . . . . . . . . 2,032 583 547 22 14 388 137 141 12 88 1030 to 34 years . . . . . . . . 1,571 440 424 6 10 360 118 136 18 77 1135 to 39 years . . . . . . . . 1,451 390 368 15 7 328 101 121 19 76 1140 to 44 years . . . . . . . . 1,293 399 386 8 5 257 74 93 7 74 945 to 49 years . . . . . . . . 1,101 345 323 7 15 242 81 74 7 73 750 to 54 years . . . . . . . . 791 227 215 7 5 189 64 58 11 52 455 to 59 years . . . . . . . . 444 113 105 4 4 107 39 35 12 20 160 to 64 years . . . . . . . . 439 116 111 4 1 104 34 33 7 26 465 to 69 years . . . . . . . . 384 88 80 6 2 119 35 43 4 31 670 to 74 years . . . . . . . . 261 50 46 2 2 49 19 17 - 13 -75 to 79 years . . . . . . . . 214 49 46 - 3 51 20 15 3 12 180 to 84 years . . . . . . . . 78 11 10 1 - 20 5 10 - 5 -85+ years. . . . . . . . . . . 133 65 65 - - 16 8 3 - 5 -Median . . . . . . . . . . . . 18.9 19.6 19.7 17.5 19.2 18.7 18.5 19.3 19.1 18.3 17.1─────────────────────────────────────────────────────────────────────────────────────────────────────Source: 2000 FSM <strong>Census</strong><strong>Chuuk</strong> Branch Statistics Office, Division of Statistics, FSM Department of Economic Affairs 135
- Page 5:
iii
- Page 12 and 13:
Preface2000 FSM Census of Chuukx
- Page 14 and 15:
Table of contents2000 FSM Census of
- Page 16 and 17:
LIST OF TEXT TABLESTABLEPageChapter
- Page 18 and 19:
List of Text Table2000 FSM Census o
- Page 20 and 21:
LIST OF FIGURESFIGUREPageFigure 1.1
- Page 22 and 23:
List of Basic-Tables2000 FSM Census
- Page 24 and 25:
MAP OF FSMxxiiChuuk Branch Statisti
- Page 27 and 28:
2000 FSM Census of Chuuk StateExecu
- Page 29 and 30:
CHAPTER 1INTRODUCTIONThe creation o
- Page 31 and 32:
2000 FSM Census of Chuuk StateChapt
- Page 33 and 34:
2000 FSM Census of Chuuk StateChapt
- Page 35 and 36:
2000 FSM Census of Chuuk StateChapt
- Page 37 and 38:
2000 FSM Census of Chuuk StateChapt
- Page 39 and 40:
2000 FSM Census of Chuuk StateChapt
- Page 41 and 42:
2000 FSM Census of Chuuk StateChapt
- Page 43 and 44:
2000 FSM Census of Chuuk State Chap
- Page 45:
2000 FSM Census of Chuuk StateChapt
- Page 48 and 49:
Chapter 2. Age and Sex Structure200
- Page 50 and 51:
Chapter 2. Age and Sex Structure200
- Page 52 and 53:
Chapter 2. Age and Sex Structure200
- Page 55 and 56:
CHAPTER 3HOUSEHOLDS, FAMILIES, AND
- Page 57 and 58:
2000 FSM Census of Chuuk StateChapt
- Page 59 and 60:
2000 FSM Census of Chuuk StateChapt
- Page 61:
2000 FSM Census of Chuuk StateChapt
- Page 64 and 65:
Chapter 4. Fertility2000 FSM Census
- Page 66 and 67:
Chapter 4. Fertility2000 FSM Census
- Page 68 and 69:
Chapter 4. Fertility2000 FSM Census
- Page 71 and 72:
CHAPTER 5MORTALITYIntroductionAs re
- Page 73 and 74:
2000 FSM Census of Chuuk StateChapt
- Page 75:
2000 FSM Census of Chuuk StateChapt
- Page 78 and 79:
Chapter 6. Migration2000 FSM Census
- Page 80 and 81:
Chapter 6. Migration2000 FSM Census
- Page 82 and 83:
Chapter 6. Migration2000 FSM Census
- Page 84 and 85:
Chapter 6. Migration2000 FSM Census
- Page 86 and 87:
Chapter 7. Religion, Ethnicity, and
- Page 88 and 89:
Chapter 7. Religion, Ethnicity, and
- Page 90 and 91:
Chapter 7. Religion, Ethnicity, and
- Page 92 and 93:
Chapter 8. Education2000 FSM Census
- Page 94 and 95:
Chapter 8. Education2000 FSM Census
- Page 96 and 97:
Chapter 8. Education2000 FSM Census
- Page 98 and 99:
Chapter 8. Education2000 FSM Census
- Page 100 and 101:
Chapter 8. Education2000 FSM Census
- Page 103 and 104:
CHAPTER 9ECONOMIC ACTIVITYIntroduct
- Page 105 and 106:
2000 FSM Census of Chuuk StateChapt
- Page 107 and 108:
2000 FSM Census of Chuuk StateChapt
- Page 109 and 110:
2000 FSM Census of Chuuk StateChapt
- Page 111 and 112: 2000 FSM Census of Chuuk StateChapt
- Page 113 and 114: 2000 FSM Census of Chuuk StateChapt
- Page 115 and 116: 2000 FSM Census of Chuuk StateChapt
- Page 117 and 118: CHAPTER 10INDUSTRY AND OCCUPATIONIn
- Page 119 and 120: 2000 FSM Census of Chuuk StateChapt
- Page 121 and 122: 2000 FSM Census of Chuuk StateChapt
- Page 123 and 124: 2000 FSM Census of Chuuk StateChapt
- Page 125 and 126: 2000 FSM Census of Chuuk StateChapt
- Page 127 and 128: 2000 FSM Census of Chuuk StateChapt
- Page 129 and 130: CHAPTER 11INCOMEIntroductionThe 200
- Page 131 and 132: 2000 FSM Census of Chuuk StateChapt
- Page 133 and 134: 2000 FSM Census of Chuuk StateChapt
- Page 135 and 136: 2000 FSM Census of Chuuk StateChapt
- Page 137: 2000 FSM Census of Chuuk StateChapt
- Page 140 and 141: Chapter 12. Housing2000 FSM Census
- Page 142 and 143: Chapter 12. Housing2000 FSM Census
- Page 144 and 145: Chapter 12. Housing2000 FSM Census
- Page 146 and 147: Chapter 12. Housing2000 FSM Census
- Page 148 and 149: Chapter 12. Housing2000 FSM Census
- Page 150 and 151: Chapter 12. Housing2000 FSM Census
- Page 152 and 153: Chapter 12. Housing2000 FSM Census
- Page 154: Chapter 12. Housing2000 FSM Census
- Page 157 and 158: BIBLIOGRAPHYArriaga, E.E., (1983).
- Page 159: 2000 FSM Census of Chuuk StateBibli
- Page 164 and 165: Basic Tables2000 FSM Census of Chuu
- Page 166 and 167: Basic Tables2000 FSM Census of Chuu
- Page 168 and 169: Basic Tables2000 FSM Census of Chuu
- Page 170 and 171: Basic Tables2000 FSM Census of Chuu
- Page 172 and 173: Basic Tables2000 FSM Census of Chuu
- Page 174 and 175: Basic Tables2000 FSM Census of Chuu
- Page 176 and 177: Basic Tables2000 FSM Census of Chuu
- Page 178 and 179: Basic Tables2000 FSM Census of Chuu
- Page 180 and 181: Basic Tables2000 FSM Census of Chuu
- Page 182 and 183: Basic Tables2000 FSM Census of Chuu
- Page 184 and 185: Basic Tables2000 FSM Census of Chuu
- Page 186 and 187: Basic Tables2000 FSM Census of Chuu
- Page 188 and 189: Basic Tables2000 FSM Census of Chuu
- Page 190 and 191: Basic Tables2000 FSM Census of Chuu
- Page 192 and 193: Basic Tables2000 FSM Census of Chuu
- Page 194 and 195: Basic Tables2000 FSM Census of Chuu
- Page 196 and 197: Basic Tables2000 FSM Census of Chuu
- Page 198 and 199: Basic Tables2000 FSM Census of Chuu
- Page 200 and 201: Basic Tables2000 FSM Census of Chuu
- Page 202 and 203: Basic Tables2000 FSM Census of Chuu
- Page 204 and 205: Basic Tables2000 FSM Census of Chuu
- Page 206 and 207: Basic Tables2000 FSM Census of Chuu
- Page 208 and 209: Basic Tables2000 FSM Census of Chuu
- Page 210 and 211: Basic Tables2000 FSM Census of Chuu
- Page 212 and 213:
Basic Tables2000 FSM Census of Chuu
- Page 214 and 215:
Basic Tables2000 FSM Census of Chuu
- Page 216 and 217:
Basic Tables2000 FSM Census of Chuu
- Page 218 and 219:
Basic Tables2000 FSM Census of Chuu
- Page 220 and 221:
Basic Tables2000 FSM Census of Chuu
- Page 222 and 223:
Basic Tables2000 FSM Census of Chuu
- Page 224 and 225:
Basic Tables2000 FSM Census of Chuu
- Page 226 and 227:
Basic Tables2000 FSM Census of Chuu
- Page 228 and 229:
Basic Tables2000 FSM Census of Chuu
- Page 230 and 231:
Basic Tables2000 FSM Census of Chuu
- Page 232 and 233:
Basic Tables2000 FSM Census of Chuu
- Page 234 and 235:
Basic Tables2000 FSM Census of Chuu
- Page 236 and 237:
Basic Tables2000 FSM Census of Chuu
- Page 238 and 239:
Basic Tables2000 FSM Census of Chuu
- Page 240 and 241:
Basic Tables2000 FSM Census of Chuu
- Page 242 and 243:
Basic Tables2000 FSM Census of Chuu
- Page 244 and 245:
Basic Tables2000 FSM Census of Chuu
- Page 246 and 247:
Basic Tables2000 FSM Census of Chuu
- Page 248 and 249:
Basic Tables2000 FSM Census of Chuu
- Page 250 and 251:
Basic Tables2000 FSM Census of Chuu
- Page 252 and 253:
Basic Tables2000 FSM Census of Chuu
- Page 254 and 255:
Basic Tables2000 FSM Census of Chuu
- Page 256 and 257:
Basic Tables2000 FSM Census of Chuu
- Page 258 and 259:
Basic Tables2000 FSM Census of Chuu
- Page 260 and 261:
Basic Tables2000 FSM Census of Chuu
- Page 262 and 263:
Basic Tables2000 FSM Census of Chuu
- Page 264 and 265:
Basic Tables2000 FSM Census of Chuu
- Page 266 and 267:
Basic Tables2000 FSM Census of Chuu
- Page 268 and 269:
Basic Tables2000 FSM Census of Chuu
- Page 270 and 271:
Basic Tables2000 FSM Census of Chuu
- Page 272 and 273:
Basic Tables2000 FSM Census of Chuu
- Page 274 and 275:
Basic Tables2000 FSM Census of Chuu
- Page 276 and 277:
Basic Tables2000 FSM Census of Chuu
- Page 278 and 279:
Basic Tables2000 FSM Census of Chuu
- Page 280 and 281:
Basic Tables2000 FSM Census of Chuu
- Page 282 and 283:
Basic Tables2000 FSM Census of Chuu
- Page 284 and 285:
Basic Tables2000 FSM Census of Chuu
- Page 286 and 287:
Basic Tables2000 FSM Census of Chuu
- Page 288 and 289:
Basic Tables2000 FSM Census of Chuu
- Page 290 and 291:
Basic Tables2000 FSM Census of Chuu
- Page 292 and 293:
Questionnaire2000 FSM Census of Chu
- Page 294 and 295:
Questionnaire2000 FSM Census of Chu
- Page 296 and 297:
Questionnaire2000 FSM Census of Chu