Chapter 11. Income2000 FSM <strong>Census</strong> of <strong>Chuuk</strong> <strong>State</strong>Table 11.7: Individual Income in 1993 and 1999 by Educational Attainment, <strong>Chuuk</strong> <strong>State</strong>: 1994 and 2000Total Males FemalesEducational attainment No. of Persons Median ($) Mean ($) No. of persons Median ($) Mean ($) No. of persons Median ($) Mean ($)1994Persons withincome 25+ years 8,299 1,105 3,064 5,235 1,503 3,631 3,064 890 2,112No education 532 741 1,422 332 806 1,746 200 654 884Elementary1-3 grades 249 783 1,859 154 875 2,499 95 669 8204-7 grades 1,136 769 1,097 658 837 1,287 478 691 835Elem. grads. 1,094 863 1,671 657 988 1,925 437 741 1,343High school9-11 grades 1,390 778 1,512 908 821 1,840 482 709 89412, no diploma 535 1,033 2,264 328 1,239 2,581 207 924 1,761HS graduates 1,408 1,739 2,749 859 2,090 3,064 549 1,260 2,257College 1,955 4,894 7,072 1,339 5,261 7,938 616 4,172 5,189Some, no degree 907 3,380 4,896 592 3,750 5,436 315 2,882 3,880Assoc. academic 327 4,900 5,902 227 4,740 6,129 100 5,227 5,386Assoc. vocational 333 5,792 6,568 224 5,994 6,641 109 5,331 6,418Bachelors 312 7,625 9,199 234 8,229 9,897 78 6,304 7,105Masters or higher 76 16,000 31,545 62 16,818 35,739 14 13,750 12,9752000Persons withincome 25+ years 19,090 785 2,133 10,536 888 2,672 8,554 686 1,469No education 2,978 665 1,148 1,502 729 1,646 1,476 610 640Elementary1-3 grades 629 754 1,310 338 809 1,553 291 700 1,0284-7 grades 2,905 687 1,807 1,586 766 2,587 1,319 612 870Elem. grads. 2,789 705 1,273 1,412 814 1,521 1,377 620 1,018High school9-11 grades 3,878 675 1,319 2,209 742 1,518 1,669 603 1,05612, no diploma 1,421 825 2,026 827 936 2,326 594 709 1,609HS graduates 1,861 987 2,618 1,035 1,396 3,119 826 873 1,990College 2,629 4,151 5,633 1,627 4,822 6,393 1,002 3,132 4,400Some, no degree 1,450 1,794 3,515 844 2,400 3,938 606 1,034 2,926Assoc. academic 404 5,690 6,798 268 6,087 7,445 136 5,106 5,523Assoc. vocational 390 5,990 7,169 239 6,331 7,476 151 5,368 6,683Bachelors 310 7,357 10,065 219 7,887 11,040 91 6,118 7,719Masters or higher 75 12,708 14,016 57 15,227 15,406 18 8,333 9,614Source: 1994 FSM <strong>Census</strong>, Table P183; 2000 FSM <strong>Census</strong>, Table P11-12Workers economic activities naturally has a bearing on their income. Table 11.8 shows the median income of each ofthe economic activity categories by sex in 1994 and 2000. Although the data on income refer to a different time periodthan economic status, the majority of these persons’ economic status would not have changed. Those personsemployed in the formal work sector had the highest median income at $2,810 in 1994, which increased to $3,700 in2000. Surprisingly, those persons who were not in the labor force but could have taken a job had a median incomehigher than the persons in subsistence. Those who could have taken a job had an income of $628 in 2000, and those inthe subsistence category had a median income of $582. This would suggest that about 79 percent of the subsistenceworkers and about 77 percent not in the labor force were receiving income from a source other than wages or salary.Females had consistently lower median incomes at every economic status.Table 11.8: Individual Median Income in 1993 and 1999 by Economic Status the Week Before the <strong>Census</strong>, <strong>Chuuk</strong> <strong>State</strong>: 1994 and 2000Percent of 1994 work force Median income ($)Percent of 2000 work force Median income ($)claiming incomeclaiming incomeEconomic status Number Total Males Females Number Total Males FemalesPersons 15+ yearswith income 31.9 9,283 987 1,378 852 55.8 19,090 785 888 686In labor force 56.4 6,288 1,916 2,024 1,723 46.9 11,257 978 1,226 842Employed 62.9 5,614 2,295 2,289 2,307 46.6 11,016 992 1,268 853Formal work 87.6 4,709 2,810 2,898 2,627 32.8 4,398 3,700 3,579 3,949Agriculture/fishing 25.5 905 679 693 622 64.6 6,618 667 716 606Subsistence 22.5 701 643 658 591 78.8 3,431 582 602 560Market oriented 47.4 204 836 843 800 54.1 3,187 792 860 686Unemployed 30.4 674 599 619 580 66.8 241 603 619 584Not in labor force 16.7 2,995 660 721 617 76.9 7,833 612 643 591Could have taken a job 20.4 679 591 598 586 73.6 4,231 628 681 599Not available for work 15.9 2,316 684 764 628 81.1 3,602 594 609 581Source: 1994 FSM <strong>Census</strong>, Table P185 and unpublished data; 2000 FSM <strong>Census</strong>, Table P11-14 and unpublished dataNote: Occupation refers to the most recent job, while the income data refers to 1993 & 1999 income.Table 11.9 shows median income for different occupations. Not all persons who had income in 1993 and 1999reported an occupation. Some persons with income were not working or had not had a job in the 5 years prior to the106 <strong>Chuuk</strong> Branch Statistics Office, Division of Statistics, FSM Department of Economic Affairs
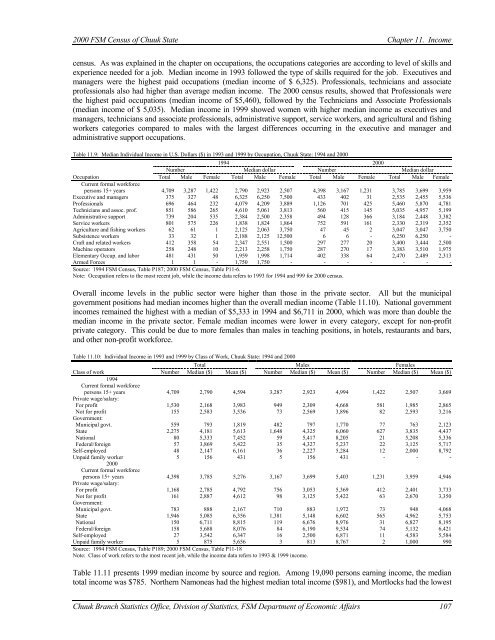
2000 FSM <strong>Census</strong> of <strong>Chuuk</strong> <strong>State</strong>Chapter 11. Incomecensus. As was explained in the chapter on occupations, the occupations categories are according to level of skills andexperience needed for a job. Median income in 1993 followed the type of skills required for the job. Executives andmanagers were the highest paid occupations (median income of $ 6,325). Professionals, technicians and associateprofessionals also had higher than average median income. The 2000 census results, showed that Professionals werethe highest paid occupations (median income of $5,460), followed by the Technicians and Associate Professionals(median income of $ 5,035). Median income in 1999 showed women with higher median income as executives andmanagers, technicians and associate professionals, administrative support, service workers, and agricultural and fishingworkers categories compared to males with the largest differences occurring in the executive and manager andadministrative support occupations.Table 11.9: Median Individual Income in U.S. Dollars ($) in 1993 and 1999 by Occupation, <strong>Chuuk</strong> <strong>State</strong>: 1994 and 20001994 2000Number Median dollar Number Median dollarOccupation Total Male Female Total Male Female Total Male Female Total Male FemaleCurrent formal workforcepersons 15+ years 4,709 3,287 1,422 2,790 2,923 2,507 4,398 3,167 1,231 3,785 3,699 3,959Executive and managers 375 327 48 6,325 6,250 7,500 433 402 31 2,535 2,455 5,536Professionals 696 464 232 4,079 4,209 3,889 1,126 701 425 5,460 5,870 4,781Technicians and assoc. prof. 851 586 265 4,610 5,061 3,813 560 415 145 5,035 4,957 5,199Administrative support 739 204 535 2,384 2,500 2,358 494 128 366 3,184 2,448 3,382Service workers 801 575 226 1,838 1,824 1,864 752 591 161 2,330 2,319 2,352Agriculture and fishing workers 62 61 1 2,125 2,063 3,750 47 45 2 3,047 3,047 3,750Subsistence workers 33 32 1 2,188 2,125 12,500 6 6 - 6,250 6,250 -Craft and related workers 412 358 54 2,347 2,551 1,500 297 277 20 3,400 3,444 2,500Machine operators 258 248 10 2,213 2,258 1,750 287 270 17 3,383 3,510 1,975Elementary Occup. and labor 481 431 50 1,959 1,998 1,714 402 338 64 2,470 2,489 2,313Armed Forces 1 1 - 1,750 1,750 - - - - - - -Source: 1994 FSM <strong>Census</strong>, Table P187; 2000 FSM <strong>Census</strong>, Table P11-6.Note: Occupation refers to the most recent job, while the income data refers to 1993 for 1994 and 999 for 2000 census.Overall income levels in the public sector were higher than those in the private sector. All but the municipalgovernment positions had median incomes higher than the overall median income (Table 11.10). National governmentincomes remained the highest with a median of $5,333 in 1994 and $6,711 in 2000, which was more than double themedian income in the private sector. Female median incomes were lower in every category, except for non-profitprivate category. This could be due to more females than males in teaching positions, in hotels, restaurants and bars,and other non-profit workforce.Table 11.10: Individual Income in 1993 and 1999 by Class of Work, <strong>Chuuk</strong> <strong>State</strong>: 1994 and 2000Total Males FemalesClass of work Number Median ($) Mean ($) Number Median ($) Mean ($) Number Median ($) Mean ($)1994Current formal workforcepersons 15+ years 4,709 2,790 4,594 3,287 2,923 4,994 1,422 2,507 3,669Private wage/salary:For profit 1,530 2,168 3,983 949 2,309 4,668 581 1,985 2,865Not for profit 155 2,583 3,536 73 2,569 3,896 82 2,593 3,216Government:Municipal govt. 559 793 1,819 482 797 1,770 77 763 2,123<strong>State</strong> 2,275 4,181 5,613 1,648 4,325 6,060 627 3,835 4,437National 80 5,333 7,452 59 5,417 8,205 21 5,208 5,336Federal/foreign 57 3,869 5,422 35 4,327 5,237 22 3,125 5,717Self-employed 48 2,147 6,161 36 2,227 5,284 12 2,000 8,792Unpaid family worker 5 156 431 5 156 431 - - -2000Current formal workforcepersons 15+ years 4,398 3,785 5,276 3,167 3,699 5,403 1,231 3,959 4,946Private wage/salary:For profit 1,168 2,785 4,792 756 3,053 5,369 412 2,401 3,733Not for profit 161 2,887 4,612 98 3,125 5,422 63 2,670 3,350Government:Municipal govt. 783 888 2,167 710 883 1,972 73 948 4,068<strong>State</strong> 1,946 5,085 6,356 1,381 5,148 6,602 565 4,962 5,753National 150 6,711 8,815 119 6,676 8,976 31 6,827 8,195Federal/foreign 158 5,688 8,076 84 6,190 9,534 74 5,132 6,421Self-employed 27 3,542 6,347 16 2,500 6,871 11 4,583 5,584Unpaid family worker 5 875 5,656 3 813 8,767 2 1,000 990Source: 1994 FSM <strong>Census</strong>, Table P189; 2000 FSM <strong>Census</strong>, Table P11-18Note: Class of work refers to the most recent job, while the income data refers to 1993 & 1999 income.Table 11.11 presents 1999 median income by source and region. Among 19,090 persons earning income, the mediantotal income was $785. Northern Namoneas had the highest median total income ($981), and Mortlocks had the lowest<strong>Chuuk</strong> Branch Statistics Office, Division of Statistics, FSM Department of Economic Affairs 107
- Page 5:
iii
- Page 12 and 13:
Preface2000 FSM Census of Chuukx
- Page 14 and 15:
Table of contents2000 FSM Census of
- Page 16 and 17:
LIST OF TEXT TABLESTABLEPageChapter
- Page 18 and 19:
List of Text Table2000 FSM Census o
- Page 20 and 21:
LIST OF FIGURESFIGUREPageFigure 1.1
- Page 22 and 23:
List of Basic-Tables2000 FSM Census
- Page 24 and 25:
MAP OF FSMxxiiChuuk Branch Statisti
- Page 27 and 28:
2000 FSM Census of Chuuk StateExecu
- Page 29 and 30:
CHAPTER 1INTRODUCTIONThe creation o
- Page 31 and 32:
2000 FSM Census of Chuuk StateChapt
- Page 33 and 34:
2000 FSM Census of Chuuk StateChapt
- Page 35 and 36:
2000 FSM Census of Chuuk StateChapt
- Page 37 and 38:
2000 FSM Census of Chuuk StateChapt
- Page 39 and 40:
2000 FSM Census of Chuuk StateChapt
- Page 41 and 42:
2000 FSM Census of Chuuk StateChapt
- Page 43 and 44:
2000 FSM Census of Chuuk State Chap
- Page 45:
2000 FSM Census of Chuuk StateChapt
- Page 48 and 49:
Chapter 2. Age and Sex Structure200
- Page 50 and 51:
Chapter 2. Age and Sex Structure200
- Page 52 and 53:
Chapter 2. Age and Sex Structure200
- Page 55 and 56:
CHAPTER 3HOUSEHOLDS, FAMILIES, AND
- Page 57 and 58:
2000 FSM Census of Chuuk StateChapt
- Page 59 and 60:
2000 FSM Census of Chuuk StateChapt
- Page 61:
2000 FSM Census of Chuuk StateChapt
- Page 64 and 65:
Chapter 4. Fertility2000 FSM Census
- Page 66 and 67:
Chapter 4. Fertility2000 FSM Census
- Page 68 and 69:
Chapter 4. Fertility2000 FSM Census
- Page 71 and 72:
CHAPTER 5MORTALITYIntroductionAs re
- Page 73 and 74:
2000 FSM Census of Chuuk StateChapt
- Page 75:
2000 FSM Census of Chuuk StateChapt
- Page 78 and 79:
Chapter 6. Migration2000 FSM Census
- Page 80 and 81:
Chapter 6. Migration2000 FSM Census
- Page 82 and 83:
Chapter 6. Migration2000 FSM Census
- Page 84 and 85: Chapter 6. Migration2000 FSM Census
- Page 86 and 87: Chapter 7. Religion, Ethnicity, and
- Page 88 and 89: Chapter 7. Religion, Ethnicity, and
- Page 90 and 91: Chapter 7. Religion, Ethnicity, and
- Page 92 and 93: Chapter 8. Education2000 FSM Census
- Page 94 and 95: Chapter 8. Education2000 FSM Census
- Page 96 and 97: Chapter 8. Education2000 FSM Census
- Page 98 and 99: Chapter 8. Education2000 FSM Census
- Page 100 and 101: Chapter 8. Education2000 FSM Census
- Page 103 and 104: CHAPTER 9ECONOMIC ACTIVITYIntroduct
- Page 105 and 106: 2000 FSM Census of Chuuk StateChapt
- Page 107 and 108: 2000 FSM Census of Chuuk StateChapt
- Page 109 and 110: 2000 FSM Census of Chuuk StateChapt
- Page 111 and 112: 2000 FSM Census of Chuuk StateChapt
- Page 113 and 114: 2000 FSM Census of Chuuk StateChapt
- Page 115 and 116: 2000 FSM Census of Chuuk StateChapt
- Page 117 and 118: CHAPTER 10INDUSTRY AND OCCUPATIONIn
- Page 119 and 120: 2000 FSM Census of Chuuk StateChapt
- Page 121 and 122: 2000 FSM Census of Chuuk StateChapt
- Page 123 and 124: 2000 FSM Census of Chuuk StateChapt
- Page 125 and 126: 2000 FSM Census of Chuuk StateChapt
- Page 127 and 128: 2000 FSM Census of Chuuk StateChapt
- Page 129 and 130: CHAPTER 11INCOMEIntroductionThe 200
- Page 131 and 132: 2000 FSM Census of Chuuk StateChapt
- Page 133: 2000 FSM Census of Chuuk StateChapt
- Page 137: 2000 FSM Census of Chuuk StateChapt
- Page 140 and 141: Chapter 12. Housing2000 FSM Census
- Page 142 and 143: Chapter 12. Housing2000 FSM Census
- Page 144 and 145: Chapter 12. Housing2000 FSM Census
- Page 146 and 147: Chapter 12. Housing2000 FSM Census
- Page 148 and 149: Chapter 12. Housing2000 FSM Census
- Page 150 and 151: Chapter 12. Housing2000 FSM Census
- Page 152 and 153: Chapter 12. Housing2000 FSM Census
- Page 154: Chapter 12. Housing2000 FSM Census
- Page 157 and 158: BIBLIOGRAPHYArriaga, E.E., (1983).
- Page 159: 2000 FSM Census of Chuuk StateBibli
- Page 162 and 163: Basic Tables2000 FSM Census of Chuu
- Page 164 and 165: Basic Tables2000 FSM Census of Chuu
- Page 166 and 167: Basic Tables2000 FSM Census of Chuu
- Page 168 and 169: Basic Tables2000 FSM Census of Chuu
- Page 170 and 171: Basic Tables2000 FSM Census of Chuu
- Page 172 and 173: Basic Tables2000 FSM Census of Chuu
- Page 174 and 175: Basic Tables2000 FSM Census of Chuu
- Page 176 and 177: Basic Tables2000 FSM Census of Chuu
- Page 178 and 179: Basic Tables2000 FSM Census of Chuu
- Page 180 and 181: Basic Tables2000 FSM Census of Chuu
- Page 182 and 183: Basic Tables2000 FSM Census of Chuu
- Page 184 and 185:
Basic Tables2000 FSM Census of Chuu
- Page 186 and 187:
Basic Tables2000 FSM Census of Chuu
- Page 188 and 189:
Basic Tables2000 FSM Census of Chuu
- Page 190 and 191:
Basic Tables2000 FSM Census of Chuu
- Page 192 and 193:
Basic Tables2000 FSM Census of Chuu
- Page 194 and 195:
Basic Tables2000 FSM Census of Chuu
- Page 196 and 197:
Basic Tables2000 FSM Census of Chuu
- Page 198 and 199:
Basic Tables2000 FSM Census of Chuu
- Page 200 and 201:
Basic Tables2000 FSM Census of Chuu
- Page 202 and 203:
Basic Tables2000 FSM Census of Chuu
- Page 204 and 205:
Basic Tables2000 FSM Census of Chuu
- Page 206 and 207:
Basic Tables2000 FSM Census of Chuu
- Page 208 and 209:
Basic Tables2000 FSM Census of Chuu
- Page 210 and 211:
Basic Tables2000 FSM Census of Chuu
- Page 212 and 213:
Basic Tables2000 FSM Census of Chuu
- Page 214 and 215:
Basic Tables2000 FSM Census of Chuu
- Page 216 and 217:
Basic Tables2000 FSM Census of Chuu
- Page 218 and 219:
Basic Tables2000 FSM Census of Chuu
- Page 220 and 221:
Basic Tables2000 FSM Census of Chuu
- Page 222 and 223:
Basic Tables2000 FSM Census of Chuu
- Page 224 and 225:
Basic Tables2000 FSM Census of Chuu
- Page 226 and 227:
Basic Tables2000 FSM Census of Chuu
- Page 228 and 229:
Basic Tables2000 FSM Census of Chuu
- Page 230 and 231:
Basic Tables2000 FSM Census of Chuu
- Page 232 and 233:
Basic Tables2000 FSM Census of Chuu
- Page 234 and 235:
Basic Tables2000 FSM Census of Chuu
- Page 236 and 237:
Basic Tables2000 FSM Census of Chuu
- Page 238 and 239:
Basic Tables2000 FSM Census of Chuu
- Page 240 and 241:
Basic Tables2000 FSM Census of Chuu
- Page 242 and 243:
Basic Tables2000 FSM Census of Chuu
- Page 244 and 245:
Basic Tables2000 FSM Census of Chuu
- Page 246 and 247:
Basic Tables2000 FSM Census of Chuu
- Page 248 and 249:
Basic Tables2000 FSM Census of Chuu
- Page 250 and 251:
Basic Tables2000 FSM Census of Chuu
- Page 252 and 253:
Basic Tables2000 FSM Census of Chuu
- Page 254 and 255:
Basic Tables2000 FSM Census of Chuu
- Page 256 and 257:
Basic Tables2000 FSM Census of Chuu
- Page 258 and 259:
Basic Tables2000 FSM Census of Chuu
- Page 260 and 261:
Basic Tables2000 FSM Census of Chuu
- Page 262 and 263:
Basic Tables2000 FSM Census of Chuu
- Page 264 and 265:
Basic Tables2000 FSM Census of Chuu
- Page 266 and 267:
Basic Tables2000 FSM Census of Chuu
- Page 268 and 269:
Basic Tables2000 FSM Census of Chuu
- Page 270 and 271:
Basic Tables2000 FSM Census of Chuu
- Page 272 and 273:
Basic Tables2000 FSM Census of Chuu
- Page 274 and 275:
Basic Tables2000 FSM Census of Chuu
- Page 276 and 277:
Basic Tables2000 FSM Census of Chuu
- Page 278 and 279:
Basic Tables2000 FSM Census of Chuu
- Page 280 and 281:
Basic Tables2000 FSM Census of Chuu
- Page 282 and 283:
Basic Tables2000 FSM Census of Chuu
- Page 284 and 285:
Basic Tables2000 FSM Census of Chuu
- Page 286 and 287:
Basic Tables2000 FSM Census of Chuu
- Page 288 and 289:
Basic Tables2000 FSM Census of Chuu
- Page 290 and 291:
Basic Tables2000 FSM Census of Chuu
- Page 292 and 293:
Questionnaire2000 FSM Census of Chu
- Page 294 and 295:
Questionnaire2000 FSM Census of Chu
- Page 296 and 297:
Questionnaire2000 FSM Census of Chu