Source Mechanism Study of Quetta Earthquake of May 30, 1935
Source Mechanism Study of Quetta Earthquake of May 30, 1935
Source Mechanism Study of Quetta Earthquake of May 30, 1935

Create successful ePaper yourself
Turn your PDF publications into a flip-book with our unique Google optimized e-Paper software.
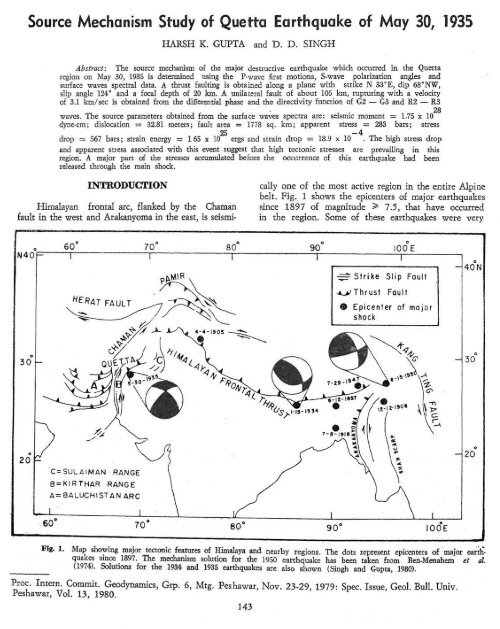
Abstract:HARSH K. GUPTA and D. D. SINGHThe source mechanism <strong>of</strong> the major destl-uctive earthquake which occurred in the <strong>Quetta</strong>region on <strong>May</strong> <strong>30</strong>, <strong>1935</strong> is determined using the P-wave first motions, S-wave polarization angles andsurface waves spectral data. A thrust faulting is obtained along a plane with strike N 33"E, dip 68"NW,slip angle 124" and a focal depth <strong>of</strong> 20 km. A unilatersll fault <strong>of</strong> about 106 km, rupturing with a velocity<strong>of</strong> 3.1 km/sec is obtained from the differential phase and the directivity function <strong>of</strong> lG2 - G3 and R2 - R3waves. The source parameters obtained from the surface waves spectra are: seismic moment = 1.75 x 10 28dyne-cm; dislocation = 32.81 meters; fault area = 1778 sq. km; apparent stress = 283 bars; stress25 -4drop = 567 bars; strain energy = 165 x 10 ergs and strain drop = 18.9 x 10 . The high stress dropand apparent stress associated with this went suggest that high tectonic stresses are prevailing in thisregion. A major part <strong>of</strong> the stresses accumulated before the occurrence <strong>of</strong> this earthquake had beenreleased thro~ngh the main shoclr.INTRODUCPTIONHimalayan frontal arc, flded by the Chamanfault in the west and Arakanyoma in the east, is seisrni-cally one <strong>of</strong> the most active region in the entire Alpinebelt. Fig. 1 shows the epicenters <strong>of</strong> major earthquakessince 1897 <strong>of</strong> magnitude 3 7.5, that have occurredin the region. Some <strong>of</strong> these earthquakes were veryu Thr us1 Foul t'C=~ULAIMAN RANGEB=KIRTHAR RANGEA= BALUCHISTAN ARCFig. 1.Map showing major tectonic features <strong>of</strong> Himalaya and nearby regions. The dots represent epicenters <strong>of</strong> major earthquakessince 1897. The mechanism solution for the 1950 earthquake has brm taken from Ben-Menahem el at.(1974). Solutions for the 1934 and <strong>1935</strong> earthquakes are also shown (Siugh and Gupta, 1980).Proc. Intern. Commit. Geodynamics, Grp. 6, Mtg. Peshawar, Nov. 23-29, 1979: Spec. Issue, Geol. Bull. Unh.Peshawar, VoZ. 13, 1980.-.
damaging and claimed thousands <strong>of</strong> human lives. Thefocal mechanism solutions provide better means fordetermining the orientation <strong>of</strong> regional stress, nature <strong>of</strong>faulting and sense <strong>of</strong> motion on the faults. The focalmechanism solutions for a very few large magnitudeearthquakes are available in the Himalayan and nearbyregions. For understanding the regional tectonics <strong>of</strong> theregion, it is necessary to know the source parameters<strong>of</strong> these earthquakes. Ben-Menahem et al. (1974) investigatedin detail the Assam earthquake <strong>of</strong> August 15,1950. The source parameters <strong>of</strong> the Bihar-Nepal earthquake<strong>of</strong> January 15, 1934 have been investigated indetail by Singh and Gupta (1980). Among the remainingearthquakes, the <strong>Quetta</strong> earthquake <strong>of</strong> <strong>May</strong> <strong>30</strong>,<strong>1935</strong> is <strong>of</strong> special interest, as sufficient instrumentaldata are available to carry out the detailed source parameterstudies.The area surrounding the <strong>Quetta</strong> syntaxis formsone <strong>of</strong> the seismically most active region in the Alpinebelt. Several earthquakes have occurred in the pre-histaricaltimes causing severe damage to both propertyand life. The focal mechanism solution for earthquakesoccuring in this region has been determined by variousinvestigators like Quittmeyer et al. (1979) andChandra (1978 and 1980). A major destructive earthquake<strong>of</strong> magnitude M = 7.6 occurred close to (Fig. I)<strong>Quetta</strong> (epicenter 29.5"N, 66.7"E) on <strong>May</strong> <strong>30</strong>, <strong>1935</strong>(origin time 21 h 33 m 0.0. s). It caused a considerableamount <strong>of</strong> destruction, claimed an estimated<strong>30</strong>,000 human lives and created numerous fracturesand landslides. Here we present the detailed sourceparameter investigations for this earthquake using theavailable records <strong>of</strong> merent seismological stationsthroughout the world. The focal mechanism and di•’-ferent seismic source parameters like fault length, rupturevelocity, source time function, seismic moment,dislocation, apparent stress, stress and strain drop areestimated using the body and surface waves data <strong>of</strong> thisearthquake.FOCAL MECHANISMP and S waves dufu: Seismograms were obtained forthe <strong>Quetta</strong> earthquake from Merent seismologicalstations throughout the world. The P-wave firstmotion directions are read from the long period verticalcomponent records. These first motions are plotted onthe lower hemisphere <strong>of</strong> the equal area projection(Fig. 2). S-wave polarization angles are determinedusing the records <strong>of</strong> a few seismic stations. These areplotted in Fig. 2. The standard deviation and averageerror are calculated by varying the dip and strike <strong>of</strong>the nodal planes within the range, which were permittedfrom the P-wave data. For the best fit model, thestandard deviation and average error are estimated tobe 10.6" and 8.8'. Here the P and S waves data arenot sufficient for defining the nodal planes accuratelyFig. 2., OUETTA MAY <strong>30</strong>,<strong>1935</strong> ZOKILOMETERSFault plane solution determined using first motionsread from long-period records. Filled and opencircIes represent &st motions compressions anddilatations, respectively. ,P is the pressure axis or axis<strong>of</strong> maximum compression, T is the tension axis oraxis <strong>of</strong> minimum compression. X and Y are thepoles <strong>of</strong> the two nodal planes. S-wave poIarizationdirections are shown by short lines. Small dots indi-Lcate stations for which ody Swave data are used.and, therefore, surface waves spectral data have alsobeen used.Rayleigh/Love wave spechd ratio: Surface wave spectralratio has advantages over the use <strong>of</strong> absolute surfacewaves spectra, as we do not have to apply thecorrections for the ef•’ect <strong>of</strong> instrument, path, sourcefiniteness and source time function (Canitez and Toksoz,1971). For the determination <strong>of</strong> observed spectralratio, the fundamental mode Rayleigh and Love waves<strong>of</strong> several minutes duration (Fig. 3 and Table 1) aredigitized at the varying time intervals, depending uponthe wave forms. These data are then interpolated at afixed time interval <strong>of</strong> 0.3 sec using the Lagerangianinterpolation method. The digitized data are detrendedand the arithmetic mean is removed. Afterwards, thedata are Fourier analysed using the Simpson's methodto get the spectral amplitude and phase. The theoreticalspectral ratios are calculated using the method <strong>of</strong>Harkrider (1 970) for different fault orientations consistentwith the P- and S-waves data. The best fit is obtainedby the trial and error comparison <strong>of</strong> the observedRayleigh/Love wave spectral ratio with the theoreticalones, calculated for focal depths <strong>of</strong> 10, 20 and 35 kmat five seismic stations. A few such plots are shownin Fig. 4 for the selected best fit model. The fault
TABLE I. The Digitized Signals Recorded at Different Seismic Stations for the <strong>Quetta</strong> earthquake <strong>of</strong> Mqy <strong>30</strong>, <strong>1935</strong>.. - -. .Dis tame Beginning <strong>of</strong> End <strong>of</strong> the timeStation Seismograph Component Wave (km) the time window windowName GMT GMThr min sec hr min secUppsalaCopenhagenWiechertWiechert-Galitzin WilipStuttgartGalitzin WillipScoresbysundGalitzin WilipIvigtutWiechertMelbourneWellingtonMilne ShawMilne ShawMAY <strong>30</strong>,<strong>1935</strong>plane orientation for the best fit model are as follows:Strike , 0 = N33"EDip, 8= 68"NWSlip angle, h. = 124"Focal depth, H = 20 kmFautfl length, rupture velocity mtd source time function:Directivity fmction was defined by Ben-Menahem(1961) as the ratio <strong>of</strong> the spectral amplitude <strong>of</strong> wavesleaving the source in opposite directions:COP lEWlwherec = phase velocityb = fault lengthv = rupture velocityQ = angle between the fault plane and the great
TABLE 2.. Estimates <strong>of</strong> the Fault Length for <strong>Quetta</strong>earthquake <strong>of</strong> <strong>May</strong> <strong>30</strong>, <strong>1935</strong> from. theDifferential Phases <strong>of</strong> Love and RayleighwavesFrequency Period STU SCO(Hz) (Sec.) (G2/G3) (R2/R3)We have estimated the fault length and rupturevelocity from the diflexential phases and the direcfivityfunction method (Ben-Menahem and Toksoz, 1962 and1963). For the determination <strong>of</strong> Uerentid phases <strong>of</strong>G2G3 and R2-R3, the Love and Rayleigh waves for<strong>Quetta</strong> earthquake are digitized (Fig. 3 and Table 1)as described earlier. The digitized data are detrended,corrected for amplitude and instrumental phase shift(Hagiwara, 1958). The amplitude and phase spectrumare obtained using the fast Fourier transform algorithem.The initial phase is obtained using the relation <strong>of</strong> Ben-Menahem and Toksijz (1 962) :wheret = the time lag <strong>of</strong> the beginning <strong>of</strong> the spectralnwindow with respect to the origin time.: a' = Fourier phaseA = epicentral distance <strong>of</strong> the recording stationM = an integerinst= instrumental phase shiftThe initial phase, @o, is corrected fur the sourcefiniteness effect. Then the Merential phase, 6 4 iscalculated for the pairs <strong>of</strong> R2-R3 and G2-G3 wavesand is listed in Table 2. The average value <strong>of</strong>X'@% ( X' = wave length ) is estimated, which yieldsthe fault length <strong>of</strong> 106 km.Fig.THEORETICALx = 124'~ 6=-68:SCO- PERIOD (SECONDS) --+4. Comparison <strong>of</strong> obsdved Rayldgh/Lme wave spectralratio (dots) -&h the theortical ones (continuousline) at a few stations for the best fit model.-.The rupture velocity is calculated using the dire=.tivity functions <strong>of</strong> G2-G3 and R2-R3 waves. Thedsav-ectiiyit~~ function is obtained from &e spec-tral amplitude ratios <strong>of</strong> R2-R3 or G2G3 waves,;corrected for the absorption effect. The values <strong>of</strong> phase /velocity and attenuation coefficients are taken fromMills and Hales (1978). The theoretical directivity iscalculated from the above relation for different combi- ,nations <strong>of</strong> fault length and rupture velocity. The faultlength is varied in the range <strong>of</strong> 106 * <strong>30</strong> km andrupture velocity is varied from 2.5 to 3.5 km/sec. 'Fig. 5 shows the directivity functions for the selectedbest fit model. The rupture velocity is estimated to be3.1 km/sec. We have also tried to match the observed ,directivity functions with the theoretical ones which Iwere calculated for different seismic somce models con- :sidered (Ben-Menahem and Toksiiz, 1962). These are lil Ithe exponentially decaying source, and (ii) the bidirec- jtional faulting. The theoretical directivity functions ,obtained for these two seismic source models do not !match satisfactorily with the observed ones. The objer- 'ved directivity function gives a better fit with the 'unilateral horizontal fault movement source model with ,1
MAY <strong>30</strong>, <strong>1935</strong>and error methods <strong>of</strong> comparing the observed sourcrtime function with the- synthesized ones. The saurcttime function, which fits the observed data here satisfactorily, is written as:.Ja2G (t) = H (t) € log,, ( 1 + - ) 1t2Here H (t) is the Heaviside unit step function anda is a constant. These results are shown in Fig. 6.a-- THEORE TICAL" 0-dl 2 0.3 0 0 0 Gb? 0-;El- Frequency, Hz -Fig. 6. The observed phase spectra <strong>of</strong> the source time functionand the reconstructed source" time <strong>of</strong> the <strong>Quetta</strong>earthquake.Seismic moment and onbev soslrce parameters:Seismic moment is a measure <strong>of</strong> the size <strong>of</strong> an earth.quake source, We have determined it 'using the relation<strong>of</strong> Udias and Arroyo (1970). For the cddation <strong>of</strong>seismic moment, the spectral amplitudes which weredetermined earlier, have been used. We have correctedfor the fmiteness effect <strong>of</strong> the source by dividing by thefactor Sin X/X,.. .where >Fig- 5.SCO (G2/G3)-3 2 KM/SECObserved and theoretical values <strong>of</strong> directivity funetions determined at different frequencies for the<strong>Quetta</strong> earthquake.a constant rupture velocity. Therefore, uailaterd faultpropagation with a constant rupture propgation isinferred for <strong>Quetta</strong> earthquake.<strong>Source</strong> time function is obtained using the initialphase <strong>of</strong> R2 waves. The initial phases <strong>of</strong> a seismicsource are the phases <strong>of</strong> Fourier transform <strong>of</strong> its sotimefunctions. For the synthesis <strong>of</strong> source time function,several trigonometrical and exponential functions, havebeen considered. The best fit is obtained by the trialThe seismic moment values are fisted in Table 3. Faultarea, A, is determined from magnitude using the relation(Chinnery , 1969) :log A (Sq km) = 0.60 m - 1.31,-.."... ...-- ."*After getting the fault length and fault area, we estimatethe fault width, W, for a rectangular fault model. Theaverage dislocation across the fault plane is estimatedu"sing the relation:wherep = shear modulus (=3x1O1? dyne/cm2)147
TABLE 3. Seismic Moment Estimates for the <strong>Quetta</strong> earthquake <strong>of</strong> <strong>May</strong> <strong>30</strong>, <strong>1935</strong>.Station Distance Rayleigh Wave Love Wave Average(degree) M M MOdyne-cm) (1028 dyne-cm) O dyne-cm)110 sec 80 sec 65 sec 110 sec 80 sec 65 sec-COP 45.9 4.87 3 -08 1.32 2.76 2.15 2.76 2 -82SCO 61.7 3 -53 1.67 1.32 4.71 1.20 4.72 2.86IVI 75.1 1.57 0.38 0.22 0.59 0.35 0.51 0.60WEL 122.1 0.75 0.19 0.29 1.26 0 -84 0.93 0.71The stress drop, a~; strain energy, E, and straindrop, x; are estimated using the following relations(Eshelby, 1957) :TABLE 4. Estimates <strong>of</strong> Seismic <strong>Source</strong> ParametersParameters <strong>May</strong> <strong>30</strong>, <strong>1935</strong>x Aa=-EtHere, r = (:)*7and n =--x12Fault length, kmFault width, kmFault area, krn2Rupture velocity, km/secStrain energy, ergs1.65 x lo25Seismic moment, dyne - cm 1.75 x 1028Displacement, metersStress drop, barsApparent stress, bars 283The apparent stress is a measure <strong>of</strong> the stressesacting in the focal region <strong>of</strong> the earthquake and is esti- Straitl drop 18.9 xmated by the following relation (Aki, 1966; Brune,1968) : Magnitude, M (Richter, 1958) 7.6Azimuth <strong>of</strong> strikeDip <strong>of</strong> Fau1.tSlip angle 124"All these seismic source parametets are listed in Focal depth, km 20Table 4.*. " .a2<strong>Source</strong> time function, G (t) H(t) { log lo (1 +-) 1t2
The earthquake <strong>of</strong> <strong>May</strong> <strong>30</strong>, <strong>1935</strong> occurred nearthe <strong>Quetta</strong> syntaxis. Body and sudace waves studiesindicate thrust faulting along a plane with strikeN 33"E, dip 68"NW and slip angle 124". Isoseismals<strong>of</strong> maximum intensity X are aligned in the NNL direction.Chandra (1978) has determined the focal mechanismsolutions for earthquakes near the <strong>Quetta</strong> region.He has obtained left-lateral strike slip faulting alongthe N-S striking nodal plane for one earthquake, whichoccurred east <strong>of</strong> <strong>Quetta</strong>. The focal mechanism solutionsfor earthquakes occurring near the southern part <strong>of</strong>the Sulairnan range, where the structural trend curvestowards the west, shows thrust faulting along eastwestor north-east striking nodal planes. The trend <strong>of</strong>the pressure axis in these mechanism solutions isslightly west <strong>of</strong> north. Near <strong>30</strong>•‹N latitude, the trend<strong>of</strong> Sulaiman ranges curve around toward west in afestoon-like structure. The focal mechanism solutionsdetermined by Chandra (1980) show predominantlystrike slip faulting in this region. These solutions indicateright lateral movement along west to north-weststriking nodal planes, or left lateral motion alongnorth to north-east striking nodal planes. The seismicitytrend in the epicentral region <strong>of</strong> these earthquakesfavours a west to north-west striking fault plane (Quittmeyeret al., 1979). Close to the epicentre <strong>of</strong> <strong>1935</strong>earthquake, the Jurassic rocks are overlying the Cretaceousformations and the entire formations are dippingto the north-west side. There are several thrust faultspresent in the region (Fig. 1) where the rocks on thenorthwest side <strong>of</strong> the fault have been thrusted over therccks on the south-east side (West, 1936).The mountains <strong>of</strong> Baluchistan consist <strong>of</strong> simplefolds with axes parallel to the alignment <strong>of</strong> themountain ranges. In general, the anticlines form theridges and the synclines form the valleys. These foldshave been formed due to relative movements betweenCentral Asia and the Indian subcontinent. The northsouthtrend <strong>of</strong> the Baluchistan arc is interrupted by asharp re-entrant angle in the neighbourhood <strong>of</strong> <strong>Quetta</strong>.At the southern end <strong>of</strong> Sulaiman range, the mountainsswing sharply towards the west with an east-westtrend and near <strong>Quetta</strong>, there is again a sharp bendtowards the south (Fig. 1). The north-south trend isresumed along the Kirthar mountains (West, 193 6).The structure <strong>of</strong> the area consists <strong>of</strong> a complex pattern<strong>of</strong> fold and thrust with axes changing from eastwestto north-south.The value <strong>of</strong> stress drop associated with the <strong>1935</strong><strong>Quetta</strong> earthquake is larger than those reported forcther earthquakes <strong>of</strong> similar magnitude (Abe, 1972 ;Ben-Menahem, 1977). The high value <strong>of</strong> stress dropand apparent stress associated with this earthquakesuggests that a major part <strong>of</strong> the stresses accumulatedbefore the occurrence <strong>of</strong> this earthquake, have beenreleased though the main shock (Kanamori, 1972).This implies the presence <strong>of</strong> high tectonic stresses in'the epicentral region <strong>of</strong> this earthquake. The <strong>Quetta</strong>region is seismically quite active.As pointed out by Ben-Menahem and Toksoz(1962), the initial phase at the source consists <strong>of</strong> twoparts: (i) the phase which is due to strain-release timefunction at a point on the fault, and (ii) the phaseretardation due to fiteness and the motion <strong>of</strong> thesource. The initial phase for the <strong>1935</strong> earthquake isnot varying much with frequency. This implies thatthe above mentioned two contributions <strong>of</strong> phases areeither cancelling each other or are constant alongthe entire frequency spectrum. Similar results wereobtained in the case <strong>of</strong> Alaska earthquake <strong>of</strong> July 10,1958 (Brune, 1961) and Chillean earthquake <strong>of</strong> <strong>May</strong>22, 1960 (Bme et al., 1961), which show a constantinitial phase for the entire period range <strong>of</strong> 210 to 550sec investigated.CONCLUSIONSThe focal mechanism solution for earthquakesoccurring in the nearby regions <strong>of</strong> <strong>Quetta</strong> syntaxisshows strike slip faulting in general. The faultplane solution for the <strong>Quetta</strong> earthquake <strong>of</strong> <strong>May</strong> <strong>30</strong>,<strong>1935</strong> determined while using the body and surfacewaves spectral data, shows thrust faulting along a planehaving strike N 33"E, dip 68'NW, slip angle 124'and a focal depth <strong>of</strong> 20 krn. This earthquake is characterizedby high stress drop and apparent stress; indicatingthat high tectonic stresses are prevailing in theepicentral region.Acknowledge?lzents: The authors are grateful to Dr. S.Balakrishna, Director National Geophysical Research Institute,Hyderabad, India for according permission to publish thiswork. The seismograms used in the present study were kindlysupplied by different seismological observatories in the world.We would like to express our sincere thanks to the Directors<strong>of</strong> these observatories.REFEBENCESAbe, K. 1972. <strong>Mechanism</strong>s and tectonic implications <strong>of</strong> the1966 and 1970 Peru earthquakes, Phys. Earth Planet.Interiors 5, 367-379.Aki, K. 1966 Generation and propagation <strong>of</strong> G waves fromthe Niigslta earthquake <strong>of</strong> June 16, 1964. Part 2.Estimation <strong>of</strong> earthquake moment, released energy,and stress-strain drop from ,the Gwave spectrum,Bull. <strong>Earthquake</strong> Res. Inst., Tokyo Univ. 4-4, 73-88.Ben-Menahem, A. 1961. Radiation <strong>of</strong> seismic surface wavesfrom finite moving sources, Bull. Seism. !k. Am. 51,401-435.Ben-Menahem, A. & Toksoz, M.N. 1962. Soyc&nechanismfrom spectra <strong>of</strong> long period seismic ydace waves. 1.The Mongolian earthquake <strong>of</strong> DKmber 4, 1957, J.Geophys. lies. 67, 1943-1955. /
Ben-Menahern, A. & Toksoz, M.N. 1963. <strong>Source</strong> mechanismfrom spectrums <strong>of</strong> long period surface waves 2. TheKanlchatka earthquake <strong>of</strong> November 4, 1952. J.Geophys. Res. 68, 5207-5222.Ren-Menahem, A,, Aboodi, E. & Schiild, R. 1974. The source<strong>of</strong> the great Assam earthquake - an interplate wedgemotion, Phys. Earth Planet. Inter. 9, 265-289.Ben-Menahem, A. 1977. <strong>Earthquake</strong> similarity laws, PhysEarth Planet. Interior 15, 1618.Brune, J.N. 1961. Radiation pattern <strong>of</strong> Rayleigh waves fromthe southeast Alaska earthquake <strong>of</strong> July 10, 1958,Symposium on <strong>Earthquake</strong> <strong>Mechanism</strong>, Pubs. DominionObservatory, Ottawa, %, 10, 1961.Brune, J.N., Beni<strong>of</strong>f, H. & Ewing, M. 1%1. Longitudinal surfacewaves from the Chilean earthquake <strong>of</strong> <strong>May</strong> 22,1960, recorded on linear strain seismographs, J.Geophys. Res. 66, 2895-2910.Brune, J.N. 1968. Seismic moment, Seismicity and rate <strong>of</strong>slip along major fault zones, J. Geophys. Res. 73,777-7848.Canita, N. & Toksoz, M.N. 1971. <strong>Source</strong> parameters <strong>of</strong>earthquakes from body and surface-wave data, Bull.Seism. Soc. Am. 61, 1369-1379.Chandra, U. 1978. Seismicity, earthquake mechanisms andtectonics along the Himalayan mountain range andvicinity, Phys. Earth Planet. Interiors 16, 109-131.Chandra, U. 1980. Focal mechanism solutions and their tectonicimplications for the Alpine-Himalayan region,east. I.C.G. Working Group 6 Volume, Am. Gmphy.Union (in press).Chinnery, M .A. 1969. , <strong>Earthquake</strong> magnitude and source parameters,Bull. Seism. Soc. Am. 59, 1969-1982.Eshelby, J.D. 1957. The determination <strong>of</strong> the elastic field <strong>of</strong>an ellipsoidal inclusion and related problems, Proc.Royal. Soc., London, A 241, 3763%.WagiWua, T. 1958. A note on the theory <strong>of</strong> electromagneticseismograph, Bull. <strong>Earthquake</strong> Res. Inst. Tokyo Uaiv.36, 139-1641.Harkrider, D.G. 1970. Surface waves in mdtilayered elasticmedia. Part 11. Higher mode spectra and spectralratios from point sources in plane layered earthmodels, Bull. Seism. Soc. Am. 60, 1937-1987.Kanamori, H. 1972. Determination <strong>of</strong> effective tectonic stressassociated with earthquake faulting: The Tottoriearthquake <strong>of</strong>! 1943, Phys. Earth Planet Interiors 5,426-434.Mills, J.M. S; Hales, A.L. 1978. Grqt circle Rayleigh waveattention and group velocity Part II. Observationsfor periods between 50 and 200 seconds for ninegreat-circle paths and global averages for periods <strong>of</strong>5 to 600 seconds, Phys. Earth Planet, Interiors 17,209-231.Quittmeyer, R.C., Farah, A. & Jacob, K.H. 1979. The seismi.city <strong>of</strong> Pakistan and its relation to surface faults: kGeodynamics <strong>of</strong> Pakistan - Progress Report (eds.Abul Farah and Kees A. DeJong), Special Publica.ticn <strong>of</strong> the Geol. Survey <strong>of</strong> Pakistan, <strong>Quetta</strong>.Richter, C.F. 1958. Elementary !%smology, W.H . Freemm,Sari Francisco, 768.Singh, D.D. 81 Gupta, H.K. 1980. <strong>Source</strong> dynamics <strong>of</strong> twogreat earthquakes <strong>of</strong> the Indian subcontinent: TheBihar-Nepal earthquake <strong>of</strong> January 15, 1934 and the<strong>Quetta</strong> earthquake <strong>of</strong> <strong>May</strong> <strong>30</strong>, <strong>1935</strong>, Bun. Seism. Soc.Am. (in press).Udias, A. & Arroyo, A L. 1970. Body and surface wave study<strong>of</strong> source parameters <strong>of</strong> the March 15, 1964 Spanishearthquake, Tectonophysics 9, 323-346.West, W.D. 1936. Preliminary Geological report on the Balu.chistan (<strong>Quetta</strong>) earthquake <strong>of</strong> <strong>May</strong> 31st, <strong>1935</strong>, Rec.Geol. Survey. Ind. 69 (pt 21, 203240.