Unit 5 Lesson 4 - Activity 47
Unit 5 Lesson 4 - Activity 47
Unit 5 Lesson 4 - Activity 47
- No tags were found...

Create successful ePaper yourself
Turn your PDF publications into a flip-book with our unique Google optimized e-Paper software.
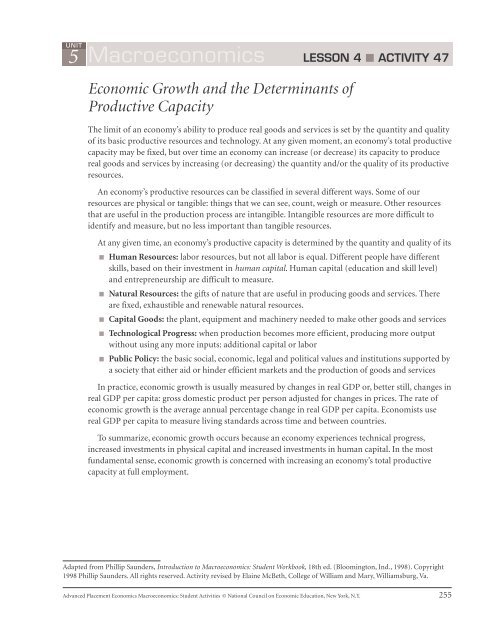
5UNITMacroeconomics LESSON 4 ■ ACTIVITY <strong>47</strong>Economic Growth and the Determinants ofProductive CapacityThe limit of an economy’s ability to produce real goods and services is set by the quantity and qualityof its basic productive resources and technology. At any given moment, an economy’s total productivecapacity may be fixed, but over time an economy can increase (or decrease) its capacity to producereal goods and services by increasing (or decreasing) the quantity and/or the quality of its productiveresources.An economy’s productive resources can be classified in several different ways. Some of ourresources are physical or tangible: things that we can see, count, weigh or measure. Other resourcesthat are useful in the production process are intangible. Intangible resources are more difficult toidentify and measure, but no less important than tangible resources.At any given time, an economy’s productive capacity is determined by the quantity and quality of its■ Human Resources: labor resources, but not all labor is equal. Different people have differentskills, based on their investment in human capital. Human capital (education and skill level)and entrepreneurship are difficult to measure.■ Natural Resources: the gifts of nature that are useful in producing goods and services. Thereare fixed, exhaustible and renewable natural resources.■ Capital Goods: the plant, equipment and machinery needed to make other goods and services■ Technological Progress: when production becomes more efficient, producing more outputwithout using any more inputs: additional capital or labor■ Public Policy: the basic social, economic, legal and political values and institutions supported bya society that either aid or hinder efficient markets and the production of goods and servicesIn practice, economic growth is usually measured by changes in real GDP or, better still, changes inreal GDP per capita: gross domestic product per person adjusted for changes in prices. The rate ofeconomic growth is the average annual percentage change in real GDP per capita. Economists usereal GDP per capita to measure living standards across time and between countries.To summarize, economic growth occurs because an economy experiences technical progress,increased investments in physical capital and increased investments in human capital. In the mostfundamental sense, economic growth is concerned with increasing an economy’s total productivecapacity at full employment.Adapted from Phillip Saunders, Introduction to Macroeconomics: Student Workbook, 18th ed. (Bloomington, Ind., 1998). Copyright1998 Phillip Saunders. All rights reserved. <strong>Activity</strong> revised by Elaine McBeth, College of William and Mary, Williamsburg, Va.Advanced Placement Economics Macroeconomics: Student Activities © National Council on Economic Education, New York, N.Y. 255
5UNITMacroeconomicsLESSON 4 ■ ACTIVITY <strong>47</strong> (continued)Part AMeasuring Economic Growth in Hamilton County and Jefferson CountyFigure <strong>47</strong>.1Hamilton Hamilton Jefferson JeffersonYear Real GDP Population Real GDP Population1 $2.1 billion 70,000 $500,000 152 2.5 billion 80,000 525,000 163 2.8 billion 90,000 600,000 174 2.7 billion 86,000 650,000 181. Using Figure <strong>47</strong>.1 as a reference, fill out the tables in Figures <strong>47</strong>.2, <strong>47</strong>.3 and <strong>47</strong>.4.Figure <strong>47</strong>.2HamiltonJeffersonTime period % Change in Real GDP % Change in Real GDPFrom Year 1 to Year 2From Year 2 to Year 3From Year 3 to Year 4Figure <strong>47</strong>.3HamiltonJeffersonYear Per Capita Real GDP Per Capita Real GDP1234Figure <strong>47</strong>.4HamiltonJeffersonTime period % Change in Per Capita Real GDP % Change in Per Capita Real GDPFrom Year 1 to Year 2From Year 2 to Year 3From Year 3 to Year 4256 Advanced Placement Economics Macroeconomics: Student Activities © National Council on Economic Education, New York, N.Y.
5UNITMacroeconomicsLESSON 4 ■ ACTIVITY <strong>47</strong> (continued)2. When did Hamilton County experience the largest growth in real GDP? ____________________In per capita real GDP? _____________________Are these growth rates different? Explain.3. When did Jefferson County experience the largest growth in real GDP? _____________________In per capita real GDP? _____________________Are these growth rates different? Explain.4. The residents of Hamilton County believe they live in a wealthier community than small ruralJefferson County. Based on these numbers, do they? Explain.Advanced Placement Economics Macroeconomics: Student Activities © National Council on Economic Education, New York, N.Y. 257
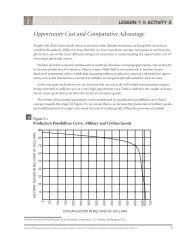
5UNITMacroeconomicsLESSON 4 ■ ACTIVITY <strong>47</strong> (continued)Part BAnalyzing the Reasons for Economic GrowthEconomic growth can be illustrated by a rightward shift of the long-run aggregate supply curve or ashift outward of the production possibilities curve of consumption goods vs. capital goods.5. Draw a graph that includes AD, SRAS and LRAS and then draw a graph of a PPC.Figure <strong>47</strong>.5Relationship Between LRAS and PPC:Increased Investment in EducationPRICE LEVELCAPITAL GOODSREAL GDPCONSUMPTIONGOODS(A) On each graph you drew, show the effect of an increased investment in education that makesthe work force more productive. Explain your reasoning.(B) Of the five factors that affect economic growth, which factor is increased by this investment ineducation?258 Advanced Placement Economics Macroeconomics: Student Activities © National Council on Economic Education, New York, N.Y.
5UNITMacroeconomicsLESSON 4 ■ ACTIVITY <strong>47</strong> (continued)6. Explain how fewer government regulations will affect economic growth. Cite an example to supportyour explanation. Show the effect of fewer government regulations on the graphs in Figure <strong>47</strong>.6.Figure <strong>47</strong>.6Relationship Between LRAS and PPC:Fewer Government RegulationsPRICE LEVELCAPITAL GOODSREAL GDPCONSUMPTIONGOODS7. Briefly explain how the following policies will affect economic growth and why.(A) Higher taxes on businessesAdvanced Placement Economics Macroeconomics: Student Activities © National Council on Economic Education, New York, N.Y. 259
5UNITMacroeconomicsLESSON 4 ■ ACTIVITY <strong>47</strong> (continued)(B) Improvements in technology(C) Less savings by people who want to enjoy the good life(D) Higher productivity of labor because of improved management styles(E) Lower interest rates260 Advanced Placement Economics Macroeconomics: Student Activities © National Council on Economic Education, New York, N.Y.