Sub-Regional Profiles - Sydney Local Health District - NSW ...
Sub-Regional Profiles - Sydney Local Health District - NSW ...
Sub-Regional Profiles - Sydney Local Health District - NSW ...

You also want an ePaper? Increase the reach of your titles
YUMPU automatically turns print PDFs into web optimized ePapers that Google loves.
Strathfield <strong>Local</strong> Government Area <strong>Health</strong> ProfileHowever, the availability of primary care services within Strathfield may present some challengesin the future. The per-capita rate availability of GPs and Practice Nurses is the lowest in thecatchment, and the availability of public allied health and community services appears to belimited based on the data made available for the project.IndicatorTable 1: Characteristics of the Strathfield LGA at a glanceValueLGARank withinInner West<strong>Sydney</strong>Inner West<strong>Sydney</strong>Population^ 35,187* 8 th 548,627* 6,917,656Population growth forecast (2011 to 2025) # 30.6% 2 nd 22.1% 20.3%% Indigenous persons # 0.3% 9 th 0.9% 2.5%Median annual household income^ $73,892 6 th $78,930 α $64,324Unemployment # 5.5% 4 th 5.5% 5.7%% English as primary language^ 32.1% 8 th 54.9% 72.5%Private <strong>Health</strong> Insurance coverage # 51.1% 5 th 50.9% 48.2%Broadband internet penetration # 76.7% 4 th 73.4% 69.9%Disability – has need for assistance withcore activities^4.0% 5 th 4.2% 4.9%Actual Births 2011^485 7 th 9,041 97,602<strong>NSW</strong>Source: ^Australian Bureau of Statistics; # Public <strong>Health</strong> Information Development Unit and Australian Bureau of StatisticsNote: α Derived by <strong>Health</strong>Consult based on income data published by the Australian Bureau of Statistics (2011)* This population number is based on first count data. The values based on estimated resident data (ERP) are 37,141 and 582,100 respectively.Inner West <strong>Sydney</strong> Medicare <strong>Local</strong> and <strong>Sydney</strong> <strong>Local</strong> <strong>Health</strong> <strong>District</strong> Page 2Strathfield <strong>Local</strong> Government AreaPopulation <strong>Health</strong> LGA/SLA Profile v1.1 March 2013
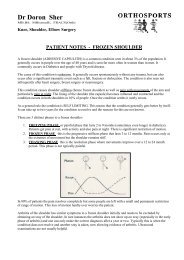
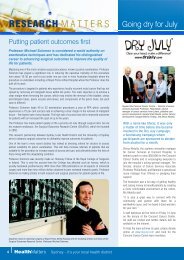
Strathfield <strong>Local</strong> Government Area <strong>Health</strong> Profile2Population and community characteristicsHeadlines Culturally diverse LGA. Only 35.1% of residents identify English as their first language; High number of refugee entrants, particularly from Sri Lanka, China and Sudan; and Average socio-economic status, compared to catchment and <strong>NSW</strong> averages.2.1 POPULATION CHARACTERISTICSThe age profile of the Strathfield LGA shows a high concentration of persons aged between 15and 29 years, relative to the catchment and <strong>NSW</strong> averages. The cause of this trend is twofold:there has been an increase in the number of young students, workers and couples moving intothe area, coupled by an increase in the number of older residents moving away. Therefore, overrecent years, Strathfield has been defying the national ageing trend.The proportion of residents aged 65 years or over (12.0%) is fairly similar to that across thebroader catchment (11.8%), but lower than <strong>NSW</strong> (14.7%) except in the proportion of residentsaged over 85 years.Figure 1: Population profile (by age) vs Inner West <strong>Sydney</strong> and state comparators, 2011Source: Public <strong>Health</strong> Information Development Unit and Australian Bureau of Statistics (2012)During the past decade, the overall rate of population growth within the Strathfield LGA hasincreased steadily however, this trend has slowed since 2009. Population estimates to 2025 areprovided in Figure 2, which shows that the growth in persons younger than age 70 years isexpected to be well in excess of that expected across the catchment and <strong>NSW</strong>. In particular,there is expected to be significant growth in persons aged between 0 and 24 years, 30 to 44 yearsand 60 to 69 years, with most growth anticipated along the Parramatta Road corridor. GrowthInner West <strong>Sydney</strong> Medicare <strong>Local</strong> and <strong>Sydney</strong> <strong>Local</strong> <strong>Health</strong> <strong>District</strong> Page 3Strathfield <strong>Local</strong> Government AreaPopulation <strong>Health</strong> LGA/SLA Profile v1.1 March 2013
Strathfield <strong>Local</strong> Government Area <strong>Health</strong> Profileforecasts for persons aged 75 years and above are expected to be well below the rate expected inboth the catchment and <strong>NSW</strong>.Figure 2: Forecast population growth (by age) vs Inner West <strong>Sydney</strong> and state comparators, 2011 to 2025Source: Public <strong>Health</strong> Information Development Unit and Australian Bureau of Statistics (2012)Table 2 and Figure 3 illustrate the projected changes in population numbers and number ofpeople in different age groups in the Strathfield LGA from 2006 – 2031. The projectedpopulation numbers are based on the estimated resident population numbers released by the<strong>NSW</strong> Planning Department in 2009 and differ from those in Figure 2. In 2007, the populationdensity in the Strathfield LGA was 2487.8 (population/area). 2Table 2: Projected population, Strathfield LGA and Inner West <strong>Sydney</strong> 2006, 2011, 2016, 2021 and 2031PopulationStrathfield LGAInner West <strong>Sydney</strong>projections 2006 2011 2016 2021 2031 2006 2011 2016 2021 2031Total population 33,23 36,322 39,136 42,022 47,721 531,624 578,162 612,914 642,009 696,2111Aged 0 – 4 years 1,601 2,099 2,264 2,402 2,607 31,043 37,279 38,469 39,425 41,571Aged 5 – 14 years 4,243 4,332 4,787 5,336 5,898 49,018 53,637 60,076 64,014 66,763Aged 15 – 24 years 5,767 6,009 6,240 6,373 7,290 73,914 75,761 77,464 79,603 87,569Aged 25 – 44 years 10,13 11,077 11,871 12,543 13,488 198,494 211,686 218,664 223,694 234,4868Aged 45 – 64 years 7,415 8,403 9,025 9,642 10,765 117,304 131,328 139,858 147,132 155,676Aged 65 – 84 years 3,444 3,673 4,121 4,830 6,400 54,463 59,580 67,995 76,761 94,544Aged 85 years+ 623 729 829 896 1,272 7,388 8,890 10,388 11,381 15,603Source: <strong>NSW</strong> <strong>Health</strong> Population Projection Series 1, 20092<strong>NSW</strong> Department of <strong>Local</strong> Government 2009, Comparative Information on <strong>NSW</strong> <strong>Local</strong> Government Councils 2007/08, accessed 4 August 2010.Available at: http://www.dlg.nsw.gov.au/dlg/dlghome/documents/Comparatives/Comparatives_2007_08.pdfInner West <strong>Sydney</strong> Medicare <strong>Local</strong> and <strong>Sydney</strong> <strong>Local</strong> <strong>Health</strong> <strong>District</strong> Page 4Strathfield <strong>Local</strong> Government AreaPopulation <strong>Health</strong> LGA/SLA Profile v1.1 March 2013
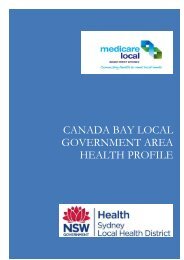
Strathfield <strong>Local</strong> Government Area <strong>Health</strong> ProfileFigure 3: Strathfield LGA projected population age groups 2006, 2011, 2016, 2021 and 2031Source: <strong>NSW</strong> <strong>Health</strong> Population Projection Series 1, 2009Concurrent with population growth are proposed increases in the number of local homes andjobs. The <strong>NSW</strong> Government’s Metropolitan Strategy, Inner West <strong>Sub</strong>region, Draft <strong>Sub</strong>regionalStrategy has set a target of an additional 8,300 local dwellings from 2004 to 2031 3 and a target of20,700 local jobs in 2031, an increase of 1,500 from 2001. 42.2 BIRTHS AND MATERNAL HEALTHTable 3 and Figure 4 show the number of births to Strathfield LGA residents in the period 2006 -2011. The annual number of births has increased steadily between 2006 and 2011, as has thefertility rate. Over this period the fertility rate in Strathfield was consistently lower than that for<strong>NSW</strong>.Table 3: Births to Strathfield LGA Residents and Fertility Rate 2006 - 2011Year Strathfield births Strathfield totalfertility rate<strong>NSW</strong> total fertility rate2006 341 1.30 1.792007 380 1.36 1.812008 398 1.40 1.852009 419 1.43 1.872010 471 1.47 1.902011 485 1.52 1.91Source: ABS 2011 Catalogue No. 330010DO004_20113Department of Planning, <strong>NSW</strong> Government, 2008. <strong>NSW</strong> Government’s Metropolitan Strategy, Inner West <strong>Sub</strong>region, Draft <strong>Sub</strong>regional Strategy. Accessed29 July 2010. Available at: http://www.metrostrategy.nsw.gov.au/LinkClick.aspx?fileticket=iKcbkl8OBSw%3d&tabid=664Department of Planning, <strong>NSW</strong> Government, 2008. <strong>NSW</strong> Government’s Metropolitan Strategy, Inner West <strong>Sub</strong>region, Draft <strong>Sub</strong>regional Strategy. Accessed29 July 2010. Available at:http://www.metrostrategy.nsw.gov.au/LinkClick.aspx?fileticket=do8nbzQyxU8%3d&tabid=66Inner West <strong>Sydney</strong> Medicare <strong>Local</strong> and <strong>Sydney</strong> <strong>Local</strong> <strong>Health</strong> <strong>District</strong> Page 5Strathfield <strong>Local</strong> Government AreaPopulation <strong>Health</strong> LGA/SLA Profile v1.1 March 2013
Strathfield <strong>Local</strong> Government Area <strong>Health</strong> ProfileFigure 4: Births to Strathfield LGA Residents 2006 - 2011Source: ABS 2011 Catalogue No. 330010DO004_2011The overall immunisation coverage rates for children aged 0 to 84 months calculated from theGeneral Practice Immunisation Incentives Scheme for the August 2012 quarter for the InnerWest <strong>Sydney</strong> catchment is 89.4%.Maternal health indicators are presented in Table 4 and have been extracted from <strong>NSW</strong> <strong>Health</strong>’s<strong>Health</strong> Statistics and Australian Bureau of Statistics web pages. The rate of smoking duringpregnancy in Strathfield is significantly lower than the state, as is the rate of attendance forantenatal care prior to 14 weeks gestation.Table 4: Maternal health indicators, Strathfield LGA and state comparatorsMaternal indicator Strathfield <strong>NSW</strong>Actual births 2011 5 485 99,054Total fertility rate 2011 6 7 1.52 1.91Smoking at all during pregnancy, 2008 to 2010 combined,number of mothers who smoked per year, smoothedstandardised prevalence ratio 8First antenatal visit before 14 weeks of gestation, 2008 to2010 combined, smoothed percent of pregnancies,smoothed standardised prevalence ratio23(45.4) -67%(83.6) -Source: ABS 2011 Catalogue No. 330010DO004_2011 and <strong>NSW</strong> <strong>Health</strong> Statistics# Estimated number per year; Below the state average at 1% level of significance11,235(100)79.3% #(100)2.3 CULTURAL CHARACTERISTICSA hallmark of the population in Strathfield is its cultural and linguistic diversity. 49.9% of allresidents were born overseas, primarily in China, South Korea, India and Sri Lanka. Together,these four groups account for 28.8% of Strathfield’s total population. 95 Australian Bureau of Statistics Births Australia 2011. Available athttp://www.abs.gov.au/AUSSTATS/abs@.nsf/DetailsPage/3301.02011?OpenDocument. Accessed 11 November 2011.6Total fertility rate represents the number of children a female would bear during her life if she experienced current age-specific fertility rates ateach age of her reproductive life. (ABS 2007)7Australian Bureau of Statistics Births Australia 2011. Available athttp://www.abs.gov.au/AUSSTATS/abs@.nsf/DetailsPage/3301.02011?OpenDocument. Accessed 11 November 2011.8http://www.healthstats.nsw.gov.au/Indicator/mum_smomum_lgamap accessed 11 November 20129Profile.id: Strathfield Community Council., accessed from http://profile.id.com.au/strathfield/homeInner West <strong>Sydney</strong> Medicare <strong>Local</strong> and <strong>Sydney</strong> <strong>Local</strong> <strong>Health</strong> <strong>District</strong> Page 6Strathfield <strong>Local</strong> Government AreaPopulation <strong>Health</strong> LGA/SLA Profile v1.1 March 2013
Strathfield <strong>Local</strong> Government Area <strong>Health</strong> Profile32.1% of residents speak English as a primary language, which is the second-lowest rate of anyLGA in the catchment (behind Canterbury). The cultural diversity of Strathfield is underlined bythe large number of cultural groups that comprise its population. Of note are people of Chinese(18.5%), Indian (16.8%), Korean (9.7%) and Middle-Eastern (6.3%) descent. 11.0% of residentsindicated that they speak English ‘not well’ or ‘not at all’.Figure 5: Primary language spoken at home vs Inner West <strong>Sydney</strong> and state-level comparators, 2011 to 2025Source: Australian Bureau of Statistics (2011)2.4 EDUCATION LEVELS74% of people aged over 15 years have completed Year 12 schooling (or equivalent). This levelof completion is much higher than the completion rate for <strong>NSW</strong> (47.6%).2.5 SOCIO-ECONOMIC CHARACTERISTICSThe Socio-Economic Indexes For Areas (SEIFA) are used to rank geographic areas acrossAustralia according to their socio-economic characteristics. The Index of Relative SocioeconomicDisadvantage (IRSD) contains indicators of disadvantage such as low income, highunemployment and low levels of education. Relative disadvantage is associated with a lownumber. The average across Australia is 1,000. A number below 1,000 indicates lowersocioeconomic status.The SEIFA score for the Strathfield LGA is 1,044, which ranks it at the 84 th percentile of Socio-Economic Advantage and Disadvantage 10 for <strong>NSW</strong>, and 5 th across all LGAs / SLAs within InnerWest <strong>Sydney</strong>. 11 Strathfield’s advantage / disadvantage percentile relative to other LGAs in thecatchment is illustrated in Figure 6.10Australian Bureau of Statistics (2011)11Public <strong>Health</strong> Information Development Unit and Australian Bureau of Statistics (2012)Inner West <strong>Sydney</strong> Medicare <strong>Local</strong> and <strong>Sydney</strong> <strong>Local</strong> <strong>Health</strong> <strong>District</strong> Page 7Strathfield <strong>Local</strong> Government AreaPopulation <strong>Health</strong> LGA/SLA Profile v1.1 March 2013
Strathfield <strong>Local</strong> Government Area <strong>Health</strong> ProfileFigure 6: Comparison of SEIFA Advantage and Disadvantage percentiles across Inner West <strong>Sydney</strong>, 2011Source: Australian Bureau of Statistics (2011)Average annual household incomes within the Strathfield LGA are approximately equivalent tothe average across the catchment 12 . Unemployment in Strathfield is also equivalent to the rateacross the catchment at 6.4% 13 , as is the proportion of residents with private health insurancecoverage (51.1% in Strathfield versus 50.9% across the catchment and 48.2% across <strong>NSW</strong>).2.6 ABORIGINAL AND TORRES STRAIT ISLANDER COMMUNITYStrathfield was originally home to the Wangal people. Indigenous Australians comprise a total of0.3% of the total population of the Strathfield LGA, which is the smallest proportion of anyLGA across the catchment area. At the 2011 Census, a total of 103 persons identified themselvesas Indigenous Australians. Slightly over half of these (52) were aged 24 or below 14 . It is widelyrecognised that the Aboriginal population has poorer overall health status, however indicators atan LGA level were not available. It is widely recognised that the Aboriginal population haspoorer overall health status, however indicators at an LGA level were not available.2.7 HUMANTARIAN ARRIVALSTable 5 provides local and state data relating to humanitarian settlers during the period 1 July2005 - 30 June 2011. Humanitarian arrivals settling in Strathfield came from 24 differentcountries, with over half being from Sri Lanka.12Australian Bureau of Statistics (2011)13ibid. (2011)14Public <strong>Health</strong> Information Development Unit and Australian Bureau of Statistics (2012)Inner West <strong>Sydney</strong> Medicare <strong>Local</strong> and <strong>Sydney</strong> <strong>Local</strong> <strong>Health</strong> <strong>District</strong> Page 8Strathfield <strong>Local</strong> Government AreaPopulation <strong>Health</strong> LGA/SLA Profile v1.1 March 2013
Strathfield <strong>Local</strong> Government Area <strong>Health</strong> ProfileTable 5: Humanitarian migration stream, settlers arriving 2005 – 2011, Strathfield LGA and <strong>NSW</strong>Population characteristics Strathfield LGA <strong>NSW</strong>Humanitarian Stream, number of settlers arriving from 247 25,4602005 to 2011Top 3 countries of birth for humanitarian migrationstream, number of settlers arriving 2005 – 2011Iraq ^ 8,270Afghanistan ^ 1,554Iran ^ 1,385Peoples Republic of China 39+ #Sri Lanka 135+ #Burma 6+ #Source: Department of Immigration and Citizenship Settlement Database 15# Not one of the top 3 countries of birth; ^ Actual number suppressed due to low numbers in reported age cohorts+ actual number is greater but some data has been suppressed due to small numbers in reported age cohorts2.8 HOMELESSNESSAs illustrated in Figure 7, the per-capita rate of homelessness in Strathfield (3.0 persons per1,000) is lower than the rate across the catchment area (6.9 persons per 1,000) and lower than<strong>NSW</strong> (3.4 persons per 1,000).However, other statistics point to deficiencies in the standard of housing available within theLGA. The number of persons living in overcrowded housing in Strathfield (4.6 persons per1,000) is notably higher than the catchment (4.0 persons per 1,000). Additionally, there are arelatively high number of persons staying in temporary accommodation (0.9 per 1,000 persons).Figure 7: Housing and homelessness indicators vs Inner West <strong>Sydney</strong> and state comparators, 2006Source: Australian Bureau of Statistics (2006)Population Characteristics of the Strathfield LGA are provided in Table 6. They includeindicators reflecting people and culture, disability, the labour force, education and familycomposition from the Australian Bureau of Statistics (ABS) 2011 Census of Population andHousing.15Department of Immigration and Citizenship Settlement Database. Accessed 21 February 2012. Available at: http://www.immi.gov.au/living-inaustralia/delivering-assistance/settlement-reporting-facility/Inner West <strong>Sydney</strong> Medicare <strong>Local</strong> and <strong>Sydney</strong> <strong>Local</strong> <strong>Health</strong> <strong>District</strong> Page 9Strathfield <strong>Local</strong> Government AreaPopulation <strong>Health</strong> LGA/SLA Profile v1.1 March 2013
Strathfield <strong>Local</strong> Government Area <strong>Health</strong> ProfileTable 6: Population characteristics of the Strathfield LGA and <strong>NSW</strong>Population Characteristics Strathfield LGA <strong>NSW</strong>People and CultureTotal persons 35,188 6,917,658Indigenous persons (comprises Aboriginal and Torres Strait 103 (0.3%) 172,621 (2.5%)Islander)Persons born overseas 18,531 (52.7%) 1,778,548(25.7%)Country of birth – three most common responses other thanAustraliaUnited Kingdom * 274,823 (4.0%)China 3,266 (9.3%) 156,034 (2.3%)New Zealand * 114,233 (1.7%)India 2,814 (8.0%) *South Korea 2,641 (7.5%) *Language spoken at home – English only spoken at home 11,309(32.1%)5,013,343(72.5%)Three most common languages other than English spoken athomeArabic ** 184,252 (2.7%)Mandarin 2,822 (8.0%) 139,825 (2.0%)Cantonese 2,830 (8.0%) 136,374 (2.0%)Korean 3,133 (8.9%) **Disability 16Has need for assistance with core activities 1,412 (4.0%) 338,362 (4.9%)Carers 17Unpaid assistance provided to a person with a disability 2,976 (8.5%) 638,614 (9.2%)Education 18Highest Year of School Completed – Year 12 or equivalent 19,542(69.7%)Highest Year of School Completed – Year 10 or equivalent 2,736(9.8%)Labour force status2,631,287(49.2%)1,278,047(23.9%)Total labour force 17,622 3,334,857Employed full time 10,662 (60.5%) 2,007,925(60.2%)Unemployed 1,130 (6.4%) 196,526 (5.9%)IncomeMedian individual income ($/weekly) 558 561Median household income ($/weekly) 1,421 1,23716Source: ABS 2006 CDATA Online. This variable has been developed to measure the number of people with a profound or severe disability.(ABS, 2006, 2901.0 – Census Dictionary, 2006, (Reissue)http://www.abs.gov.au/ausstats/abs@.nsf/Lookup/2901.0Chapter9908902006+(Reissue)?OpenDocument17Source: ABS 2006 CDATA Online. This variable recorded people who in the two weeks prior to Census Night spent time providing unpaidcare, assistance or help to family members or others because of a long term illness, disability or problems related to old age. It included peoplewho were in receipt of a Carer Payment or Carer Allowance. It did not include work performed via a voluntary group or organisation. (ABS, 2006,2901.0 – Census Dictionary, 2006, (Reissue)http://www.abs.gov.au/ausstats/abs@.nsf/Lookup/2901.0Chapter9943002006+(Reissue)?OpenDocument18Proportion calculated on the total persons 15 years and over who are no longer attending primary or secondary schoolInner West <strong>Sydney</strong> Medicare <strong>Local</strong> and <strong>Sydney</strong> <strong>Local</strong> <strong>Health</strong> <strong>District</strong> Page 10Strathfield <strong>Local</strong> Government AreaPopulation <strong>Health</strong> LGA/SLA Profile v1.1 March 2013
Strathfield <strong>Local</strong> Government Area <strong>Health</strong> ProfileFamily characteristicsCouple families with children 4,633 (51.6%) 831,850 (45.5%)Couple families without children 2,812 (31.3%) 669,019 (36.6%)One parent families 1,290 (14.4%) 297,904 (16.3%)Household composition – occupied private dwellingsFamily household 8,617(75.7%)1,777,398(71.9%)Lone person household 2,151 (18.9%) 599,148 (24.2%)Dwelling characteristicsTotal private dwellings 11,916 2,736,637Median rent ($/weekly) (occupied private) 400 300Median housing loan repayment ($/monthly) (occupied 2,195 1,993private)Occupied private dwellings - fully owned 3,257 (27.3%) 820,006 (30.0%)Occupied private dwellings - rented including rent-free 4,151 (34.8%) 743,050 (27.2%)Source: ABS 2011 Census of Population and Housing* Not one of the three most common responses** Not one of the three most common languages other than English spoken at homeInner West <strong>Sydney</strong> Medicare <strong>Local</strong> and <strong>Sydney</strong> <strong>Local</strong> <strong>Health</strong> <strong>District</strong> Page 11Strathfield <strong>Local</strong> Government AreaPopulation <strong>Health</strong> LGA/SLA Profile v1.1 March 2013
Strathfield <strong>Local</strong> Government Area <strong>Health</strong> Profile3<strong>Health</strong> risks of the populationHeadlines Among the lowest proportion of overweight (19.0%) and obese persons (10.5%) inthe catchment, although mortality from obesity-related conditions is marginally above the<strong>NSW</strong> average; and Second-highest level of persons with physical inactivity within the catchment (36.4%).3.1 HEALTH RISK FACTORSFigure 8 shows that the health risk profile of Strathfield residents is generally lower than both thecatchment and <strong>NSW</strong> in terms of smoking (14.6%), psychological distress (11.7%), obesity(10.5%) and overweight (19.0%) persons. The low prevalence of overweight and obesity issomewhat surprising considering that Strathfield has the second-highest proportion of physicallyinactiveresidents within the catchment (36.4%).In spite of its otherwise low overall risk profile, Strathfield also ranks second across thecatchment in terms of dangerous alcohol consumption (5.0%).Figure 8: <strong>Health</strong> risk factors vs Inner West <strong>Sydney</strong> and state comparators, 2007-08Source: Public <strong>Health</strong> Information Development Unit and Australian Bureau of Statistics 2007-08 National <strong>Health</strong> SurveyRefer to Appendix B 1.3 for definitions of <strong>Health</strong> Risk Factors described aboveTable 7 provides detail reflecting health behaviours of residents covered by the catchment and<strong>NSW</strong> and has been extracted from the <strong>NSW</strong> Population <strong>Health</strong> Survey 2011 Report on Adult<strong>Health</strong>. There is some variation in the elements assessed compared to the previous figure due todiverse methods in the <strong>NSW</strong> National <strong>Health</strong> Survey methods and this table is provided toillustrate trends in Inner West <strong>Sydney</strong> overall.Inner West <strong>Sydney</strong> Medicare <strong>Local</strong> and <strong>Sydney</strong> <strong>Local</strong> <strong>Health</strong> <strong>District</strong> Page 12Strathfield <strong>Local</strong> Government AreaPopulation <strong>Health</strong> LGA/SLA Profile v1.1 March 2013
Strathfield <strong>Local</strong> Government Area <strong>Health</strong> ProfileTable 9: Indicators reflecting health status of residents, Strathfield LGA and <strong>NSW</strong>Indicator Strathfield <strong>NSW</strong>Hospitalisations 2009-10 to 2010-11, smoothed number ofseparations per year, Smoothed Standardised Separation Ratio(sSSR) 19Potentially preventable hospitalisations 2009-10 to 2010-11,smoothed number of separations (sSSR)Diabetes hospitalisations 2009-10 to 2010-11, smoothed number ofseparations per year (sSSR)Coronary heart disease hospitalisations 2009-10 to 2010-11smoothed number of hospitalisations per year (sSSR)Chronic obstructive pulmonary disease hospitalisations, personsaged 65+, 2008-09 to 2009-10 smoothed number of hospitalisationsper year (sSSR)High body mass index attributable hospitalisations, smoothednumber of separations per year 2008-09 to 2009-10 (sSSR)Alcohol attributable hospitalisations, 2009 – 2010 to 2010 – 2011,smoothed number of hospitalisations per year, (sSSR)Smoking attributable hospitalisations, 2009 – 2010 to 2010 – 2011,smoothed number of hospitalisations per year, sSSRFall-related injury hospitalisations, persons aged 65 years andover, 2008-2009 to 2009-2010 combined, smoothed number ofhospitalisations per year, sSSRPotentially avoidable deaths, persons aged under 75 years, 2006 to2007 combined, smoothed number of deaths per year, SmoothedStandardised Mortality Ratio (sSMR) 20Deaths potentially avoidable by primary prevention, persons agedunder 75 years, 2006 to 2007 combined, smoothed number ofdeaths per year (sSMR)Potentially avoidable deaths from causes amenable to health care,persons aged under 75 years, 2006 to 2007 combined, smoothednumber of deaths per year (sSMR)High body mass attributable deaths 2006 to 2007, SmoothedNumber of Deaths per Year, sSMRAlcohol attributable deaths, 2006 to 2007, smoothed number ofdeaths per year (sSMR)Smoking attributable deaths, 2006 to 2007, smoothed number ofdeaths per year (sSMR)10,851(87.4) -638(73.6) -85(95.6)142(65.7) -37(56.5) -123(71.2) -157(64.6) -132(67.6) -134(94.9)41(91.7)24(87.6)17(96.8)(Ratio only)(100)(100)(100)(100)(100)(100)(100)(100)(100)(100)(100)(100)14(100)(104.1)5(100)(89.9)21(100)(91.2)Source: <strong>Health</strong> Statistics <strong>NSW</strong> and <strong>NSW</strong> <strong>Health</strong> Chief <strong>Health</strong> Officer’s Report 2010--below State average at 5% level of significance; - below State average at 1% level of significance++ above State average at 5% level of significance, + above State average at 1% level of significanceTable 10 provides details of the ten most common reasons for hospitalisation in 2010/11 forStrathfield residents:19The smoothed Standardised Separation Ratio (sSSR,) can be interpreted as a 'relative risk', and is compared to the <strong>NSW</strong> average which is set to100.20The smoothed Standardised Mortality Ratio (sSMR,) can be interpreted as a 'relative risk', and is compared to the <strong>NSW</strong> average which is set to100.Inner West <strong>Sydney</strong> Medicare <strong>Local</strong> and <strong>Sydney</strong> <strong>Local</strong> <strong>Health</strong> <strong>District</strong> Page 16Strathfield <strong>Local</strong> Government AreaPopulation <strong>Health</strong> LGA/SLA Profile v1.1 March 2013
Strathfield <strong>Local</strong> Government Area <strong>Health</strong> ProfileTable 10: Ten most common reasons for hospitalisation in 2010/11 in the Ashfield LGA and <strong>NSW</strong><strong>NSW</strong> 2010/11s Strathfield StrathfieldRank<strong>NSW</strong>SeparationsDigestive system 1413 (18.93%) 1 27803 (16.59%) 1Pregnancy, childbirth and the puerperium 770 (10.32%) 2 17482 (10.43%) 2Musculoskeletal system and connective 676 (9.06%) 3 16756 (10.00%) 3tissueCirculatory system 592 (7.93%) 4 13753 (8.21%) 4Respiratory system 477 (6.39%) 5 9627 (5.75%) 6Eye 454 (6.08%) 6 7632 (4.55%) 11Ear, nose, mouth and throat 423 (5.67%) 7 8905 (5.31%) 7Female reproductive system 399 (5.35%) 8 9897 (5.91%) 5Skin, subcutaneous tissue and breast 392 (5.25%) 9 8296 (4.95%) 9Nervous System 348 (4.66%) 10 8877(5.30%) 8Source: <strong>Sydney</strong> <strong>Local</strong> <strong>Health</strong> <strong>District</strong>, Flow Info V. 11.0<strong>NSW</strong>Rank4.2 CANCERFigure 10 shows that the incidence of cancer in the Strathfield LGA appears lower across mostcancer types as compared to the catchment and <strong>NSW</strong> rates per 1,000 persons. The rate ofprostate cancer is 46% lower than the <strong>NSW</strong> average. Stomach cancer is the only major type ofcancer where the incidence in Strathfield is above the catchment and <strong>NSW</strong> rate.Figure 10: Incidence of selected cancers per 1,000 persons vs Inner West <strong>Sydney</strong> and state comparators,2004 to 2008Source: Cancer Institute <strong>NSW</strong> (2010); Note: Incidences reported are crude rates (not age-standardised)Information on cancer screening rates is not available at an LGA level. For the Inner West<strong>Sydney</strong> catchment level, cancer screening information is available for both breast and cervicalcancer screening.The <strong>NSW</strong> Cancer Plan includes a target to increase breast cancer screening participation in theage group 50-69 years so that over 70% of women aged 50-69 years have 2 yearly mammogramsby 2010. In the period 2009-2010, the participation rate in the catchment was 47%, compared to52.7% for <strong>NSW</strong>. 2121 <strong>Health</strong> Statistics <strong>NSW</strong> http://www.healthstats.nsw.gov.au/Indicator/can_brstscr_lhn. Accessed 19 November 2012Inner West <strong>Sydney</strong> Medicare <strong>Local</strong> and <strong>Sydney</strong> <strong>Local</strong> <strong>Health</strong> <strong>District</strong> Page 17Strathfield <strong>Local</strong> Government AreaPopulation <strong>Health</strong> LGA/SLA Profile v1.1 March 2013
Strathfield <strong>Local</strong> Government Area <strong>Health</strong> ProfileCervical cancer screening rates in <strong>NSW</strong> for women aged 20 - 69 in 2009 and 2010 combinedwere 56.5% and in the catchment were 54.9%. 22The count and age standardised incidence rates (per 100,000) for cancers (2004-2008) in theStrathfield LGA and <strong>NSW</strong> are presented in Table 11. Over this period, 642 people from theStrathfield LGA were diagnosed with cancer, a rate of 389.7 per 100,000 (less than the state rateof 483.2 per 100,000). The most common cancers were breast, prostate and lung. Incidencerates for kidney, stomach, thyroid, pancreatic, brain and ovarian cancers as well as non-Hodgkinslymphoma were higher than for the state. Notably both melanoma and bladder cancer rates wereapproximately half that for the state.Table 11: Count and age standardised incidence rates (per 100,000) for cancers, 2004 – 2008, Strathfield LGA and<strong>NSW</strong>Cancer Site Strathfield LGA <strong>NSW</strong>CountStandardisedIncidenceRate/100,000CountStandardisedIncidenceRate/100,000All Cancers 642 389.7 177,519 483.2Bladder 8 4.9 3,631 9.7Brain 16 9.3 2,356 6.6Breast 84 51.8 21,102 58.2Cervix 5 3 1,228 3.5Colon 55 33.4 15,072 40.6Head and Neck 18 11.3 4,686 12.8Kidney 29 16.6 4,857 13.2Leukaemia 18 11.2 4,605 12.6Lip NA NA 1,203 3.3Liver 8 5.1 2,088 5.7Lung 60 37.2 15,905 43Melanoma 31 19.4 17,716 48.8Mesothelioma NA NA 1,047 2.8Non-Hodgkins Lymphoma 30 18.7 6,828 18.6Oesophagus NA NA 2,024 5.4Ovaries 12 7.7 2,191 6Pancreas 21 11.8 4,062 10.9Prostate 83 51.5 31,321 84.4Rectal 25 15.4 8,338 22.6Stomach 23 13.8 3,275 8.8Testicles NA NA 1,084 3.2Thyroid 23 14.1 3,301 9.4Uterus 12 7.2 3,043 8.3Cancer at Indef & Unspec Site 21 11.3 6,014 16Other Cancers 48 28.2 10,542 28.8Source: Incidence and Mortality data is from the <strong>NSW</strong> Central Cancer Registry. Population estimates are from HOIST, Epidemiology andSurveillance Branch, <strong>NSW</strong> <strong>Health</strong> Department. 2322 <strong>Health</strong> Statistics <strong>NSW</strong> http://www.healthstats.nsw.gov.au/Indicator/can_cervscr_lhn. Accessed 19 November 2012Inner West <strong>Sydney</strong> Medicare <strong>Local</strong> and <strong>Sydney</strong> <strong>Local</strong> <strong>Health</strong> <strong>District</strong> Page 18Strathfield <strong>Local</strong> Government AreaPopulation <strong>Health</strong> LGA/SLA Profile v1.1 March 2013
Strathfield <strong>Local</strong> Government Area <strong>Health</strong> ProfileThe count and age standardised mortality rates (per 100,000) for cancers (2004 – 2008) in theStrathfield LGA and <strong>NSW</strong> are presented in Table 12. Over this period 251 residents ofStrathfield LGA died from cancer, representing a lower rate than that for <strong>NSW</strong>. The 3 maincancers causing death were (in descending order) lung, breast and colon. Mortality rates forbreast, pancreatic stomach, ovarian, brain cancers were higher in Strathfield than for <strong>NSW</strong>.Table 12: Count and age standardised mortality rates (per 100,000) for cancers, 2004 – 2008,Strathfield LGA and <strong>NSW</strong>Cancer Site Strathfield <strong>NSW</strong>CountMortalityRate/100,000CountMortalityRate/100,000All Cancers 251 147.4 66,228 176.9Bladder NA NA 1,644 4.3Brain 10 6.3 1,716 4.7Breast 24 14.4 4,693 12.6Cervix NA NA 415 1.1Colon 19 10.7 5,511 14.6Head and Neck 5 2.8 1,762 4.7Kidney 8 4.2 1,605 4.3Leukaemia 6 3.6 2,248 6Lip NA NA NA NALiver 5 3.1 1,527 4.1Lung 45 27.8 12,781 34.4Melanoma of skin 9 5.5 2,314 6.2Mesothelioma NA NA 947 2.5Non-Hodgkins Lymphoma 10 6.1 2,569 6.8Oesophagus NA NA 1,590 4.2Ovaries 6 3.9 1,394 3.7Pancreas 17 9.7 3,611 9.6Prostate 13 7.3 4,904 12.8Rectal 8 4.7 3,018 8.1Stomach 15 8.8 2,232 6Testicles NA NA NA NAThyroid NA NA 168 0.4Uterus NA NA 614 1.6Cancer at Indef & Unspec 16 8.5 4,473 11.8SiteOther Cancers 20 11.6 4,411 11.8Source: Incidence and Mortality data is from the <strong>NSW</strong> Central Cancer Registry. Population estimates are from HOIST, Epidemiology andSurveillance Branch, <strong>NSW</strong> <strong>Health</strong> Department. 24NA denotes no figure available as total count was under 5 2523Cancer Institute <strong>NSW</strong>, Central Cancer Registry Statistical Reporting Module website. Accessed 10 November 2012. Available at:http://www.cancerinstitute.org.au/data-and-statistics/cancer-statistics/online-statistics-module24Cancer Institute <strong>NSW</strong>, Central Cancer Registry Statistical Reporting Module website. Accessed 10 November 2012. Available at:http://www.cancerinstitute.org.au/data-and-statistics/cancer-statistics/online-statistics-module25 Additional information relating to Cancer can be obtained from the Cancer Institute <strong>NSW</strong>, Central Cancer Registry Statistical ReportingModule web page. Available at: http://www.statistics.cancerinstitute.org.au/.Inner West <strong>Sydney</strong> Medicare <strong>Local</strong> and <strong>Sydney</strong> <strong>Local</strong> <strong>Health</strong> <strong>District</strong> Page 19Strathfield <strong>Local</strong> Government AreaPopulation <strong>Health</strong> LGA/SLA Profile v1.1 March 2013
Strathfield <strong>Local</strong> Government Area <strong>Health</strong> Profile4.3 MORTALITYThe median age of death for and deaths from all causes for residents of the Strathfield LGA and<strong>NSW</strong> is provided in Table 13.Table 13: Life expectancy and deaths from all causes for residents of the Strathfield LGA and <strong>NSW</strong>Indicator Strathfield <strong>NSW</strong>Deaths from all causes 2011, Indirectly Standardised 5.1 5.7Death Rate ^Deaths from suicide and self-inflicted injuries 2003- 5.1 9.32007, average annual ASR 26 per 100,000 population #Males Females Males FemalesMedian Age of Death 2003 - 2007 27 79 84 77 83Source: ^SSWLHD & SLHD Centre for Research, Evidence Management and Surveillance; # Public <strong>Health</strong> Information Development Unit(2012)Consistent with its low overall risk profile, Strathfield residents experience significantly lowerrates of preventable mortality than the total catchment area, as well as lower mortality comparedto <strong>NSW</strong>, as shown in Figure 11. The difference in preventable mortality between the Strathfieldand <strong>NSW</strong> averages represents a saving of 6.7 lives per year.Figure 11: Preventable mortality* per 1,000 persons vs Inner West <strong>Sydney</strong> and state comparatorsSource: Public <strong>Health</strong> Information and Development Unit and Australian Bureau of Statistics (2012)Note: * Data relates to persons aged from 0 to 74 years where mortality is caused by a number of conditions specified by the Public <strong>Health</strong>Information Development Unit. Mortality rates reported are crude rates (not age-standardised).Figure 12 shows that premature deaths from cancer, circulatory system disease, respiratorysystem disease and external causes in Strathfield were all well below per-capita benchmark levelsacross the catchment and <strong>NSW</strong>.26ASR denotes indirectly age-standardised rate per 100,000 population27Public <strong>Health</strong> Information Development Unit Social <strong>Health</strong> Atlas of Australia: Statistical <strong>Local</strong> Area and <strong>Local</strong> Government Area 2012 http://http://www.publichealth.gov.au/data/social-health-atlas-of-australia%3a-statistical-local-area-and-local-government-area_-published-2012.htmlaccessed 10/11/12Inner West <strong>Sydney</strong> Medicare <strong>Local</strong> and <strong>Sydney</strong> <strong>Local</strong> <strong>Health</strong> <strong>District</strong> Page 20Strathfield <strong>Local</strong> Government AreaPopulation <strong>Health</strong> LGA/SLA Profile v1.1 March 2013
Strathfield <strong>Local</strong> Government Area <strong>Health</strong> ProfileFigure 12: Premature mortality * from chronic disease (ages 0 to 74 years) and external causes per 1,000persons vs Inner West <strong>Sydney</strong> and state comparators, 2003 to 2007Source: Public <strong>Health</strong> Information and Development Unit and Australian Bureau of Statistics (2012)Note: * ‘Premature mortality’ is defined by PHIDU as mortality occurring prior to 75 years of age;‘Circulatory system conditions’ include ICD-10-AM codes I00 to I99; ‘Respiratory system diseases’ include ICD-10-AM codes J00 to J99;‘External causes’ include deaths arising from transport accidents, accidental falls, accidental poisoning, assault and suicide;Death rates reported are crude rates (not age-standardised).4.4 INFECTIOUS DISEASESIn New South Wales, Inner West <strong>Sydney</strong> has the highest rate of Hepatitis B virus reflecting ahigh population from East Asian countries. Inner West <strong>Sydney</strong> has the second highest rate ofHIV (reflecting a high population of gay and other homosexually active men) and the secondhighest rate of Hepatitis C virus (reflecting high rates of injecting drug use).Figure 13 shows that the prevalence of all types of sexually transmissible infections (STIs) inStrathfield is lower than across other LGAs in the catchment; however, the rates associated withall types of STIs are higher incidence than the <strong>NSW</strong> average. Although the chlamydia rate islower than the catchment average, Strathfield joins Burwood and Canterbury with one thehighest HBV rates. 28Figure 13: Prevalence of sexually transmissible infections per 1,000 persons vs Inner West <strong>Sydney</strong> and statelevelcomparators, 2010Source: <strong>Sydney</strong> <strong>Local</strong> <strong>Health</strong> <strong>District</strong> and <strong>NSW</strong> <strong>Health</strong> Centre for Epidemiology and Research (2010)Note: Rates reported are crude (not age standardised)28 Australian Society for HIV MedicineInner West <strong>Sydney</strong> Medicare <strong>Local</strong> and <strong>Sydney</strong> <strong>Local</strong> <strong>Health</strong> <strong>District</strong> Page 21Strathfield <strong>Local</strong> Government AreaPopulation <strong>Health</strong> LGA/SLA Profile v1.1 March 2013
Strathfield <strong>Local</strong> Government Area <strong>Health</strong> Profile4.5 DISABILITYFigure 14 shows that the proportion of persons that require assistance with core activities inStrathfield is similar to the overall catchment, but is higher than the <strong>NSW</strong> average for personsaged 70 years and above. The proportion of Strathfield residents aged 80 years or above thatneed assistance with core activities (42.4%) is almost six percentage points higher than theaverage across <strong>NSW</strong> (36.9%).Figure 14: Proportion of persons requiring assistance with core activities* vs Inner West <strong>Sydney</strong> and statecomparators, 2011Source: Australian Bureau of Statistics (2011)Note: * ‘Core activities’ are defined by the ABS as needing help in one or more of three activity areas of self-care, mobility and communication’Inner West <strong>Sydney</strong> Medicare <strong>Local</strong> and <strong>Sydney</strong> <strong>Local</strong> <strong>Health</strong> <strong>District</strong> Page 22Strathfield <strong>Local</strong> Government AreaPopulation <strong>Health</strong> LGA/SLA Profile v1.1 March 2013
Strathfield <strong>Local</strong> Government Area <strong>Health</strong> Profile5<strong>Health</strong> service utilisationHeadlines Primary care services for Strathfield residents in 2009/10 were in line with the levels ofthe same services across the entire catchment, but noticeably less than most servicetypes within <strong>NSW</strong>; The rate of practice nurse services in Strathfield (155 per 1,000 persons) is almost half ofthe rate demonstrated across <strong>NSW</strong> as a whole (296 per 1,000 persons); The per-capita utilisation of ED services in all triage classifications is significantlylower for Strathfield residents than the overall catchment area; The rate of preventable hospitalisation for ambulatory care-sensitive conditions inStrathfield (19.6 per 1,000 persons) is marginally higher than the rate observed acrossthe catchment (18.9 cases per 1,000), although significantly below the rate across <strong>NSW</strong>(23.8 per 1,000 persons); and HACC clients located in Strathfield receive a much lower number of HACC servicesper-capita for most service types.5.1 PRIMARY CARE UTILISATIONMedicare data shown in Figure 15 illustrates that primary care services billed to the MedicareBenefits Schedule (MBS) for Strathfield residents in 2009/10 were in line with the levels of thesame services across the entire catchment. However, these same levels were noticeably less thanmost service types within <strong>NSW</strong>. The largest shortfall was in relation to practice nurse services, inwhich the rate within Strathfield (155 per 1,000 persons) was almost half of the ratedemonstrated across <strong>NSW</strong> as a whole (296 per 1,000 persons). This rate may be easily explainedby the very low availability of practice nurses in the Strathfield LGA, with only a single practicenurse listed as operating in the Strathfield LGA. 29Data provided by Inner West <strong>Sydney</strong> ML also shows that Strathfield has the lowest number ofGPs per-capita of any LGA (1.19 per 1,000 persons, compared to an average of 1.42 across theentire catchment), and the third-highest proportion of GPs aged over 55 (40.5%) 30 of any LGA.29Based upon data provided by the Inner-West <strong>Sydney</strong> Medicare <strong>Local</strong>30Data provided by Inner-West <strong>Sydney</strong> Medicare <strong>Local</strong>Inner West <strong>Sydney</strong> Medicare <strong>Local</strong> and <strong>Sydney</strong> <strong>Local</strong> <strong>Health</strong> <strong>District</strong> Page 23Strathfield <strong>Local</strong> Government AreaPopulation <strong>Health</strong> LGA/SLA Profile v1.1 March 2013
Strathfield <strong>Local</strong> Government Area <strong>Health</strong> ProfileFigure 15: Selected primary care services per 1,000 persons, vs Inner West <strong>Sydney</strong> and state comparators,2010Source: Public <strong>Health</strong> Information Development Unit and Department of <strong>Health</strong> and Ageing (2012)5.2 EMERGENCYTable 14 shows that residents of the Strathfield LGA made 4,927 emergency department (ED)visits to public hospitals within Inner West <strong>Sydney</strong> during 2011-2012; representing 3.6% of allED visits to these hospitals overall.Table 14 shows that of all Strathfield residents accessing emergency department services, 79.9%presented to Concord Hospital, 11.7% to Royal Prince Alfred Hospital and 8.4% to CanterburyHospital.ED presentations by Strathfield residents comprised 11.4% of the Concord Hospital’s total EDcaseload, but comprised only a fraction of the ED caseload of the other hospitals within InnerWest <strong>Sydney</strong>. Information is not available on the private ED usage of Strathfield residents.Table 14: Emergency department presentations by hospital, 2011-12Canterbury Concord Royal PrinceHospital Hospital Alfred HospitalTotalPresentations from Strathfield LGA 413 (8.4%) 3,935 (79.9%) 579 (11.7%) 4,927 (100%)ED presentations for all persons (within and outside Inner West <strong>Sydney</strong>)Total ED presentations for hospital(all persons)35,998 (26.0%) 34,629 (25.1%) 67,586 (48.9%) 138,213 (100%)Strathfield % of Total 1.1% 11.4% 0.9% 3.6%Source: Statewide Emergency Data provided by Inner-West <strong>Sydney</strong> Medicare <strong>Local</strong>Data relating to patient triage classification across the catchment per 1,000 persons is provided inTable 15. Table 15 signifies lower crude usage of public emergency care facilities, as the percapitautilisation of ED services in all triage classifications is significantly lower for Strathfieldresidents than the overall catchment area. The number of presentations per-capita for ‘nonurgent’reasons, are the lowest of any LGA in the catchment, and are less than half of the averagenumber of non-urgent ED cases per-capita across the entire catchment. ‘Inner West <strong>Sydney</strong> Medicare <strong>Local</strong> and <strong>Sydney</strong> <strong>Local</strong> <strong>Health</strong> <strong>District</strong> Page 24Strathfield <strong>Local</strong> Government AreaPopulation <strong>Health</strong> LGA/SLA Profile v1.1 March 2013
Strathfield <strong>Local</strong> Government Area <strong>Health</strong> ProfileLGATable 15: Emergency department presentations per capita, by triage category, 2011-12Triage classification - number of persons per 1,000 (not age standardised)Resuscitation Emergency Urgent Semi-urgent Non-urgentAshfield 1.36 13.15 58.57 64.01 13.66Burwood 1.94 17.52 90.55 119.81 14.16Canada Bay 1.17 14.26 62.45 87.51 11.43Canterbury 1.33 14.17 82.05 90.89 10.35Leichhardt 0.84 14.81 59.20 55.92 20.10Marrickville 1.70 20.77 82.51 80.17 28.20Strathfield 0.99 9.49 48.74 72.50 7.25<strong>Sydney</strong> South 0.69 8.76 35.15 33.17 12.88<strong>Sydney</strong> West 0.75 15.31 60.39 59.30 23.67Inner West<strong>Sydney</strong>1.24 14.73 68.56 77.22 15.63Source: Statewide Emergency Data provided by Inner-West <strong>Sydney</strong> Medicare <strong>Local</strong>5.3 AMBULATORY-CARE SENSITIVE ADMISSIONSFigure 16 shows potentially preventable hospitalisations resulting from Ambulatory-CareSensitive Conditions (ACSCs). ACSCs are those conditions for which hospitalisation may beavoidable with primary care, Public <strong>Health</strong> interventions and early intervention. ACSC’s includevaccine-preventable conditions, selected acute conditions and selected chronic conditions thatmay potentially be modifiable through behaviour or lifestyle change.Figure 16 shows that rates of hospitalisation for ambulatory care-sensitive conditions inStrathfield (19.6 per 1,000 persons) are marginally higher than the rate observed across thecatchment (18.9 cases per 1,000), but significantly below the rate across <strong>NSW</strong> (23.8 per 1,000persons).Figure 16: Preventable hospitalisations for ambulatory-care sensitive conditions per 1,000 persons * vs InnerWest <strong>Sydney</strong> and state comparators, 2009-10 to 2011-12Source: <strong>NSW</strong> <strong>Health</strong> Centre for Epidemiology and Evidence (2011); Note: Rates reported are indirectly standardised by age and gender.As a potential cause of ACSCs for children (e.g. whooping cough), Figure 17 shows thatStrathfield has lower immunisation rates for children aged less than 15 months, with only 81.9%of children immunised, compared to an average of 90.6% across the entire catchment.Inner West <strong>Sydney</strong> Medicare <strong>Local</strong> and <strong>Sydney</strong> <strong>Local</strong> <strong>Health</strong> <strong>District</strong> Page 25Strathfield <strong>Local</strong> Government AreaPopulation <strong>Health</strong> LGA/SLA Profile v1.1 March 2013
Strathfield <strong>Local</strong> Government Area <strong>Health</strong> ProfileFigure 17: Child immunisation rates * across Inner-West <strong>Sydney</strong> LGAs / SLAs, 2008Source: Public <strong>Health</strong> Information Development Unit and National Centre for Immunisation Research and Surveillance (2012)Note: * Child immunisation rates refer to children aged 15 months or less, who are immunised against diphtheria, tetanus, whooping cough,polio, HIB and Hepatitis B.5.4 HOME AND COMMUNITY CAREFigure 18 shows the profile of Home and Community Care (HACC) clients in Strathfield,compared to the inner-West <strong>Sydney</strong> catchment and <strong>NSW</strong>. There was a lower proportion ofclients that do not speak English (33.0%) as compared to the catchment. There is a relativelyhigher proportion of HACC clients with a carer (30.6%), and a correspondingly lower proportionof clients living alone (33.0%). This may be a reflection of the culturally diverse make up of theLGA.Figure 18: HACC client profile vs Inner West <strong>Sydney</strong> and state comparators, 2010-11Source: Public <strong>Health</strong> Information Development Unit and Department of <strong>Health</strong> and Ageing (2012)Figure 19 provides a graphical comparison of selected HACC services in Strathfield, compared tothe catchment and <strong>NSW</strong>. It shows that HACC clients living in Strathfield received a lowernumber of HACC services per-capita for most service types, especially in care coordination, casemanagement, centre-based day care and transport.Inner West <strong>Sydney</strong> Medicare <strong>Local</strong> and <strong>Sydney</strong> <strong>Local</strong> <strong>Health</strong> <strong>District</strong> Page 26Strathfield <strong>Local</strong> Government AreaPopulation <strong>Health</strong> LGA/SLA Profile v1.1 March 2013
Strathfield <strong>Local</strong> Government Area <strong>Health</strong> ProfileFigure 19: HACC service profile vs Inner West <strong>Sydney</strong> and state comparators, 2010-11Source: Public <strong>Health</strong> Information Development Unit and Department of <strong>Health</strong> and Ageing (2012);Note: Rates reported are indirectly standardised by age and gender.Inner West <strong>Sydney</strong> Medicare <strong>Local</strong> and <strong>Sydney</strong> <strong>Local</strong> <strong>Health</strong> <strong>District</strong> Page 27Strathfield <strong>Local</strong> Government AreaPopulation <strong>Health</strong> LGA/SLA Profile v1.1 March 2013
Strathfield <strong>Local</strong> Government Area <strong>Health</strong> Profile6<strong>Health</strong> service availabilityHeadlines Lowest number of GPs per capita within the catchment (1.19 per 1,000 persons); Lowest number of practice nurses within the catchment (0.03 per 1,000 persons); and Low availability of most allied health practitioners as compared to the catchmentoverall. Although the number of high-care residential aged care places in Strathfield (90.8 per1,000 persons aged 70+) is well above the per-capita availability across both thecatchment (63.5) and <strong>NSW</strong> (45.1), the number of low-care places in Strathfield (14.7per 1,000 persons aged 70+) are less than half of the number per-capita provided inboth the catgchment (34.8) and less than a third of the per-capita rate across <strong>NSW</strong>(42.6); and There are no community aged care places available within the Strathfield LGA.6.1 HOSPITALS AND DAY SURGERYAs Table 16 shows, there are two facilities located within the Strathfield LGA, notably bothoperated by the private sector. The first is Strathfield Private Hospital, a 96 bed acute surgical andrehabilitation facility, and the second is Alwyn Rehabilitation Hospital, a 26 bed facility. Thenearest public hospital and emergency department to Strathfield LGA is the principal referralConcord Repatriation and General Hospital, located within the Canada Bay LGA. The RoyalPrince Alfred Hospital provides tertiary and quaternary services.Table 16: Acute and day surgery facilities available in Strathfield<strong>Health</strong> Service Name Service Type LocationPrivate sector health servicesStrathfield Private Hospital Private hospitals StrathfieldAlwyn Rehabilitation Hospital Rehabilitation hospitals StrathfieldSource: <strong>NSW</strong> <strong>Health</strong> Establishment Registration Online (HERO) database6.2 GENERAL PRACTICESelected characteristics of General Practitioners currently practicing across the catchment areshown in Figure 17. The number of GPs per 1,000 persons in Strathfield is the lowest of anyLGA in the catchment (1.2 per 1,000 persons). The reported number of practice nurses percapita is of even greater concern at 0.03 per 1,000 persons.In spite of this remarkably low number of practice nurses, the number of practice nurse servicesis comparable to the per capita rate across the catchment, as shown in Figure 15. This may pointto deficiencies in available data that identify the number of practice nurses in Strathfield.Inner West <strong>Sydney</strong> Medicare <strong>Local</strong> and <strong>Sydney</strong> <strong>Local</strong> <strong>Health</strong> <strong>District</strong> Page 28Strathfield <strong>Local</strong> Government AreaPopulation <strong>Health</strong> LGA/SLA Profile v1.1 March 2013
Strathfield <strong>Local</strong> Government Area <strong>Health</strong> ProfileThe per-capita rate of GPs providing services under the Access to Allied Psychological Services(ATAPS) program (0.54 GPs per 1,000 persons) is also the lowest of any LGA within thecatchment, and GPs delivering services in an aged care setting is the second-lowest within thecatchment (0.26 GPs per 1,000 persons). This may point to an opportunity to diversify the rangeof services provided by GPs in the Strathfield LGA.Figure 20: GPs and services provided per 1,000 persons, comparison across the catchmentSource: Inner-West <strong>Sydney</strong> Medicare <strong>Local</strong> (2012); Note: Rates reported are crude (not age standardised).6.3 ALLIED HEALTHFigure 21 shows the availability of allied health practitioners in Strathfield on a per-capita basis, ascompared to Inner West <strong>Sydney</strong> overall. The availability of allied health services such as clinicalpsychology, occupational therapy, pharmacy, physiotherapy and social work in Strathfield is wellbehind the availability for these practitioner types across the catchment. Only dentists, dieticiansand podiatrists are more readily available within Strathfield compared to the overall catchment.Figure 21: Number of selected private allied health practitioners per 1,000 personsSource: Inner-West <strong>Sydney</strong> Medicare <strong>Local</strong> (2012).Note: Data is not available at the state level regarding per-capita availability of all service providers. As a result, comparisons to <strong>NSW</strong> have notbeen shown in this Figure; Rates reported are crude (not age standardised).Inner West <strong>Sydney</strong> Medicare <strong>Local</strong> and <strong>Sydney</strong> <strong>Local</strong> <strong>Health</strong> <strong>District</strong> Page 29Strathfield <strong>Local</strong> Government AreaPopulation <strong>Health</strong> LGA/SLA Profile v1.1 March 2013
Strathfield <strong>Local</strong> Government Area <strong>Health</strong> Profile6.4 COMMUNITY HEALTH SERVICESResidents in Strathfield have access to a full range of community health services provided locatedin major facilities in Croydon, Marrickville, Redfern and Canterbury. These services provideservices based on varied catchments, with most being available to all catchment LGAs.The Strathfield Early Childhood Centre, which is shown in Table 17, is the only communityhealth facility located in Strathfield LGA.Public sector health servicesTable 17: Community health facilities in Strathfield<strong>Health</strong> Service Name Service Type LocationStrathfield Early Childhood Centre Child <strong>Health</strong> Services StrathfieldSource: <strong>NSW</strong> <strong>Health</strong> Establishment Registration Online (HERO) database6.5 AGED CAREMuch of the health-related care delivered to older people, people requiring rehabilitation, andtheir carers is delivered directly by the Aged Care and Rehabilitation (AC&R) service, a core partof the <strong>Sydney</strong> <strong>Local</strong> <strong>Health</strong> <strong>District</strong>. Other religious, charitable and community organisationsthroughout the inner-west areas of <strong>Sydney</strong> also provide services. The availability of nursinghome facilities within the Strathfield LGA is shown in Table 18:Crescent Nursing HomePrivate Nursing HomeTable 18: Aged care facilities in StrathfieldHomebushSource: <strong>NSW</strong> <strong>Health</strong> Establishment Registration Online (HERO) databaseLocationData obtained from PHIDU and the department of <strong>Health</strong> and Ageing reinforces the lowavailability of aged care places in Strathfield, as shown in Figure 22. Although the number ofhigh-care residential aged care places in Strathfield (90.8 per 1,000 persons aged 70+ years) is wellabove the per-capita availability across both the catchment (63.5) and <strong>NSW</strong> (45.1), the number oflow-care places in Strathfield (14.7 per 1,000 persons aged 70+ years) are less than half of thenumber per-capita provided in both the catchment (34.8) and less than a third of the per-capitarate across <strong>NSW</strong> (42.6).The data available from PHIDU indicates that there are no community aged care places availablewithin the Strathfield LGA. Although forecast population growth in aged persons is expected tobe below the state average to 2025, growth in persons aged 65 years or more is expected to be44.0%. 31 The development of community aged care arrangements within Strathfield will beimportant in meeting this increased demand, and may help to alleviate existing pressures as aresult of the absence of low-care places.31 Public <strong>Health</strong> Information Development Unit and Australian Bureau of Statistics (2012)Inner West <strong>Sydney</strong> Medicare <strong>Local</strong> and <strong>Sydney</strong> <strong>Local</strong> <strong>Health</strong> <strong>District</strong> Page 30Strathfield <strong>Local</strong> Government AreaPopulation <strong>Health</strong> LGA/SLA Profile v1.1 March 2013
Strathfield <strong>Local</strong> Government Area <strong>Health</strong> ProfileFigure 22: Aged care places per 1,000 persons vs Inner West <strong>Sydney</strong>, state and national comparators, 2010Source: Public <strong>Health</strong> Information Development Unit and Department of <strong>Health</strong> and Ageing (2012)Inner West <strong>Sydney</strong> Medicare <strong>Local</strong> and <strong>Sydney</strong> <strong>Local</strong> <strong>Health</strong> <strong>District</strong> Page 31Strathfield <strong>Local</strong> Government AreaPopulation <strong>Health</strong> LGA/SLA Profile v1.1 March 2013
Strathfield <strong>Local</strong> Government Area <strong>Health</strong> ProfileAppendix A: Postcode to LGA / SLA correspondencesIn a number of cases, data was only available at the postcode level, rather than a LGA or SLAlevel. Where this occurred, the data at the postcode level has been mapped to the LGA or SLAaccording to the correspondences shown in Table A.1. The correspondences in Table A.1 arebased upon published data sourced from the Australian Bureau of Statistics regarding postcodeto SLA or LGA mappings detemined under the Australian Standard Geographical Classification.In a number of cases, a single postcode spans a number of LGAs or SLAs. Where this occurs,<strong>Health</strong>Consult has only considered those postcode where more than 10% are within an LGA orSLA boundary.Table A.1: Postcode to SLA / LGA correspondencesLGA / SLAAshfieldBurwoodCanterburyCanada Bay% WITHINPOSTCODE LGABOUNDARY2045 99.62LGA / SLA% WITHINPOSTCODE LGABOUNDARY2038 98.952130 99.97 2039 100.00Leichhardt2131 100.00 2040 99.992132 40.71 2041 100.002132 59.292042 60.982133 51.54 2044 99.742134 100.00 2048 99.952135 20.33 Marrickville2049 100.002136 52.34 2050 40.172133 40.35 2203 100.002191 78.20 2204 99.962192 100.002129 100.002193 95.86 2135 72.702194 100.00 Strathfield2136 47.662195 100.00 2140 100.002196 74.57 2191 21.802206 100.002008 33.622208 50.22 2015 100.002209 32.92 2016 100.002210 17.78 <strong>Sydney</strong> South 2017 100.002046 100.00 2018 37.022047 100.00 2042 39.022137 100.00 2043 100.002138 100.00<strong>Sydney</strong> West2006 100.002139 100.00 2007 92.592008 66.382009 100.002037 100.002050 59.83Inner West <strong>Sydney</strong> Medicare <strong>Local</strong> and <strong>Sydney</strong> <strong>Local</strong> <strong>Health</strong> <strong>District</strong> Page 32Strathfield <strong>Local</strong> Government AreaPopulation <strong>Health</strong> LGA/SLA Profile v1.1 March 2013
Strathfield <strong>Local</strong> Government Area <strong>Health</strong> ProfileAppendix B: Data limitations and assumptionsB.1.DATA SOURCESThe background paper to Medicare <strong>Local</strong>s <strong>Health</strong> Needs Assessment and Planning released bythe Commonwealth Department of <strong>Health</strong> and Ageing states that “Medicare <strong>Local</strong>s will berequired to have an excellent understanding of their catchment area…which will involveMedicare <strong>Local</strong>s carrying out comprehensive and robust health needs assessment exercises andplanning”. The Department has not prescribed an approach to health needs assessment andplanning at this stage, but has developed an interim approach that aims to ensure that Medicare<strong>Local</strong>s’ Needs Assessment Reports “reflect on the specific characteristics and health care needsof their populations in determining which priority activities to pursue”.Unfortunately the breadth of detail required to inform the LGA/SLA profiles is not availablewithin a single data source. Accordingly, data has been sourced on a range of relevant indicatorsusing the most appropriate, recently available source for each indicator. In some cases, theabsence of complete data consistency across all indicators may require consumers of theLGA/SLA profiles to interpret some findings with caution, and this document aims to identifythose areas where this is most likely to be the case.The Consultant has attempted to source and attribute external data collections where possiblethroughout the document, either directly below tables or in footnotes at the bottom of each page.These references should be used in conjunction with this document when interpreting theLGA/SLA profiles.B.1.1PHIDU Social <strong>Health</strong> Atlas of AustraliaWherever possible, data underpinning the development of the LGA/SLA profiles have beendrawn from a single data source. In many cases data has been sourced from the August andOctober 2012 releases of the Social <strong>Health</strong> Atlas of Australia, which is compiled by the Public<strong>Health</strong> Information Development Unit (PHIDU), which is under the auspices of the Universityof Adelaide.The data obtained from PHIDU is provided at the LGA/SLA, Medicare <strong>Local</strong>, state and nationallevels and includes a broad number of indicators that are relevant to population health needs.However, in a number of cases the data collections that underpin these indicators have beencompiled by different organisations that use different sampling techniques and assumptions.Furthermore, the range of indicators presented in PHIDU’s Social <strong>Health</strong> Atlas use data collectedover different years. The breadth of data sources, collection techniques and collectiontimeframes used in PHIDU’s Social <strong>Health</strong> Atlas should therefore be taken into considerationwhen interpreting the data, and readers should be cautious about drawing direct comparisonsbetween indicators that are based upon data that has been collected at different timeframes, bydifferent organisations, or using different assumptions.Some indicators presented within PHIDU’s Social <strong>Health</strong> Atlas of Australia are ‘syntheticpredictions’ that have been derived by PHIDU at the LGA or SLA level, based upon variousdifferent data collections. As a result, these predictions do not represent data collected inadministrative or other data sets, should be used with caution, and be treated as indicative of theprevalence of the health condition or risk factor in an area with these demographic andsocioeconomic characteristics. Synthetic predictions within the PHIDU dataset have been madeInner West <strong>Sydney</strong> Medicare <strong>Local</strong> and <strong>Sydney</strong> <strong>Local</strong> <strong>Health</strong> <strong>District</strong> Page 33Strathfield <strong>Local</strong> Government AreaPopulation <strong>Health</strong> LGA/SLA Profile v1.1 March 2013
Strathfield <strong>Local</strong> Government Area <strong>Health</strong> Profilefor indicators relating to the prevalence of chronic disease, private health insurance coverage andhealth risk factors.B.1.2 Other data sourcesAlthough PHIDU’s Social <strong>Health</strong> Atlas of Australia provides an excellent repository of datarelating to population health needs, it does not contain data on some other variables of interestthat <strong>Health</strong>Consult has deemed important to inform the LGA/SLA profiles.As a result, these data items have been sourced by the Consultant from a range of publicly andprivately-held data collections; predominantly the Australian Bureau of Statistics and <strong>Health</strong>Statistics New South Wales, but also a range of others.As stated above in relation to PHIDU data, the need to obtain data from a range of sourcesintroduces the possibility for misalignment of populations and assumptions when comparing dataacross time periods, or from different data sources. Nonetheless, it has been necessary as part ofthe development of the LGA/SLA profiles to draw conclusions between indicators that arebased upon different data collections. Although the LGA/SLA profiles have been constructed insuch a way that the most relevant, recently available data has been used for each indicator, it isimportant to recognise the limitations inherent in comparing data sourced from differentcollections, and over different timeframes.Considering the diversity of data sources used to construct the LGA/SLA profiles, data was notalways available for all indicators at the state, Medicare <strong>Local</strong> or LGA/SLA level. As a result,some indicators have been derived in order to provide comparisons between indicators at thesedifferent levels. Where benchmarks have been calculated by the Consultant they have beenidentified in footnotes to Tables and figures included in the LGA/SLA profiles. Consumersshould exercise caution when making comparisons between derived benchmarks and reportedresults.Inner West <strong>Sydney</strong> Medicare <strong>Local</strong> provided workforce data on private allied health provider forthis report. Note that this database is still being constructed and is subject to review.B.1.3 <strong>Health</strong> Risk Factors – definitionsThe data in Figure 8 are self-reported data, reported to interviewers in the 2007–08 National<strong>Health</strong> Survey.A current smoker is an adult (over 18 years of age) who reported at the time of interview thatthey smoked cigarettes, cigars or pipes at least once a week.Risky alcohol consumption was based on estimated alcohol consumption in the seven days priorto interview using two components – the number of days on which the respondent reportedconsuming alcohol in the previous week; and the quantity consumed in the most recent days onwhich they consumed alcohol. For people who drank on no more than three days in the lastweek, their daily consumption was simply the total consumed divided by seven. Harmful use ofalcohol is defined as average daily consumption of more than 75 ml (three standard drinks) formales and 50 ml (two standard drinks) for females.Physical inactivity is defined as those aged 15 years and over who did not exercise in the twoweeks prior to interview for the 2007–08 NHS, through sport, recreation or fitness (includingwalking).Inner West <strong>Sydney</strong> Medicare <strong>Local</strong> and <strong>Sydney</strong> <strong>Local</strong> <strong>Health</strong> <strong>District</strong> Page 34Strathfield <strong>Local</strong> Government AreaPopulation <strong>Health</strong> LGA/SLA Profile v1.1 March 2013
Strathfield <strong>Local</strong> Government Area <strong>Health</strong> ProfilePsychological Distress: This data is derived from the Kessler Psychological Distress Scale (K-10),which is a scale of non-specific psychological distress based on 10 questions asked ofrespondents about negative emotional states in the 4 weeks prior to interview. 'High' and ‘veryhigh’ distress are the two highest levels of distress categories (of a total of four categories).Overweight and Obesity: The BMI was calculated from self-reported height and weightinformation and grouped as follows to allow reporting against both World <strong>Health</strong> Organizationand National <strong>Health</strong> & Medical Research Council guidelines – normal range: 18.5 to less than20.0 and 20.0 to less than 25.0; overweight: 25.0 to less than 30.0; obese: 30.0 and greater.A list of ICD codes used as the basis for the calculation of ‘preventable mortality’ (Figure 12) isavailableat:http://www.publichealth.gov.au/pdf/atlases/avoid_mortality_aust_2006/avoid_mortality_appendix_full.pdfInner West <strong>Sydney</strong> Medicare <strong>Local</strong> and <strong>Sydney</strong> <strong>Local</strong> <strong>Health</strong> <strong>District</strong> Page 35Strathfield <strong>Local</strong> Government AreaPopulation <strong>Health</strong> LGA/SLA Profile v1.1 March 2013