VOLUME 2 HUMAN SETTLEMENT PLANNING AND ... - CSIR
VOLUME 2 HUMAN SETTLEMENT PLANNING AND ... - CSIR
VOLUME 2 HUMAN SETTLEMENT PLANNING AND ... - CSIR
- No tags were found...

You also want an ePaper? Increase the reach of your titles
YUMPU automatically turns print PDFs into web optimized ePapers that Google loves.
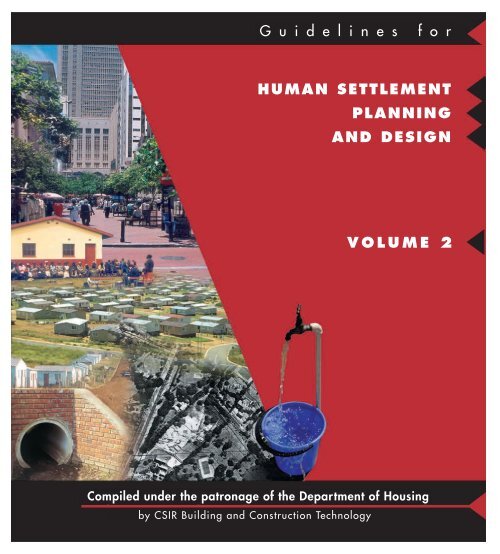
G u i d e l i n e s f o r<strong>HUMAN</strong> <strong>SETTLEMENT</strong><strong>PLANNING</strong><strong>AND</strong> DESIGN<strong>VOLUME</strong> 2Compiled under the patronage of the Department of Housingby <strong>CSIR</strong> Building and Construction Technology
Compiled under the patronage of the Department of Housingby <strong>CSIR</strong> Building and Construction Technology
GUIDELINES FOR <strong>HUMAN</strong> <strong>SETTLEMENT</strong> <strong>PLANNING</strong> <strong>AND</strong> DESIGNFOREWORDThe establishment of economically, physically, environmentally and socially integrated and sustainable builtenvironments is one of the most important factors which will contribute to harnessing the full developmentpotential of South Africa and addressing distortions of the past and the future needs of our growing population.This goal cannot be achieved without the active participation of especially local government, the private sector andcommunities in partnership with one another.This manual, Guidelines for Human Settlement Planning and Design, provides a guiding vision for South Africansettlement formation, addressing the qualities that should be sought after in our human settlements, andproviding guidance on how these can be achieved. The publication has been developed over a period of more thantwo years through a participative process in which stakeholders and experts from various disciplines were involved.This book is intended to be a living document and you, the reader, are one of its architects. I therefore encourageyou to use it, discuss it and debate the guidelines it contains. Still, this work is not the last word on the subject, andyour feedback and comments would be welcome. Your active involvement will be the key to the successfulattainment of sustainable, habitable living environments in South Africa.MS S MTHEMBI-MAHANYELEMINISTER OF HOUSINGForewordi
GUIDELINES FOR <strong>HUMAN</strong> <strong>SETTLEMENT</strong> <strong>PLANNING</strong> <strong>AND</strong> DESIGNPublished by <strong>CSIR</strong> Building and Construction TechnologyP O Box 395, Pretoria, 0001Copyright vests in the <strong>CSIR</strong>c 2000, <strong>CSIR</strong>, PretoriaBoutek Report No. BOU/E2001Reprint 2005Capture Press, PretoriaISBN 0-7988-5498-7ii
GUIDELINES FOR <strong>HUMAN</strong> <strong>SETTLEMENT</strong> <strong>PLANNING</strong> <strong>AND</strong> DESIGNACKNOWLEDGEMENTSThe following persons and organisations were involved in the preparation of this document:Project manager:Mr L M Austin<strong>CSIR</strong> BoutekProject coordinators:Ms H D BekkerDr S M BiermannMr J S StiffMs L VoslooMr K M Wolhuter<strong>CSIR</strong> Boutek<strong>CSIR</strong> Boutek<strong>CSIR</strong> Transportek<strong>CSIR</strong> Boutek<strong>CSIR</strong> TransportekAuthors:Mr A AdamMCA Urban and Environmental Planners ccMr L M Austin <strong>CSIR</strong> BoutekDr D I BanksEnergy & Development Research Centre, University of Cape TownMr R Behrens Urban Problems Research Unit, University of Cape TownMr W Blersch Ninham Shand (North) (Pty) Ltd, Consulting EngineersMs E Brink<strong>CSIR</strong> BoutekMs K BurgerBurger & Waluk Town PlannersMr J W M Cameron TRC Africa (Pty) LtdMr W D Cowan Energy & Development Research Centre, University of Cape TownProf D Dewar School of Architecture & Planning, University of Cape TownMr L DruceVBGD Town & Regional PlannersMs L C Duncker <strong>CSIR</strong> BoutekMr O J Gerber GIBB Africa (Pty) Ltd, Consulting EngineersMr D J Jones<strong>CSIR</strong> TransportekMr G Jordaan Holm & Jordaan Architects and Urban DesignersMs T Katzschner Urban Problems Research Unit, University of Cape TownMs K Landman <strong>CSIR</strong> BoutekMs A LebeloNinham Shand (North) (Pty) Ltd, Consulting EngineersMs A LootsHolm & Jordaan Architects and Urban DesignersMs N Mammon Mammon Rendall Planners and Designers ccMr G J Morris Feather EnergyDr P Paige-Green <strong>CSIR</strong> TransportekMr E R Painting Mothopo Technologies cc, Management & Engineering ConsultantsMr C SadlerBergman-Ingerop (Pty) Ltd, Consulting EngineersMr J S Stiff<strong>CSIR</strong> TransportekMr J S Strydom <strong>CSIR</strong> BoutekMr H L Theyse <strong>CSIR</strong> TransportekProf F Todeschini School of Architecture & Planning, University of Cape TownProf R Uytenbogaardt School of Architecture & Planning, University of Cape TownMr S van Huyssteen <strong>CSIR</strong> TransportekProf A T Visser Department of Civil Engineering, University of PretoriaDr K C WallNinham Shand (Pty) Ltd, Consulting EngineersProf V Watson Urban Problems Research Unit, University of Cape TownMr K M Wolhuter <strong>CSIR</strong> TransportekThe NRS Project, Eskom, provided material on electricity supply, based on documents approved by the ElectricitySuppliers Liaison Committee, on which Eskom, AMEU, the Chamber of Mines and the South African Bureau ofStandards are represented.Acknowledgementsiii
GUIDELINES FOR <strong>HUMAN</strong> <strong>SETTLEMENT</strong> <strong>PLANNING</strong> <strong>AND</strong> DESIGNRECORD OF REVISIONS <strong>AND</strong> AMENDMENTSRevisions:Amendments:Remove existing chapter(s) and substitute with the attached revised chapter(s).Remove existing page(s) and substitute the attached new page(s). A vertical line in the marginshows where a change has been made (there are no amendments to date).Date Chapter Title Rev Amdt PageNo. No. number(s)August 2003 9 Water supply 1 - AllAugust 2003 10 Sanitation 1 - AllRecord of revisions and amendments
GUIDELINES FOR <strong>HUMAN</strong> <strong>SETTLEMENT</strong> <strong>PLANNING</strong> <strong>AND</strong> DESIGN
IndexVolume 1Volume 2Chapter 1Chapter 2Chapter 3Chapter 4Chapter 5Chapter 6Chapter 7Chapter 8Chapter 9Chapter 10Chapter 11Chapter 12IntroductionA framework for settlement-makingSpatial and structural principles forsettlement-makingPlanning method and participationPlanning guidelines5.1 Movement networks5.2 Public transport5.3 Hard open spaces5.4 Soft open spaces5.5 Public facilities5.6 Land subdivision5.7 Public utilities5.8 Cross-cutting issues5.8.1 Environmental designfor safer communities5.8.2 Ecologically soundurban development5.8.3 Fire safetyStormwater managementRoads: Geometric design and layoutplanningRoads: Materials and constructionWater supplySanitationSolid waste managementEnergy12.1 Grid electricity12.2 Other forms of energy
Chapter 6Stormwater management6
GUIDELINES FOR <strong>HUMAN</strong> <strong>SETTLEMENT</strong> <strong>PLANNING</strong> <strong>AND</strong> DESIGNTABLE OF CONTENTSINTRODUCTION. . . . . . . . . . . . . . . . . . . . . . . . . . . . . . . . . . . . . . . . . . . . . . . . . . . . . . . . . . . . . . . . . . . . 1The impact of development on the natural environment . . . . . . . . . . . . . . . . . . . . . . . . . . . . . . . . . . . 1Drainage laws . . . . . . . . . . . . . . . . . . . . . . . . . . . . . . . . . . . . . . . . . . . . . . . . . . . . . . . . . . . . . . . . . . . . . 1The dual drainage system. . . . . . . . . . . . . . . . . . . . . . . . . . . . . . . . . . . . . . . . . . . . . . . . . . . . . . . . . . . . 2Development changes the environment . . . . . . . . . . . . . . . . . . . . . . . . . . . . . . . . . . . . . . . . . . . . . . . . 3The requirement for integrated planning . . . . . . . . . . . . . . . . . . . . . . . . . . . . . . . . . . . . . . . . . . . . . . . 3THE PURPOSE OF STORMWATER MANAGEMENT. . . . . . . . . . . . . . . . . . . . . . . . . . . . . . . . . . . . . . . . . . 3<strong>PLANNING</strong>. . . . . . . . . . . . . . . . . . . . . . . . . . . . . . . . . . . . . . . . . . . . . . . . . . . . . . . . . . . . . . . . . . . . . . . . 4Introduction . . . . . . . . . . . . . . . . . . . . . . . . . . . . . . . . . . . . . . . . . . . . . . . . . . . . . . . . . . . . . . . . . . . . . . 4Master planning . . . . . . . . . . . . . . . . . . . . . . . . . . . . . . . . . . . . . . . . . . . . . . . . . . . . . . . . . . . . . . . . . . . 4Detailed design. . . . . . . . . . . . . . . . . . . . . . . . . . . . . . . . . . . . . . . . . . . . . . . . . . . . . . . . . . . . . . . . . . . . 7MANAGING THE IMPACT OF DEVELOPMENT ON THE ENVIRONMENT . . . . . . . . . . . . . . . . . . . . . . . . . 8Rural development . . . . . . . . . . . . . . . . . . . . . . . . . . . . . . . . . . . . . . . . . . . . . . . . . . . . . . . . . . . . . . . . . 8Layout planning . . . . . . . . . . . . . . . . . . . . . . . . . . . . . . . . . . . . . . . . . . . . . . . . . . . . . . . . . . . . . . . . . . . 8Preserving the natural environment. . . . . . . . . . . . . . . . . . . . . . . . . . . . . . . . . . . . . . . . . . . . . . . . . . . . 8TECHNOLOGIES AVAILABLE TO THE ENGINEER . . . . . . . . . . . . . . . . . . . . . . . . . . . . . . . . . . . . . . . . . . 10The hydrologic cycle . . . . . . . . . . . . . . . . . . . . . . . . . . . . . . . . . . . . . . . . . . . . . . . . . . . . . . . . . . . . . . . 10Flood routing . . . . . . . . . . . . . . . . . . . . . . . . . . . . . . . . . . . . . . . . . . . . . . . . . . . . . . . . . . . . . . . . . . . . 10Flood-line determination . . . . . . . . . . . . . . . . . . . . . . . . . . . . . . . . . . . . . . . . . . . . . . . . . . . . . . . . . . . 10Detention and retention facilities . . . . . . . . . . . . . . . . . . . . . . . . . . . . . . . . . . . . . . . . . . . . . . . . . . . . 10Outlets at stormwater-detention facilities . . . . . . . . . . . . . . . . . . . . . . . . . . . . . . . . . . . . . . . . . . . . . . 11Bridge backwaters . . . . . . . . . . . . . . . . . . . . . . . . . . . . . . . . . . . . . . . . . . . . . . . . . . . . . . . . . . . . . . . . 12Erosion protection . . . . . . . . . . . . . . . . . . . . . . . . . . . . . . . . . . . . . . . . . . . . . . . . . . . . . . . . . . . . . . . . 12Transitions. . . . . . . . . . . . . . . . . . . . . . . . . . . . . . . . . . . . . . . . . . . . . . . . . . . . . . . . . . . . . . . . . . . . . . . 13Kerb inlets. . . . . . . . . . . . . . . . . . . . . . . . . . . . . . . . . . . . . . . . . . . . . . . . . . . . . . . . . . . . . . . . . . . . . . . 13Side weirs . . . . . . . . . . . . . . . . . . . . . . . . . . . . . . . . . . . . . . . . . . . . . . . . . . . . . . . . . . . . . . . . . . . . . . . 13Road drainage . . . . . . . . . . . . . . . . . . . . . . . . . . . . . . . . . . . . . . . . . . . . . . . . . . . . . . . . . . . . . . . . . . . 13Roof drainage . . . . . . . . . . . . . . . . . . . . . . . . . . . . . . . . . . . . . . . . . . . . . . . . . . . . . . . . . . . . . . . . . . . . 17Upgrading issues. . . . . . . . . . . . . . . . . . . . . . . . . . . . . . . . . . . . . . . . . . . . . . . . . . . . . . . . . . . . . . . . . . 18Stormwater management Chapter 6i
GUIDELINES FOR <strong>HUMAN</strong> <strong>SETTLEMENT</strong> <strong>PLANNING</strong> <strong>AND</strong> DESIGNLIST OF TABLESTable 6.1 Design flood frequencies for major systems . . . . . . . . . . . . . . . . . . . . . . . . . . . . . . . . . . . . . . . . . .7Table 6.2 Design flood frequencies for minor systems . . . . . . . . . . . . . . . . . . . . . . . . . . . . . . . . . . . . . . . . . .7Table 6.3 Suggested maximum encroachment of runoff on roads during minor storms . . . . . . . . . . . . . . .15Table 6.4 Problems commonly experienced with storage facilities . . . . . . . . . . . . . . . . . . . . . . . . . . . . . . . .26Table 6.5 Suggested minimum grades for pipes . . . . . . . . . . . . . . . . . . . . . . . . . . . . . . . . . . . . . . . . . . . . . . .27Table 6.6 Suggested spacing of anchor blocks . . . . . . . . . . . . . . . . . . . . . . . . . . . . . . . . . . . . . . . . . . . . . . .27LIST OF FIGURESFigure 6.1San Antonio’s famous main riverwalk loop. This tourist attraction can be isolated by itssophisticated flood attenuation and flood prevention facilities during major stormevents. The project will enable a 100-year flood to be accommodated through theSan Antonio River system . . . . . . . . . . . . . . . . . . . . . . . . . . . . . . . . . . . . . . . . . . . . . . . . . . . . . . . . .2Figure 6.2 Damage from major floods can be catastrophic . . . . . . . . . . . . . . . . . . . . . . . . . . . . . . . . . . . . . . . .2Figure 6.3 Contour planning: An effective stormwater management tool . . . . . . . . . . . . . . . . . . . . . . . . . . . .8Figure 6.4 Overgrazing exposes the land to rain damage and can result in extensive erosion . . . . . . . . . . . .9Figure 6.5 Runoff from feedlots contains high levels of pollutants . . . . . . . . . . . . . . . . . . . . . . . . . . . . . . . . .9Figure 6.6 Dump sites must be protected against extraneous runoff . . . . . . . . . . . . . . . . . . . . . . . . . . . . . . .10Figure 6.7 Multiple-outlet structure of a detention pond . . . . . . . . . . . . . . . . . . . . . . . . . . . . . . . . . . . . . . . .11Figure 6.8 Simple drop structures in a residential environment . . . . . . . . . . . . . . . . . . . . . . . . . . . . . . . . . . .12Figure 6.9 Energy dissipator . . . . . . . . . . . . . . . . . . . . . . . . . . . . . . . . . . . . . . . . . . . . . . . . . . . . . . . . . . . . . . .12Figure 6.10 Energy dissipator in a multiple land use setting . . . . . . . . . . . . . . . . . . . . . . . . . . . . . . . . . . . . . . .12Figure 6.11 A lined open roadside channel . . . . . . . . . . . . . . . . . . . . . . . . . . . . . . . . . . . . . . . . . . . . . . . . . . . .14Figure 6.12Figure 6.13Figure 6.14Incorrect vertical alignment has caused stormwater to bypass this kerb inlet. Kerbinlets in the intersecting road on the left have also not captured runoff from thatroad so that stormwater flows across this bus route, creating a hazard . . . . . . . . . . . . . . . . . . . .14This ponding is the result of encroachment of the grass verge onto the road.Grass-cutting maintenance operations should also include harvesting the grass, toprevent siltation and build-up of new grass growth . . . . . . . . . . . . . . . . . . . . . . . . . . . . . . . . . . .14Flow across this intersection has resulted in siltation, which is inconvenient andhazardous to road users . . . . . . . . . . . . . . . . . . . . . . . . . . . . . . . . . . . . . . . . . . . . . . . . . . . . . . . . .14Figure 6.15 Example of surface drainage in a residential setting . . . . . . . . . . . . . . . . . . . . . . . . . . . . . . . . . . .14Figure 6.16 Open channel alongside an arterial road . . . . . . . . . . . . . . . . . . . . . . . . . . . . . . . . . . . . . . . . . . . .15Figure 6.17 The contour-planning concept, to impede the drainage of runoff from the development . . . . .16Figure 6.18(a) and (b): Concentration of stormwater drainage in a roadway resulting in majorinconvenience to road users . . . . . . . . . . . . . . . . . . . . . . . . . . . . . . . . . . . . . . . . . . . . . . . . . . . . . .16Stormwater management Chapter 6iii
GUIDELINES FOR <strong>HUMAN</strong> <strong>SETTLEMENT</strong> <strong>PLANNING</strong> <strong>AND</strong> DESIGNFigure 6.19 Roadside drains of the major system . . . . . . . . . . . . . . . . . . . . . . . . . . . . . . . . . . . . . . . . . . . . . . .16Figure 6.20 (a) and (b): Layout planning in steep terrain . . . . . . . . . . . . . . . . . . . . . . . . . . . . . . . . . . . . . . . . .17Figure 6.21This office complex incorporated the entrance to the building in a detention facility.Under normal conditions, this area functions as a pleasant park with water features . . . . . . . . .18Figure 6.22 (a): Depressed area to store excess runoff . . . . . . . . . . . . . . . . . . . . . . . . . . . . . . . . . . . . . . . . . . .18Figure 6.22Figure 6.23(b): Runoff from this parking area is stored in the drainage ways usingmultiple-outlet drains . . . . . . . . . . . . . . . . . . . . . . . . . . . . . . . . . . . . . . . . . . . . . . . . . . . . . . . . . . .18Gully erosion by headwater upstream of a highway culvert inlet. Specific attentionneeds to be paid to structures founded in soils with high erosion potential . . . . . . . . . . . . . . . . .20Figure 6.24 An example of a grassed waterway . . . . . . . . . . . . . . . . . . . . . . . . . . . . . . . . . . . . . . . . . . . . . . . .20Figure 6.25 Part detention, part retention facility, including an artificial wetland . . . . . . . . . . . . . . . . . . . . .22Figure 6.26(a) and (b): Construction sites can be prevented from polluting the surrounding area bythe use of straw bales, mulching and geo-mats. Aggregates placed at exits from sitesprevent the transport of pollution . . . . . . . . . . . . . . . . . . . . . . . . . . . . . . . . . . . . . . . . . . . . . . . . .22Figure 6.27 Stone aggregate can be placed on the roadside while the shoulder grass establishes itself . . . . .22Figure 6.28 The straw-bale barrier has allowed pioneer plants to establish themselves . . . . . . . . . . . . . . . . .23Figure 6.29 Unmanaged domestic refuse is a serious health risk . . . . . . . . . . . . . . . . . . . . . . . . . . . . . . . . . . .24Figure 6.30Figure 6.31Figure 6.32Uncontrolled dumping at municipal waste sites can have a serious impact on surfaceand sub-surface water systems . . . . . . . . . . . . . . . . . . . . . . . . . . . . . . . . . . . . . . . . . . . . . . . . . . . .24This water point has been placed in a low-lying area. Drainage of runoff and waterspilled from the point has not been allowed for, and a health hazard has resulted . . . . . . . . . . .24These sports fields will act as a detention facility should the watercourse on the rightof the picture not be able to convey the flood. Note that the playing surfaces areraised to aid drainage after such an event. The crest of the side weir between thewatercourse and the sports fields is designed to accept the excess flow, but is madeaesthetically pleasing with a meandering cycle path . . . . . . . . . . . . . . . . . . . . . . . . . . . . . . . . . . .25Figure 6.33 Inlet grids need attention . . . . . . . . . . . . . . . . . . . . . . . . . . . . . . . . . . . . . . . . . . . . . . . . . . . . . . . .27Figure 6.34 Kerb inlets require maintenance . . . . . . . . . . . . . . . . . . . . . . . . . . . . . . . . . . . . . . . . . . . . . . . . . . .27Figure 6.35 The use of underground drainage systems in unpaved roadways should be justified . . . . . . . . . .28Figure 6.36 Stormwater drainage must occur off the roadway if kerbing is not installed . . . . . . . . . . . . . . . .28Figure 6.37 Flood-warning systems . . . . . . . . . . . . . . . . . . . . . . . . . . . . . . . . . . . . . . . . . . . . . . . . . . . . . . . . . .28Figure 6.38 This nature trail has a problem with pampas grass (Cortaderia jubata), an alien invader . . . . . . .29Figure 6.39Dolines are almost always the result of man’s intervention in natural drainage systems.This sinkhole has been caused by a road culvert . . . . . . . . . . . . . . . . . . . . . . . . . . . . . . . . . . . . . .29ivChapter 6Stormwater management
GUIDELINES FOR <strong>HUMAN</strong> <strong>SETTLEMENT</strong> <strong>PLANNING</strong> <strong>AND</strong> DESIGNINTRODUCTIONThe impact of development on the naturalenvironmentDevelopment is a process of growth and change,which implies improvement. Any development willtherefore affect or impact on its environment in someway or other. We consider the building of roads, theerection of buildings and the general improvement offactors that cause inconvenience - like the drainage ofstormwater - as development. However, thisdevelopment may significantly change the hydraulicproperties of an area. Typically, pervious layers arerendered less permeable or even impermeable.Depressions are raised to prevent ponding. Surfacesand conduits are constructed to drain runoff moreefficiently. Natural vegetation is often removed,allowing reduced interception and transpiration.Limited vegetation cover exposes the soil to the impactof rain, which may lead to increased erosion. Naturalmeandering watercourses may be canalised to moreeffectively route flows through the development.Stormwater management is the science of limitingthese negative impacts on the environment andenhancing the positive impacts, or catering for thehydraulic needs of a development while minimisingthe associated negative environmental impacts.Drainage lawsIncreasing development densities have influenced theservitude required to safely discharge runoff into thenatural environment. This densification andmodification of undeveloped land has also resulted inincreased quantities and concentrations of flow with aconcomitant increase in pollution.Upstream landowners’ responsibilities for dischargingrunoff onto downstream properties, and theconcomitant responsibilities of downstream ownershave a long history which is based largely on commonlaw. This has been modified somewhat by legislationgiving certain rights to central, regional and localauthorities.Three rules are generally applicable throughout theworld today as far as the drainage of surface runoff isconcerned. These concern:• the “common enemy” concept;• natural flow; and• reasonable use.Stormwater runoff is considered a common enemyand each property owner may fight it off or control itby retention, diversion, repulsion or alteredtransmission. The focus of the common enemy rulehas two focal points:the acknowledgement that some damage resultsfrom even minor improvements; and• The principle of granting each landowner as muchfreedom as possible to deal with his land essentiallyas he sees fit.The natural flow (or civil law) rule places a naturaleasement upon the lower land for the drainage ofsurface water along its natural course, and the naturalflow of the water may not be obstructed by the ownerof the lower property to the detriment of the interestsof the owner of the higher property.This rule has been modified to some extent in allowing,for example, surface runoff to be accelerated orotherwise altered into the natural stream. Thelandowner may, however, neither overtax the capacityof the watercourse nor divert into it runoff that wouldnot naturally have drained into the watercourse (seeBarklie v Bridle 1956 (2) SA 103 (S.R.)).In efforts to promote drainage, many of thesemodifications to the natural-flow rule increase theburden on the lower land.The reasonable-use rule provides that each propertyowner is permitted to make reasonable use of his land,even though by doing so he may alter the flow of thesurface waters and cause harm to others. He incursliability when his interference is unreasonably harmful(see Redelinghuis v Bazzoni 1975 AD 110(T)).One can see that, in developing property, it isextremely difficult not to concentrate, increase oraccelerate stormwater runoff onto downstreamproperties. Through the provincial ordinances, theauthorities have been invested with the right tochange the natural drainage of stormwater in theinterests of the public as a whole. However with thisright comes the responsibility to act with due care inkeeping the effects of such deviations withinacceptable limits. The general rule that “statutoryauthority when constructing a work is excused fromliability for damage thereby caused to third persons” issubject to the proviso that the work must not benegligently executed or maintained (see New HeriotGold Mining v Union Government (Minister ofRailways and Harbours) 1916 AD 415, 421;Johannesburg Municipality v Jolly 1915 TPD 432;Herbert Holbrow (Pty) Ltd v Cape Divisional Council1988 (1) SA 387(c)).To ameliorate this development phenomenon, certainstrategies and technologies are available. The goals ofstormwater management should support thephilosophy of lessening the impact of stormwater flowthrough and off developed areas. Stormwater shouldbe considered a resource (see Figure 6.1).• The need to make improvements to property, withStormwater management Chapter 61
GUIDELINES FOR <strong>HUMAN</strong> <strong>SETTLEMENT</strong> <strong>PLANNING</strong> <strong>AND</strong> DESIGNof the National Water Act, Act 36 of 1998. This sectiondeals with pollution prevention, and in particular thesituation where pollution of a water resource occurs ormight occur as a result of activities on land. The personwho owns, controls, occupies or uses the land inquestion is responsible for taking measures to preventpollution of water resources.The dual drainage systemDeveloped areas are defined as any man-induceddevelopments which have changed the environment.In this chapter, all developments in the continuumfrom rural to urban settings will be addressed.Figure 6.1: San Antonio’s famous main riverwalkloop. This tourist attraction can be isolated by itssophisticated flood attenuation and flood preventionfacilities during major storm events. The project willenable a 100-year flood to be accommodatedthrough the San Antonio River systemIt is within the power of the local authority toconstruct works such as streets and drains which willhave an effect on the flow (quantity, quality andvelocity) of stormwater discharged on the downstreamland.Traditionally, runoff from frequent (minor) storms hasbeen carried in the urban formal drainage systems.Typically this was achieved by draining runoff fromproperties into the streets and then via conduits to thenatural watercourses. The system was intended toaccommodate frequent storms and associated runoff.Today, the value of property is of such significance thatengineers need to consider not only frequent stormsbut the more severe storms, which can cause majordamage with sometimes catastrophic consequences(see Figure 6.2). The dual system incorporates a minorsystem for the frequent storm events and a majorsystem for the less frequent but severe storm events.The major system may include conduits and natural orartificial channels, but would commonly also make useof the road system to convey runoff overland tosuitable points of discharge. This is not very differentfrom what has happened de facto except that formalcognisance is now given to the routing of runoff fromall storms via the secondary use of roads and otherfacilities in the urban environment.The use of the road system and open spaces (such asPublic bodies have been entrusted with statutorypowers to enable them to carry out public duties. If itis impossible for them to carry out their duties withoutinfringing upon the rights of others, it may be inferredthat the legislators intended them to have the powerto do so, in spite of the prejudicial effect onindividuals. If, however, damage that could reasonablyhave been prevented is caused to individuals, thefailure to take reasonably practicable preventivemeasures is negligence.Case law offers opinions and provides principles onwhich to base the extent of liability of a local authorityfor damage caused by an increase in stormwater flow.In some cases the issue may be whether interferencewith private rights is justified where the exercise ofstatutory powers is alleged to have resulted in aninjury to another.Prohibition against pollution is addressed in Clause 19Figure 6.2: Damage from major floods can becatastrophic2Chapter 6Stormwater management
GUIDELINES FOR <strong>HUMAN</strong> <strong>SETTLEMENT</strong> <strong>PLANNING</strong> <strong>AND</strong> DESIGNparks and sports fields) as drainage components of themajor system, while imposing inconvenience to roadusers, is considered an acceptable land-use for thesesevere storm events.Development changes the environmentHigh regard needs to be given to natural drainagepatterns and systems. This is because developmentinterferes with these systems. Stormwatermanagement must therefore consider howdevelopment has interfered or will interfere with thenatural systems. The design engineer, with theplanning team, must then plan on how to cope withthese changes, to lessen the impact of the alteredrunoff caused by this development.It is recognised that development impacts negativelyon the natural drainage systems in several ways:• Permeability of the development area is decreasedthrough increased population densities and feweropen spaces such as parks and gardens, or by theintroduction of impervious areas such as surfacedstreets, houses and amenities associated with theurban environment. This increases the runoff fromthe area during storm events, because of thereduced infiltration properties of the developmentarea.• The introduction of efficient stormwater drainagesystems to deal with the common enemy impliesthat the runoff must be conveyed as efficiently aspossible to the natural watercourses. Theoperative word efficient is here related to costefficiency.This has the effect of decreasing thetime runoff takes to reach the naturalwatercourses. The result is a reduction of overlandflow, meandering watercourses and the like,through a system which drains runoff to thewatercourses as quickly as possible. The floodproblem is therefore transferred downstream.Quicker responses in larger catchments makethem more susceptible to the effects of highintensity,shorter duration storm events.• In more efficient drainage systems, peak flowsoccur more quickly. This effect has madedevelopments more susceptible to shorter, moreintense storm events which in the smallercatchments may lead to greater peak flows.• The drainage systems are exposed to flows frommore frequent, higher intensity storms because ofthe decreased times of concentration. It isrecognised that short-duration storms have higherrain intensities than the longer rainfall events. Thisincreases the pressure put by the frequent, highintensitystorms on the man-made drainagesystems, which in turn put more pressure on thenatural drainage systems.• The quality of the runoff deteriorates. One only hasto consider runoff from man-made environmentswhich conveys pollutants such as fertilisers,discarded rubbish, spillages and discharges fromvehicles, septic tank effluent as well as eroded soil.The requirement for integrated planningAgainst this background, the responsibility for soundplanning to lessen these negative impacts rests withthe whole design team, and not just with the drainageengineer. A holistic approach to planning needs to betaken, whereby land use is identified and a commoncommitment to its optimisation forms the backgroundto the planning premises.Where development projects are carried out withlimited funds, the question of “minimum allowablestandards” always comes to the fore. It is in thesecases, especially, that the development equationbecomes a question of balancing low capital cost atdevelopment stage against high maintenance costs forthe rest of the time.THE PURPOSE OF STORMWATERMANAGEMENTStormwater management is based on• the need to protect the health, welfare and safetyof the public, and to protect property from floodhazards by safely routing and dischargingstormwater from developments;• the quest to improve the quality of life of affectedcommunities;• the opportunity to conserve water and make itavailable to the public for beneficial uses;• the responsibility to preserve the naturalenvironment;• the need to strive for a sustainable environmentwhile pursuing economic development; and• the desire to provide the optimum methods ofcontrolling runoff in such a way that the mainbeneficiaries pay in accordance with their potentialbenefits.While these goals may be reflected in other disciplines- and indeed may even be in apparent conflict withone another - specific objectives supporting theseoverall goals need to be identified for each specificproject by the planning team.Stormwater management Chapter 63
GUIDELINES FOR <strong>HUMAN</strong> <strong>SETTLEMENT</strong> <strong>PLANNING</strong> <strong>AND</strong> DESIGN<strong>PLANNING</strong>IntroductionPlanning is a fundamental function of the projectteam. It determines what the team wants to attain andhow it should go about doing so. Some strategic issuesneed to be considered before any detailed designwork can be entertained. This is strategic planning or“master planning”.Master planningThe whole purpose of planning is to facilitate theaccomplishment of a project’s objectives. Whichobjectives or goals drive the process really depends onthe state of mind of those formulating them, butgenerally should spell out the why, where, what, whenand how of the endeavour. Land use planning shouldbe a consideration of what land resources are availableand what they are suitable for, both in the short termand longer term.Master planning should be concerned with thefollowing principles:Sustainable developmentA key concept of master planning should aim at anenduring or sustainable development.An initiative called Caring for the earth, a strategyfor sustainable living, launched in partnership withthe World Conservation Union, the United NationsEnvironment Programme and the World WideFund for Nature, stressed two fundamentalrequirements for sustainable agriculture, namely:• securing a widespread and deeply heldcommitment to an ethic for sustainable living;and• integrating conservation and development.The World Health Organisation’s Global Strategyfor Health and Environment was a direct result ofthe United Nation’s Agenda 21 which was drawnup during the Earth Summit in June 1992 at theUnited Nations Conference on Environment andDevelopment (UNCED) in Rio de Janeiro, Brazil.Agenda 21 was an action plan to guide nationaland international activities to ensure that thenatural resources of the world are managed in sucha manner that sustainable development isachieved. The term “sustainable development” canbe defined as development that meets the needs ofthe present without compromising the ability offuture generations to meet their own needs.The idea that should guide all planning is thatthere is an interrelationship between the threeconcepts of health, the environment anddevelopment. Any change taking place in the onehas a direct influence on the other two.An essential element of rational land-use planningis land evaluation, which should be a systematicway of looking at the options available and ofconsidering the environment in which theseoptions are likely to operate, so that the results ofdifferent courses of action can be predicted.Physical planning therefore cannot be divorcedfrom social and economic circumstances or fromadministrative and constitutional processes. Moreimportantly, the protection of the environmentagainst pollution decay is essential, to optimise thebenefits of sustainable development.Integration with other disciplines in theplanning teamDevelopment produces waste products. Whenpeople choose to live closer both to one anotherand to economic opportunities, there is inevitablyan increase in the generation of waste products.The increased volume of wastes needs to bemanaged to lessen the impact on the environment.Solid waste technologies, the siting of cemeteries,water purification works, sewage works andindustries are typical issues facing the planningteam in the initial stage. All concern thestormwater specialist.Layout planning and transport routes inevitablyaffect the natural drainage of stormwater. Theseconstraints must be explored. Natural habitatswill be affected and their importance must notbe ignored.Drainage of both sewage and stormwater is anatural constraint to development that may haveto take priority over other services and amenities.Policy impact assessmentAll planning must start with certain premises. Manyof these are dictated by outside influences andtheir impact on the planning at hand must berecognised and considered.Policy guidelines from external sources mayinfluence the objectives of any development. Apolicy impact assessment may be required toevaluate the importance of these policies and howthey can affect or impact on the planneddevelopment. External influences may includepolicies from• the World Health Organisation;• the United Nations (UNCED);4Chapter 6Stormwater management
GUIDELINES FOR <strong>HUMAN</strong> <strong>SETTLEMENT</strong> <strong>PLANNING</strong> <strong>AND</strong> DESIGN• the South African Constitution;• the Government’s Reconstruction andDevelopment Programme;• white papers involving water law, water supplyand sanitation - Department of Water Affairs &Forestry (DWAF); and• integrated environmental managementprocedures - Department of EnvironmentalAffairs & Tourism (DEAT).While these issues may not all be obligatory, theydo serve as a platform or frame of reference froma global and national perspective. They mayinfluence the planning premises.Strategic impact assessmentCertain constraints to planning and developmenthave to be considered. These are mainly connectedwith the legal environment. A strategic impactassessment must involve consideration of the aimsof the following legislation:• National Water Act Water Act (Act 36 of 1998):To provide for the fundamental reform of thelaw relating to water resources and to providefor matters connected therewith.The legal responsibilities of the stormwaterspecialist influence the planning. The insertionof 20-year and 50-year flood lines on certaintownship plans is an example. Whatdevelopment takes place within these floodlines must be explored. The protection ofsewage treatment works, cemeteries and solidwaste sites from flooding must be considered.• Conservation of Agricultural Resources Act (Act43 of 1983):To provide for the control over the utilisation ofthe natural agricultural resources in theRepublic in order to promote the conservationof the soil, the water resources and thevegetation and the combating of weeds andinvader plants.Government Notice No. R1048 of GovernmentGazette No. 9238 of this Act indicated that:No land user shall ... cultivate any land on hisfarm unit within the flood area of a watercourse or within 10 metres horizontally outsidethe flood area of a water course.The “flood area” in relation to a water course isdefined as the area which, in the opinion of theexecutive officer, is flooded by the flood waterof that water course during a 1-in-10 year flood.• Environment Conservation Act (Act 73 of 1989):To provide for effective protection andcontrolled utilisation of the environment.• National Roads Act (Act 54 of 1971):To provide for the construction and control ofnational roads, including the disposal ofstormwater on a national road.• Minerals Act (Act 50 of 1991) and itsRegulations:Specific issues relating to the EnvironmentalManagement Programme (EMP) are relevant.• Minimum requirements for disposal of waste:Minimum requirements issued by theDepartment of Water Affairs & Forestryregarding the selection of sites, theirdevelopment and management and eventualclosure. Three specific references are:- Minimum requirements for the disposal ofwaste by landfill.- Minimum requirements for the handlingand disposal of hazardous waste.- Minimum requirements for monitoring atwaste management facilities.• Health Act (Act 63 of 1977):To provide for measures for the promotion ofhealth of the inhabitants of the Republic.• Atmospheric Pollution Prevention Act (Act 45 of1965):To provide for the prevention of pollution ofthe atmosphere.Specific measures are required for thepurification of effluents discharged fromappliances for preventing or reducing to aminimum the escape of any noxious oroffensive gases escaping into the atmosphere,and for preventing the release of noxious oroffensive constituents from such effluents intodrains and drainage canals.• Common law, case law and statutory law:Certain laws of parliament, provincialordinances and government notices can alterexisting rules and lay down the law, as it were.These statutory laws create legal duties uponspecific persons or bodies and thus determinewho is to be sued in delict when damage iscaused (Committee of State Road Authorities1994). Any person or body performing tasks inpursuance of statutory authority bestowedupon him or her to construct works such asstreets and drains should heed the principles ofthe delict, to avoid legal liability for damagesuffered by another party.Stormwater management Chapter 65
GUIDELINES FOR <strong>HUMAN</strong> <strong>SETTLEMENT</strong> <strong>PLANNING</strong> <strong>AND</strong> DESIGNTable 6.1:L<strong>AND</strong> USEDesign flood frequencies for major systemsDESIGN FLOOD RECURRENCE INTERVALResidentialInstitutional (e.g. schools)General commercial and industrialHigh value central business districts50 years50 years50 years50 - 100 yearsTable 6.2:L<strong>AND</strong> USEDesign flood frequencies for minor systemsDESIGN FLOOD RECURRENCE INTERVALResidentialInstitutional (e.g. schools)General commercial and industrialHigh value central business districts1 - 5 years2 - 5 years5 years5 - 10 yearsof best management practices (BMPs), goodpractice, or best available technology not entailingexcessive cost (BATNEEC) may convince theplanning team that more stringent recurrenceintervals need to be considered, including planningfor regional maximum floods (RMFs) or probablemaximum floods (PMFs).Detailed designStormwater drainage planDetailed planning refers to the planning ofdevelopments within a catchment. The designphilosophies and critical concerns and issues willhave been addressed in the master drainage plan.Stormwater drainage planning is theimplementation of those policies and guidelines. Itshould strive to commit responsibilities to thedesign team and the authorities. Genericresponsibilities include• planning, feasibility studies and preliminarydesign;• records of decisions and the development of anauditing system;• detailed design;• implementation or construction;• the process of handing a scheme over to aresponsible authority;• operation and maintenance; and• monitoring and reporting (elements of theauditing system).Typically the controlling authority should beresponsible for ensuring that detailed planning iscompatible with the master drainage plan and thatthe objectives of stormwater management areattained. The design team needs to considerresponsibilities throughout the design life of theproject or development - the cradle-to-graveapproach.Responsibilities for runoff controlStormwater management within an urban area isthe responsibility of the local authority for thatarea, since the control of stormwater is considereda purely local matter.Certain central and provincial governmentlegislation, however, has encroached on the localauthority’s planning. Examples are• the requirement to insert the 1-in-100 yearflood lines on all township development plans(National Water Act 36 of 1998);• prevention of water pollution (consumers)regulated by the departments of Water Affairs& Forestry, Environmental Affairs & Tourism,and Health;• safety of dams (approved ProfessionalEngineer);• alteration of a public stream (Transvaal RoadOrdinance 22 of 1957; Agricultural Holdings(Transvaal) Registration Act No 22 of 1919;Orange Free State Roads Ordinance 4 of 1968);• auditing systems and records of decision (IEM);andStormwater management Chapter 67
GUIDELINES FOR <strong>HUMAN</strong> <strong>SETTLEMENT</strong> <strong>PLANNING</strong> <strong>AND</strong> DESIGN• Mines and Works Act.Detaining and retaining stormwaterRunoff can be stored in constructed dams.However, to be effective, such dams usuallydemand much space. Successful detention ofrunoff may therefore have to rely on severaltechnologies involving• detention ponds (detention facilities) or rooftopdetention;• a preference for overland flow as opposed tohydraulically efficient engineering conduits;• maintaining pervious surfaces and reducingimpervious structures; and• maintaining vegetation cover to increaseinterception and evapotranspiration.MANAGING THE IMPACT OFDEVELOPMENT ON THEENVIRONMENTRural developmentThe issues and concerns in rural environments maydiffer from those in the urban setting. Typical issuesmay include erosion, and soil salinisation. Transportroutes may have gravel surfaces, and technologiesused to drain runoff need to be carefully considered.Layout planningMany of the grid-type layouts inevitably concentratestormwater in certain roadways. This is usually the casewhen planners design systems applicable to moderntechnological standards when they know thatupgrading to these standards may take place only inthe very distant future, if at all.What is proposed is a move towards what agriculturalengineers and conservationists have always practised -contour planning (e.g. contour ploughing, which isploughing that follows the contours of land,perpendicular to its slope). This technology isparticularly applicable to the more rural type ofdevelopment (see the section on unsurfaced roadsbelow for more detail).An example of a tea estate demonstrates this type oflayout well (see Figure 6.3). All access paths (whichcould be substituted by access roads in an urbanenvironment) follow the contours. Other tracks arerouted at right angles to the contours so that noextraneous runoff crosses or drains onto them. Allstormwater can then be routed along the access pathsto the natural channels or waterways.Figure 6.3: Contour planning: An effectivestormwater management toolThe advantage of contour technology is that all flow isrouted overland in open channels. This minimises boththe flow volumes (drainage occurs regularly) andvelocities (open channel flow with flat gradients). Thisreduces erosion. Soakaways, permeable strata,vegetation interception, retention/detention facilitiesare some of the many tools at the drainage engineer’sdisposal. Overland flow in ditches or swales should bedesigned at the outset with the road layout planners,not afterwards. Where road crossings are required,causeways and drifts are easily constructed. This allowsfor the use of local labour and materials. Dropstructures may also be included with silt traps,allowing maintenance workers to reclaim soil lost fromthe upstream area.Preserving the natural environmentNatural resourcesBefore any layout planning should begin, detailedinformation regarding topography, geology,hydrology, and fauna and flora, needs to beobtained. Areas containing building materials(sands, aggregates, road materials, clays and thelike) should not be sterilised by other land useswithout consideration being given to theirpotential utilisation. Sandy areas are useful forrecharging ground water. High-intensitydevelopment can be matched with soils of lowpermeability and vegetation of poor quality.8Chapter 6Stormwater management
GUIDELINES FOR <strong>HUMAN</strong> <strong>SETTLEMENT</strong> <strong>PLANNING</strong> <strong>AND</strong> DESIGNAlternative fuel sources may need to be developed.Otherwise uncontrolled denudation of the naturallandscape may seriously damage the environment,leading to rapid degradation and soil erosion.design and management cannot beoveremphasised (see Figure 6.5).All life forms depend on water and, indirectly, onthe soil. These two elements must therefore receivepriority in any development planning.All consequences of man’s use of natural resourceshave to be analysed. In many informal settlements,for example, residents grow crops and keepanimals, both for subsistence and informal selling.These agricultural practices must be recognised aspart of the urban fabric. However, if agriculturalpractices are to be accepted, potential problemsneed to be addressed.Assessing past failuresPoor farming practices have impacted negativelyon the environment (Department of Agriculture1995). Some of the consequences have been thefollowing:• Decreasing biodiversity. Natural habitats havebeen destroyed, leading to a decrease in theabundance and diversity of fauna and flora.• Overgrazing. Overstocking and limited grazingrotation have resulted in denuded land and athreat of desertification. Selective grazing byanimals on certain preferred plant species oftenleads to encroachment by unpalatable andundesirable plant species. Overgrazing is aparticularly endemic problem (see Figure 6.4).Figure 6.5: Runoff from feedlots contains high levelsof pollutantsInorganic fertilisers are often environmentallycostly. They can leach out of the soil andcontaminate groundwater and streams. Otherconsequences of injudicious use of fertilisers canreflect in the build-up of toxicity, acidificationand salinisation.Pesticides often kill non-targeted and usuallybeneficial organisms in the immediateapplication area. Non-biodegradable pesticidescan accumulate in the soil and water, withhazardous consequences to animal and humanlife.• Soil crusting. Incorrect tillage changes thestructure of the soil compaction, resulting inpoorer water infiltration: runoff increases andthere is a greater risk of erosion.• Dump sites also need protection (see Figure 6.6).Figure 6.4: Overgrazing exposes the land to raindamage and can result in extensive erosion• Pollution by fertilisers, pesticides, herbicidesand fungicides. Cattle dips and feedlots arepotential sources of pollution. Their properStormwater management Chapter 69
GUIDELINES FOR <strong>HUMAN</strong> <strong>SETTLEMENT</strong> <strong>PLANNING</strong> <strong>AND</strong> DESIGNGradually varying flow is normally assumed. Thecomputation to determine the variation in depth offlow with distance is available from many sources andis discussed later.Flood-line determinationFigure 6.6: Dump sites must be protected againstextraneous runoffThe determination of flood lines is usually based onthe routing of stormwater through the water course(drainage way). The capacity of a natural channel (orany channel for that matter) is affected by theinteraction of local features and the graduallyvarying flow profile. The routing problem has beenaddressed by Bakhmeteff (1932), Chow (1959),Henderson (1966) and French (1994). Theirclassifications of the flow profiles are welldocumented. Several computer programs areavailable to aid in the determination of water surfaceprofiles.Detention and retention facilitiesTECHNOLOGIES AVAILABLE TO THEENGINEERThe hydrologic cycleThere are four basic aspects in the hydrologic cycle ofinterest to the hydrologist, namely:• precipitation;• evaporation and transpiration;• surface runoff; and• ground water.Hydrology is used in stormwater management for thedesign and operation of hydraulic structures. Thesecould include spillways, highway bridges and culverts,or urban drainage systems (Alexander 1990; Linsley etal 1975; Midgley 1972; Adamson 1981).Flood routingMany methods and techniques are available to aid thedesign engineer in calculating runoff hydrographs andassociated flood peaks. The scope of this documentdoes not allow for any detailed dealing with thesetechniques; reference only is made to them. There aremany competent references for adequate coverage(Alexander 1990; Midgley 1972; Rooseboom et al 1981;Pansegrouw 1990).There are also hydraulic simulations, methods andcomputer programs available that route stormwaterrunoff and predict hydrographs at nominated reachesin watercourses and drainage ways, e.g. Hydrosim(routing model using the kinematic flood-routingequation), and the SCS method.Routing of storm water through drainage ways andrivers requires the computation of varied flow.A detention facility is designed to attenuate runoff,specifically the peak flows experienced in the reachesof a water course. These facilities may be planned on amulti-purpose basis as required by the controllingauthority, and can achieve a number of stormwaterobjectives.Many municipalities now require in their subdivisionregulations that runoff from a development may notexceed pre-development runoff for a particularfrequency design flood. This is normally accomplishedby the construction of a detention basin or facility. Thefacility acts as a small flood-control reservoir, whichcan attenuate the peak of the runoff before it flowsdownstream.The sizing and positioning of detention facilities needsto be done on a catchment basis, and should form partof the master drainage plan. The combined effect ofdischarges from various sub-catchments should beanalysed to minimise possible adverse effects on thewatercourse under consideration.All dams need to be registered, classified andevaluated as dams with a safety risk, specifically anystructure with a wall height greater than 5 meters. Theevaluation process must involve an ApprovedProfessional Engineer (APE).To effectively determine the parameters of such afacility, flood routing the design inflow hydrographsthrough the storage in the basin with a predictableoutflow needs to be done, so that downstream effectscan be determined. Typical design data may include• the relevant hydrographs for each of a range ofdesign flood recurrence intervals or frequencies,taking cognisance of the ultimate possible postdevelopmentcharacteristics of the catchment;10Chapter 6Stormwater management
GUIDELINES FOR <strong>HUMAN</strong> <strong>SETTLEMENT</strong> <strong>PLANNING</strong> <strong>AND</strong> DESIGN• details of the storage and stage characteristics ofthe detention basin;• details of the outlet structures with reference tothe discharges from the structures at the variousstages;• structural and geotechnical details of the dam wallwith regard to type of wall, materials, filters,founding details, spillway structure, erosionprotection and freeboard;Flow types are categorised according to inletcontrol, barrel control or culvert, or outlet control.However, all culverts act to some extent asdetention structures, because some stormwaterupstream of the culvert accumulates beforeflowing through the culvert. An accurateassessment of the behaviour of a specific culvertconfiguration for detention facilities needs to beobtained over a range of flows and headwaters(see Figure 6.7).• safety precautions related to floods and otherhazards;• possible recreational use of the facility; and• maintenance issues, including sedimentation andmaintenance of vegetation.See also: American Society of Civil Engineers 1982;Brink 1979; Gerber et al 1980; Jennings et al 1978;Knight et al 1977; SA Institution of Civil Engineers,1985.Programs are available to do the flood routing of aninflow hydrograph through a detention facility toproduce the downstream outflow hydrograph (HEC-1,Pond Pack). Many of these use the storage-indicationworking-curve method or Modified Puls method whichis discussed in more detail in Appendix A to thischapter (Golding 1981).Storage facilities may be purpose-built, designedprimarily to attenuate runoff, and are usually in theform of wet (part retention, part detention) or dry(detention) facilities. Certain cities in America useunderground tunnels and disused quarries, into whichpeak flows are routed. The effluent is then pumpedfrom these facilities through purification systemsbefore being discharged into the receiving rivers.Supplementary facilities, whose primary function isnot stormwater attenuation but which have beendesigned to function in an emergency as astormwater-detention facility, can be designed inparking areas, sports fields and areas upstream of roadembankments.Outlets at stormwater-detention facilitiesCulvertsFlow through culverts is dealt with in many textbooks. Nomographs are available, for example inUS Department of Transportation (1985). Flowthrough culverts is also dealt with in Chow (1959)and French (1994). Most local authorities,provincial and national roads departments havetheir own design guidelines, to which the drainagedesigner should refer.Figure 6.7: Multiple-outlet structure of a detentionpondProportional weirsThe proportional weir has one uniquecharacteristic in that it has a linear head-dischargerelationship. Details are provided in Appendix B ofthis chapter.Improved inverted V-notch or chimney weirThe inverted V-notch (IVN) weir is a more practical,linear sharp-crested weir. Details are given inAppendix B of this chapter.Spillway crestsOverflow spillway crests are widely used as outletsfrom detention facilities. Their design is outside thescope of this publication. Reese and Maynord(1987) provide an adequate reference.Other control structuresWeirs are structures widely used in hydraulicengineering to control or measure flow. Typicalweirs include the following:• Broad-crested weirsRectangularTriangularStormwater management Chapter 611
GUIDELINES FOR <strong>HUMAN</strong> <strong>SETTLEMENT</strong> <strong>PLANNING</strong> <strong>AND</strong> DESIGN• Sharp crested weirsRectangularV-NotchCipoletti weirProportional or Sutro weirExamples of some energy dissipators are shown inFigures 6.8, 6.9 and 6.10.• Parshall flume.There are also other weirs. However, there arelimitations to the applications of these types ofweirs and contractions. French (1994) and Chow(1959) provide ample discussion on the subject. Seealso Keller (1989) and Francis (1969).Bridge backwatersBackwaters produced by bridge restrictions need to beanalysed when flood lines are considered. For furtherreference see US Dept. of Transportation (1978),Hydraulics of bridge waterways, Hydraulic designseries No 1.Erosion protectionFigure 6.8: Simple drop structures in a residentialenvironmentEnergy dissipatorsThe dissipation of energy of water in canals or ofwater discharging from pipes must be consideredwhen downstream erosion and scouring arepossible. The drainage engineer is always facedwith the problem of achieving this in anaesthetically pleasing way. Several technologies areavailable:• Widening the drainage way and decreasing thedepth of flow. This will have the effect ofreducing the velocity of flow. Overland flow is atypical example.• Increasing the roughness of the canal ordrainage way. Although this will increase thetotal cross-sectional area of flow, it willdecrease the velocity.Figure 6.9: Energy dissipator• Structures which include the following:Roughness elementsUSBR type II basinUSBR type III basinUSBR type IV basinSAF stilling basinContra Costa energy dissipatorHook type energy dissipatorTrapezoidal stilling basinImpact-type energy dissipatorUSFS metal impact energy dissipatorDrop structuresCorps of Engineers stilling wellRiprap basins.Reference to their selection and hydraulic design isgiven in US Department of Transportation (1983).Figure 6.10: Energy dissipator in a multiple land usesetting12Chapter 6Stormwater management
GUIDELINES FOR <strong>HUMAN</strong> <strong>SETTLEMENT</strong> <strong>PLANNING</strong> <strong>AND</strong> DESIGNStructural elementsStructural elements that are typically used include:• Geocells (e.g. Hyson-cells);• Geotextiles (e.g. Bidim, MacMat, Sealmac);• Geomembranes (HDPE linings and others);• Riprap;• Gabions (refer to SABS 1200);• Reno mattresses (refer to SABS 1200);• Linings (e.g. Armorflex); and• Stone pitching (adequately covered in SABS1200).The reader is urged to approach the suppliers ofthese products for technical information.TransitionsKerb inlet transitionsKerb inlets (lateral stormwater inlets) are widelyused with kerbs and surfaced roads. Theirperformance has been discussed adequately byothers. Forbes (1976), for example, proposed thaton moderate to steep road gradients, the capacitycould be substantially improved by incorporatingan extended length of depressed gutter upstreamof the inlet.Culvert transitionsCulvert transitions are structures that attempt toconverge wide, shallow subcritical flows into highvelocitycritical flows which can be passed throughdeep, narrow throats that are more cheaplyconstructed as culverts or bridges. Sometimestermed minimum energy or maximum dischargedesigns, this concept allows large flows to berouted through smaller, more efficient andeconomical culverts or bridges without the usualbackwater or headwater required to provide theenergy necessary to pass the flow through a typicalopening (Cottman and McKay 1990). Considerationmust be given to the immediate downstreameffects and energy dissipation.Modification of the headwall and culvert openingdetails to conventional culverts and bridges canalso reduce the energy loss at the entrance. Thislends itself to a more efficient hydraulic design (USDept. of Transportation 1985, Hydraulic design ofhighway culverts). However, a more efficienthydraulic design through the culvert structuregenerally leads to higher-energy waters at theoutlet. Energy dissipators may have to beincorporated into the design.Kerb inletsThe standards used by municipalities vary considerably.Generally, cognisance should be taken of thefollowing:• hydraulic performance;• accessibility for cleaning purposes;• ability of the top section of the culvert to bearheavy traffic;• safety for all road users; and• cost.For further information, refer to Forbes (1976).Side weirsSide weirs are structures often used in irrigationtechniques, sewer networks and flood protection. Aspecial case of this is the kerb inlet (Hagner 1987;Burchard and Hromadka 1986).Road drainageSurfaced roadsThe main function of urban roads is the carrying ofvehicular, cycle and pedestrian traffic. However,they also have a stormwater managementfunction. During minor storm events, the twofunctions should not be in conflict. During majorstorm events, the traffic function will beinterrupted, the flood control function becomesmore important and the roads will act as channels.Good road layout can substantially reducestormwater-system and road-maintenance costs.A well-planned road layout can significantly reducethe total stormwater-system costs. Whenintegrated with a major system this may obviatethe need for underground stormwater conduits. Akey element is that the road layout should bedesigned to follow the natural contour of the land(Miles 1984). Coordinated planning with the roadand drainage engineers is crucial at the prefeasibilitystage.Stormwater runoff may affect the traffic-carryingcapacity through:• sheet flow across the road surface;• channel flow along the road;• ponding of runoff on road surfaces; and• flow across traffic lanes.Refer to Figures 6.11, 6.12, 6.13 and 6.14.Stormwater management Chapter 613
GUIDELINES FOR <strong>HUMAN</strong> <strong>SETTLEMENT</strong> <strong>PLANNING</strong> <strong>AND</strong> DESIGNFigure 6.11: A lined open roadside channelFigure 6.14: Flow across this intersection has resultedin siltation, which is inconvenient and hazardous toroad usersSheet flowThis flow is generated on a road surface and isusually least at the road crown, increasing towardsthe road edge. This can lead to hydroplaning whena vehicle travelling at speed has its tyres separatedfrom the road surface by a thin film of water.Sheet flow can also interfere with traffic whensplashing impairs the vision of drivers.Channel flowFigure 6.12: Incorrect vertical alignment has causedstormwater to bypass this kerb inlet. Kerb inlets inthe intersecting road on the left have also notcaptured runoff from that road so that stormwaterflows across this bus route, creating a hazardChannel flow is generated from sheet flow andfrom overland flow from adjacent areas. As theflow proceeds it increases in volume, encroachingon the road surface until it reaches a kerb inlet ordrain inlet. The result is reduced effective roadwidth. Again, splashing produced by the tyres canlead to dangerous driving conditions.It is important that emergency vehicles should stillbe able to use the road during major storms.Figures 6.15 and 6.16 illustrate examples of channelflow.Figure 6.13: This ponding is the result ofencroachment of the grass verge onto the road.Grass-cutting maintenance operations should alsoinclude harvesting the grass, to prevent siltation andbuild-up of new grass growthFigure 6.15: Example of surface drainage in aresidential setting14Chapter 6Stormwater management
GUIDELINES FOR <strong>HUMAN</strong> <strong>SETTLEMENT</strong> <strong>PLANNING</strong> <strong>AND</strong> DESIGNslope of the road.Encroachment on roads by runoffMajor storm eventsThe encroachment by runoff from a major stormevent onto primary roads should not exceed adepth of 150 mm at the crown of the road. Thiswill allow access by emergency vehicles.Minor storm eventsFigure 6.16: Open channel alongside an arterial roadPondingPonding on roads may occur at low points, atchanges in gradient, at sump inlets and roadintersections. This can have a serious effect ontraffic flow, particularly as it may reach depthsgreater than the kerb height or remain on theroadway for long periods. A particular hazard ofponding is that it is localised and traffic may entera pond at high speed.Flow across traffic lanesFlow across traffic lanes may occur at intersections,when the capacity of the minor system is exceeded.As with ponding, localised cross-flows can createtraffic hazards. Therefore, at road intersections, forexample, traffic devices should be used to reducetraffic speed during downpours. In such casesallowing cross-flow may be preferable tomaintaining the road gradient, which would havethe effect of creating irregularities in the crossThe suggested maximum encroachment on roadsby runoff from minor storms is given in Table 6.3.Road gradientsMaximum road gradientsThe maximum road gradient should be such thatthe velocity of runoff flowing in the road edgechannels does not exceed 3 m/s at the limitsindicated in Table 6.3. Where the velocity of flowexceeds this value, design measures should beincorporated to dissipate the energy.Minimum road gradientsThe minimum gradient for road edge channelsshould be not less than 0,4% (to reduce depositionof sediment).Maximum road crown slopeThe maximum slope from the crown of the road tothe road edge channel is not governed bystormwater requirements.Table 6.3:Suggested maximum encroachment of runoff on roads during minor stormsROAD CLASSIFICATIONResidential and lower-order roadsNo kerb overtopping.*MAXIMUM ENCROACHMENTFlow may spread to crown of road.Residential access collectorNo kerb overtopping.*Flow spread must leave at least one traffic lanefree of water.Local distributorNo kerb overtopping.*Flow spread must leave at least one lane free ineach direction.Higher-order roadsNo encroachment is allowed on any traffic lane.* Where no kerb exists, encroachment should not extend over property boundaries.Stormwater management Chapter 615
GUIDELINES FOR <strong>HUMAN</strong> <strong>SETTLEMENT</strong> <strong>PLANNING</strong> <strong>AND</strong> DESIGNMinimum road crown slopeThe minimum slope from the road crown to thechannel should be not less than 2% for a plain,surface or an average of 2% where the surface hasa variable cross slope.Unsurfaced roadsThe drainage function of unsurfaced roads isdependent - and has a significant impact - on theplanning of the road and access layout. If theroadway is to be used to channel and drainstormwater runoff, then the velocity of this runoffmust be such that minimal erosion potential exists.This means that gravel roads, together with theirside drains, need to have low gradients. Roads withsteep gradients should, as far as possible, not beused as drainage ways, nor should any adjacentside drains without proper erosion protection. Thisprotection can include drop structures, linedchannels at critical sections, or regular drainagefrom the roadway into intersecting roads ordrainage ways. Refer to Figures 6.17 and 6.18.Figure 6.17: The contour-planning concept, toimpede the drainage of runoff from thedevelopmentFigure 6.18 (b): Concentration of stormwaterdrainage in a roadway resulting in majorinconvenience to road usersRunoff from earth or gravel roads will contain gritand its conveyance in pipes can eventually block oreven damage the pipe network. Blockages aredifficult to clear. In many instances maintenance isnot done, rendering the network ineffectual. Useof pipelines in environments of high erosionpotential is not recommended because of the highexpense of maintenance and high risk of failure ornon-performance.An alternative to a network of pipes is an openchannelsystem on the roadsides for conveyingminor storm runoff. This system may also conveydry weather flow in areas where there are high orperched water tables, and there is sullage fromindividual households or from communal waterpoints. The positioning of communal water pointsmust be carefully considered and soakaways ordrainage from these points included in their design(see Chapter 9). Suitable erosion protection of thecanal invert, including drop structures and silttraps, is important. See Figure 6.19Figure 6.18 (a): Concentration of stormwaterdrainage in a roadway resulting in majorinconvenience to road usersFigure 6.19: Roadside drains of the major system16Chapter 6Stormwater management
GUIDELINES FOR <strong>HUMAN</strong> <strong>SETTLEMENT</strong> <strong>PLANNING</strong> <strong>AND</strong> DESIGNThe use of open roadside channels may necessitatea wider road reserve than that required toaccommodate subsurface drains. This is particularlypertinent where open channels intersect withroadways or property access ways. The width of anopen channel may increase progressively as thedrain accepts more runoff. The road reserve mayhave to be widened or the channel deepened. Theadvantages of these alternative technologies mustbe compared. Open drains, like all systems, willrequire maintenance. However, this technology isnot “out-of-sight, out-of-mind”. Siltation and otherproblems will immediately become apparent.Where the whole roadway is used as a drainageway for the major system, erosion protection onthe downstream road edge may need to beconsidered. The crossfall of the road shouldgenerally be against the natural ground slope sothat the whole road width can act as a drainageway in the major system. To maximise the storagefunction of the roads as part of the drainagesystem in major storm events, the settlement layoutshould be planned so that the greatest length ofroad closely follows the ground contour (thecontour-planning concept). Figure 6.20 shows anexample of this planning concept of a rural villagein highly erodible granitic soils. The erosion fromthis area was effectively eliminated.Figure 6.20 (b): Layout planning in steep terrainRoof drainageHigh-intensity short-duration storms are experiencedin many parts of southern Africa. These violent stormsare often accompanied by strong winds and hail,which may lead to damage and the flooding ofbuildings containing valuable assets.It is considered prudent that designers of roofstructures for large buildings take cognisance of theroof drainage system. The research done by Schwartzand Culligan (1976) suggested that the five-minutestorm is likely to cause overtopping of gutters inbuildings of conventional size. The approach to thedesign of roof lengths, gutter size, box receivers anddownpipes is discussed in this reference.In the United States of America certain authoritiesrequire that all runoff generated on certain propertiesbe stored for slow discharge into the municipaldrainage system. Ponding of rain on roofs is oneretention technology. Others include using depressedareas on the property to store excess runoff. SeeFigures 6.21 and 6.22.Figure 6.20 (a): Layout planning in steep terrainStormwater management Chapter 617
GUIDELINES FOR <strong>HUMAN</strong> <strong>SETTLEMENT</strong> <strong>PLANNING</strong> <strong>AND</strong> DESIGNFigure 6.21: This office complex incorporated theentrance to the building in a detention facility.Under normal conditions, this area functions as apleasant park with water featuresFigure 6.22 (b): Runoff from this parking area isstored in the drainage ways using multiple-outletdrainsUpgrading issuesWhile greenfield development may encompass a morerigid planning procedure, upgrading projects shouldalso be subjected to assessment of their possibleenvironmental impact. In development, wheregreenfield development may be at the one end of thecontinuum and projects associated with maturedeveloped areas at the other, the issues to beaddressed in planning should be similar. A rigorousassessment of impacts - which may include operationand maintenance issues - should be considered. Theclassification of project proposals and their possibleeffects on certain areas and features are consideredfully in the Guideline Document 1 of the IEMprocedure (Department of Environment Affairs1992b).POLLUTION ABATEMENTFigure 6.22 (a): Depressed area to storeexcess runoffWhile the issue of quantity of stormwater runoff hasbeen addressed in South Africa for some time,emphasis on the quality of runoff has lagged behind.While economic and social attention to developmenthas been largely beneficial, the total cost oftechnology (that is, the opportunity costs of notconsidering the total waste stream produced by atechnology) has not been considered in great depth inSouth Africa. This typically refers to issues, like healthcare, which concentrate on treating the symptomsinstead of striving for a balance between prevention(reducing or eliminating the cause) and cure. The user,the man in the street, pays sooner or later, carryingboth financial cost and forfeiting quality of life.18Chapter 6Stormwater management
GUIDELINES FOR <strong>HUMAN</strong> <strong>SETTLEMENT</strong> <strong>PLANNING</strong> <strong>AND</strong> DESIGNSources of pollutionAir pollutionWith the exception of pollution generated bymotor transport, stationary fossil-fuel processesproduce the bulk of air pollution in South Africa(Petrie et al 1992). Five activities in this categorywhich generate air pollution are recognised:• fuel combustion and gasification fromstationary sources (particularly electrical powergeneration);• fossil fuel burning in dense unservicedsettlements;• industrial and chemical processes (ferro-alloyindustries, fertiliser production);• solid waste disposal (incineration of industrial,residential and hospital wastes); and• land surface disturbances (mining andconstruction activities, agricultural practicesand veld fires).Of particular concern is the acidic deposition byrain (acid rain) which may result in acidification offreshwater ecosystems, denudation of forested andagricultural areas, corrosion of metal surfaces anddestruction of masonry structures.While the Atmospheric Pollution Prevention Actprovides for both administrative and judicialcontrol measures, air pollution control isadministered in practice by the chief officer of alocal authority and the government miningengineer.Point sources of water pollutionIndustrialApart from the air pollution produced by industry,most industrial processes use water and produceeffluent. Some of these processes include• abattoirs;• breweries;• pharmaceuticals;• fishing;• tanning; and• the fruit and vegetable industry.The strategies for pollution abatement are focusedon the reduction of water use at source andimproved effluent purification technologies.Runoff from industrial plant sites may contain toxicor hazardous pollutants. The installation ofdetention facilities can be one technology to storethe effluent during periods of runoff and release itat a slower rate to a treatment process such as awetland.MiningThere are many pollutants emanating from miningoperations, depending on the operationsthemselves. Probably the main concern to thedrainage engineer is the so-called acid minedrainage and heavy metals.The standard practice on South African minesvaries considerably. The fundamental principles ofkeeping clean water and polluted water separateand preventing clean water from becomingcontaminated are largely ignored by many mines(Pulles et al 1996).Non-point sources of water pollutionNon-point sources of water pollution are difficultto locate. Some success has been obtained usinginfra-red aerial photography (Perchalski et al 1988).This technology can prove helpful in identifyingnon-point source problems that include• oxygen depletion in dams; and• runoff from city streets, farms, forests, mines,construction sites and atmospheric deposition.Agricultural pollutionPoor farming practices have often impactednegatively on the environment. Some of theobserved consequences have been• decreasing bio-diversity;• overgrazing through overstocking;• pollution by fertilisers;• pollution by pesticides, herbicides andfungicides;• soil crusting; and• irrigation with polluted water.The scarcity of water has been identified as thesingle most limiting factor for economic growth insouthern Africa. It is therefore essential that thisscarce resource be utilised judiciously and sensiblyfor the benefit of all users, including the naturalenvironment.Certain standards of water quality are required forall users - from primary domestic use to water forirrigation, stock watering, recreation and themaintenance of aquatic habitats.Water used for irrigation will always containmeasurable quantities of dissolved salts. TheseStormwater management Chapter 619
GUIDELINES FOR <strong>HUMAN</strong> <strong>SETTLEMENT</strong> <strong>PLANNING</strong> <strong>AND</strong> DESIGNinclude relatively small but important amounts ofdissolved salts originating from the dissolving orweathering of rocks, soil, lime, gypsum and othersalt sources as the water passes over or percolatesthrough them. The suitability of water forirrigation will be determined by the amount andtype of salts present. While the quality does notform part of the scope of this chapter, poor waterquality may cause various soil - and thereforeproductivity - problems to develop, namely• salinity;• permeability;• toxicity; and• miscellaneous chemical problems (e.g. excessnitrogen in the water, pH).Guidelines in terms of the sodium adsorption ratio(Ayers 1977) and the adjusted sodium adsorptionratio should be consulted to ensure thatproductivity is not limited by the water quality, andthat users downstream are not disadvantaged bypoor agricultural land use.Urban pollutionStormwater runoff from urban catchments hasbeen found in many areas to be a major source ofpollution to the water-receiving bodies. Practicessuch as effective rubbish collection, street cleaning,vegetation buffer strips and improved fertilizerpractices ameliorate this pollution (see the sectionon street cleaning in Chapter 11: Solid wastemanagement).Soil erodibilityFigure 6.23: Gully erosion by headwater upstream ofa highway culvert inlet. Specific attention needs tobe paid to structures founded in soils with higherosion potentialGrass-lined channelsGrassed waterways are generally a cost-effective wayto convey stormwater (US Dept Agriculture 1987). Theuse of indigenous plants for stabilisation isrecommended. The velocity of water flowing in thewaterway should be limited in relation to theerodibility and slope of the waterway.Fencing off the waterway in a rural environment isusually an effective way of controlling livestock so thatthe grass cover can be established. Once this cover hasbeen established, livestock can be introduced onto thegrassed waterway in a controlled manner. Figure 6.24illustrates the concept.Examples of highly erodible soils in South Africainclude the granitic soils found in Mpumalanga andthe Highveld (Kyalami system). Although erosion is anatural phenomenon, interference by man with thenatural environment can rapidly degrade the naturalsystems available to ameliorate this erosion. One ofthe major anthropological influences which occurs inmany of the rural areas is the over-stocking of animals.See Figure 6.23.Dispersive clays occur in any soil with highexchangeable sodium percentage (ESP) values. Thetesting procedures for the identification of dispersiveclays are discussed by Elges (1985). Methods forconstructing safe and economic structures withdispersive clays should be carefully considered.Figure 6.24: An example of a grassed waterway20Chapter 6Stormwater management
GUIDELINES FOR <strong>HUMAN</strong> <strong>SETTLEMENT</strong> <strong>PLANNING</strong> <strong>AND</strong> DESIGNDetention pondsWhile authorities in the USA stipulate detention timesfor certain areas, the general use of this technology tosettle out suspended solids and for the treatment ofother pollutants from runoff in South Africa appearsremote, as the incoming runoff usually has a high claycontent. Siltation occurs in all dams. However, from apurification point of view, it is not consideredeconomically feasible in detention facilities to settleout the products of erosion (i.e fine silts and clays).Detention times would need to be very long, andtherefore require large areas of land. Retentionfacilities should rather be considered for theirbeneficial use as water bodies and integrated with thenatural drainage corridors which allow other naturalprocesses to occur (e.g. wetlands).WetlandsBackgroundWalmsley (1987) defined wetlands as “waterdominated areas with impeded drainage wheresoils are saturated with water and there is acharacteristic fauna and flora”. Other items such asvleis, water sponges, marshes, bogs, swamps, pans,river meadows and riverine areas are oftenincluded in references to wetlands. Their ecologicalimportance has often been emphasised, and manymunicipalities and industries are using artificialwetlands to treat waste water (Gillette 1993).Wetlands purification functionsThe principle function of the vegetation inwetlands is to create additional environments formicrobial populations. The stems and leaves in thewater obstruct flow, facilitate sedimentation andincrease the surface area for the attachment ofmicrobes, and constitute thin films of reactivesurfaces.Wetland plants also increase the amount of aerobicmicrobial environment in the substrate. This isincidental to the unique adaptation of wetlandplants to thrive in saturated soils. Most terrestrialplants cannot survive in waterlogged soils for anyappreciable length of time due to the oxygendepletion which normally follows flooding. Unliketheir terrestrial relatives, wetland plants havespecialised structures which enable them toconduct atmospheric gases, including oxygen,down into the roots. This oxygen leaks out of theroot hairs, forming an aerobic rhizosphere aroundevery root hair, while the remainder of thesubsurface water volume remains anaerobic. Thisjuxtaposition of aerobic/anaerobic environments iscrucial to the transformation of nitrogenouscompounds and other substances.Microbial organismsMicrobes (bacteria, fungi, algae and protozoa)alter contaminant substances in order to obtainnutrients or energy to complete their life-cycles.The effectiveness of wetlands in water purificationis dependent on developing and maintainingoptimal environmental conditions for the desirablemicrobial populations. Most of the desirablemicrobes are ubiquitous and are likely to be foundin most waste waters with nutrients and energy;hence inoculation of specific strains is generally notnecessary.SubstrateThe primary role of the substrate, whether soil,gravel or sand, is to provide a support for theplants and a surface for attachment by microbialpopulations. The substrate can also be selected onthe basis of its chemical characteristics, wherepollutant removal is achieved through complexing- a chemical and physical process allowing morecomplex substances to be formed, which thenremain in the substrate zone (Batchelor 1993).Plant selectionThe diversity and complexity of natural wetlandvegetation is principally the result of interactionsbetween the following three important factors:• hydrology;• substrate; and• climate.In constructing a wetland - if the intention is toattempt to reproduce a “natural” wetland - athorough knowledge of local wetland vegetation isa distinct advantage. If, however, the intention isto use the wetland for water purification, there area number of universal species that can be used. Byfar the most commonly used genera arePhragmites, the common reed and Typha (referredto locally as the bulrush). Other genera that havebeen used successfully are various Scirpus andCyperus species.Advantages of constructed wetlandsConstructed or created wetlands simulate processesoccurring in the natural wetland system. Theseinclude• flood attenuation (if properly designed); and• water-quality improvement through theremoval of substances such as suspended solids,nitrogen, trace metals, bacteria and sulphates.These are only a few of the substances wetlandsStormwater management Chapter 621
GUIDELINES FOR <strong>HUMAN</strong> <strong>SETTLEMENT</strong> <strong>PLANNING</strong> <strong>AND</strong> DESIGNare able to remove. Their effective functioning isdependent on the pressure of environmentalconditions conducive to the required processes.They are not dependent on external energy orchemical inputs. Wetlands also require littlemaintenance.In addition to their water purification functions,wetlands provide habitats and life-support systemsfor a wide range of flora and fauna, particularlybirds, plants, reptiles and invertebrates. Wetlandscan be aesthetically pleasing and offer anopportunity for recreation and education. SeeFigure 6.25.Figure 6.26 (a): Construction sites can be preventedfrom polluting the surrounding area by the use ofstraw bales, mulching and geo-mats. Aggregatesplaced at exits from sites prevent the transport ofpollutionFigure 6.25: Part detention, part retention facility,including an artificial wetlandProtection of the environment during theconstruction phaseErosion protectionOne of the most unstable periods in anydevelopment occurs during the construction phase.Runoff from sites should be collected in temporarycheck dams (see below). Straw bales can bepositioned at kerb inlets to prevent silt enteringthe underground drainage systems whileconstruction is taking place. Figures 6.26 and 6.27illustrate the examples of temporary erosionprotection.Figure 6.26 (b): Construction sites can be preventedfrom polluting the surrounding area by the use ofstraw bales, mulching and geo-mats. Aggregatesplaced at exits from sites prevent the transport ofpollutionFigure 6.27: Stone aggregate can be placed on theroadside while the shoulder grass establishes itself22Chapter 6Stormwater management
GUIDELINES FOR <strong>HUMAN</strong> <strong>SETTLEMENT</strong> <strong>PLANNING</strong> <strong>AND</strong> DESIGNProtection and rehabilitationThe erosion cycle - detachment, transportation,deposition - is a natural phenomenon. However,development usually alters the natural pattern.Erosion control is a measure to substantially reduceerosion and thereby decrease the sediment inputinto the stream system. The aim is to reduce theaccelerated erosion typically caused by pooragricultural techniques and other land uses.Measures may include practices such as contourfarming and terracing (applicable to both the ruraland urban settings), strip cropping, crop rotation,no-till farming, grassing drainage ways, gully andstream bank erosion control, and stabilisation ofcritical areas.Technologies available to the designer include thefollowing:Silt fencing and straw bale barriersSilt fences and hay/straw bale barriers are twotypes of filter barriers. They are temporarystructures which are installed across or at the toe ofa slope. They are used to control sheet flow and aretherefore not effective in areas of concentratedflow, such as ditches or waterways. See Figure 6.28.RiprapRiprap is a heavy stone facing on a shorebank usedto protect it and the adjacent upland against wavescour. Riprap depends on the soil beneath it forsupport and should be built only on stable shoresand bank slopes.Other technologiesThe use of geofabrics, matting, netting, mulchingand brush-layering are other technologies whichattempt to protect the soil from rain impact andimpede the flow of stormwater runoff.The alternative biological approach is oftenintegrated with the structural technologies. Manyof the indigenous flora can be effectively used toform vegetation buffer strips and other naturalbarriers, sponges and stable riverine corridors(Oberholzer 1985).Street cleaningStreet cleaning can be an effective method ofremoving litter and sand-sized particles. Overallpollutant removal by street sweeping is not, however,very efficient, with an upper limit of 30 per centremoval being reported in the USA for well-runprogrammes and a more typical removal of 10 to 30per cent (Sartor et al 1984).Organics and nutrients are not effectively controlled,but regular - daily or twice daily - street cleaning canremove up to 50 per cent of the total solids and heavymetal yields in urban stormwater (Field 1985).Runoff from unmanaged urban environments can behighly polluted. Efforts to reduce this pollution mustbe coordinated between those responsible for refuseremoval, sanitation, and industrial effluent.Waste disposal sitesFigure 6.28: The straw-bale barrier has allowedpioneer plants to establish themselvesTemporary check damsSmall temporary check dams constructed across aditch or small channel reduce the velocity ofconcentrated stormwater flows. They also trapsmall amounts of sediment. Temporary check damsare useful on construction sites, or for temporarystabilisation of erosion areas where protection isrequired for the establishment of vegetation.The siting of waste disposal sites is regulated by theminimum requirements guidelines published by theDepartment of Water Affairs & Forestry (1994a, b andc). For the drainage engineer, the importance of sitingrelates to the environmental impact the sites may haveon the ground and surface water bodies. As wastedisposal sites are regarded as a bulk service, they arenot discussed further in this document, except toillustrate the adverse effects of uncontrolled orunmanaged dumping (see Figures 6.29 and 6.30).Stormwater management Chapter 623
GUIDELINES FOR <strong>HUMAN</strong> <strong>SETTLEMENT</strong> <strong>PLANNING</strong> <strong>AND</strong> DESIGNOn-site sanitationThe protection of the environment from possiblepollution by on-site sanitation systems such as pittoilets and soakaways is crucial. Pollution may becaused by infiltration of the leachate from the pitsinto the groundwater, or by surface runoff througha sanitation system which is positioned in a surfacewaterdrainageway. The preservation ofgroundwater resources (many South Africans usewells, springs and boreholes) is particularlyimportant. In this regard, recommendations of theDepartment of Water Affairs & Forestry (1995) arerelevant.Water supplyFigure 6.29: Unmanaged domestic refuse is a serioushealth riskIn developing communities, consider the drainage ofexcess water from water points. Erosion can occur (seeFigure 6.31).Figure 6.30: Uncontrolled dumping at municipalwaste sites can have a serious impact on surface andsub-surface water systemsSanitationWaterborne sanitationIllegal stormwater drainage into sewer gulleys isendemic throughout South Africa. The increase inflow into sewage works after storm events iswidely recognised (Institute of Water PollutionControl 1973). While no estimates of flow aresuggested, one empirical estimation for increasedflow under wet weather conditions is equal to oneand a half times the peak dry weather flow.However, because of the variations observed inmany sites, it is advisable to place gulleys awayfrom where stormwater flows or collects, andgulleys should be as few in number as practicable.Figure 6.31: This water point has been placed in alow-lying area. Drainage of runoff and water spilledfrom the point has not been allowed for, and ahealth hazard has resultedSelection of cemetery sitesThe following ten criteria are deemed essential(Fischer 1992) when planning the position of acemetery:• soil excavatability for ease of excavating thegraves;• soil permeability which affects the pollutants’ability to be transported into groundwater;• the position with respect to domestic watersupplies, specifically if groundwater resources arebeing used;24Chapter 6Stormwater management
GUIDELINES FOR <strong>HUMAN</strong> <strong>SETTLEMENT</strong> <strong>PLANNING</strong> <strong>AND</strong> DESIGN• the position with respect to drainage features, sothat stormwater runoff does not convey pollutantsto streams or pose a threat of exposing graves. Theposition of the 1:50 floodline or a more stringentfloodline should be part of the investigation;• site drainage, which influences the ingress of raininto the soil and therefore the graves, with thepossibility of pollutants then being conveyed fromthe site through the soil;• site topography, which influences access to gravesas well as surface and subsurface drainage;• basal buffer zone, which relates to the depth of soil(buffer) between the deepest grave and the watertable (permanent or perched);• grave stability relates to the stability of the soilaround the grave from the time of excavation tothe time of interment;• soil workability, which refers to the ease ofcompaction; and• cemetery size, which relates to the requirements offuture grave sites and development pressures.Cemetery pollutionAccording to Fischer (1992) cemeteries pose apollution threat in that many of the existingcemeteries in SA contaminate our water resources.Microbiological pollutants (including bacteria,viruses and parasites) remain active within thewater table at much greater distances from theirsource than was previously assumed.The control of weed growth and invader plants, andthe mowing of lawns is necessary for aesthetic andhealth (mosquito control) reasons. To ensure that thebottom of a dry pond remains dry, it should be sloped(typically at 5 per cent) to the outlet or to a subchannellinking the inlet to the outlet. The subchannelmay confine silt and enable storm runoff fromminor events to bypass the pond. Subsurface drainagemay be required to prevent swampy conditions whena surface channel cannot be conveniently installed.Aquatic weed growth can be reduced in wet(retention) ponds by designing the ponds to have aminimum depth of water of 1,2 meters (after allowingfor sedimentation). Aeration and disinfection of thewater may also be necessary to maintain the requiredquality. The proper design of grids over outlets(limiting the opening to about 314 mm 2 ) assists inreducing outlet blockages. Reliable emergencyspillways that cannot block should be provided. Thepollution of wet ponds, where the initial runoffcannot be routed to bypass the facility, can be reducedto some extent by installing grease and sediment trapsupstream of the pond inlet.However, reduction or elimination of the pollutants attheir source is generally the preferred option.The failure of a facility’s embankment may result frompiping, either because of poor soils (e.g. dispersivesoils), inadequate filter designs, animals which burrowinto the embankment, or tree root systems. Legumesshould not be used as plant cover for earthembankments as this results in a concentration ofnitrogen in the roots, which attracts rodents.When sports fields are used as detention facilities,playing surfaces are generally raised slightly above thesurrounding area to facilitate drainage and clearing ofgeneral debris and siltation. See Figure 6.32.At present no legislation exists to control theplanning of cemeteries in South Africa. Linked tothe issue of land availability, the potential ofpollution from cemeteries requires a thoroughtechnical evaluation.MAINTENANCE ISSUESDetention facilitiesThe nature of problems encountered with astormwater facility depends on its type, function,location and general environment. Many of theproblems can be avoided by proper design andconstruction procedures. Table 6.4 lists some of theproblems commonly experienced with these facilities.Figure 6.32: These sports fields will act as a detentionfacility should the watercourse on the right of thepicture not be able to convey the flood. Note thatthe playing surfaces are raised to aid drainage aftersuch an event. The crest of the side weir betweenthe watercourse and the sports fields is designed toaccept the excess flow, but is made aestheticallypleasing with a meandering cycle pathWhere porous pavements are used in parking areas orroads to encourage infiltration or reduce traffic noise,Stormwater management Chapter 625
GUIDELINES FOR <strong>HUMAN</strong> <strong>SETTLEMENT</strong> <strong>PLANNING</strong> <strong>AND</strong> DESIGNTable 6.4:Problems commonly experienced with storage facilities (after APWA Specialreport No 49 1981, and DeGroot 1982)PROBLEM TYPEWeed growthCOMMENTSEasy access to the site will enable the maintenance department tocombat weed growth. Designers should establish acceptable pioneergrasses (e.g. Cynodon dactolon - fine kweek, Stenotaphrum secundatum- buffalo grass) and reeds and marsh plants where applicable.Maintaining grassBank slopes should be gentle enough to allow access by maintenanceequipment.Sedimentation and urban litterIncreased maintenance required, but confined to a specific site.Mosquito controlRegular mowing required - keeping grass short facilitates evaporationand provides access for predators of mosquito larvae.Outlet blockagesParticular detail required for outlet works and may incorporate strawbale filters and trash racks.Soggy surfacesLandscape the basin so that depressions can be utilised as retentionareas for artificial wetlands.Inflow water pollutionRegular maintenance during wet season. Consider wetland filters atinlets.Algal growthAttempt to create a sustainable ecology.Fence maintenanceConsider public access points to the facility.Unsatisfactory emergency spillwaydesignDam design requirements.Dam failures and leaksDam design requirements (e.g. dispersive soils).Public safety during storm eventsFlood warning systems are an integral part of the total design.the surfaces should be regularly cleaned of debris toprevent clogging.Design detailsMinimum pipe diametersThe suggested minimum pipe diameters are• 300 mm in a servitude; and• 375 mm in a road reserve.considered at the design stage (see Table 6.5).Anchor blocksConcrete anchor blocks (20 MPa concrete strength)should be provided, as in Table 6.6.Figures 6.33 to 6.36 illustrate some commonmaintenance problems with stormwater facilitieswhich can be avoided by careful planning and design.Minimum velocities and gradients in pipesThe desirable minimum velocity range is 0,9 - 1,5m/s. Low velocities will not prevent siltation, so themaintenance of pipe networks needs to be26Chapter 6Stormwater management
GUIDELINES FOR <strong>HUMAN</strong> <strong>SETTLEMENT</strong> <strong>PLANNING</strong> <strong>AND</strong> DESIGNTable 6.5: Suggested minimum grades for pipes (City of Durban 1984)PIPE DIAMETER (mm) DESIRABLE MINIMUM GRADIENT ABSOLUTE MINIMUM GRADIENT(1 IN ...) (1 IN...)300 80 230375 110 300450 140 400525 170 500600 200 600675 240 700750 280 800825 320 900900 350 1 0001 050 440 1 2501 200 520 1 500Table 6.6: Suggested spacing for anchor blocks (City of Durban 1984)GRADIENT (1 IN...)SPACING FOR 2,44 m PIPE LENGTHS2 (50%) every joint2 - 3,33 (50% - 30%) alrternate joint5 (20%) every 4 th joint10 (10%) every 8 th jointFigure 6.34: Kerb inlets require maintenanceFigure 6.33: Inlet grids need attentionStormwater management Chapter 627
GUIDELINES FOR <strong>HUMAN</strong> <strong>SETTLEMENT</strong> <strong>PLANNING</strong> <strong>AND</strong> DESIGNFigure 6.35: The use of underground drainagesystems in unpaved roadways should be justifiedVeld fires are a common occurrence during the wintermonths in many areas in South Africa. No land-usermay burn veld or allow burnt veld to be grazedwithout the written authorization of the executiveofficer (Forestry Act No 72 of 1968). While it isgenerally agreed (Booysen and Tainton 1984) that veldburning (typically every 3 - 5 years) improves thequality of the veld, regular yearly burning reduces thebasal cover of the grass and therefore subjects the soilin the area to rain beat and possible erosion. Not onlydoes the burning pollute the atmosphere, butresources such as thatching materials (Hyparrheniafilipendula, H. dissoluta and H. hirta) may be lost.Although grasses usually recover before the rains,when burned in the middle of winter, fires in earlyspring may expose the soil to potential erosion. Apreferred technology is mowing; this, however, is moreexpensive.Awareness of hazardous situations andflood-warning systemsFlood-warning systems are an integral component ofthe design of any hydraulic structure, and are a localauthority responsibility. Stormwater managementshould aim to eliminate flood hazards.Effective forecasting and warning of impendingflooding will enable a community to prepare andtherefore reduce the danger to life and property.Flood warnings are usually more effective in largecatchments, where long response times allowintervention by the authorities and the public.However, local areas subject to flood hazards can besignposted and safety measures incorporated into theland-use design. (See Figure 6.37.)Figure 6.36: Stormwater drainage must occur off theroadway if kerbing is not installedENVIRONMENTAL HEALTH <strong>AND</strong>SAFETYThe role of education and communityinvolvementWood consumption for cooking and heating purposescan be greatly reduced by the use of efficient stoves(Ellis 1987), in lieu of open fires. Less woodconsumption leads to less denudation of thelandscape.The establishment of woodlots, although a long-termproject, will help alleviate the wood shortage. Again,these woodlots must be protected and managed, sothe communities having access to the resource musthave the necessary institutional capacity to do this.Figure 6.37: Flood-warning systems28Chapter 6Stormwater management
GUIDELINES FOR <strong>HUMAN</strong> <strong>SETTLEMENT</strong> <strong>PLANNING</strong> <strong>AND</strong> DESIGNRecreational use of facilitiesWatercourses need to be managed and maintained inurban environments. Flood plains are particularlyvaluable facilities for indigenous fauna and flora. Oneparticular maintenance problem is the management ofalien invader plants (see Figure 6.38). Maintenance bythe relevant authorities may place a high burden onthe funding available for general parks andrecreational maintenance. The commitment tomaintain these natural corridors should becommunicated to all involved and not be the burdenof the authorities only. Many campaigns (Collect-a-can,for example) encourage public participation inmaintaining our natural areas.The following recommendations have been made bythe Council for Geoscience (Calitz 1993):House structures• All man-made ponds, drainage ways,stormwater conduits and road surfaces shouldbe made impervious.• Runoff from structures should be conveyed inimpervious conduits away from the structures. Ifgutters are required by the local authority, thedownpipes should discharge into a lined orprecast furrow. This furrow should dischargethe water 1,5 m away from the from thefoundation, preferably onto a grassed groundsurface sloping away from the structure. Whereno gutters are utilised, it is recommended thatan apron 1,5 m wide be provided along theexternal walls of the structure where water willdischarge from roofs. This will allow the runofffrom the roof to be distributed away from thestructure foundation.Installation and maintenance of services• Bulk services should be routed in road reservesor servitudes with a minimum width of fivemeters.Figure 6.38: This nature trail has a problem withpampas grass (Cortaderia jubata), an alien invaderGeneral precautions for development ondolomites• Sewer- and water-reticulation systems in theroad reserves or other servitudes. If theseservices are placed mid-block, a building linerestriction of a minimum width of 5 m shouldbe imposed. Place water and sewer connectionsof any two erven on their common propertyboundary. Shared sewer connections should beconsidered if this arrangement leads to areduction of the length of piping and/orminimises the disturbance to the environment.• Each erf should have a rodding eye or similaraccess point to the sewer connection, inaddition to an inspection eye.• All stormwater, water and sewer pipes must bewatertight.Figure 6.39: Dolines are almost always the result ofman’s intervention in natural drainage systems. Thissinkhole has been caused by a road culvert• Avoid the use of clay pipes. When usingpolyethylene (HDPE) or polyvinyl chloride(uPVC) pipes, the use of compression-type jointsis preferred. The use of heat fusion, glue fusionor mechanical bonding requires goodworkmanship and may rupture with smalldifferential movements in the soil.• The roots of trees planted in close proximity tothe line of water-bearing services often causeleaks. Due regard should be taken whenpositioning trees and other plants.Stormwater management Chapter 629
GUIDELINES FOR <strong>HUMAN</strong> <strong>SETTLEMENT</strong> <strong>PLANNING</strong> <strong>AND</strong> DESIGN• Trenches and excavations, once opened, shouldbe closed as soon as possible. Propercompaction of the backfilling is recommendedto obviate the trench acting as a soakawaydrain.• The excavated material may be unsuitable foruse as pipe bedding or initial backfillingmaterial because of the possibility of thepresence of coarse chert.• Water pipes entering buildings should be fittedwith flexible couplings or kinked with a Z-formto allow for relative movement.• Corrodible pipes should be protected.• Where pipes cross roads, consideration shouldbe given to the use of sleeves or culverts (easeof access for maintenance).• Once the service has been installed andbackfilled, the ground surface profile should berestored to its natural slope.• All laid drainage pipes and sewerage should betested for leakage at time of installation andthereafter at regular intervals (<strong>CSIR</strong>, NBRI Infosheet X/BOU 2034).See also: Donaldson 1963; Buttrick and Van Schalkwyk1995; Buttrick and Roux 1993; and Roux 1991.30Chapter 6Stormwater management
GUIDELINES FOR <strong>HUMAN</strong> <strong>SETTLEMENT</strong> <strong>PLANNING</strong> <strong>AND</strong> DESIGNGLOSSARY:Terms used in stormwatermanagement• CUTA: Committee of Urban Transport Authorities,Department of Transport, PO Box 415, Pretoria0001.• Design period: Design period is usually the lengthof time a structure or asset will be expected to havea useful life, or the amortisation period if loanshave been procured to finance the construction ofthe structure or asset.• Design storm: The properties of a storm includethe depth, spread and duration of the rainfall aswell as variations in rainfall intensity in space andtime over the catchment area during the storm. Inthe choice of a design storm cognisance should betaken of all these parameters.• Detention facility: A structure which temporarilystores excess stormwater for a length of time. Theoutlet of the structure is designed to release thestored water into the downstream watercourse ata rate less than the flow rate into the facility duringstorm events.• Drainage area: That part of a catchment above aspecified point that contributes to the runoff atthat point.• Drainage system: See “stormwater drainagesystem”.• Dry pond: A detention pond that remains dryduring dry weather flow conditions.• Dry weather flow: Flow occurring in a watercourse not attributable to a storm rainfall event,but to groundwater flow where the water tableintersects the stream channels of a catchment.These dry weather flows do not fluctuate rapidlybecause of the low flow velocities.• Evapotranspiration: The evaporation from allwater, soil, snow, ice, vegetation and other surfacesplus transpiration of moisture from the surfacemembranes of leaves and other plant surfaces.• Flood plain: The flood plain of a river is the valleyfloor adjacent to the incised channel, which may beinundated during high water (Linsley et al 1975).CUTA defines the floodplain as the area inundatedin a river by the major flood.• Flood plain fringe: The flood plain fringe is thatarea in a river defined as being below the levelreached by the regional maximum flood and abovethe level reached by the major flood. Note: The USNational Flood Insurance Programme hasdefinitions of “floodway” and “fringe area” thatdiffer from those of CUTA.• Flood zone or floodway: Defined by CUTA as thearea inundated by the regional maximum flood(RMF).• Groundwater runoff: That part of the infiltratingwater that percolates downward until it becomesgroundwater. Eventually, after an indirect passage,it enters a stream that intersects its path andbecomes dry weather flow or base flow.• Hyetograph: A graph indicating the distributionof rain relative to time.• Hydrograph: A graph of stage or dischargerelative to time.• Interception: Precipitation stored on vegetationas opposed to rain in surface depressions (termeddepression storage).• Major drainage system: A stormwater drainagesystem which caters for severe, infrequent stormevents. Supported by the minor drainage system.• Minor drainage system: A stormwater drainagesystem which caters for frequent storms of a minornature.• Nomograph: A chart or graph from which, given aset of parameters, other dependant parameterscan be ascertained.• Off-stream facility: A stormwater facility which issituated away from the normal drainage way. Atypical example is shown in Figure 6.32. The sportsfields alongside a drainage way will act as adetention facility should the bank of the drainageway be overtopped by flood waters.• On-site facility: Detention facility located on awatercourse and through which normal dryweather flow passes.• Outfall: See “stormwater outfall”.• Recurrence interval: Recurrence interval orreturn period is the average interval betweenevents. The recurrence interval is usually expressedin years and is the reciprocal of the annualprobability. That is, the event having an annualprobability of occurrence of 2% (0,02) has arecurrence interval of 50 years. This does not implythat such an event will occur after every 50 years,or even that there will necessarily be one suchevent in every 50 years, but rather that over a muchlonger period (like a 1 000 year period) there willvery likely be 20 events of equal or greatermagnitude.Stormwater management Chapter 631
GUIDELINES FOR <strong>HUMAN</strong> <strong>SETTLEMENT</strong> <strong>PLANNING</strong> <strong>AND</strong> DESIGN• Retention facility: A structure which retainsrunoff indefinitely should the capacity of thestructure be sufficient to contain such runoff.Excess flow into the structure will be discharged viaa spillway.• Runoff: The water which constitutes streamflowmay reach the stream channel by any of severalpaths from the point where it first reaches theearth as precipitation. Water which flows over thesoil surface is described as surface runoff andreaches the stream soon after its occurrence asrainfall. Other water infiltrates through the soilsurface and flows beneath the surface to thestream.• Stormwater drainage system: All the facilitiesused for the collection, conveyance, storage,treatment, use and disposal of runoff from adrainage area to a specified point.• Stormwater outfall: The point at which runoffdischarges from a conduit.• Subsurface runoff: The flow derived from waterinfiltrating the soil and flowing laterally in theupper soil strata. It reaches the receiving streams orbodies of water fairly soon after a rainfall event,without joining the main body of groundwater.• Surface runoff: That part of the runoff thattravels over the ground surface and in channels toreach the receiving streams or bodies of water.• Sustainable development: Development thatmeets the needs of the present withoutcompromising the ability of future generations tomeet their own needs.• Watercourse: Stream or channel. May or may nothave a permanent flow of water.32Chapter 6Stormwater management
GUIDELINES FOR <strong>HUMAN</strong> <strong>SETTLEMENT</strong> <strong>PLANNING</strong> <strong>AND</strong> DESIGNAPPENDIX AStorage-Indication working curve method or Modified Puls method.The standard flood routing equation is( I1 + I 2) T - ( Q 1 + Q 2) T = S 2 - S 1 = S2 2This can be transposed to( I 2 2 T 2 T 21) + ( I 2) + ( S 1) + ( Q 1) - Q 1 = ( S 2) + ( Q 2)(A1)(A2)whereI 1 and I 2 are the inflow rates at times T 1 and T 2 respectively;Q 1 and Q 2 are the outflow rates at times T 1 and T 2 respectively;S 1 and S 2 are the storage values at times T 1 and T 2 respectively;T is the time increment between time T 2 and T 1 .In equation (A2) all the values on the LHS are known. Initially I 1 , Q 1 , S 1 and I 2 are known, yielding .T 2By developing the relationship between Q and , Q 2 can be interpolated from the value andT T 2S 2 can be interpolated from the relationship between Q and S. In the next time step the terms Q 2 andbecome Q 1 andso on.( S 1) ( 1) + Q T 2( S 2) ( 2) + Q( S +Q) ( S 2) ( 2) + Q( S 2) ( 2) + Q T 2respectively, so that the third storage value and discharge value can be deduced, andStormwater management Chapter 633
GUIDELINES FOR <strong>HUMAN</strong> <strong>SETTLEMENT</strong> <strong>PLANNING</strong> <strong>AND</strong> DESIGNAPPENDIX BProportional and inverted V-notch weirsThe relationships for proportional weirs are as follows:Q = C D . 2ga . b(h - a 3)(B1)where the discharge coefficient C D can be assumed to be approximately 0,62andx = 1 -2 tan-1 ( y )ba(B2)whereQ is the flow in m 3 /sa, b, h, x and y are in meters and shown in Figure B6.DOWNSTREAM ELEVATIONPROPORTIONAL WEIRDOWNSTREAM ELEVATIONINVERTED V-NOTCH WEIRThe relationship is as follows:q = 2 C D . 2g . 2Wh 3 / 2 -8 .CD . 2g. tan .h 5 /3 .2for 0 < h < dFor flows through this weir above a depth of 0,22d but less than 0,94d (where d is the V-sloped section height),Murthy (1990) found that the discharges are proportional to the depth of flow. See Figure B6.Figure B6: Proportional weirs34Chapter 6Stormwater management
GUIDELINES FOR <strong>HUMAN</strong> <strong>SETTLEMENT</strong> <strong>PLANNING</strong> <strong>AND</strong> DESIGNAPPENDIX CBroad crested weirThe most commonly used formula for estimating flow over a broad crested weir is formula (C1). As long as theflow is critical and parallel along its length, the equation is a good estimate.q = 1,70H 23/2(C1)Whereq = flow per unit width of weir.H 2 = total specific head at the weir.Stormwater management Chapter 635
GUIDELINES FOR <strong>HUMAN</strong> <strong>SETTLEMENT</strong> <strong>PLANNING</strong> <strong>AND</strong> DESIGNBIBLIOGRAPHYAcocks, J P H (1988). Veld types of South Africa. Thirdedition. Botanical Research Institute. Department ofAgriculture & Water Supply, Republic of South Africa.Adamson, P T (1981). Southern African storm rainfall.Technical report TR 102. Department of Water Affairs.Pretoria.African National Congress (1994). The Reconstructionand Development Programme: A policy framework.Umanyano Publications, Johannesburg.Alexander, W J R (1990). Flood hydrology for SouthernAfrica. SANCOLD, Pretoria.American Society of Civil Engineers (1982).Proceedings of the conference on stormwaterdetention facilities: Planning, design, operation andmaintenance. Edited by William De Groot. AmericanSociety of Civil Engineers, New York.APWA (1981). Urban Stormwater Management. APWASpecial report No 49. American Public WorksAssociation, Chicago.Ayers, R S (1977). Quality of water for irrigation.Journal of the Irrigation and Drainage Division, ASCE,103(IR2): pp 135-154.Bakhmeteff, B A (1932). Hydraulics for open channels.McGraw-Hill Book Company, New York.Batchelor, A (1993). Division of Water, Environmentand Forest Technology, <strong>CSIR</strong>. Personal Communication.Booysen, P de V and Tainton, N M (1984). Ecologicaleffects of fire in South African ecosystems. EcologicalStudy 48. Springer-Verlag, Berlin.Brink, A B A (1979). Engineering geology of SouthernAfrica. 4 Volumes. Building Publications, Pretoria.Burchard. W V and Hromadka, T V (1986). A simpleweir structure floodway bypass analysis program.Microsoftware for Engineers, Vol 2, No 4.Buttrick, D B and van Schalkwyk, M (1995). Themethod of scenario supposition for stability evaluationof sites on dolomitic land in South Africa. SAICEJournal, Fourth Quarter.Buttrick, D B and Roux, P (1993). The safety of highdensity informal settlements on the dolomites ofSouth Africa. Applied Karst Geology, Beck (ed.)Balkema, Rotterdam.Calitz, F (1993). Caring for the earth: a strategy forsustainable living. Council for Geoscience, inpartnership with the World Conservation Union, theUnited Nations Environment Programme and theWorld Wide Fund for Nature.Chow, V T (1959). Open-channel hydraulics. McGraw-Hill Book Company, New York.City of Durban, Drainage and Coastal EngineeringDepartment (1984). Guidelines for the design ofstormwater drainage systems.Committee of State Road Authorities (1994).Guidelines for the hydraulic design and maintenanceof river crossings. TRH 25. Division of Roads andTransport Technology, <strong>CSIR</strong>.Volume I : Hydraulics, hydrology and ecologyVolume VI : Risk analysis of river crossing failureVolume VII : Legal aspectsCottman, N H and McKay, G R (1990). Bridges andculverts reduced in size and cost by use of critical flowtransitions. Proceedings Institution of Civil Engineers,Part 1, June, pp 421-437.<strong>CSIR</strong>, Division of Building Technology (1995).Guidelines for the provision of engineering servicesand amenities in residential township development.Pretoria.<strong>CSIR</strong>, Division of Water, Environment and ForestryTechnology (1996). Strategic environmentalassessment (SEA): A primer. ISBN 0-7988-5245-3.<strong>CSIR</strong>, Stellenbosch.<strong>CSIR</strong> (1984). Technical guide to good houseconstruction. NBRI, <strong>CSIR</strong>. Pretoria. July.<strong>CSIR</strong>, NBRI (nd) Info sheet X/BOU 2034.Cumberland County Soil and Water ConservationDistrict (1993), Fact Sheet No. 5, 1A Karen Drive,Westbrook, Maine 04092.De Groot, W (1982). Stormwater Detention Facilities:Planning, design, operation and maintenance.Proceedings of the conference on stormwaterdetention facilities at New England College, Henniker,New Hampshire, August 2-6.Department of Agriculture. Directorate ResourceConservation (1995). Sustainable agriculture and thelaw: The way ahead. ISBN 0-621-16090-3. Pretoria.Department of Agriculture and Water Supply (1987).Declared weeds and alien invader plants in SouthAfrica. Bulletin 413. ISBN 0-621-10772-7. Research byHenderson, M, Fourie, D M C, Wells, M J andHenderson, L. Pretoria.Department of Environmental Affairs (1992a). Buildingthe foundation for sustainable development in SouthAfrica. ISBN 0-7988-5209-7. Pretoria.36Chapter 6Stormwater management
GUIDELINES FOR <strong>HUMAN</strong> <strong>SETTLEMENT</strong> <strong>PLANNING</strong> <strong>AND</strong> DESIGNDepartment of Environmental Affairs (1992b). Theintegrated environmental management procedure.Integrated Environmental Management GuidelineSeries 1 - 6. Pretoria.Department of Environmental Affairs & Tourism(1995). Wetlands of South Africa. Edited by G I Cowan.Pretoria.Department of Environmental Affairs & Tourism(1996). South African national report to the RamsarConvention. ISBN 0-621-17339-8. Pretoria.Department of Environmental Affairs, WeatherBureau (1986). Climate of South Africa: Climatestatistics up to 1984. Government Printer, Pretoria.Department of Water Affairs & Forestry (1981).Guidelines for development within areas susceptibleto flooding. Pretoria.Department of Water Affairs & Forestry (1994a).Minimum requirements for waste disposal by landfill.First edition. Waste management series. CTP BookPrinters, Cape Town.Department of Water Affairs & Forestry (1994b).Minimum requirements for the handling and disposalof hazardous waste. First edition. Waste managementseries. CTP Book Printers, Cape Town.Department of Water Affairs & Forestry (1994c).Minimum requirements for monitoring at wastemanagement facilities. First edition. Wastemanagement series. CTP Book Printers, Cape Town.Department of Water Affairs & Forestry (1995). Aguideline for groundwater protection for thecommunity water supply and sanitation programme.First edition. Pretoria.Donaldson, G W (1963). Sinkholes and subsidencecaused by subsurface erosion. RD 68 1973, NationalBuilding Research Institute, <strong>CSIR</strong>, Pretoria.Elges, H F W K (1985). Dispersive soils. The CivilEngineer in South Africa, July.Ellis, W S (1987). Africa’s stricken Sahel. NationalGeographic, Vol 172, No 2.Erskine, J M (1992). Vetiver grass: Its potential use insoil and moisture conservation in southern Africa. S AJournal of Science. No 88, p 298.Field, R (1985). Urban Runoff: Pollution sources,control and treatment. Water Resources BulletinVol 21, No 2. American Water Resources Association.Fischer, G J (1992). The selection of cemetery sites inSouth Africa. Engineering Geology Division, GeologicalSurvey of South Africa, Port Elizabeth.Forbes, H J C (1976). Capacity of lateral stormwaterinlets. The Civil Engineer in South Africa. September.Francis, J R D (1969). A text book of fluid mechanics.Edward Arnold Ltd, London.French, R H (1994). Open-channel hydraulics. McGraw-Hill, New York.Fuggle, R F and Rabie, M A (1992). Environmentalmanagement in South Africa. ISBN 0-7021-2847-3. Juta& Co Ltd. Cape Town.Gerber, F A and Harmse, H J v M (1980). ‘n Identifikasiemetode vir die identifisering van dispersiewe grond.Technical Report TR 104. Department of Water Affairs,Forestry & Environmental Affairs, South Africa.Gildenhuys, A (1981). Legal aspects concerningstormwater drainage. Paper presented at a seminar onUrban Stormwater Management held at Durban, CapeTown and Pretoria. National Building ResearchInstitute. <strong>CSIR</strong>, Pretoria.Gillette, B (1993). Everything’s ducky. American Cityand Council, Vol 108, No 2, February, pp 36-44.Golding, B L (1981). Flood routing program. CivilEngineering. ASCE, June, pp 74-75.Hager, W H (1987). Lateral flow over side weirs. Journalof Hydraulic Engineering, Vol 113, No 4, April. ASCE.Hauck, R D (1992). Treating wastewater in constructedwetlands. Biocycle BCYCDK, Vol 33, No 9, p72.September.Henderson, F M (1966). Open channel flow. Macmillan,New York.Henderson, L (1995). Plant invaders of southern Africa.ISBN 1-86849-026-2. Plant Protection ResearchInstitute, Agricultural Research Council, Pretoria.Jennings, J E and Brink, A B A (1978). Application ofgeotechnics to the solution of engineering problems -essential preliminary steps to relate the structure tothe soil which provides its support. Proceedings of theInstitution of Civil Engineers, Part 1, Vol 64, November,pp 57-589.Keller, R J (1989). Sloping crest crump weir. Journal ofIrrigation and Drainage Engineering, Vol 115, No 2,April, pp 231-238.Stormwater management Chapter 637
GUIDELINES FOR <strong>HUMAN</strong> <strong>SETTLEMENT</strong> <strong>PLANNING</strong> <strong>AND</strong> DESIGNKnight, K et al (1977). Stability of shale slopes in theNatal Coastal Belt. 5th Southeast Asian Conference ofSoil Engineering. Bangkok, Thailand. 2-4 July.Levin, R I (1987). Statistics for management. Fourthedition. Prentice-Hall, New Jersey.Linsley, R K, Kohler, M A, Paulus, J L H (1975).Hydrology for engineers. McGraw-Hill, Tokyo.Midgley, D C (1972). Design flood determination inSouth Africa. Report HRU 1/72. Hydrological ResearchUnit, University of the Witwatersrand, Johannesburg.Miles, L C (1984). Hydraulic components of stormwatermanagement. National Building Research Institute,R/Bou 1214, <strong>CSIR</strong>, Pretoria.Neethling, J, Potgieter, J M and Visser, P J (1990). Lawof delict. Butterworths, Durban.Oberholzer, L (1985). River bank stabilisation - analternative biological method. Veld and Flora. June,pp 39-41.Pansegrouw, J P (1990). A new friction relation fordetermining flood-lines. IMIESA, Nov/Dec, pp 28-31.Perchalski, F R and Higgins, J M (1988). Pinpointingnonpoint pollution. ASCE, Feb.Petrie, J G, Burns, Y M and Bray, W (1992).Environmental management in South Africa, Chapter17. Edited by Fuggle, R F and Rabie, M A. Juta & CoLtd. Cape Town.Platford, G G (1990). Protection of stream banks anddrainage lines. South African Sugar Journal, Vol 74,No 3, pp 79-82, March.Pulles, W, Howie, D, Otto, D, and Easton, J (1996). Amanual on mine water treatment and managementpractices in South Africa. WRC Report TT 80/96. WaterResearch Commission, Pretoria.Reese, A J and Maynord, S T (1987). Design of spillwaycrests. Journal of Hydraulic Engineering, Vol 113, No 4,April.Reily, J M (1992). Treating and reusing industrialwastewater. Water, Environment & Technology, Vol 4,No 11, pp 52-53. November.Rhomberg, E J, Mason, J M (1982). Responsibility forrunoff control. Public Works. November, pp 60-62.Roesner, L. and Matthews, R (1990). Stormwatermanagement for the 1990s. American City & County.February.Rooseboom, A, Basson, M S, Loots, M S, Wiggett, J Hand Bosman, J (1981). Handleiding vir paddreinering.1st Edition. National Transport Commission,Directorate Land Transport, Pretoria.Roux, P (1991). Geotegniese ondersoeke virdorpsontwikkeling in dolomietgebiede. Memoir 78,Department of Mineral and Energy Affairs.Government Printer, Pretoria.SABS 1200:1986. Standardized specification for civilengineering construction. South African Bureau ofStandards, Pretoria.SA Government Gazette (1986). Dams with a safetyrisk. Regulation Gazette No 3979, Vol 253, No 10366.Government Notice No R. 1559. 25 July.SA Institution of Civil Engineers (1985). Problem soils inSouth Africa - State of the art symposium. The CivilEngineer in South Africa, Vol 27, No 7, July.Sandvik, A (1985). Proportional weirs for stormwaterpond outlets. Civil Engineering, ASCE. March.Sartor, J D et al (1984). Street sweeping as a waterpollution control measure: Lessons learned over thepast ten years. The Science of the Total Environment,Vol 33, pp 171-183.Schwartz, H I and Culligan, P T (1976). Roof drainageof large buildings in South Africa. The Civil Engineer inSouth Africa, August.South African Natural Heritage Programme (1996).Annual report 1995/1996. ISBN 0-621-16920-X.Schneider Electric South Africa, Johannesburg.The Institute of Water Pollution Control (SouthernAfrican Branch) (1973). A guide to the design ofwastewater purification works. Johannesburg.The Water Institute of Southern Africa (1988). Manual onthe design of small sewage works. ISBN 0-620-11110 0.Halfway House.Transkei Department of Agriculture & Forestry.Engineering Services Branch. Rural DevelopmentDivision (1992). Proposed guidelines for theconstruction and maintenance of stock dams. Umtata.Treadaway, D (1989). Putting the squeeze on America’slandfills. American City & County. August.United Nation’s Agenda 21 (1992). Earth Summit inJune at the United Nations Conference onEnvironment and Development (UNCED) in Rio deJaneiro, Brazil.38Chapter 6Stormwater management
GUIDELINES FOR <strong>HUMAN</strong> <strong>SETTLEMENT</strong> <strong>PLANNING</strong> <strong>AND</strong> DESIGNUnited Nations Centre on Transnational Corporations(1990). Criteria for sustainable developmentmanagement. United Nations, New York.US Department of Agriculture (1987). Stability designof grass-lined open channels. Agriculture HandbookNumber 667. US Government Printing Office,Washington DC.US Department of the Interior (1987). Design of smalldams: A water resource technical publication. Thirdedition, United States Government Printing Office.Denver, Colorado.US Dept of Transportation (1978). Hydraulics of bridgewaterways. Hydraulic Design Series No 1. USGovernment Printing Office, Washington DC.US Dept of Transportation (1983). Hydraulic design ofenergy dissipators for culverts and channels. HydraulicEngineering Circular No 14. Report No FHWA-EPD-86-110. National Technical Information Service,Springfield, Virginia.US Dept of Transportation (1985). Hydraulic design ofhighway culverts. Hydraulic Design Series No 5. ReportNo FHWA-IP-85-15. National Technical InformationService, Springfield, Virginia.Van Eeden, M (1988). Gronderosie verwoes kosbareland. Innovo, Vol 6, October. Department of LocalGovernment, Housing & Agriculture. GovernmentPrinter, Pretoria.Walmsley, D (1987). A rationale for the developmentof a national wetland research programme.Unpublished paper read at working group for wetlandresearch, 12 August.Water Research Commission (1996). Adaption andcalibration of an urban runoff quality model. WRCReport No 298/1/96.Whipple, W (1991). Best management practices forstorm water and infiltration control. Water ResourcesBulletin, Paper No 91125, Vol 27, No 6. AmericanWater Resources Association. New Jersey.Wood, A (1990). Application of constructed reedbedsfor wastewater treatment in South Africa. Steffen,Robertson & Kirsten, Johannesburg.LEGISLATION CITEDAtmospheric Pollution Prevention Act (Act No 45 of 1965).Conservation of Agricultural Resourses Act (Act No 43of 1983.Environment Conservation Act (Act No 73 of 1989).Forestry Act (Act No 72 of 1968).General Effluent Standards (Government Gazette, No.9225 18 May, 1984).Government Gazette Regulation Gazette No 3979, Vol25, No 10366. Government Notice No R1559.Health Act (Act No 63 of 1977).Minerals Act (Act No 50 of 1991) and its Regulations.National Roads Act (Act No 54 of 1971).National Water Act (Act No 36 of 1998).White papers involving water law, water supply andsanitation (DWAF)CASE LAWBarklie v Bridle, 1956 (2) SA 103 (S.R.).Herbert Holbrow (Pty) Ltd v Cape Divisional Council,1988 (1) SA 387(c).Johannesburg Municipality v Jolly, 1915 TPD 432.New Heriot Gold Mining v Union Government(Minister of Railways and Harbours), 1916 AD 415, 421.Redelinghuis v Bazzoni, 1975 AD 110(T).Stormwater management Chapter 639
GUIDELINES FOR <strong>HUMAN</strong> <strong>SETTLEMENT</strong> <strong>PLANNING</strong> <strong>AND</strong> DESIGN40Chapter 6Stormwater management
Chapter 7Roads: Geometric design andlayout planning7
GUIDELINES FOR <strong>HUMAN</strong> <strong>SETTLEMENT</strong> <strong>PLANNING</strong> <strong>AND</strong> DESIGNTABLE OF CONTENTSSCOPE . . . . . . . . . . . . . . . . . . . . . . . . . . . . . . . . . . . . . . . . . . . . . . . . . . . . . . . . . . . . . . . . . . . . . . . . . . . 1INTRODUCTION. . . . . . . . . . . . . . . . . . . . . . . . . . . . . . . . . . . . . . . . . . . . . . . . . . . . . . . . . . . . . . . . . . . . 1Reference to planning . . . . . . . . . . . . . . . . . . . . . . . . . . . . . . . . . . . . . . . . . . . . . . . . . . . . . . . . . . . . . . 1Classification of the road and street system. . . . . . . . . . . . . . . . . . . . . . . . . . . . . . . . . . . . . . . . . . . . . . 2Measures of effectiveness (MOE) . . . . . . . . . . . . . . . . . . . . . . . . . . . . . . . . . . . . . . . . . . . . . . . . . . . . . . 3Traffic calming . . . . . . . . . . . . . . . . . . . . . . . . . . . . . . . . . . . . . . . . . . . . . . . . . . . . . . . . . . . . . . . . . . . . 4BASIC DESIGN PARAMETERS. . . . . . . . . . . . . . . . . . . . . . . . . . . . . . . . . . . . . . . . . . . . . . . . . . . . . . . . . . 4The design vehicle. . . . . . . . . . . . . . . . . . . . . . . . . . . . . . . . . . . . . . . . . . . . . . . . . . . . . . . . . . . . . . . . . . 4The design driver . . . . . . . . . . . . . . . . . . . . . . . . . . . . . . . . . . . . . . . . . . . . . . . . . . . . . . . . . . . . . . . . . . 5The road surface . . . . . . . . . . . . . . . . . . . . . . . . . . . . . . . . . . . . . . . . . . . . . . . . . . . . . . . . . . . . . . . . . . . 5THE ELEMENTS OF DESIGN . . . . . . . . . . . . . . . . . . . . . . . . . . . . . . . . . . . . . . . . . . . . . . . . . . . . . . . . . . . 6Design speed. . . . . . . . . . . . . . . . . . . . . . . . . . . . . . . . . . . . . . . . . . . . . . . . . . . . . . . . . . . . . . . . . . . . . . 6Ceiling speed . . . . . . . . . . . . . . . . . . . . . . . . . . . . . . . . . . . . . . . . . . . . . . . . . . . . . . . . . . . . . . . . . . . . . 6Design hour . . . . . . . . . . . . . . . . . . . . . . . . . . . . . . . . . . . . . . . . . . . . . . . . . . . . . . . . . . . . . . . . . . . . . . 6SIGHT DISTANCE . . . . . . . . . . . . . . . . . . . . . . . . . . . . . . . . . . . . . . . . . . . . . . . . . . . . . . . . . . . . . . . . . . . 8Stopping sight distance (SSD) . . . . . . . . . . . . . . . . . . . . . . . . . . . . . . . . . . . . . . . . . . . . . . . . . . . . . . . . . 8Barrier sight distance (BSD) . . . . . . . . . . . . . . . . . . . . . . . . . . . . . . . . . . . . . . . . . . . . . . . . . . . . . . . . . . 8Decision sight distance (DSD) . . . . . . . . . . . . . . . . . . . . . . . . . . . . . . . . . . . . . . . . . . . . . . . . . . . . . . . . 10Passing sight distance (PSD) . . . . . . . . . . . . . . . . . . . . . . . . . . . . . . . . . . . . . . . . . . . . . . . . . . . . . . . . . 10Intersection sight distance (ISD) . . . . . . . . . . . . . . . . . . . . . . . . . . . . . . . . . . . . . . . . . . . . . . . . . . . . . . 10HORIZONTAL ALIGNMENT . . . . . . . . . . . . . . . . . . . . . . . . . . . . . . . . . . . . . . . . . . . . . . . . . . . . . . . . . . 13Tangents . . . . . . . . . . . . . . . . . . . . . . . . . . . . . . . . . . . . . . . . . . . . . . . . . . . . . . . . . . . . . . . . . . . . . . . . 14Curvature and superelevation . . . . . . . . . . . . . . . . . . . . . . . . . . . . . . . . . . . . . . . . . . . . . . . . . . . . . . . 14Superelevation runoff. . . . . . . . . . . . . . . . . . . . . . . . . . . . . . . . . . . . . . . . . . . . . . . . . . . . . . . . . . . . . . 14VERTICAL ALIGNMENT . . . . . . . . . . . . . . . . . . . . . . . . . . . . . . . . . . . . . . . . . . . . . . . . . . . . . . . . . . . . . 15Curvature . . . . . . . . . . . . . . . . . . . . . . . . . . . . . . . . . . . . . . . . . . . . . . . . . . . . . . . . . . . . . . . . . . . . . . . 15Gradients. . . . . . . . . . . . . . . . . . . . . . . . . . . . . . . . . . . . . . . . . . . . . . . . . . . . . . . . . . . . . . . . . . . . . . . . 17Climbing lanes . . . . . . . . . . . . . . . . . . . . . . . . . . . . . . . . . . . . . . . . . . . . . . . . . . . . . . . . . . . . . . . . . . . 18CROSS-SECTION DESIGN . . . . . . . . . . . . . . . . . . . . . . . . . . . . . . . . . . . . . . . . . . . . . . . . . . . . . . . . . . . . 19Roads: Geometric design and layout planning Chapter 7i
GUIDELINES FOR <strong>HUMAN</strong> <strong>SETTLEMENT</strong> <strong>PLANNING</strong> <strong>AND</strong> DESIGNLanes . . . . . . . . . . . . . . . . . . . . . . . . . . . . . . . . . . . . . . . . . . . . . . . . . . . . . . . . . . . . . . . . . . . . . . . . . . . 19Shoulders . . . . . . . . . . . . . . . . . . . . . . . . . . . . . . . . . . . . . . . . . . . . . . . . . . . . . . . . . . . . . . . . . . . . . . . 21Medians and outer separators . . . . . . . . . . . . . . . . . . . . . . . . . . . . . . . . . . . . . . . . . . . . . . . . . . . . . . . 22Verges . . . . . . . . . . . . . . . . . . . . . . . . . . . . . . . . . . . . . . . . . . . . . . . . . . . . . . . . . . . . . . . . . . . . . . . . . 22Sidewalks . . . . . . . . . . . . . . . . . . . . . . . . . . . . . . . . . . . . . . . . . . . . . . . . . . . . . . . . . . . . . . . . . . . . . . . 22Slopes . . . . . . . . . . . . . . . . . . . . . . . . . . . . . . . . . . . . . . . . . . . . . . . . . . . . . . . . . . . . . . . . . . . . . . . . . . 24INTERSECTIONS . . . . . . . . . . . . . . . . . . . . . . . . . . . . . . . . . . . . . . . . . . . . . . . . . . . . . . . . . . . . . . . . . . . 24Introduction . . . . . . . . . . . . . . . . . . . . . . . . . . . . . . . . . . . . . . . . . . . . . . . . . . . . . . . . . . . . . . . . . . . . . 24Location of intersections. . . . . . . . . . . . . . . . . . . . . . . . . . . . . . . . . . . . . . . . . . . . . . . . . . . . . . . . . . . . 25The types of intersection control . . . . . . . . . . . . . . . . . . . . . . . . . . . . . . . . . . . . . . . . . . . . . . . . . . . . .26The form of intersections . . . . . . . . . . . . . . . . . . . . . . . . . . . . . . . . . . . . . . . . . . . . . . . . . . . . . . . . . . . 28Intersection components . . . . . . . . . . . . . . . . . . . . . . . . . . . . . . . . . . . . . . . . . . . . . . . . . . . . . . . . . . . 29Mini-roundabouts . . . . . . . . . . . . . . . . . . . . . . . . . . . . . . . . . . . . . . . . . . . . . . . . . . . . . . . . . . . . . . . . . 32BIBLIOGRAPHY . . . . . . . . . . . . . . . . . . . . . . . . . . . . . . . . . . . . . . . . . . . . . . . . . . . . . . . . . . . . . . . . . . . 35iiChapter 7Roads: Geometric design and layout planning
GUIDELINES FOR <strong>HUMAN</strong> <strong>SETTLEMENT</strong> <strong>PLANNING</strong> <strong>AND</strong> DESIGNLIST OF TABLESTable 7.1 Comparison between classification systems . . . . . . . . . . . . . . . . . . . . . . . . . . . . . . . . . . . . . . . .3Table 7.2 Dimensions of design vehicles (m) (after Wolhuter and Skutil 1990) . . . . . . . . . . . . . . . . . . . . .4Table 7.3 Minimum turning radii . . . . . . . . . . . . . . . . . . . . . . . . . . . . . . . . . . . . . . . . . . . . . . . . . . . . . . . .5Table 7.4 Brake force coefficients . . . . . . . . . . . . . . . . . . . . . . . . . . . . . . . . . . . . . . . . . . . . . . . . . . . . . . . .6Table 7.5 Recommended design and ceiling speed . . . . . . . . . . . . . . . . . . . . . . . . . . . . . . . . . . . . . . . . . .7Table 7.6 Stopping sight distance on level roads . . . . . . . . . . . . . . . . . . . . . . . . . . . . . . . . . . . . . . . . . . . .8Table 7.7 Barrier sight distance . . . . . . . . . . . . . . . . . . . . . . . . . . . . . . . . . . . . . . . . . . . . . . . . . . . . . . . . . .9Table 7.8 Decision sight distance on level roads . . . . . . . . . . . . . . . . . . . . . . . . . . . . . . . . . . . . . . . . . . . .10Table 7.9 Passing sight distance on level roads . . . . . . . . . . . . . . . . . . . . . . . . . . . . . . . . . . . . . . . . . . . .10Table 7.10 Pedestrian sight distance . . . . . . . . . . . . . . . . . . . . . . . . . . . . . . . . . . . . . . . . . . . . . . . . . . . . . .13Table 7.11 Maximum superelevation for various classes of road . . . . . . . . . . . . . . . . . . . . . . . . . . . . . . . .14Table 7.12 Minimum radii for horizontal curves (m) . . . . . . . . . . . . . . . . . . . . . . . . . . . . . . . . . . . . . . . . .14Table 7.13 Rates and minimum lengths of superelevation runoff . . . . . . . . . . . . . . . . . . . . . . . . . . . . . . .15Table 7.14 Minimum values of K for vertical curves . . . . . . . . . . . . . . . . . . . . . . . . . . . . . . . . . . . . . . . . . .16Table 7.15 Minimum length of vertical curves . . . . . . . . . . . . . . . . . . . . . . . . . . . . . . . . . . . . . . . . . . . . . .17Table 7.16 Maximum gradients on major roads (%). . . . . . . . . . . . . . . . . . . . . . . . . . . . . . . . . . . . . . . . . .17Table 7.17 Traffic volume warrants for climbing lanes . . . . . . . . . . . . . . . . . . . . . . . . . . . . . . . . . . . . . . . .19Table 7.18 Typical width of verge elements . . . . . . . . . . . . . . . . . . . . . . . . . . . . . . . . . . . . . . . . . . . . . . . .23Table 7.19 LOS criteria for sidewalk width . . . . . . . . . . . . . . . . . . . . . . . . . . . . . . . . . . . . . . . . . . . . . . . . .24Table 7.20 Taper rates . . . . . . . . . . . . . . . . . . . . . . . . . . . . . . . . . . . . . . . . . . . . . . . . . . . . . . . . . . . . . . . . .30Table 7.21 Typical edge treatments for left turns . . . . . . . . . . . . . . . . . . . . . . . . . . . . . . . . . . . . . . . . . . . .30Table 7.22 Design traffic conditions . . . . . . . . . . . . . . . . . . . . . . . . . . . . . . . . . . . . . . . . . . . . . . . . . . . . . .32Table 7.23 Turning roadway widths (m) . . . . . . . . . . . . . . . . . . . . . . . . . . . . . . . . . . . . . . . . . . . . . . . . . . . . . .33Roads: Geometric design and layout planning Chapter 7iii
GUIDELINES FOR <strong>HUMAN</strong> <strong>SETTLEMENT</strong> <strong>PLANNING</strong> <strong>AND</strong> DESIGNLIST OF FIGURESFigure 7.1 Truck speed on grades . . . . . . . . . . . . . . . . . . . . . . . . . . . . . . . . . . . . . . . . . . . . . . . . . . . . . . . . .5Figure 7.2 Stopping sight distance on gradients . . . . . . . . . . . . . . . . . . . . . . . . . . . . . . . . . . . . . . . . . . . . .9Figure 7.3 Minimum horizontal radius for stopping sight distance . . . . . . . . . . . . . . . . . . . . . . . . . . . . . . .9Figure 7.4 Intersection sight distance for turning manoeuvre . . . . . . . . . . . . . . . . . . . . . . . . . . . . . . . . .11Figure 7.5 Intersection sight distance for crossing manoeuvre . . . . . . . . . . . . . . . . . . . . . . . . . . . . . . . . .12Figure 7.6 Intersection sight distance for yield condition . . . . . . . . . . . . . . . . . . . . . . . . . . . . . . . . . . . . .12Figure 7.7 Elements of the cross-section . . . . . . . . . . . . . . . . . . . . . . . . . . . . . . . . . . . . . . . . . . . . . . . . . . .20Figure 7.8 Typical bus stop layouts . . . . . . . . . . . . . . . . . . . . . . . . . . . . . . . . . . . . . . . . . . . . . . . . . . . . . . .23Figure 7.9 Angles of skew . . . . . . . . . . . . . . . . . . . . . . . . . . . . . . . . . . . . . . . . . . . . . . . . . . . . . . . . . . . . . .27Figure 7.10 Layout of island . . . . . . . . . . . . . . . . . . . . . . . . . . . . . . . . . . . . . . . . . . . . . . . . . . . . . . . . . . . . .32ivChapter 7Roads: Geometric design and layout planning
GUIDELINES FOR <strong>HUMAN</strong> <strong>SETTLEMENT</strong> <strong>PLANNING</strong> <strong>AND</strong> DESIGNSCOPEIn this chapter the major objectives are to• stress the importance of geometric design, givingexpression to planning concepts;• emphasise the revised approach to the roadhierarchy;• suggest the importance of satisfying the needs ofall road users, both vehicular and non-vehicular;and• provide guidelines for detailed geometric designthat will result in a safe, efficient, affordable andconvenient road and street system.INTRODUCTIONReference to planningThe ultimate objective in the creation of an urbanplace is that it should be such that people would wishto live, work and play there. This can only be achievedby the closest co-operation between the planner andthe geometric designer, because the ultimate layout ofthe street system effectively defines the urban area interms of its functionality and, hence, its attractivenessto the inhabitants.These two disciplines must also interact closely withthe other disciplines involved in the provision ofservices to the inhabitants. As streets also form sets ofconduits along which essential services such as watersupply, sewerage and power are conducted, theyshould be so located that they do not unnecessarilyconstrain the provision of these services.This chapter of the guidelines cannot, therefore, beread in isolation.Both the planner and the designer are required toadopt a more holistic approach to determination ofthe street network than has previously been the case.They may find it useful to consider the total width ofthe cross-section as being hard open space, only partof which is dedicated to the movement function. Thispart of the cross-section is roughly equivalent to theroad reserve as previously understood and is stillrequired to address a range of trip purposes, tripcomponents and modes of travel.With regard to modes of travel, the design of the streetnetwork was historically predicated almost exclusivelyon the passenger car. Many trip makers will, however,always be reliant on walking or public transport as theonly modes available to them. Furthermore, it is notpossible to endlessly upgrade the street network interms of a growing population of passenger cars.Road design should, therefore, not only accommodatepublic transport but actively seek toencourage its use. Adding embayed bus stops to aroute essentially designed for passenger cars does notconstitute support for the promotion of publictransport.Obviously, bus routes should be designed with the busas the design vehicle. This selection of design vehicleimpacts, inter alia, on decisions concerning maximumgradients, lane widths and provision for bus stops. Adesignated bus route should have a horizontalalignment planned to enhance the attractiveness ofthe route to would-be passengers and also be highlyaccessible to pedestrians by ensuring that walkingdistances to the nearest bus stop are minimised.Dedicated bus lanes should be provided in areas wherethe volume of bus or other high-occupancy vehicleswarrants their use. The dedicated bus lane implies thatthe street will essentially be a shared facility servingother modes of transport as well. The high volumes ofbus traffic that are typically achieved when a numberof bus routes converge on the CBD or some othertransport hub may suggest that dedicated bus routes,as opposed to bus lanes, become a practical option.The distinction drawn between geometric planning andgeometric design is not always clear. In this document,geometric planning is described in Chapter 5: PlanningGuidelines. A brief exposition of the differencebetween planning and design is offered below.Geometric planningPlanning addresses the broad concepts in terms ofwhich the functions of the various links in thestreet network are defined. These concepts addressthe sum of human activity, whether economic(which can be formal or informal), recreational orsocial - the latter including educational, health careand worship activities. In this context, it is pointedout that movement is a derived activity or demand.Previously, both planning and design tended tofocus on areas being dedicated to single land-use,thus forcing a need for movement between theliving area and any other. Current planningphilosophies favour the abandonment of single usein favour of mixed use. Mixed use suggests thatpeople can both live and work in one area. Notonly will this have the practical effect of reducingthe demand for movement over long distances but,where movement is still necessary, it will supportchange of the mode of movement because, overshort distances, walking and cycling are practicaloptions. This will further reduce the areal extentrequired to be dedicated to movement. Conceptualplanning leads to the definition of corridorsintended to support some or other activity, one ofwhich is movement.Roads: Geometric design and layout planning Chapter 71
GUIDELINES FOR <strong>HUMAN</strong> <strong>SETTLEMENT</strong> <strong>PLANNING</strong> <strong>AND</strong> DESIGNCorridors, in association with their intendedfunctions, will ultimately define the horizontalalignment of the streets located in them. A needfor high traffic speeds will suggest high values ofhorizontal radius, whereas reductions in radiuscould be applied to force speeds down to matchactivities involving a mix of vehicular and nonvehiculartraffic. Reduction of the lengths oftangents between curves or intersections couldserve the same purpose.The dominant function of the corridor defines thevertical alignment in terms of maximum andminimum acceptable gradients, vertical curvatureand length of grade. For example, streets with apredominantly pedestrian function should ideally beflat, whereas - if movement includes provision for abus route - modest gradients are allowable. Routesintended principally for the movement of vehiclesother than buses may be steeper although, wherevery high volumes are anticipated, the adverseeffect of steep gradients must be borne in mind.Function is defined in terms of two primecomponents, namely the nature and the extent ofdemand. As such, it is the major informant of thedesign of the cross-section. The demand may be forhigh-speed, high-volume traffic flows, in whichcase the cross-section would comprise more thanone moving lane in each direction, possibly with amedian between the opposing flows and shouldersas opposed to sidewalks. On the other hand, if thedemand is for predominantly pedestrian/commercial activity, very wide sidewalks (i.e. widerthan would be required merely to accommodate avolume of moving pedestrians) would be necessaryto allow for sidewalk cafes, roadside vending andbrowsing or window shopping. While vehicleswould not necessarily be excluded, their presencewould not be encouraged and speeds would beforced down by having few and narrow lanes andvery short tangent lengths.Geometric designDesign is principally concerned with converting tophysical dimensions the constraints introduced byplanning concepts. Ongoing reference to thechapter on Planning is necessary to ensure that theroad as ultimately designed matches the intentionsregarding its function. It is important to realise thatthe function of the road reserve is broader thanmerely the accommodation of moving traffic whichmay be either vehicular or pedestrian. Althoughgeometric design tends to focus on movement, theother functions must be accommodated. If thedesigner does not adopt this wider perspective, themost likely consequence would be that the originalintention - “the creation of an urban place thatshould be such that people would wish to live, workand play there” - would be severely compromised.The goals of transportation as propounded by theDriessen Commission are the economic, safe andconvenient movement of people and goods with aminimum of side-effects. These goals areunchanged. It must be understood that, in arrivingat an acceptable street design, these goals applyequally to all modes of travel. In this respect, it willinvariably be necessary to seek compromisesbetween the various modes. The one goal seen asbeing non-negotiable is safety. For example, thesafety of pedestrians cannot be compromised inpursuit of convenience of vehicular travel.Classification of the road and streetsystemThe traditional five-level hierarchy of streets haseffectively been abandoned, principally because itplaced an over-emphasis on the vehicular movementfunction of the street system. The concept of ahierarchy also implicitly carried with it the notion ofone part of the network being more important thananother. The network comprises a system ofinterlinking streets serving different functions, andoften serving these different functions differently.Over-emphasis of the importance of one link at thecost of another does not only constitute poor design;it can place the network as a whole in jeopardy. In fact,all parts of the network require equal consideration.To assist designers in developing some understandingof the new classification system, Table 7.1, offering acomparison between the previous five-tier system, theUrban Transport Guideline (UTG) series, and thatcurrently employed, is shown below.It should, however, be clearly understood that there isnot a one-to-one relationship between the current andthe other classifications. The five-tier and the UTGclassification systems are limited to addressingmovement in terms of a spectrum of accessibility versusmobility, whereas the current classification addressesall functions of roads and streets. Reference should bemade to Chapter 5.1: Movement Networks, in whichthe classification system is comprehensively described.Mixed routes forming part of the “movementnetwork” classification can be subdivided into “higherorder”,“middle-order” and “lower-order” routes.Higher-order routes would carry higher volumes oftraffic and/or accommodate higher levels of economicactivity, whereas lower-order routes would principallyaddress local and access-seeking traffic andaccommodate higher levels of recreational activity.Middle-order routes serve primarily as links betweenhigher- and lower-order routes. It would thus beunwise to regard the appellation of “higher-order” asan invitation to reach for, say, UTG 5.The five-tier system subdivided Class 5 streets into afurther six sub-classes, two of which could be loosely2Chapter 7Roads: Geometric design and layout planning
GUIDELINES FOR <strong>HUMAN</strong> <strong>SETTLEMENT</strong> <strong>PLANNING</strong> <strong>AND</strong> DESIGNTable 7.1:Comparison between classification systemsMOVEMENT NETWORK FIVE-TIER SYSTEM URBAN TRANSPORT GUIDELINES (UTG SERIES)Vehicle-only route 1 Regional distributor (Freeways not included)2 Primary distributor Major arterial (UTG1)Mixed pedestrian and 3 District distributor Minor arterial (UTG1)Vehicle route4 Local distributor Collector (UTG15)5 Access street Local street (UTG7 &10)Pedestrian-only route(not applicable)classified as being pedestrian-only. The UTG series doesnot address either freeways or pedestrian-only routes.UTG 10 addresses local commercial and industrialstreets which fall outside the ambit of this document.Measures of effectiveness (MOE)Geometric design is primarily concerned with theassemblage of a group of components leading to thecreation of an operating system. As a case in point, thecross-section is not whole and indivisible: it is, in fact,heavily disaggregated. In the preparation of a design,it is thus necessary not only to be aware of the variousfunctions that the geometric design is intended toserve but also to be able to measure the extent towhich the often conflicting functions are served.Invariably, the local authority will specify that thefacility provided should meet some or other specifiedlevel of utility. Measures of effectiveness (MOE) arethus required.With regard to movement, MOEs can relate either tomanagement of the operation of infrastructure, or tothe provision of infrastructure.In the former case, reference is to TransportationSystem Management (TSM) and its strategies andprocesses, all of which have MOEs associated withthem. Reference should be made to Guidelines for thetransportation system management process (1991),Pretoria: Committee of Urban Transport Authorities(Draft Urban Transport Guidelines: UTG 9). Thisdocument is available from the National Departmentof Transport.Management is aimed at enhancing the productivityof the system as provided. A well- managed systemcould, with a lesser extent of infrastructure,conceivably accommodate the same demand formovement as an unmanaged system. By the sametoken, a design that is sensitive to the possibilitiescontained in good management would result in ahighly efficient use of space.A lesser extent of infrastructure implies that more landis available for other applications and the capitaloutlay involved in infrastructure provision per erf islessened. This benefit applies directly to all aspects ofcommunity life. Residential properties are renderedmore affordable because the costs incurred in servicingthem inevitably impact on property prices. Thefinancial return from commercial properties isenhanced because the lower land price has an effecton the business overheads of the occupier. In short,commercial activities can become more competitive.MOEs that refer to the provision of infrastructureinvariably refer to the Transportation Research BoardSpecial Report 209: Highway Capacity Manual (HCM),the most recent edition of which was issued in 1994.This manual is in general use in South Africa. Themanual comprehensively addresses the entirespectrum of modes of movement, and all aspects ofthe road or street network, from freeways toresidential streets to intersections. The HCMpropounds a philosophy of Levels of Service (LOS) and,in general, refers to five levels ranging from A to Ewith LOS A being the highest level and LOS Ecorresponding to capacity. The higher levels aretypically related to LOS E by utilising a volume-tocapacityor v/c ratio. The actual MOEs on which thelevels of service are based vary between the varioustypes of facility being analysed. Those applying to afreeway do not apply to a residential street or to asignalised intersection so that, although in all casesreference could be made to LOS A, what is intended isnot comparable between them.It is recommended that analysis be based on theHighway Capacity Manual, with due regard being paidto the practical benefits to be derived from theapplication of TSM measures.Roads: Geometric design and layout planning Chapter 73
GUIDELINES FOR <strong>HUMAN</strong> <strong>SETTLEMENT</strong> <strong>PLANNING</strong> <strong>AND</strong> DESIGNTraffic calmingTraffic calming refers to measures usually designed toreduce either the volume of moving vehicles or theirspeed. The intentions behind the application of trafficcalming can, however, be many and various. Inaddition to reductions in speed or volumes of traffic,they may include:• noise reduction;• reduction of air pollution; and• provision of safe areas for pedestrians or othernon-vehicular road users.Planning aimed at achieving these intentions reducesthe need for the introduction of traffic calmingmeasures which are essentially artificial devices such asspeed humps, chicanes, street narrowing devices, roadclosures and changes in surfacing colour or texture.Planning measures could include the selection of linklengths as a means of reducing variations in vehiclespeed. As a rule of thumb, a link length in metres thatis about ten times the desired speed in km/h wouldensure that a vehicle entering the link at less than thedesired speed is not likely to accelerate beyond it.Alternating priority control at the intersections alonga street would also serve as a restraint on excessivespeed, as would bounding the various links by threeleggedor T- intersections.Small-radius horizontal curvature would effectivelycause a reduction in traffic speeds. However, thisapplication is not recommended for general practice.Highly curvilinear alignments impact adversely on thecosts of provision of all the services normally locatedwithin the road reserve. Furthermore, pedestrianswould be subjected to unnecessarily long travel pathsbetween origin and destination.Should traffic calming measures be necessary, an areawideapproach is preferable to isolated measures. Theeffect is to impose the desired conditions over a widearea so that low speeds or volumes become part of thedrivers’ expectations in respect of the area beingtraversed. An isolated speed hump located where adriver does not expect it can result in loss of control ordamage to the vehicle itself.Traffic calming devices are discussed in detail inSchermers G and Theyse H (1996), National guidelinesfor traffic calming.BASIC DESIGN PARAMETERSThe design vehicleThe design vehicle is a composite rather than a singlevehicle. It thus represents a combination of the criticaldesign features of all the vehicles within a specific classweighted by the number of each make and modelvehicle found in the South African vehicle population.The dimensions offered in Table 7.2 were determinedby Wolhuter and Skutil (1990). The values quoted inthe table are 95 percentile values.Because of its application in the determination ofpassing sight distance, the fifth percentile value ofheight is selected. The height of passenger cars is thustaken as 1,3 m. A height of 2,6 m is adopted for allother vehicles.Two vehicles are recommended for use in the design ofurban roads. The passenger car should be used forspeed-related standards and the bus for standardsrelating to manoeuvrability, typically at intersections.The bus also dictates the maximum permissiblegradient. Designs must, however, be checked to ensurethat larger vehicles, such as articulated vehicles, can beaccommodated within the total width of the travelledway, even though they may encroach on adjacent oreven opposing lanes. Should these larger vehiclescomprise more than 10% of the traffic stream, it willbe necessary to use them as the design vehicle.In constricted situations where templates for turningmovements are not appropriate, the capabilities of thedesign vehicle become critical. Ninety-five percentilevalues of minimum turning radii for the outer side ofthe vehicle are given in Table 7.3. It is stressed thatthese radii are appropriate only to crawl speeds.Truck speeds on various grades have been the subjectof much study under southern African conditions. Busspeeds are similar and it has been found thatTable 7.2: Dimensions of design vehicles (m) (after Wolhuter and Skutil 1990)VEHICLE WHEEL BASE FRONT OVERHANG REAR OVERHANG WIDTHPassenger car (P) 3,1 0,7 1,0 1,8Single unit (SU) 6,1 1,2 1,8 2,5Single unit + trailer (SU +T) 6,7+3,4*+6,1 1,2 1,8 2,5Single unit bus (BUS) 7,6 2,1 2,6 2,6Semi-trailer (WB-15) 6,1+9,4 0,9 0,6 2,5* Distance between SU rear wheels and trailer front wheels4Chapter 7Roads: Geometric design and layout planning
GUIDELINES FOR <strong>HUMAN</strong> <strong>SETTLEMENT</strong> <strong>PLANNING</strong> <strong>AND</strong> DESIGNTable 7.3:VEHICLEMinimum turning radiiMIN RADIUS (m)drivers an eye height of 1,8 m or more. These valueshave accordingly been adopted for use in theseguidelines.Passenger car (P) 6,2Single unit (SU) 12,8Single unit + trailer (SU+T) 14,0Single unit bus (BUS) 13,1Semi-trailer (WB-15) 13,7performance is not significantly affected by heightabove sea-level. Performance can therefore berepresented by a single family of curves calculated onthe basis of the 95 percentile mass/power ratio of 275kg/kW, and as shown in Figure 7.1.Pedestrians are also considered to be “design vehicles”in the sense that they are self-propelled, occupy spaceand have a measurable speed of movement. Whenbunched with others, while awaiting an opportunityto cross a street for example, the individual pedestrianoccupies a circular space of about 700 mm in diameter.Pedestrians on the move will, however, prefer to beone metre or more apart. Walking speed on average is1,5 m/s but in certain areas, such as in the vicinity ofold-age homes, hospitals and schools, allowanceshould be made for lower speeds.High volumes of pedestrians also invariably forcelower walking speeds. Under these circumstances,design should be predicated on a walking speed of1,0 m/s.The design driverResearch (Pretorius 1976, Brafman Bahar 1983) hasindicated that 95% of passenger car drivers have aneye height of 1,05 m or more, and 95% of bus or truckA figure of 2,5 seconds has been generally adopted forreaction time for response to a single stimulus.American practice also makes provision for a reactiontime of 5,7-10,0 seconds for more complex multiplechoicesituations. These extended times makeprovision for the case where more than one externalcircumstance must be evaluated, and the mostappropriate response selected and initiated.The road surfaceThe road surface has numerous qualities which canaffect the driver’s perception of the situation ahead,but skid resistance is the only one of these qualitiestaken into account in these guidelines.Skid resistance has been the subject of researchworldwide, and it has been locally established byMkhacane (1992) and Lea (1996) that the derivedvalues of brake force coefficient are appropriate to thesouthern African environment. Lea established that alimiting value of 0,4 is appropriate to gravel surfacesfor all speeds. This suggests that, for design purposes,a value not greater than 0,2 should be adopted forthese roads. With regard to surfaced roads, there is aconsiderable range of values. At 50 km/h the skidresistance of a worn tyre on a smooth surface is halfthat of a new tyre on a rough surface, and at 100 km/hit is five times lower. Skid resistance also depends onspeed, and reduces as speed increases.The speed used in the calculation of guideline values isthe operating speed, generally 80-85% of designspeed.10080Speed (km/h)6040206%1%2%3%4%5%00400 800 1200 1600 2000 2400 2800 3200 3600Distance along grade (m)Figure 7.1: Truck speed on gradesRoads: Geometric design and layout planning Chapter 75
GUIDELINES FOR <strong>HUMAN</strong> <strong>SETTLEMENT</strong> <strong>PLANNING</strong> <strong>AND</strong> DESIGNBrake-force coefficients are given in Table 7.4. Noallowance is made for a safety factor, as theserepresent actually measured values for a worn tyre ona smooth wet surface which, in engineering terms,constitutes a “worst case”.Where it is necessary to vary the design speed along asection of road because of topographic or otherlimiting features, care should be taken to ensure thatadequate transitions from higher to lower standardsare provided.Table 7.4:Brake force coefficientsCeiling speedSPEED (km/h)THE ELEMENTS OF DESIGNDesign speedCOEFFICIENTS20 0,4740 0,3760 0,3280 0,30100 0,29120 0,28Traffic speeds are measured and quoted in kilometresper hour. The Highway Capacity Manual(Transportation Research Board 1994) lists definitionsof ten different speeds, such as spot speed, time meanspeed, space mean speed, overall travel speed, runningspeed, etc. In this document, reference is principally todesign speed and operating speed.The design speed is a speed selected for the purposesof the design and correlation of those features of aroad (such as horizontal curvature, vertical curvature,sight distance and superelevation) upon which thesafe operation of vehicles depends. The design speedshould thus be regarded more in the nature of agrouping of various design standards rather than as aspeed per se.The operating speed is the highest running speed atwhich a driver can travel on a given road underfavourable weather and prevailing traffic conditionswithout, at any time, exceeding the design speed.Implicit in this definition of operating speed is the ideathat the design speed is also the maximum safe speedthat can be maintained on a given section of roadwhen traffic conditions are so favourable that thedesign features of the road govern the driver’sselection of speed.Sight should not be lost of the fact that a degree ofarbitrariness attaches to the concept of maximum safespeed. The absolute maximum speed at which anindividual driver is safe depends as much on thedriver’s skill and reaction time, the quality andcondition of the vehicle and its tyres, the weatherconditions and the time of day (insofar as this affectsvisibility) as on the design features of the road.In the urban situation, the need to vary the designspeed because of physically constraining features isnot likely to arise with any frequency. However,situations in which it is desirable to reduce operatingspeeds are common. Cases in point are areas wherelocalised high concentrations of pedestrian trafficprevail. Examples include in the vicinity of schools(with particular reference to primary and nurseryschools), old-age homes, modal transfer points andhospitals. Activity streets, where mixed usage mayprevail, may require low operating speeds oversubstantial distances.It would be extremely unwise to reduce the designspeed in these areas, since a reduction in the designspeed carries with it a reduction of sight distance. Withthe greater number of potential hazards that need tobe observed and responded to, the driver should beafforded as much sight distance, and hence reactiontime, as possible. In such areas, the design speedshould be increased rather than reduced. An increasein the design speed by a factor less than 1,2 is not likelyto produce any significant difference in operatingconditions as perceived by the driver.Clearly, however, the higher design speed should notserve as an inducement to increase operating speedand the concept of traffic calming would have to bebrought into play.Table 7.5 offers design and ceiling speeds appropriateto various classes of roads and streets. It should benoted that, ideally, shopping precincts such as mallsshould be so designed that vehicular access to them isnot necessary. Should this not be possible to achieve inpractice, access should be permitted only outsidenormal business hours. Parking areas serving shoppingprecincts should be designed to minimise vehiclepedestrianconflicts.Design hourIn the same way that a design speed is not a speed, thedesign hour is not an hour in the normal sense of theword. It is, in fact, a shorthand description of theconditions being designed for - specifically theprojected traffic conditions.These conditions include• traffic volume, measured in vehicles per hour;• traffic density, measured in vehicles per kilometre;6Chapter 7Roads: Geometric design and layout planning
GUIDELINES FOR <strong>HUMAN</strong> <strong>SETTLEMENT</strong> <strong>PLANNING</strong> <strong>AND</strong> DESIGNTable 7.5:Recommended design and ceiling speedCLASS OF ROAD DESIGN SPEED (km/h) CEILING SPEED (km/h)Vehicles only (freeways) 100 - 120 Not applicableVehicles only (other) 70 - 100 Not applicableMixed (higher order) 60 - 80 50 - 60Mixed (middle order) 40 - 60 30 - 50Mixed (lower order) 40 - 60 30 - 50Pedestrian 30 20 - 30Shopping precincts 30
GUIDELINES FOR <strong>HUMAN</strong> <strong>SETTLEMENT</strong> <strong>PLANNING</strong> <strong>AND</strong> DESIGNThis function is not quite as direct as the equationimplies because the basis of measurement differs.Density is measured across a considerable length ofstreet at a single point in time, whereas flow ismeasured at a single point in space over an extendedperiod of time. For this reason, the speed referred toin the above relationship is space mean speed asopposed to the more generally understood time meanspeed.It is the relationship between these measures whichdefines the Level of Service to be provided by thestreet being designed and, hence, the number ofmoving lanes to be provided in the cross-section.SIGHT DISTANCESight distance is a fundamental criterion in the designof any road or street. It is essential for the driver to beable to perceive hazards on the road, with sufficienttime in hand to initiate any required action safely. Ona two-lane two-way road it is also necessary for him orher to be able to enter the opposing lane safely whileovertaking. In intersection design, the application ofsight distance is slightly different from that applied indesign for the rest of the road or street system butsafety is always the chief consideration.Stopping sight distance (SSD)Stopping distance involves the ability of the driver tobring the vehicle safely to a standstill and is thus basedon speed, driver reaction time and skid resistance. Thetotal distance travelled in bringing the vehicle to astop has two components:• the distance covered during the driver’s reactionperiod; andareas, the object height can be increased to 0,6 m. Thisgreater height provides a practical design with anadequate margin of safety for the protection ofchildren, pets and other obstacles typicallyencountered on this class of street.Object height is also taken into account because, if thesight distance were measured to the road surface, thelength of the vertical curve required would besubstantially increased.This could result in streets being significantly above orbelow natural ground level. In the urban environmentwhere there is a need for access to adjacent propertiesat relatively short intervals, this is not acceptable.The gradient has a marked effect on the stoppingdistancerequirements. Figure 7.2 is an expansion ofTable 7.6, demonstrating this effect.Table 7.6:DESIGN SPEED(km/h)Stopping sight distance onlevel roadsSTOPPING SIGHT DISTANCE(m)30 3040 5050 6560 8070 9580 11590 135100 155110 180120 210• the distance required to decelerate to 0 km/h.The stopping distance is expressed as :where:s = 0,694 v + v 2 / 254 fs = total distance travelled (m)v = speed (km/h)f = brake force coefficientStopping sight distances are based on operatingspeeds. The brake-force coefficients quoted inTable 7.4 have been adopted for design, and thecalculated stopping sight distances are given inTable 7.6.Stopping sight distance is measured from an eyeheight of 1,05 m to an object height of 0,15 m in thecase of the higher-order roads. This object height isused because an obstacle of a lower height would notnormally represent a significant hazard. In residentialStopping sight distance can also be affected by a visualobstruction such as a garden wall or shrubbery next tothe lane on the inside of a horizontal curve, as shownin Figure 7.3.Barrier sight distance (BSD)Barrier sight distance is the limit below whichovertaking is legally prohibited. Two opposing vehiclestravelling in the same lane should be able to come toa standstill before impact. A logical basis for thedetermination of the barrier sight distance is thereforethat it should equal twice the stopping distance, plus afurther distance of 10 m to allow an additional safetymargin. The values given in Table 7.7 reflect thisapproach.Barrier sight distance is measured to an object heightof 1,3 m, with eye height remaining unaltered at1,05 m. The greater object height is realistic because itrepresents the height of a low approaching vehicle.8Chapter 7Roads: Geometric design and layout planning
GUIDELINES FOR <strong>HUMAN</strong> <strong>SETTLEMENT</strong> <strong>PLANNING</strong> <strong>AND</strong> DESIGN400350Stopping sight distance (m)30025020015010050120 km/h100 km/h80 km/h60 km/h40 km/h0-8-7 -6 -5 -4 -3 -2 -1 0 1 2 3 4 5 6 7 8Gradient (G) (%)Figure 7.2: Stopping sight distance on gradients220020001800MCLInside laneLine of sightM=4Minimum radius (m)1600140012001000800600ObstructionM=6M=8M=104002000R for designspeed40 60 80 100 120 140Design speed (km/h)Figure 7.3: Minimum horizontal radius for stopping sight distanceTable 7.7:DESIGN SPEED(km/h)Barrier sight distanceBARRIER SIGHT DISTANCE(m)40 11060 17080 240100 320120 430Hidden dip alignments are commonly considered to bepoor design practice. They typically mislead driversinto believing that there is more sight distanceavailable than actually exists. In checking thealignment in terms of barrier sight distance, thedesigner should pay detailed attention to areas wherethis form of alignment occurs, to ensure that driversare made aware of any inadequacies of design.Because of the low speeds involved and the typicallyshort lengths of lower-order mixed-usage streets, thepassing operation is of little significance so that barrierRoads: Geometric design and layout planning Chapter 79
GUIDELINES FOR <strong>HUMAN</strong> <strong>SETTLEMENT</strong> <strong>PLANNING</strong> <strong>AND</strong> DESIGNmarkings are seldom, if ever, employed on thesestreets.Decision sight distance (DSD)The best visual cue to the driver is the roadway ahead.For this reason it is necessary in certain circumstancesfor the road surface itself to be visible to the driver fora given distance ahead. This is to allow sufficient timefor the assimilation of a message and the safeinitiation of any action required. An example is themarking that allocates specific lanes at an intersectionto turning movements. Warning of this must be givensufficiently far in advance of the intersection to permita lane change that does not detrimentally affect theoperation of the intersection itself.lengthened or shortened. A further possibility is theprovision of a passing lane.Passing sight distance can be calculated on one of twobases, being either the sight distance required for asuccessful overtaking manoeuvre or that required foran aborted manoeuvre. The former could be describedas being a desirable standard and the latter as theminimum. Values quoted for the successful manoeuvreare taken from AASHTO (1994) and for the abortedmanoeuvre from Harwood and Glennon (1989), whobase these distances on the vehicles involved being apassenger car passing a bus or a truck.Table 7.9 lists passing sight distances in respect of bothsuccessful and aborted manoeuvres.Decision sight distance, as given in Table 7.8, is relatedto the reaction time involved in a complex driving task.The reaction time selected for this purpose is 7,5seconds, which is roughly the mean of values quoted inAmerican practice. The calculated values in Table 7.8are based on stopping sight distance to allow for thecondition where the decision is to bring the vehicle torest.Table 7.8:Decision sight distance onlevel roadsDESIGN SPEED (km/h) STOPPING SIGHT DISTANCE (m)40 13060 19080 240100 300120 350This has the effect of increasing the normal reactiontime of 2,5 seconds by a further five seconds of travelat the design speed of the road. Decision sightdistance is measured from an eye height of 1,05 m tothe road surface, i.e. to an object height of 0 m.Passing sight distance (PSD)In the case of vehicles-only and higher-order mixedusage streets, passing sight distance is an importantcriterion indicative of the quality of service providedby the road. The initial design is required to providestopping sight distance over the full length of theroad, with passing sight distance being checkedthereafter. A heavily trafficked road requires a higherproportion of passing sight distance than a lightlytrafficked road to provide the same level of service.Insufficient passing sight distance over a vertical curvecan be remedied, for example, either by lengtheningthe vertical curve to provide passing sight distancewithin the length of the curve itself, or by shorteningthe curve to extend the passing opportunities oneither side. Horizontal curves can similarly beTable 7.9:Passing sight distance onlevel roadsDESIGN PASSING SIGHT DISTANCE (m)SPEED SUCCESSFUL ABORTED(km/h) MANOEUVRE MANOEUVRE40 290 -60 410 22680 540 312100 670 395120 800 471Passing sight distance in respect of a successfulmanoeuvre allows adequately (according to Harwoodand Glennon 1989) for an aborted manoeuvre in thecase of a bus or truck attempting to pass another.As in the case of barrier sight distance, passing sightdistance is not a consideration in the design of lowerordermixed-usage streets.Intersection sight distance (ISD)At a stop-controlled intersection, the driver of astationary vehicle must be able to see enough of thethrough-road or street to be able to carry out one ofthree operations before an approaching vehiclereaches the intersection, even if this vehicle comes intoview just as the stopped vehicle starts to move. Thesethree operations are to:• turn to the left in advance of a vehicle approachingfrom the right;• turn to the right, crossing the path of a vehicleapproaching from the right and in advance of avehicle approaching from the left;• to move across the major highway in advance of avehicle approaching from the left.10Chapter 7Roads: Geometric design and layout planning
GUIDELINES FOR <strong>HUMAN</strong> <strong>SETTLEMENT</strong> <strong>PLANNING</strong> <strong>AND</strong> DESIGNIn the first case, the assumption is that the turningvehicle will accelerate to 85% of the design speed ofthe through-road and a vehicle approaching on thethrough-road will decelerate from the design speedalso to 85% of the design speed, leaving a two-secondheadway between them at the end of the manoeuvre.According to AASHTO, the intersection sight distancerequired for the right turn is only about one metre lessthan that required for the left turn, given the sameassumptions as made in the first case.In the case of the vehicle crossing the through- road,the distance the crossing vehicle must travel is the sumof:• the distance from the stop line to the edge of thethrough carriageway;• the width of the road being crossed; and• the length of the crossing vehicle.This manoeuvre must be completed in the time it takesthe approaching vehicle to reach the intersection,assuming that the approaching vehicle is travelling atthe design speed of the through-road. For safety, thetime available should also include allowance for thetime it takes for the crossing driver to establish that itis safe to cross, engage gear and set his or her vehiclein motion: a period of about two seconds is normallyused.Intersection sight distances recommended inaccordance with the principles outlined above aregiven in Figures 7.4 and 7.5. Before a lower value isadopted in a specific case, the implications ofdeparting from the recommended values should beconsidered.The line of sight is taken from a point on the centreline of the crossing road and 2,4 m back from the edgeof the through-road, to a point on the centre line ofthe through-road, as shown in Figures 7.4 and 7.5. Thesetback is intended to allow for a pedestrian or cycletrack crossing beyond the Stop line.The object height is 1,3 m. The eye height is 1,05 m fora passenger car and 1,8 m for buses and all otherdesign vehicles. There should not be any obstruction tothe view in the sight triangle, which is defined as thearea enclosed by the sight line and the centre lines ofthe intersecting roads.Where an intersection is subject to yield control, theunobstructed sight triangle must be larger. If it isassumed that the vehicle approaching the intersectionon the minor leg will be travelling at 30 km/h, adistance of 30 m would be required to stop the vehicle.If the driver is already preparing to stop, allowance forreaction time is no longer necessary and a distance of10 m is required to bring the vehicle to a standstill. Ifthe approach speed is 60 km/h, the required distanceis 45 m.1000StArticulatedtruck800WIntersection sight distance S (m)t6004005mLine of sightSingle unitPassengercar20000 20 40 60 80 100 120 140Design speed (km/h)Figure 7.4: Intersection sight distance for turning manoeuvreRoads: Geometric design and layout planning Chapter 711
GUIDELINES FOR <strong>HUMAN</strong> <strong>SETTLEMENT</strong> <strong>PLANNING</strong> <strong>AND</strong> DESIGNThe sight triangles required for yield control based onan approach speed of 60 km/h are so large that theprobability of their being found in an urban area isremote.If the driver does not stop but turns to travel in thesame direction as a vehicle approaching at the designspeed of the through-road, the driver of the lattervehicle will be forced to slow down to match speeds ata safe following distance.The intersection sight distance for this manoeuvre isshown in Figure 7.6Because the driver approaching the yield sign may berequired to stop, intersection sight distance as definedand measured for the stop condition must also beavailable.Intersections are, typically, the points at whichpedestrians would want to cross the through-road or600500WScArtic 4-laneIntersection sight distance S c (m)4003002005mLine of sightArtic 4-laneSU 4-laneSU 2-laneP 4-laneP 2-lane10000 20 40 60 80 100 120 140Design speed (km/h)Figure 7.5: Intersection sight distance for crossing manoeuvre600S yIntersection sight distance S (m)y50040030020045mLine of sightArticulatedtruck (Artic)Single unit(SU)Passengercar (P)10000 20 40 60 80 100 120 140Design speed (km/h)Figure 7.6: Intersection sight distance for yield condition12Chapter 7Roads: Geometric design and layout planning
GUIDELINES FOR <strong>HUMAN</strong> <strong>SETTLEMENT</strong> <strong>PLANNING</strong> <strong>AND</strong> DESIGNstreet. Pedestrians must therefore be provided withadequate sight distance to ensure that they can crossthe through-street in safety. This case is preciselyanalogous to that of the vehicle at the intersection,because the principle involved is that the sightdistance provided is directed towards what thepedestrian must be able to see rather than the sightdistance available to drivers of vehicles on thethrough-road.Pedestrian sight distance is measured from an eyeheight of 1,0 m to an object height of 1,3 m. It isassumed that the pedestrian is located on the left sideof the intersecting street with the oncoming vehicleapproaching also from the left. This represents thelongest crossing distance before a situation which is atall safe is achieved, because the further assumption isthat the pedestrian will not be required to pause onthe centreline of the through-road. The distancesoffered in Table 7.10 would be adequate for crossing atwo-lane road.Table 7.10:DESIGN SPEED (km/h)Pedestrian sight distanceIf adequate sight distance is not available, it may benecessary to provide a signalised cross-walk, thusforcing through vehicles to stop. Furthermore, if anadequate gap in the through-traffic does not presentitself at intervals not exceeding one minute, asignalised pedestrian crossing should also beconsidered.HORIZONTAL ALIGNMENTSIGHT DISTANCE(m)30 4540 5550 7060 8570 100The horizontal alignment of a road or street is thecombination of curves and straights (or tangents)presented on a plan view. Curves are usually circular,although spirals and other higher-order polynomialscan be used under highly specific circumstances, whichare seldom found in residential environments.Determination of the horizontal alignment of anurban street is a planning rather than a detaileddesign function, and is highly iterative in nature.Iteration is not only between the three dimensionsof design, e.g. where restraints in the verticaldimension may force a shift in horizontal alignment,but also involves continuous revisiting of theintentions originally formulated with regard tosettlement making.Design of the horizontal alignment must also giveeffect to the proposed function of the road or street.For example, the horizontal alignment of a freeway istypified by long tangents and gentle curves, whereas aresidential street should be designed to discourageoperating speeds higher than 40 to 50 km/h.General principles to be observed in the determinationof the horizontal alignment of a road or street are thefollowing:• No vehicle can instantaneously change fromtraversing a curve in one direction to traversingone in the reverse direction. Short lengths oftangent should thus be used between reversecurves.• Broken-back curves (where two curves in the samedirection are separated by a short tangent) shouldnot be used as they are contrary to drivers’expectations. In the residential environment, this isdifficult to avoid as cadastral boundaries arestraight lines. Fitting smooth curves within areserve comprising a series of chords of a circle isnot always possible.• Large- and small-radius curves should not be mixed.Successive curves to the left and the right shouldgenerally have similar radii and the 1:1,5 rule is auseful guide in their selection.• In residential areas, the deviation angle of shortradiuscurves should not exceed 90° as, at highervalues of deviation, encroachment by large vehicleson opposing lanes becomes pronounced and,furthermore, the splay that has to be provided topermit adequate sight distance becomes excessive.• For small-deflection angles, curves should besufficiently long to avoid the impression of a kink.• Alignment should be sensitive to the topographyto minimise the need for cuts and fills and therestriction that these place on access to erven fromthe street. Streets at right angles to the contourscan create problems in terms of construction,maintenance, drainage, scour (in the case ofgravelled surfaces) and also constitute a traffichazard. During heavy rainstorms, water flowingdown a steep street can flow across theintersecting street.In addition, the various utilities, such as sewerage,power and water reticulation, are typically locatedwithin the road reserve. The planning of the roadnetwork must therefore also take cognisance of thelimitations to which these services are subject. Forexample, a street located in such a fashion that itsvertical alignment tends to be undulating wouldpresent significant difficulties in the location of sewerruns.Roads: Geometric design and layout planning Chapter 713
GUIDELINES FOR <strong>HUMAN</strong> <strong>SETTLEMENT</strong> <strong>PLANNING</strong> <strong>AND</strong> DESIGNTangentsAs horizontal curves are circular, the straightsconnecting them are usually referred to as tangents.While the selection of radius of horizontal curvaturedictates the operating speed selected by the driver,long tangents can cause speeds to increase tounacceptable levels, followed by deceleration as thenext curve is encountered. It has been found thatlimiting the length of tangents (in metres) to aboutten times the design speed (in km/h) will cause speedsto stay fairly constant. A design speed of 40 km/hwould thus suggest that tangents should not be morethan about 400 m in length.In the situation of an urban grid of streets, a 400-metre-long tangent bounded at both ends by T-intersections would also tend to limit speeds to of theorder of 40 km/h.Curvature and superelevationAcceptable rates of superelevation are offered in Table7.11.Table 7.11:In Table 7.12, the minimum radii of horizontal curvesfor various design speeds and maximum rates ofsuperelevation are calculated from the relationshipR =Maximum superelevationfor various classes of roadCLASS OF ROADMAXIMUMOR STREET SUPERELEVATION (%)Vehicle-only (freeway) 10Vehicle-only (other) 6 - 8Mixed-usage (higher-order) 4 - 6Mixed-usage (middle-order) 2 - 4Mixed-usage (lower-order) 2 - 4v 2127(e + f)where:R = radius (m)v = speed (km/h)e = superelevation rate(m/m)f = side friction factorUnlike the rural situation where a tight radius curvecan be matched by a high value of superelevation, thelarge variations in vehicle speeds encountered in theurban environment cause high values ofsuperelevation to be inappropriate. Furthermore,there is a distinct likelihood that there would not besufficient distance available to accommodate thedevelopment of superelevation. Property access in theimmediate vicinity of the curve probably would notallow a cross-section where one road edge is a metreor more above the other.In Table 7.12, all values have been rounded up to thenearest five metres. A camber of 2 to 3% suggests thatrates of superelevation of -0,02 to +0,02 are usuallynormal camber situations. There is no knownapplication for a 0% super-elevation and it should beavoided as, in the absence of a longitudinal gradient,it will cause drainage problems and ponding on theroad surface.Superelevation runoffStreets normally have a camber with the high point ontheir centreline and a fall, typically of the order of 2 to3% as suggested above, to either edge. Superelevationis developed or run off by rotating the outer lanearound the centreline until a crossfall across the fullwidth of the street, equal to the original camber, isachieved. From this point, both lanes are furtherrotated around the centreline until the full extent ofsuperelevation has been achieved.This further rotation need not necessarily be about thecentreline. Special circumstances may demand adifferent point of rotation. A constraint on the level ofone or other of the road edges may require that theconstrained edge becomes the axis of rotation. Theneed to secure an adequate, but not too steep, fall toa drop inlet on the inside of a curve may require thatthe axis of rotation be shifted to a point slightlyTable 7.12:Minimum radii for horizontal curves (m)DESIGN SPEED SIDE FRICTION MINIMUM RADII FOR MAXIMUM RATES OF SUPERELEVATION (e) OF:(km/h) FACTOR (f) -0,02 0 +0,02 0,04 +0,06 +0,0830 0,19 45 40 35 30 30 3040 0,18 80 70 65 60 55 5050 0,17 135 115 105 95 85 8060 0,16 205 180 160 145 130 12070 0,15 300 260 230 205 185 17080 0,14 420 360 315 280 255 230100 0,13 - - 525 465 415 375120 0,11 - - 875 760 670 60014Chapter 7Roads: Geometric design and layout planning
GUIDELINES FOR <strong>HUMAN</strong> <strong>SETTLEMENT</strong> <strong>PLANNING</strong> <strong>AND</strong> DESIGNremoved from the inner edge.Rotation over too short a distance will create theimpression of an unsightly kink in the road surfaceand, if the distance is too long, drainage problems arelikely to occur in the area where the camber is lessthan about 0,5%. The rate of rotation is measured bythe relative slope between the roadway edge and theaxis of rotation. Relative slopes that have been foundin practice to give acceptable lengths of runoff arequoted in Table 7.13. Where space does not permitthe use of these rates, minimum lengths forsuperelevation runoff for two-lane roads may have tobe adopted. These are also quoted in Table 7.13. Theselengths are based on relative slopes that are generally50% higher than those recommended for normal use.Table 7.13:Where a circular arc is preceded by a transition curve,the full superelevation is developed across the lengthof the transition. Transition curves, however, are onlyused on the tightest radius curves applied to roadswith high design speeds. In all other cases, thesuperelevation runoff must be distributed betweenthe tangent and the curve because full superelevationat the end of the tangent is as undesirable as nosuperelevation at the start of the curve. Drivers tend tofollow a transition path in entering a curve and thispath typically has two-thirds of its length on thetangent with the remaining third being on the curveitself. Superelevation runoff is similarly distributed tomatch the actual path of the vehicle.VERTICAL ALIGNMENTRates and minimum lengthsof superelevation runoffDESIGN RELATIVE MINIMUMSPEED SLOPE (%) LENGTH (m)40 0,7 3560 0,6 4080 0,5 50100 0,4 60120 0,4 70Vertical alignment is the combination of parabolicvertical curves and straight sections joining them.Straight sections are referred to as grades, and thevalue of their slope is the gradient, usuallyexpressed in percentage form, e.g. a 5% gradeclimbs through 5 metres over a horizontal distanceof 100 metres.horizontal alignment rather than by the verticalalignment, whereas the speeds of buses and otherheavy vehicles are constrained more by the verticalalignment. The design speed applied to the verticalalignment should therefore match that applied to thehorizontal alignment and it could be argued that ahigher vertical design speed is preferable.As in the case of the horizontal alignment, the verticalalignment should be designed to be aestheticallypleasing. In this regard due recognition should also begiven to the interrelationship between horizontal andvertical curvature. A vertical curve that coincides witha horizontal curve should, if possible, be containedwithin the horizontal curve and, ideally, haveapproximately the same length.Where a vertical curve falls within a horizontal curve,the superelevation generated by the horizontalcurvature improves the availability of sight distancebeyond that suggested by the value of verticalcurvature. This enables the edge profiles to have acurvature sharper than the minima suggested inTable 7.14. The proviso, however, is that the driver’sline of sight is contained within the width of theroadway. When the line of sight goes beyond theroadway edge, the effect on sight distance of lateralobstructions such as boundary walls or highvegetation must be checked.A smooth grade line with gradual changes appropriateto the class of road and the character of thetopography is preferable to an alignment withnumerous short lengths of grade and vertical curves.The “roller coaster” or “hidden dip” type of profileshould be avoided. This profile is particularlymisleading in terms of availability of sight distanceand, where it cannot be avoided, sight distancegreater than suggested in Table 7.6 may be required interms of accident experience. For aesthetic reasons, abroken-back alignment is not desirable in sags wherea full view of the profile is possible. On crests thebroken-back curve adversely affects passingopportunity.CurvatureThe horizontal circular curve provides a constant rateof change of bearing. Analogous to this is the verticalparabola which provides a constant rate of change ofgradient. Academic niceties apart, there is little tochoose between the application of the parabola or thecircular curve, the differences between them beingvirtually unplottable and, in any event, within thelevels of accuracy to which the pavement typically isconstructed.With the whole-life economy of the road in mind,vertical alignment should always be designed to ashigh a standard as is consistent with the topography.Passenger car speeds are dictated by the standard ofRoads: Geometric design and layout planning Chapter 715
GUIDELINES FOR <strong>HUMAN</strong> <strong>SETTLEMENT</strong> <strong>PLANNING</strong> <strong>AND</strong> DESIGNFrom the general form of a parabolic functiony = ax 2 + bx + cit follows that the rate of change of grade, d 2 y/dx 2 ,equals 2a. The reciprocal of 2a, K, is thus the distancerequired to effect a unit change of grade. Verticalcurves are specified in terms of this factor, K, and theirhorizontal length as shown in the relationshipL = A.KMinimum rates of curvatureThe minimum rate of curvature is determined bysight distance as well as by considerations ofcomfort of operation and aesthetics. The sightdistance most frequently employed is the stoppingsight distance which, as stated earlier, is measuredfrom an eye height of 1,05 m to an object height of0,15 m although, in the case of residential streets,an object height of 0,6 m could be used.In the case of sag curves, the sight distance isreplaced by a headlight illumination distance ofthe same magnitude, assuming a headlight heightof 0,6 m and a divergence angle of 1˚ above thelongitudinal axis of the headlights. Whereadequate street lighting is available, the headlightcriterion does not apply and comfort is the onlycriterion that limits values.Special circumstances may dictate the use ofdecision sight distance or even passing sightdistance. Where a sight distance other than thatfor stopping has to be employed, the relationshipoffered below can be used to calculate therequired curve length and, thereafter, the K-valueof vertical curvature.Where the sight distance, S, is less than the curvelength, L,L =AS 2100 ( 2h 1 + 2h 2 )and, where S is greater than L,200 ( h 1 + h 2 )L = 2S -2Awhere:L = length of vertical curve (m)S = sight distance (m)A = algebraic difference in grades (%)h 1 = height of eye above road surface (m)h 2 = height of object above road surface (m)Values of K, based on stopping sight distance inthe case of crest curves, and on headlightillumination distance in the case of sag curves,are given in Table 7.14.Minimum lengths of vertical curvesWhere the algebraic difference betweensuccessive grades is small, the interveningminimum vertical curve becomes very short, and,particularly where the adjacent tangents arelong, the impression of a kink in the grade line iscreated. Where the difference in grade is lessthan 0,5%, the vertical curve is often omitted. InTable 7.15, a minimum length of curve foralgebraic differences in grade greater than 0,5%is suggested for purely aesthetic reasons.Where a crest curve and a succeeding sag curvehave a terminal point in common, the visual effectcreated is that the road has suddenly droppedaway. In the reverse case, the illusion of a hump iscreated. Either effect is removed by inserting aTable 7.14:Minimum values of K for vertical curvesDESIGN SPEED CREST CURVES FOR OBJECT OF HEIGHT SAG CURVES(km/h) 0,15 m 0,60 m Without street lighting With street lighting40 6 2 8 450 11 6 12 660 16 10 16 870 23 2080 33 2590 46 Not 31 Not100 60 applicable 36 applicable110 81 43120 110 5216Chapter 7Roads: Geometric design and layout planning
GUIDELINES FOR <strong>HUMAN</strong> <strong>SETTLEMENT</strong> <strong>PLANNING</strong> <strong>AND</strong> DESIGNshort length of straight grade between the twocurves and, typically, 60 m to 100 m is adequate forthis purpose.Table 7.15:DESIGN SPEED(km/h)GradientsMinimum length of verticalcurvesLENGTH OF CURVE(m)40 8060 10080 140100 180120 220Maximum gradients on higher order roadsBus and truck speeds are markedly affected bygradient. Bus routes should be designed withgradients which will not reduce the speed of thesevehicles enough to cause intolerable conditions forfollowing drivers. Glennon (1970) found that thefrequency of accidents increases sharply when thespeeds of heavy vehicles are reduced by more than15 km/h.For southern African conditions a speed reductionof 20 km/h is generally accepted as representingintolerable conditions. If gradients on which bus ortruck speed reduction is less than 20 km/h cannotbe achieved economically, it may be necessary toprovide auxiliary lanes for the slower-movingvehicles. Wolhuter (1990) established that, on flatgrades, 50 percentile bus and truck speeds areabout 17 km/h lower than the equivalentpassenger car speeds, so that a speed reduction of20 km/h actually represents a total speeddifferential of about 37 km/h.Maximum gradients for different design speedsand types of topography are suggested inTable 7.16. It is stressed that these are guidelinesonly. Optimisation of the design of a specific road,taking the whole-life economy of the road intoaccount, may suggest some other maximumgradient.The three terrain types described are defined bythe differences between passenger-car and bus ortruck speeds prevailing in them. On flat terrain, thedifferences between the speeds of cars and busesremain relatively constant at about 17 km/h,whereas hilly terrain causes substantial speeddifferentials. In mountainous terrain, buses andtrucks are reduced to crawl speeds for substantialdistances.Maximum gradients on residential streetsOn local streets, maximum gradient has asignificant effect on the cost of townshipdevelopment. Where possible, road alignmentshould be designed to minimise the extent and costof earthworks and to avoid problems with accessand house design. It therefore has to be acceptedthat short sections of steep gradients may benecessary in some settlement developments.Where a residential street is also a bus route, thegradients recommended in Table 7.16 should notbe exceeded. Where this is not possible, amaximum gradient of 14% may have to beconsidered.On higher-order mixed-usage streets, therecommended maximum gradient is 10% but, onsections not longer than 70 m, the gradient can beincreased to 12,5%. On purely residential streets,the maximum gradient could be 12% and onsections not longer than 50 m the gradient couldbe increased to 16%.Notwithstanding the values given, the followingpoints should be taken into consideration:• Gradients should be selected in consultationwith the stormwater design engineer.• Steep gradients on short access loops and culsde-saccould result in properties beinginundated and surface runoff washing acrossTable 7.16: Maximum gradients on major roads (%)DESIGN SPEED (km/h)TOPOGRAPHYFLAT ROLLING MOUNTAINOUS40 7 8 960 6 7 880 5 6 7100 4 5 6120 3 4 5Roads: Geometric design and layout planning Chapter 717
GUIDELINES FOR <strong>HUMAN</strong> <strong>SETTLEMENT</strong> <strong>PLANNING</strong> <strong>AND</strong> DESIGNintersecting streets.• Multiple-use surfaces which serve bothvehicular access and recreational purposes,including playing space for children, should berelatively flat and not provided with kerbs (theyare, in fact, shared surfaces).• Where cycling is an important mode of travel, itwill be necessary to consider the effects ofgradient on cycling in deciding on the roadalignment.• It is difficult to construct streets on gradientssteeper than about 12% by conventionalmeans. 12/14 ton rollers cannot climb gradientsthis steep. They also tend to damage the basecourse while attempting to stop after adownhill pass. Steeper grades should thus beconstructed of concrete, brick or interlockingroad stones. The last-mentioned surface is notrecommended where speeds in excess of about60 km/h are anticipated, as the partial vacuumcreated behind a passing tyre tends to suck outthe sand from between adjacent stones andthus destroy the integrity of the surface.• Gravel surfaces are subject to scour at waterflow speeds of the order of 0,6 to 1,0 m/s. Underconditions of overland flow, this speed isachieved at slopes of the order of 7 to 8%. Theslope in question is the resultant of the vectorsof longitudinal slope and crossfall.Minimum gradientsIf the cross-section of the road does not includekerbing, the gradient could be 0% because thecamber is continued across the adjacent shoulder,thus allowing for adequate drainage of the roadsurface. The verge will have to accommodate thedrainage both of the road reserve and of thesurrounding properties. The decision to accept azero gradient would thus have to be informed bythe stormwater drainage design. Zero gradient isnot recommended as a general rule and thepreferred minimum is 0,5%.Kerbed streets should have a minimum gradient ofnot less than 0,5%. If the street gradient has to beless than this, it would be necessary to grade thekerbs and channels separately and to reduce thespacing between drop inlets to ensure that theheight difference between the edge of thetravelled way and channel is not too pronounced.Climbing lanesApplication of climbing lanesClimbing lanes are auxiliary lanes added outsidethe through-lanes. They have the effect ofreducing congestion in the through-lanes byremoving slower-moving vehicles from the trafficstream. As such, they are used to match the Level ofService on the rising grade to that prevailing on thelevel sections of the route. In the urban situation,climbing lanes may be used on vehicles-only andhigher-order mixed-usage streets. They have noapplication on local residential streets.Warrants for climbing lanesAs implied earlier, the maintenance of anacceptable level of service over a section of theroute is one of the reasons for the provision ofclimbing lanes. Another reason is the enhancementof road safety by the reduction of the speeddifferential in the through-lane. The warrants forclimbing lanes are therefore based on both speedand traffic volume.A bus/truck speed profile should be prepared foreach direction of flow. It would then be possible toidentify those sections of the road where speedreductions of 20 km/h or more may warrant theprovision of climbing lanes.The traffic volume warrant is given in Table 7.17. Itshould be noted that the word “trucks” includesbuses, rigid-chassis trucks and articulated vehicles.A further warrant is based on matching Levels ofService (LOS) along the route. Alternatively, a formof partial economic analysis developed byWolhuter (1990) could be used. This software -<strong>AND</strong>OG (ANalysis of Delay On Grades) - is availablefrom <strong>CSIR</strong>-Transportek. It compares the cost ofconstruction of the climbing lane to the costs of thedelay incurred by not providing it.Location of terminalsA slow-moving vehicle should be completely clearof the through-lane by the time its speed hasdropped by 20 km/h, and remain clear of thethrough-lane until it has accelerated again to aspeed which is 20 km/h less than its normal speed.The recommended taper length is 100 m so thatthe start taper begins 100 m in advance of thepoint where the full climbing lane width isrequired, and the end taper ends 100 m beyond theend of the climbing lane.If there is a barrier line, owing to restricted sightdistance, at the point where the speed reductionwarrant falls away, the full lane should be18Chapter 7Roads: Geometric design and layout planning
GUIDELINES FOR <strong>HUMAN</strong> <strong>SETTLEMENT</strong> <strong>PLANNING</strong> <strong>AND</strong> DESIGNTable 7.17:Traffic volume warrants for climbing lanesGRADIENT (%)TRAFFIC <strong>VOLUME</strong> IN DESIGN HOUR (veh/h)5% trucks in stream 10% trucks in stream4 632 4866 468 3168 383 25710 324 198extended to where the marking ends, with thetaper ending 100 m beyond this point.Climbing lane widthThe climbing lane should preferably have the samewidth as the adjacent through-lanes. On majorroutes, through-lanes may have widths of 3,7 m,3,4 m or 3,1 m. It is unlikely that climbing lanes willbe provided on roads where the traffic volumes areso low that a lane width of 3,1 m is adequate.Climbing lanes therefore tend to be either 3,7 m or3,4 m wide. Even if the through-lanes are 3,7 mwide, a climbing lane 3,4 m or perhaps even 3,1 mwide may, however, be considered on the groundsof low lane occupancy and speed or some otherconstraining topographic circumstance. Climbinglanes on bus routes should, however, have a widthof 3,7 m.CROSS-SECTION DESIGNThe cross-section of a road provides accommodationfor moving and parked vehicles, drainage, publicutilities, non-motorised vehicles and pedestrians. It isalso required to serve more than just movementrelatedactivities.Residential streets, for example, offer a neutralterritory on which neighbours can meet informally.They can also serve as playgrounds for children indevelopments where plot sizes are too small for thispurpose.Abutting trading or light industrial activities in activitycorridors may require sidewalks wider than thoserequired purely for moving pedestrians. Pedestriansalso “park”, in the sense of browsing through goods onoffer (either in shop windows or by roadside vendors)or relaxing in a sidewalk café. In short, the roadreserve is required to address a wide spectrum ofactivities. For this reason it was suggested previouslythat reference should be to “hard open space” withonly a portion of this comprising the road reserve aspreviously understood.Movement, as an activity served by the cross- section,comprises a spectrum of needs. One end of thespectrum of the movement function relates to puremobility, as typified by the freeway and urban arterial.Vehicle movement is the sole concern and pedestriansare totally excluded from these roads. The other endof the spectrum is concerned with accessibility and theneeds of the pedestrian. Vehicular movement may benecessary on these roads but it is tolerated rather thanencouraged and is subject to significant restrictions.Between these two extremes, mixed usage is foundwith vehicular and non-vehicular activities sharing theavailable space. If these uses have to compete for theirshare of space, it can reasonably be stated that thedesign has failed to meet its objective.The flexibility of the road reserve in accommodatingsuch widely disparate needs derives from thedisaggregated nature of the cross-section, asillustrated in Figure 7.7.The cross-section may comprise all or some of thefollowing components:• Lanes- Basic- High Occupancy Vehicle (HOV) lanes- Auxiliary (turning or climbing)- Parking- Cycle• Medians- Shoulders- Central island• Shoulders- Verges- Sidewalks.LanesBasic or through-lanesUndivided roads may have either one lane in eachdirection (two-lane two-way roads) or more thanone lane in each direction (multilane roads). Dualcarriageway roads have two or more lanes in eachdirection separated by a median. Customarily,there is symmetry of through-lanes, and asymmetryRoads: Geometric design and layout planning Chapter 719
GUIDELINES FOR <strong>HUMAN</strong> <strong>SETTLEMENT</strong> <strong>PLANNING</strong> <strong>AND</strong> DESIGNRoad reserveRoad prismOutershoulderVergeTravelledwayInner shoulderRoadbedMedianMedianislandInner shoulderRoadway orcarriagewayInnerlaneOuterlaneVergeXXShoulder breakpointFigure 7.7: Elements of the cross-sectionon a particular section of road should arise onlyfrom the addition of an auxiliary lane that is clearlyallocated to one direction of travel.The selection of lane width is based on trafficvolume and vehicle type and speed. Highervolumes and speeds require wider lanes, and thegreatest lane width recommended is 3,7 m. Wheretraffic volumes are such that a multilane crosssectionor a divided cross-section is required, 3,7 mis a logical lane width to adopt.No operational or safety benefit accrues from lanewidths wider than 3,7 m, although some urbanauthorities allow lane widths as broad as 5,5 m. Inpeak hours, these wider lanes tend to carry twolanes of moving passenger cars each. They also easethe process of passenger cars overtaking buseswithout encroaching significantly on the opposinglane. Finally, they enable informal parking in theabsence of demarcated parking bays. As such, 5,5 mlanes tend to be used only in higher-order mixedusagestreets.The narrowest lane width recommended is 3,1 m,which gives a clear space of 0,25 m on either side ofa vehicle that is 2,6 m wide i.e. a bus. This widthwould normally be employed only where speeds ortraffic volumes are expected to be low and busesinfrequent, e.g. on residential streets.If the route is not intended ever to accommodatebuses, the lane width could be reduced to as littleas 2,7 m. Intermediate conditions of volume andspeed can be adequately catered for by a lanewidth of 3,4 m.Streets where pedestrian activities are expected topredominate may have only one lane, withprovision for passing made at intervals. In this case,the lane width should not be less than 3,1 m.Passing bays should be provided at not more than50 m spacings. It is important that passing baysshould be intervisible. If this is not achieved,motorists may enter a single lane section only tofind that it is already occupied thus forcing one orother of the vehicles involved to reverse to theprevious passing bay.High occupancy vehicle (HOV) lanesHOV lanes normally extend over considerabledistances and could, therefore, be included in thecategory of basic lanes. These lanes are normallyapplied only to higher-order mixed-usage streetsand are intended to serve all HOVs and not onlybuses. Vehicles that could be allowed to use HOVlanes thus include• buses;• minibus taxis; and• car pool vehicles.A policy decision would have to be provided by thelocal authority concerned in respect of the level ofvehicle occupancy that would allow a vehicle toenter an HOV lane. An operational problem thatimmediately arises in the application of HOV lanesis their policing, to ensure that only vehicleslegitimately described as HOVs use them.As buses have an overall width of 2,6 m, the smallerbasic lane widths would not be appropriate. Aspointed out, a 3,1 m lane would allow only 0,25 mbetween the outside of the bus and the lane edgewith a distinct possibility that a moving bus wouldnot always be precisely located in the centre of thelane. At speeds higher than those encountered inresidential areas, encroachment on other lanescould be expected. To avoid encroachment, a lanewidth of 3,7 m is the minimum that should beaccepted for a HOV lane.It is not possible to lay down hard-and-fastwarrants for the provision of bus lanes. From anoperational point of view, relating purely to themovement of people, it follows that the capacity of20Chapter 7Roads: Geometric design and layout planning
GUIDELINES FOR <strong>HUMAN</strong> <strong>SETTLEMENT</strong> <strong>PLANNING</strong> <strong>AND</strong> DESIGNthe street being analysed should be greater withthe added HOV lane than without it. Where anexisting lane is converted to an HOV lane, i.e. whenit is no longer available for use by other vehicles,the provision of the HOV lane could lead to adecline in throughput of passengers.The estimation of transit capacity is more complexand less precise than estimates of highway capacityas it deals with the movement of both people andvehicles whereas highway capacity restricts itself tovehicular movement. Furthermore, the variables toaddress in such estimates include, in addition to thenormal factors applying to highway capacity• the size of the transit vehicles, in terms ofallowable passenger loadings;• the frequency of operation of the service; and• the interaction between passenger trafficconcentrations and vehicle flow.Reference should be made to TRB Special Report209: Highway Capacity Manual with regard to theanalysis of mass transit facilities.The layout of bus stops is discussed under theheading “Verges”.Auxiliary lanesAuxiliary lanes are lanes added to the normal crosssectionto address a specific purpose and arenormally applied only to vehicle-only or higherordermixed-usage streets.Typically, auxiliary lanes are added at intersectionsto support left and right turns so that thesemanoeuvres can take place at relatively low speedswithout impeding the movement of the throughtraffic.If a road has signalised intersections, it maybe necessary to add auxiliary lanes to match theintersection capacity to that of the approach legs.These lanes are discussed in more detail belowunder the heading “Intersections”.Auxiliary lanes can also be provided at intersectionsto serve through-traffic. The intention is to matchthe capacity of the intersection to its upstream anddownstream links. The need for such lanes and thestorage length upstream and merging lengthdownstream that they have to accommodate are amatter for analysis as described by the HighwayCapacity Manual.Climbing lanes, as auxiliary through-lanes, arediscussed above under the heading “VerticalAlignment”.Parking lanesParking lanes are normally 2,5 m wide with aminimum width of 2,1 m, and are usually embayed.In this configuration, the parking lane is actuallylocated in the verge area. Individual parking baysare typically 6,0 m long with each pair of parkingbays being provided with an additional clear spaceof 1,5 m between them to allow for manoeuvringinto or out of the bays. In areas where very hightidal flows are expected, it is useful to be able to usethe parking lanes as moving lanes during periods ofpeak flow. Under these circumstances, the parkinglane should have a minimum width of 3,1 m.Cycle lanesIdeally, cycle lanes should be located in the vergearea, as the speed differential between bicyclesand pedestrians is likely to be less than thatbetween bicycles and motorised vehicles. Wherethis is not possible and either there is significantcycle traffic or it is desired to encourage bicycles asa mode of travel, a cycle lane can be added outsidethose intended for motorised vehicles.Such lanes should be of the order of 1,5 m wideand clearly demarcated as cycle lanes. If these lanesare wider than 2,0 m, passenger cars are likely touse them, possibly even for overtaking on the left,which is a manoeuvre to be actively discouraged.ShouldersThe shoulder is defined as the usable area alongsidethe travelled way.Shoulders are applied only to roads wherepedestrian traffic is not specifically catered for. Theirwidth does not, therefore, make provision for themounting of guardrails, or for edge drains orshoulder rounding. The shoulder breakpoint is somedistance beyond the edge of the usable shoulder,usually about 0,5 to 1,0 m.A stopped vehicle can be adequately accommodatedby a shoulder which is 3,0 m wide, and there is nomerit in adopting a shoulder width greater than this.The shoulder should, on the other hand, not be sonarrow that a stopped vehicle would cause congestionby forcing vehicles travelling in both directions into asingle lane. However, a partly blocked lane isacceptable under conditions of low speed and lowtraffic volume. With the narrowest width of throughlane,i.e. 3,1 m, it is possible for two vehicles to passeach other next to a stopped vehicle where theshoulders are not less than 1,0 m wide, giving a totalcross-sectional width of 8,2 m to accommodate threevehicles. It is stressed that this width is an irreducibleminimum and appropriate only to low lane volumesand low speeds.Roads: Geometric design and layout planning Chapter 721
GUIDELINES FOR <strong>HUMAN</strong> <strong>SETTLEMENT</strong> <strong>PLANNING</strong> <strong>AND</strong> DESIGNHazards tend to cause a lateral shift of vehicles iflocated closer than 1,5 m to the lane edge, and forspeeds higher than 60 km/h a shoulder width of 1,5 mshould be regarded as the minimum.Intermediate traffic volumes and higher operatingspeeds require a shoulder width greater than 1,0 m,and three alternative shoulder widths are suggested,namely 1,5 m, 2,0 m and 2,5 m.The 3,0 m shoulder is appropriate for the highestoperating speeds and heavy traffic volumes.Medians and outer separatorsThe median is the total area between the inner edgesof the inside traffic lanes of a divided road, andincludes the inner shoulders and central island. Thepurpose of the median is to separate opposing streamsof traffic and hence reduce the possibility of vehiclescrossing into the path of opposing traffic. This isaccomplished by the selection of an appropriatemedian width or by the use of a physical barrier suchas a guardrail.Median width depends not only on traffic volume butalso on the function of the road and trafficcomposition. A median functioning as a pedestrianrefuge could be narrower than one protecting aturning vehicle which could be anything up to acombination vehicle (i.e. semitrailer plus trailer). Amedian narrower than 3,0 m does not offerpedestrians any sense of security, particularly whenbuses or trucks are travelling in the immediatelyadjacent lanes.A median of less than 1,5 m in width is physicallydangerous to pedestrians and should not beconsidered wherever pedestrian traffic is likely to beencountered. However, with severe spatial limitations,it is possible to use medians this narrow. They wouldserve only to accommodate back-to-back guardrails toensure vehicular separation. A median that is 5,0 mwide would be able to accommodate a right-turn lanewith provision for a pedestrian refuge, but would alsorequire guardrail protection to separate the opposingflows of traffic.Medians are totally inappropriate in residentialstreets. These streets are principally directed to thefunction of accessibility, including vehicles turningright from the street to enter individual properties.Medians, particularly when raised and kerbed,preclude this movement. If medians are depressed, it ispossible for vehicles to traverse them but, foroncoming vehicles, this is an unexpected andcorrespondingly dangerous manoeuvre.The purpose of an outer separator is to separatestreams of traffic flowing in the same direction but atdifferent speeds and also to modify weavingmanoeuvres. In general, the standards applied tomedians are also appropriate for outer separators. Theouter separator could, for example, support thesituation of a relatively high-speed road traversing alocal shopping area. Vehicles manoeuvring into or outof parking spaces and pedestrians are thussafeguarded from collisions with fast-moving throughtraffic.This situation would, however, constitute poorplanning or be forced by a situation outside thecontrol of the planner. This contention refers to thefact that the central high-speed lanes would be asignificant barrier to pedestrians wishing to cross thestreet and effectively create two independentshopping areas from an otherwise integrated unit.VergesThe verge is defined as the area between the roadwayedge and the road reserve boundary.All facilities not directly connected with the road, e.g.telephone or power lines, are normally located in theverge. In the case of the freeway, the verge is simplythe clear space between the shoulder breakpoint andthe reserve boundary. On the other hand, in the urban,specifically the residential, environment it is the vergethat gives the street its richness and unique character.As in the case of the cross-section as a whole, wherethe total width is built up as the sum of variousdisaggregated elements, the verge width is also thesum of the various elements it is required to contain.In general, the verge should have a width of the orderof about 5 metres, but, as implied by the precedingstatement, this can only be regarded as a very roughrule of thumb.Even where HOV lanes are provided, it is desirable tolocate bus stops in the verge. Typical layouts for busstops are shown in Figure 7.8.Various elements and their typical widths are listed inTable 7.18.SidewalksWherever there is significant usage by pedestrians, theshoulder is replaced by a sidewalk. A sidewalk isunderstood as comprising the entire width betweenthe adjacent kerb face and the reserve boundary, andis generally paved over the full width of the verge. Ifthe provision for pedestrians does not use this fullwidth, reference is made to “footways”. The width ofthe sidewalk is dictated by the anticipated volume ofpedestrian traffic, with an additional allowance beingmade for any other application intended as part of thefunction of the road reserve.Reference should be made to the discussion of “hardopen spaces” in Chapter 5 of this document.22Chapter 7Roads: Geometric design and layout planning
GUIDELINES FOR <strong>HUMAN</strong> <strong>SETTLEMENT</strong> <strong>PLANNING</strong> <strong>AND</strong> DESIGN3,5m50m35m15m (minimum)Gravelsurface50m35m1,5mShoulder100mm broken whitecentre line4,5m stripe, 7,5m gap100mm wide continuousyellow line100mm broken whiteline2,7m stripe,4,5m gap(a) Gravel surface50m35m15m (minimum)Hardenedarea with busshelter50m35mGravelshoulder3,0m1,5m1,0mShoulder100mm broken whitecentre line4,5m stripe, 7,5m gap100mm broken whiteline2,7m stripe, 4,5m gap(b) Blacktop surface100mm wide continuousyellow lineFigure 7.8: Typical bus stop layoutsTable 7.18:Typical width of verge elementsELEMENTSWIDTH (m)Berm 1,5 m high 6,0Bicycle paths 1,5 - 3,0Bus stop embayment 3,0Bus stop passenger queue 0,7 - 1,4Clear strip (including kerb and drainage inlet) 2,0Drainage inlet or manhole 1,5Driveway approach 5,0Electric light poles 0,3 - 0,5Footway (sidewalk) 1,5 - 2,0Guardrails or barriers 0,5Kerbs (barrier) 0,15Kerbs (mountable) 0,3Kerbs (semi-mountable) 0,15Landscape strip 3,0Parking (parallel) 2,5Traffic signals 0,6 - 1,5Traffic signs 0,6 - 2,0Trench width for underground service1,0 m minimumRoads: Geometric design and layout planning Chapter 723
GUIDELINES FOR <strong>HUMAN</strong> <strong>SETTLEMENT</strong> <strong>PLANNING</strong> <strong>AND</strong> DESIGNThe topic of design for pedestrians is exhaustivelydescribed in: Pedestrian facility guidelines: Manual toplan, design and maintain safe pedestrian facilities.Department of Transport Report 92/126, Pretoria.In this document, the sidewalk is defined as comprisingtwo elements, these being the “effective” width andthe “ancillary” width. The effective width is thatportion of the sidewalk dedicated to movement andthe ancillary width the portion of the road reserveotherwise used. The effective width is shown as beingset back by 0,5 m from the adjacent kerb face.Required effective widths of sidewalk for various LOScan be calculated by dividing the flow inpedestrians/minute by the values of pedestrians/minute/metre as shown in Table 7.19.Table 7.19:LEVEL OF SERVICEThe total width of the sidewalk is thus the effectivewidth as calculated plus the setback of 0,5 m plus theancillary width determined by the other functions tobe accommodated by the sidewalk.SlopesCamber and crossfallLOS criteria for sidewalkwidthPEDESTRIANS/MINUTE/METREA 0,6B 2,1C 3,0D 4,6E 7,6Camber implies two slopes away from a centralhigh point, as in a two-lane two-way road, wherethe cross-section slopes down from the centre lineto the shoulders. Crossfall is a single slope fromshoulder to shoulder. The slope, whether camber orcrossfall, is provided to facilitate drainage of theroad surface.The steepness of slope lies in the range of 2 to 3%.In areas where heavy rainfall is common or wherethe most economical longitudinal gradient is 0%,the steeper slope is preferred. Cambers steeperthan 3% introduce operational problems, both indriving and in increased wear of vehiclecomponents. Where a surfaced shoulder isprovided, the camber should be taken to the outeredge of the shoulder. Unsurfaced shoulders shouldhave a crossfall of 4% to ensure a rate of flowacross this rougher surface that matches the flowacross the surfaced area.In the case of very narrow reserves, such as in thecase of lanes or alleys where spatial restrictionsmay preclude the provision of drainage outside thewidth of the travelled way, a negative or reversecamber, i.e. sloping towards a central low point,could be considered. In this case, the centreline ofthe street is the low point to create a flat Vconfiguration. The entire surfaced width thenserves as a drainage area.MediansTwo different conditions dictate the steepness ofthe slope across the median: drainage and safety.As suggested earlier, the normal profile of amedian would be a negative camber to facilitatedrainage. The flattest slope that is recommended is10%. Slopes flatter than this may lead to pondingand may allow water to flow from the median ontothe carriageway.Slopes steeper than 25% (or 1:4) would makecontrol of an errant vehicle more difficult, leadingto a greater possibility of cross-median accidents. Ifsurface drainage requires a median slope steeperthan 1:4, this aspect of road safety would justifyreplacing surface drainage with an undergrounddrainage system.Cut and fill battersGradelines that require cuts or fills so high thattheir batters require specific attention are aliento mixed-usage streets. The intention withthese streets is that the gradeline should be asclose as possible to the natural ground leveland, preferably, slightly below it. This isnecessary to ensure ease of access to adjacentproperties and also to support the drainage ofthe surrounding area.On vehicle-only roads, the slopes of the sides of theroad prism are, like those of medians, dictated bytwo different conditions. Shallow slopes arerequired for safety, and a slope of 1:4 is thesteepest acceptable for this purpose. Thealternative is to accept a steeper slope and providefor safety by some other means, such as guardrails.In this case the steepest slope that can be used isdictated by the natural angle of repose anderodibility of the construction material.INTERSECTIONSIntroductionIntersections are required to accommodate themovement of both vehicles and of pedestrians. In bothrespects, intersections have a lower capacity than thelinks on either side of them. In consequence, it is the24Chapter 7Roads: Geometric design and layout planning
GUIDELINES FOR <strong>HUMAN</strong> <strong>SETTLEMENT</strong> <strong>PLANNING</strong> <strong>AND</strong> DESIGNefficiency of the intersections that dictates theefficiency of the network as a whole.Various measures of effectiveness (MOE) may beproposed. These include energy consumption, time,safety and convenience, and one should not lose sightof the fact that these measures apply as much topedestrians as they do to vehicles. Furthermore, whilethey are not mutually exclusive, clashes between thesemeasures can arise. For example, the minimisation ofenergy usage suggests that the major vehicular trafficshould be kept moving at all times. The safety andconvenience of all other road users, vehicular andpedestrian alike, would obviously be compromised as aresult. Optimisation of the design of any intersectionthus requires consideration of the MOEs appropriateto it and to those to whom these measures should beapplied.In the case of residential streets, the needs ofpedestrians should take precedence over the needs ofvehicles whereas, on higher-order roads, the needs ofmoving vehicles are more important. It follows that, inthe former case, convenience would be a primemeasure of efficiency. In the latter, energyconsumption becomes significant. In both cases, safetyis a major concern.With regard to vehicular traffic, the operation of anintersection requires that opposing streams of vehiclesare forced either to reduce speed or to stop.Optimisation of intersection efficiency in this caserefers essentially to a reduction of delay. Delay has twocomponents of interest. In the first, reference is totime costs. Signalisation, for example, forces a majorflow periodically to be brought to a stop to allowentry by the minor flow. A signalised intersection will,therefore, always tend to show higher total delay thanwould a priority-controlled intersection. In the secondcomponent, reference is to energy costs becausestationary vehicles with their engines idling are stillconsuming fuel.Vehicles travelling in a common direction are at a lowlevel of risk. Vehicles travelling in opposing directionsare at a higher level of risk. Highest yet is the level ofrisk associated with vehicles travelling in crossingdirections. Most accidents occurring on the roadnetwork take place at its intersections.For reasons both of efficiency and safety it is,therefore, necessary to pay careful attention to thedesign of intersections. Aspects of design that have tobe considered are:• the location of intersections;• the form of intersections;• the type of intersection control; and• the detailed design of individual intersectioncomponents.These four aspects are discussed in more detail in thesections that follow.Location of intersectionsTwo aspects of the location of intersections requireconsideration. The first of these relates to the spacingbetween successive intersections and the second torestraints applying to the location of individual orisolated intersections.Successive intersectionsThe spacing of successive intersections is essentiallya function of planning of the area being served.Minimum distances between intersections areprimarily concerned with the interaction betweenthese intersections. In the case of the major links inthe movement network, access control measuresare usually brought to bear to ensure the efficientfunctioning of the intersections on them.Ensuring green wave progression along a routewith signalised intersections would requirespacings of the order of 500 m.A driver cannot reasonably be expected to utilisethe decision sight distance to an intersectioneffectively if an intervening intersection requireshis or her attention. The sign sequence for anintersection includes signs beyond the intersection.Where an intersection is sufficiently important towarrant a sign sequence, the driver should bebeyond the last of these signs before beingrequired to give his attention to the followingintersection. Under these circumstances, aminimum spacing of 500 m between successiveintersections is also suggested.Spacings of this magnitude, therefore, typicallyapply to vehicle-only or to higher-order mixedusagestreets.On local streets, the goal is maximum accessibility.Any form of access control is inappropriate. Onecriterion for the spacing of their intersectionsshould be that they are not so close that waitingtraffic at one intersection could generate a queueextending beyond the next upstream intersection.Very closely spaced intersections would also resultin a disproportionate percentage of space beingdedicated to the road network.Isolated intersectionsConsiderations of safety suggest various restraintson the location of isolated intersections. The needfor drivers to discern and readily perform themanoeuvres necessary to pass through anintersection safely means that decision sightdistance, as previously described, should beRoads: Geometric design and layout planning Chapter 725
GUIDELINES FOR <strong>HUMAN</strong> <strong>SETTLEMENT</strong> <strong>PLANNING</strong> <strong>AND</strong> DESIGNavailable on the through-road on both sides of theintersection. The driver on the intersecting roadwill require intersection sight distance to be able toenter or cross the through-road safely.Modification of the alignment of either thethrough- or the intersecting road, or of both, maymake it possible to meet these requirements for asafe intersection. If not, it will be necessary torelocate the intersection.The location of an intersection on a horizontalcurve can create problems for the drivers on bothlegs of the intersecting road.Drivers on the intersecting road leg on the inside ofthe curve will find it difficult to see approachingtraffic, because this traffic will be partly behindthem. The fact that a large portion of the sighttriangle could fall outside the normal width of theroad reserve would also mean that both adequatedecision sight distance and adequate shouldersight distance may be lacking.Drivers on the leg of the intersecting road on theoutside of the curve seldom have any problemswith sight distance because, in addition to havingapproaching traffic partly in front of them, theymay have the added height advantage caused bythe superelevation of the curve. They do, however,have to negotiate the turn onto the through-roadagainst an adverse superelevation. In the urbansituation, where values of superelevation are low,this does not constitute a serious problem.The risk involved in sharp braking during anemergency should also be borne in mind whenlocating an intersection on a curve.Generally, an intersection should not be located ona curve with a superelevation greater than 6%.The stopping distance required on a downgrade of6% is approximately 40% longer than thatrequired on a level road. Drivers seemingly havedifficulty in judging the additional distancerequired for stopping on downgrades and it issuggested, as a safety measure, that intersectionsshould not be located on grades steeper than 3%.If it is not possible to align all the legs of anintersection to a gradient of 3% or less, thethrough-road could have a steeper gradientbecause vehicles on the intersecting road have tostop or yield, whereas through vehicles may onlyhave to do so occasionally.Where steep gradients on the intersecting road areunavoidable, a local reduction in its gradientwithin the reserve of the through-road should beconsidered. The reason for this is that buses andfreight vehicles have difficulty in stopping andpulling away on steep slopes. Typically, the camberof the through-road would be extended along theintersecting road for a sufficient distance to allowsuch vehicles to stop clear of the through-lane onthe through-road and pull away with relative ease.A distance of approximately 10 m from theshoulder breakpoint is required for this. After that,reverse curves with an intervening gradient of 6%or more can be used to match the local gradeline ofthe intersecting road to the rest of its alignment. Inthe case of private accesses, steeper grades can beconsidered.One of the consequences of a collision betweentwo vehicles at an intersection is that either or bothmay leave the road. It is therefore advisable toavoid locating an intersection other than atapproximately ground level. Lateral obstructions ofsight distance should also be considered when thelocation of an intersection is being determined.The location of an intersection may have to bemodified as a result of an excessive angle of skewbetween the intersecting roads, i.e. the change ofdirection to be negotiated by a vehicle turning leftoff the through-road. Preferably, roads shouldmeet at, or nearly at, right angles. Angles of skewbetween 60° and 120°, with 0° representing thedirection of travel on the through-road, produceonly a small reduction in visibility for drivers ofpassenger vehicles, which often does not warrantrealignment of the intersecting road. However, therange of angles of skew between 60° and 75°should be avoided because a truck driver wishingto enter the through-road at an intersection withan angle of skew of 75° or less would find the viewto his left obscured by his vehicle. Therefore, if theangle of skew of the intersection falls outside therange of 75° to 120°, the intersecting road shouldbe relocated.Figure 7.9 illustrates the acceptable angles of skew.The types of intersection controlSignalisationSignalisation applies only to higher-order roadsand is, in any event, an expensive form of control.Signals should not be employed, in the firstinstance, as speed-reducing devices. Signalsintroduce an inefficiency into the system byimposing delay on the through flow to allow theintersecting flow either to cross or to join it. Theobjective, generally, is to keep the introducedinefficiency to a minimum through the use ofproper signal progression. It is interesting to notethat an arterial with good signal progression candeliver more vehicles per unit of time to the CBDstreet system than the latter can handle. This maybe an argument in favour of deliberately26Chapter 7Roads: Geometric design and layout planning
GUIDELINES FOR <strong>HUMAN</strong> <strong>SETTLEMENT</strong> <strong>PLANNING</strong> <strong>AND</strong> DESIGNThis form of control is appropriate to the situationwhere no clear distinction can be drawn betweenthe intersecting roads in terms of relativeimportance and where traffic flows on each aremore or less equal. It is typically regarded as aninterim measure prior to the installation of trafficsignals.Mini roundabouts, traffic circles andgyratoriesThe principle difference between these three formsof control is the diameter of the central island. Thegyratory can have a central island with a diameterof 50 m or more, whereas the traffic circle wouldtypically have a central island with a diameter ofthe order of 10 m and the mini-roundabout acentral island that could range from a painted dotto about 4 m diameter.Figure 7.9: Angles of skewinterrupting the flow by a well-planneddiscontinuity in progression.Signals should not be used on the highest orderroads. At design speeds of 100 km/h and higher,problems with regard to the length of the amberphase and the extent of the dilemma zone manifestthemselves. The dilemma zone is that length ofroad upstream of a signal where, if the signalchanges to amber, it is possible neither to clear theintersection before the onset of the opposing greenphase nor to stop in advance of the pedestriancross-walk. If these speeds are to be maintained,freeway operation has to be considered.Multi-way stop or yieldReference is to the situation where every approachto the intersection is subject to stop or yieldcontrol. Some local authorities in South Africa havealso instituted a variation on this form of control byapplying stop control not to all but to the majorityof approach legs, e.g. two out of three or three outof four. In the United States, the operation ofintersections subject to this form of control grantspriority to vehicles approaching from the left. TheSouth African operation is based on the principleof “first come, first served”.The gyratory and the traffic circle operate on thebasis of entering vehicles being required to yield totraffic approaching from the right. The miniroundabout,on the other hand, is controlled by atraffic circle yield sign which, as defined in theRoad Traffic Regulations, “Indicates to the driver ofa vehicle approaching a traffic circle that he shallyield right of way to any vehicle which will crossany yield line at such intersection before him andwhich, in the normal course of events, will cross thepath of such driver’s vehicle.”The distinction between behaviour at a traffic circleand that required at a mini-roundabout is not clearto many drivers. Confusion is exacerbated by thefact that a warning sign (a triangular sign with theapex uppermost) requires that right of way shouldbe granted to vehicles approaching from the rightas is the case of the traffic circle.Priority controlPriority control implies that one of the intersectingroads always takes precedence over the other withcontrol taking the form of either stop or yieldcontrol. This form of control applies to the situationwhere it is clear which is the more important of thetwo intersecting roads. Priority control can also bealternated between successive intersections, forexample in a residential area where the layout ismore-or-less a grid pattern and the intersectingstreets are of equal importance. In this case, theswitching of priority would partially serve as atraffic calming measure. In general, this is the mostcommonly used form of intersection control.Selection of appropriate control measureEach intersection should be considered on its ownmerits and hard and fast rules or a “recipe” methodfor the selection of the control measure to beRoads: Geometric design and layout planning Chapter 727
GUIDELINES FOR <strong>HUMAN</strong> <strong>SETTLEMENT</strong> <strong>PLANNING</strong> <strong>AND</strong> DESIGNemployed at any given intersection are notrecommended.Volumes of vehicular traffic being served by theintersection are not considered to be anythingother than the roughest of guides. In terms oftraffic movement through an intersection, the basicgoal should be to minimise delay as far as possible.Delay has two components: geometric delay andtraffic delay. Geometric delay is the delay caused bythe existence of the control measure employed.The control measure requires that a driver slowdown or stop at the intersection, check that theintersection is clear and then accelerate back to theprevious speed. Geometric delay is the differencebetween the time taken to perform the requiredset of actions and that expended in travellingthrough the intersection area at undiminishedspeed. Traffic delay is that generated by opposingtraffic with, as an example, right-turning trafficbeing impeded by heavy opposing flows or causingimpedance to following vehicles that wish to travelstraight through the intersection.Schermers (1987) reports that, at flows of less than300 vehs/15 mins, traffic delays with four-way stopsare less than those with signalisation. In the rangeabove 900 vehs/15 mins, signalisation demonstratedthe lowest level of delay. Mini- roundabouts, onthe other hand, demonstrate relatively low levelsof delay, i.e. even less than four-way stops, up to aflow of about 400 vehs/15 mins. Thereafter, theextent of delay from using mini-roundaboutsincreases rapidly but remains less than that withsignalisation until a flow of 900 vehs/15 mins isachieved. Total traffic delay at 300 veh/15 minamounts to about 3 000 veh.sec/15 mins or about10 seconds per vehicle on average whereas, at 900vehs/15 mins, total traffic delay is about 16 000veh.sec/15 mins or about 18 seconds per vehicle onaverage.Priority control does not lend itself readily toanalyses of the above form, as the total delay iseven more heavily dependent on the split betweenthe opposing flows than in the cases discussedabove. Heavy flows on the through-road result inthere being relatively few gaps in the traffic streamthat are acceptable to drivers wishing to enter orcross from one of the intersecting legs. This resultsin substantial delays being generated. On the otherhand, for the same total flow but with fewer ofthese vehicles travelling on the through-road,adequate gaps exist for even relatively heavy flowson the intersecting road to experience little delay.Calculation of delay using a model such as the wellknownTanner formula should be applied to theseintersections.The form of intersectionsIntersection form is dictated largely by planningconsiderations. However, even during the planningphase, due cognisance has to be taken of the safety ofvehicles or pedestrians within the area of theintersections. Safety is enhanced by, inter alia,reduction of the number of conflict points at whichaccidents can occur.The number of conflict points increases exponentiallywith the number of legs added to the intersection. Athree-legged intersection generates six vehicle-vehicleconflict points, whereas a four- legged intersection has24 and a five-legged intersection 60. Accident historyshows that this increased potential for collision atintersections is, in fact, realised.In addition to the decrease in safety with an increasingnumber of approaches to an intersection, there is alsoa decline in operational efficiency, i.e. an increase indelay.Multi-leg intersections, i.e. intersections with morethan four legs, should not be provided in new designsand, where they occur in existing networks, everyeffort should be made to convert them to four- orthree-legged intersections through channelisationprocedures.Staggered intersections address the problem ofskewed intersections (i.e. those with angles of skewoutside the limits recommended above) which can beeither three- or four-legged. Skewed intersectionspresent a variety of problems. In the first instance,angles of skew greater than those specified generate aline-of-sight problem for the driver on the intersectingroad. Secondly, a vehicle required to turn through theacute angle will be moving at a very slow speed,suggesting that those entering the through-road mayrequire a greater sight distance than would be thecase for a 90° turn. Finally, the surfaced intersectionarea becomes excessive. Without channelisation of thismovement, a driver traversing the intersection isconfronted by a large surfaced area without anypositive guidance on the route to be followed.Unpredictable selections of travelled path canrepresent a distinct hazard to other vehicles in theintersection area.Four-legged skewed intersections should be relocatedso that they form either a single crossing with an angleof skew closer to 90°, or a staggered intersection,which is a combination of two three-leggedintersections in close proximity. The right-left stagger,i.e. where the driver on the intersecting road isrequired to turn right onto the through-road followedby a left turn off it, is preferred. In this case, the driverwaits on the intersecting road for a gap in thethrough-traffic prior to entering the through-road,with the left turn off it being unimpeded except28Chapter 7Roads: Geometric design and layout planning
GUIDELINES FOR <strong>HUMAN</strong> <strong>SETTLEMENT</strong> <strong>PLANNING</strong> <strong>AND</strong> DESIGNpossibly by pedestrians. The left-right stagger mayrequire the vehicle to stop on the through-road whileawaiting a gap in the opposing flow to complete theright turn. Relocation of the intersection is to bepreferred to the left-right stagger.Mini-roundabouts can have either three or fourapproach legs. They comprise either a slightly raised ora painted central island, usually less than 4 metres indiameter, with the traffic lanes being deviated slightly,both to accommodate the island and to force areduction of speed through the intersection. Thediscussion above relating to angles of skew appliesequally to this form of intersection.Intersection componentsAuxiliary through-lanesAuxiliary lanes for through-traffic are addedoutside the through-lanes to match the capacity ofthe intersection with that of the road betweenintersections. These lanes are normally onlyprovided at signalised intersections. The length oflane to be added is a matter of calculation. It isdependent on the traffic flow to be serviced andon the length of green time available for theapproach leg in question. In the case of prioritycontrol, auxiliary through-lanes would not berequired on the through-road. Traffic volumes onthe intersecting road would probably be too lowto warrant their application. This should, however,be checked.Auxiliary turning lanesTurning lanes provide for traffic turning eitherto the left or to the right and can thus beadded either outside the through-lanes orimmediately adjacent to the centreline.In the latter case, the through-lanes would have tobe deviated away from the centreline if there is nota median island wide enough to accommodate theright-turn lane. Particularly at night, a wet, hencereflective, road surface causes the road markingsnot to be readily visible. Deviation of a throughlaneshould therefore be clearly demarcated byroad studs to ensure that vehicles do notinadvertently stray into the right-turn lane.The extent of deviation provided is dependent onthe extent of offset provided to the right-turn lane.Good practice suggests that opposing right-turnlanes should be in line with each other to providethe turning driver with the maximum clear view ofoncoming traffic that would oppose the turningmovement. In this case, the deviation of thethrough-lane would amount to only half of thewidth of the turning lane.Ideally, turning lanes should have the same widthas the adjacent lanes but spatial limitations mayrequire that a smaller width be used. The lowspeeds anticipated in turning lanes in combinationwith relatively low lane occupancy make it possibleto use lesser widths, but the width of the turninglane should not be less than 3,1 m.The length of turning lanes has three components:the deceleration length, the storage length and theentering taper.Deceleration should, desirably, take place clear ofthe through-lane. The total length required is thatnecessary for a safe and comfortable stop from thedesign speed of the road. Stopping sight distance isbased on a deceleration rate of 3,0 m/s 2 and acomfortable rate is taken as being half this, so thats =v 238,9where s = deceleration lane length (m)v = design speed (km/h)The storage length has to be sufficient for thenumber of vehicles likely to accumulate during acritical period. It should not be necessary for rightturningvehicles to stop in the through-lane.Furthermore, vehicles stopped in the through-lanewhile awaiting a change of traffic signal phaseshould not block the entrance to the turning lane. Inthe case of unsignalised intersections, the storagelength should be sufficient to accommodate thenumber of vehicles likely to arrive in a two-minuteperiod. At signalised intersections, the requiredstorage length depends on the signal cycle length,the phasing arrangement and the rate of arrivals ofright-turning vehicles. The last-mentioned can bemodelled using the Poisson distribution which isP(x=r) =e -m m rr!where e = base of natural logarithmsm = constant equal to thevalue of arrivalsr = the number of arrivals forwhich the probability isbeing calculated.In both signalised and unsignalised intersections,the length of storage lane should be sufficient toaccommodate at least two passenger cars. If busesor trucks represent more than 10% of the turningtraffic, provision should be made for storage of atleast one passenger car and one bus or truck. Itshould be noted that the length of the design busis 12,3 m, compared with the 9,1 m of the truck.Roads: Geometric design and layout planning Chapter 729
GUIDELINES FOR <strong>HUMAN</strong> <strong>SETTLEMENT</strong> <strong>PLANNING</strong> <strong>AND</strong> DESIGNThe shorter length could be used only if the road isnot intended to serve as a bus route.TapersTapers can be either passive, allowing a lateralmovement in the traffic stream, or active, forcingthe lateral movement to take place. Thus, theaddition of a lane to the cross-section is preceded bya passive taper, and a lane drop by an active taper. Ingeneral, an active taper should be long whereas apassive taper can be short. In the latter case, a tapercan be “squared off”, meaning that a full-width laneis added instantaneously and the taper demarcatedby road marking as opposed to physicallyconstructing a tapered length of road.Taper rates are shown in Table 7.20.The lower taper rate for active kerbed tapers ispermissible because of the higher visibility of thekerbing which, for this purpose, should be highlightedwith paint or reflective markings. Very often, the needfor storage space at urban intersections outweighsthe need for smooth transitions. In this case thepassive taper rate can be reduced to 1:2.Kerbing and kerb radiiBarrier or semi-mountable kerbing isrecommended for intersections because of themore visible demarcation of the lane edge thatthey offer. In the presence of pedestrians, barrierkerbing is the preferred option. In either case,ramps should be provided for prams andwheelchairs. Kerbing is normally offset by 0,3 mfrom the lane edge.Left-turning traffic must be able to negotiate theturn without encroaching on either the adjacentshoulder or sidewalk or on the opposing lane. Thelatter requirement can, however, be relaxed in thecase of the occasional large vehicle on a street withlow traffic volumes.Various forms of edge treatment are described inTable 7.21.It should be noted that the minimum outer turningradius of a passenger car is of the order of 6,2 m. Apassenger car would thus, at a crawl speed, just beable to maintain position relative to a left- turningkerb with a radius of about 4,0 m.The three-centre curve closely approximates theactual path of a vehicle negotiating the turn. Thishas the effect of reducing the extent of the surfacedarea that has to be provided and is, thus,particularly useful where a change of direction ofgreater than 90° has to be accommodated. Thisclose approximation to actual wheel paths alsosuggests that it offers a level of guidance to turningvehicles better than that provided by simple curves.Corner splaysDepending on the width of the road reserve, it maybe necessary to splay the reserve boundary in theintersection area to provide adequate stoppingsight distance for drivers both on the major and theminor legs of the intersection. In general, aminimum width of border area around the cornershould be of the order of 3,5 m.Table 7.20:Taper ratesDESIGN SPEED (km/h) 30 40 50 60 80 100Passive tapersTaper rate (1 in) 5 8 10 15 20 25Active tapersTaper rate (1 in) for painted line taper 20 23 25 35 40 45Taper rate (1 in) for kerbed taper 10 13 15 20 25 30Table 7.21:Typical edge treatments for left turnsTREATMENTMINIMUM KERBRADIUS (m)APPROACH/DEPARTURETREATMENTSimple curve 10 NilSimple curve with tapers 6 1:15 tapersThree-centred curve 6 Ratio of curvature 2:1:4Channelised turning roadway with three-centred curve 15 Ratio of curvature 2:1:4Channelised turning roadway with simple curve and tapers 25 1:10 tapers30Chapter 7Roads: Geometric design and layout planning
GUIDELINES FOR <strong>HUMAN</strong> <strong>SETTLEMENT</strong> <strong>PLANNING</strong> <strong>AND</strong> DESIGNChannelisationChannelisation involves the use of islands and roadmarkings and is usually required where trafficvolumes are high. The purposes of channelisationwith regard to vehicle movement are to:• separate areas for manoeuvring and presentdrivers with one decision at a time;• control the direction of movement of vehiclesto obtain small angles for merging anddiverging at low relative speeds or approximateright angles for crossing at high relative speeds;• control speed by redirection or funnelling, thelatter implying a steady reduction of lane widthover a short distance;• provide protection and storage for turningvehicles;• eliminate excessive surfaced areas which permitdrivers to perform improper manoeuvres or totravel along paths unpredictable to otherdrivers;• prevent illegal manoeuvres, such as turns in thewrong direction into one-way streets; and• provide space and protection for traffic controldevices and other road signs.Channelisation is also required at intersectionswhere traffic volumes may be relatively low butpedestrian volumes high. In this case, the functionof channelisation is directed towards providingrefuge for pedestrians seeking to cross the varioustraffic flows.Walking speeds are typically of the order of 1,5 m/s.In the vicinity of old-age homes and similar areas,accommodation should be made for a walkingspeed of about 1 m/s. Crossing a two-lane streetwould thus require a gap or a lag of about sevenseconds. A gap is the difference between the timesof arrival at the crossing point by two successivevehicles. The lag is the unexpired portion of a gap,i.e. the time between the pedestrian arriving at thecrossing point and an opposing vehicle arriving atthe same point. On multilane streets, the crossingtime is correspondingly higher.If traffic flows are such that a gap or lag equal toor greater than the crossing time is not available atabout one minute intervals, pedestrians aretempted to cross by pausing on the roadmarkingsbetween the various flows to await the gap in thenext flow to be crossed.This is not a normally recommended practice. It canbe avoided by the provision of islands which havethe effect of reducing the duration of the requiredgap, hence increasing the probability of itsoccurrence. Alternatively, the creation of adequategaps can be forced by the use of demarcated or,preferably, signalised pedestrian crossings.IslandsIslands, whether painted or kerbed, can be classedinto three groups:• directional islands, which direct traffic alongthe correct channels or prevent illegalmanoeuvres;• divisional islands, which separate opposingtraffic flows; and• refuge islands, to protect pedestrians crossingthe roadway or turning vehicles that arerequired to stop while awaiting gaps in theopposing traffic, and also to provide space fortraffic control devices.Typically, islands are either long and narrow ortriangular in shape. The circular central island isconsidered more a traffic control device than achannelisation feature. Small islands have lowvisibility and cannot serve safely as eitheraccommodation for pedestrians or traffic controldevices. Islands should not have an area of less than5 m 2 or width of less than 1,2 m. Islands used aspedestrian refuges should preferably be 3,0 mwide. Painted islands do not constitute a significantrefuge for pedestrians and should not be used inthis application. Pedestrian refuge islands shouldbe provided with barrier kerbing and ramps forwheelchairs and prams.Island kerbing is usually introduced suddenly. Forthis reason, the approach end requires carefuldesign. In the case of triangular islands, the pointof intersection of the approach sides of the islandshould be rounded and painted and, possibly, alsobe provided with reflective markings. Theapproach end should also be offset from the edgeof the adjacent lane, as shown in Figure 7.10.Turning roadwaysThe normal track width of a vehicle is the distancebetween the outer faces of the rear tyres. When acurve is being negotiated, the rear wheels trackinside the front wheels and the track width thenbecomes the radial distance between the path ofthe outside front wheel and the inside rear wheel.On turning roadways, it is this greater width thathas to be accommodated. The turning roadwaywidth is thus a function of:Roads: Geometric design and layout planning Chapter 731
GUIDELINES FOR <strong>HUMAN</strong> <strong>SETTLEMENT</strong> <strong>PLANNING</strong> <strong>AND</strong> DESIGNTurning roadway1,0R0,6Shoulder width0,6Direction of travelMinimum area5m•Through lane direction of travelR0,6Figure 7.10: Layout of islandR0,30,6Dimensions in metres• the flow operation being designed for;• the design vehicle to be accommodated; and• the radius of curvature of the turning roadway.With regard to the first-mentioned, threeoperations need to be addressed. These are:• Case I: One-lane one-way operation, with noprovision for passing a stalled vehicle.• Case II: One-lane one-way operation, withprovision for passing a stalled vehicle.• Case III: Two-lane operation, either one-way ortwo-way.Design vehicles to be accommodated are passengercars (P), single-unit trucks or buses (SU) andarticulated vehicles (WB12). The selection of designvehicle is addressed as the traffic condition beingdesigned for. These are:• Traffic Condition A - Predominantly P vehiclesbut some consideration given to SUs.• Traffic Condition B - Sufficient SUs (approx 10%)to govern design but some consideration givento WB12s.• Traffic Condition C - Sufficient WB12s to governdesign.Provision for passing stalled vehicles and two-laneoperation require a combination of design vehicles.The combinations normally considered are shown inTable 7.22.Table 7.22:The selected lane width either should or can bemodified depending on the selected edge treatment.Three edge treatments have to be accommodated.These are mountable kerbing, barrier or semimountablekerbing, and the stabilised shoulder. Theycan occur in combination, e.g. a barrier kerb on oneside of the lane and a stabilised shoulder on the other.Shoulders would only be used at intersections if thecross-section of the road upstream and downstream ofthe intersection includes shoulders. In the presence ofpedestrians, kerbing is necessary.Recommended turning roadway widths are listed inTable 7.23. for the various cases, conditions and edgetreatments.The crossfall prevailing on the through-lanes is simplyextended across the turning roadways. Shouldsuperelevation be deemed to be necessary, it couldbe achieved by the use of a crossover crown line, inwhich case the maximum superelevation could be ashigh as 6%.Mini-roundaboutsDesign traffic conditionsCASE A B CI P SU WB12II P-P P-SU SU-SUIII P-SU SU-SU WB12-WB12Mini-roundabouts are the one exception to thegeneral practice of avoiding the use of intersectioncontrols as traffic calming devices. They can be usedeither as intersection controls or as traffic calmingdevices. In the latter case, however, their applicationshould be as part of area-wide traffic calming schemesrather than in isolation.The mini-roundabout comprises a central circularisland, deflector islands on each of the approach legsand a circular travelled way around the central island.On a three-legged or T-intersection, it is frequentlynecessary to apply speed humps to the approach fromthe left on the cross leg of the T. The reason for this isthat the location of the circular island is invariably suchthat traffic on this leg has a straight line path throughthe intersection and it is necessary to force a reductionof speed.32Chapter 7Roads: Geometric design and layout planning
GUIDELINES FOR <strong>HUMAN</strong> <strong>SETTLEMENT</strong> <strong>PLANNING</strong> <strong>AND</strong> DESIGNTable 7.23:Turning roadway widths (m)CASE I CASE II CASE IIIRADIUS ON INNER EDGE (m)DESIGN TRAFFIC CONDITIONA B C A B C A B C15 5,4 5,4 6,9 6,9 7,5 8,7 9,3 10,5 12,625 4,8 5,1 5,7 6,3 6,9 8,1 8,7 9,9 11,130 4,5 4,8 5,4 6,0 6,6 7,5 8,4 9,3 10,550 4,2 4,8 5,1 5,7 6,3 7,2 8,1 9,0 9,975 3,9 4,8 4,8 5,7 6,3 6,9 8,1 8,7 9,3100 3,9 4,5 4,8 5,4 6,0 6,6 7,8 8,4 0,0125 3,7 4,5 4,8 5,4 6,0 6,6 7,8 8,4 8,7150 3,7 4,5 4,5 5,4 6,0 6,6 7,8 8,4 8,7TANGENT 3,7 4,5 4,5 5,1 5,7 6,3 7,5 8,1 8,1WIDTH MODIFICATION APPROPRIATE TO EDGE TREATMENTMountable kerb none none noneBarrier kerb one side add 0,3 m none add 0,3 mBarrier kerb both sides add 0,6 m add 0,3 m add 0,6 mStabilised shoulder one or both sides Condition B & C lane Deduct shoulder Deduct 0,6 m wherewidths on tangent width; minimum shoulder is 1,2 m ormay be reduced to width as for wider3,7 m for 1,2 m or Case Iwider shoulderMini-roundabouts have negative implications forcyclists and, to a lesser extent, for pedestrians.Circulation of traffic through a roundabout is notstraightforward and the need for vehicles to stop atthe intersection is reduced. Crossing opportunitiesfor pedestrians are thus similarly reduced and thetask of judging acceptable gaps is more difficult. Thecirculatory flow and reduced carriageway widthoffer less protected space for cyclists. In addition,motorists are seldom prepared to yield the right ofway to cyclists. These two classes of road users thusrequire careful consideration in the design of theseintersections and appropriate facilities provided forthem.Central islandThe central island is typically of the order of 4,0m in diameter. It may simply be a painted island,although the preferred option is that it should bean asphalt hump. The latter offers more specificguidance to drivers and ensures that the miniroundaboutoperates as intended. The heightof the hump should be in the range of 75 mmto 100 mm. This is a compromise between theheight that is visible to approaching drivers andthe height that long vehicles can traverse withoutdamage. The guidance role is strengthened, andthe asphalt hump simultaneously protected fromdamage by passing vehicles, if the central island issurrounded by a 25 mm high steel hoop, securelyanchored to the road surface.Width of travelled wayThe inscribed circle diameter is dependent on thedesign vehicle. Britain and Australia bothrecommend a diameter of 28 m, suggesting thusthat the travelled way has a width of 12 m,assuming that the traffic circle has a diameter of4 m. This corresponds to use of a WB-12 as thedesign vehicle. South African practice, where themini-roundabout is typically used in residentialareas, is to use the passenger car or the bus as thedesign vehicle of choice. If the roundabout is notlocated on a bus route, the inscribed circleRoads: Geometric design and layout planning Chapter 733
GUIDELINES FOR <strong>HUMAN</strong> <strong>SETTLEMENT</strong> <strong>PLANNING</strong> <strong>AND</strong> DESIGNdiameter could be reduced to 14 m. Bus routeswould require an inscribed circle 25 m in diameterand this width is adequate for two-lane operationby passenger cars.Deflector islandsKerbed islands are used to guide vehicles into theintersection area. The side of the island closest tothe traffic approaching the intersection thusconstitutes an active taper. A taper rate of 1:10appropriate to a design speed of 30 km/h should beemployed. The side of the island downstream ofthe intersection is also an active taper insofar as itserves as a transition from the wider lane widtharound the mini-roundabout to the normal lanewidth applying to the rest of the street, and thesame taper rate applies. In this case, however, thetaper rate is relative to the direction of movementof vehicles exiting from the intersection. Theapproach end of the island should be rounded andoffset as illustrated in Fig 7.10.The kerbed island is normally preceded by apainted island.34Chapter 7Roads: Geometric design and layout planning
GUIDELINES FOR <strong>HUMAN</strong> <strong>SETTLEMENT</strong> <strong>PLANNING</strong> <strong>AND</strong> DESIGNBIBLIOGRAPHYAmerican Association of State Highway andTransportation Officials (1994). A policy on geometricdesign of highways and streets. Washington.Brafman Bahar, G (1983). A need for revised geometricstandards based on truck stopping distance and drivereye height. <strong>CSIR</strong>, National Institute for Transport andRoad Research, Report RF/3/83. Pretoria. Departmentof Transport, in Pretoria.CUTA (1991). Guidelines for the transportation systemmanagent process. Committee of Urban TransportAuthorities (Draft Urban Transport Guidelines UTG9).Department of Transport (1992). Pedestrian facilityguidelines: Maunual to plan, design and maintain safepedestrian facilities. Report no 92/126. Department ofTransport, Pretoria.Glennon, J C (1970). An evaluation of design criteriafor operating trucks safely on grades. TransportationResearch Board Record 312. pp 93-112.Harwood, D W and Glennon, J C (1989). Passing sightdistance design for passenger cars and trucks.Transportation Research Board Record 1208. pp 59-69.Washington.Lea, J D (1996). Skid resistance of unpaved roads.<strong>CSIR</strong>, Division of Roads and Transport Technology,Report CR-96/007. Pretoria.Mkhacane, H S (1992). Geometric standards forunpaved roads. <strong>CSIR</strong>, Department of Transport, Report92/271. Pretoria.Pretorius, H B (1976). Eye-heights of drivers of cars andvans. <strong>CSIR</strong>, National Institute for Transport and RoadResearch Report RF/3/76. Pretoria.Schermers, G (1987). Roundabouts - An alternative tointersection control. <strong>CSIR</strong>, National Institute forTransport and Road Research, Report RT/83. Pretoria.Schermers, G and Theyse, H, (1996). Nationalguidelines for traffic calming. Department ofTransport Report no CR-96/036, Pretoria.Transportation Research Board (TRB) (1994). SpecialReport 209. Highway Capacity Manual. Washington.Wolhuter, K M and Skutil, V (1990). Parameters forSouth African design vehicles. Department ofTransport, Report 89/214. Pretoria.Wolhuter, K M (1990). Warrants for climbing lanes.M Eng thesis. University of Pretoria.Roads: Geometric design and layout planning Chapter 735
GUIDELINES FOR <strong>HUMAN</strong> <strong>SETTLEMENT</strong> <strong>PLANNING</strong> <strong>AND</strong> DESIGN36Chapter 7Roads: Geometric design and layout planning
Chapter 8Roads: Materials andconstruction8
GUIDELINES FOR <strong>HUMAN</strong> <strong>SETTLEMENT</strong> <strong>PLANNING</strong> <strong>AND</strong> DESIGNTABLE OF CONTENTSINTRODUCTION . . . . . . . . . . . . . . . . . . . . . . . . . . . . . . . . . . . . . . . . . . . . . . . . . . . . . . . . . . . . . . . . . . . 1SCOPE <strong>AND</strong> NATURE OF THIS CHAPTER . . . . . . . . . . . . . . . . . . . . . . . . . . . . . . . . . . . . . . . . . . . . . . . . . 1DESIGN PHILOSOPHY . . . . . . . . . . . . . . . . . . . . . . . . . . . . . . . . . . . . . . . . . . . . . . . . . . . . . . . . . . . . . . .1Provision and ability to pay . . . . . . . . . . . . . . . . . . . . . . . . . . . . . . . . . . . . . . . . . . . . . . . . . . . . . . . . . .1Appropriate standards . . . . . . . . . . . . . . . . . . . . . . . . . . . . . . . . . . . . . . . . . . . . . . . . . . . . . . . . . . . . . .1Environmental impact . . . . . . . . . . . . . . . . . . . . . . . . . . . . . . . . . . . . . . . . . . . . . . . . . . . . . . . . . . . . . . .1Risk . . . . . . . . . . . . . . . . . . . . . . . . . . . . . . . . . . . . . . . . . . . . . . . . . . . . . . . . . . . . . . . . . . . . . . . . . . . . .2THE PAVEMENT DESIGN PROCESS . . . . . . . . . . . . . . . . . . . . . . . . . . . . . . . . . . . . . . . . . . . . . . . . . . . . . 2Level of service . . . . . . . . . . . . . . . . . . . . . . . . . . . . . . . . . . . . . . . . . . . . . . . . . . . . . . . . . . . . . . . . . . . .2Stormwater accommodation . . . . . . . . . . . . . . . . . . . . . . . . . . . . . . . . . . . . . . . . . . . . . . . . . . . . . . . . .2Economic considerations and design strategy . . . . . . . . . . . . . . . . . . . . . . . . . . . . . . . . . . . . . . . . . . . .3STRUCTURE OF THIS CHAPTER . . . . . . . . . . . . . . . . . . . . . . . . . . . . . . . . . . . . . . . . . . . . . . . . . . . . . . . . 3THE COMPONENTS OF THE DESIGN PROCESS. . . . . . . . . . . . . . . . . . . . . . . . . . . . . . . . . . . . . . . . . . . . . 5SERVICE OBJECTIVE. . . . . . . . . . . . . . . . . . . . . . . . . . . . . . . . . . . . . . . . . . . . . . . . . . . . . . . . . . . . . . . . . 5COMPILING A STREET “PROFILE” . . . . . . . . . . . . . . . . . . . . . . . . . . . . . . . . . . . . . . . . . . . . . . . . . . . . . . 5Street categories . . . . . . . . . . . . . . . . . . . . . . . . . . . . . . . . . . . . . . . . . . . . . . . . . . . . . . . . . . . . . . . . . . .5Street function . . . . . . . . . . . . . . . . . . . . . . . . . . . . . . . . . . . . . . . . . . . . . . . . . . . . . . . . . . . . . . . . . . . .6Level of service (LOS) . . . . . . . . . . . . . . . . . . . . . . . . . . . . . . . . . . . . . . . . . . . . . . . . . . . . . . . . . . . . . . .6Street standards . . . . . . . . . . . . . . . . . . . . . . . . . . . . . . . . . . . . . . . . . . . . . . . . . . . . . . . . . . . . . . . . . . .6The street as public open space . . . . . . . . . . . . . . . . . . . . . . . . . . . . . . . . . . . . . . . . . . . . . . . . . . . . . . .8DESIGN STRATEGY . . . . . . . . . . . . . . . . . . . . . . . . . . . . . . . . . . . . . . . . . . . . . . . . . . . . . . . . . . . . . . . . . 8Paved streets . . . . . . . . . . . . . . . . . . . . . . . . . . . . . . . . . . . . . . . . . . . . . . . . . . . . . . . . . . . . . . . . . . . . . .8Selection of analysis period . . . . . . . . . . . . . . . . . . . . . . . . . . . . . . . . . . . . . . . . . . . . . . . . . . . . . . . . .10Structural design period . . . . . . . . . . . . . . . . . . . . . . . . . . . . . . . . . . . . . . . . . . . . . . . . . . . . . . . . . . . .10DESIGN TRAFFIC <strong>AND</strong> BEARING CAPACITY. . . . . . . . . . . . . . . . . . . . . . . . . . . . . . . . . . . . . . . . . . . . . . 10Paved streets . . . . . . . . . . . . . . . . . . . . . . . . . . . . . . . . . . . . . . . . . . . . . . . . . . . . . . . . . . . . . . . . . . . . .10Unpaved streets . . . . . . . . . . . . . . . . . . . . . . . . . . . . . . . . . . . . . . . . . . . . . . . . . . . . . . . . . . . . . . . . . .15MATERIALS . . . . . . . . . . . . . . . . . . . . . . . . . . . . . . . . . . . . . . . . . . . . . . . . . . . . . . . . . . . . . . . . . . . . . . 15Description of major material types . . . . . . . . . . . . . . . . . . . . . . . . . . . . . . . . . . . . . . . . . . . . . . . . . . .15Roads: Materials and construction Chapter 8i
GUIDELINES FOR <strong>HUMAN</strong> <strong>SETTLEMENT</strong> <strong>PLANNING</strong> <strong>AND</strong> DESIGNPAVEMENT TYPES . . . . . . . . . . . . . . . . . . . . . . . . . . . . . . . . . . . . . . . . . . . . . . . . . . . . . . . . . . . . . . . . . 16Behaviour of different pavement types . . . . . . . . . . . . . . . . . . . . . . . . . . . . . . . . . . . . . . . . . . . . . . . .16ENVIRONMENT . . . . . . . . . . . . . . . . . . . . . . . . . . . . . . . . . . . . . . . . . . . . . . . . . . . . . . . . . . . . . . . . . . . 20Topography . . . . . . . . . . . . . . . . . . . . . . . . . . . . . . . . . . . . . . . . . . . . . . . . . . . . . . . . . . . . . . . . . . . . . .20Climate and structural design . . . . . . . . . . . . . . . . . . . . . . . . . . . . . . . . . . . . . . . . . . . . . . . . . . . . . . . .20Climate and subgrade California Bearing Ratio (CBR) . . . . . . . . . . . . . . . . . . . . . . . . . . . . . . . . . . . . .21Material depth . . . . . . . . . . . . . . . . . . . . . . . . . . . . . . . . . . . . . . . . . . . . . . . . . . . . . . . . . . . . . . . . . . .22Delineation of subgrade areas . . . . . . . . . . . . . . . . . . . . . . . . . . . . . . . . . . . . . . . . . . . . . . . . . . . . . . .22Design CBR of subgrade . . . . . . . . . . . . . . . . . . . . . . . . . . . . . . . . . . . . . . . . . . . . . . . . . . . . . . . . . . . .22STRUCTURAL DESIGN METHODS. . . . . . . . . . . . . . . . . . . . . . . . . . . . . . . . . . . . . . . . . . . . . . . . . . . . . . 22Design methods for paved streets . . . . . . . . . . . . . . . . . . . . . . . . . . . . . . . . . . . . . . . . . . . . . . . . . . . .22Design methods for unpaved streets . . . . . . . . . . . . . . . . . . . . . . . . . . . . . . . . . . . . . . . . . . . . . . . . . .24PRACTICAL CONSIDERATIONS. . . . . . . . . . . . . . . . . . . . . . . . . . . . . . . . . . . . . . . . . . . . . . . . . . . . . . . . 24Surface drainage . . . . . . . . . . . . . . . . . . . . . . . . . . . . . . . . . . . . . . . . . . . . . . . . . . . . . . . . . . . . . . . . . .24Subsurface drainage . . . . . . . . . . . . . . . . . . . . . . . . . . . . . . . . . . . . . . . . . . . . . . . . . . . . . . . . . . . . . . .25Compaction . . . . . . . . . . . . . . . . . . . . . . . . . . . . . . . . . . . . . . . . . . . . . . . . . . . . . . . . . . . . . . . . . . . . . .29Subgrade below material depth . . . . . . . . . . . . . . . . . . . . . . . . . . . . . . . . . . . . . . . . . . . . . . . . . . . . . .30Street levels . . . . . . . . . . . . . . . . . . . . . . . . . . . . . . . . . . . . . . . . . . . . . . . . . . . . . . . . . . . . . . . . . . . . . .30Service trenches . . . . . . . . . . . . . . . . . . . . . . . . . . . . . . . . . . . . . . . . . . . . . . . . . . . . . . . . . . . . . . . . . .31Pavement cross-section . . . . . . . . . . . . . . . . . . . . . . . . . . . . . . . . . . . . . . . . . . . . . . . . . . . . . . . . . . . . .31Considerations for concrete pavements . . . . . . . . . . . . . . . . . . . . . . . . . . . . . . . . . . . . . . . . . . . . . . . .32Kerbs and channels . . . . . . . . . . . . . . . . . . . . . . . . . . . . . . . . . . . . . . . . . . . . . . . . . . . . . . . . . . . . . . . .32Edging . . . . . . . . . . . . . . . . . . . . . . . . . . . . . . . . . . . . . . . . . . . . . . . . . . . . . . . . . . . . . . . . . . . . . . . . . .32Accessibility . . . . . . . . . . . . . . . . . . . . . . . . . . . . . . . . . . . . . . . . . . . . . . . . . . . . . . . . . . . . . . . . . . . . . .32COST ANALYSIS . . . . . . . . . . . . . . . . . . . . . . . . . . . . . . . . . . . . . . . . . . . . . . . . . . . . . . . . . . . . . . . . . . . 32General . . . . . . . . . . . . . . . . . . . . . . . . . . . . . . . . . . . . . . . . . . . . . . . . . . . . . . . . . . . . . . . . . . . . . . . . .32Present worth . . . . . . . . . . . . . . . . . . . . . . . . . . . . . . . . . . . . . . . . . . . . . . . . . . . . . . . . . . . . . . . . . . . .32Construction costs . . . . . . . . . . . . . . . . . . . . . . . . . . . . . . . . . . . . . . . . . . . . . . . . . . . . . . . . . . . . . . . . .33Maintenance costs . . . . . . . . . . . . . . . . . . . . . . . . . . . . . . . . . . . . . . . . . . . . . . . . . . . . . . . . . . . . . . . .33Real discount rate . . . . . . . . . . . . . . . . . . . . . . . . . . . . . . . . . . . . . . . . . . . . . . . . . . . . . . . . . . . . . . . . .34Salvage value . . . . . . . . . . . . . . . . . . . . . . . . . . . . . . . . . . . . . . . . . . . . . . . . . . . . . . . . . . . . . . . . . . . .34iiChapter 8Roads: Materials and construction
GUIDELINES FOR <strong>HUMAN</strong> <strong>SETTLEMENT</strong> <strong>PLANNING</strong> <strong>AND</strong> DESIGNOptimisation of life-cycle costs . . . . . . . . . . . . . . . . . . . . . . . . . . . . . . . . . . . . . . . . . . . . . . . . . . . . . . .35DISCUSSION ON THE DESIGN PROCEDURES FOR DIFFERENT STREET TYPES. . . . . . . . . . . . . . . . . . . . . 36PAVED ARTERIAL <strong>AND</strong> ACCESS STREETS. . . . . . . . . . . . . . . . . . . . . . . . . . . . . . . . . . . . . . . . . . . . . . . . 36The design process . . . . . . . . . . . . . . . . . . . . . . . . . . . . . . . . . . . . . . . . . . . . . . . . . . . . . . . . . . . . . . . .36PAVED BASIC ACCESS STREETS . . . . . . . . . . . . . . . . . . . . . . . . . . . . . . . . . . . . . . . . . . . . . . . . . . . . . . . 41Structural design of paved basic access streets . . . . . . . . . . . . . . . . . . . . . . . . . . . . . . . . . . . . . . . . . . .41UNPAVED ARTERIAL <strong>AND</strong> ACCESS STREETS . . . . . . . . . . . . . . . . . . . . . . . . . . . . . . . . . . . . . . . . . . . . . 43Street category . . . . . . . . . . . . . . . . . . . . . . . . . . . . . . . . . . . . . . . . . . . . . . . . . . . . . . . . . . . . . . . . . . .43Design strategy . . . . . . . . . . . . . . . . . . . . . . . . . . . . . . . . . . . . . . . . . . . . . . . . . . . . . . . . . . . . . . . . . . .43Materials . . . . . . . . . . . . . . . . . . . . . . . . . . . . . . . . . . . . . . . . . . . . . . . . . . . . . . . . . . . . . . . . . . . . . . . .43Design of imported layers . . . . . . . . . . . . . . . . . . . . . . . . . . . . . . . . . . . . . . . . . . . . . . . . . . . . . . . . . . .43UNPAVED BASIC ACCESS STREETS. . . . . . . . . . . . . . . . . . . . . . . . . . . . . . . . . . . . . . . . . . . . . . . . . . . . . 44TERTIARY WAYS . . . . . . . . . . . . . . . . . . . . . . . . . . . . . . . . . . . . . . . . . . . . . . . . . . . . . . . . . . . . . . . . . . 44Layout . . . . . . . . . . . . . . . . . . . . . . . . . . . . . . . . . . . . . . . . . . . . . . . . . . . . . . . . . . . . . . . . . . . . . . . . . .44Material . . . . . . . . . . . . . . . . . . . . . . . . . . . . . . . . . . . . . . . . . . . . . . . . . . . . . . . . . . . . . . . . . . . . . . . .45Design of tertiary ways (standard cross-sections) . . . . . . . . . . . . . . . . . . . . . . . . . . . . . . . . . . . . . . . . .45CONSTRUCTION . . . . . . . . . . . . . . . . . . . . . . . . . . . . . . . . . . . . . . . . . . . . . . . . . . . . . . . . . . . . . . . . . . 48Staged construction and upgrading . . . . . . . . . . . . . . . . . . . . . . . . . . . . . . . . . . . . . . . . . . . . . . . . . . .48Construction approaches . . . . . . . . . . . . . . . . . . . . . . . . . . . . . . . . . . . . . . . . . . . . . . . . . . . . . . . . . . .51DESIGNING FOR LABOUR-BASED CONSTRUCTION . . . . . . . . . . . . . . . . . . . . . . . . . . . . . . . . . . . . . . . . 51MAINTENANCE . . . . . . . . . . . . . . . . . . . . . . . . . . . . . . . . . . . . . . . . . . . . . . . . . . . . . . . . . . . . . . . . . . . 54MAINTENANCE OF BASIC ACCESS STREETS. . . . . . . . . . . . . . . . . . . . . . . . . . . . . . . . . . . . . . . . . . . . . . 56Labour and mechanisation . . . . . . . . . . . . . . . . . . . . . . . . . . . . . . . . . . . . . . . . . . . . . . . . . . . . . . . . . .56Environmental maintenance . . . . . . . . . . . . . . . . . . . . . . . . . . . . . . . . . . . . . . . . . . . . . . . . . . . . . . . . .56MAINTENANCE OF TERTIARY WAYS . . . . . . . . . . . . . . . . . . . . . . . . . . . . . . . . . . . . . . . . . . . . . . . . . . . 56BIBLIOGRAPHY . . . . . . . . . . . . . . . . . . . . . . . . . . . . . . . . . . . . . . . . . . . . . . . . . . . . . . . . . . . . . . . . . . . 59Roads: Materials and construction Chapter 8iii
GUIDELINES FOR <strong>HUMAN</strong> <strong>SETTLEMENT</strong> <strong>PLANNING</strong> <strong>AND</strong> DESIGNAPPENDIX A: THE CATALOGUE OF PAVEMENT DESIGNS . . . . . . . . . . . . . . . . . . . . . . . . . . . . . . 61Notes regarding the use of the catalogue . . . . . . . . . . . . . . . . . . . . . . . . . . . . . . 61RECOMMENDED READING . . . . . . . . . . . . . . . . . . . . . . . . . . . . . . . . . . . . . . . . . . 61APPENDIX B: EXAMPLES OF STRUCTURAL DESIGN BY THE CATALOGUE METHOD. . . . . . . . . . 71A. EXAMPLE OF THE STRUCTURAL DESIGN OF A CATEGORY UB STREET . . . . 71SERVICE OBJECTIVE, STREET CHARACTERISTICS <strong>AND</strong> STREET PROFILE . . . . 71Design strategy . . . . . . . . . . . . . . . . . . . . . . . . . . . . . . . . . . . . . . . . . . . . . . 71Structural design and pavement type selection. . . . . . . . . . . . . . . . . . . . . . 73Possible pavement structures. . . . . . . . . . . . . . . . . . . . . . . . . . . . . . . . . . . . 74Practical considerations . . . . . . . . . . . . . . . . . . . . . . . . . . . . . . . . . . . . . . . . 74Cost analysis . . . . . . . . . . . . . . . . . . . . . . . . . . . . . . . . . . . . . . . . . . . . . . . . . 74Discount rate . . . . . . . . . . . . . . . . . . . . . . . . . . . . . . . . . . . . . . . . . . . . . . . . 74Salvage value and road-user costs . . . . . . . . . . . . . . . . . . . . . . . . . . . . . . . . 74Present worth of costs . . . . . . . . . . . . . . . . . . . . . . . . . . . . . . . . . . . . . . . . . 74B. EXAMPLE OF THE STRUCTURAL DESIGN OF A CATEGORY UD STREET . . . . 77SERVICE OBJECTIVE, STREET CHARACTERISTICS <strong>AND</strong> STREET PROFILE . . . . 77Street category. . . . . . . . . . . . . . . . . . . . . . . . . . . . . . . . . . . . . . . . . . . . . . . 77Estimate design traffic . . . . . . . . . . . . . . . . . . . . . . . . . . . . . . . . . . . . . . . . . 77Materials . . . . . . . . . . . . . . . . . . . . . . . . . . . . . . . . . . . . . . . . . . . . . . . . . . . 77Structural design and pavement type selection. . . . . . . . . . . . . . . . . . . . . . 77Subgrade CBR and selected layers . . . . . . . . . . . . . . . . . . . . . . . . . . . . . . . . 77Possible pavement structures. . . . . . . . . . . . . . . . . . . . . . . . . . . . . . . . . . . . 78Cost analysis . . . . . . . . . . . . . . . . . . . . . . . . . . . . . . . . . . . . . . . . . . . . . . . . . 78APPENDIX C: MATERIAL TYPES . . . . . . . . . . . . . . . . . . . . . . . . . . . . . . . . . . . . . . . . . . . . . . . . . 79Materials for paved basic access streets . . . . . . . . . . . . . . . . . . . . . . . . . . . . . . . . 79Material problems . . . . . . . . . . . . . . . . . . . . . . . . . . . . . . . . . . . . . . . 82Materials for unsealed streets . . . . . . . . . . . . . . . . . . . . . . . . . . . . . . 82Earth streets . . . . . . . . . . . . . . . . . . . . . . . . . . . . . . . . . . . . . . . . . . . 83Gravel wearing courses . . . . . . . . . . . . . . . . . . . . . . . . . . . . . . . . . . . 83Stabilised earth streets . . . . . . . . . . . . . . . . . . . . . . . . . . . . . . . . . . . . . . . . . . 86Dust palliatives . . . . . . . . . . . . . . . . . . . . . . . . . . . . . . . . . . . . . . . . . . . . . . . . . . . 86RECOMMENDED READING . . . . . . . . . . . . . . . . . . . . . . . . . . . . . . . . . . . . . . . . . . . . . . . . . . . . . . . 86ivChapter 8Roads: Materials and construction
GUIDELINES FOR <strong>HUMAN</strong> <strong>SETTLEMENT</strong> <strong>PLANNING</strong> <strong>AND</strong> DESIGNLIST OF TABLESTable 8.1 Typical street characteristics . . . . . . . . . . . . . . . . . . . . . . . . . . . . . . . . . . . . . . . . . . . . . . . . . . . . . . .5Table 8.2 Levels of service (LOS) of streets or drainage and combined facilities . . . . . . . . . . . . . . . . . . . . . . .7Table 8.3 Categorisation of street standards . . . . . . . . . . . . . . . . . . . . . . . . . . . . . . . . . . . . . . . . . . . . . . . . . .8Table 8.4 Structural design periods for various street categories . . . . . . . . . . . . . . . . . . . . . . . . . . . . . . . . .10Table 8.5 Classification of pavements and traffic for structural design purposes . . . . . . . . . . . . . . . . . . . . .11Table 8.6 80 kN single-axle equivalency factors, derived from F= (p/80) 4,2 . . . . . . . . . . . . . . . . . . . . . . . . . .12Table 8.7 Determination of E80s per commercial vehicle . . . . . . . . . . . . . . . . . . . . . . . . . . . . . . . . . . . . . . . .12Table 8.8 Traffic growth factor (g) for calculation of future or initial traffic from present traffic . . . . . . . .13Table 8.9Table 8.10Traffic growth factor (f y ) for calculation of cumulative traffic over predictionperiod from initial (daily) traffic . . . . . . . . . . . . . . . . . . . . . . . . . . . . . . . . . . . . . . . . . . . . . . . . . . .14Design factors for the distribution of traffic and equivalent traffic among lanes andshoulders . . . . . . . . . . . . . . . . . . . . . . . . . . . . . . . . . . . . . . . . . . . . . . . . . . . . . . . . . . . . . . . . . . . . .14Table 8.11 Material depths to be used for determining the design CBR of the subgrades . . . . . . . . . . . . . . .22Table 8.12 Subgrade CBR groups used for structural design . . . . . . . . . . . . . . . . . . . . . . . . . . . . . . . . . . . . . .22Table 8.13 Scour velocities for various materials . . . . . . . . . . . . . . . . . . . . . . . . . . . . . . . . . . . . . . . . . . . . . . .25Table 8.14Table 8.15Compaction requirements for the construction of pavement layers (andreinstatement of pavement layers) . . . . . . . . . . . . . . . . . . . . . . . . . . . . . . . . . . . . . . . . . . . . . . . . .30Suggested typical ranges of period of service (without rejuvenators) of various surfacingtypes in the different street categories and base types (if used as specifiedin the catalogue) . . . . . . . . . . . . . . . . . . . . . . . . . . . . . . . . . . . . . . . . . . . . . . . . . . . . . . . . . . . . . . .34Table 8.16 Typical future maintenance for cost analysis . . . . . . . . . . . . . . . . . . . . . . . . . . . . . . . . . . . . . . . . .35Table 8.17 Suggested pavement types for different road categories and traffic classes . . . . . . . . . . . . . . . . .39Table 8.18Table 8.19Possible condition at end of structural design period for various street categoriesand pavement types . . . . . . . . . . . . . . . . . . . . . . . . . . . . . . . . . . . . . . . . . . . . . . . . . . . . . . . . . . . .40Preparation of subgrade and required selected layers for the different subgradedesign CBRs . . . . . . . . . . . . . . . . . . . . . . . . . . . . . . . . . . . . . . . . . . . . . . . . . . . . . . . . . . . . . . . . . . .41Table 8.20 Examples of staged construction . . . . . . . . . . . . . . . . . . . . . . . . . . . . . . . . . . . . . . . . . . . . . . . . . .49Table 8.21 Summary of employment potential . . . . . . . . . . . . . . . . . . . . . . . . . . . . . . . . . . . . . . . . . . . . . . . .52Table 8.22 Relative contribution of main activities . . . . . . . . . . . . . . . . . . . . . . . . . . . . . . . . . . . . . . . . . . . . .52Table 8.23 Potential of pavement layers for labour-intensive construction methods . . . . . . . . . . . . . . . . . . .53Table 8.24 Typical activities suited to ABEs . . . . . . . . . . . . . . . . . . . . . . . . . . . . . . . . . . . . . . . . . . . . . . . . . . .54Table 8.25 Street maintenance categories and limited examples of maintenance activities . . . . . . . . . . . . . .55Table 8.26 Suitability of mechanical equipment and labour for maintenance activities . . . . . . . . . . . . . . . . .58Roads: Materials and construction Chapter 8v
GUIDELINES FOR <strong>HUMAN</strong> <strong>SETTLEMENT</strong> <strong>PLANNING</strong> <strong>AND</strong> DESIGNLIST OF FIGURESFigure 8.1 Street pavement design flow diagram . . . . . . . . . . . . . . . . . . . . . . . . . . . . . . . . . . . . . . . . . . . . . . 4Figure 8.2 Illustration of design periods and alternative design strategies . . . . . . . . . . . . . . . . . . . . . . . . . . . .9Figure 8.3 General pavement behaviour characteristics . . . . . . . . . . . . . . . . . . . . . . . . . . . . . . . . . . . . . . . . .18Figure 8.4 Macro-climatic regions of southern africa . . . . . . . . . . . . . . . . . . . . . . . . . . . . . . . . . . . . . . . . . . .21Figure 8.5 Typical basic access street cross-sections . . . . . . . . . . . . . . . . . . . . . . . . . . . . . . . . . . . . . . . . . . . . .25Figure 8.6 Tertiary ways: ditches and drains . . . . . . . . . . . . . . . . . . . . . . . . . . . . . . . . . . . . . . . . . . . . . . . . . .26Figure 8.7 Tertiary ways: drift . . . . . . . . . . . . . . . . . . . . . . . . . . . . . . . . . . . . . . . . . . . . . . . . . . . . . . . . . . . . .27Figure 8.8 Tertiary ways: dish drains . . . . . . . . . . . . . . . . . . . . . . . . . . . . . . . . . . . . . . . . . . . . . . . . . . . . . . . .28Figure 8.9 Typical grass block and vegetation . . . . . . . . . . . . . . . . . . . . . . . . . . . . . . . . . . . . . . . . . . . . . . . . .29Figure 8.10 Illustrative pavement cross-section . . . . . . . . . . . . . . . . . . . . . . . . . . . . . . . . . . . . . . . . . . . . . . . . .31Figure 8.11Degree of structural distress to be expected at the time of rehabilitation fordifferent structural design periods . . . . . . . . . . . . . . . . . . . . . . . . . . . . . . . . . . . . . . . . . . . . . . . . .36Figure 8.12 Typical cost versus level of service curve values . . . . . . . . . . . . . . . . . . . . . . . . . . . . . . . . . . . . . . .36Figure 8.13 Structural design flow diagram (mainly for category UA and UB streets) . . . . . . . . . . . . . . . . . . .37Figure 8.14 Simplified design flow diagram for residential streets (category UC and UD) . . . . . . . . . . . . . . . .38Figure 8.15 Ranges of terminal rut depth conditions for different street categories . . . . . . . . . . . . . . . . . . . .40Figure 8.16 Pavement design curves for basic access streets . . . . . . . . . . . . . . . . . . . . . . . . . . . . . . . . . . . . . . .42Figure 8.17 Design curves for the passability of unpaved roads . . . . . . . . . . . . . . . . . . . . . . . . . . . . . . . . . . . .44Figure 8.18 Flow diagram of design process for basic access streets . . . . . . . . . . . . . . . . . . . . . . . . . . . . . . . . .45Figure 8.19 Tertiary ways: cross-sections . . . . . . . . . . . . . . . . . . . . . . . . . . . . . . . . . . . . . . . . . . . . . . . . . . . . . .46Figure 8.20 Labour-intensive tertiary ways: cross-sections, cuttings and embankments . . . . . . . . . . . . . . . . . .47Figure 8.21 Simple drags for maintenance of tertiary ways . . . . . . . . . . . . . . . . . . . . . . . . . . . . . . . . . . . . . . .57viChapter 8Roads: Materials and construction
GUIDELINES FOR <strong>HUMAN</strong> <strong>SETTLEMENT</strong> <strong>PLANNING</strong> <strong>AND</strong> DESIGNINTRODUCTIONThis chapter focuses on• the philosophy of residential street design, withparticular emphasis on the need for a shift from aprevious approach of risk elimination to anapproach of risk management;• the need for layout planning and drainage designto be considered before the structural design ofthe street is addressed;• the relative importance of the street and the levelof service expected by the users and provided byvarious road types;• the structural design of street pavements;• approaches to construction that includeconventional methods, labour-intensive methodsand approaches that allow small contractors toparticipate;• practical guidelines for the maintenance of streets;• the comparison of proposed pavement designs ona life-cycle cost basis; and• references to other guidelines for additionalinformation.SCOPE <strong>AND</strong> NATURE OF THISCHAPTERThe chapter covers issues ranging from general designphilosophy to detailed methods for the structuraldesign of street pavements. The overall designphilosophy, design approach and design procedurespresented in this chapter are applicable to urbanstreets in South Africa, and may be used for similarapplications in the sub-region.DESIGN PHILOSOPHYBy nature, structural design of street pavements tendsto be prescriptive owing to the restrictions imposed bygeology, topography, design traffic and materials. Theuse of catalogues in the past (even though intended asdesign examples) has perhaps also given rise to theview that these options are set. In order to make thissection of the guidelines more facilitative thanprescriptive, engineering options - together with theimplications of choosing an option - are presented.The structural design of the pavements in an urbanenvironment cannot be done in isolation. Fundingmechanisms, the ability to execute maintenance whenrequired, the ability of the end users to pay,appropriate standards and environmental impact willinfluence the structural design process. These issuescannot be quantified numerically in the design processbut should rather determine the mindset of thedesigner. The designer must therefore exercise hisown judgement during the design process, taking intoconsideration the above issues and the risk associatedwith his design decisions.Provision and ability to payStreet upgrading and maintenance in residential areasis traditionally funded from rates levied and collectedby the local authority. The level of service providedwill need to take into account this source of fundingand an appropriate level should be found which willbe affordable to the ratepayers.Appropriate standardsIn the past, similar guideline documents have focusedon the more highly developed component of SouthAfrica with an emphasis on standards appropriate tohigh levels of car ownership and high traffic volumes.Standards have also been very conservative, with theuse of low-risk pavements with concomitant highconstruction cost. A shift in emphasis has occurred andservice provision to the whole spectrum ofdevelopment levels now needs to be considered. Dueto the differing traffic volumes that may be expected atdifferent levels of development and the need to movetowards risk management, standards appropriate toparticular applications must be considered. It shouldbe noted that “appropriate standards” does notnecessarily imply “relaxed standards”.Environmental impactRoads (and transport routes in general), by theirnature, can be environmentally intrusive. It isimportant, therefore, to construct them so that theirimpact on the environment is as small as possible.Comparatively little work, other than certain specificenvironmental impact assessments, has beenconducted on the impact of roads and the associatedtraffic on the environment. It is therefore consideredimportant that, before any new roads are constructed,or existing roads are rehabilitated or upgraded, therelevant authorities determine the impact on both thebiophysical and the socio-economic environments. InAfrica, most funding agencies will not consider thegranting of loans for road development and upgradinguntil a thorough investigation has been concluded.A number of impacts associated with theconstruction, maintenance and use of roads havebeen identified and are summarised below. The list isnot exhaustive but appraises most of the major socioeconomicand biophysical considerations, andincludes impacts on the:Roads: Materials and construction Chapter 81
GUIDELINES FOR <strong>HUMAN</strong> <strong>SETTLEMENT</strong> <strong>PLANNING</strong> <strong>AND</strong> DESIGN• physical characteristics of the site andsurroundings;• ecological characteristics of the site andsurroundings;• current and potential land use and landscapecharacter;• cultural resources;• socio-economic characteristics of the affectedpublic;• adjacent and associated infrastructure services;• social and community services and facilities;• the nature and level of present and futureenvironmental pollution; and• health and safety.RiskIn order to provide street infrastructure in residentialenvironments where there invariably are budgetlimitations, urban authorities need to adopt aphilosophy of risk management. Where a localauthority is responsible for the costs of constructionand maintenance, the philosophy of structural designmust move towards an approach that balancesconstruction and maintenance costs by sensible risktakingand risk management. This document,therefore, allows for the current need for riskmanagement and has moved away from previousapproaches of “designing out” risk by using high-coststreet pavements.There will, of course, be areas where high constructioncosts are borne by the property developer or purchaserwho demands a higher standard of street than mightbe economically justifiable. In such a case the benefitof lower future maintenance costs is passed on to thelocal authority and free-market conditions willdetermine the ultimate standard of construction.There are currently certain streets built at low costwith associated high risk, and this documentrecognises this fact. In informal settlements there maybe unknown and unclassified street systems, andarterial routes may be gravelled. A risk has thereforebeen assumed on these informal streets, which mayhave been taken over by a local authority. It is alsopossible that an authority could build a street structureat some risk and let traffic and time show the problemareas.In order to address the issue of risk associated with theuse of a particular pavement type in a particular streetcategory, the link between structural design,maintenance and construction is addressed in thesection on life-cycle costs. The document allows forrisk management by stating the risk involved in usingalternative designs. This is achieved by “qualitativestatements” regarding the risk and a list of riskmanagementapproaches that can be used to managehigher risk structures.The greater the relaxation in specification, the greaterthe risk. In order to manage this and controlconsequences, only one parameter should be relaxedat any one time. For example, if the drainage isinherently poor and cannot be cost-effectivelyrectified, no attempt at reducing material quality orpavement thickness should be considered.Risk must be related to road usage. Higher risk can beaccommodated on lower-usage roads, while theinverse is true for main routes and arterials.THE PAVEMENT DESIGN PROCESSThe aim of structural design is to produce a structurallybalanced pavement which, at minimum present worthof cost, will carry the traffic for the structural designperiod in the prevailing environment, at an acceptableservice level without major structural distress. Ifnecessary, the pavement should be capable of beingstrengthened by various rehabilitation measures tocarry the traffic over the full analysis period.This aim is achieved by protecting the subgradethrough the provision of pavement layers. However,issues such as level of service, stormwateraccommodation, traffic, pavement materials, subgradesoils, environmental conditions, construction detailsand economics are all part of the process.It is important to attend to layout planning anddrainage design before the structural design of thestreet is addressed, as these will lend better definitionto the role of the street in the larger development,and also affect the final structural design of thepavement.Level of serviceThe “level of service” of streets is expressed as acombined function of the pavement and stormwaterdrainage elements. A chosen level of service has to beachieved at the lowest possible life-cycle cost.Stormwater accommodationThe importance of topography on the structuraldesign and functional use of streets is clearly reflectedin the drainage and maintenance requirements ofstreets in general. Macro-drainage is relevant to thisdiscussion. Streets that cross contours at an angle, oreven perpendicularly, pose the most drainage2Chapter 8Roads: Materials and construction
GUIDELINES FOR <strong>HUMAN</strong> <strong>SETTLEMENT</strong> <strong>PLANNING</strong> <strong>AND</strong> DESIGNproblems. In such cases function rather than structuremay require that a street be paved or provided witherosion protection. It is therefore important thatrequirements described in the chapters on layoutplanning (Chapter 7) and stormwater management(Chapter 6) be met before one embarks on thestructural design.Unpaved streetsIn rolling and mountainous terrain there may besteep gradients which result in the erosion ofgravel streets and, in particular, erosion of theirdrainage facilities, with direct implications for theirsafety and functional use. A longitudinal streetgradient of 5% is an average value above whicherosion problems may occur on unpaved streets,and slopes steeper than this would warrantadditional attention. Gravels in the upper range ofthe suggested plasticity index (PI) could effectivelyreduce erosion, but local conditions should beconsidered in the detailed evaluation.Piped systems vs surface systemsThe use of the road surface - or of surface channels- to accommodate the minor stormwater flows canbe more appropriate than the use of piped systemsin certain instances, provided safety is notcompromised. Areas under development and areaswhere verges are not grassed can give rise to highsilt loads in the stormwater flows, which canrapidly block piped systems. The dumping ofrefuse and other debris into stormwater inlets andmanholes is a common occurrence in someresidential areas and this will also lead toblockages. In areas where regular maintenance ofpiped systems does not take place, surface systemsare probably more appropriate.Upgrading and staged constructionTwo concepts that need to be considered as part ofthe life-cycle strategy of a street during design, are“staged construction” and “upgrading”. Althoughit is difficult to exactly define and completelyseparate these concepts, some characteristics maybe more typical of one than of the other.The aim of staged construction is to spread thefinancial load from the initial construction periodto some stage later during the life cycle of thefacility. On the other hand, upgrading willnormally take place when the demands on anexisting facility far exceed the level of service thefacility can provide. The influence of doubling thecontractor’s establishment costs needs to beevaluated carefully when staged construction isconsidered.STRUCTURE OF THIS CHAPTERThe flow diagram in Figure 8.1 outlines the pavementdesign process. The components may not all be clearat this stage, but will be discussed in detail in thefollowing sections.This discussion will be done in two parts:• the components of the process will be discussed ingeneral; and• a detailed discussion on the design process for eachof the five branches in the diagram will follow.Economic considerations and designstrategyLife-cycle costsProviding a traffic circulation network to aresidential area involves both construction (capital)and maintenance (operating) costs. For a localauthority which is responsible for these functions,the costs of both construction and maintenancemust be minimised to provide a service at thelowest total outlay. The total life-cycle cost of aroad should include the vehicle operating costs, butthese can be disproportionally high and are oftenneglected. In this case only the agency cost isevaluated.Roads: Materials and construction Chapter 83
GUIDELINES FOR <strong>HUMAN</strong> <strong>SETTLEMENT</strong> <strong>PLANNING</strong> <strong>AND</strong> DESIGNPavement DesignService objectiveLayout planCurrent and future functionTrafficCompiling a street profileArterial and access streets Characteristics of streets Basic access streets Tertialy waysYesLow riskFunds availableto pave?NoHigherriskStreet categoryDescription and functionImportanceLevel of serviceVehicle trafficDesign bearing capacityPaved/unpavedPedestrian trafficYes Pave forreasons other than bearingcapacityNoPaved arterial and access streets Unpaved arterial and access streets Paved basic access streetsUnpaved basic access streetsStreet categoryStreet categoryMaterialsDesign strategyDesign strategyDesign bearing capacityYes No Yes NoDust palliativeadequate?In-situ materialacceptable?MaterialsMaterialsEnvironmentEnvironmentIn-situ material wearing courseStructural designPavement type selectionDesign methodDesign imported layersStructural designPavement type selectionDesign methodDesign imported layersStandard cross-sectionsPractical considerationsErosion protectionEconomic analysisConstruction and maintenanceFigure 8.1: Street pavement design flow diagram4Chapter 8Roads: Materials and construction
GUIDELINES FOR <strong>HUMAN</strong> <strong>SETTLEMENT</strong> <strong>PLANNING</strong> <strong>AND</strong> DESIGNTHE COMPONENTS OF THE DESIGNPROCESSSERVICE OBJECTIVEBefore the designer starts in earnest with the actualpavement design of a particular street, he mustconsider the background against which to design andthe objective of providing the facility. This does notneed to be considered in great detail at this early stageof the design, but it will guide the direction of thedesign process. Factors that need to be consideredinclude the layout and drainage plan, the current andfuture functions of the street and the anticipatedtraffic. The layout and stormwater drainage planshould be well defined at this stage, which also definesthe function of the street to some extent. Detailedcalculations on design traffic will be done at a laterstage in the design, and only an estimate of thenumber of vehicles is required at this stage.COMPILING A STREET “PROFILE”The shaded area in Figure 8.1 highlights the majordecision-making part of the design process. A decisionhas to be made at this stage on selecting anappropriate street “profile”, which will determine thedesign procedure to adopt. A number ofcharacteristics define the profile of the street. Theseinclude the street category, the description andfunction of the street, the importance of the street,the level of service of the facility (street and drainagecombined), vehicle traffic, design bearing capacity,street standard (paved/unpaved) and even thepedestrian traffic expected.Street categoriesTypical street characteristics are listed in Table 8.1. Forthe purpose of this document, four different streetcategories, namely UA, UB, UC and UD, are considered.These categories range from very important arterialTable 8.1:Typical street characteristicsSTREET CATEGORYUA UB UC UDARTERIAL STREETSACCESS STREETSDescription and Vehicles only Higher-order Lower-order Pedestrian andfunction mixed pedestrian mixed pedestrian vehicle access routeand vehicle route and vehicle routeLevel of service (LOS) High LOS Moderate LOS Moderate to low LOS Low LOSTraffic (vehicles per >600 75
GUIDELINES FOR <strong>HUMAN</strong> <strong>SETTLEMENT</strong> <strong>PLANNING</strong> <strong>AND</strong> DESIGNstreets with a very high volume of traffic, to lessimportant lightly trafficked residential streets.Street functionArterial streetsArterial streets are the major routes providingmobility between and within residential,recreational, commercial and industrial areas. Thetraffic volumes on these streets will be high andthe streets will generally carry significant numbersof buses and other heavy vehicles.Access streetsAccess streets include all residential streets belowthe level of urban bus routes. Their primaryfunction is access to residential erven and they willthus carry few heavy vehicles. Depending on thelevel of development and affluence of the area,traffic may be so light that the primary structuraldesign objectives may relate more to minimisingdamage from erosion than to supporting thetraffic.Access streets may be further divided into accessstreets with traffic levels of more than 75 vehiclesper day and those with less than 75 vehicles perday, of which less than 5 are heavy vehicles. Basicaccess streets would generally be found indeveloping areas where vehicle ownership is low.Level of service (LOS)The level of service that a user expects from a street isrelated to the function of the street, to the generalstandard of the facility and partly to the volume oftraffic carried. For example, the user will expect abetter riding quality on a dual-carriageway arterialstreet than on a minor residential street. Irrespectiveof this, the user will generally expect the highestpossible standard.Streets in a residential area function at different levelsof service (LOS). The LOS values are determined by thefunctional use of the street, the level of constructionand the drainage provision. In Table 8.2 thedescription of each type of street and its drainage isgiven, with the associated LOS values. In the matrix thecombined LOS value is given. The final LOS value isdetermined mostly by the LOS of the drainage.Street standardsArterial streetsPaved arterial streets:The heavy traffic carried by arterial streets willgenerally justify their being built to a traditionalpaved standard, if funds are available.Unpaved arterial streets:Although unpaved arterial streets exist in manyareas, it is almost impossible to justify them on aneconomic or social basis. The cost of maintainingthem is excessive and the frequency of maintenancenecessary to retain a riding quality of anyacceptability results in safety hazards. In addition,the user costs, in comparison with a paved street, areextremely high. All attempts should be made toupgrade unpaved arterials carrying bus and heavygoods vehicles to a suitable, relatively low-risk,paved standard as rapidly as possible, whilstarterials carrying mostly light goods vehicles canafford slightly higher-risk pavements.Although undesirable, financial constraints mayprevent an authority being able to pave all arterialstreets in a network. The street network shouldthen be prioritised on an economic basis to identifycandidate streets for upgrading. The optimum useof available materials is thus necessary to reducethe undesirable properties as far as possible.Access streetsA distinction is made between access streets (>75vehicles per day) and basic access streets (
GUIDELINES FOR <strong>HUMAN</strong> <strong>SETTLEMENT</strong> <strong>PLANNING</strong> <strong>AND</strong> DESIGNTable 8.2: Levels of service (LOS) of streets or drainage and combined facilitiesLOS DRAINAGE LOS 4 & 5 3 2 1STREETCATEGORYStreet Description Pipe system, Lined Unlined UnsurfacedLOS kerbs, gutter channel on channel on street withand surfaced shoulder or shoulder or provision ofstreet on street on street drainage withsheet flowUA 5 Primary streets (busroutes) with adesigned structure5 5 4and surfacing, or3 Gravel3 2UB 5 District and/or localdistributors(bus routes) with adesigned structureand surfacing, or5 5 33 Gravel3 2UC 5 Residential accesscollectors with adesigned lightstructure andsurfacing, or 5 4 3 23 Gravel, or 3 2 11 In situ3 2 1UD 5 Access and basicaccess streets withsurfacing on light 5 4 3 2structure, or3 Gravel, or 3 2 11 In situ 3 2 1up to five are heavy vehicles) make maximum useof in situ material and require realistic materialstandards.Paved basic access streets:Factors determining the acceptable performance ofsuch light-structure streets are• drainage (surface and subsurface);• material quality;• construction control;• control of overloading; and• maintenance.The philosophy of basic access streets is toconcentrate on the engineering impact ofRoads: Materials and construction Chapter 87
GUIDELINES FOR <strong>HUMAN</strong> <strong>SETTLEMENT</strong> <strong>PLANNING</strong> <strong>AND</strong> DESIGNdrainage, material quality and constructioncontrol, to achieve more realistic minimumstandards for the circumstances described earlier.Although cost comparisons are not dealt withseparately, the principle is that cost-saving ismaximised.Unpaved basic access streets:These are the lowest quality basic access streetsacceptable. Although undesirable from the pointof view of dust generation, the production of mudwhen wet, and the need for constant maintenance,financial constraints may preclude the use ofhigher quality streets for the very low traffic typicalof these streets. The optimum use of availablematerials is thus necessary to reduce theundesirable performance properties as far aspossible.Earth basic access streets are considered a viableoption only if the in situ material is of a quality thatwill support vehicles even in a soaked condition.One of the major problems with earth streets isthat they initially form tracks, and, if bladed, astreet that is lower than the surrounding terrainresults, with significant drainage problems.Tertiary waysUnpaved basic access streets may evolve frominformal access routes, which are referred to astertiary ways in this document.In developing areas an infrastructure of narrowways which carry no or few vehicles exists. Thesenon-trafficked tertiary ways are mostly informaland unserviced, but in older developing areas theyare formalised (upgraded) by the provision ofsurfacings, drainage or even services like water andelectricity.In an informal residential development no layoutplanning for tertiary ways is done. The existence ofthese ways is dictated by pedestrians’ needs tofollow the shortest possible route. It is advisable todesign for tertiary ways during layout planning asthese form the basic links between dwellings. In aformal design this facility can enhance the designprinciples applicable to the higher order of streets.Summary of street standardsThe street standards that would generally beconsidered for application to particular streetcategories are summarised in Table 8.3.The street as public open spaceIn the lower street categories (access collector and,particularly, basic access streets) the street functionsare less the preserve of the motor vehicle and morethe preserve of the pedestrian and resident. This isparticularly true of developing areas, where theincidence of traffic is likely to be low. This may berecognised by the provision of a smooth surface.Streets may also function as firebreaks in areas of highhousing density - a possible justification for retainingwide street reserves in some instances.DESIGN STRATEGYPaved streetsThe design strategy could influence the total cost of apavement structure. Normally, a design strategy isapplicable only to paved Category UA and UB streets.For unpaved streets, or paved Category UC and UDstreets, the design periods are fixed.The analysis period (see Figure 8.2) is a convenientplanning period during which complete reconstructionof the pavement is undesirable. The structural designperiod, on the other hand, is defined as the period forwhich it is predicted with a high degree of confidencethat no structural maintenance will be required.In order to fulfil the design objective of selecting theoptimum pavement in terms of present worth of cost,Table 8.3:Categorisation of street standardsARTERIAL STREETS(UA <strong>AND</strong> UB)ACCESS STREETS(UC <strong>AND</strong> UD)Paved Unpaved Access streets (>75 Basic access streets (
GUIDELINES FOR <strong>HUMAN</strong> <strong>SETTLEMENT</strong> <strong>PLANNING</strong> <strong>AND</strong> DESIGNit is necessary to consider how the pavement isexpected to perform over the entire analysis period.The manner in which a design strategy can bepresented is demonstrated schematically in Figure 8.2,which shows the generalised trends of riding qualitydecreasing with time, and traffic for two differentpavement structures, namely:Design 1, which requires resealing to maintain thesurface in a good condition, and later some structuralrehabilitation such as an overlay (Figure 8.2 (a)); andDesign 2, which is structurally adequate for the wholeof the analysis period and requires only threeresealings (Figure 8.2 (b)).It is important to note that any design procedure canonly estimate the timing and nature of themaintenance measures needed. Naturally, suchestimates are only approximations, but they provide avaluable guide for a design strategy. The actualmaintenance should be determined by a propermaintenance procedure. The accuracy of the predictioncould be improved by having a feedback system.Selection of analysis periodConstructedriding quality4Surface treatmentRiding quality (psi)32* see noteStructuralrehabilitation** see noteStructural design period (10-20 yrs)1Analysis period (20-30 yrs)0Time(a) Design 14Constructedriding qualitySurface treatment3* see noteRiding quality (psi)21Terminal riding qualityStructural design period (15-30 yrs)Analysis period (20-30 yrs)0Time(b) Design 2Design 2 requires three resurfacings and no strengthening duringthe analysis period.* If surfacing is not maintained and if water-susceptiblematerials are used in the pavement** Structural rehabilitation usually occurs at a later stageFigure 8.2: Illustration of design periods and alternative design strategiesRoads: Materials and construction Chapter 89
GUIDELINES FOR <strong>HUMAN</strong> <strong>SETTLEMENT</strong> <strong>PLANNING</strong> <strong>AND</strong> DESIGNThe analysis period is a realistic cost period. There maybe a difference between the analysis period and thetotal period over which a facility will be used. Theanalysis period is often related to the geometric life. Ifthe street alignment is fixed, a period of 30 yearsshould be used. In the case of a short geometric life ina changing traffic situation, a shorter analysis periodshould be used.Structural design periodSelection of structural design periodTable 8.4 gives a summary of suggested structuraldesign periods for different road categories.Category UA streets• a lack of short-term funds; and• a lack of confidence in design assumptions,especially the design traffic.Structural design periods may range from 10 to 25years. Normally a period of 20 years will be used(Table 8.4).Category UC streetsFor category UC streets (residential streets) a fixedstructural design period of 20 years isrecommended (Table 8.4).Category UD streetsTable 8.4:Structural design periods forvarious street categoriesThe traffic volume is so limited that no structuraldesign period is applicable.STREET CATEGORYCategory UA streetsFor Category UA streets, the structural designperiod should be reasonably long because• it is usually not politically acceptable for streetauthorities to carry out heavy rehabilitationon recently constructed pavements;• street user costs are high and the cost of thedisruption of traffic will probably cancel outany pavement cost savings that result from thechoice of short structural design periods; and• the street alignment is normally fixed.Category UB streetsSTRUCTURAL DESIGN PERIOD*(YEARS)RANGERECOMMENDEDUA 15-25 20UB 10-25 20UC 10-30 20* The analysis period for category UA and UB streetsis 30 years.For Category UB streets, the structural designperiod may vary, depending on the circumstances.Long structural design periods (20 years) will beselected when circumstances are the same as forCategory UA streets.Factors that encourage the selection of shortstructural design periods are• a short geometric life for a facility in achanging traffic situation;DESIGN TRAFFIC <strong>AND</strong> BEARINGCAPACITYPaved streetsReal life traffic consists of vehicles spanning a range ofaxle loadings. The composition of the traffic on onestreet will differ from that on another because of thedifferences in street category and function. Theunique traffic spectrum on a particular street will bethe design traffic for that street.Pavements are, however, designed for a number ofstandard 80 kN axles (SA standard axles). The totalnumber of standard axles that a pavement structurewill be able to carry over its design life is referred to asthe bearing capacity of the pavement. The designbearing capacity of a pavement is thereforeconsidered to be constant for a particular pavementstructure (ignoring environmental effects). It iscustomary to design pavements for a bearing capacityinterval rather than a specific value. These intervalsare referred to as pavement classes and Table 8.5summarises pavement design classes based onpavement bearing capacity. This is done because of thelarge variation associated with real pavementperformance and the associated difficulty in predictingpavement life.Although the bearing capacity of a pavement isconsidered to be constant, different traffic spectrumswill have different damaging effects on the pavementdue to the different axle-load compositions of thetraffic spectrums. The cumulative damaging effect ofall individual axle loads is expressed as the number ofequivalent 80 kN single-axle loads (ESA, equivalentstandard axles, or E80s). This is the number of 80 kNsingle-axle loads which would cause the same damageto the pavement as the actual spectrum of axle loads.10Chapter 8Roads: Materials and construction
GUIDELINES FOR <strong>HUMAN</strong> <strong>SETTLEMENT</strong> <strong>PLANNING</strong> <strong>AND</strong> DESIGNTable 8.5:Classification of pavements and traffic for structural design purposesPAVEMENTCLASSBEARINGCAPACITY(MILLION 80 kNAXLES/LANE)TYPICAL TRAFFIC <strong>VOLUME</strong>S <strong>AND</strong> TYPE OF TRAFFICAPPROXIMATEVEHICLES PER DAYDESCRIPTIONPER LANEES0,003 < 0,003 Very lightly trafficked streets, very few heavy vehicles.ES0,01 0,003 - 0,01 < 75 These roads include the transition from gravel to paved roads.ES0,03 0,01 - 0,03ES0,1 0,03 - 0,1ES 0,3 0,1 - 0.3 75 - 220ES1 0,3 - 1 220 - 700 Lightly trafficked street, mainly cars and light delivery vehicles,very few heavy vehicles.ES3 1 - 3 >700 Medium volume, few heavy vehicles.ES10 3 - 10 > 700 High volume and/or many heavy vehicles.ES30 10 - 30 > 2 200 Very high volume of traffic and/or aES100 30 - 100 > 6 500high proportion of fully laden heavy vehiclesFor structural design, an estimate of the cumulativeequivalent traffic per lane over the structural designperiod is required. The cumulative equivalent trafficmust then fall into the pavement class for which thestreet is designed.The cumulative equivalent traffic can be determined intwo different ways:• by estimation from tabulated traffic classes; and• through detailed computation from initial andmean daily traffic axle loads, growth rates andlane-distribution factors.The estimation of the cumulative equivalent trafficover the structural design period from tabulatedvalues is recommended, unless more specificinformation is available. A detailed computation ofthe cumulative equivalent traffic would be applicableonly when the design traffic loading is bound to behigher than 0,2 x 10 6 E80s. The designer shouldconsider whether construction traffic is to be carriedby the pavement. For Category UC and UD streets,detailed computations of traffic are normally notnecessary. However, a calculation is necessary todetermine an appropriate traffic loading.For certain lightly trafficked streets, a change in theservice level may be considered because of anticipatedlower vehicle speeds. In these cases a lower streetcategory should be selected (acceptance of higher risk)rather than changing the designs in the catalogue.Computation of equivalent trafficThe detailed computation of the cumulativeequivalent traffic involves• the load equivalency of traffic;• surveys of traffic conditions;• projecting the traffic data over the structuraldesign period; and• estimating the lane distribution.Load equivalency of traffic:The number of E80s is termed the equivalenttraffic. The load-equivalency factor relates thenumber of repetitions of a given axle load to theequivalent number of E80s.This equivalency factor is a function of pavementcomposition, material types, definition of terminalconditions and street rideability. Table 8.6 givesaverage equivalency factors based on:F = (P/80) n (8.1)wheren = 4,2F = load equivalency factorP = axle load in kN.Roads: Materials and construction Chapter 811
GUIDELINES FOR <strong>HUMAN</strong> <strong>SETTLEMENT</strong> <strong>PLANNING</strong> <strong>AND</strong> DESIGNPavements that are sensitive to overloading, suchas shallow-structured pavements with thincemented bases, may have n values of more than4,2 whereas less sensitive, deep-structuredpavements may have n values of less than 4,2. Thedesigner can carry out a sensitivity analysis over thespectrum of axle loads with n values ranging from2 to 6. This may be especially useful in the case ofabnormal axle-load spectra.Projection of the traffic data over the structuraldesign period• Projection to initial design year:The present average daily equivalent traffic(daily E80s) can be projected to the initialdesign year by multiplying by a growth factordetermined from the growth rate:The equivalent traffic can be determined bymultiplying the number of axle loads (t j ) in eachload group in the entire load spectrum by therelevant equivalency factor (F j ), determined fromTable 8.6.g x = (1 + 0,01.i) x (8.3)whereg = growth factorBy summation the equivalent daily traffic isE = ∑ t j .F j (8.2)Table 8.7:Determination of E80s percommercial vehicleSurveys of traffic conditions (Jordaan 1986; Haupt1980; NITRR 1978).The present average daily traffic is the amount ofdaily traffic in a single direction, averaged over thepresent year. This traffic can be estimated fromtraffic surveys carried out at some time before theinitial year. Such a survey may include• static weighing of sample of vehicles;• dynamic weighing of all axles for a sampleperiod (e.g. a traffic axle-weight classifier(TAWC) survey); or• estimation procedure based on visualobservation (Table 8.7 can be used to assist inthis.)LOADING OF COMMERCIALVEHICLES (OR TYPE OF ROAD)NUMBER OFE80s/COMMERCIALVEHICLESMostly unladen (Category UC,residential and collector streets), 0,650% unladen, 50% laden(Category UA or UB, arterial 1,7roads and bus routes)>70% laden (Category UA or 2,6UB, main arterials or majorindustrial routes)Fully laden bus 3,0Table 8.6: 80 kN single-axle equivalency factors, derived from F = (p/80) 4,2SINGLE AXLE LOAD, 80 kN EQUIVALENCY SINGLE AXLE LOAD, 80 kN AXLE EQUIVALENCYP*(kN) FACTOR, F P(kN) FACTOR, F205 50,0105 - 114 3,600*Single-axle load with dual wheels12Chapter 8Roads: Materials and construction
GUIDELINES FOR <strong>HUMAN</strong> <strong>SETTLEMENT</strong> <strong>PLANNING</strong> <strong>AND</strong> DESIGNi = growth rate (%)f y = 365 (1+0,01.i) [(1+0,01.i)y -1](0,01.i)(8.6)x = time between determination of axleload data and opening of streets inyears.The traffic growth factor (g) is given in Table8.8.• Computation of cumulative equivalent traffic:The cumulative equivalent traffic (total E80s)over the structural design period may becalculated from the equivalent traffic in theinitial design year and the growth rate for thedesign period. Where possible, the growth rateshould be based on specific information. Morethan one growth rate may apply over thedesign period. There may also be a differencebetween the growth rates for total andequivalent traffic. These rates will normally varybetween 2% and 10%, and a value of 6% isrecommended.The daily equivalent traffic in the initial year isgiven byE initial = E. g x (8.4)The cumulative equivalent traffic may becalculated from(y = structural design period).The cumulative growth factor (f y ) is given inTable 8.9.Estimating the lane distribution of trafficOn multi-lane roads, the traffic will be distributedamong the lanes. Note that the distribution oftotal traffic and equivalent traffic will not be thesame. The distribution will also change along thelength of street, depending on geometric factorssuch as climbing or turning lanes. Suggested designfactors for total traffic (B) and equivalent traffic(Be) are given in Table 8.10. As far as possible,these factors incorporate the change in lanedistribution over the geometric life of a facility. Thefactors should be regarded as maxima anddecreases may be justified.The design cumulative equivalent trafficThe design cumulative equivalent traffic may becalculated by multiplying the equivalent traffic by alane distribution factor (B e ):N e = (∑ t j .F j ).g x .f y .B e (8.7)whereN e - E initial .f y (8.5)∑ t j .F j =equivalent daily traffic at time of surveywheref y = cumulative growth factor, based ong x = growth factor to initial year (x = periodfrom traffic survey to initial design year)Table 8.8: Traffic growth factor (g) for calculation of future or initial traffic from presenttrafficTIME BETWEENDETERMINATION OF*g FOR TRAFFIC INCREASE, i (% PER ANNUM)AXLE LOAD DATA<strong>AND</strong> OPENING OFROAD, x (YEARS)2 3 4 5 6 7 8 9 101 1,02 1,03 1,04 1,05 1,06 1,07 1,08 1,09 1,102 1,04 1,06 1,08 1,10 1,12 1,14 1,17 1,19 1,213 1,06 1,09 1,12 1,16 1,19 1,23 1,26 1,30 1,334 1,08 1,13 1,17 1,22 1,26 1,31 1,36 1,41 1,465 1,10 1,16 1,22 1,28 1,34 1,40 1,47 1,54 1,616 1,13 1,19 1,27 1,34 1,42 1,50 1,59 1,68 1,777 1,15 1,23 1,32 1,41 1,50 1,61 1,71 1,83 1,958 1,17 1,27 1,37 1,48 1,59 1,72 1,85 1,99 2,149 1,20 1,30 1,42 1,55 1,69 1,84 2,00 2,17 2,3610 1,22 1,34 1,48 1,63 1,79 1,97 2,16 2,37 2,59*g = (1 + 0,01.i) xRoads: Materials and construction Chapter 813
GUIDELINES FOR <strong>HUMAN</strong> <strong>SETTLEMENT</strong> <strong>PLANNING</strong> <strong>AND</strong> DESIGNTable 8.9:Traffic growth factor (f y ) for calculation of cumulative traffic over predictionperiod from initial (daily) trafficPREDICTION COMPOUND GROWTH RATE, i (% PER ANNUM) *PERIOD, Y(YEARS) 2 4 6 8 10 12 14 16 18 204 1 534 1 611 1 692 1 776 1 863 1 953 2 047 2 145 2 246 2 3515 1 937 2 056 2 180 2 312 2 451 2 597 2 750 2 911 3 081 3 2596 2 348 2 517 2 698 2 891 3 097 3 317 3 551 3 081 4 066 4 3497 2 767 2 998 3 247 3 517 3 809 4 124 4 464 4 832 5 229 5 6578 3 195 3 497 3 829 4 192 4 591 5 028 5 506 6 029 6 601 7 2269 3 631 4 017 4 445 4 922 5 452 6 040 6 693 7 417 8 220 9 10910 4 076 4 557 5 099 5 710 6 398 7 173 8 046 9 027 10 130 11 36911 4 530 5 119 5 792 6 561 7 440 8 443 9 588 10 895 12 384 14 08112 4 993 5 703 6 526 7 480 8 585 9 865 11 347 13 061 15 044 17 33613 5 465 6 311 8 130 8 473 9 845 11 458 13 352 15 575 18 183 21 24114 5 947 6 943 7 305 9 545 11 231 13 242 15 637 18 490 21 887 25 92715 6 438 7 600 9 005 10 703 12 756 15 239 18 242 21 872 26 257 31 55116 6 939 8 284 9 932 11 953 14 433 17 477 21 212 25 795 31 414 38 29917 7 450 8 995 10 915 13 304 16 278 19 983 24 598 30 346 37 500 46 39718 7 971 9 734 11 957 14 762 18 308 22 790 28 458 35 625 44 680 56 11519 8 503 10 503 13 061 16 338 20 540 25 934 32 859 41 748 53 154 67 77620 9 045 11 303 14 232 18 039 22 995 29 455 37 875 48 851 63 152 81 76925 11 924 15 808 21 227 28 818 39 486 54 506 75 676 105 517 147 559 206 72730 15 103 21 289 30 587 44 656 66 044 98 656 148 459 224 533 340 661 517 66435 18 612 27 858 43 114 67 927 108 816 176 464 288 595 474 509 782 431 1 291 37340 22 487 36 071 59 877 102 120 177 700 313 586 588 416 999 544 1 793 095 3 216 609* based on f y = 365 (1 + 0,01.i)[(1 + 0,01.i) y - 1]/(0,01.i)Table 8.10: Design factors for the distribution of traffic and equivalent traffic amonglanes and shouldersTOTALDESIGN DISTRIBUTION FACTOR, BNUMBERe OR BOFTRAFFIC SURFACED SLOWSURFACED FASTLANE 1* LANE 2 LANE 3LANES SHOULDER SHOULDER**(a) Equivalent traffic (E80s) Factor B e2 100 100 - - -4 95 95 30 - 306 70 70 60 25 25(b) Traffic (total axles or evu***) Factor B2 100 100 - - -4 70 70 50 - 506 30 30 50 40 40* Lane 1 is the outer or slow lane** For multi-lane roads*** evu = equivalent vehicle unit; one commercial vehicle = 3 evu design factors for the distribution of traffic andequivalent traffic among lanes and shoulders.14Chapter 8Roads: Materials and construction
GUIDELINES FOR <strong>HUMAN</strong> <strong>SETTLEMENT</strong> <strong>PLANNING</strong> <strong>AND</strong> DESIGNf y = cumulative growth factor over structuraldesign period (y = structural designperiod)B e = lane distribution factor for equivalenttraffic.To check the geometric capacity of the street, the totaldaily traffic towards the end of the structural designperiod can be calculated fromn = (initial total daily traffic).g x ( 8.8)with g x as previously defined.When projecting traffic over the structural designperiod, the designer should take into account thepossibility of capacity (HRB 1985) conditions beingreached, which would result in no further growth intraffic for that particular lane.Unpaved streetsFor the design of unpaved streets only the averagedaily traffic is required as performance is mostly afunction of the total traffic, with the light : heavy splitbeing of minor importance. This is the result of thetraffic-induced deformation of properly designedunpaved streets being restricted to the upper portionof the gravel surfacing. Problems in this area arerectified during routine surface maintenance - that is,grading and spot regravelling, or by regravelling ofthe road.MATERIALSThe selection of materials for pavement design isbased on a combination of availability, economicfactors and previous experience. These factors have tobe evaluated during the design in order to select thematerials best suited to the conditions.The recommended design procedure mostly uses thestandard material specification defined in TechnicalRecommendation for Highways Guidelines for roadconstruction materials (NITRR 1984). Only abbreviatedspecifications are given and TRH14 should beconsulted for more details. The materials are classifiedinto various categories according to their fundamentalbehaviour, and into different classes according to theirstrength characteristics.Description of major material typesThis subsection describes the broad material types andtheir main characteristics. The behaviour of thedifferent pavement types consisting of combinationsof these materials is described in the following section.Granular materials and soils (G1 to G10)These materials show stress-dependent behaviour,and under repeated stresses deformation can occurthrough shear and/or densification.A G1 is a densely-graded, unweathered, crushedstonematerial compacted to 86 - 88% of apparentdensity. A faulty grading may be adjusted only byadding crusher sand or other stone fractionsobtained from the crushing of the parent rock. G2and G3 may be a blend of crushed stone with otherfine aggregate to adjust the grading. If the fineaggregate is obtained from a source other than theparent rock, its use must be approved by thepurchaser, and the supplier must furnish thepurchaser with the ull particulars regarding theexact amount and nature of such fine aggregate.G4 to G10 materials range from high-qualitynatural gravels used in pavement layers (CBR 25-80)to lower-quality materials used in selected layers(CBR 3-15).In unpaved streets natural gravel materials ofquality G5 to G7 are recommended for the wearingcourse. The recommended plasticity index limitsfor G4 or G5 will not apply if the material is used asa gravel wearing course. Maximum particle sizelimits also have to be reduced for use as a gravelwearing course.Asphalt hot-mix materials (BC to TS)Asphalt hot-mix materials are visco-elastic andunder repeated stresses they may either crack ordeform or both. Normally a continuously gradedbitumen hot-mix (BC) will have a higher stabilityand lower fatigue life than a semi-gap-graded (BS)material. Tar hot-mixes (TC, TS) will normally havelower fatigue lives than the equivalent bitumenhot-mixes. Usually the stability of a tar mix is thesame as or higher than that of the equivalentbitumen mix. Tar mixes have seldom been used inSouth Africa due to low durability.Bituminous cold-mix materialsNatural gravel or recycled material may be treatedwith emulsion (ETM) or foamed bitumen (FTM) toincrease the stiffness and strength, after an initialcuring period (SABITA 1993; Csanyi 1960). Theresidual binder content for foam- and emulsiontreatedmaterial is normally below 5% by mass. Adistinction is made between emulsion stabilisation(GEMS) with residual binder contents between 1,5and 5% by mass and emulsion modification (ETBs)with residual binder contents between 0,6 and1,5% by mass.Foamed bitumen and emulsion treatment may beused on new construction projects to treat theRoads: Materials and construction Chapter 815
GUIDELINES FOR <strong>HUMAN</strong> <strong>SETTLEMENT</strong> <strong>PLANNING</strong> <strong>AND</strong> DESIGNlocally available material, enabling the use of thismaterial in the pavement base layer or onrehabilitation projects by treating the existing basematerial. Emulsion-treated material may be mixedon site by conventional construction equipment,deep-milling machines or plant. The emulsiontreatedmaterial should however, be placed andcompacted immediately. Foam-treated materialmay be mixed in a plant or on site by using deepmillingmachines, and may be stockpiled for periodsup to three months (KZN 1997). A further advantageof using these materials on rehabilitation projects isthat the streets may be opened to traffic very soonafter construction. The unsurfaced base layer mayeven be exposed to traffic for limited periods of timewithout material loss.Portland cement concrete (PCC)Concrete is an elastic, brittle material possessinglow tensile strength and it may thus crack underexcessive repeated flexure. In this document onlyone concrete strength is considered.Cemented materials (C1 to C4)As with concrete, cemented materials are elastic,possess low tensile strength and may crack underrepeated flexure. These materials also crackbecause of shrinkage and drying. By applying anupper limit to the strength specification, wideshrinkage cracks can be avoided. Because of theexcessive shrinkage cracking of C1 materials, theyare not generally used.A C2 material will be used when a non-pumpingerosion-resistant layer is required (as for thesubbase under a concrete pavement)C3 and C4 materials can be used as replacementsfor granular layers in bases and subbases. They canbe treated with cement, lime, slagment, lime/flyashmixtures or various combinations of pozzalanicbinders, depending on the properties of thenatural materials.Surfacing (AG to AO; S1 to S8)The surfacings range from high-quality asphaltsurfacings to surface treatments, surfacemaintenance measures such as rejuvenators, anddiluted emulsion treatments.Macadams (WM to PM)These traditional, high-quality, but also labourintensive,pavement materials can be used in theplace of GI to G4 materials. However, specificknowledge of construction techniques is required.These materials are less affected by water than theusual granular materials and their use should beconsidered, especially in wet regions.Paving blocks (S-A, S-B)The use of interlocking concrete paving blocks (S-A)is limited to low-speed (
GUIDELINES FOR <strong>HUMAN</strong> <strong>SETTLEMENT</strong> <strong>PLANNING</strong> <strong>AND</strong> DESIGNstone, a granular or cemented subbase and asubgrade of various soils or gravels. The mode ofdistress in a pavement with an untreated subbase isusually deformation, arising from shear ordensification in the untreated materials. Thedeformation may manifest itself as rutting or aslongitudinal roughness eventually leading tocracking. This is illustrated in Figure 8.3(a).In pavements with cemented sub-bases, the subbaseimproves the load-carrying capacity of thepavement, but at some stage the subbase will crackunder traffic. The cracking may propagate until thelayer eventually exhibits properties similar to thoseof a natural granular material. It is unlikely thatcracking will reflect to the surface, and there is likelyto be little rutting or longitudinal deformation untilafter the subbase has cracked extensively. However,if the subbase exhibits large shrinkage or thermalcracks, they may reflect to the surface.Recent work has shown that the post-crackedphase of a cement-treated subbase under granularand bituminous bases adds substantially to theuseful life of the pavement. Deflectionmeasurements at various depths within thepavement have indicated that the initial effectivemodulus of this material is high - 3 000 to 5 000MPa as shown in Figure 8.3(c).This relatively rigid subbase generally fatiguesunder traffic, or in some cases even underconstruction traffic, and assumes a lower effectivemodulus (800 to 1 000 MPa). This change inmodulus does not normally result in a markedincrease in deformation, but the resilientdeflection and radius of curvature do change, asshown in Figure 8.3(d).In the mechanistic design (Freeme, Maree andViljoen 1982) these phases have been termed thepre-cracked and post-cracked phases. The designaccommodates the changes in modulus of thesubbase and, although the safety factor in the basewill be reduced, it will still be well withinacceptable limits.The eventual modulus of the cemented subbaseswill depend on the quality of the materialoriginally stabilised, the cementing agent, theeffectiveness of the mixing process, the absolutedensity achieved, the durability of the stabilisationand the degree of cracking. The ingress of moisturecan affect the modulus in the post-cracked phasesignificantly. In some cases the layer may behavelike a good-quality granular material with amodulus of 200 to 500 MPa, but in other cases themodulus may be between 50 and 200 MPa. Thischange is shown diagrammatically in Figure 8.3(c).The result is that the modulus of the cementedsubbase assumes very low values and this causesfatigue and high shear stresses in the base.Generally, surface cracking will occur and, with theingress of water, there may be pumping from thesubbase.For high-quality, heavily trafficked pavements it isnecessary to avoid materials that will eventuallydeteriorate to a very low modulus. Many of theselower-class materials have, however, proved to beadequate for lower classes of traffic.The surfacing may crack owing either to hardeningof the binder as it ages or to load-associatedfatigue cracking. The strength of granularmaterials is often susceptible to water, andexcessive deformation may occur when waterenters through surface cracks. The watersusceptibilityof a material depends on factors suchas grading, the PI of the fines, and density.Waterbound macadams are less susceptible towater than crushed-stone bases and are thereforepreferred in wet regions.Bituminous pavementsThese pavements have a bituminous layer morethan 80 mm thick. They can be subdivided into twomajor groups, namely bitumen- and tar-basepavements:Bitumen-base pavements:In bitumen-base pavements both deformation andfatigue cracking are possible. Two types of subbaseare recommended, namely either an untreatedgranular subbase or a weakly stabilised cementedsubbase. Rutting may originate in either thebituminous or the untreated layers, or in both. Thisis illustrated in Figure 8.3(b). If the subbase iscemented there is a probability that shrinkage orthermal cracking will reflect through the base tothe surfacing, especially if the bituminous layer isless than 150 mm thick or if the subbase isexcessively stabilised. Maintenance usually consistsof a surface treatment to provide better skidresistance and to seal small cracks, an asphaltoverlay in cases where riding quality needs to berestored and when it is necessary to prolong thefatigue life of the base, or recycling of the basewhen further overlays are no longer adequate.Tar-base pavements:The fatigue life of a tar premix is well below thatof most asphalt hot-mix materials. Only weaklycemented subbases are used. The main distressappears to be cracking of the cemented subbase,followed by fatigue of the tar base.Maintenance for tar bases is the same as forbituminous bases.Roads: Materials and construction Chapter 817
GUIDELINES FOR <strong>HUMAN</strong> <strong>SETTLEMENT</strong> <strong>PLANNING</strong> <strong>AND</strong> DESIGNRiding qualityRut depthRiding qualityRut depthCrackingCracking(a) Granular baseTime and trafficTime and traffic(b) Bituminous baseEffective modulus (Mpa)5 0004 0003 0001 000500PrecrackedphasePost-crackedphasePoor-qualitymaterialInfluenceof waterGood-qualitymaterialPrecrackedphasePost-crackedphaseCurvatureInfluenceof waterDeflectionDeformationTraffic(c) Cemented-subbasemodulus behaviourTraffic(d) Cemented-subbaseindicatorsRiding-qualityRiding-qualityCrackingCrackingRut depthTime and traffic(e) Concrete pavementTime and traffic(f) Cemented baseFigure 8.3: General pavement behaviour characteristicsBituminous cold-mix based pavementsAlthough the binders in emulsion and foamtreatedmaterials are viscous, the material is stiffand brittle much like a cement-treated materialafter curing. The initial field stiffness values ofthese materials may vary between 800 and 2 000Mpa, depending on the binder content and parentmaterial quality. These values will graduallydecrease with increasing traffic loading to valuestypical for granular materials between 150 and 500MPa. Early indications are that this reduction iscaused by the breakdown (effective fatigue) of thebonded layer into particle sizes smaller than thethickness of the layer (Theyse 1997).Field performance of pavements with emulsionandfoam- treated base layers indicates that theyare not as sensitive to overloading as a pavementwith a cement- treated base, and do not pumpfines from the subbase.18Chapter 8Roads: Materials and construction
GUIDELINES FOR <strong>HUMAN</strong> <strong>SETTLEMENT</strong> <strong>PLANNING</strong> <strong>AND</strong> DESIGNConcrete pavementsIn concrete pavements, most of the traffic loadingis carried by the concrete slab and little stress istransferred to the subgrade. The cementedsubbase provides a uniform foundation and limitspumping of subbase and subgrade fines. Throughthe use of tied shoulders, most of the distressstemming from the edge of the pavement can beeliminated and slab thickness can also be reduced.Distress of the pavement usually appears first asspalling near the joints, and then may progress tocracking in the wheel paths. Once distress becomesevident, deterioration is usually rapid. See Figure8.3(e).Maintenance consists of patching, joint repair,crack repair, under-sealing, grinding, or thinconcrete or bituminous overlays. In cases of severedistress, thick concrete, bituminous or granularoverlays will be used, or the concrete may berecycled.Cemented-base pavementsIn these pavements, most of the traffic stresses areabsorbed by the cemented layers and a little by thesubgrade. It is likely that some block cracking willbe evident very early in the life of the cementedbases; this is caused by the mechanism of dryingshrinkage and by thermal stresses in the cementedlayers. Traffic-induced cracking will cause theblocks to break up into smaller ones. These crackspropagate through the surfacing. The ingress ofwater through the surface cracks may cause theblocks to rock under traffic, resulting in thepumping of fines from the lower layers. Rutting orroughness will generally be low up to this stage butis likely to accelerate as the extent of the crackingincreases. See Figure 8.3(f).Pavements consisting of cemented bases ongranular subbases are very sensitive to overloadingand to ingress of moisture through the cracks.When both the base and the subbase arecemented, the pavement will be less sensitive tooverloading and moisture. The latter type ofpavement is generally used.The shrinkage cracks that form early in the life ofthe pavement may be rehabilitated by sealing.Once traffic-load-associated cracking has becomeextensive, rehabilitation involves either thereprocessing of the base, or the application of asubstantial bituminous or granular overlay.Paving blocksMany types of interlocking and non-interlockingsegmental blocks are used in a wide variety ofapplications, which range from footpaths todriveways to heavily loaded industrial stacking andservicing yards. The use of segmental blockpavements is a relatively recent phenomenon inSouth Africa. The popularity of these blocks isincreasing due to a number of factors:• the blocks are manufactured from localmaterials;• they can either provide a labour-intensiveoperation or can be manufactured and laid bymachine;• they are aesthetically acceptable in a wide rageof applications; and• they are versatile as they have some of theadvantages of both flexible and concretepavements.In current practice a small plate vibrator is used tobed the blocks into a sand bedding ofapproximately 20 mm and to compact jointing sandbetween individual blocks. The selection of theright type of sand for these purposes is important,since a non-plastic material serves best as beddingwhile some plastic content is required to fill thejoints.Properly laid block pavements are adequatelywaterproofed and ingress of large quantities ofwater into foundations does not occur. Theprocedures for the structural design of segmentalblock pavements are presented in UTG2 Structuraldesign of segmental block pavements in southernAfrica (NITRR 1984) and are applicable to bothindustrial and street uses.Segmental blocks are manufactured with verticalsquare side faces. Those that interlock are shapedso as to allow them to fit “jigsaw” fashion into apaved area. They can be made of pressed concrete,fired-clay brick or any other material. The currentrecommended minimum strength for structural useis given as a wet compressive strength of not lessthan 25 MPa.Block pavements require the paved area to be“contained” either by kerbs or by other means ofstopping lateral spread of the block. This is arequirement for both interlocking and noninterlockingshapes. Lateral movements areinduced by trafficking and these movements causebreaks in the jointing sand. The associatedopening-up of the block pavement makes it moresusceptible to the ingress of surface water. Inheavily loaded areas interlocking shapes haveadvantages over non-interlocking shapes,especially if vehicles with a slewing action areinvolved.Roads: Materials and construction Chapter 819
GUIDELINES FOR <strong>HUMAN</strong> <strong>SETTLEMENT</strong> <strong>PLANNING</strong> <strong>AND</strong> DESIGNExperience has shown that joints should be 2 to 5mm wide. Geometric design should follow practicesfor other pavements. Variable street widths, curvesand junctions do not present problems in practice,since the blocks are small and can easily be cut andplaced to suit the geometry of the pavement. Inpractice, the minimum cross-fall for block pavementsshould be one per cent. For wide areas of industrialpaving, special care should be taken to ensure thatthe cross-fall of the surface is adequate. Camberedcross-sections are also satisfactory.The joints between the blocks seal better with timedue to the action of weathering and the addition ofstreet detritus to the joints, thereby improving thetotal strength of the block pavement. One per centfalls (minimum) to the surface of block pavementsallow water to drain across the pavement, reducingingress by absorption through the joints, andeliminate ponding. The joints between the blocks onsteep gradients may form the drainage paths forrainwater. In such cases the pattern of the blocks isan important consideration. Experience has shownthat a herringbone pattern is best for use on steepgradients and for industrial paving.An advantage of the blocks is that they can be reused.They can be lifted if repairs have to be carriedout to failed areas of subbase or if services have tobe installed and can be relaid afterwards. As far asthe design of segmental block pavements isconcerned, this re-use of the blocks has nodisadvantages.Little maintenance work is required with segmentalblock paving. Maintenance involves the treatmentof weeds and the correcting of surface levels if theinitial construction had been poor. The correction ofsurface levels is done by removing the area of blocksaffected, levelling the subbase, compacting thesubbase (often with hand hammers) and replacingthe blocks.Segmental paving provides an exciting addition tothe pavement construction methods possible insouthern Africa.Unpaved streetsThe most common causes of poor performance ofgravel streets are slipperiness and potholing whenwet, and excessive dust and ravelling when dry. Theformation of corrugations is normally the result ofinadequate compaction or low cohesion combinedwith traffic. Frequent maintenance (e.g. grading,watering and the addition of material) is thereforenecessary.ENVIRONMENTThe environment is characterised by topography, theclimatic conditions (moisture and temperature) underwhich the street will function, and the underlyingsubgrade conditions. Environmental factors must betaken into account in the design of pavementstructures.TopographyTopography is dealt with in Chapter 6: StormwaterManagement. The importance of its influence on thestructural design and functional use of streets is clearlyreflected in the drainage and maintenancerequirements of streets in general. Macro drainage isrelevant to this discussion. In rolling and mountainousterrain there may be steep gradients which result inthe erosion of gravel streets and, in particular, erosionof their drainage facilities, with direct implications fortheir safety and functional use. Streets that crosscontours at an angle, or even perpendicularly, pose themost drainage problems. In such cases functionalrather than structural requirements may demand thata street be paved or protected from erosion. It istherefore important that requirements described inthe chapters on Layout Planning and StormwaterManagement be met before one embarks on thestructural design.Unpaved streetsStreets with high longitudinal gradients are morelikely to occur in mountainous areas or even hillyterrain. A 6% longitudinal street gradient is anaverage value above which erosion problems mayoccur, and slopes steeper than this would warrantadditional attention. The upper range of suggestedPI could effectively counteract erosion, but mayresult in unacceptable slipperiness on steep slopes.Local conditions should be considered in thedetailed evaluation.Climate and structural designThe climate will largely determine the rate ofweathering of natural rock and its products, thedurability of weathered natural street-buildingmaterials and - depending on drainage conditions -the stability of untreated materials in the pavement.The climate may also influence the equilibriummoisture content within the pavement layers. Thedesigner should always consider climatic conditionsand avoid using materials that are excessively watersusceptibleor temperature-sensitive in adverseconditions. It is also possible to accommodate climaticconditions by either adjusting California Bearing Ratio(CBR) values or by weighting the equivalent traffic(not both).20Chapter 8Roads: Materials and construction
Chapter 8Roads: Materials andconstruction8
GUIDELINES FOR <strong>HUMAN</strong> <strong>SETTLEMENT</strong> <strong>PLANNING</strong> <strong>AND</strong> DESIGNTABLE OF CONTENTSINTRODUCTION . . . . . . . . . . . . . . . . . . . . . . . . . . . . . . . . . . . . . . . . . . . . . . . . . . . . . . . . . . . . . . . . . . . 1SCOPE <strong>AND</strong> NATURE OF THIS CHAPTER . . . . . . . . . . . . . . . . . . . . . . . . . . . . . . . . . . . . . . . . . . . . . . . . . 1DESIGN PHILOSOPHY . . . . . . . . . . . . . . . . . . . . . . . . . . . . . . . . . . . . . . . . . . . . . . . . . . . . . . . . . . . . . . .1Provision and ability to pay . . . . . . . . . . . . . . . . . . . . . . . . . . . . . . . . . . . . . . . . . . . . . . . . . . . . . . . . . .1Appropriate standards . . . . . . . . . . . . . . . . . . . . . . . . . . . . . . . . . . . . . . . . . . . . . . . . . . . . . . . . . . . . . .1Environmental impact . . . . . . . . . . . . . . . . . . . . . . . . . . . . . . . . . . . . . . . . . . . . . . . . . . . . . . . . . . . . . . .1Risk . . . . . . . . . . . . . . . . . . . . . . . . . . . . . . . . . . . . . . . . . . . . . . . . . . . . . . . . . . . . . . . . . . . . . . . . . . . . .2THE PAVEMENT DESIGN PROCESS . . . . . . . . . . . . . . . . . . . . . . . . . . . . . . . . . . . . . . . . . . . . . . . . . . . . . 2Level of service . . . . . . . . . . . . . . . . . . . . . . . . . . . . . . . . . . . . . . . . . . . . . . . . . . . . . . . . . . . . . . . . . . . .2Stormwater accommodation . . . . . . . . . . . . . . . . . . . . . . . . . . . . . . . . . . . . . . . . . . . . . . . . . . . . . . . . .2Economic considerations and design strategy . . . . . . . . . . . . . . . . . . . . . . . . . . . . . . . . . . . . . . . . . . . .3STRUCTURE OF THIS CHAPTER . . . . . . . . . . . . . . . . . . . . . . . . . . . . . . . . . . . . . . . . . . . . . . . . . . . . . . . . 3THE COMPONENTS OF THE DESIGN PROCESS. . . . . . . . . . . . . . . . . . . . . . . . . . . . . . . . . . . . . . . . . . . . . 5SERVICE OBJECTIVE. . . . . . . . . . . . . . . . . . . . . . . . . . . . . . . . . . . . . . . . . . . . . . . . . . . . . . . . . . . . . . . . . 5COMPILING A STREET “PROFILE” . . . . . . . . . . . . . . . . . . . . . . . . . . . . . . . . . . . . . . . . . . . . . . . . . . . . . . 5Street categories . . . . . . . . . . . . . . . . . . . . . . . . . . . . . . . . . . . . . . . . . . . . . . . . . . . . . . . . . . . . . . . . . . .5Street function . . . . . . . . . . . . . . . . . . . . . . . . . . . . . . . . . . . . . . . . . . . . . . . . . . . . . . . . . . . . . . . . . . . .6Level of service (LOS) . . . . . . . . . . . . . . . . . . . . . . . . . . . . . . . . . . . . . . . . . . . . . . . . . . . . . . . . . . . . . . .6Street standards . . . . . . . . . . . . . . . . . . . . . . . . . . . . . . . . . . . . . . . . . . . . . . . . . . . . . . . . . . . . . . . . . . .6The street as public open space . . . . . . . . . . . . . . . . . . . . . . . . . . . . . . . . . . . . . . . . . . . . . . . . . . . . . . .8DESIGN STRATEGY . . . . . . . . . . . . . . . . . . . . . . . . . . . . . . . . . . . . . . . . . . . . . . . . . . . . . . . . . . . . . . . . . 8Paved streets . . . . . . . . . . . . . . . . . . . . . . . . . . . . . . . . . . . . . . . . . . . . . . . . . . . . . . . . . . . . . . . . . . . . . .8Selection of analysis period . . . . . . . . . . . . . . . . . . . . . . . . . . . . . . . . . . . . . . . . . . . . . . . . . . . . . . . . .10Structural design period . . . . . . . . . . . . . . . . . . . . . . . . . . . . . . . . . . . . . . . . . . . . . . . . . . . . . . . . . . . .10DESIGN TRAFFIC <strong>AND</strong> BEARING CAPACITY. . . . . . . . . . . . . . . . . . . . . . . . . . . . . . . . . . . . . . . . . . . . . . 10Paved streets . . . . . . . . . . . . . . . . . . . . . . . . . . . . . . . . . . . . . . . . . . . . . . . . . . . . . . . . . . . . . . . . . . . . .10Unpaved streets . . . . . . . . . . . . . . . . . . . . . . . . . . . . . . . . . . . . . . . . . . . . . . . . . . . . . . . . . . . . . . . . . .15MATERIALS . . . . . . . . . . . . . . . . . . . . . . . . . . . . . . . . . . . . . . . . . . . . . . . . . . . . . . . . . . . . . . . . . . . . . . 15Description of major material types . . . . . . . . . . . . . . . . . . . . . . . . . . . . . . . . . . . . . . . . . . . . . . . . . . .15Roads: Materials and construction Chapter 8i
GUIDELINES FOR <strong>HUMAN</strong> <strong>SETTLEMENT</strong> <strong>PLANNING</strong> <strong>AND</strong> DESIGNPAVEMENT TYPES . . . . . . . . . . . . . . . . . . . . . . . . . . . . . . . . . . . . . . . . . . . . . . . . . . . . . . . . . . . . . . . . . 16Behaviour of different pavement types . . . . . . . . . . . . . . . . . . . . . . . . . . . . . . . . . . . . . . . . . . . . . . . .16ENVIRONMENT . . . . . . . . . . . . . . . . . . . . . . . . . . . . . . . . . . . . . . . . . . . . . . . . . . . . . . . . . . . . . . . . . . . 20Topography . . . . . . . . . . . . . . . . . . . . . . . . . . . . . . . . . . . . . . . . . . . . . . . . . . . . . . . . . . . . . . . . . . . . . .20Climate and structural design . . . . . . . . . . . . . . . . . . . . . . . . . . . . . . . . . . . . . . . . . . . . . . . . . . . . . . . .20Climate and subgrade California Bearing Ratio (CBR) . . . . . . . . . . . . . . . . . . . . . . . . . . . . . . . . . . . . .21Material depth . . . . . . . . . . . . . . . . . . . . . . . . . . . . . . . . . . . . . . . . . . . . . . . . . . . . . . . . . . . . . . . . . . .22Delineation of subgrade areas . . . . . . . . . . . . . . . . . . . . . . . . . . . . . . . . . . . . . . . . . . . . . . . . . . . . . . .22Design CBR of subgrade . . . . . . . . . . . . . . . . . . . . . . . . . . . . . . . . . . . . . . . . . . . . . . . . . . . . . . . . . . . .22STRUCTURAL DESIGN METHODS. . . . . . . . . . . . . . . . . . . . . . . . . . . . . . . . . . . . . . . . . . . . . . . . . . . . . . 22Design methods for paved streets . . . . . . . . . . . . . . . . . . . . . . . . . . . . . . . . . . . . . . . . . . . . . . . . . . . .22Design methods for unpaved streets . . . . . . . . . . . . . . . . . . . . . . . . . . . . . . . . . . . . . . . . . . . . . . . . . .24PRACTICAL CONSIDERATIONS. . . . . . . . . . . . . . . . . . . . . . . . . . . . . . . . . . . . . . . . . . . . . . . . . . . . . . . . 24Surface drainage . . . . . . . . . . . . . . . . . . . . . . . . . . . . . . . . . . . . . . . . . . . . . . . . . . . . . . . . . . . . . . . . . .24Subsurface drainage . . . . . . . . . . . . . . . . . . . . . . . . . . . . . . . . . . . . . . . . . . . . . . . . . . . . . . . . . . . . . . .25Compaction . . . . . . . . . . . . . . . . . . . . . . . . . . . . . . . . . . . . . . . . . . . . . . . . . . . . . . . . . . . . . . . . . . . . . .29Subgrade below material depth . . . . . . . . . . . . . . . . . . . . . . . . . . . . . . . . . . . . . . . . . . . . . . . . . . . . . .30Street levels . . . . . . . . . . . . . . . . . . . . . . . . . . . . . . . . . . . . . . . . . . . . . . . . . . . . . . . . . . . . . . . . . . . . . .30Service trenches . . . . . . . . . . . . . . . . . . . . . . . . . . . . . . . . . . . . . . . . . . . . . . . . . . . . . . . . . . . . . . . . . .31Pavement cross-section . . . . . . . . . . . . . . . . . . . . . . . . . . . . . . . . . . . . . . . . . . . . . . . . . . . . . . . . . . . . .31Considerations for concrete pavements . . . . . . . . . . . . . . . . . . . . . . . . . . . . . . . . . . . . . . . . . . . . . . . .32Kerbs and channels . . . . . . . . . . . . . . . . . . . . . . . . . . . . . . . . . . . . . . . . . . . . . . . . . . . . . . . . . . . . . . . .32Edging . . . . . . . . . . . . . . . . . . . . . . . . . . . . . . . . . . . . . . . . . . . . . . . . . . . . . . . . . . . . . . . . . . . . . . . . . .32Accessibility . . . . . . . . . . . . . . . . . . . . . . . . . . . . . . . . . . . . . . . . . . . . . . . . . . . . . . . . . . . . . . . . . . . . . .32COST ANALYSIS . . . . . . . . . . . . . . . . . . . . . . . . . . . . . . . . . . . . . . . . . . . . . . . . . . . . . . . . . . . . . . . . . . . 32General . . . . . . . . . . . . . . . . . . . . . . . . . . . . . . . . . . . . . . . . . . . . . . . . . . . . . . . . . . . . . . . . . . . . . . . . .32Present worth . . . . . . . . . . . . . . . . . . . . . . . . . . . . . . . . . . . . . . . . . . . . . . . . . . . . . . . . . . . . . . . . . . . .32Construction costs . . . . . . . . . . . . . . . . . . . . . . . . . . . . . . . . . . . . . . . . . . . . . . . . . . . . . . . . . . . . . . . . .33Maintenance costs . . . . . . . . . . . . . . . . . . . . . . . . . . . . . . . . . . . . . . . . . . . . . . . . . . . . . . . . . . . . . . . .33Real discount rate . . . . . . . . . . . . . . . . . . . . . . . . . . . . . . . . . . . . . . . . . . . . . . . . . . . . . . . . . . . . . . . . .34Salvage value . . . . . . . . . . . . . . . . . . . . . . . . . . . . . . . . . . . . . . . . . . . . . . . . . . . . . . . . . . . . . . . . . . . .34iiChapter 8Roads: Materials and construction
GUIDELINES FOR <strong>HUMAN</strong> <strong>SETTLEMENT</strong> <strong>PLANNING</strong> <strong>AND</strong> DESIGNOptimisation of life-cycle costs . . . . . . . . . . . . . . . . . . . . . . . . . . . . . . . . . . . . . . . . . . . . . . . . . . . . . . .35DISCUSSION ON THE DESIGN PROCEDURES FOR DIFFERENT STREET TYPES. . . . . . . . . . . . . . . . . . . . . 36PAVED ARTERIAL <strong>AND</strong> ACCESS STREETS. . . . . . . . . . . . . . . . . . . . . . . . . . . . . . . . . . . . . . . . . . . . . . . . 36The design process . . . . . . . . . . . . . . . . . . . . . . . . . . . . . . . . . . . . . . . . . . . . . . . . . . . . . . . . . . . . . . . .36PAVED BASIC ACCESS STREETS . . . . . . . . . . . . . . . . . . . . . . . . . . . . . . . . . . . . . . . . . . . . . . . . . . . . . . . 41Structural design of paved basic access streets . . . . . . . . . . . . . . . . . . . . . . . . . . . . . . . . . . . . . . . . . . .41UNPAVED ARTERIAL <strong>AND</strong> ACCESS STREETS . . . . . . . . . . . . . . . . . . . . . . . . . . . . . . . . . . . . . . . . . . . . . 43Street category . . . . . . . . . . . . . . . . . . . . . . . . . . . . . . . . . . . . . . . . . . . . . . . . . . . . . . . . . . . . . . . . . . .43Design strategy . . . . . . . . . . . . . . . . . . . . . . . . . . . . . . . . . . . . . . . . . . . . . . . . . . . . . . . . . . . . . . . . . . .43Materials . . . . . . . . . . . . . . . . . . . . . . . . . . . . . . . . . . . . . . . . . . . . . . . . . . . . . . . . . . . . . . . . . . . . . . . .43Design of imported layers . . . . . . . . . . . . . . . . . . . . . . . . . . . . . . . . . . . . . . . . . . . . . . . . . . . . . . . . . . .43UNPAVED BASIC ACCESS STREETS. . . . . . . . . . . . . . . . . . . . . . . . . . . . . . . . . . . . . . . . . . . . . . . . . . . . . 44TERTIARY WAYS . . . . . . . . . . . . . . . . . . . . . . . . . . . . . . . . . . . . . . . . . . . . . . . . . . . . . . . . . . . . . . . . . . 44Layout . . . . . . . . . . . . . . . . . . . . . . . . . . . . . . . . . . . . . . . . . . . . . . . . . . . . . . . . . . . . . . . . . . . . . . . . . .44Material . . . . . . . . . . . . . . . . . . . . . . . . . . . . . . . . . . . . . . . . . . . . . . . . . . . . . . . . . . . . . . . . . . . . . . . .45Design of tertiary ways (standard cross-sections) . . . . . . . . . . . . . . . . . . . . . . . . . . . . . . . . . . . . . . . . .45CONSTRUCTION . . . . . . . . . . . . . . . . . . . . . . . . . . . . . . . . . . . . . . . . . . . . . . . . . . . . . . . . . . . . . . . . . . 48Staged construction and upgrading . . . . . . . . . . . . . . . . . . . . . . . . . . . . . . . . . . . . . . . . . . . . . . . . . . .48Construction approaches . . . . . . . . . . . . . . . . . . . . . . . . . . . . . . . . . . . . . . . . . . . . . . . . . . . . . . . . . . .51DESIGNING FOR LABOUR-BASED CONSTRUCTION . . . . . . . . . . . . . . . . . . . . . . . . . . . . . . . . . . . . . . . . 51MAINTENANCE . . . . . . . . . . . . . . . . . . . . . . . . . . . . . . . . . . . . . . . . . . . . . . . . . . . . . . . . . . . . . . . . . . . 54MAINTENANCE OF BASIC ACCESS STREETS. . . . . . . . . . . . . . . . . . . . . . . . . . . . . . . . . . . . . . . . . . . . . . 56Labour and mechanisation . . . . . . . . . . . . . . . . . . . . . . . . . . . . . . . . . . . . . . . . . . . . . . . . . . . . . . . . . .56Environmental maintenance . . . . . . . . . . . . . . . . . . . . . . . . . . . . . . . . . . . . . . . . . . . . . . . . . . . . . . . . .56MAINTENANCE OF TERTIARY WAYS . . . . . . . . . . . . . . . . . . . . . . . . . . . . . . . . . . . . . . . . . . . . . . . . . . . 56BIBLIOGRAPHY . . . . . . . . . . . . . . . . . . . . . . . . . . . . . . . . . . . . . . . . . . . . . . . . . . . . . . . . . . . . . . . . . . . 59Roads: Materials and construction Chapter 8iii
GUIDELINES FOR <strong>HUMAN</strong> <strong>SETTLEMENT</strong> <strong>PLANNING</strong> <strong>AND</strong> DESIGNAPPENDIX A: THE CATALOGUE OF PAVEMENT DESIGNS . . . . . . . . . . . . . . . . . . . . . . . . . . . . . . 61Notes regarding the use of the catalogue . . . . . . . . . . . . . . . . . . . . . . . . . . . . . . 61RECOMMENDED READING . . . . . . . . . . . . . . . . . . . . . . . . . . . . . . . . . . . . . . . . . . 61APPENDIX B: EXAMPLES OF STRUCTURAL DESIGN BY THE CATALOGUE METHOD. . . . . . . . . . 71A. EXAMPLE OF THE STRUCTURAL DESIGN OF A CATEGORY UB STREET . . . . 71SERVICE OBJECTIVE, STREET CHARACTERISTICS <strong>AND</strong> STREET PROFILE . . . . 71Design strategy . . . . . . . . . . . . . . . . . . . . . . . . . . . . . . . . . . . . . . . . . . . . . . 71Structural design and pavement type selection. . . . . . . . . . . . . . . . . . . . . . 73Possible pavement structures. . . . . . . . . . . . . . . . . . . . . . . . . . . . . . . . . . . . 74Practical considerations . . . . . . . . . . . . . . . . . . . . . . . . . . . . . . . . . . . . . . . . 74Cost analysis . . . . . . . . . . . . . . . . . . . . . . . . . . . . . . . . . . . . . . . . . . . . . . . . . 74Discount rate . . . . . . . . . . . . . . . . . . . . . . . . . . . . . . . . . . . . . . . . . . . . . . . . 74Salvage value and road-user costs . . . . . . . . . . . . . . . . . . . . . . . . . . . . . . . . 74Present worth of costs . . . . . . . . . . . . . . . . . . . . . . . . . . . . . . . . . . . . . . . . . 74B. EXAMPLE OF THE STRUCTURAL DESIGN OF A CATEGORY UD STREET . . . . 77SERVICE OBJECTIVE, STREET CHARACTERISTICS <strong>AND</strong> STREET PROFILE . . . . 77Street category. . . . . . . . . . . . . . . . . . . . . . . . . . . . . . . . . . . . . . . . . . . . . . . 77Estimate design traffic . . . . . . . . . . . . . . . . . . . . . . . . . . . . . . . . . . . . . . . . . 77Materials . . . . . . . . . . . . . . . . . . . . . . . . . . . . . . . . . . . . . . . . . . . . . . . . . . . 77Structural design and pavement type selection. . . . . . . . . . . . . . . . . . . . . . 77Subgrade CBR and selected layers . . . . . . . . . . . . . . . . . . . . . . . . . . . . . . . . 77Possible pavement structures. . . . . . . . . . . . . . . . . . . . . . . . . . . . . . . . . . . . 78Cost analysis . . . . . . . . . . . . . . . . . . . . . . . . . . . . . . . . . . . . . . . . . . . . . . . . . 78APPENDIX C: MATERIAL TYPES . . . . . . . . . . . . . . . . . . . . . . . . . . . . . . . . . . . . . . . . . . . . . . . . . 79Materials for paved basic access streets . . . . . . . . . . . . . . . . . . . . . . . . . . . . . . . . 79Material problems . . . . . . . . . . . . . . . . . . . . . . . . . . . . . . . . . . . . . . . 82Materials for unsealed streets . . . . . . . . . . . . . . . . . . . . . . . . . . . . . . 82Earth streets . . . . . . . . . . . . . . . . . . . . . . . . . . . . . . . . . . . . . . . . . . . 83Gravel wearing courses . . . . . . . . . . . . . . . . . . . . . . . . . . . . . . . . . . . 83Stabilised earth streets . . . . . . . . . . . . . . . . . . . . . . . . . . . . . . . . . . . . . . . . . . 86Dust palliatives . . . . . . . . . . . . . . . . . . . . . . . . . . . . . . . . . . . . . . . . . . . . . . . . . . . 86RECOMMENDED READING . . . . . . . . . . . . . . . . . . . . . . . . . . . . . . . . . . . . . . . . . . . . . . . . . . . . . . . 86ivChapter 8Roads: Materials and construction
GUIDELINES FOR <strong>HUMAN</strong> <strong>SETTLEMENT</strong> <strong>PLANNING</strong> <strong>AND</strong> DESIGNLIST OF TABLESTable 8.1 Typical street characteristics . . . . . . . . . . . . . . . . . . . . . . . . . . . . . . . . . . . . . . . . . . . . . . . . . . . . . . .5Table 8.2 Levels of service (LOS) of streets or drainage and combined facilities . . . . . . . . . . . . . . . . . . . . . . .7Table 8.3 Categorisation of street standards . . . . . . . . . . . . . . . . . . . . . . . . . . . . . . . . . . . . . . . . . . . . . . . . . .8Table 8.4 Structural design periods for various street categories . . . . . . . . . . . . . . . . . . . . . . . . . . . . . . . . .10Table 8.5 Classification of pavements and traffic for structural design purposes . . . . . . . . . . . . . . . . . . . . .11Table 8.6 80 kN single-axle equivalency factors, derived from F= (p/80) 4,2 . . . . . . . . . . . . . . . . . . . . . . . . . .12Table 8.7 Determination of E80s per commercial vehicle . . . . . . . . . . . . . . . . . . . . . . . . . . . . . . . . . . . . . . . .12Table 8.8 Traffic growth factor (g) for calculation of future or initial traffic from present traffic . . . . . . . .13Table 8.9Table 8.10Traffic growth factor (f y ) for calculation of cumulative traffic over predictionperiod from initial (daily) traffic . . . . . . . . . . . . . . . . . . . . . . . . . . . . . . . . . . . . . . . . . . . . . . . . . . .14Design factors for the distribution of traffic and equivalent traffic among lanes andshoulders . . . . . . . . . . . . . . . . . . . . . . . . . . . . . . . . . . . . . . . . . . . . . . . . . . . . . . . . . . . . . . . . . . . . .14Table 8.11 Material depths to be used for determining the design CBR of the subgrades . . . . . . . . . . . . . . .22Table 8.12 Subgrade CBR groups used for structural design . . . . . . . . . . . . . . . . . . . . . . . . . . . . . . . . . . . . . .22Table 8.13 Scour velocities for various materials . . . . . . . . . . . . . . . . . . . . . . . . . . . . . . . . . . . . . . . . . . . . . . .25Table 8.14Table 8.15Compaction requirements for the construction of pavement layers (andreinstatement of pavement layers) . . . . . . . . . . . . . . . . . . . . . . . . . . . . . . . . . . . . . . . . . . . . . . . . .30Suggested typical ranges of period of service (without rejuvenators) of various surfacingtypes in the different street categories and base types (if used as specifiedin the catalogue) . . . . . . . . . . . . . . . . . . . . . . . . . . . . . . . . . . . . . . . . . . . . . . . . . . . . . . . . . . . . . . .34Table 8.16 Typical future maintenance for cost analysis . . . . . . . . . . . . . . . . . . . . . . . . . . . . . . . . . . . . . . . . .35Table 8.17 Suggested pavement types for different road categories and traffic classes . . . . . . . . . . . . . . . . .39Table 8.18Table 8.19Possible condition at end of structural design period for various street categoriesand pavement types . . . . . . . . . . . . . . . . . . . . . . . . . . . . . . . . . . . . . . . . . . . . . . . . . . . . . . . . . . . .40Preparation of subgrade and required selected layers for the different subgradedesign CBRs . . . . . . . . . . . . . . . . . . . . . . . . . . . . . . . . . . . . . . . . . . . . . . . . . . . . . . . . . . . . . . . . . . .41Table 8.20 Examples of staged construction . . . . . . . . . . . . . . . . . . . . . . . . . . . . . . . . . . . . . . . . . . . . . . . . . .49Table 8.21 Summary of employment potential . . . . . . . . . . . . . . . . . . . . . . . . . . . . . . . . . . . . . . . . . . . . . . . .52Table 8.22 Relative contribution of main activities . . . . . . . . . . . . . . . . . . . . . . . . . . . . . . . . . . . . . . . . . . . . .52Table 8.23 Potential of pavement layers for labour-intensive construction methods . . . . . . . . . . . . . . . . . . .53Table 8.24 Typical activities suited to ABEs . . . . . . . . . . . . . . . . . . . . . . . . . . . . . . . . . . . . . . . . . . . . . . . . . . .54Table 8.25 Street maintenance categories and limited examples of maintenance activities . . . . . . . . . . . . . .55Table 8.26 Suitability of mechanical equipment and labour for maintenance activities . . . . . . . . . . . . . . . . .58Roads: Materials and construction Chapter 8v
GUIDELINES FOR <strong>HUMAN</strong> <strong>SETTLEMENT</strong> <strong>PLANNING</strong> <strong>AND</strong> DESIGNLIST OF FIGURESFigure 8.1 Street pavement design flow diagram . . . . . . . . . . . . . . . . . . . . . . . . . . . . . . . . . . . . . . . . . . . . . . 4Figure 8.2 Illustration of design periods and alternative design strategies . . . . . . . . . . . . . . . . . . . . . . . . . . . .9Figure 8.3 General pavement behaviour characteristics . . . . . . . . . . . . . . . . . . . . . . . . . . . . . . . . . . . . . . . . .18Figure 8.4 Macro-climatic regions of southern africa . . . . . . . . . . . . . . . . . . . . . . . . . . . . . . . . . . . . . . . . . . .21Figure 8.5 Typical basic access street cross-sections . . . . . . . . . . . . . . . . . . . . . . . . . . . . . . . . . . . . . . . . . . . . .25Figure 8.6 Tertiary ways: ditches and drains . . . . . . . . . . . . . . . . . . . . . . . . . . . . . . . . . . . . . . . . . . . . . . . . . .26Figure 8.7 Tertiary ways: drift . . . . . . . . . . . . . . . . . . . . . . . . . . . . . . . . . . . . . . . . . . . . . . . . . . . . . . . . . . . . .27Figure 8.8 Tertiary ways: dish drains . . . . . . . . . . . . . . . . . . . . . . . . . . . . . . . . . . . . . . . . . . . . . . . . . . . . . . . .28Figure 8.9 Typical grass block and vegetation . . . . . . . . . . . . . . . . . . . . . . . . . . . . . . . . . . . . . . . . . . . . . . . . .29Figure 8.10 Illustrative pavement cross-section . . . . . . . . . . . . . . . . . . . . . . . . . . . . . . . . . . . . . . . . . . . . . . . . .31Figure 8.11Degree of structural distress to be expected at the time of rehabilitation fordifferent structural design periods . . . . . . . . . . . . . . . . . . . . . . . . . . . . . . . . . . . . . . . . . . . . . . . . .36Figure 8.12 Typical cost versus level of service curve values . . . . . . . . . . . . . . . . . . . . . . . . . . . . . . . . . . . . . . .36Figure 8.13 Structural design flow diagram (mainly for category UA and UB streets) . . . . . . . . . . . . . . . . . . .37Figure 8.14 Simplified design flow diagram for residential streets (category UC and UD) . . . . . . . . . . . . . . . .38Figure 8.15 Ranges of terminal rut depth conditions for different street categories . . . . . . . . . . . . . . . . . . . .40Figure 8.16 Pavement design curves for basic access streets . . . . . . . . . . . . . . . . . . . . . . . . . . . . . . . . . . . . . . .42Figure 8.17 Design curves for the passability of unpaved roads . . . . . . . . . . . . . . . . . . . . . . . . . . . . . . . . . . . .44Figure 8.18 Flow diagram of design process for basic access streets . . . . . . . . . . . . . . . . . . . . . . . . . . . . . . . . .45Figure 8.19 Tertiary ways: cross-sections . . . . . . . . . . . . . . . . . . . . . . . . . . . . . . . . . . . . . . . . . . . . . . . . . . . . . .46Figure 8.20 Labour-intensive tertiary ways: cross-sections, cuttings and embankments . . . . . . . . . . . . . . . . . .47Figure 8.21 Simple drags for maintenance of tertiary ways . . . . . . . . . . . . . . . . . . . . . . . . . . . . . . . . . . . . . . .57viChapter 8Roads: Materials and construction
GUIDELINES FOR <strong>HUMAN</strong> <strong>SETTLEMENT</strong> <strong>PLANNING</strong> <strong>AND</strong> DESIGNNAMIBIAWalvisbayCapitalsJhb = JohannesburgWindhoekKeetmanshoopCape TownNORTHERN CAPEWESTERNCAPEKimberleyBOTSWANAMossel BayMmbathoNORTHWESTFrancistownGaboroneBloemfonteinEASTERNCAPEBishoPort ElizabethFREESTATEPietersburgNORTHERNPROVINCEJhbGAUTENGEast LondonMPUMALANGANelspruitKWAZULUNATALDurbanMaputoPietermaritzburgLegendClimaticregionWetModerateDryBeiraApprox.WeinertNvalues< 22 - 5> 5Figure 8.4: Macro-climatic regions of southern AfricaSouthern Africa can be divided into three climaticregions:• a large dry region;• a moderate region; and• a small wet region.Figure 8.4 is a map of southern Africa, which indicatesthe different climatic regions. These are macroclimatesand it should be kept in mind that differentmicroclimates may occur within these regions. This isparticularly important where such local microclimateshave a high moisture content. This will have a directinfluence on moisture-susceptible materials in basicaccess streets which require specific drainageconsiderations.Climate and subgrade California BearingRatio (CBR)The design parameter for the subgrade is the soakedCBR at a representative density. For structural designpurposes, when a material is classified according to theCBR, it is implied that not more than 10% of themeasured values for such a material will fall below theclassification value. A proper preliminary soil surveyshould be conducted.It is current practice to use soaked CBR values, butusing them in dry regions may be over-conservative(Jordaan 1986). It is suggested that the CBR value of amaterial be increased if the in situ conditions areexpected to be unsoaked, e.g. in dry regions (Haupt1980). An estimate of the CBR at the expectedmoisture conditions, i.e. at optimum moisture content(OMC) or, say, 75 per cent of OMC, can be determinedin the laboratory by refraining from soaking thesamples before CBR testing or even drying back to therequired moisture content.The dynamic cone penetrometer (DCP) can be used todetermine the in-situ CBR and variations in in-situstrengths (Jordaan 1986). The in-situ CBRs determinedwith the DCP can be calibrated by doing laboratorysoakedCBRs. If material parameters such as gradingmodulus (GM), plastic limit (PL) and dry density (DD) areincluded in the analysis, typical relations can be used toderive CBR values (Sampson 1984). The relevantequation is:log e CBR = 1,1 (log e DCP) + 0,85 (GM) -0,031 (PL) - 0,001 (DD) + 7,4 (8.9)where loge is the natural logarithm.For the material types under consideration, the CBR isdetermined at a 2,54 mm depth of penetration, withDCP penetration in millimetres per blow.It is current practice for the design parameter forsubgrade to be the soaked California Bearing Ratio(CBR) for paved streets. It is recommended thatunsoaked (field) CBR values should be used particularlyin dry regions (Haupt 1980; Emery 1984 and 1987). Thedynamic cone penetrometer (DCP) is the idealinstrument for such an approach (Kleyn and van Zyl1987; Kleyn 1982). However, it should be pointed outRoads: Materials and construction Chapter 821
GUIDELINES FOR <strong>HUMAN</strong> <strong>SETTLEMENT</strong> <strong>PLANNING</strong> <strong>AND</strong> DESIGNthat soaked CBR values may be required for wetregions where no proper drainage can be provided orfor wet-season passability on unpaved streets. Whenthe DCP is used, care should be taken that themoisture content is a fair representation of themoisture content over long periods of time.The requirement for subgrade or fill CBR is a soakedCBR of at least 3 at 90% Mod AASHTO density in wetareas, and an in-situ CBR of 3 in dry and moderateareas. The material should also have a maximum swellof 1,5% at 100% Mod AASHTO compaction to ensurethat it is not too expansive. If the CBR values aredetermined in the field with the DCP, the subgradeareas with a field CBR of less than 3 will need specialtreatment. If the field CBR values are in excess of 45over a depth of at least 150mm at a density of 95%Mod AASHTO, the subgrade can be considered to besubbase quality, and only a base would be needed.Material depthThe term “material depth” is used to denote the depthbelow the finished level of the street to which soilcharacteristics have a significant effect on pavementbehaviour. Below this depth, the strength and densityof the soils are assumed to have a negligible effect onthe pavement. The depth approximates the cover for asoil with CBR of 1 - 2. However, in certain special casesthis depth may be insufficient. These cases are listed inthe section dealing with practical considerations(subgrade below material depth).Table 8.11 specifies the materail depth used fordeterming the design CBR of the subgrade fordifferent street categories.Table 8.11: Material depths to be used fordetermining the design CBRof the subgradesROAD CATEGORYMATERIAL DEPTH (mm)UA 1 000UB 800UC 600UD 400The designer should distinguish between very localisedgood or poor soils and more general subgrade areas.Localised soils should be treated separately from therest of the pavement factors. Normally, localised poorsoils will be removed and replaced by suitable material.Design CBR of subgradeFor construction purposes the design subgrade CBR islimited to four groups, as shown in Table 8.12.Table 8.12: Subgrade CBR groups used forstructural designCLASSThe CBR is normally determined after samples havebeen soaked for four days. Special measures arenecessary if a material with a CBR of less than 3 isencountered within the material depth. Thesemeasures include stabilisation (chemical ormechanical), modification (chemical), or the removalor addition of extra cover. After the material has beentreated, it will be classified under one of theremaining three subgrade groups.Design CBR on fillWhen the street is on fill, the designer must availhimself of the best information available on thelocal materials that are likely to be used. Thematerial should be controlled to at least thematerial depth. TRH10 (NITRR 1984) should beconsulted when a material with a CBR of less than3 is used in the fill.Design CBR in cutSUBGRADE CBRSG1 >15SG2 7 to 15SG3 3 to 7SG4
GUIDELINES FOR <strong>HUMAN</strong> <strong>SETTLEMENT</strong> <strong>PLANNING</strong> <strong>AND</strong> DESIGNparticular design method in mind. Most of the purelyempirical design methods were developed from datawhere the design bearing capacity did not exceed 10to 12 million standard axles. The purely empiricaldesign methods are also limited in their application toconditions similar to those for which they weredeveloped. The designer must therefore make acritical assessment of the applicability of the designmethod to his design problem. Locally developedmethods should then also have an advantage in thisregard.It must also be kept in mind that, although thesedesign methods will predict a certain bearing capacityfor a pavement structure, there are many factors thatwill influence the actual bearing capacity of thepavement, and the predicted value should beregarded only as an estimate. It is therefore better toapply various design methods, with each methodpredicting a somewhat different bearing capacity. Thiswill assist the designer to develop a feeling for therange of bearing capacity for the pavement, ratherthan stake everything on a single value.The “Catalogue” design methodThis document focuses mainly on the use of thecatalogue of pavement designs (CSRA 1996; CUTA1987; Hefer 1997; Theyse 1997) included inAppendix A. However, this does not exclude theuse of any of the other proven design methods.Most of the pavement designs in the cataloguewere developed from mechanistic-empiricaldesign, although some are based on the DCPdesign method and others are included on thebasis of their field performance.The catalogue approach is a fairly straightforwardpen-and-paper method and does not require accessto a computer.The California Bearing Ratio (CBR) coverdesign methodThe California Bearing Ratio (CBR) design methodwas developed in the 1950s from empirical data(Yoder and Witczak 1975). The method is based onthe approach of protecting the subgrade byproviding enough cover of sufficient strength toprotect the subgrade from the traffic loading. CBRcoverdesign charts were developed for differentsubgrade CBR strengths and traffic loadings. Theapplicability of this method should be evaluatedcritically before it is applied to local environmentaland traffic conditions.This method is a pen-and-paper method and noaccess to a computer is required.The AASHTO Guide for Design of PavementStructuresThe AASHTO Guide for Design of PavementStructures provides the designer with acomprehensive set of procedures for new andrehabilitation design and provides a goodbackground to pavement design (AASHTO 1993).The design procedures in the guideline documentare, however, empirical, and were mostlydeveloped from the results of the AASHTO RoadTest carried out in the late 1950s and early 1960s.Although some software based on the proceduresin the AASHTO design guide is commerciallyavailable, the procedure may be applied just aswell by hand.The Dynamic Cone Penetrometer (DCP)methodThe DCP design method was developed locallyduring the 1970s. The original method was basedon the CBR-cover design approach and latercorrelated with heavy vehicle simulator (HVS) testresults. This method incorporates the concept of abalanced pavement structure in the designprocedure (Kleyn and van Zyl 1987). If usedproperly, designs generated by this method shouldhave a well-balanced strength profile with depth,meaning that there will be a smooth decrease inmaterial strength with depth. Such balancedpavements are normally not very sensitive tooverloading. Some knowledge of typical DCPpenetration rates for road-building material isrequired to apply this method.DCP design may be done by hand, but if DCP dataneed to be analysed, access to a computer andappropriate software is necessary.South African Mechanistic Design MethodThe South African Mechanistic Design Method(SAMDM) (van Vuuren et al 1974; Walker et al1977; Paterson and Maree 1978; Theyse et al 1996)was developed locally and is one of the mostcomprehensive mechanistic-empirical designmethods in the world (Freeme, Maree and Viljoen1982). This method may be used very effectivelyfor new and rehabilitation design. Someknowledge of the elastic properties of materials asused by the method is required, and experience inthis regard is recommended. In the case ofrehabilitation design or upgrading, field tests suchas the DCP and Falling Weight Deflectometer(FWD) may be used to determine the inputparameters for the existing structure.Access to a computer and appropriate software isessential for effective use of this method, as well asRoads: Materials and construction Chapter 823
GUIDELINES FOR <strong>HUMAN</strong> <strong>SETTLEMENT</strong> <strong>PLANNING</strong> <strong>AND</strong> DESIGNfor analysing DCP and FWD data.Design methods for unpaved streetsUnlike sealed roads, where the application of abituminous surfacing results in a semi-permanentstructure (for up to 20 years) in which deformation orfailure is costly to repair and usually politicallyunacceptable, unsealed roads are far more forgiving.Routine maintenance is essential and localisedproblems are rectified relatively easily. For this reason,the design process for unsealed roads has neverprogressed to the sophisticated techniques developedfor sealed roads.The main principles in designing unsealed roads are• to prevent excessive subgrade strain; and• to provide an all-weather, dust-free surface withacceptable riding quality.These two requirements are achieved by providing anadequate thickness of suitable material, constructed toa suitable quality. A simple design technique coveringthickness and materials has been developed for SouthAfrica and is summarised in TRH14 Guidelines for roadconstruction materials (NITRR 1984c).PRACTICAL CONSIDERATIONSSurface drainageExperience has shown that inadequate drainage isprobably responsible for more pavement distress insouthern Africa than inadequate structural or materialdesign. Effective drainage is essential for goodpavement performance, and it is assumed in thestructural design procedure.Drainage for basic access streetsEffective drainage is a prerequisite in the structuraldesign of basic access streets. Drainage design isintegral in stormwater management. As outlined inthe principles of stormwater management, thedesign should allow for non-structural andstructural measures to cope with minor and majorstorms. The non-structural measures are related tooptimising the street layout and the topography toretard stormwater flow and curb the possibleassociated damage. Structural measures includenot only the provision of culverts, pipes orchannels, but also the street itself. With minorstorms, structural measures should ensure thatwater is shed from the street into side drainagechannels, and with major storms, these measuresshould limit the period of impassability while thestreet functions as a drainage channel itself. In thelatter case the street should be paved.In addition to paving basic access streets forreasons of drainage, erosion control and wetweatheraccessibility, other factors such as dust andsocial issues may play a role.Included in the social issues are politics, adjacentschools and hospitals, and the use of the streets aspublic areas.Unpaved basic access streets therefore require sidedrainage channels that are lower than the streetlevel to ensure that water is drained off the streetinto the side channel. These side channels shouldbe carried through the main street at intersections.A maximum cross-fall of 5% is suggested for thestreet. For paved streets this cross-fall can bereduced to 3%. In Figure 8.5 typical cross-sectionsof basic access streets are illustrated. For basicaccess streets, excess water can be handled in sidechannels or even on the street itself, acting as achannel-and-street combination, and be led toopen areas (e.g. sports fields, parks) for dissipation.For an unpaved network, channels - as shown inFigure 8.6 - and not pipes are required. Pipes can beconsidered only where all the basic access streetsare surfaced owing to the problem of silting, orwhere the gradient of the pipe and design of inletsand outlets are such that silting and blocking willnot occur (NITRR, 1984a).Channels should be designed to prevent silting orponding of stagnant water, yet avoid excessiveerosion. Ponding is of particular importance as itcan result in water soaking into the structurallayers of the pavement. The draft TRH17 (NITRR,1984b) gives guidelines on the design of openchannels to prevent silting.The longitudinal gradient of a channel and thematerial used determine the amount of scouring orerosion of such channels. Table 8.13 provides thescour velocities for various materials and guidance onthe need to line or pave channels. Linings of handpackedstone can be as functional as concrete linings.As a rough guide it is suggested that an unpavedchannel should not be steeper than 2% (1:50).Accesses to dwelling units should provide a smoothentry, whilst preventing stormwater in the street orchannel from running onto properties. Where sidedrainage is provided to streets, special attentionshould be paid to the design of access ramps, or theelimination of the need for ramps to safeguard thefunctioning of the drainage channels.Kerbing is not used extensively on basic accessstreets if they are surfaced, but edging may be usedas an alternative when the shoulder or sidewalkmaterial is of inadequate stability. However, itshould be stressed that the shoulder of a surfacedbasic access street should be constructed with24Chapter 8Roads: Materials and construction
GUIDELINES FOR <strong>HUMAN</strong> <strong>SETTLEMENT</strong> <strong>PLANNING</strong> <strong>AND</strong> DESIGNVerge RoadwayVerge Verge RoadwayVergeChannelStructural layersand surfacingON ROAD : CHANNEL UNLINEDChannel (labouror equipment)Structural layersand surfacingON ROAD : CHANNEL LINEDVerge Roadway Verge Verge RoadwayVergeStructural layersand surfacingCross-fallGround slopeChannel (equipmentbasedprofile)OFF ROAD : CHANNEL UNLINEDGround slopeStructural layersand surfacingOFF ROAD : CHANNEL LINEDChannel (labourbasedprofile)Figure 8.5: Typical basic access street cross-sectionsmaterial of at least the same quality as the subbase(Netterberg and Paige-Green 1988).The shoulder should preferably be protected with abituminous surfacing. The cost of this can be highhowever, and the decision will have to be based onaffordability.Erosion control for tertiary waysErosion control is considered to be the maincriterion in the design of tertiary ways. Stormwatermust be accommodated by ditches and drains onthe sides of the tertiary ways. In Figure 8.6 typicaldetail is given of such ditches. Detail is also given ofstilling ponds, catchwater drains and check dams.These should be seen as typical examplesillustrating the principles involved. Check dams areused on downhill tertiary ways to dissipate theenergy of the stormwater and to form naturalsteps.Table 8.13:MATERIALScour velocities for variousmaterialsALLOWABLE VELOCITY(m/s)Fine sand 0,6Loam 0,9Clay 1,2Gravel 1,5Soft shale 1,8Hard shale 2,4Hard rock 4,5When low points are reached, drifts and disheddrains can be used to give preference to the flow ofwater without major structural requirements.Erosion protection on the approaches must beprovided for. Details of typical drifts and dish drainsare shown in Figures 8.7 and 8.8.Tertiary ways would normally be constructed fromthe in situ material. The use of vegetation toprevent erosion is highly recommended and can beachieved by various means. Grass-blocks are butone example where vegetation is used to preventerosion (Figure 8.9). These should, however, beregularly maintained to avoid a build-up of grassand silt.Subsurface drainageSubsurface drainage design is a specialised subject andboth the infiltration of surface water and the control ofsubsurface water have to be considered. The basicphilosophy is to provide effective drainage to (at least)material depth so that the pavement structure does notbecome excessively wet.Subsurface drainage problems can be reduced mosteffectively by raising the road above natural groundlevel. This cannot always be done in the urbansituation and the provision of side drains adjacent tothe road, to a depth as low as possible beneath theroad surface is equally effective.If neither of these two options is practical, and groundwater or seepage flows prevail, some form of cut-offtrench with an interceptor drain may be necessary.These are expensive and other options (such as apermeable layer beneath the subbase) could also beconsidered.Roads: Materials and construction Chapter 825
GUIDELINES FOR <strong>HUMAN</strong> <strong>SETTLEMENT</strong> <strong>PLANNING</strong> <strong>AND</strong> DESIGNFig. 8.6Normally 4,0m. May beincreased to provide fieldor village accessEdge of carriageway20m c/cEdge of carriagewaySlopeC L Flat (< 1 in 50)SlopeC LSpacing 50m c/c of mitresDitchNormally 4,0m. May beDitchincreased to provide fieldSteep (> 1 in 10)4 m radius0,6mor village access10m c/cMild (1 in 20 - 1 in 50)Ideally this area toEdge of carriageway20m c/cEdge of carriagewaybe left unexcavated.SlopeFlat (< 1 in 50)SlopeSometimes a natural50m c/cbarrier such as tree DitchDitchor an ant hill can beOutlet SECTION A-Aused to deflect 4 m flow radius0,6mLength of mitre:Ideally this area to 10m gentle slope; 5m steep slopebe left unexcavated.Outlet length of mitreIN SLOPING GROUNDIN FLAT GROUNDSometimes a naturalnormally 10m but in verybarrier such as treeflat areas a pit may beor an ant hill can beOutlet SECTION A-Anecessary to effect outfallused to deflect flowMITRE DRAIN (OR TURN OUT)A AA AIN SLOPING GROUNDCatchwater drain toculvert or other outletC LLength of mitre:10m gentle slope; 5m steep slopeExisting ground slopeCatchwater drain toculvert or other outletNormally not less than 5,0mSpacing of mitresDepthvaries2m radiusOutlet length of mitreIN 0,15m FLAT GROUND 0,50m 0,75mnormally 10m but in veryflat areas a pit may benecessary to effect outfallMITRE DRAIN (OR TURN OUT)Existing ground slopeSteep (> 1 in 10)10m c/cMild (1 in 20 - 1 in 50)DepthvariesBerm(if required)2m radiusA0,25mnormallyL CA2m radiusA2m radius0,15m 0,50m 0,75mLINED DITCH0,25mnormallyACemented masonry0,15 m thick110,5m0,5m1Spoil on lowerhill sideNormally 1 not less than 5,0mBerm(if required)DitchLINED DITCHCarriagewayCemented m0,15 m thickDETAIL OFCATCHWATER 1 DRAIN1 0,5m0,5m1Spoil on lowerhill side1CATCHWATER DRAINDitch0,05mBCarriagewayCheck damDETAIL OFCATCHWATER DRAINAACATCHWATER DRAINSlope of ditchBDepth of ditch dBHeight of check dam 0,5 to 0,7 dCheck damThis distance such that gradient (A)Ais about 1:70 to 1:100LONG SECTION OF DITCHACoarse sand or fine gravelSlope of ditchB filter on upstream Depth side of ditch dHeight Interstices of check filleddam 0,5 to 0,7 dThis distance such that gradient (A)with sand/gravel0,25m 0,25m0,1m 0,1m 0,1m 0,2mis about 1:70 to 1:100LONG SECTION OF DITCH0,50mCheck damprofileCoarse sand or fine gravelfilter on upstream sided/2Interstices filled0,25m 0,25mwith sand/gravel0,1m 0,1m 0,1m 0,2mHand-placed stoneBrushwoodup to 200/300 mmin fill0,50m0,05mSECTION B-Bd/2Note: Check dams to be usedwhere soil is erodibleSECTION B-BCheck damprofileSTONE CHECK DAMCHECK DAMSSTONE CHECK DAMHand-placed stoneup to 200/300 mmBRUSHWOOD CHECK DAMBrushwoodin fillBRUSHWOOD CHECK DAMWooden stakesat 100 mm c/cWoodeat 100Figure 8.6: Tertiary ways: ditches and drains26Chapter 8Roads: Materials and construction
GUIDELINES FOR <strong>HUMAN</strong> <strong>SETTLEMENT</strong> <strong>PLANNING</strong> <strong>AND</strong> DESIGNNormal roadlevel300 mm square x 250 mm highwhite painted masonrymarker posts1 in 10C LDish = 0,1mdeepMarker posts to bemaximum 5,0m centres1 in 100,25m1,0m200 mm 1:2:4 concreteto have rough finishtransverse to road CLapplied by brush orby tamping boardToe wall0,5mSECTION A-A300 mm gravel0,5mMasonryend wallDitch entryWidth L 2 as directed butto be at least bed widthBstream flowDitch entryANormal width of road = 5,00 mThreshold width = 3,9 m4,5m3,5mL 1 (varies)L 2 (varies - min. 4,0 m)L 1Absolute min. 2,9mMasonryfoundationwalls : toe,heel & endAC LTaper over 1,5mDitch entryApron of large pitched stonesor, if necessary, gabionsBPeg distance paintedon marker postDitch entryPLANNotes on slab constructionAternative 1 (as illustrated insections A-A & B-B)300 mm compacted gravel overlainwith 200 mm 1:2:4 concrete200 mm 1:2:4concrete3,5 m2%300 mm gravelApronAlternative 2 (as illustrated below)To be used with the objective ofsaving cement.300 mm compacted gravel overlainwith cement-pitched masonryMasonrytoe wall1,0mmFill to be wellcompactedMortar to be 1 partcement to 6 partssand0,5m 2,5m0,5m1,5mMasonryheel wall300mm 200mmCement mortar brushed in450 mm nominal size stonelaid on wet concreteCompacted gravelSECTION B-BBed : 500 mm 1:3:6concreteCompacted fillCONSTRUCTION ALTERNATIVE 2Figure 8.7: Tertiary ways: driftRoads: Materials and construction Chapter 827
GUIDELINES FOR <strong>HUMAN</strong> <strong>SETTLEMENT</strong> <strong>PLANNING</strong> <strong>AND</strong> DESIGNFig. 8.8DitchslopeAny surplus stoneto be used as apronXFlowXLevel at X to be the sameas bottom of ditchArea shaped 1,5%to suitCarriagewayA10%(on C L )10%(on C L )ALCSlopeditchPLANTo outfallDish drain may needextending to effectsuitable outfall0,150,05Surface tobe smoothDETAIL3,0m 2,0m 3,0m10 % on C LSECTION A-A0,2mDishedDISH DRAIN TYPE 1L10% on CCut off wall maybe required atinlet depth 0,5 mCONSTRUCTIONBed: 50 mm 1:3:6 concreteStone: 150 mm nominal size well beddedin concreteSurface: cement mortar brushed inWHERE TO USE DISH DRAIN TYPE 1Gently sloping ground. Very lowflows anticipatedDry pitched masonryapron as requiredXFlowCCut off wallXDry pitchedmasonry0,50mCement pitmasonryB1,5%CBCut offwallSECTION C-C0,30mArea shapedto suitPLAN10%OutfallDished10%Dish drain to beextended as required3,0m 3,0m 3,0m 3,0m 3,0mNormal road levelCONSTRUCTIONAs for dish drain type 1WHERE TO USE DISH DRAITYPE 2Where anticipated flows arelight to moderate but wherethe use of a culvert isunnecessary or impracticalCement pitchedmasonryCut off wallFigure 8.8: Tertiary ways: dish drains28Chapter 8Roads: Materials and construction
GUIDELINES FOR <strong>HUMAN</strong> <strong>SETTLEMENT</strong> <strong>PLANNING</strong> <strong>AND</strong> DESIGNOriginal groundcut to sectionshownPlant grass andshrubs hereShrub plantingRootsystemWayStepped embankment(note vertical walls)Drainage channelRootsystemSlope into drainSECTIONAL DETAIL500 x 500Six holes forsoil and grassGrassAAReinforcementRibs reinforcedwith wireRootsSECTION A-APLANMay be fitted tointerlock withadjacent unitsFigure 8.9: Typical grass block and vegetationSubsurface water problems are frequentlyencountered where water provision in urban areas isby way of standpipes adjacent to roads. Apart fromthe surface runoff, significant seepage into the groundoccurs and this frequently passes directly beneath theadjacent road. Careful drainage in the areassurrounding standpipes is thus essential.As discussed earlier, subsurface drainage is aspecialised field requiring a good knowledge of waterflow regimes, drainage paths and filter criteria, andspecialist assistance should be obtained.CompactionThe design procedures assume that the specifiedmaterial properties are satisfied in the field. A numberof the traditional material properties (e.g. grading,plasticity) are independent of the construction process,but the strength is strongly dependent on thecompaction achieved in the field. The design strengthis based on the laboratory-determined strength of thematerial at a specified density. In order to ensure thatthis strength is obtained in the field, that particulardensity must be achieved during the field compaction.Table 8.14 gives the minimum compaction standardsrequired for the various layers of the pavementstructure. Note that, below base level, the standardsare independent of the type of material used. As mostRoads: Materials and construction Chapter 829
GUIDELINES FOR <strong>HUMAN</strong> <strong>SETTLEMENT</strong> <strong>PLANNING</strong> <strong>AND</strong> DESIGNTable 8.14: Compaction requirements for the construction of pavement layers (andreinstatement of pavement layers)PAVEMENT LAYERCOMPACTED DENSITYSurfacing Asphalt 95% 75-blow MarshallBase (upper and lower) Crushed stone G1 86% to 88% apparent densityG2 100% to 102% mod AASHTOCrushed stone G3and gravel G4AsphaltCemented98% mod AASHTO95% 75-blow Marshall92% theoretical max97% mod AASHTOSubbase (upper and lower)Selected subgradeSubgrade(within 200 mm of selected subgrade)(within material depth)Fill (cohesionless sand)95% mod AASHTO93% mod AASHTO90% mod AASHTO85% mod AASHTO90% mod AASHTO(100% mod AASHTO)materials below base level will have a potential densitysomewhat in excess of the specified density which isrelatively easily achieved if compaction is carried out atthe correct moisture content, an attempt should bemade to get as close to 100% Mod AASHTO density aspossible. This has significant benefits in terms of anincreased shear strength, a reduced potential to rut,and lower moisture susceptibility. Standard practiceshould be to roll the layer to refusal density based onproof rolling of a short section prior to its fullcompaction. Hand-held rollers may be inadequate toachieve the required density.Subgrade below material depthSpecial subgrade problems requiring specialisttreatment may be encountered. The design procedureassumes that these have been taken into accountseparately. The main problems that have to beconsidered are the following:• the extreme changes in volume that occur in somesoils as a result of moisture changes (e.g. inexpansive soils and soils with collapsible structures);• other water-sensitive soils (dispersive or erodiblesoils);• flaws in structural support (e.g. sinkholes, miningsubsidence and slope instability;• the non-uniform support that results from widevariations in soil types or states;• the presence of soluble salts which, underfavourable conditions, may migrate upwards andcause cracking, blistering or loss of bond of thesurfacing, disintegration of cemented bases andloss of density of untreated bases; and• the excessive deflection and rebound of highlyresilient soils during and after the passage of a load(e.g. in ash, micaceous and diatomaceous soils).The techniques available for terrain evaluation andsoil mapping are given in TRH2 Geotechnical and soilengineering mapping for roads and the storage ofmaterials data (NITRR 1978). Specialist advice shouldbe obtained where necessary for specific problemareas. The design of embankments should be done inaccordance with TRH10 Site investigation and thedesign of road embankments (NITRR 1984d).Street levelsThe fact that the provision of vehicular accessadjoining streets, dwellings and commercialestablishments is the primary function of an urbanstreet means that street levels become a rather moreimportant factor in urban areas than they are in ruralor inter-urban street design. Urban street levels placesome restrictions on rehabilitation and create specialmoisture/drainage conditions.30Chapter 8Roads: Materials and construction
GUIDELINES FOR <strong>HUMAN</strong> <strong>SETTLEMENT</strong> <strong>PLANNING</strong> <strong>AND</strong> DESIGNIn some cases, rehabilitation in the form of an overlaymay cause a problem, particularly with respect to thelevel of kerbs and channels, camber and overheadclearances. In these cases strong consideration shouldbe given to bottom-heavy designs (i.e. designs with acemented subbase and possibly a cemented base),which would mainly require the same maintenance asthin surfacings and little structural maintenanceduring the analysis period.Urban streets are frequently used as drainage channelsfor surface-water runoff. This is in sharp contrast withurban, inter-urban and rural roads which are usuallyraised to shed the water to side table drains somedistance from the road shoulder.Service trenchesTrenches excavated in the pavement to provideessential services (electricity, water, telephone, etc) arefrequently a source of weakness. This is a result ofeither inadequate compaction during reinstatement,or saturation of the backfill material.Compaction must achieve at least the minimumdensities specified in the catalogue of designs andmaterial standards (Table 8.14). These densities arereadily achieved when granular materials are used, butit becomes much more difficult when natural materialsare used, particularly in the case of excavated clays.When dealing with clay subgrades it is recommendedthat, if it is economically feasible, a moderate-qualitygranular material be used as a trench backfill inpreference to the excavated clay. In streets of CategoryUB and higher it is preferable to stabilise all thebackfill material and in lower categories the provisionof a stabilised “cap” over the backfill may beconsidered to eliminate settlement as far as possible.Care must be taken not to over-stabilise (i.e. produce aconcrete) as this results in significant problems withadhesion of the surfacing and differential deflectionscausing failure around the particles.Service trenches can also be the focal points ofdrainage problems. Settlement in the trench, givingrise to standing water and possibly to cracking of thesurface, will permit the ingress of moisture into thepavement. Fractured water, sewerage or stormwaterpipes lead to saturation in the subgrade and possiblyin the pavement layers as well.Alternatively, a trench backfilled with granularmaterial may even act as a subsurface drain, but thenprovision for discharge must be made. It is, however,generally recommended that the permeability of thebackfill material should be as close as possible to thatof the existing layers in order to retain a uniformmoisture flow regime within the pavement structure.Pavement cross-sectionGenerally, it is preferable to keep the design of thewhole carriageway the same, with no change in layerthickness across the street. However, where there aresignificant differences in the traffic carried byindividual lanes (e.g. in climbing lanes), the pavementstructure may be varied over the cross-section of thecarriageway, provided that this is economical andpractical. Under these circumstances, the actual trafficpredicted for each lane should be used in determiningthe design traffic.The cross-section can be varied with steps in the layerthickness, or wedge-shaped layers. Under nocircumstances should the steps be located in such away that the water can be trapped in them. Typicalelements of the pavement cross-section for a pavedurban street are shown in Figure 8.10.CutKerbSurfacingKerbSubsurfacedrainBaseSubbase (upper and lower)Selected layers (upper and lower)Subgrade(Cut)Subgrade(Fill)StructuralpavementlayersSubgrade(Defined by material depths)Note: The purpose of this diagram is to illustrate all thedifferent aspects of pavement structure terminology.It is not necessarily a reflection of normal practice.Figure 8.10: Illustrative pavement cross-sectionRoads: Materials and construction Chapter 831
GUIDELINES FOR <strong>HUMAN</strong> <strong>SETTLEMENT</strong> <strong>PLANNING</strong> <strong>AND</strong> DESIGNConsiderations for concrete pavementsDetails on the design of concrete pavements arebeyond the scope of this document. However, somebasic practical recommendations are offered below(SA Department of Transport 1977):• The subgrade should be prepared to provide auniform support.• The subbase should be stabilised to a high qualityto provide a non-pumping, erosion-resistant,homogeneous pavement support.• When jointed concrete pavements are used,attention should be given to joint details such asspacing, type and sealing.Kerbs and channelsKerbs and channels are important to prevent edgeerosion and to confine stormwater to the streetsurface.Consideration should be given to the type and methodof construction of kerbs when deciding on a layerthicknes for the base.It is common practice to construct kerbs upon the(upper) subbase layer to provide edge restraint for agranular base. This restraint will help to provide thespecified density and strength. Care must be taken toensure that this type of structure does not “box”moisture into the base course material.In the case of kerbing with a fixed size (i.e. precastkerbing or kerbing with fixed shutters cast in situ) itmay be advantageous to design the base thickness toconform with the kerb size (e.g. if the design calls fora 30 mm AG with a 125 mm G4 underlay, and thegutter face is 160mm, rather use a 130 mm G4).EdgingInstead of kerbs, edging could be used for low-trafficstreets when the shoulder or sidewalk material is ofadequate stability. This material should be shaped tothe correct level and the edge may be sealed with aprime coat, a sand seal, a slurry seal or a premix. Adegree of saving may be possible by utilising trimmedgrass verges where longitudinal gradients are low andstormwater flows are not likely to be high.AccessibilityAccess to dwelling units should be provided for in sucha way that adequate sight distances and a smoothentry are provided, but the access ways should at thesame time keep stormwater on the street fromrunning into adjacent properties.At pedestrian crossings special sloped openings in thekerbs should be provided to accommodate thehandicapped and hand-pushed carts.COST ANALYSISGeneralAlternative pavement designs should be compared onthe basis of cost. The cost analysis should be regardedas an aid to decision-making. However, a cost analysismay not take all the necessary factors into account andit should therefore not override all otherconsiderations. The main economic factors thatdetermine the cost of a facility are the analysis period,the structural design period, the construction cost, themaintenance cost, the salvage value at the end of theanalysis period and the real discount rate.A complete cost analysis should be done for CategoryUA and UB streets. For Category UC and UD streets, acomparison of the construction and maintenance costswill normally suffice.The method of cost analysis put forward in thisdocument should be used only to compare pavementstructures in the same street category. This is becausestreets in different street categories are constructed todifferent standards and are expected to performdifferently, with different terminal levels of service.The effect these differences have on street user costs isnot taken into account directly.The choice of analysis period and structural designperiod will influence the cost of a street. The finaldecision will not necessarily be based purely oneconomics, but will depend on the design strategy.The construction cost should be estimated fromcurrent contract rates for similar projects.Maintenance costs should include the cost ofmaintaining adequate surfacing integrity (e.g.through resealing) and the cost of structuralmaintenance (e.g. the cost of an asphalt overlay). Thesalvage value of the pavement at the end of theanalysis period can contribute to the next pavement.However, geometric factors such as minorimprovements to the vertical and horizontalalignment and the possible relocation of drainagefacilities make the estimation of the salvage value verydifficult.Present worthThe total cost of a project over its life is theconstruction cost plus maintenance costs, minus thesalvage value. The total cost can be expressed in anumber of different ways but, for the purpose of thisdocument, the present worth of costs (PWOC)approach has been adopted.32Chapter 8Roads: Materials and construction
GUIDELINES FOR <strong>HUMAN</strong> <strong>SETTLEMENT</strong> <strong>PLANNING</strong> <strong>AND</strong> DESIGNThe present worth of costs can be calculated asfollows:PWOC = C + M 1 (1 + r) -x j + ...M j (1 + r)-x jwherePWOC = present worth of costC = present cost of initial construction+ ... -S(1 + r)-z(8.10)M j = cost of the j th maintenance measureexpressed in terms of current costsr = real discount ratex j = number of years from the present to the j thmaintenance measure, within the analysisperiodz = analysis periodS = salvage value of pavement at the end of theanalysis period, expressed in terms of thepresent value.Construction costsThe checklist of unit costs should be used to calculatethe equivalent construction cost per square metre.Factors to be considered include the availability ofnatural or local commercial materials, their expectedcost trends, the conservation of aggregates in certainareas, and practical aspects such as speed ofconstruction and the need to foster the developmentof alternative pavement technologies. The potentialfor labour-based construction also needs to beconsidered.The cost of excavation should be included as certainpavement types will involve more excavation thanothers.Maintenance costsThere is a relation between the type of pavement andthe maintenance that might be required in the future.When different pavement types are compared on thebasis of cost, these future maintenance costs should beincluded in the analysis to ensure that a soundcomparison is made. It should also be noted thatrelaxations of material, drainage or pavementthickness standards will normally result in increasedmaintenance costs.Figures 8.2 and 8.3 show that the life of the surfacingand water ingress into the pavement play animportant part in the behaviour of some pavements.For this reason, planned maintenance of the surfacingis very important to ensure that these pavementsperform satisfactorily. The service life of each type ofsurfacing will depend on the traffic and the type ofbase used. Table 8.15 gives guidelines regarding theservice life that can be expected from various surfacingtypes. These values may be used for a more detailedanalysis of future maintenance costs.Typical maintenance measures that can be used for thepurpose of cost analysis are given in Table 8.16. Itshould be noted that, since the costs are discounted tothe present worth, the precise selection of themaintenance measure is not very important. Somemaintenance measures are used more commonly onspecific pavement types and this is reflected in Table8.16. There are two types of maintenance:• measures to improve the condition of thesurfacing; and• structural maintenance measures applied at theend of the structural design period.The structural design period (SDP) has been defined asthe period for which it is predicted with a high degreeof confidence that no structural maintenance will berequired. Therefore, typical structural maintenancewill generally only be necessary at a later stage. Ifstructural maintenance is done soon after the end ofthe structural design period, the distress encounteredwill only be moderate. When structural maintenance isdone much later, the distress will generally be moresevere. Figure 8.11 indicates the degree of distress tobe expected at the time of rehabilitation for differentstructural design periods. Table 8.16 makes provisionfor both moderate and severe distress.The typical maintenance measures given in Table 8.16should be replaced by more accurate values, if specificknowledge about typical local conditions is available.Street-user delay costs should also be considered,although no proper guide for their determination isreadily available. The factors that determine overallstreet user costs are:• running costs (fuel, tyres, vehicle maintenance anddepreciation), which are largely related to thestreet alignment, but also to the riding quality(PSI);• accident costs, which are related to streetalignment, skid resistance and riding quality; and• delay costs, which are related to the maintenancemeasures applied and the traffic situation on thestreets. This is a difficult factor to assess as it mayinclude aspects such as the provision of detours.Roads: Materials and construction Chapter 833
GUIDELINES FOR <strong>HUMAN</strong> <strong>SETTLEMENT</strong> <strong>PLANNING</strong> <strong>AND</strong> DESIGNTable 8.15: Suggested typical ranges of period of service (without rejuvenators) ofvarious surfacing types in the different street categories and base types (ifused as specified in the catalogue)BASE TYPESURFACING TYPE(≤ 50 mm THICKNESS)TYPICAL RANGE OF SURFACING LIFE (YEARS)ROAD CATEGORYA B C, D(ES3-ES100) (ES1-ES10) (ES0,003-ES3)GranularBitumen sand or slurry seal - - 2 - 8Bitumen single surface treatment 6 - 8 6 - 10 8 - 11Bitumen double surface treatment 6 - 10 6 - 12 8 - 13Cape seal 8 - 10 10 - 12 8 - 18Continuously-graded asphalt 8 - 11Gap-graded asphalt premix 8 - 13BituminousBitumen sand or slurry seal - - 2 - 8Bitumen single surface treatment 6 - 8 6 - 10 8 - 11Bitumen double surface treatment 6 - 10 6 - 12 8 - 13Cape seal - 8 - 15 8 - 18Continuously-graded asphalt 8 - 12 8 - 12 -Gap-graded asphalt premix 8 - 14 10 - 15 -Porous (drainage) asphalt premix 8 - 12 10 - 15 -CementedBitumen sand or slurry seal ** - -Bitumen single surface treatment ** 4 - 7 5 - 8Bitumen double surface treatment ** 5 - 8 5 - 9Cape seal ** 5 - 10 5 - 11Continuously-graded asphalt ** 5 - 10 -Gap-graded asphalt premix ** 6 - 12 -- Surface type not normally used.** Base type not used.Real discount rateWhen a “present-worth” analysis is done, a realdiscount rate must be selected to express futureexpenditure in terms of present-day values. Thisdiscount rate should correspond to the rate generallyused in the public sector. Unless the client clearlyindicates that he prefers some other rate, 8% isrecommended for general use. A sensitivity analysisusing rates of say 6,8 and 10% could be carried out todetermine the importance of the value of the discountrate.Salvage valueThe salvage value of the pavement at the end of theperiod under consideration is difficult to assess. If thestreet is to remain in the same location, the existingpavement layers may have a salvage value but, if thestreet is to be abandoned at the end of the period, thesalvage value could be small or zero. The assessment ofthe salvage value can be approached in a number ofways, depending on the method employed torehabilitate or reconstruct the pavement.• Where the existing pavement is left in position andan overlay is constructed, the salvage value of thepavement would be the difference between thecost of constructing an overlay and the cost ofconstructing a new pavement to a standard equalto that of the existing pavement with the overlay.This is termed the “residual structural value”.• Where the material in the existing pavement istaken up and recycled for use in the construction ofa new pavement, the salvage value of the recycledlayers would be the difference between the cost offurnishing new materials and the cost of taking upand recycling the old materials. This salvage valueis termed the “recycling value”.• In some cases the procedure followed could be acombination of (a) and (b) above and the salvagevalue would have to be calculated accordingly.34Chapter 8Roads: Materials and construction
GUIDELINES FOR <strong>HUMAN</strong> <strong>SETTLEMENT</strong> <strong>PLANNING</strong> <strong>AND</strong> DESIGNTable 8.16: Typical future maintenance for cost analysisTYPICAL MAINTENANCE MEASURES*BASE TYPEGranularBituminousConcreteCementedPavingblocksCast-in-situblocksMEASURES TO IMPROVE THE SURFACINGCONDITION**STRUCTURAL MAINTENANCESURFACETREATMENT ON ASPHALT PREMIX MODERATE DISTRESS SEVERE DISTRESSORIGINAL SURFACINGS1 (10 - 15 yrs) S1 (12 - 20 yrs) 30 - 40 AG, AC >100 BS, BCS1 (18 - 27 yrs) S1 (21 - 30 yrs) ororGranular overlayAG (13 - 22 yrs)orAG (24 - 33 yrs)Recycling of baseS1 (13 - 17 yrs) 30 - 40 AG, AC >100 BS, BCS1 (22 - 28 yrs)ororRecycling of baseAG (13 - 17 yrs)AG (26 - 34 yrs)Joints repair, Further joint and Concrete granularsurface texturing surface repairs or(15 yrs, 30 yrs) Bituminous overlay(equivalent costorof 20 mm PCC)RecyclingS1 (8 - 13 yrs) S1 (8 - 13 yrs) Further surface Thick granularS1 (16 - 24 yrs) S1 (16 - 24 yrs) treatments overlayS1 (23 - 30 yrs) S1 (23 - 30 yrs) orRecycling of baseNo maintenance Re-levelling of Rebuild base,measures blocks bedding sand andblocksNo maintenance Remove and Rebuild underlyingmeasures replace blocks layer and place castwithcast-in-situ blocks in-situ blocks* S1 (10 yrs) represents a single surface treatment at 10 years and 40 AG (20 yrs) represents a 40 mm thick bitumensurfacing at 20 years.** Refer to Table 8.15 for typical lifetimes of different surfacing types.The salvage values of individual layers of thepavement may differ considerably, from estimates ashigh as 75% to possibly as low as 10%. The residualsalvage value of gravel and asphalt layers is generallyhigh, whereas that of concrete pavements can be highor low, depending on the condition of the pavementand the method of rehabilitation. The salvage value ofthe whole pavement would be the sum of the salvagevalues of the individual layers. In the absence of betterinformation, a salvage value of 30% of initialconstruction cost is recommended.Optimisation of life-cycle costsIn Table 8.2 a description of the street and its drainageis given, with their LOS values. In the matrix thecombined LOS value is given. The final LOS value isdetermined mostly by the LOS of the drainage.The main purpose of the determination of arepresentative LOS for a street is to illustrate theassociated life-cycle costs. This identification canenable authorities and decision makers to select adesign which will be affordable and upgradable. Thecosts associated with a typical street are made up ofdesign and construction costs, maintenance costs andstreet-user costs. Construction costs are high for highLOS values and low for low LOS values. MaintenanceRoads: Materials and construction Chapter 835
GUIDELINES FOR <strong>HUMAN</strong> <strong>SETTLEMENT</strong> <strong>PLANNING</strong> <strong>AND</strong> DESIGNcosts, on the contrary, are low for high LOS values andhigh for low LOS values.This concept is illustrated in Figure 8.12 with typical,present worth-of-cost versus LOS values. The combinedcost curve has a typical minimum value between thehighest and lowest LOS values. Street-user costs arelow for high LOS streets and high for low LOS streets.403530DISCUSSION ON THE DESIGNPROCEDURES FOR DIFFERENT STREETTYPESAt this stage the designer should have gatheredenough information on the street(s) to be designed, tobe able to decide which design procedure to follow -as illustrated in Figure 8.1. If an existing network is tobe upgraded, the information contained in the streetprofiles may be used to determine paving priorities atthis stage. With a background knowledge of the basicconcepts from the previous section, it is now possibleto go into the detailed structural design of the streetpavements.Time of rehabilitation (years)252015105Severe distressModerate distressLimited structural distressPAVED ARTERIAL <strong>AND</strong> ACCESSSTREETSThe design processThe portion of the flow diagram in Figure 8.1 thatrefers to the design of paved arterial and access routesis enlarged upon in Figure 8.13, and divided into 8sections. Each section will be treated separately but allsections have to be considered as a whole before adesign can be produced.Figure 8.11: Degree of structural distress to beexpected at the time of rehabilitation for differentstructural design periodsPresent worth of costs (R x 10 )62,252,001,751,501,251,000,750,500,250 5 10 15 20 25 30Length of structural design period (years)TotalMaintenanceConstruction05 4 3 2 1BestWorstLevel of service (LOS)Figure 8.12: Typical cost versus level of service curvevaluesThe first five sections represent the basic inputs topavement design, namely street category, designstrategy, design traffic, material availability andenvironment. The sixth section explains how, with theseas inputs, the designer can then use an appropriatedesign method to obtain possible pavement structures.Information on certain practical considerations in thedesign of streets follows in the seventh section. In thefinal section the analysis of alternative designs on a lifecyclecost basis, in the light of construction costs andmaintenance costs, is considered.A simplified flow diagram for the structural design ofresidential streets (Category UC and UD only) issuggested in Figure 8.14.Street categoryThe street category will have been identifiedduring the process of compiling the street profile,and will most likely be UA, UB or UC. The section oncharacteristics of streets may be consulted for adiscussion on street categories in general.Design strategySelect an appropriate analysis and structural designperiod for the street under consideration. Thesection on street standards provides guidelines ontypical analysis and design periods and lists otherfactors that need to be considered.36Chapter 8Roads: Materials and construction
GUIDELINES FOR <strong>HUMAN</strong> <strong>SETTLEMENT</strong> <strong>PLANNING</strong> <strong>AND</strong> DESIGNSECTION 1SECTION 2Selectroad categoryUA, UB, UC, ORUDSelectdesign strategyAnalysis periodand structuraldesign periodAlternativestrategiesSECTION 6StructuraldesignPavementbehaviorTerminalconditionPavement typeselectionCatalogueIncludePracticalConsiderations*SECTION 3SECTION 4SECTION 5Estimatedesign trafficTraffic classesEO - E4ConsidermaterialsAvailability ofmaterialsUnit costsUnit costsPast experienceDefineenvironmentTopographyClimatic regionDelineate subgradeareas**SECTION 7SECTION 8DrainageCompactionProblemsubgradesCross-sectionConcretepavementsDo costAnalysisPrevent worthof costsConstructioncostsDiscount rateFuturemaintenanceSalvage value*Design CBR*Refer back to SECTION 2, reiterateFigure 8.13: Structural design flow diagram (mainly for category UA and UB streets)Design bearing capacityCalculate the cumulative equivalent traffic for theparticular street, according to the procedureoutlined in the section on design strategy. Based onthe cumulative equivalent traffic, an appropriatepavement class or design bearing-capacity intervalmay then be selected from Table 8.5.MaterialsMost of the materials for the selected, subbase andbase layers of the pavement structures applicableto arterial and access streets will usually have to beimported. Possible material sources and theavailability and cost of different types of materialshould be established. The availability of materialcombined with the expected behaviour of themajor types of material and pavement, as discussedin the section on materials, will determine the finalselection of the appropriate materials andpavements for particular needs.EnvironmentThe two most important environmental factors toconsider are the climatic region and the design ofthe subgrade on which the street will beconstructed. These are discussed in the section onenvironment.Structural designThe actual structural design has two aspects - theselection of appropriate pavement types and anappropriate design method for the particularstreet.Pavement selectionThe behaviour of different pavement types hasbeen dealt with. Certain types may not be suitablefor some street categories, traffic classes or climaticregions. A number of alternative types should,however, be selected. The most cost-effectivedesign will then be identified in the economicanalysis.Pavement structures with thin, rigid or stiff layersat the top (shallow structures) are generally moresensitive to overloading than deep structures. Ifmany overloaded vehicles can be expected, shallowstructures should be avoided.Roads: Materials and construction Chapter 837
0.0000GUIDELINES FOR <strong>HUMAN</strong> <strong>SETTLEMENT</strong> <strong>PLANNING</strong> <strong>AND</strong> DESIGNSECTION 1SECTION 3SECTION 4Selectroad categoryUA, UB, UC, orUDEstimatedesign trafficConsiderconstructiontrafficConsidermaterialsAvailability ofmaterialsUnit costsPast experienceSECTION 6SECTION 7StructuraldesignPavementbehaviourPavement typeselectionCatalogueIncludepracticalconsiderationsDrainageCompactionProblemsub gradesCross-sectionConcretepavementsSECTION 5DefineenvironmentTopographyClimatic regionDelineate subgradeareasSECTION 8Do costanalysisPresent worthof constructioncostsDesign CBRFigure 8.14: Simplified design flow diagram for residential streets (category UC and UD)Figure 8.3 indicates that the more rigid structuresdeteriorate rapidly once distress sets in, whereasthe more flexible pavements generally deterioratemore slowly. Signs of distress are often more visibleon rigid pavements.Pavement structures consisting of watersusceptiblematerials may be undesirable for wetclimatic regions, unless special provision is made fordrainage.Table 8.17 shows recommended pavement types(base and subbase) for different street categoriesand traffic classes. Reasons why certain pavementtypes are not recommended are also stated briefly.Possible condition at end of structural designperiod:There is no design method available to predict theexact condition of a length of street 10 to 20 yearsin the future. However, certain modes of distresscan be expected in certain pavement types andaccount must be taken of such distress. Table 8.18shows acceptable terminal conditions of rut depthand cracking for the various street categories andpavement types. Figure 8.15 demonstrates that therut depth values in Table 8.18 actually representranges of failure conditions.Although the net depth conditions may beclassified as terminal, there may be instances wherethe rutting has occurred primarily in the subgradeand the structural layers are still integral. In thesecases the rutting may be rectified - using, forexample, a thick slurry - and the street maycontinue to provide an acceptable level of service.Design method selectionThe designer may use a number of designprocedures, such as the mechanistic designmethod, the AASHTO structural number method,the CBR cover curves or the catalogue of designsgiven in Appendix A. A brief overview of a selectednumber of design methods is given in the sectionon structural design methods above. Whatever thestrategy used, traffic, available materials andenvironment must be taken into account. Someestimation of future maintenance measures isnecessary before a comparison can be made on thebasis of present worth of costs. Special constructionconsiderations that might influence either thepavement structure or the pavement costs arediscussed below in the section dealing withpractical considerations.This document includes the application of thecatalogue design method, which is given in detailin Appendix A. However, the best results willprobably be obtained if the catalogue is usedtogether with some other design method. The38Chapter 8Roads: Materials and construction
GUIDELINES FOR <strong>HUMAN</strong> <strong>SETTLEMENT</strong> <strong>PLANNING</strong> <strong>AND</strong> DESIGNTable 8.17: Suggested pavement types for different road categories and traffic classesPAVEMENT TYPE STREET CATEGORY <strong>AND</strong> PAVEMENT CLASS (DESIGN ABBREVIATED REASON WHYBEARING CAPACITY)*THE LISTED PAVEMENTTYPES ARE NOTUA UB UC UD RECOMMENDED FORBASE SUBBASETHE GIVEN STREETES ES ES ES ES ES ES ES ES ESCATEGORY30 10 3 3 1 1 0,3 0,1 0,1 0,03<strong>AND</strong> TRAFFIC LOADINGGranularAsphalthot-mixGranularCementedGranularCementedUncertain behaviourConcreteGranularCementedExtra thickness requiredto prevent fatiguecrackingToo expensive, toodifficult to trenchCementedGranularFatigue cracking,pumping and rockingof blocksCementedShrinkage cracksunacceptableGranularPaving blocksCementedNot recommended athigh speedsBituminouscold-mixMacadamsGranularCementedGranularCementedCast-in-situblocksNot recommended athigh speedsSee Table 8.6 for definition of pavement classes.Roads: Materials and construction Chapter 839
GUIDELINES FOR <strong>HUMAN</strong> <strong>SETTLEMENT</strong> <strong>PLANNING</strong> <strong>AND</strong> DESIGNTable 8.18: Possible condition at end of structural design period for various streetcategories and pavement typesPOSSIBLE CONDITION AT END OFROAD CATEGORYSTRUCTURAL DESIGN PERIOD UA UB UC UDRut depth 20 mm 20 mm 20 mm 20 mmLength of road exceeding stated rutdepth (refer to Figure 8.15) 10 % 15 % 25 % 40 %Type of crackingGranular baseBituminous baseConcrete pavementCemented baseCrocodile cracking, surface loss, pumping of finesCrocodile cracking, pumping of finesSlab cracking, spalling at joints, pumping of finesBlock cracking, rocking blocks, pumping of finesProportion of road on which statedtypes of cracking occur 10% 15% 25% 40%catalogue method can serve as a useful startingpoint, even if other design methods are used.The application of the catalogue design methodGeneral:It should be noted that these designs areconsidered adequate to carry the total designequivalent traffic over the structural design period.Construction constraints on practical layerthicknesses and increments in thicknesses are met.It is assumed that the requirements of the materialstandards are met. The catalogue may not beapplicable when special conditions arise; othermethods should then be used, but the cataloguecan still act as a guide. The catalogue does notnecessarily exclude other possible pavementstructures.between the structures for the various classes oftraffic is a change in the layer thickness. In thesecases the designer may use linear interpolation.However, there is often a change in materialquality, as well as in thickness. Simple interpolationis then inadequate and the designer will have touse other design methods.Surfacings:Urban and residential streets carry both traffic andstormwater runoff. The traffic often consists ofeither large volumes of lightly loaded vehicles (e.g.on CBD streets) or virtually no vehicular traffic (e.g.on residential streets and culs-de-sac). In bothcases, however, a high-quality surfacing is required.Such surfacing is also necessary because the streetacts as a water channel.Selected layers:The catalogue assumes that all subgrades arebrought to equal support standards. The designCBR of the subgrade is limited to four groups(Table 8.12). Normally, the in situ subgrade soil willbe prepared or ripped and recompacted to a depthof 150 mm. On top of this prepared layer, one ortwo selected layers may be added. The requiredselected subgrade layers will vary, according to thedesign CBR of the subgrade. Table 8.19 shows thepreparation of the subgrade and required selectedlayers for the different subgrade design CBRs.Rut depth (mm)302010*Values in Table 8.18Ranges of failureconditionsUAUCUBUDInterpolation between traffic classes:The pavement structures in the catalogue areconsidered adequate to carry the total designtraffic, according to the upper value of the trafficclasses defined in Table 8.5. The total design trafficmay be predicted with more accuracy than isimplied by the traffic classes. In such a case thedesigner may use a simple linear interpolationtechnique. In many designs the only difference0010 20 30 40 50Length of road exceeding stated rut depth (%)Local repairs only*Figure 8.15: Ranges of terminal rut depth conditionsfor different street categories40Chapter 8Roads: Materials and construction
GUIDELINES FOR <strong>HUMAN</strong> <strong>SETTLEMENT</strong> <strong>PLANNING</strong> <strong>AND</strong> DESIGNTable 8.19: Preparation of subgrade and required selected layers for the differentsubgrade design CBRs*DESIGN CBR OF SUBGRADE 25Add selected layers:Upper Not applicable 150 mm G7 150 mm G7 - -Lower 150 mm G9 - - -Treatment of in-situ Special Rip and Rip and Rip and Use subbasesubgrade treatment recompact to recompact to recompact to or base layer**required 150 mm G10 150 mm G9 150 mm G7* Not applicable to category UD roads: for these use only one selected layer (G7) if required.** Compacted to the appropriate density (see Table 8.14).The factors influencing the choice of surfacing are:• local experience;• availability;• street category;• design traffic class;• environment (e.g. moisture, temperature andultraviolet radiation);• pavement type and deflection;• maintenance capability;• turning movements, intersections, brakingmovements; and• gradients.The catalogue specifies the surfacing type, but allowsa choice of surfacings for the lower categories ofstreet. The controlling authority should select asurfacing from the catalogue that will give satisfactoryperformance (SABITA 1993).If a waterbound macadam is used in the base in theplace of a GI to G4 material, the thin surfacings will beinadequate to provide acceptable riding quality on thecoarse surface typically obtained. In such cases, up to50 mm of asphalt premix may be required.Practical considerationsA host of practical issues that need to beconsidered are covered in the section on practicalconsiderations above.Economic analysisThe purpose of the economic analysis is to identifythe most economically viable design. The economicanalysis is strongly linked to the design strategyand the life-cycle cost of the alternative designs. Inthe case of category UC and UD streets, where adesign strategy is not necessarily formulated, onlythe construction cost needs to be considered fordesigns without a design strategy.PAVED BASIC ACCESS STREETSThe functional classification of basic access streets (seestreet categories under “compiling a street profile”above) indicates that traffic volumes are so low that thetraditional design guidelines are not applicable in mostcases. (CUTA 1988b). Non-traffic related factors such aslayout planning, stormwater management and drainage,climate, environment, topography and in- situ materialshave a major influence on the design of basic accessstreets. Adherence to the guidelines for layout planningand stormwater management (CUTA 1988a) is aprerequisite for the sound design of basic access streets.As mentioned in the earlier section on the drainage ofbasic access streets, there may be a number of reasonsfor paving a basic access street. The decision process isillustrated in Figures 8.1 and 8.16.If erosion problems are identified, erosion protectionmust be supplied. Dust palliatives may be consideredas one option in this regard.Structural design of paved basic accessstreetsAlthough basic access streets normally carry lighttraffic, the final desired pavement structure should bedesigned and constructed only after the infrastructuredevelopment is completed to avoid damage byconstruction traffic. The street can be constructed upto subbase level and used in an unpaved state duringinfrastructure development, before correction of thesubbase and application of the base and surfacing.Roads: Materials and construction Chapter 841
GUIDELINES FOR <strong>HUMAN</strong> <strong>SETTLEMENT</strong> <strong>PLANNING</strong> <strong>AND</strong> DESIGNPermanent layer thickness (mm)3002001000SpecialtreatmentrequiredBase levelSubbase levelSubgrade levelBase level1 3 7 10 25 40 60CBR of subgrade(Soaked in wet areas, in situ in dry or moderate areas)Figure 8.16: Pavement design curves for basic access streetsSelection of pavement typeBecause of the very low bearing capacities forwhich basic access streets are designed, thepavement structures of these streets will be verylight. Coal and refuse-removal lorries, howeverfew, are bound to be overloaded with destructiveeffects on surfacings and the pavement structure.This should be recognised in the design phase andpavement types sensitive to overloading should notbe selected.Selection of design methodThe dynamic cone penetrometer (DCP) designmethod, the catalogue in Appendix A, or thedesign method described below could be used forthe structural design of paved basic access streets.Pavement structures are bound to be mostlygranular on basic access streets and therefore theuse of the DCP model (Kleyn and van Zyl 1987) isstrongly recommended. The minimum number ofblows to penetrate 800 mm of the pavementstructure is 110 in a dry condition and 60 in a wetcondition (Kleyn 1982). Streets with even fewerpavement structural layers than the traditionalthree have been found to perform satisfactorily asbasic access streets (Horak 1988), but designsshould be checked with the DCP model.Figure 8.16 can also be used as a guideline for thedesign of the pavement structure. It is suggestedthat a soaked CBR be used only in wet areas whilein-situ CBR values from DCP soundings can be usedin moderate to dry areas (Emery 1984). The qualityof in-situ material will determine the need for asubbase layer. Where an asphalt surfacing of 25mmis used, the base thickness may be reduced by thesurfacing thickness, provided that the deflectionsdo not increase to the level that rapid fatiguefailure of the asphalt occurs.The implications and problems with relaxingmaterial specifications for paved streets have beenfully discussed by Netterberg and Paige-Green(1988). Each layer in the street should be treated asa separate entity with respect to the materials usedand the construction procedures.Selected layers:If the in-situ material is not of at least G9 quality(NITRR 1984c) material of this quality or bettershould be imported and placed on the compactedin-situ material. If the in-situ material is of G9 orbetter quality, no selected layer is necessary. Thesubgrade or selected layers should be compacted toat least 93% Mod AASHTO density, but preferablyto refusal density.A summary of the recommended quality of theplatform for the subbase is therefore as follows:• min CBR at OMCand 90% ModAASHTO compaction: 7;• min. field compaction: 93% Mod AASHTO.Subbase:Once the foundation of the subbase has a CBR of atleast 7 (i.e. at least G9), material of G6 or betterquality should be used for the subbase. Themoisture content at which the CBR values aredetermined should be near the expected fieldmoisture content (OMC is often considered areasonably conservative estimate).The following specifications are recommended forsubbase material:• minimum CBR atOMC and fieldcompaction: 25;42Chapter 8Roads: Materials and construction
GUIDELINES FOR <strong>HUMAN</strong> <strong>SETTLEMENT</strong> <strong>PLANNING</strong> <strong>AND</strong> DESIGN• min compaction: 95% Mod AASHTO,preferably refusal;• max size: two-thirds of layerthickness.Specifying the material strength makes itunnecessary to limit properties such as grading (ofthe matrix in particular) and plasticity, as it is theseproperties which determine the strength at anyspecific moisture content and density.It is important to carry out the CBR test in astandard manner and the recommended method isthat all oversize material (larger than 19,0mm) isdiscarded. This procedure is considered to result ina slightly conservative CBR as the larger materialwould generally produce more interlock and shearresistance.In many cases where the in-situ material has a CBRof 25 or more, no subbase is necessary and the basecan be applied directly onto the in-situ materialcompacted to at least 95% Mod AASHTO density.Base:The base is the most important structural layer of alightly trafficked street, and must have adequatestrength and durability to perform satisfactorilyduring the life of the street. Structurally, a materialwith a CBR strength of 30 to 50 at field moistureand density is adequate for lightly trafficked streets(Kleyn and Van Zyl 1987). A compaction of 98%Mod AASHTO is necessary to limit traffic-associatedcompaction to an acceptable amount, although itshould preferably be compacted to refusal density.The durability of the material, however, must beascertained for many aggregates - especially basicigneous rocks.It is considered necessary to provide differentrequirements for each material group. The bearingcapacity is the major criterion in each case, and thisshould be related to the prevailing environmentalconditions. The bearing capacity of bases for lightlytrafficked streets is best specified in terms of theCBR value at 98% Mod AASHTO compaction at theexpected field moisture conditions. In poorlydrained and wet areas it may be necessary to usethe soaked values, while in arid areas a test at theOMC (Emery 1984) may be used for the design. InSouth Africa the ratio of the equilibrium moisturecontent (EMC) in the base to the optimum moisturecontent (OMC) seldom exceeds 0,6 (Emery 1984).The risk of using an unsoaked CBR in the subgradefor the design can be quantified and expressed asthe probability of the street failing before thedesign traffic has been carried for varying moisturecontents (Emery 1987). The example discussed byEmery (1984) indicates that, even with an EMC/OMCratio of more than 1,5, the probability of the streetnot carrying 0,2 M E80s is less than about 6%.UNPAVED ARTERIAL <strong>AND</strong> ACCESSSTREETSThe most common causes of poor performance ofgravel streets are slipperiness and potholing when wet,and producing excessive dust and ravelling when dry.The formation of corrugations is normally the result ofinadequate compaction or low cohesion combined withtraffic. Frequent maintenance (e.g. grading, wateringand the addition of material) is necessary and thefrequency of maintenance will increase with increasingtraffic.Street categoryNormally, unpaved streets could be considered for useas Category UC or UD streets, although there may bespecial cases where they can be regarded as CategoryUB streets.Design strategyA gravel street may be regarded as a long-term facilityor as an interim step towards a paved street. This willinfluence the level of the surface with regard tostormwater facilities and geometric considerations.MaterialsMaterial will usually have to be imported for at leastthe wearing course of gravel arterial and accessstreets. Possible material sources must be identifiedearly in the design process.Design of imported layersSelected layers for gravel streetsThe selected layers for gravel streets shouldpreferably be designed as for paved arterial andaccess streets, although this is not critical asdiscussed earlier. The minimum subgrade CBR,however, should be 3 for less than 100 vpd and 5for more than 100 vpd, or else 150 mm of“subbase” with a CBR of 5 and 10 respectivelyshould be imported to support the base. It isadvisable, however, that at subgrade level there isno distinction between paved and unpaved streets,to simplify possible later changes from unpaved topaved streets.Design of gravel wearing courseThe standards for gravel wearing courses are laiddown in Appendix B. The quality and thickness ofthe wearing course may also depend on the designapproach, as follows:Roads: Materials and construction Chapter 843
GUIDELINES FOR <strong>HUMAN</strong> <strong>SETTLEMENT</strong> <strong>PLANNING</strong> <strong>AND</strong> DESIGNSoaked laboratory CBR at 95% Mod AASHTO• The gravel street may be regarded as a longtermfacility, in which case the most suitablewearing course will be selected for theprevailing conditions (climate, materialavailability and traffic). On more heavilytrafficked streets, the gravel wearing courseshould be used as a future subbase. On accessstreets it could constitute the future basecourse.• The gravel wearing course may be regarded asan interim riding surface, which will be overlaidor removed when the street is paved. If thegravel wearing course is going to be overlaidlater, the material should comply with thesubbase standards applicable to the futurepavement. If the wearing course is to beremoved later, consideration should be given tothe inclusion of a proper subbase duringconstruction, should such a subbase benecessary.• The gravel wearing course may be regarded asthe base layer of the future paved street. Thiswill normally be possible only for someCategory UC or UD streets, but then specialrestrictions may be placed on the plasticityindex of the fines.The thickness of the gravel wearing course willusually be a standard 150 mm. Passability duringthe wet season is best determined by the soakedlaboratory CBR of the surfacing gravel material.Figure 8.17 gives a proposed limit related to theaverage daily traffic (ADT).504030201010 100 1 000Average daily traffic (ADT)Road is trafficableduring wet seasonRoad becomesimpassable duringwet seasonFigure 8.17: Design curves for the passability ofunpaved roadsWhen a gravel wearing course has to be providedbecause the existing subgrade cannot support thetraffic loads adequately under all climaticconditions, the thickness requirement for thegravel wearing course can be determinedanalytically. A thickness design method which givesthe required material thickness for adequatesubgrade protection, regulated gravel loss anddeficiencies in compaction is described in TRH20.UNPAVED BASIC ACCESS STREETSThe functional classification of basic access streets (seesection on categories of street) indicates that trafficvolumes are so low that the traditional designguidelines are not applicable in most cases. (CUTA1988b). Non-traffic related factors such as layoutplanning, stormwater management and drainage,climate, environment, topography and in situmaterials have a major influence on the design of basicaccess streets. Adherence to the guidelines for layoutplanning and stormwater management (CUTA 1988a)is a prerequisite for the sound design of basic accessstreets.Figures 8.1 and 8.18 illustrate the decision process forthe design of basic access streets. If the decision istaken not to pave a basic access street, attentionshould be paid to erosion protection, the quality of thein-situ material and the quality of the wearing course(if required).Erosion-prone in-situ materials should be identified(Rooseboom and Mulke 1982). The length of erosionfreein situ material can be determined if the gradientand basic material information is available. If erosionproblems are identified, erosion protection must beprovided. Surface stabilisers may be considered in thisregard.As shown in Figure 8.18, in-situ material can be usedwithout a surfacing if it meets the appropriatematerial standards for basic access streets (TRH20).The thickness of a gravel wearing course should be100mm unless experience suggests otherwise. If in-situmaterial meets the specified material requirements ofTRH20, a gravel wearing course need not be importedto the street (Netterberg 1985).TERTIARY WAYSAs settlements develop, so does an infrastructure ofnarrow ways which carry predominantly pedestrians,cattle and bicycles. These non-trafficked (motorisedtraffic) tertiary ways are mostly informal andunserviced, but in older settlements in developingareas they are formalised (upgraded) by the provisionof surfacings, drainage or even services like water andelectricity (Clifford 1987).LayoutIn an informal settlement development no layoutplanning for tertiary ways is done. The existence ofthese ways is dictated by pedestrians’ need to followthe shortest possible routes. At a later stage of44Chapter 8Roads: Materials and construction
GUIDELINES FOR <strong>HUMAN</strong> <strong>SETTLEMENT</strong> <strong>PLANNING</strong> <strong>AND</strong> DESIGNDrainage and Layout Planning*Design of basic access streetsYesErosion problems ?NoNeed erosionprotectionIs in-situ materialacceptable ?Is dust palliative ongravel adequate ?NoDesign gravelthicknessYesIn-situ base actsas wearingcourseSelect surfacing typeUse dust palliativeNoYesBase, subbase and subgrade meet material specifications* This should be done before the design of basic access streetsFigure 8.18: Flow diagram of design process for basic access streetsdevelopment some of these tertiary ways may bereplaced by basic access streets. It is advisable to designfor tertiary ways during layout planning as these formthe basic links between dwellings. In a formal designthey can enhance the design principles applicable tothe higher order of streets.MaterialThe in-situ material is mostly used for tertiary ways.However, no standards are applicable, as no formalconstruction is carried out during the initial informaldevelopment stages. In general, where problemmaterials exist, they should be covered or improved toensure passability. The discussion on material typescovered in Appendix C is applicable to theidentification of possible material problems.Design of tertiary ways (standard crosssections)No formal design exists during the early stages ofgrowth in a developing community. In the later stagesof development these tertiary ways can be upgradedto have an appropriate profile, with side drains. Insuch cases, and for those tertiary ways which aredesigned from the outset, various cross-sections aresuggested for various ground slopes (Figure 8.19). Thecross-slopes of a tertiary way are limited to 10%. In thecase of very steep sloping ground, the camber isreplaced by a 7% cross-slope against the ground slope.Dimensions are also given for ditches, berms andretaining walls. In Figure 8.20, typical cutting andembankment cross-section details are given, with atable on embankment details.Dust palliativesUnacceptable levels of dust are experienced onmany of these roads, especially those in rural andurban communities. In the past, dust was onlyconsidered a nuisance factor. However, recentstudies have indicated that the dust generated byvehicles on unpaved roads could have significantenvironmental and social impacts in terms ofhealth and safety issues, visual pollution, andeconomic impacts pertaining to loss of roadconstruction material, increased buildingmaintenance and higher vehicle-operating costs.Consequences of dustThe main consequences of dust include discomfortfor pedestrians, vehicle occupants and residents ofproperties adjacent to the road. Visibility forfollowing and approaching vehicles is greatlyreduced, creating a safety risk for motorists,cyclists, pedestrians and livestock. In addition,vehicle-operating costs increase dramatically ondusty roads. Other important effects of dustinclude health hazards, reduced agricultural yields,pollution and loss of road construction material.Roads: Materials and construction Chapter 845
GUIDELINES FOR <strong>HUMAN</strong> <strong>SETTLEMENT</strong> <strong>PLANNING</strong> <strong>AND</strong> DESIGNOverall formation width 7,5 m0,50 0,75Width of road 5,00 m 0,75 0,50m mm mWidth of gravel (if reqd) 4,00 m1:310% (loose)10% (loose)Normal depth ofditch 0,25 mNormal cross-section** Note cross-sections of dished roads inurban areas may be used where sideflat groundditches are not needed.(longitudinally and transversally)varies 1,25 m Width of road 5,00 mvariesAdditional borrowmaterial (if required)0,25 m10% (loose)Sloping ground(up to 1 in 6)Original ground level1:2Grass planting(as necessary)1,25 mWidth of road 5,00 mvariesDry masonry asalternative tograssWhen H exceeds1,0 m, face to bebacksloped at 1:3H0,25 m10%10%Sloping ground(>1 in 6 < 1 in 3)1:1 /1 2Grass plantingto prevent erosionWhen H exceeds2,0 m, berms to beused at 2,0 m centresverticallyBerm1,00 mH1,25 mnormal,but maybe reducedto0,80 m13*Normal width of road 5,00 mAbsolute minimum distancebetween marker stones = 3,5 mbut lay-bys to be provided at100 m centres7% (loose)White painted marker stones at5 m centres to denote hazardor protect stability of structureRetaining structure as required.* Normal backslope 3:1but may be steeper ifrock is encounteredA catchwater drain may berequired above cut slope.0,25 mIf ditch is narrowed and isconsidered a traffic hazard,white painted marker stonesat 5,0 m centres to be usedSloping ground(> 1 in 3)Figure 8.19: Tertiary ways: cross-sectionsProcesses affecting the generation of dustDust generation is predominantly related to the siltcontent, plasticity characteristics, hardness andrelative density of the aggregate, and thethreshold shear velocity of the wind generating thedust. The moisture content of the material and theperiod since the road was last bladed will alsoinfluence the level of dust. The parameters used indust prediction include plasticity index, linearshrinkage, percentage passing 0,075 mm, theaggregate impact value and the relative density.Dust controlIn terms of the total unpaved road network inSouth Africa, minimal dust control is currentlybeing carried out. The last few years have seen aproliferation of products which the manufacturersclaim will reduce both dust and maintenance onunpaved roads. However, minimal specification oftheir properties or records of their performance areavailable and very few properly controlledcomparative tests on the effectiveness of theproducts from different producers and suppliershave been carried out in full-scale field trials.Research on dust palliatives has been conducted bythe <strong>CSIR</strong> over a period of six years on behalf of roadauthorities and product manufacturers. In order tofacilitate the selection of an appropriate productfor particular conditions, dust palliatives aredivided into the following ten categories:46Chapter 8Roads: Materials and construction
GUIDELINES FOR <strong>HUMAN</strong> <strong>SETTLEMENT</strong> <strong>PLANNING</strong> <strong>AND</strong> DESIGNCatchwater drainas required onuphill side of cutting,to be located no closerthan 5,0 m from edgeof cuttingNormal backslope 3:1but may be steeper ifrock encounteredStep1,00m0,3m13 0,5mOriginal ground levelOverall formation width 5,60 mNormal width of road 4,00m0,3m1Width of gravel (ifrequired) 3,50m0,5m 37%Cutting7%0,25m1,75 mWhen height of cutface exceeds 2,0 m,steps to be usedGuide to camber:if soil loose or uncompacteduse 10%. If natural,undisturbed, or compacted,use 17%(L 1+ L ) 2 (L 1+ L 2 )L 2 L1 L 1L 2HD1:2Normal road width 5,00mOriginal ground levelEmbankment10% (loose)1:2Wide flat-bottomedditches as borrowareaEmbankment dimensionsEmbankmentheightHArea ofembankmentADepth ofditchDOffsetfrom CLL1Offsetto edgeL 2Totaloffset(L 1+ L 2)EmbankmentheightHArea of Depth of Offset Offset Totalembankment ditch from C L to edge offsetADL1L 2 (L 1+ L 2)0,300,350,400,450,500,550,600,650,700,750,800,850,900,951,002,122,432,763,093,443,794,164,534,925,315,726,136,566,997,440,300,300,300,300,300,400,400,400,400,400,400,400,400,400,403,103,203,303,403,503,603,703,803,904,004,104,204,304,404,503,834,354,905,456,035,145,606,066,557,047,558,068,609,149,706,937,558,208,859,538,749,309,8610,4511,0411,6512,2612,9013,5414,201,101,201,301,401,501,601,802,002,202,402,602,803,003,504,008,369,3210,3211,3612,4413,5615,9218,4421,1223,9626,9630,1233,4442,4452,440,500,500,500,500,500,600,750,751,001,001,251,251,251,501,754,704,905,105,305,505,706,106,506,907,307,708,108,509,5010,5010,2010,6111,3712,5013,5114,6016,8219,4121,3223,3325,2027,2029,1034,0038,8214,3016,2817,6018,8120,1022,5225,5027,8230,2332,5034,9037,2043,5049,3249,320,40m7%Overall "formation" width 5,80mNormal width of road 5,00m7%Cementedmasonrywall1,00m max.Channel to beexcavated toprovide drainageon uphill sideRockCompacted fillEmbankment over rock outcropNOTE:Width of wall atbase may be widerthan 0,40 m if requiredFigure 8.20: Labour-intensive tertiary ways: cross-sections, cuttings and embankments• water and wetting agents;• waste oils;• emulsified petroleum resins;• hygroscopic materials;• ligno-sulphonates;• modified waxes;• acrylate polymers;• tars and bitumens;• sulphonated oils; and• other products.Environmental considerationsGrowing environmental awareness in the roadsindustry has necessitated the development ofappropriate tests for assessing the impact ofspraying chemical dust palliatives onto unpavedroads. A series of interim test methods to determinethe toxicity of additives to surface water,groundwater and vegetation has been developedand is currently being perfected. Initial resultsindicate that all the products are toxic to aquatic lifein an undiluted form, and standard precautions forthe handling and transportation of chemicals should beadhered to. Testing of the leachate from soils to whichRoads: Materials and construction Chapter 847
GUIDELINES FOR <strong>HUMAN</strong> <strong>SETTLEMENT</strong> <strong>PLANNING</strong> <strong>AND</strong> DESIGNthe product has been applied at the recommendedapplication rates indicated that none of the leachatesfrom any of the products tested is likely to influencegroundwater or surface water. Certain products are likelyto kill plants if they are sprayed directly onto the leaves.However, root uptake of the leachate by plants isunlikely to cause death.CONSTRUCTIONStaged construction and upgradingTwo concepts that need to be considered as part of thelife-cycle strategy of a street during design are stagedconstruction and upgrading. Although it is difficult toexactly define and completely separate these concepts,certain characteristics may be more typical of one thanof the other.The aim of staged construction is to spread some ofthe financial load from the initial construction periodto some stage later during the life cycle of the facility.However, right from the onset, the aim is to provide aparticular level of service for the duration of thestructural design and analysis period of the facility.There may be slight changes in, for instance, the ridingquality of the facility, but these should have a marginalinfluence on the operating cost of the facility to theuser.On the other hand, upgrading will normally take placewhen the demands placed on an existing facility farexceed the level of service the facility can provide. Thenew facility has to provide a much higher level ofservice at a much reduced cost to the user. An examplewould be the upgrading from a gravel to a surfacedstreet.Staged construction may be done by adding a finallayer, or reworking an existing layer at some stageearly during the structural design period of the facility.Most of the money spent during the initialconstruction of the facility should therefore beinvested in the lower layers of the structure, providinga sound foundation to build on in the future.During the upgrading process, maximum use shouldbe made of the existing foundation provided by thepavement being upgraded. Dynamic conepenetrometer (DCP) and impulse deflection meter(IDM) surveys may provide the information required toincorporate the remaining strength of the existingpavement in the design of the future facility. Specialequipment may also be used to maximise the bearingcapacity of the in-situ material. Impact rollercompaction can prove very useful in the urbanenvironment. With this equipment, it is usuallypossible to compact the in-situ material to a depth of600mm at densities well above those normallyspecified for the subgrade and selected layers of apavement, without excavating and replacing anymaterial. This results in few layers or thinner layersbeing required in the pavement structure.One of the problems that may be associated withstaged construction in the urban environment is thelimitation placed on street levels by the other servicesin the street reserve, particularly the stormwaterdrainage system. If a system of kerbs, gutters andstormwater pipes is used, it may not be possible to addan additional structural layer to the pavement systemat a later stage. In such cases, consideration should begiven to initially providing a subbase-quality gravelbase, and to rework this layer at some early stage inthe structural design period of the pavement by doingdeep in-place recycling and stabilisation with cement,bitumen emulsion or a combination of the two. Asecond problem that requires consideration is the costof repeated mobilisation on a project. Themobilisation of plant and resources for a lightpavement structure in an urban area (usually of shortlength) is often a significant portion of the total cost.Table 8.20 provides a number of staged constructionexamples developed from the catalogue of pavementdesigns contained in Appendix A. Both the initial andfinal pavement structures are illustrated for the stagedconstruction options. The staged construction of theseexamples is not achieved by merely taking a design fora high bearing capacity and removing the base layer.The structures for the initial construction phase areactually also taken from the catalogue and have aknown bearing capacity. This should assist indetermining the time allowed to elapse beforecompleting construction without allowing too muchdamage to the initial structure. By adding therequired base layer or stabilising an existing base layerof the pavement at the initial construction phase, thebearing capacity is increased to the actual bearingcapacity required.The present worth of cost (PWOC) values for the stagedconstruction options listed in Table 8.20 vary from beingalmost the same as for the full construction options tovalues significantly less than the PWOC for the fullconstruction options. In general, staged constructiontherefore spreads the financial burden of constructionand is economically more viable than initial fullconstruction. The economics of each project must,however, be considered on merit. It must also be keptin mind that because some of the cost of construction isshifted a few years into the life cycle of a pavement,future budgets must allow for this cost plus inflation.The details of upgrading from a gravel street to asurfaced street will depend largely on individualprojects and will be determined by the bearingcapacity of the material on the existing street. Asalready mentioned, the strength of the existingpavement should be optimally utilised in the newdesign and if material is imported to the gravel street,48Chapter 8Roads: Materials and construction
GUIDELINES FOR <strong>HUMAN</strong> <strong>SETTLEMENT</strong> <strong>PLANNING</strong> <strong>AND</strong> DESIGNTable 8.20: Example of staged constructionDescription Full construction Staged constructionInitial construction: Lightly cemented base(pavement catalogue, street category UD):design bearing capacity100 000 E80s30 mm A150 mm G3200 mm C4S1150 mm C430 mm A150 mm G3ExistingstructureFinal construction: Granular base (pavementcatalogue for dry regions, street category UB):design bearing capacity3 million E80s150 mm G7150 mm G9150 mm G7150 mm G9Final pavement suitable for minor arterials,collectors and bus routesG10G10Addition of granular base during finalconstructionInitial construction: Lightly cemented base(pavement catalogue, street category UD):design bearing capacity100 000 E80sFinal construction: Granular base (pavementcatalogue for dry regions, street category UB):design bearing capacity1 million E80sFinal pavement suitable for minor arterials,collectors and bus routesS1125 mm G4150 mm C4150 mm G7150 mm G9G10S1150 mm C4150 mm G7150 mm G9G10Addition of granular base during finalconstructionS1125 mm G4ExistingstructureInitial construction: Lightly cemented base(pavement catalogue, street category UD):design bearing capacity30 000 E80sFinal construction: Granular base pavement(catalogue for dry regions, street category UC):design bearing capacity1 million E80sFinal pavement suitable for residentialcollector streets and lightly trafficked busroutesS1125 mm G4125 mm C4150 mm G7150 mm G9G10S1125 mm C4150 mm G7150 mm G9G10Addition of granular base during finalconstructionS1125 mm G4ExistingstructureInitial construction: Lightly cemented base(pavement catalogue, street category UD):design bearing capacity30 000 E80sFinal construction: Granular base pavement(catalogue for dry regions, street category UC):design bearing capacity300 000 E80sFinal pavement suitable for residentialcollector streets and lightly trafficked busroutesS1125 mm G5125 mm C4150 mm G7150 mm G9G10S1125 mm C4150 mm G7150 mm G9G10Addition of granular base during finalconstructionS1125 mm G5Existingstructure49Roads: Materials and construction Chapter 8
GUIDELINES FOR <strong>HUMAN</strong> <strong>SETTLEMENT</strong> <strong>PLANNING</strong> <strong>AND</strong> DESIGNTable 8.20: Example of staged construction (continued)Description Full construction Staged constructionInitial construction: Granular base (pavementcatalogue for dry regions, street category UC):design bearing capacity100 000 E80sS1125 mm G5125 mm C4S1125 mm G5125 mm C4S1125 mm C3ExistingstructureFinal construction: Lightly cemented base(pavement catalogue, street category UC):design bearing capacity1 million E80sFinal pavement suitable for residentialcollector streets and lightly traffickedbus routes150 mm G7150 mm G9G10150 mm G7150 mm G9G10Deep in-place milling and stabilisationof granular base during finalconstructionInitial construction: Lightly cemented base(pavement catalogue, street category UC):design bearing capacity300 000 E80sS1125 mm C3200 mm C4S1200 mm C4S1125 mm C3ExistingstructureFinal construction: Lightly cemented base(pavement catalogue, street category UC):design bearing capacity3 million E80s150 mm G7150 mm G9150 mm G7150 mm G9Final pavement suitable for minor arterials,collectors and bus routesG10G10Addition of lightly cemented baseduring final constructionInitial construction: Lightly cemented base(pavement catalogue, street category UC):design bearing capacity300 000 E80s30 mm A150 mm G1200 mm C4S1200 mm C430 mm A150 mm G1ExistingstructureFinal construction: Granular base pavement(catalogue for wet regions, street category UB):design bearing capacity3 million E80s150 mm G7150 mm G9150 mm G7150 mm G9Final pavement suitable for minor arterials,collectors and bus routes in wet regionsG10G10Addition of a crushed stone baselayer during final constructionInitial construction: Lightly cemented base(pavement catalogue, street category UC):design bearing capacity300 000 E80sFinal construction: Ashalt hot-mix base(pavement catalogue, street category UB):design bearing capacity1 million E80sFinal pavement suitable for minor arterials,collectors and bus routes in wet regions30 mm A80 mm BC200 mm C4150 mm G7150 mm G9G10200 mm C4150 mm G7150 mm G9G10Addition of asphalt hot-mix baselayer during final construction30 mm A80 mm BCExistingstructure50Chapter 8Roads: Materials and construction
GUIDELINES FOR <strong>HUMAN</strong> <strong>SETTLEMENT</strong> <strong>PLANNING</strong> <strong>AND</strong> DESIGNthe possible utilisation of this material in a futureupgrading to a paved street should be kept in mind.The cost analysis for upgrading from a gravel to asurfaced street must at least include the savings invehicle-operating cost as part of the benefit to thestreet user. The cost of upgrading should be weighedagainst the benefits by means of a cost-benefitanalysis, expressing the benefits as a ratio to the cost.The CB-Roads or SURF+ (refer to manuals) computerprograms are ideally suited for this type of analysis.Construction approachesConstruction of urban streets has become a highlymechanised process but, over the past few years, thepossibility of creating employment opportunities hasled to greater use of labour-intensive technologies.Additionally, the encouragement of small businesses,owned by the previously disadvantaged, has led to thegreater use of these affirmable business enterprises(ABEs) as subcontractors to established contractors or ascontractors for small projects. The benefits of usinglabour-intensive construction or of using ABEs wouldinclude a reduction in unemployment, by creatingproductive jobs and opportunities.There are thus three construction approaches that canbe adopted, although a mix may also be appropriate:• conventional construction (mechanised);• labour-intensive construction; and• construction using ABEs.The method of construction that is to be used mayhave some impact on the selection of materials andthe structural design. The construction method shouldbe clearly understood before the design proceeds, as adesign suitable for plant-intensive construction may beunsuitable for labour-based construction and viceversa.Conventional constructionConventional construction is generally wellunderstood by engineers and most design in therecent past has been for this type of construction.Conventional construction is suited to most newstreet-construction jobs, perhaps with theexception of construction in confined areas.Advantages may include rapid mobilisation andcompletion, while disadvantages may includelimited expenditure on the local community..Labour-based constructionIf it is important to include the achievement ofsocio-economic goals as part of service provision,the designer should consider the use of labourbasedconstruction to achieve these goals. Socioeconomicgoals that could motivate the use oflabour-based construction could include relief ofunemployment and the transfer of constructionskills to the unemployed, particularly previouslydisadvantaged persons, with the aim of developingSMMEs.It is important that labour-intensive constructionbe carried out using a payment-for-production, ortask-based, approach. This is the only way in whicheconomic efficiency has been realised.Small, medium and micro-enterprises(SMMEs)Where there is a motivation to use labour-basedconstruction (if it is important to include theachievement of socio-economic goals as part ofservice provision), the designer should also considerthe promotion of local contractors to achieve thesegoals. Socio-economic goals that could motivatethe use of SMMEs could include the promotion ofentrepreneurship and the advancement of localbusinesses, particularly those owned by previouslydisadvantaged persons.DESIGNING FOR LABOUR-BASEDCONSTRUCTIONIn order to ensure the maximisation of job creation tothe extent that is economic and feasible, the terms ofreference for technical consultants engaged to carryout feasibility studies should require the consultant toexamine the appropriateness of designs that areinherently labour-intensive, to report on theeconomic implications of using such designs and,thereafter, to design a project based on designs andtechnology appropriate for construction thatmaximises labour-intensive methods.All construction activities cannot always be executedby means of labour-intensive methods. This must berecognised in the design. Examples of activitiesdemanding greater mechanisation are:• deep excavation - apart from safety considerations,material can only be thrown a certain height byshovel;• excavation and spreading of very coarse material;• in-situ mixing of stabilising material (cement orlime) effectively into coarse aggregates;• application of tar - due to safety considerations;• compaction of thick layers or very large aggregates(e.g. rock fill) with small (pedestrian) rollers;• mixing of high-strength concrete;Roads: Materials and construction Chapter 851
GUIDELINES FOR <strong>HUMAN</strong> <strong>SETTLEMENT</strong> <strong>PLANNING</strong> <strong>AND</strong> DESIGN• excavation of medium to hard material;• haulage by wheelbarrows over long distances; and• placement of heavy pipes.Labour-intensive construction should, in general, striveto obtain the standards set for conventionalconstruction. However, the design should ensure thatthe standards specified are appropriate. Thisnecessitates a critical review of all specifications duringthe design stage.Table 8.21 gives generalised information on theemployment potential of roadwork projects. Theinformation in the table is of a general nature, andshould be used with caution.The following are some guidelines that can be used inthe design of civil engineering projects to maximisethe use of labour:• Once the type of project has been selected, theinformation in Table 8.22 can be used to indicatethe potential for employment creation.• Select the construction activities that have thebiggest impact on employment creation (where thecontribution of this activity forms a significant partof the project cost and the activity has thepotential for employment creation). Information inthe following paragraphs will be useful in thisselection. A preliminary cost analysis can be done.• Consider using local plant and materials (i.e. rentplant and purchase material from the community).• Consider the involvement of ABEs, which generallyuse more labour-intensive methods, in theconstruction.Table 8.21: Summary of employment potentialPROJECTCONVENTIONAL CONTRIBUTION (%) POTENTIAL CONTRIBUTION (%)LABOUR PLANT MATERIAL LABOUR PLANT MATERIALRehabilitation* 9 53 37 29 26 45Gravel road* 15 66 19 49 35 16Drainage (culverts) 34 36 30 54 24 22Bridges 20 10 70 22 8 70Urban street 13 54 33 36 27 37*Earthworks and pavements only.Table 8.22: Relative contribution of main activitiesDESCRIPTION% CONTRIBUTION TOWARDS PROJECT COSTSREHABILITATION PAVED GRAVELSite accommodation 3 2 4,5Accommodation of traffic 5 5 4Clearing and grubbing 0,5 1 2Drainage 3 3 7,5Culverts 3 15 11Kerbs and edging 3,5 8,5 0Earthworks 6 4 22Pavement layers 10 14 16Base 8 10 0Prime and seal work 35 15 0Ancillary works 5 4 6,5Landscaping 2 152Chapter 8Roads: Materials and construction
GUIDELINES FOR <strong>HUMAN</strong> <strong>SETTLEMENT</strong> <strong>PLANNING</strong> <strong>AND</strong> DESIGN• Conduct a detailed investigation into the activitiesselected for labour-intensive construction, and thepossibilities for using ABEs, local plant andmaterials. The result of this investigation mayindicate that some activities cannot be done bymeans of labour, due to construction practicalitiesor the availability of materials. A more detailedcost analysis can then be done. Further, make surethat the design can be specified.Tables 8.23 and 8.24 may be of assistance fordetermining the most appropriate activities to beundertaken by labour-intensive methods. Thecontribution of the various elements towards thecontract value and the potential of the variouselements for employment enhancement are given.Construction using ABEsABEs that are interested in carrying out some ofthe project work should be identified. A certainamount of technical and business training may berequired for inexperienced ABEs.In the case of street construction projects, the useof ABEs is likely to include• emerging small contractors;• emerging materials suppliers; and• emerging materials hauliers.The activities in which ABEs may be engaged caninclude all construction operations, including theentire works for small projects. Once the ABEs whomight wish to work on a project have beenidentified, the technical consultant should propose,Table 8.23: Potential of pavement layers for labour-intensive construction methodsLAYER TYPE POTENTIALSubbase In-situ soil GoodImportedGood*Stabilised soilFair, not practicalBase In-situ soil GoodNatural gravelGoodEmulsion treated gravelGoodCrusher runFair, not practicalCement stabilised gravelNot practical**Lime stabilised gravelFair, good***Bituminous premixFair, goodWaterbound macadamGoodPenetration macadamGoodSurfacing Sand seal Good#SlurryGoodDouble sealGood#Cape sealGood#AsphaltFairRoller compacted concreteGoodConcrete (plain)GoodConcrete (reinforced)GoodSegmental blocksGood##Notes:* The suitability of this will depend entirely on the haul distance.** Cement-stabilised gravel is not suitable for labour intensive methods due to its quick setting time.*** Lime-stabilised gravel is more suitable as it reacts and sets more slowly, but achieving an even mix is difficultby entirely manual means and labourers must take extreme care to avoid contact between the lime and skinduring application: protective clothing is essential.# In the case of a bitumen surfacing, only certain types of emulsion have a non-critical application temperatureand are suitable for hand laying.## Quality control of on-site manufacture is critical.Roads: Materials and construction Chapter 853
GUIDELINES FOR <strong>HUMAN</strong> <strong>SETTLEMENT</strong> <strong>PLANNING</strong> <strong>AND</strong> DESIGNand obtain agreement to, the procurement formatthat is best suited to the size and scope of theproject and the capabilities of the ABEs. He mayneed to identify packages of work that can becarried out by ABEs, in which case the tenderdocuments for the main contractor shouldspecifically identify such packages of work.Typically, ABEs have been used in the activitiesshown in Table 8.24 .MAINTENANCEThe object of maintenance is to preserve, repair andrestore the maintainable features of a street networkto their designed standard or to a predeterminedcondition. In this sense, even rehabilitation may beconsidered a maintenance activity as the object wouldbe to restore the pavement to its original condition.Proper, timely maintenance that is managed efficientlywill result in long-term savings to the street authorityand street user.In addition to normal street maintenance activities,the situation in densely populated areas is furthercomplicated by the installation and maintenance of allthe other services found in the street reserve in suchareas. These services include stormwater, electricityand water supply, sewerage and telecommunicationsystems. Although the street authority is notresponsible for the maintenance of these systems, itremains the legal custodian of the street reserve andTable 8.24: Typical activities suited to ABEsCOMPONENTACTIVITIESAccommodation of trafficClearing and grubbingDrainageCulvertsKerbing and edgingEarthworksPavement layersBasePrime and seal workAncillary worksMasonry wallsLandscapingWatering of gravel diversionsAs requiredCatchpits and manholesExcavation of open drainsLined open drainSubsoil drainsInlet and outlet structuresExcavation of trenchesInstallation of lightweight pipesManufacture of reinforced concrete slabs, walls and decksMasonry wallsManufacture of concrete elementsLaying of kerbing and edgingMinor earthworksCrushing of aggregatesScreening of stockpilesHaulage of materialsSpreading of materialsRemoval of oversize materialsConstruction of labour-intensive base types (waterboundmacadam, emulsion-treated base, stabilised orunstabilised gravel)Manufacture of paving blocksLaying of paving blocksHand spraying of primeManufacture and laying of slurrySeals (Cape seal, double seal, single seal)FencingGabionsConcrete structuresPainting of roadmarkingsGrassingPlanting of trees54Chapter 8Roads: Materials and construction
GUIDELINES FOR <strong>HUMAN</strong> <strong>SETTLEMENT</strong> <strong>PLANNING</strong> <strong>AND</strong> DESIGNas such must authorise and coordinate the efforts ofthe various other departments or companies involved.Complaints regarding the poor or delayed repair ofthe street surface operations of other parties will moreoften than not be directed at the streets department,and these activities should therefore be monitored bythe streets department.The two main components of the maintenance processare the actual physical execution of the work and themanagement of the process. Of these two, the biggestchallenge is the efficient management of the process.Management systems may vary from being highlysophisticated systems of a pro-active nature with alarge computerised component, to less technicalneeds-driven systems of a reactive nature, or even acombination of the two. The success of a particularsystem largely depends on the environment in which itis applied and may well fail if it is not appropriate to thespecific conditions and demands of the area where it isapplied and the type of maintenance activity to whichit is applied.Maintenance activities may be classified as beingroutine or periodic maintenance, or rehabilitation.Within these categories, some activities may be specificto paved streets and some to unpaved streets, whileothers may be applicable to both street types. Bydefining the scope of the maintenance for which aparticular authority will be responsible, in terms of themaintenance activities applicable to the particular streetnetwork, a better understanding of exactly what isrequired is achieved. Table 8.25 lists some maintenanceactivities according to maintenance category.Some estimate of the extent of the maintenanceworkload will set the scene for planning, executing andmonitoring maintenance activities. This may be done bydividing the whole network into maintenance zonesand preparing an inventory, indicating the expectedamount of work for each maintenance activity in eachzone. For instance, the length of unpaved street willdirectly determine the workload in terms of wateringand blading for a particular zone.Once the scope and extent of maintenance are known,several options may be considered for deciding onwhen to do a specific activity and on the best means ofdoing the work.The simplest approach to routine maintenanceactivities is to work according to predeterminedschedules, repeated at regular intervals. Maintenanceteams will therefore be set up to perform one or moremaintenance activities and will be allocated a specificmaintenance zone. They will then work through thezone according to a predetermined schedule and willrepeat the schedule in cycles. The resources should bebalanced with the maintenance workload in themaintenance zones, to control the duration of thecycles. If these cycles are too short, the teams will beunder-utilised and if too long, maintenance problemswill be left unattended to for lengthy periods.Typically, the cycles could have a duration of a fewmonths for activities such as vegetation control to afew years for painting street markings. The planninghorizon is determined by the duration of these cycles.Actual performance may be measured against the setschedules and planning revised accordingly. Thisapproach implies that the maintenance team isresponsible for identifying the need for maintenanceas it works through its area of responsibility. Theapproach may also fail to utilise the maintenanceteams to full capacity and may be expensive as thewhole team is moved through the maintenance zoneregardless of the need for maintenance. It does,however, remain a fairly straightforward,unsophisticated approach.Table 8.25: Street maintenance categories and limited examples of maintenance activitiesFACILITYMAINTENANCE CATEGORYROUTINE PERIODIC REHABILITATIONPaved streets • Painting street markings • Reseal • Recycle• Cleaning stormwater inlets• Overlay• Pothole patching• Recycle and overlay• Crack sealing• Sidewalk and cycle path repair.Unpaved streets • Watering • Regravel • Shape and regravel• Blading• Patch gravelling• Cleaning side drains and ditchesNon-specific • Street sign maintenance • Street sign• Vegetation controlreplacementRoads: Materials and construction Chapter 855
GUIDELINES FOR <strong>HUMAN</strong> <strong>SETTLEMENT</strong> <strong>PLANNING</strong> <strong>AND</strong> DESIGNThe alternative is to have inspectors identifying theneed for maintenance at specific locations and thentargeting maintenance teams at those problems with aplanning horizon of about two weeks.Periodic maintenance and rehabilitation are normallytriggered by the street condition. In these cases, theprocess may be initiated by a pro-active system, basedon a history of condition-assessment data collectedover years, processed by computer and enhanced bythe experience of the persons involved in themanagement system, or by a reactive system whereareas requiring immediate action are identified andattended to. If the latter approach is selected, a rapidresponse is, however, required to prevent excessivedeterioration. In addition to the normal workingprocedure opted for, a complaints register should alsobe kept. Prompt reaction to the complaints raised bythe public in such a register is, however, essential.Maintenance activities may be done by in-housemaintenance teams or given out on contract. Therecent trend is towards appointing contractors to domaintenance. Because of the low level of technicalexpertise required - especially by routine maintenanceactivities - this offers an excellent entry point foraspiring future contractors. Maintenance activities arealso ideally suited to manual labour. Proper trainingand logistical support of the maintenance teams are,however, essential and must be specifically targeted atthe activities they will perform.The lack of logistical support in terms of transport,hand tools and materials may seriously handicapmaintenance efforts. On the other hand, over- supply,by keeping too much stock of an item for which thereis a low demand, will also tie up capital. This situationmay easily arise when there is too much diversity in, forinstance, the selection of paving blocks used. Stocks ofa particular block will have to be acquired and storedfor replacing broken blocks in future. If there is toowide a selection of blocks used, stocks will have to beobtained and stored for each type, resulting in a majorlogistical and financial problem. It is thereforeadvisable to standardise on certain bulk items.Maintenance activities are in essence simpleprocedures to be carried out with the proper trainingand equipment. Management during all stages -including planning, execution, monitoring and replanning,as well as addressing the vast logisticaldemands of maintenance teams - may at the end ofthe day determine the success of the maintenanceefforts.MAINTENANCE OF BASIC ACCESSSTREETSlimited. Local authority resources or experience mayalso not be able to meet the need. Because of the lighttraffic and possible limitations in the maintenanceapplied, basic access streets are designed to withstandenvironmental deterioration. Under such a policy,maintenance of drainage channels is more importantthan grading unsurfaced streets. The emphasis is onlabour-intensive types of maintenance rather thanequipment.Labour and mechanisationSome construction and most maintenance activitiesoffer considerable scope for the application of labourbasedmethods, and some activities are only possibleby such methods. Table 8.26 indicates the potential formechanical and labour-based methods in differentmaintenance operations. In choosing betweenmechanical and labour-based methods, considerationshould be given to the standard of work achieved byeach method, as well as to costs and the organisationof work. On basic access streets it is not alwaysnecessary for labour-based operations to have thesame standard of finish that can be obtained usingmachines. A decision to do labour-based maintenancemay influence design details such as the shape of sidedrainage channels.Environmental maintenanceErosion is the main form of wear in basic access streets.The maintenance of such streets is therefore primarilyrelated to the environmental maintenance of thedrainage facilities. This includes the shaping, cleaning,desilting and scour protection of the drainagechannels. Grass-cutting and other forms of vegetationcontrol will also constitute part of this type ofmaintenance. The emphasis is on the efficientfunctioning of drainage channels.The integrity of a surfacing on light-structure streetsdetermines the lifespan of a street. Crack-sealing orpothole-patching should be done on a preventivebasis, as cracked or potholed streets may show rapiddeterioration when structural layers are wet andcarrying traffic.MAINTENANCE OF TERTIARY WAYSThe construction of tertiary ways is mostly labourintensiveand maintenance should be as well. This typeof maintenance can be classified as environmentalmaintenance, as most would be focused on ditchcleaning,grass-cutting, scour protection and replacinggravel. Various labour-intensive means exist to enablethe scraping of tertiary ways. Figure 8.21 illustratestypical drags that can be used for this purpose.Maintenance funds for basic access streets constructedwith severe budgetary constraints are likely to be56Chapter 8Roads: Materials and construction
GUIDELINES FOR <strong>HUMAN</strong> <strong>SETTLEMENT</strong> <strong>PLANNING</strong> <strong>AND</strong> DESIGNBRUSHWOOD DRAGSmall branches tied togetherTYRE SLEDGEOld truck tyres chained togetherCABLE DRAGkgkgkgBundles of steel cables bound together and fixedin a frame, weighed with concrete blocks toenable it to cut into the surface. Wooden sticksmay be used if steel cables are not available.Care must be taken that pieces of the steel cablewhich may break off the drag are not left lyingon the road.kgSTEEL DRAGkgkgRolled steel joist or steel rail weighted withconcrete blocks and towed at an angle to theroad.kg kg kgBOX DRAGWooden box filled with concrete blocks on topof an old grader blade.kgkgTOLARDFive blades at different angles under a box weightedwith concrete blocks.Figure 8.21: Simple drags for maintenance of tertiary waysRoads: Materials and construction Chapter 857
GUIDELINES FOR <strong>HUMAN</strong> <strong>SETTLEMENT</strong> <strong>PLANNING</strong> <strong>AND</strong> DESIGNTable 8.26: Suitability of mechanical equipment and labour for maintenance activitiesACTIVITYMECHANICALEQUIPMENTLABOURDitch-cleaning and cutting Good* Good*Cleaning and minor repair to culverts and bridges Poor GoodBuilding scour controls Poor GoodRepair of structures Poor GoodGrading unpaved surfaces Good ImpracticableDragging and brushing of unpaved surfaces Poor PoorFilling potholes Poor GoodFilling unpaved surfaces and slopes Poor GoodGrass cutting Good** GoodRepairing and replacing traffic signs Poor GoodStockpiling gravel Good FairRegravelling gravel surfaces Good Fair* The labour potential in these activities depends on suitable design of the ditch cross-section (see Figure 8.5).** The labour potential in this activity depends on the width of the shoulder and the presence of obstructions,such as road furniture and culvert headwalls.58Chapter 8Roads: Materials and construction
GUIDELINES FOR <strong>HUMAN</strong> <strong>SETTLEMENT</strong> <strong>PLANNING</strong> <strong>AND</strong> DESIGNBIBLIOGRAPHYAbbreviations:AASHTO:CSRA:CUTA:HRB:KZN:NITRR:American Association of State Highwayand Transportation OfficialsCommittee of State Road Authorities,South AfricaCommittee of Urban Transport Authorities,South AfricaHighway Research Board, WashingtonKwaZulu-Natal Department of Transport,PietermaritzburgNational Institute for Transport and RoadResearch, <strong>CSIR</strong>, PretoriaAASHTO (1993). Guide for design of pavementstructures. AASHTO, Washington.Clifford, J M (1987). Interim report on non-traffickedtertiary ways in developing urban areas. Contractreport C/PAD/63.1. NITRR, Pretoria.Csanyi, L H (1960). Bituminous mixes prepared withfoamed asphalt. Iowa Engineering Experiment Station.Iowa State University.CSRA (1996). Structural design of flexible pavementsfor inter-urban and rural roads. Department ofTransport Technical recommendations for Highways:Draft TRH4. Pretoria.CUTA (1987). Structural design of segmental blockpavements for Southern Africa. Department ofTransport Technical Recommendations for Highways,Draft UTG2. Pretoria.CUTA (1988a). Guidelines for urban stormwatermanagement. Draft UTG4. Division of Roads andTransport Technology, <strong>CSIR</strong>, Pretoria.CUTA (1988b). Structural design of urban roads. DraftUTG3. Division of Roads and Transport Technology,<strong>CSIR</strong>, Pretoria.Emery, S J (1984). Prediction of pavement moisturecontent in Southern Africa. Proceedings of the 8thregional conference in Africa on soil mechanics andfoundation engineering pp 239-250. Harare.Emery, S J (1987). Unsoaked CBR design to reduce thecost of roads. Proceedings of the AnnualTransportation Convention. Pretoria.Freeme, C R, Maree, J H and Viljoen, A W (1982).Mechanistic design for asphalt pavements andverification using the Heavy Vehicle Simulator.Proceedings of the fifth international conference onthe structural design of asphalt pavements. August,Delft (NITRR reprint RR362).pavements in Southern Africa. M.Sc thesis, Universityof the Witwatersrand, Johannesburg.Hefer A W (1997). Towards design guidelines formacadam pavements. M.Eng thesis. University ofPretoria, Pretoria.Highway Research Board (HRB) (1985). Highwaycapacity manual. HRB Special Report no 209,Washington DC.Horak, E (1988). Affordable streets - a realistic view.Conference on national infrastructure for housing insouthern Africa. 23 - 24 May, Pretoria.Jordaan, G J (1986). An assessment of pavementrehabilitation design methods: a method based onDynamic Cone Penetrometer (DCP) measurements asdeveloped in South Africa. NITRR Technical NoteTC/4/86, <strong>CSIR</strong>, Pretoria.Kleyn, E G (1982). Aspects of pavement evaluation anddesign as determined with the aid of the dynamic conepenetrometer (DCP). M.Eng thesis (Afrikaans).University of Pretoria, Pretoria.Kleyn, E G and van Zyl, G D (1987). Applications of thedynamic cone penetrometer (DCP) to light pavementdesign. Report L4/87. Transvaal Roads Department,Materials Branch. Pretoria.KZN (1997). Trials on P504 using foamed bitumentreatedmaterials. KwaZulu -Natal Department ofTransport. Pietermaritzburg.Netterberg, F (1985). Materials location. Paperpresented at the SA Road Federation seminar on roadsin developing areas. NITRR Technical Note TS/3/85.<strong>CSIR</strong>, Pretoria.Netterberg, F and Paige-Green, P (1988). Pavementmaterials for low volume roads in southern Africa: areview. Proceedings of the 8th quinquennialconvention of the South African Institute of CivilEngineers and the annual transportation convention.Vol 2D, Paper 2D2. Pretoria.NITRR (1978). Geotechnical and soil engineeringmapping for roads and the storage of materials data.TRH2, <strong>CSIR</strong>, Pretoria.NITRR (1982). Construction of road embankments.TRH9. <strong>CSIR</strong>, Pretoria.NITRR (1984a). Subsurface drainage for roads. DraftTRH15. <strong>CSIR</strong>, Pretoria.NITRR (1984b). Geometric design of rural roads. DraftTRH17. <strong>CSIR</strong>, Pretoria.Haupt, F J (1980). Moisture conditions associated withRoads: Materials and construction Chapter 859
GUIDELINES FOR <strong>HUMAN</strong> <strong>SETTLEMENT</strong> <strong>PLANNING</strong> <strong>AND</strong> DESIGNNITRR (1984c). Site investigation and the design ofroad embankments. TRH10. <strong>CSIR</strong>, Pretoria.NITRR (1984d). Guidelines for road constructionmaterials. TRH14. <strong>CSIR</strong>, Pretoria.Paterson, W D O and Maree, J H (1978). An interimmechanistic procedure for the structural design ofasphalt pavements. National Institute for Transportand Road Research, <strong>CSIR</strong>, Pretoria.Rooseboom, A and Mulke, F J (1982). Erosioninitiation: recent developments in the explanation andprediction of erosion and sediment yield. Proceedingsof the Exeter Symposium. July.SABITA (1993). Gems: the design and use of granularemulsion mixes. South African Bitumen Associationmanual 14. Cape Town.SA Department of Transport (1977). Standard detailsfor concrete pavements. Pretoria.Sampson, L R (1984). Investigations of the correlationbetween CBR and DCP. NITRR Technical Note TS/33/84.<strong>CSIR</strong>, Pretoria.Theyse, H L, De Beer, M and Rust, F C (1996). Overviewof the South African mechanistic pavement designmethod. Flexible pavement design and rehabilitationissues. Transportation Research Board, TransportationResearch Record no 1539. Washington.Theyse, H L (1997b). Interim guidelines on thestructural design of pavements with emulsion treatedlayers. Confidential contract report CR-97/045. <strong>CSIR</strong>,Pretoria.Van Vuuren, D J, Otte, E and Paterson, W D O (1974).The structural design of flexible pavements in SouthAfrica. Proceedings of the 2 nd conference on asphaltpavements in South Africa. Durban.Visser, A T (1994). A cast in-situ block pavement forlabour-enhanced construction. Concrete/beton, No 71,February.Visser, A T and Hall, S (1999). A flexible portlandcement concrete pavement for low-volume roads.Paper offered to the Seventh international conferenceon low-volume roads, Baton Rouge, 23 -27 May, LosAngeles.Walker, R N, Paterson, W D O, Freeme, C R and Marais,C P (1977). The South African mechanistic pavementdesign procedure. Proceedings of the 4 th internationalconference on the structural design of asphaltpavements. Ann Arbor, University of Michigan,Michigan.Yoder, E J and Witczak, M W (1975). Principles ofpavement design. 2 nd edition. John Wiley Intersciencepublications, New York.Theyse, H L (1997a). Preliminary assessment of thestructural properties of pavements with foamedbitumen base layers. Confidential contract report CR-97/087. <strong>CSIR</strong>, Pretoria.60Chapter 8Roads: Materials and construction
GUIDELINES FOR <strong>HUMAN</strong> <strong>SETTLEMENT</strong> <strong>PLANNING</strong> <strong>AND</strong> DESIGNAPPENDIX ATHE CATALOGUE OF PAVEMENT DESIGNSThe catalogue of pavement designs contained in this appendix was compiled from various sources, with the aim ofaddressing the specific needs of pavement design in urban areas. The catalogue pages dealing with the granularbase pavements for both wet and dry regions, the cement-treated base pavements, and the asphalt hot-mix basepavements were obtained from the TRH4 document. These designs were developed from the SAMDM and werechecked with the DCP design method.The macadam page was obtained form the TRH4 document and supplemented by the category D designs.The emulsion-treated base pavement designs were developed using the DCP design method.The block paving pavement designs were obtained from the UTG2 document.The cast-in-situ block paving designs were obtained from the original proposal by Visser (1994), which wassubsequently validated by Visser and Hall (1999).Notes regarding the use of the catalogue• The designs in the catalogue are merely suggested designs, and the designer may modify and adjust them onthe basis of sound engineering principles and experience.• The layer thicknesses indicated in the catalogue represent minimum thicknesses required. Practical constructionissues and layer thickness tolerances should be allowed for.• Although the catalogue generally indicates a fixed thickness of asphalt, regardless of the grading of the asphaltand the binder type, these values serve only as suggested starting values. The designer should consider theparticular properties of the asphalt mix that will be used.• Designs are valid for the upper bearing-capacity boundaries of the pavement classes.• It is assumed that all the requirements regarding material quality, moisture condition and compaction are metduring the construction of the pavements.RECOMMENDED READINGCSRA (1996). Structural design of flexible pavements for inter-urban and rural roads. Department of TransportTechnical Recommendations for Highways Draft TRH4. Pretoria.CUTA (1987). Structural design of segmental block pavements for southern Africa. Department of Transport UrbanTransportation Guidelines Draft UTG2. Pretoria.Hefer, A W (1997). Towards design guidelines for macadam pavements. M.Eng thesis. University of Pretoria,Pretoria.Roads: Materials and construction Chapter 861
GUIDELINES FOR <strong>HUMAN</strong> <strong>SETTLEMENT</strong> <strong>PLANNING</strong> <strong>AND</strong> DESIGNGRANULAR BASES (DRY <strong>AND</strong> MODERATE REGIONS)1998PAVEMENT CLASS <strong>AND</strong> DESIGN BEARING CAPACITY (80 kN AXLES/LANE)ROAD CATEGORYUA: Trunk roads,primary distributors,freeways, majorarterials and by-passesES0,0030,1-0,3x10 4ES0,010,3-1,0x10 4ES0,031,0-3,0x10 4ES0,13,0-10x10 4ES0,30,1-0,3x10 6ES10,3-1,0x10 6ES31,0-3,0x10 640A125 G2150 C340A150 G2150 G5ES103,0-10x10 640A150 G2250 C3ES3010-30x10 650A150 G1250 C3ES10030-100x10 650A150 G1300 C3FoundationUB: District andlocal distributors,minor arterials andcollectors, industrialroads, goods-areas and bus routesS125 G4150 C4S150 G4150 G5S*/30A150 G3150 C4S*/30A150 G3150 G540A150 G2200 C430A150 G2200 G5150 G7150 G9G10UC: Residentialaccess collectors, carparks and lightlytrafficked bus routesS100 G5125 C4S125 G4125 G6S125 G5125 C4S125 G4150 G6S125 G4125 C4S125 G4150 G5S150 G3150 C4S150 G3150 G5UD: Local accessroads, -loops, -ways,-courts, -strips andculs de sacS1100 G5100 G7S1100 G5125 G7S1100 G4125 G7S1100 G4125 G6S1100 G5100 C4S125 G4125 G6S100 G5125 C4S125 G4150 G6S125 G5150 C4150 G9G10Symbol A denotes AG, AC, or AS.A0, AP may be recommended as a surfacing measure for improved skid resistance when wet or to reduce water sprayS denotes Double Surface Treatment (seal or combinations of seal and slurry)S1 denotes Single Surface Treatment* If seal is used, increase C4 and G5 subbase thickness to 200mm. m.Most likely combinations of roadcategory and design bearing capacity.62Chapter 8Roads: Materials and construction
GUIDELINES FOR <strong>HUMAN</strong> <strong>SETTLEMENT</strong> <strong>PLANNING</strong> <strong>AND</strong> DESIGNGRANULAR BASES (WET REGIONS)PAVEMENT CLASS <strong>AND</strong> DESIGN BEARING CAPACITY (80 kN AXLES/LANE)ROAD CATEGORYES0,0030,1-0,3x10 4ES0,010,3-1,0x10 4ES0,031,0-3,0x10 4ES0,13,0-10x10 4ES0,30,1-0,3x10 6ES10,3-1,0x10 6ES31,0-3,0x10 6ES103,0-10x10 6ES3010-30x10 6UA: Trunk roads,primary distributors,freeways, majorarterials and by-passes30A150 G1**200 C3*40A150 G1300 C3(250 C3)*50A150 G1400 C3(300 C3)UB: District andlocal distributors,minor arterials andcollectors, industrialroads, goods-areas and bus routesS150 G2150 C4S150 G2200 G5S/30A150 G1**200 C440A150 G1300 C4*(250 C4)UC: Residentialaccess collectors, carparks and lightlytrafficked bus routesS100 G5125 C4S125 G4S125 G5125 C4S150 G4S125 G2150 C4S150 G2S150 G2**200 C4S150 G2125 G6150 G6150 G5150 G4UD: Local accessroads, -loops, -ways,-courts, -strips andculs de sacS1100 G5100 G7S1100 G5125 G7S1100 G4125 G7S1100 G4125 G6S1100 G5100 C4S125 G4125 G6S100 G5125 C4S150 G4150 G6S125 G5150 C4Symbol A denotes AG, AC, or AS.A0, AP may be recommended as a surfacing measure for improved skid resistance when wet or to reduce water sprayS denotes Double Surface Treatment (seal or combinations of seal and slurry)S1 denotes Single Surface Treatment* If water is prevented from entering the base, the subbase thickness may be reduced to the values indicated in brackets.** Base thickness may be reduced by 25 mm if cemented subbase thickness is increased by 50 mm.Most likely combinations of roadcategory and design bearing capacity.ES10030-100x10 61998Foundation150 G7150 G9G10150 G9G10Roads: Materials and construction Chapter 863
GUIDELINES FOR <strong>HUMAN</strong> <strong>SETTLEMENT</strong> <strong>PLANNING</strong> <strong>AND</strong> DESIGNCEMENTED BASESPAVEMENT CLASS <strong>AND</strong> DESIGN BEARING CAPACITY (80 kN AXLES/LANE)ROAD CATEGORYES0,0030,1-0,3x10 4ES0,010,3-1,0x10 4ES0,031,0-3,0x10 4ES0,13,0-10x10 4ES0,30,1-0,3x10 6ES10,3-1,0x10 6ES31,0-3,0x10 6ES103,0-10x10 6ES3010-30x10 6UA: Trunk roads,primary distributors,freeways,arterials and by-passes30A150 C3200 C4UB: District andlocal distributors,minor arterials andcollectors, industrialroads, goods-areas and bus routesS125 C3150 C4S125 C3200 C4S/30A150 C3*300 C4UC: Residentialaccess collectors, carparks and lightlytrafficked bus routesS100 C4100 G6S200 C3S125 C4125 G6S125 C3125 C4S150 C3150 C4UD: Local accessroads, -loops, -ways,-courts, -strips andculs de sacS1100 C4100 G8S1100 C4125 G8S1125 C4125 G7S1150 C4150 G7S125 C4125 G6S125 C4150 G6Symbol A denotes AG, AC, or AS.A0, AP may be recommended as a surfacing measure for improved skid resistance when wet or to reduce water sprayS denotes Double Surface Treatment (seal or combinations of seal and slurry)S1 denotes Single Surface Treatment* Crushing of cemented base may occurMost likely combinations of roadcategory and design bearing capacity.ES10030-100x10 6Foundation150 G7150 G9G10150 G9G1064Chapter 8Roads: Materials and construction
GUIDELINES FOR <strong>HUMAN</strong> <strong>SETTLEMENT</strong> <strong>PLANNING</strong> <strong>AND</strong> DESIGNChapter 8 Page 81ASPHALT HOT-MIX BASESPAVEMENT CLASS <strong>AND</strong> DESIGN BEARING CAPACITY ACITY (80 kN AXLES/LANE)ES30ES10ES3ES1ES0,3ES0,1ES0,03ES0,01ES0,003ROAD CATEGOR TEGORY10-30x10 63,0-10x10 6ES1001,0-3,0x10 630-100x10 650A0,3-1,0x10 60,1-0,3x10 63,0-10x10 41,0-3,0x10 40,3-1,0x10 40,1-0,3x10 440A120 BC40A90 BC180 BC450 C31998Foundation150 G740A80 BC300 C3250 C3400 C3UA: Trunk roads,primary distributors,freeways, majorarterials and by-passes30A80 BC30A80 BC200 C4300 C3UB: District andlocal distributors,minor arterials andcollectors, industrialroads, goods-loadingareas and bus routes150 G9G10150 G9UC: Residentialaccess collectors, carparks and lightlytrafficked ficked bus routesUD: Local accessroads, -loops, -ways,-courts, -strips andculs de sacG10Roads: Materials and construction Chapter 8Most likely combinations of roadcategory and design bearing capacity.Symbol A denotes AG, AC, or AS.A0, AP may be recommended as a surfacing measure for improved skid resistance when wet or to reduce water spraySymbol BC does not include LAMBS (BC1 Table 13)S denotes Double Surface Treatment (seal or combinations of seal and slurry)S1 denotes Single Surface Treatment65
GUIDELINES FOR <strong>HUMAN</strong> <strong>SETTLEMENT</strong> <strong>PLANNING</strong> <strong>AND</strong> DESIGNChapter 8 Page 82EMULSION-TREATED BASESPAVEMENT CLASS <strong>AND</strong> DESIGN BEARING CAPACITY ACITY (80 kN AXLES/LANE)ROAD CATEGOR TEGORYUA: Trunk roads,primary distributors,freeways, majorarterials and by-passesES0,0030,1-0,3x10 4ES0,010,3-1,0x10 4ES0,031,0-3,0x10 4ES0,13,0-10x10 4ES0,30,1-0,3x10 6ES10,3-1,0x10 6ES31,0-3,0x10 6ES103,0-10x10 640A125 E1250 C4ES3010-30x10 6UB: District andlocal distributors,minor arterials andcollectors, industrialroads, goods-loadingareas and bus routesS100 E2150 C4S125 E2150 G5S*/30A125 E2150 C4S*/30A150 E2150 G540A125 E1200 C440A150 E1150 C4UC: Residentialaccess collectors, carparks and lightlytrafficked ficked bus routesS 100 E3150 G6S100 E2150 G6S100 E2125 C4UD: Local accessroads, -loops, -ways,-courts, -strips andculs de sacS1100 E3100 G6S1100 E3125 G6Symbol A denotes AG, AC, or AS.A0, AP may be recommended as a surfacing measure for improved skid resistance when wet or to reduce water sprayS denotes Double Surface Treatment (seal or combinations of seal and slurry)S1 denotes Single Surface TreatmentMost likely combinations of roadcategory and design bearing capacity.ES10030-100x10 61998Foundation150 G7150 G9G10150 G9G1066Chapter 8Roads: Materials and construction
GUIDELINES FOR <strong>HUMAN</strong> <strong>SETTLEMENT</strong> <strong>PLANNING</strong> <strong>AND</strong> DESIGNMACADAM BASESPAVEMENT CLASS <strong>AND</strong> DESIGN BEARING CAPACITY ACITY (80 kN AXLES/LANE)ROAD CATEGOR TEGORYUA: Trunk roads,primary distributors,freeways, majorarterials and by-passesES0,0030,1-0,3x10 4ES0,010,3-1,0x10 4ES0,031,0-3,0x10 4ES0,13,0-10x10 4ES0,30,1-0,3x10 6ES10,3-1,0x10 6ES31,0-3,0x10 630 - 40A125 M150 C3ES103,0-10x10 640A150 M125 C3125 C4ES3010-30x10 650A150 M150 C3150 C3UB: District andlocal distributors,minor arterials andcollectors, industrialroads, goods-loadingareas and bus routesS100 M150 G5S125 M150 G5S or 30A125 M150 C440A125 M125 C4125 C4UC: Residentialaccess collectors, carparks and lightlytrafficked ficked bus routesS100 M100 C4S100 MS100 M125 C4S100 M150 G5S125 M100 C4S125 M125 G5150 G5UD: Local accessroads, -loops, -ways,-courts, -strips andculs de sacS1100 M150 G7S1100 M125 C4S1125 M150 G7S1100 M125 C4S1125 M150 G7S175 M125 C4S1150 M150 G775 M125 C4150 G7S100 M125 C4150 G7Symbol A denotes AG, AC, or AS.A0, AP may be recommended as a surfacing measure for improved skid resistance when wet or to reduce water sprayS denotes Double Surface Treatment (seal or combinations of seal and slurry)S1 denotes Single Surface TreatmentMost likely combinations of roadcategory and design bearing capacity.ES10030-100x10 61998Foundation150 G7150 G9G10150 G9G10Roads: Materials and construction Chapter 867
GUIDELINES FOR <strong>HUMAN</strong> <strong>SETTLEMENT</strong> <strong>PLANNING</strong> <strong>AND</strong> DESIGNROAD CATEGOR TEGORYUA: Trunk roads,primary distributors,freeways, majorarterials and by-passesUB: District andlocal distributors,minor arterials andcollectors, industrialroads, goods-loadingareas and bus routesUC: Residentialaccess collectors, carparks and lightlytrafficked ficked bus routesUD: Local accessroads, -loops, -ways,-courts, -strips andculs de sacBLOCK PAVEMENTS (MODERATE <strong>AND</strong> DRY REGIONS)PAVEMENT CLASS <strong>AND</strong> DESIGN BEARING CAPACITY ACITY (80 kN AXLES/LANE)ES0,0030,1-0,3x10 4ES0,010,3-1,0x10 4ES0,031,0-3,0x10 4ES0,13,0-10x10 4ES0,30,1-0,3x10 6ES10,3-1,0x10 6ES31,0-3,0x10 6ES103,0-10x10 6ES3010-30x10 660 S-AS-B or S-C20 SND125 C460 S-AS-B or S-C20 SND100 -150 G560 S-AS-B or S-C20 SND150 C460 S-AS-B or S-C20 SND150 G580 S-A20 SND100 C4100 C480 S-A20 SND125 C3125 C360 S-AS-B or S-C20 SND100 -125 G560 S-AS-B or S-C20 SND125 C460 S-AS-B or S-C20 SND125 C460 S-AS-B or S-C20 SND125 C480 S-AS-B or S-C20 SND150 C360 S-AS-B or S-C20 SND60 S-AS-B or S-C20 SND100 -125 G560 S-AS-B or S-C20 SND150 G5125 C4150 C4Most likely combinations of roadcategory and design bearing capacity.ES10030-100x10 61998Foundation150 G7150 G9G10150 G9G1068Chapter 8Roads: Materials and construction
GUIDELINES FOR <strong>HUMAN</strong> <strong>SETTLEMENT</strong> <strong>PLANNING</strong> <strong>AND</strong> DESIGNROAD CATEGORYUA: Trunk roads,primary distributors,freeways, majorarterials and by-passesUB: District andlocal distributors,minor arterials andcollectors, industrialroads, goods-areas and bus routesUC: Residentialaccess collectors, carparks and lightlytrafficked bus routesUD: Local accessroads, -loops, -ways,-courts, -strips andculs de sacES0,0030,1-0,3x10 4BLOCK PAVEMENTS (WET REGIONS)PAVEMENT CLASS <strong>AND</strong> DESIGN BEARING CAPACITY (80 kN AXLES/LANE)ES0,010,3-1,0x10 4ES0,031,0-3,0x10 4ES0,13,0-10x10 4ES0,30,1-0,3x10 6ES10,3-1,0x10 6ES31,0-3,0x10 6ES103,0-10x10 6ES3010-30x10 660 S-AS-B or S-C20 SND150 G560 S-AS-B or S-C20 SND150 C460-80 S-A20 SND125 C480 S-A20 SND150 C460 S-AS-B or S-C20 SND125 C4150 C4150 C460 S-AS-B or S-C20 SND100 -125 G560 S-AS-B or S-C20 SND100 C460 S-AS-B or S-C20 SND100-150 C4100-150 G560 S-AS-B or S-C20 SND60 S-AS-B or S-C20 SND150 G560 S-AS-B or S-C20 SND125 C460 S-AS-B or S-C20 SNDMost likely combinations of roadcategory and design bearing capacity.ES10030-100x10 61998Foundation150 G7150 G9G10150 G9G10Roads: Materials and construction Chapter 869
GUIDELINES FOR <strong>HUMAN</strong> <strong>SETTLEMENT</strong> <strong>PLANNING</strong> <strong>AND</strong> DESIGNTable A1:Cast in-situ block pavement codes for use in Figure A1ROUTE <strong>AND</strong> ENVIRONMENT CLASSIFICATIONDESIGN TRAFFIC DURING STRUCTURAL LIFE (E80)7 A AMinor arterial, dry climate, CBR 3-7 B BMinor arterial, dry climate, CBR >7 C BAccess street, wet climate, CBR 3-7 D C BAccess street, wet climate, CBR >7 E C BAccess street, dry climate, CBR 3-7 D C BAccess street, dry climate, CBR >7 E C B*Special precautions have to be taken if the design CBR
GUIDELINES FOR <strong>HUMAN</strong> <strong>SETTLEMENT</strong> <strong>PLANNING</strong> <strong>AND</strong> DESIGNAPPENDIX BEXAMPLES OF STRUCTURAL DESIGN BY THE CATALOGUE METHODA. EXAMPLE OF THE STRUCTURAL DESIGN OF A CATEGORY UB STREETSERVICE OBJECTIVE, STREET CHARACTERISTICS <strong>AND</strong> STREET PROFILEThe structural design of the pavements for a new residential area needs to be done. The layout plan andstormwater design have been completed. For the purpose of this example, the design of one of the streets will beconsidered. The following general information is available:• The pavement structure for a local distributor that will serve as a bus route needs to be designed. The facilitymust open for traffic in five years time.• The route is regarded as an important link in the transportation system.• Drainage will consist of a pipe system with kerbs and gutters. The pipe system is installed to avoid any futuredisruption on the bus route due to upgrading the drainage system.• The traffic is expected to exceed 700 vehicles per day with 15% being heavy vehicles, mostly buses. Theexpected annual average daily equivalent (AADE) design traffic is 180 E80s/lane/day for this route. (If the trafficinformation is not readily available from the planning office (or client body), consult and follow the guidelinesset out in the section on levels of service in this document).• The street surface will be paved because of the importance of the road and the volume of traffic.• A paved walkway and bus stops will be provided for pedestrian traffic, with controlled pedestrian crossings atintersections.Design pavement structures of different base types and compare these on the basis of present worth of life-cyclecosts before making a final selection.Street category:After consideration of the characteristics listed and consultation with the client, it is decided to design for acategory UB street.Design strategySelect analysis periodThe alignment will probably not change and therefore a period of 30 years is selected.Select structural design periodAs this is a new facility and there is considerable uncertainty about the traffic volume and growth rate, a periodof 15 years is selected. Therefore AP = 30 years; SDP = 15 years.Estimate design trafficThe current equivalent traffic (180 E80s/lane/day) is projected to the initial year using Equation 8.3 and thegrowth factor, g, from Table 8.8. The cumulative equivalent traffic over the structural design period (Equation8.5) is determined by multiplying the initial equivalent traffic by the cumulative growth factor, f, from Table 8.9.Because of the uncertainty regarding the traffic growth rate, a sensitivity analysis with growth rates rangingfrom 2 to 8 percent (higher values are unrealistic for this road) is done. Table B1 shows the cumulativeequivalent traffic and the applicable traffic class for a structural design period of 15 years. Regardless of theselected growth rate, the design traffic class is ES3.MaterialsTable B2 indicates the availability and cost of material. The unit prices listed are all 1995 prices.Roads: Materials and construction Chapter 871
GUIDELINES FOR <strong>HUMAN</strong> <strong>SETTLEMENT</strong> <strong>PLANNING</strong> <strong>AND</strong> DESIGNTable B1:Cumulative equivalent traffic and applicable traffic class for SDP = 15 yearsGROWTH g f CUMULATIVE DESIGNRATE (TABLE 8.8) (TABLE 8.9) EQUIVALENT TRAFFIC TRAFFIC CLASS(%) (E80s) OVER SDP (TABLE 8.5)2 1,10 6 440 1,3 x 10 6 ES34 1,22 7 600 1,7 x 10 6 ES36 1,34 9 010 2,2 x 10 6 ES38 1,47 10 700 2,8 x 10 6 ES3Table B2: Checklist of material availability and cost (base year 1995)3Symbol Code Material Availability Unit cost/mG1G2G3G4G5G6G7G8G9G10Graded crushed stoneGraded crushed stoneGraded crushed stoneNatural gravelNatural gravelNatural gravelGravel/soilGravel/soilGravel/soilGravel/soilBorrow pitR86,00R86,00R78,00R42,59R39,23R35,31R33,03R32,31R31,40R122,00R122,00R116,00R57,64R53,50R50,36R45,65R44,87R44,00- -C1 Cemented crushed stone or gravel ✔R106,05 R145,00C2 Cemented crushed stone or gravel ✗R102,00 R140,00C3 Cemented natural gravel ✔R63,00 R76,70C4 Cemented natural gravel✔R61,70 R71,70✔✔✔✔✔✔✔✔✔✗CommercialBEM Bitumen emulsion modified gravel ✗-BES Bitumen emulsion stabilised gravel ✗-BC1Hot -mix asphalt✔-BC2Hot -mix asphalt✔R320,00BC3Hot -mix asphalt✔-BSHot -mix asphalt✔-AGACASAOAPAsphalt surfacingAsphalt surfacingAsphalt surfacingAsphalt surfacingAsphalt surfacing✔✔✔✗✗-R350,00R430,00--S1S2S3S4S5S6S7S8S9Surface treatmentSurface treatmentSand sealCape sealSlurrySlurrySlurrySurface renewal (30%)Surface renewal (60%)✔✔✗✗✗✗✗✗✗R5,10/m 2R6,00/m2R2,35/m2R6,90/m2R561,00/m3-R616,00/m3R1,20/litreR2,03/litreWM1WM2PMDRWaterbound macadamSurface treatmentPenetration macadamDumprock✗✗✗✗R150,00/m3R150,00/m 3-R30,00/m 372Chapter 8Roads: Materials and construction
GUIDELINES FOR <strong>HUMAN</strong> <strong>SETTLEMENT</strong> <strong>PLANNING</strong> <strong>AND</strong> DESIGNCentre-line CBR5040302010Average(50th percentile)Area 1 Area 2 Area 3 Area 4 Area 500 500 1000 1500 2000 2500 3000 3500Longitudinal distance (m)Figure B1: Centre-line CBR-values for the examplesClimatic regionThe road lies within a moderate climatic region.Delineation of subgrade areas and design CBR of subgradeCentreline subgrade CBR values taken at 100m intervals:5;7;6;7;7;8;5;14;12;9;10;13;16;22;25;22;20;21;17;18;12;14;12;12;10;11;10;9;6;7;5;8;8;9.The given CBR values are illustrated in Figure B1. Visual inspection of the CBR values reveals five subgrade areas:Subgrade area 1 : CBR = 5;7;6;7;7;8;5Subgrade area 2 : CBR = 14;12;9;10;13;16Subgrade area 3 : CBR = 22;25;22;20;21;17;18Subgrade area 4 : CBR = 12;14;12;12;10;11;10;9Subgrade area 5 : CBR = 6;7;5;8;8;9.Table B3 gives the CBR percentile values and design CBR of the subgrade. Ten percent of the measured CBRvalues are allowed to be below the minimum specified for a particular material quality, and the design CBR ofthe subgrade is therefore determined by the 10 th percentile value of the measured CBR values.Structural design and pavement type selectionPavement type selectionFrom the section on materials and Table 8.17 it follows that a granular, cemented or asphalt hot-mix base layermay be used with cemented subbase layers recommended for the cemented and hot-mix base layers.Table B3:Design CBR of the subgrade in exampleSUBGRADEAREAPERCENTILEVALUES*50 % 10 %CBRCLASSDESIGNCBR OFSUBGRADE1 6,2 4,4 SG3 3 - 72 12,0 8,8 SG2 7 - 153 20,5 16,7 SG1 > 154 11,0 8,6 SG2 7 - 155 7,0 4,6 SG3 3 - 7Roads: Materials and construction Chapter 873
GUIDELINES FOR <strong>HUMAN</strong> <strong>SETTLEMENT</strong> <strong>PLANNING</strong> <strong>AND</strong> DESIGNSelected layersThe selected layers necessary for the different subgrade areas are given in Table B4 (according to Table 8.20).Possible pavement structuresTable B5 shows possible pavement structures according to the catalogue (category UB streets, class ES3 traffic).Using a surface treatment instead of the asphalt wearing course may result in a lower riding quality. As this is anurban road with relatively low speed restrictions, this should not be a problem. A double seal is therefore used forall the designs except the hot-mix asphalt base.Practical considerationsThe designer should consider the consequences, if any, of the practical considerations given in the sections on streetcategories and materials.Cost analysisConstruction costFor the comparison of different pavement options, the construction cost of only the subbase, base and surfacingneed be considered. These costs follow directly from the unit costs given in Table B2.Future maintenance and life-cycle strategyThe structural design period is 15 years and the analysis period 30 years. The future maintenance for eachpavement type can be estimated from Tables 8.16 and 8.17. Table B6 shows estimated maintenance measuresduring the life cycles of the different pavement options.Discount rateFor the purposes of this example, a discount rate of 8% is normally selected. However, it is better to do a sensitivityanalysis with discount rates of 6, 8 and 10%.Salvage value and road-user costsAlthough the salvage value and road-user costs may vary with pavement life, it is unlikely that the relative effectwill influence the present worth of costs significantly. This can be confirmed with trial values.Present worth of costsThe present worth of costs can be calculated from Equation 8.10. Table B7 shows the 1995 present worth of costsfor each pavement type, taking the construction cost and maintenance strategy from Table B6 into account. Thesensitivity analysis shows that the discount rate can vary from 6 to 10 percent without having a significant influenceon the present worth of costs.It also follows from Table B7 that the pavements with granular bases are significantly less costly than the others.Therefore, a pavement with a granular base will be selected. Considering the behaviour of the different pavementtypes (refer to the relevant section in this document) it is proposed that a structure with a granular base and acemented subbase should be used. Such a pavement will probably not show the cracking and crushing problemsof a pavement with a cemented base.74Chapter 8Roads: Materials and construction
GUIDELINES FOR <strong>HUMAN</strong> <strong>SETTLEMENT</strong> <strong>PLANNING</strong> <strong>AND</strong> DESIGNTable B4:Selected layers for the different subgrade areasSUBGRADE DESIGN LOWER SELECTED UPPER SELECTED TREATMENT OFAREA CBR LAYER LAYER IN-SITU SUBGRADE1 3 - 7 150 mm G9 150 mm G7 R+R* to 150 mm G102 7 - 15 - 150 mm G7 R+R to 150 mm G93 > 15 - - R+R to 150 mm G74 7 - 15 - 150 mm G7 R+R to 150 mm G95 3 - 7 150 mm G9 150 mm G7 R+R to 150 mm G10* R+R = Rip and re-compact.Table B5:Possible pavement structures for the design exampleS*/30AS*/30AS30 A150 G3150 G3125 C380 BC150 C4150 G5200 C4300 C3Table B6:Typical maintenance measures for the different flexible and semi-rigidpavement types over their life cyclesPAVEMENT TYPEBASE SUBBASE FOR SURFACINGMAINTENANCE MEASURESSTRUCTURALMAINTENANCEGranular Granular S1 (9 yrs) 40 AG (15 yrs)S1 (25 yrs)Cemented S1 (10 yrs) 35 AG (15 yrs)S1 (25 yrs)Cemented Cemented S1 (5 yrs) 150 G1+S2 (15 yrs)S1 (10 yrs)S1 (24yrs)Hot-mix asphalt Cemented S1 (12yrs) 30 AG (15 yrs)S1 (25yrs)Roads: Materials and construction Chapter 875
GUIDELINES FOR <strong>HUMAN</strong> <strong>SETTLEMENT</strong> <strong>PLANNING</strong> <strong>AND</strong> DESIGNTable B7: Present worth of costs (base year 1995)DISCOUNTED MAINTENANCE PRESENT WORTHINITIAL INITIAL COSTS/m 2 COSTS/m 2PAVEMENT STRUCTURE COSTS/m2 MAINTENANCE COSTS/m2(R) (R)(R) (R)DISCOUNT RATE DISCOUNT RATE6% 8% 10% 6% 8% 10%S2 6,00 S1 (9 yrs) 5,10 3,02 2,55 2,16150 G3 11,00 40 AG (15 yrs) 14,00 5,84 4,41 3,35150 G5 5,88 S1 (25 yrs) 5,10 1,19 0,74 0,4723,58 10,05 7,70 5,98 33,63 31,28 29,56S2 6,00 S1 (10 yrs) 5,10 2,85 2,36 1,97150 G3 11,70 35 AG (15 yrs) 12,25 5,11 3,86 2,93150 C4 9,26 S1 (25 yrs) 5,10 1,19 0,74 0,4726,96 9,15 6,96 5,37 36,11 33,92 32,3380 BC2 25,60 S1 (12 yrs) 5,10 2,53 2,03 1,62300 C4 18,90 30 AG (25 yrs) 10,50 2,45 1,53 0,97S1 (25 yrs) 5,10 1,19 0,74 0,4744,50 6,17 4,30 3,06 50,67 48,80 47,56S2 6,00 S1 (5 yrs) 5,10 3,81 3,47 3,17125 C3 7,88 S1 (10 yrs) 5,10 2,85 2,36 1,97200C4 12,34 150 G1 base (15 yrs) 12,90 5,38 4,07 3,09S2 (15 yrs) 6,00 2,50 1,89 1,44S1 (25 yrs) 5,10 1,26 0,80 0,5226,22 15,80 12,59 10,19 42,04 38,81 36,4176Chapter 8Roads: Materials and construction
GUIDELINES FOR <strong>HUMAN</strong> <strong>SETTLEMENT</strong> <strong>PLANNING</strong> <strong>AND</strong> DESIGNB. EXAMPLE OF THE STRUCTURAL DESIGN OF A CATEGORY UD STREETSERVICE OBJECTIVE, STREET CHARACTERISTICS <strong>AND</strong> STREET PROFILEThe residential street network needs to be designed for the same residential area as in the previous example. Thelayout plan and stormwater design have been completed. For the purpose of this example, the design of one ofthe streets will be considered. The following general information is available:• The pavement structure for a basic access street needs to be designed.• The route is not regarded as an important link in the transportation system.• Drainage will consist of a lined channel next to the roadway• The traffic is expected to be below 75 vehicles per day with very little heavy traffic (< 5%). Because of theabsence of economic activity the growth rate will be very low (< 2%).• The street has a steep slope in places and will be paved for erosion-protection reasons.• Pedestrian traffic will be accommodated on the roadway and children will probably use the street as aplayground.Design pavement structures with different base types and compare them on the basis of construction costs beforemaking a final selection.Street categoryAfter consideration of the characteristics listed, it is decided to design a category UD street.Estimate design trafficWith the expected traffic (< 75 vpd), very few heavy vehicles (< 5%) and low traffic growth rate (< 2%) thecalculated design traffic will not exceed 30 000 E80s even in 30 years. The street is therefore designed for an ES0,03pavement class.MaterialsThe same material availability and cost apply as for the previous example.Structural design and pavement type selectionFrom the section on materials and Table 8.17 it follows that pavements with a granular, cemented, paving block orwaterbound macadam base layer may be selected. The paving block structure will require a cemented subbasewhile the macadam base may be built with or without stabilising the subbase. The granular and cemented baselayers may be used with a granular subbase. The cemented base on a granular subbase is not regarded as a soundoption and will not be considered for further analysis. An emulsion-treated base layer may also be used with 1%emulsion and 1% cement (E3) at a cost of R71 (1995) per m 3 . The cost for the paving block layer is R24,80 (1995)per m 2 , including the sand bedding layer.Subgrade CBR and selected layersThe centreline CBR values are:12,12,10,11,10,9,6,7,5,8,8,9The subgrade is divided into two sections:Subgrade section 1: 12,12,10,11,10,9 with a 10 th percentile CBR value = 9,5Subgrade section 2: 6,7,5,8,8,9 with a 10 th percentile CBR value = 4,6The design CBR for subgrade section 1 is between 7 and 15 and no selected material will be imported. The in-situmaterial will be ripped and compacted to a G9 standard (CBR>7) for a depth of 150 mm.Roads: Materials and construction Chapter 877
GUIDELINES FOR <strong>HUMAN</strong> <strong>SETTLEMENT</strong> <strong>PLANNING</strong> <strong>AND</strong> DESIGNThe design CBR for subgrade section 2 is between 3 and 7 and selected material will be imported. The in-situmaterial will be ripped and compacted to a G10 standard (CBR>3) for a depth of 150 mm and 150 mm materialwith a CBR>7 will be imported.Possible pavement structuresTable B8 gives the design options for the basic access street, Category UD, pavement class ES0,03.Cost analysisOnly the construction cost is considered in Table B9. The granular and emulsion-treated base pavements may beconsidered as the mechanical construction options. The cost difference of 16,6% between these two options isregarded as significant (more than 10%).The paving block and macadam options may be considered labour-intensive construction. Although there is not asignificant difference in the cost of the block paving and the 75 mm macadam options, the block paving optiondoes offer the advantage of easy access to services if these are installed under the street, or crossing the street.Table B8:Possible pavement structures for the basic street design exampleS1100 G4125 G7S1125 M150 G7S175 M125 C4S1100 E3100 G660 S-B20 SNDTable B9:Construction cost for the pavement design options for the basic access streetexamplePAVEMENT CONSTRUCTION COST (R/m 2 )LAYER COSTTOTAL PAVEMENT COSTS1 5,10100 G4 4,26 13,49125G7 4,10S1 5,10125 WM 18,75 28,80150 G7 4,95S1 5,1075 WM 11,25 24,06125 C4 7,71S1 5,10100 E3 7,10 15,73100 G6 3,5360 S-B 22,80 24,8020 SND 2,0078Chapter 8Roads: Materials and construction
GUIDELINES FOR <strong>HUMAN</strong> <strong>SETTLEMENT</strong> <strong>PLANNING</strong> <strong>AND</strong> DESIGNAPPENDIX CMATERIAL TYPESMaterials for paved basic access streetsThe specific requirements of each of the material groups for use in paved basic access streets, according to theWeinert Classification are discussed separately below. It should be noted that for arterials, traditional materialspecifications must be adhered to.Basic crystalline rocksThe basic crystalline group of materials consists of those rock types which essentially have no quartz component.They include dolerite, gabbro, norite, basalt, greenschist amphibolite, etc. The pyroxene content (and possiblysome of the feldspar, to a lesser extent) in basic crystalline rocks generally decomposes to form expansive, highlyplastic smectite clays under wet conditions or where drainage is impeded. It should be noted that these claysmay also be encountered in dry areas as a result of palaeo-climates and weathering of materials with a naturalsmectite component.The presence of smectites is not always adequately shown by plasticity or strength testing and a durability milltest (Sampson and Netterberg 1988), is required to release the clays held in the aggregate. A maximum DMI of125 is permitted for these materials. In addition a dry aggregate impact value (AIV) (Sampson and Roux 1982)should be carried out and a maximum value of 29 is acceptable. Two samples should be soaked, one in waterand the other in ethylene glycol, before AIV tests are carried out on them. If the increase in AIV from the watersoakedto the glycol-soaked samples is more than five units, the material should be rejected. A first indicationof the possible presence of smectite clays can be obtained by immersing fragments of the material in ethyleneglycol - if they disintegrate within a couple of hours, there is a strong likelihood that smectites are present.Acid crystalline rocksThe main rock types comprising this group in South Africa are granite, felsite, gneiss, rhyolite and syenite.Quartz makes up a significant proportion of these rocks and, as a result of its hardness and durability, it usuallycomprises a major proportion of the residual material. Acid crystalline materials thus generally weather to asandy material comprising quartz, illite and kaolinite, all of these being relatively stable components. As longas the CBR strength at the expected moisture and density regimes is in excess of 50 and the plasticity index isless than 15 (Richards 1978) the material will perform satisfactorily in basic access streets. It is, however,important not to include lumps of oversize material which will break down under traffic and a maximum AIVof 30 is recommended.A number of problems with acid crystalline rock bases have been attributed to the addition of excessive plasticfines to improve workability. The common practice of adding plastic fines to non-plastic materials for thispurpose is discouraged, and where practised should be done only under strict supervision and with carefuljudgement.High silica rocksHigh silica rocks consist of quartzite, porphyry, hornfels and chert, where quartz or other siliceous materials -possibly with minor amounts of feldspar and clays - comprise the bulk of the rock. The materials are generallystrong (provided the grading is not too uniform) and durable and if the CBR strength exceeds 50 the materialshould perform adequately. It is highly unlikely that durability problems will be encountered with these materials.Care should be taken with the use of chert as this is often derived from the weathering of dolomite in South Africaand is in close association with manganiferous wads and clays, which can have significant plasticities.Arenaceous rocksArenaceous rocks are composed mostly of quartz, feldspars and clays, and occur as sandstone, mica schist,arkose, conglomerate and gritstone in South Africa. The clay minerals in the residual weathering products aregenerally inactive kaolinite and illite. Arenaceous rocks, apart from having a CBR of 50 at the expected in-situmoisture and density conditions, should have a 10% FACT value of not less than 140 kN (AIV not more than 27)and a soaked value of not less than 75% of the dry value where N < 5, and 55% where N > 10, in order toidentify potentially degrading materials. A maximum fineness product of 125 with a maximum of 35% passingRoads: Materials and construction Chapter 879
GUIDELINES FOR <strong>HUMAN</strong> <strong>SETTLEMENT</strong> <strong>PLANNING</strong> <strong>AND</strong> DESIGNthe 40 mesh sieve indicates an adequately durable material (Sampson 1988). If the cementing matrix is siliceousthe 10% FACT limit can be dropped to 110 kN.Argillaceous rocksLike basic crystalline materials, argillaceous rocks are particularly troublesome as road bases, as they have astrong tendency to slake and disintegrate on exposure to moisture. The rock types making up this group inSouth Africa are mostly shale, mudrock, phyllite and slate and they should be used in basic access streets withcare. The only argillaceous rocks which may be suitable are those relatively hard, partly weathered tounweathered, slightly baked mudrocks which could require extensive treatment (including blasting andcrushing) before use and are therefore often not cost-effective for lightly trafficked roads. Certain fissile shaleswhich can be ripped have been successfully used in lightly trafficked roads, particularly in moderate to drierareas where Weinert’s N-value exceeds about 3,5. Many mudrocks are likely to slake and disintegrate in service,usually leading to distress if drainage is poor. If no other materials are available, mudrocks can be considered,but their durability according to the recommendations of Venter (1988) should be investigated. A maximumfineness product (Sampson 1988) of 125 with not more than 35% passing the 40 mesh sieve will result in anadequately durable material.Carbonate rocksDolomite, limestone and marble are the main members of this group of rocks. Carbonate rocks are generallyunsuitable for base courses for basic access streets, as the unweathered rocks are extremely hard and requireblasting and crushing. Weathering of carbonate materials usually results in the rock proceeding directly intosolution and not forming adequate residual gravel suitable for base construction. The residual material tendsto be fine, consisting of insoluble residue and/or quartz or chert sand with a small quantity of hard, often coarsecalcareous and cherty gravel. Where dolomite contains an appreciable quantity of chert, this forms a goodgravel but it is classified as a high-silica material, as discussed previously.DiamictitesTillite and certain fault breccias are the sole representatives of this material group. The use of diamictite inroads has been investigated (Paige-Green 1984) and has been shown to perform well, even where existingspecifications are not met. The durability of some of these materials has sometimes been a problem and thefollowing limits for tillites are thus proposed (mostly after Paige-Green 1984):maximum PI: 13minimum CBR: 80min 10% FACT:180 kNmin soaked/dry ratio (10% FACT): 70 if N2minimum Washingtondegradation value: 55A maximum DMI and percentage passing the 40 mesh sieve of 125 and 35, respectively, identify materialsunlikely to degrade to plastic fines in service (Sampson 1988).Metalliferous rocksThis is a very restricted rock group in South Africa, consisting of ironstone, magnetite, haematite andmagnesite, which are primarily available as the waste products of iron and magnesium mines. These rocks’ veryhigh specific gravities result in excessive haulage costs and they are probably not viable construction materialsfor basic access streets. If they do, however, occur close to a road project, they can be used with no problems,as they are generally unweathered, already crushed and unlikely to degrade in service. They can, however, likemany waste materials, be fairly variable in quality and properties.PedocretesCalcretes and ferricretes (possibly with small quantities of silcretes) are the main pedocretes used in constructionin South Africa. Extensive work has been carried out on calcretes (Netterberg 1971; 1982; Lionjanga et al 1987a,1987b) while local work on the other materials has so far been minimal. It has been shown that calcretes, inparticular, exhibit self-cementation properties, and materials with high plasticities (up to 20% ) and poorgradings (up to 80% finer than 0,425 mm) have performed well in roads in southern Africa.80Chapter 8Roads: Materials and construction
GUIDELINES FOR <strong>HUMAN</strong> <strong>SETTLEMENT</strong> <strong>PLANNING</strong> <strong>AND</strong> DESIGNA maximum fineness product of 480, with up to 55% passing the 40 mesh sieve is allowable for pedogenic basematerials (Sampson 1988). However a minimum CBR of 50 should be obtained.SurfacingBitumen surfacings are described in CSRA 1998 and range from high-quality asphalt surfacings (<strong>CSIR</strong>, NITRR1987) to various surface treatments and slurry and sand seals (CSRA 1998). The use of asphalt surfacings (<strong>CSIR</strong>,NITRR 1987) is probably not affordable for basic access streets carrying less than 75 vehicles per day, but may bethe most cost-effective surfacing in the long term, particularly when the maintenance capability is low (SABITA1992). Traditional asphalt does not have the fatigue properties necessary to avoid cracking under the higherdeflections common to light pavement structures.It is recommended that the surfacing is applied with the prime objectives of waterproofing the underlyingpavement layers and providing an all-weather, passable, dust-proof road. Aspects such as bleeding should betolerated (Netterberg and Paige-Green 1988a) and high skid-resistance is not necessary on those access streetscarrying light traffic at low speeds (a PSV of 45-50 will usually be adequate) especially in built-up areas wheretraffic-calming measures can be justified.Some of the recommended limits for material properties (CSRA 1998) are probably too strict for basic accessstreets and relaxations may be implemented. The maximum chipping size recommended for basic access streetsis 13,2mm, in order to permit comfortable use of the street for pedestrians and as a recreational area associatedwith high-density housing. While dusty chippings should be avoided (unless carefully precoated), the use ofgraded gravel or “Otta” seals (Overby 1998) should be seriously considered. The use of a graded seal results ina smaller percentage of the aggregate being wasted after crushing and a smoother, less noisy pavement. Theyhave been found to absorb high deflections, require low maintenance, have a good resistance to hardening andbe very forgiving in terms of their construction.A relatively recent development in seals is the use of bitumen binders which have been modified by theaddition of finely ground rubber or an elastomer. These add significant elasticity to the surfacing which allowsit to deflect to a far greater extent without failing by fatigue. Although these binders are more expensive thantraditional binders, their cost-effectiveness in terms of years of useful service is usually far greater.The strength requirement of TRH14 (NITRR 1987) of a 10% FACT of not less than 210 kN is too strict for basicaccess streets, a value of 120 kN or even 80 kN being satisfactory elsewhere, provided the wet value is not lessthan 75% of the dry value (Netterberg and Paige-Green 1988a). It is recommended that a minimum soakedvalue of 80 kN should be taken as the limit for general use in basic access streets, provided the material isunlikely to disintegrate in service (e.g. mudrocks and weathered basic igneous rocks). The minimum aggregatecrushing value (ACV) should not be less than 30% with a similar value for the aggregate impact value beingrecommended, the latter test being much simpler and quicker (Sampson and Roux, 1982). With these weakeraggregates, only pneumatic tyred rollers should be used during rolling of the surfacing stone.Sands for slurry and sand seals should comply with the sand-equivalent requirements of TRH14 (<strong>CSIR</strong>, NITRR1987) but the grading requirements may be relaxed slightly if no better sand is available.It is expected that most basic access streets will be surfaced with single or Cape seals (CSRA 1998) and thefollowing specifications are thus recommended:Gradings:Nominal size: 13,2 m 9,5 mm% passing 13,2 mm 85-100% passing 9,5 mm 0-30 85-100% passing 6,7 mm 0-5 0-30% passing 4,75 mm - 0-5Other properties:Flakiness index:
GUIDELINES FOR <strong>HUMAN</strong> <strong>SETTLEMENT</strong> <strong>PLANNING</strong> <strong>AND</strong> DESIGNmaterial is economically available.Stabilised layersThe use of stabilisation for basic access streets is probably not cost-effective much of the time, unless no othersuitable materials are available. To adequately avoid carbonation of marginal materials stabilised with lime,cement, slagment or combinations of these (Netterberg and Paige-Green 1983), the stabiliser content should beequivalent to at least the initial consumption of lime (ICL) plus one percent. Bitumen emulsion stabilisation(using low residual emulsion contents) can be cost-effective for improving marginal materials.Bituminous stabilised sand basesThree sand-stabilisation techniques using bitumen or tar as a binder can be used (Theyse and Horak 1987) namely• the cold wet-mix process;• the foaming process; and• the hot-mix process.The sand used in the bituminous stabilised sand bases should contain between 5 and 20% material passing throughthe 75 mm sieve. If a particular sand type does not comply with the above criterion, filler should be added to the sand.Cut-back bitumen of a RC-250 or RC-2 grade or a cut-back tar of 15-35C EVT grade may be used in the cold wetmixprocess. For the foaming process a 60/70 penetration grade bitumen is normally used, but a 55-60 EVT tarmay also be used.The amount of binder used should preferably be determined by a factorial design method (Theyse and Horak1987). This will ensure that a true optimum binder content is determined.Stability criteria for basic access streets are 71 for the Hveem Rt value after moisture-vapour soak, and 200 kPa for vaneshear strength (Theyse and Horak 1987). Control during construction is also done with the vane shear (Marais 1966).Concrete blocksConcrete or clay blocks are also viable alternatives as a surfacing/base for basic access streets. Blocks are specifiedas fully interlocking paving blocks, partly interlocking paving blocks and non-interlocking blocks (Clifford 1984).The crushing strength of concrete blocks should be sufficient to avoid excessive breakage during handling. It ispossible to make concrete blocks for paving with local materials such as calcrete, laterite and silcrete, includingthe screened (and washed, if necessary) nodules (Netterberg and Paige-Green 1988a). Bedding sand should beangular with a maximum size of 9,5 mm. Material finer than 75 µm should constitute less than 15% (Shackel1979). For higher traffic volumes, the design requirements should be considered in more detail (UTG 2 1987).Material problemsIt is important to identify problem materials timeously. Particular note should be made of potentially problematicsubgrades, such as expansive clays, collapsible and dispersive soils and saline materials. Techniques have beensummarised by Netterberg (1988) and in the SAICE special publication on problem soils (SAICE 1985).The influence of these geotechnical problems associated with subgrades should not be underestimated for basicaccess streets where any differential movement in the soil may result in cracking. Poor or infrequent maintenance(e.g. crack-sealing, pothole-patching) will allow water access to a pavement which has not been designed to astandard which will allow for weakening by moisture ingress.Materials for unsealed streetsThe requirements of an ideal wearing course material for unsealed roads are as follows (mostly after Paige-Greenand Netterberg 1987):• stability, in terms of resistance to deformation under both wet and dry conditions (i.e. essentially resistance torutting and shearing of the wearing course);• ability to provide adequate protection to the subgrade by distributing the applied loads sufficiently;82Chapter 8Roads: Materials and construction
GUIDELINES FOR <strong>HUMAN</strong> <strong>SETTLEMENT</strong> <strong>PLANNING</strong> <strong>AND</strong> DESIGN• ability to provide an acceptably smooth and safe ride without excessive maintenance;• ability to shed water without excessive scouring or erosion;• freedom from excessive dust in dry weather;• freedom from excessive slipperiness in wet weather without excessive tyre wear;• resistance to the abrasion action of traffic;• freedom from oversize stones; and• low cost and ease of maintenance.Unsealed basic access streets in urban areas should be designed to satisfy these requirements as far as possible,especially with respect to providing adequate protection of the subgrade. Aspects such as slipperiness, dust andoversize material should be attended to whenever possible, but the prevailing traffic and local situation should betaken into account and reductions in standards may be allowed if:• the cost of alternative materials is prohibitive; and• the influence of these factors is acceptable to the community in terms of frequency and consequences.Earth streetsIf the in-situ material (subgrade) conforms with the specifications of normal wearing course materials (describedbelow), no imported layer is necessary. This is the most economic solution in many cases but it is important toensure that the material is capable of performing adequately. The in-situ material often needs only to be shapedand compacted to a density of not less than 95% Mod AASHTO. Problems with drainage and maintenance may,however, occur if the street is not raised (at least 300 mm) above natural ground level, and it is recommended that,as a minimum, the top-soil (containing vegetable matter) be removed over a width equal to the street and sidedrains,the side-drains are excavated, and the gravel from the side-drains is used to form the street. The side-drainsshould be below the level of the adjacent properties to avoid flooding of these properties during heavy storms.Many proprietary products are available which claim to “stabilise” and strengthen in-situ materials, but theeffectiveness and permanence of each need to be investigated before it is used. These products are mostly materialdependent,performing well with some materials and being totally ineffective with others.Gravel wearing coursesNumerous specifications for gravel wearing course materials exist in southern Africa (Netterberg and Paige-Green1988b), but the following performance-related specifications which were developed in southern Africa arerecommended for unsealed basic access streets (mostly after CSRA 1990):Maximum size:37,5mmOversize index (l o ): 0Shrinkage product (S p ): 100-240Grading coefficient (G c ): 16-34Soaked CBR:>15 at 95% Mod AASHTOdensityTreton impact value: 20 to 65wherel o = mass of material larger than 37,5mm in a bulk sample as a percentage of the total mass (Paige-Green 1988);S p =G c =product of linear shrinkage and percentage passing 0,425 mm (calculated as a percentage of the materialfiner than 37,5 mm);product of the percentage retained between the 26,5 mm and 2,0 mm sieves and the percentage passingthe 4,75 mm sieve/100.Roads: Materials and construction Chapter 883
GUIDELINES FOR <strong>HUMAN</strong> <strong>SETTLEMENT</strong> <strong>PLANNING</strong> <strong>AND</strong> DESIGNThe plasticity-grading relationship in terms of performance is illustrated graphically in Figure C1 with theperformance of the materials falling into each zone (A, B, C, etc) being identified.All material testing follows standard TMH 1 (CSRA 1986) methods, although particle size distributions (for both G cand S p ) are normalised for 100 per cent passing the 37,5 mm sieve (Paige-Green 1988). The performance illustratedin Figure C1 is that predicted by the two properties illustrated. Other aspects such as excessive oversize materialor soft aggregate will have separate effects on the performance. An advantage of the figure is that theconsequences of being slightly out from the ideal specification can be judged and the acceptably of using thesematerials can then be evaluated.Specific characteristics and problems related to the various Weinert material groups identified previously aresummarised below:Basic crystalline rocksBasic igneous rocks generally provide good wearing course materials but commonly contain rounded(“spheroidal”) cobbles and boulders formed during weathering, particularly in the drier areas (Weinert N > 5).All of the cobbles and boulders must be removed (generally by hand, as they will not be broken down by a gridroller) prior to use of the material in unsealed roads, in order to eliminate their influence on riding quality andfacilitate easy maintenance. In the intermediate areas (N = 2 to 5), the material often weathers to a sandymaterial (e.g. “sugar dolerite”), which makes a good wearing course but may corrugate quite badly. In thewetter areas (N < 2) basic crystalline rocks usually weather to a high plasticity material which becomes slipperywhen wet and dusty when dry.Field evidence indicates that the use of basic crystalline rocks with few spheroidal boulders (less than 5 percentby mass larger than 37,5 mm), a plasticity index (PI) between 6 and 12 and a linear shrinkage of between 3 and6 result in acceptable performance with minimal maintenance. A shrinkage product of less than 240 isrecommended to minimise dust.Acid crystalline rocksThese materials generally weather to a low-plasticity, sandy material with a few large, round boulders of hardrock. Corrugations are a significant problem on many streets constructed with acid crystalline rocks but regularmaintenance with a simple tyre, brush or other type of drag can remove the corrugations. A PI of at least 6 willgenerally give good results, but in drier areas (N > 5) a PI higher than this (> 12) is recommended. Acid crystallinematerials tend to be less dusty than most other materials, particularly in arid areas.Shrinkage product (Sp)50040030020010000DSlipperyE1AGood (but may be dusty)CErodible materialsRavelsE2GoodBRavels and corrugates10 20 30 40 50Grading coefficient (Gc)Figure C1: Relationship between shrinkage product, grading coefficient and performance (CSRA 1990)84Chapter 8Roads: Materials and construction
GUIDELINES FOR <strong>HUMAN</strong> <strong>SETTLEMENT</strong> <strong>PLANNING</strong> <strong>AND</strong> DESIGNHigh silica rocksSuitable high-silica rocks for gravel wearing course are chert and quartz porphyry, both providing good wearingcourses, provided the large stones are removed (especially from the chert gravels) but often producing dustyconditions - especially in wet areas. These materials often have a lack of fines and low plasticity which resultsin ravelling and corrugation development. Some plasticity (a linear shrinkage of more than 3) is necessary toavoid the formation of severe corrugations.Arenaceous rocksThese materials either tend to weather to very sandy materials with little coarse aggregate or else coarse gravelswith a lot of oversize, which will not break down adequately under a grid roller (particularly siliceoussandstones and quartzites). Without crushing, the latter materials are generally unsuitable. The softersandstones (Treton value higher than 65) tend to break down and form potholes while if the linear shrinkageis less than about 3, corrugations tend to develop. The plasticity index is not a suitable indicator of performance.Argillaceous rocksArgillaceous rocks tend to be very stony or very clayey, depending on the weathering environment and theirstage of weathering, and are invariably extremely dusty. In wet weather the argillaceous materials tend tobecome slippery due to their high clay-mineral content. The fissile (laminated) shales provide a relatively goodwearing course, but the angular fragments frequently cause tyre damage and make the road difficult tomaintain. Argillaceous rocks are therefore not recommended for wearing course unless well fragmented andtreated with an appropriate dust palliative.CarbonatesThese materials seldom form an adequate quantity of material for the establishment of a viable borrow-pit insouthern Africa, and are not considered as suitable wearing course materials. Many South African cherts(classified as high-silica materials) usually contain fragments of dolomite in their aggregate component.DiamictitesWeathered diamictites have been successfully used as wearing course gravels, provided the erratic content(medium to large boulders of hard material, especially quartzite) is not too high. Their glacial origin results ina tendency to be relatively variable, and some of the tillites may form excessive plastic material that results inslippery streets when wet, while most weathered tillites give dusty conditions.Metalliferous rocksBecause of the hardness, low plasticity and high specific gravity (resulting in high haulage costs) that are typicalof these materials, they are not particularly suitable for unsealed streets. In mining areas, some waste may besuitable as a wearing course for unsealed streets but local experience will be the best guide. If the plasticity istoo low (mostly the case) corrugations can be expected. Because most gravels in this class have been producedby mining and crushing, they tend to be dusty.PedocretesPedocretes are potentially the most important materials for unsealed streets in southern Africa, with calcretebeing widespread in the more arid areas and ferricrete predominating in the less arid eastern areas of SouthAfrica. Sources with good properties for unsealed road construction are, however, rapidly being used up indeveloping areas. The performance of calcrete wearing courses is generally good (although the materials areoften extremely dusty and may contain large cobbles and boulders which are not easily broken down duringconstruction). Ferricretes are equally satisfactory materials but like calcretes are likely to contain an excess ofoversize material which should be removed or adequately broken down. Pedocretes with a PI of between 6 and15 have provided good performance in wet and dry areas of southern Africa.Roads: Materials and construction Chapter 885
GUIDELINES FOR <strong>HUMAN</strong> <strong>SETTLEMENT</strong> <strong>PLANNING</strong> <strong>AND</strong> DESIGNStabilised earth streetsThe use of lime- or cement-stabilised earth streets is common in certain parts of Europe (Kézdi 1979) and couldpossibly be considered for local application. No research has as yet been carried out on these materials locally, butthe problem of carbonation (Netterberg and Paige-Green 1983) and the potential loss of strength resulting fromthis process may be significant. However, it is considered that, even with carbonation, the ravelling and abrasionwill probably be less than with a natural gravel although maintenance may be a problem as the loose material islikely to be non-plastic (and very dusty). Further research into this possible solution is necessary but, for the present,its use should be based on sound engineering judgement.Dust palliativesIt is often difficult to obtain materials which will provide a dust-free surface. Dust palliatives are chemical orbituminous agents which are mixed into the upper parts or sprayed on the surface of a gravel wearing course andbind the finer portions of the gravel, thus reducing dust. A wide variety of dust palliatives is available and economicanalyses need to be carried out for each product in each situation to determine their viability. The social impact ofdust is, however, difficult to quantify in economic terms but should not be neglected from any analyses. Recentresearch has shown that the deliquescent products (usually calcium chloride), the ligno sulphonates, certainpolymers and some liquid chemical stabilisers (LCS) can provide good dust palliation, cost-effectively. Dustpalliatives have been fully discussed earlier in this chapter.Most dust palliatives have so far been tested on rural and inter-urban roads. The environment in a residential areais completely different in terms of drainage, traffic volumes and speed, intersections, etc. One aspect which needsto be considered is the ease of maintenance of treated roads. Road surfaces which are treated with products thatdo not penetrate into the layer cannot easily be maintained once potholes and ravelling initiates. Similarly,materials which strengthen the road considerably (e.g. liquid chemical stabilisers) do not allow grader maintenanceshould large stones protrude from the surface, as they are not easily plucked out and lead to unacceptableroughness. The optimum solution is to mix appropriate products through the layer, ensuring that all large stones(greater than 37,5 mm) are removed from the wearing course material.No general guideline for dust palliatives is currently available but a research project involving a performancerelatedstudy of a limited number of generic dust palliatives is in progress.86Chapter 8Roads: Materials and construction
GUIDELINES FOR <strong>HUMAN</strong> <strong>SETTLEMENT</strong> <strong>PLANNING</strong> <strong>AND</strong> DESIGNRECOMMENDED READINGClifford, J M (1984). Structural design of segmentalblock pavements for southern Africa. NITRR TechnicalReport RP/9/84, <strong>CSIR</strong>, Pretoria.<strong>CSIR</strong>, National Institute for Transport and RoadResearch (1985). Guidelines for road constructionmaterials. TRH 14, <strong>CSIR</strong>, Pretoria.<strong>CSIR</strong>, National Institute for Transport and RoadResearch (1987). Selection and design of hot-mixasphalt surfacings for highways. 47 pp, Draft TRH 8,<strong>CSIR</strong>, Pretoria.CSRA (1986). Standard methods of testing roadconstruction materials. Technical Methods forHighways, No 1, 2nd Edition, 232 pp, CSRA, Pretoria.CSRA (1990). The structural design, construction andmaintenance of unpaved roads. Draft TRH 20, CSRA.CSRA (1998). Surfacing seals for rural and urban roads.Technical Recommendations for Highways. (DraftTRH,3) CSRA, Pretoria.KÈzdi, A (1979). Stabilized earth roads. 327 pp.Elsevier, Amsterdam.Lionjanga, A V, Toole, T A and Newill, D (1987a).Development of specifications for calcretes inBotswana. Transportation Research Record, No 1106,Vol 1, pp 281-304. Washington, DC.Lionjanga, A V, Toole, T and Greening, P A K (1987b).The use of calcrete in paved raoads in Botswana. Proc9th Reg Conf Africa Soil Mech Foundn Engn, Vol 1, pp489-502, Lagos.Marais, C P (1966). A new technique to controlcompaction of bitumen-sand mixes on the road usinga Vane shear apparatus. The Civil Engineer in SouthAfrica, Vol 121, No 3, March, (NITRR Report RR74).Netterberg, F (1971). Calcrete in road construction.Bulletin 10. NITRR, <strong>CSIR</strong>, Pretoria.Netterberg, F (1982). Behaviour of calcretes as flexiblepavement materials in southern Africa. Proc 11thAustralian Road Research Board Conference, Part 3, pp60-69, Melbourne.Netterberg, F (1988). Geotechnical problems withroads in southern Africa. Road Infrastructure Course,Vol 1, 37 pp, Roads and Transport Technology, <strong>CSIR</strong>,Pretoria.Netterberg, F and Paige-Green, P (1983). Carbonationof lime and cement stabilized layers in roadconstruction. NITRR Report RS/3/84, <strong>CSIR</strong>, Pretoria.Netterberg, F and Paige-Green P (1988a). Pavementmaterials for low volume roads in southern Africa: Areview. Proc 8th Quinquennial Convention of SAfrican Inst Civil Engnrs and Annual TransportationConvention, Vol 2D, Paper 2D2, Pretoria.Netterberg, F and Paige-Green, P (1988b). Wearingcourses for unpaved roads in southern Africa. Areview. Proc 8th Quinquennial Convention of SAfrican Inst Civil Engnrs and Annual TransportationConvention, Vol 2D, Paper 2D5, Pretoria.Overby, C (1998). Otta Seal: A durable and costeffectivesolution for low volume sealed roads. 9 thREAAA Conference, May, Wellington, New Zealand.Paige-Green, P (1984). The use of tillite in flexiblepavements in southern Africa. Proc 8th Reg ConfAfrica Soil Mech Foundn Engng, Vol 1, pp 321-327,Harare.Paige-Green, P (1988). A revised method for the sieveanalysis of wearing course materials for unpavedroads. DRTT Report DPVT-C14.1, <strong>CSIR</strong>, Pretoria.Paige-Green, P and Netterberg, F (1987).Requirements and properties of wearing coursematerials for unpaved roads in relation to theirperformance. Transportation Research Record, No1106, pp 208-214, Transportation Research Board,Washington, DC.Richards, R G (1978). Lightly trafficked roads insouthern Africa. A review of practice andrecommendations for design. NITRR Report RP/8/78, 35pp, <strong>CSIR</strong>, Pretoria.Sampson, L R (1988). Material dependent limits for theDurability Mill Test. DRTT Report DPVTC-57.1, <strong>CSIR</strong>,Pretoria.Sampson, L R and Netterberg, F (1988). The durabilitymill: A performance-related durability test forbasecourse aggregates. Submitted to The CivilEngineer in South Africa.Sampson, L R and Roux, P L (1982). The aggregateimpact value test as an alternative method forassessment of aggregate strength in a dry state. NITRRTechnical Note TS/3/82, 27 pp, <strong>CSIR</strong>, Pretoria.Shackel, B. (1979) A pilot study of the performance ofblock paving under traffic using a Heavy VehicleSimulator. Proceedings of the Symposium on precastconcrete paving blocks, Johannesburg.South African Bitumen and Tar Association (SABITA)(1992. Appropriate standards for bituminoussurfacing. SABITA Manual 10. Cape Town.Roads: Materials and construction Chapter 887
GUIDELINES FOR <strong>HUMAN</strong> <strong>SETTLEMENT</strong> <strong>PLANNING</strong> <strong>AND</strong> DESIGNSouth African Institution of Civil Engineers (SAICE)(1985). Problems of soils in South Africa - state of theart. The Civil Engineer in South Africa, pp 367-407.Theyse, H and Horak, E (1987). A literature survey onbituminous stabilized sand bases. National Institutefor Transport and Road Research. Technical NoteTN/35/87, <strong>CSIR</strong>, Pretoria.Urban Transport Guideline (UTG) (1987). Structuraldesign of segmental block pavements for southernAfrica. Draft UTG2, <strong>CSIR</strong>, Pretoria.Venter, J P (1988). Guidelines for the use of mudrock(shale and mudstone) in road construction in SouthAfrica. NITRR Technical Note TS/7/87, 27 pp, <strong>CSIR</strong>,Pretoria.88Chapter 8Roads: Materials and construction
Chapter 9Water supply9
GUIDELINES FOR <strong>HUMAN</strong> <strong>SETTLEMENT</strong> <strong>PLANNING</strong> <strong>AND</strong> DESIGNTABLE OF CONTENTSSCOPE . . . . . . . . . . . . . . . . . . . . . . . . . . . . . . . . . . . . . . . . . . . . . . . . . . . . . . . . . . . . . . . . . . . . . . . . . . . 1INTRODUCTION. . . . . . . . . . . . . . . . . . . . . . . . . . . . . . . . . . . . . . . . . . . . . . . . . . . . . . . . . . . . . . . . . . . . 1THE IMPORTANCE OF HYGIENE PROMOTION IN WATER SUPPLY <strong>AND</strong> SANITATION . . . . . . . . . . . . . . . 2Introduction . . . . . . . . . . . . . . . . . . . . . . . . . . . . . . . . . . . . . . . . . . . . . . . . . . . . . . . . . . . . . . . . . . . . . . 2What is hygiene promotion and education? . . . . . . . . . . . . . . . . . . . . . . . . . . . . . . . . . . . . . . . . . . . . . 2<strong>PLANNING</strong>: OVERVIEW . . . . . . . . . . . . . . . . . . . . . . . . . . . . . . . . . . . . . . . . . . . . . . . . . . . . . . . . . . . . . 3General . . . . . . . . . . . . . . . . . . . . . . . . . . . . . . . . . . . . . . . . . . . . . . . . . . . . . . . . . . . . . . . . . . . . . . . . . . 3Purpose of the water supply. . . . . . . . . . . . . . . . . . . . . . . . . . . . . . . . . . . . . . . . . . . . . . . . . . . . . . . . . . 4Objectives . . . . . . . . . . . . . . . . . . . . . . . . . . . . . . . . . . . . . . . . . . . . . . . . . . . . . . . . . . . . . . . . . . . . . . . . 4Strategies . . . . . . . . . . . . . . . . . . . . . . . . . . . . . . . . . . . . . . . . . . . . . . . . . . . . . . . . . . . . . . . . . . . . . . . . 4By-laws . . . . . . . . . . . . . . . . . . . . . . . . . . . . . . . . . . . . . . . . . . . . . . . . . . . . . . . . . . . . . . . . . . . . . . . . . . 4Planning activities. . . . . . . . . . . . . . . . . . . . . . . . . . . . . . . . . . . . . . . . . . . . . . . . . . . . . . . . . . . . . . . . . . 4<strong>PLANNING</strong>: REPORTS . . . . . . . . . . . . . . . . . . . . . . . . . . . . . . . . . . . . . . . . . . . . . . . . . . . . . . . . . . . . . . . 5Project reports . . . . . . . . . . . . . . . . . . . . . . . . . . . . . . . . . . . . . . . . . . . . . . . . . . . . . . . . . . . . . . . . . . . . 5Feasibility reports . . . . . . . . . . . . . . . . . . . . . . . . . . . . . . . . . . . . . . . . . . . . . . . . . . . . . . . . . . . . . . . . . . 5Water demand . . . . . . . . . . . . . . . . . . . . . . . . . . . . . . . . . . . . . . . . . . . . . . . . . . . . . . . . . . . . . . . . . . . . 5Water conservation and -demand management (DWAF 2002) . . . . . . . . . . . . . . . . . . . . . . . . . . . . . . . 5General . . . . . . . . . . . . . . . . . . . . . . . . . . . . . . . . . . . . . . . . . . . . . . . . . . . . . . . . . . . . . . . . . . . . . . . . . . 6Wastewater disposal. . . . . . . . . . . . . . . . . . . . . . . . . . . . . . . . . . . . . . . . . . . . . . . . . . . . . . . . . . . . . . . . 6Project business plans . . . . . . . . . . . . . . . . . . . . . . . . . . . . . . . . . . . . . . . . . . . . . . . . . . . . . . . . . . . . . . . 6WATER QUALITY. . . . . . . . . . . . . . . . . . . . . . . . . . . . . . . . . . . . . . . . . . . . . . . . . . . . . . . . . . . . . . . . . . . 6General . . . . . . . . . . . . . . . . . . . . . . . . . . . . . . . . . . . . . . . . . . . . . . . . . . . . . . . . . . . . . . . . . . . . . . . . . . 6Diseases associated with water. . . . . . . . . . . . . . . . . . . . . . . . . . . . . . . . . . . . . . . . . . . . . . . . . . . . . . . . 8Water quality . . . . . . . . . . . . . . . . . . . . . . . . . . . . . . . . . . . . . . . . . . . . . . . . . . . . . . . . . . . . . . . . . . . . . 8Stability of water supplies . . . . . . . . . . . . . . . . . . . . . . . . . . . . . . . . . . . . . . . . . . . . . . . . . . . . . . . . . . . 8WATER SOURCES. . . . . . . . . . . . . . . . . . . . . . . . . . . . . . . . . . . . . . . . . . . . . . . . . . . . . . . . . . . . . . . . . . . 8Springs . . . . . . . . . . . . . . . . . . . . . . . . . . . . . . . . . . . . . . . . . . . . . . . . . . . . . . . . . . . . . . . . . . . . . . . . . . 8Wells . . . . . . . . . . . . . . . . . . . . . . . . . . . . . . . . . . . . . . . . . . . . . . . . . . . . . . . . . . . . . . . . . . . . . . . . . . . 10Boreholes . . . . . . . . . . . . . . . . . . . . . . . . . . . . . . . . . . . . . . . . . . . . . . . . . . . . . . . . . . . . . . . . . . . . . . . 11Water supply Chapter 9i
GUIDELINES FOR <strong>HUMAN</strong> <strong>SETTLEMENT</strong> <strong>PLANNING</strong> <strong>AND</strong> DESIGNRainwater . . . . . . . . . . . . . . . . . . . . . . . . . . . . . . . . . . . . . . . . . . . . . . . . . . . . . . . . . . . . . . . . . . . . . . . 12Fog harvesting . . . . . . . . . . . . . . . . . . . . . . . . . . . . . . . . . . . . . . . . . . . . . . . . . . . . . . . . . . . . . . . . . . . 13Surface water . . . . . . . . . . . . . . . . . . . . . . . . . . . . . . . . . . . . . . . . . . . . . . . . . . . . . . . . . . . . . . . . . . . . 13Bulk-supply pipelines . . . . . . . . . . . . . . . . . . . . . . . . . . . . . . . . . . . . . . . . . . . . . . . . . . . . . . . . . . . . . . 13WATER TREATMENT . . . . . . . . . . . . . . . . . . . . . . . . . . . . . . . . . . . . . . . . . . . . . . . . . . . . . . . . . . . . . . . 13General . . . . . . . . . . . . . . . . . . . . . . . . . . . . . . . . . . . . . . . . . . . . . . . . . . . . . . . . . . . . . . . . . . . . . . . . . 13Package water treatment plants . . . . . . . . . . . . . . . . . . . . . . . . . . . . . . . . . . . . . . . . . . . . . . . . . . . . . 14WATER SUPPLY OPTIONS . . . . . . . . . . . . . . . . . . . . . . . . . . . . . . . . . . . . . . . . . . . . . . . . . . . . . . . . . . . 15Selection of water supply terminals . . . . . . . . . . . . . . . . . . . . . . . . . . . . . . . . . . . . . . . . . . . . . . . . . . . 15Public or communal water supply terminals. . . . . . . . . . . . . . . . . . . . . . . . . . . . . . . . . . . . . . . . . . . . . 15Handpump installations . . . . . . . . . . . . . . . . . . . . . . . . . . . . . . . . . . . . . . . . . . . . . . . . . . . . . . . . . . . . 18Private water supply terminals . . . . . . . . . . . . . . . . . . . . . . . . . . . . . . . . . . . . . . . . . . . . . . . . . . . . . . . 18DESIGN CRITERIA FOR WATER DISTRIBUTION <strong>AND</strong> STORAGE SYSTEMS . . . . . . . . . . . . . . . . . . . . . . . 19General . . . . . . . . . . . . . . . . . . . . . . . . . . . . . . . . . . . . . . . . . . . . . . . . . . . . . . . . . . . . . . . . . . . . . . . . . 19Water demand . . . . . . . . . . . . . . . . . . . . . . . . . . . . . . . . . . . . . . . . . . . . . . . . . . . . . . . . . . . . . . . . . . . 20Factors influencing water demand . . . . . . . . . . . . . . . . . . . . . . . . . . . . . . . . . . . . . . . . . . . . . . . . . . . . 21Non-domestic water demand in developing areas. . . . . . . . . . . . . . . . . . . . . . . . . . . . . . . . . . . . . . . . 21Water demand for stock. . . . . . . . . . . . . . . . . . . . . . . . . . . . . . . . . . . . . . . . . . . . . . . . . . . . . . . . . . . . 21Water demand in developed areas. . . . . . . . . . . . . . . . . . . . . . . . . . . . . . . . . . . . . . . . . . . . . . . . . . . . 21Peak factors . . . . . . . . . . . . . . . . . . . . . . . . . . . . . . . . . . . . . . . . . . . . . . . . . . . . . . . . . . . . . . . . . . . . . 23Peak factors for developed areas . . . . . . . . . . . . . . . . . . . . . . . . . . . . . . . . . . . . . . . . . . . . . . . . . . . . . 24Storage . . . . . . . . . . . . . . . . . . . . . . . . . . . . . . . . . . . . . . . . . . . . . . . . . . . . . . . . . . . . . . . . . . . . . . . . . 24Residual pressures in developing and developed areas . . . . . . . . . . . . . . . . . . . . . . . . . . . . . . . . . . . . 24Hydraulic formulae for sizing components. . . . . . . . . . . . . . . . . . . . . . . . . . . . . . . . . . . . . . . . . . . . . . 24WATER TRANSMISSION . . . . . . . . . . . . . . . . . . . . . . . . . . . . . . . . . . . . . . . . . . . . . . . . . . . . . . . . . . . . . 24General . . . . . . . . . . . . . . . . . . . . . . . . . . . . . . . . . . . . . . . . . . . . . . . . . . . . . . . . . . . . . . . . . . . . . . . . . 24Canals . . . . . . . . . . . . . . . . . . . . . . . . . . . . . . . . . . . . . . . . . . . . . . . . . . . . . . . . . . . . . . . . . . . . . . . . . . 25Water tankers . . . . . . . . . . . . . . . . . . . . . . . . . . . . . . . . . . . . . . . . . . . . . . . . . . . . . . . . . . . . . . . . . . . . 25PIPELINE DESIGN . . . . . . . . . . . . . . . . . . . . . . . . . . . . . . . . . . . . . . . . . . . . . . . . . . . . . . . . . . . . . . . . . . 25Basic requirements . . . . . . . . . . . . . . . . . . . . . . . . . . . . . . . . . . . . . . . . . . . . . . . . . . . . . . . . . . . . . . . . 25Pipes laid above ground . . . . . . . . . . . . . . . . . . . . . . . . . . . . . . . . . . . . . . . . . . . . . . . . . . . . . . . . . . . . 26iiChapter 9Water supply
GUIDELINES FOR <strong>HUMAN</strong> <strong>SETTLEMENT</strong> <strong>PLANNING</strong> <strong>AND</strong> DESIGNVALVES <strong>AND</strong> OTHER FITTINGS . . . . . . . . . . . . . . . . . . . . . . . . . . . . . . . . . . . . . . . . . . . . . . . . . . . . . . . 26General . . . . . . . . . . . . . . . . . . . . . . . . . . . . . . . . . . . . . . . . . . . . . . . . . . . . . . . . . . . . . . . . . . . . . . . . . 26Isolating valves . . . . . . . . . . . . . . . . . . . . . . . . . . . . . . . . . . . . . . . . . . . . . . . . . . . . . . . . . . . . . . . . . . . 26Air valves. . . . . . . . . . . . . . . . . . . . . . . . . . . . . . . . . . . . . . . . . . . . . . . . . . . . . . . . . . . . . . . . . . . . . . . . 26Scour valves and outlets . . . . . . . . . . . . . . . . . . . . . . . . . . . . . . . . . . . . . . . . . . . . . . . . . . . . . . . . . . . . 27Anti-vacuum valves . . . . . . . . . . . . . . . . . . . . . . . . . . . . . . . . . . . . . . . . . . . . . . . . . . . . . . . . . . . . . . . . 27Break-pressure devices . . . . . . . . . . . . . . . . . . . . . . . . . . . . . . . . . . . . . . . . . . . . . . . . . . . . . . . . . . . . . 27Marker posts . . . . . . . . . . . . . . . . . . . . . . . . . . . . . . . . . . . . . . . . . . . . . . . . . . . . . . . . . . . . . . . . . . . . . 27Anchorage and thrust blocks . . . . . . . . . . . . . . . . . . . . . . . . . . . . . . . . . . . . . . . . . . . . . . . . . . . . . . . . 27Surge control . . . . . . . . . . . . . . . . . . . . . . . . . . . . . . . . . . . . . . . . . . . . . . . . . . . . . . . . . . . . . . . . . . . . 27Valve chambers . . . . . . . . . . . . . . . . . . . . . . . . . . . . . . . . . . . . . . . . . . . . . . . . . . . . . . . . . . . . . . . . . . . 27WATER STORAGE . . . . . . . . . . . . . . . . . . . . . . . . . . . . . . . . . . . . . . . . . . . . . . . . . . . . . . . . . . . . . . . . . 27General . . . . . . . . . . . . . . . . . . . . . . . . . . . . . . . . . . . . . . . . . . . . . . . . . . . . . . . . . . . . . . . . . . . . . . . . . 27Reservoir storage . . . . . . . . . . . . . . . . . . . . . . . . . . . . . . . . . . . . . . . . . . . . . . . . . . . . . . . . . . . . . . . . . 27Other storage reservoirs . . . . . . . . . . . . . . . . . . . . . . . . . . . . . . . . . . . . . . . . . . . . . . . . . . . . . . . . . . . . 28Location of service reservoirs . . . . . . . . . . . . . . . . . . . . . . . . . . . . . . . . . . . . . . . . . . . . . . . . . . . . . . . . 28Intermediate storage . . . . . . . . . . . . . . . . . . . . . . . . . . . . . . . . . . . . . . . . . . . . . . . . . . . . . . . . . . . . . . 29DISTRIBUTION NETWORKS . . . . . . . . . . . . . . . . . . . . . . . . . . . . . . . . . . . . . . . . . . . . . . . . . . . . . . . . . . 29General . . . . . . . . . . . . . . . . . . . . . . . . . . . . . . . . . . . . . . . . . . . . . . . . . . . . . . . . . . . . . . . . . . . . . . . . . 29General requirements for distribution network design . . . . . . . . . . . . . . . . . . . . . . . . . . . . . . . . . . . . 29Residual pressures. . . . . . . . . . . . . . . . . . . . . . . . . . . . . . . . . . . . . . . . . . . . . . . . . . . . . . . . . . . . . . . . . 30MATERIALS . . . . . . . . . . . . . . . . . . . . . . . . . . . . . . . . . . . . . . . . . . . . . . . . . . . . . . . . . . . . . . . . . . . . . . 30Considerations in the selection of materials . . . . . . . . . . . . . . . . . . . . . . . . . . . . . . . . . . . . . . . . . . . . .30Materials for pipelines . . . . . . . . . . . . . . . . . . . . . . . . . . . . . . . . . . . . . . . . . . . . . . . . . . . . . . . . . . . . . 30Materials for communication pipes . . . . . . . . . . . . . . . . . . . . . . . . . . . . . . . . . . . . . . . . . . . . . . . . . . . 31Materials for reservoirs . . . . . . . . . . . . . . . . . . . . . . . . . . . . . . . . . . . . . . . . . . . . . . . . . . . . . . . . . . . . . 31CONSTRUCTION . . . . . . . . . . . . . . . . . . . . . . . . . . . . . . . . . . . . . . . . . . . . . . . . . . . . . . . . . . . . . . . . . . 32General . . . . . . . . . . . . . . . . . . . . . . . . . . . . . . . . . . . . . . . . . . . . . . . . . . . . . . . . . . . . . . . . . . . . . . . . . 32National Standardised Specifications for Engineering Construction . . . . . . . . . . . . . . . . . . . . . . . . . . 32Watertightness test. . . . . . . . . . . . . . . . . . . . . . . . . . . . . . . . . . . . . . . . . . . . . . . . . . . . . . . . . . . . . . . . 32Disinfection of reservoirs and elevated storage facilities . . . . . . . . . . . . . . . . . . . . . . . . . . . . . . . . . . . 32Water supply Chapter 9iii
GUIDELINES FOR <strong>HUMAN</strong> <strong>SETTLEMENT</strong> <strong>PLANNING</strong> <strong>AND</strong> DESIGNMarkers for valves and hydrants. . . . . . . . . . . . . . . . . . . . . . . . . . . . . . . . . . . . . . . . . . . . . . . . . . . . . . 32MANAGEMENT OF WATER DISTRIBUTION SYSTEMS . . . . . . . . . . . . . . . . . . . . . . . . . . . . . . . . . . . . . . 32General . . . . . . . . . . . . . . . . . . . . . . . . . . . . . . . . . . . . . . . . . . . . . . . . . . . . . . . . . . . . . . . . . . . . . . . . . 32Unaccounted-for water. . . . . . . . . . . . . . . . . . . . . . . . . . . . . . . . . . . . . . . . . . . . . . . . . . . . . . . . . . . . . 32Metering . . . . . . . . . . . . . . . . . . . . . . . . . . . . . . . . . . . . . . . . . . . . . . . . . . . . . . . . . . . . . . . . . . . . . . . . 32PROVISION OF WATER FOR FIRE-FIGHTING . . . . . . . . . . . . . . . . . . . . . . . . . . . . . . . . . . . . . . . . . . . . . 33General . . . . . . . . . . . . . . . . . . . . . . . . . . . . . . . . . . . . . . . . . . . . . . . . . . . . . . . . . . . . . . . . . . . . . . . . . 33Scope of the SABS Code of Practice 090:1972 . . . . . . . . . . . . . . . . . . . . . . . . . . . . . . . . . . . . . . . . . . . 33Fire-risk categories . . . . . . . . . . . . . . . . . . . . . . . . . . . . . . . . . . . . . . . . . . . . . . . . . . . . . . . . . . . . . . . . 33Fire protection in general. . . . . . . . . . . . . . . . . . . . . . . . . . . . . . . . . . . . . . . . . . . . . . . . . . . . . . . . . . . 34Water supply for fire-fighting . . . . . . . . . . . . . . . . . . . . . . . . . . . . . . . . . . . . . . . . . . . . . . . . . . . . . . . 34Design of trunk mains . . . . . . . . . . . . . . . . . . . . . . . . . . . . . . . . . . . . . . . . . . . . . . . . . . . . . . . . . . . . . 35Water storage . . . . . . . . . . . . . . . . . . . . . . . . . . . . . . . . . . . . . . . . . . . . . . . . . . . . . . . . . . . . . . . . . . . . 35Reticulation mains . . . . . . . . . . . . . . . . . . . . . . . . . . . . . . . . . . . . . . . . . . . . . . . . . . . . . . . . . . . . . . . . 35Hydrants . . . . . . . . . . . . . . . . . . . . . . . . . . . . . . . . . . . . . . . . . . . . . . . . . . . . . . . . . . . . . . . . . . . . . . . . 36Isolating valves . . . . . . . . . . . . . . . . . . . . . . . . . . . . . . . . . . . . . . . . . . . . . . . . . . . . . . . . . . . . . . . . . . . 36Fire protection in developing and rural areas . . . . . . . . . . . . . . . . . . . . . . . . . . . . . . . . . . . . . . . . . . . 36GLOSSARY. . . . . . . . . . . . . . . . . . . . . . . . . . . . . . . . . . . . . . . . . . . . . . . . . . . . . . . . . . . . . . . . . . . . . . . 38BIBLIOGRAPHY <strong>AND</strong> RECOMMENDED READING . . . . . . . . . . . . . . . . . . . . . . . . . . . . . . . . . . . . . . . . . 38ivChapter 9Water supply
GUIDELINES FOR <strong>HUMAN</strong> <strong>SETTLEMENT</strong> <strong>PLANNING</strong> <strong>AND</strong> DESIGNLIST OF TABLESTable 9.1 Management guidelines for water service providers . . . . . . . . . . . . . . . . . . . . . . . . . . . . . . . . . . . .1Table 9.2 Broad approach to contents of planning reports . . . . . . . . . . . . . . . . . . . . . . . . . . . . . . . . . . . . . . .7Table 9.3 Factors for obtaining reliable yield estimates of spring water . . . . . . . . . . . . . . . . . . . . . . . . . . . .10Table 9.4 Recommended test and duration to estimate subsurface water yield . . . . . . . . . . . . . . . . . . . . . .12Table 9.5 Treatment selection criteria . . . . . . . . . . . . . . . . . . . . . . . . . . . . . . . . . . . . . . . . . . . . . . . . . . . . . .15Table 9.6 Selection criteria for water supply terminals . . . . . . . . . . . . . . . . . . . . . . . . . . . . . . . . . . . . . . . . .16Table 9.7 Typical discharge rates for taps (assumed efficiency rate 80%) . . . . . . . . . . . . . . . . . . . . . . . . . . .17Table 9.8 Communication pipes across roads for house connections . . . . . . . . . . . . . . . . . . . . . . . . . . . . . . .19Table 9.9 Communication pipes on near side of road for house connections . . . . . . . . . . . . . . . . . . . . . . . .19Table 9.10 Water demand for developing areas . . . . . . . . . . . . . . . . . . . . . . . . . . . . . . . . . . . . . . . . . . . . . . .20Table 9.11Water consumption in areas equipped with standpipes, yard connections and houseconnections . . . . . . . . . . . . . . . . . . . . . . . . . . . . . . . . . . . . . . . . . . . . . . . . . . . . . . . . . . . . . . . . . . .20Table 9.12 Non-domestic water demand . . . . . . . . . . . . . . . . . . . . . . . . . . . . . . . . . . . . . . . . . . . . . . . . . . . . .21Table 9.13 Water demand for stock . . . . . . . . . . . . . . . . . . . . . . . . . . . . . . . . . . . . . . . . . . . . . . . . . . . . . . . . .21Table 9.14 Water demand for developed areas . . . . . . . . . . . . . . . . . . . . . . . . . . . . . . . . . . . . . . . . . . . . . . . .22Table 9.15 Peak factors for developing areas . . . . . . . . . . . . . . . . . . . . . . . . . . . . . . . . . . . . . . . . . . . . . . . . . .23Table 9.16 Elevated storage capacity . . . . . . . . . . . . . . . . . . . . . . . . . . . . . . . . . . . . . . . . . . . . . . . . . . . . . . . .28Table 9.17 Residual pressures . . . . . . . . . . . . . . . . . . . . . . . . . . . . . . . . . . . . . . . . . . . . . . . . . . . . . . . . . . . . . .29Table 9.18 Design fire flow . . . . . . . . . . . . . . . . . . . . . . . . . . . . . . . . . . . . . . . . . . . . . . . . . . . . . . . . . . . . . . . .35Table 9.19 Duration of design fire flow . . . . . . . . . . . . . . . . . . . . . . . . . . . . . . . . . . . . . . . . . . . . . . . . . . . . . .35Table 9.20 Fire-flow design criteria for reticulation mains . . . . . . . . . . . . . . . . . . . . . . . . . . . . . . . . . . . . . . . .36Table 9.21 Location of hydrants . . . . . . . . . . . . . . . . . . . . . . . . . . . . . . . . . . . . . . . . . . . . . . . . . . . . . . . . . . . .36Water supply Chapter 9v
GUIDELINES FOR <strong>HUMAN</strong> <strong>SETTLEMENT</strong> <strong>PLANNING</strong> <strong>AND</strong> DESIGNLIST OF FIGURESFigure 9.1 Development stages for water supply and sanitation projects . . . . . . . . . . . . . . . . . . . . . . . . . . . .3Figure 9.2 Details of spring chamber . . . . . . . . . . . . . . . . . . . . . . . . . . . . . . . . . . . . . . . . . . . . . . . . . . . . . . . . .9Figure 9.3 Layout of spring protection works for multiple spring eyes . . . . . . . . . . . . . . . . . . . . . . . . . . . . .9Figure 9.4 Hand-dug well . . . . . . . . . . . . . . . . . . . . . . . . . . . . . . . . . . . . . . . . . . . . . . . . . . . . . . . . . . . . . . . . .10Figure 9.5 Arrangement for diverting the “first foul flush” . . . . . . . . . . . . . . . . . . . . . . . . . . . . . . . . . . . . . .12Figure 9.6 Various surface water intake configurations . . . . . . . . . . . . . . . . . . . . . . . . . . . . . . . . . . . . . . . . .14Figure 9.7 Typical standpipe detail . . . . . . . . . . . . . . . . . . . . . . . . . . . . . . . . . . . . . . . . . . . . . . . . . . . . . . . . .17Figure 9.8 The Durban yard tank . . . . . . . . . . . . . . . . . . . . . . . . . . . . . . . . . . . . . . . . . . . . . . . . . . . . . . . . . .18Figure 9.9 Annual average daily water demand for erven in developed areas . . . . . . . . . . . . . . . . . . . . . . . .20Figure 9.10Factor for obtaining the peak flow in mains for low-cost housing, incorporating individualon-site storage . . . . . . . . . . . . . . . . . . . . . . . . . . . . . . . . . . . . . . . . . . . . . . . . . . . . . . . . . . . . . . . .23Figure 9.11 Factor for obtaining the peak flow in mains in developed areas . . . . . . . . . . . . . . . . . . . . . . . . . .24viChapter 9Water supply
GUIDELINES FOR <strong>HUMAN</strong> <strong>SETTLEMENT</strong> <strong>PLANNING</strong> <strong>AND</strong> DESIGNSCOPEThese guidelines cover aspects that need to beconsidered when planning and implementing watersupply projects for existing residential areas anddeveloping communities. The guidelines will also beof assistance where a Water Services Authoritycompiles a Water Services Development Plan (thelatter forms part of a municipality’s IntegratedDevelopment Plan).The guidelines assist in determining and settingobjectives, developing a strategy and identifying therequired planning activities for implementing waterservices. Technical guidelines are given for use infeasibility studies and the detailed design of watersupply elements.The guidelines form part of a planned series ofmanagement guidelines intended for use by decisionmakers.The series of guidelines is shown in Table 9.1.INTRODUCTIONWater services (i.e. water supply and sanitation) inSouth Africa are controlled by the Water Services Act(Act 108 of 1997) and the National Water Act (Act 36of 1998). The Water Services Act deals with waterservices provision to consumers, while the NationalWater Act deals with water in its natural state.Central to the supply of water to a community is theWater Services Development Plan of the relevantWater Services Authority, which is required in terms ofthe Water Services Act. The Water ServicesDevelopment Plan defines the minimum as well as thedesired level of water service for communities, whichmust be adhered to by a Water Services Provider in itsarea of jurisdiction. It describes the arrangements forwater service provision in an area, both present andfuture. Water services are also to be provided inaccordance with by-laws made in terms of the WaterServices Act.Engineers and other decision-makers within a WaterServices Authority, and those working for and onbehalf of the Water Services Authority, should beaware of the social and organisational constraints inthe provision of potable water. The issues relating tothese constraints must be addressed in the objectivesof any water supply project, keeping in mind that thesanitation arrangements for a community areinextricably bound to the process (see Chapter 10).The principles of sustainability, affordability,effectiveness, efficiency and appropriateness shouldbe kept uppermost in supplying water to a community.These and other important issues are dealt with underthe relevant headings in this chapter.Table 9.1: Management guidelines for water service providers (Palmer DevelopmentGroup 1994)NAME TYPE AUTHORURBAN SERVICE PROVIDERSOrganisational arrangements for service providers Institutional PDGConsumer profile and demand for services Economic PDGPreparation of a water services development plan Planning PDGWater supply tariff setting Finance PDGSanitation tariff setting Finance PDGReporting Management PDGGuidelines for private sector participation Institutional PybusRURAL SERVICE PROVIDERSEstablishing effective service providersInstitutionalIMPLEMENTING AGENTSGuidelines for local authorities and developers (urban) Planning PDGSeries of guidelines for rural areas Technical <strong>CSIR</strong>DESIGNERSRed Book Technical <strong>CSIR</strong>COMMUNITY LEADERSGuidelines for community leaders (urban) General PDGGuidelines for community leaders (rural) General <strong>CSIR</strong>Water supply Chapter 91
GUIDELINES FOR <strong>HUMAN</strong> <strong>SETTLEMENT</strong> <strong>PLANNING</strong> <strong>AND</strong> DESIGNTHE IMPORTANCE OF HYGIENEPROMOTION IN WATER SUPPLY <strong>AND</strong>SANITATIONIntroductionThe principal purpose of programmes to improvewater supply and sanitation is to improve health. Onthe other hand, the mere provision of water andsanitation infrastructure will not, in itself, improvehealth. To get the maximum benefit out of animproved water supply and sanitation infrastructure,people need to be supported with information thatwill enhance these benefits. This form of information,and the imparting of skills, is called hygiene education.Hygiene promotion and education provides peoplewith information that they can use to change theirbehavioural patterns in order to improve their health.Changes in behaviour do not come automatically, butalso have a motivational component. In manyinstances incentives are necessary to induce a changein behaviour, the major incentive being the benefitderived from changed behaviour.An important lesson learnt during the InternationalDrinking Water Supply and Sanitation Decade is thatgood coverage – providing a large number of peoplewith access to facilities – does not equal success orsustainability. Because water supply and sanitationfacilities are subject to misuse, non-use, or breakdown,international donors and national governments alikehave come to recognise that the sustainability ofsystems is of critical importance. Apart from a sense ofownership of the facilities, it also means thatcommunities should adopt hygiene practices that willhelp them realise the health benefits of water supplyand sanitation improvements. Hygiene promotion andeducation is a key component of the effort to achievethese health benefits.To achieve sustainable water supply and sanitationdevelopment requires effective complementary inputssuch as community participation, community capacitybuildingand community training. International trendsand research have indicated that hygiene promotionand education plays a major role in breaking down thetransmission of diseases that are affecting many ruralcommunities in the developing world.In South Africa it is essential to understand theattitudes and behaviours of developing communitiestowards water, sanitation and hygiene. Mostdeveloping communities rely on the government tomake sure that their water supply and sanitationprojects are sustainable, but it is necessary for thecommunity itself to contribute to the sustainability ofits projects, as well as to the development of anappropriate hygiene-promotion and educationprogramme. It is at community level that real decisionson hygiene promotion and education should be made,but these communities need information to be able tomake decisions reflecting their aspirations, desires andneeds.For guidelines on implementing a project with theabove elements, see Appendix A of Chapter 10.What is hygiene promotion andeducation?Hygiene promotion and education is not aboutcoercion, but about bringing change in the behaviourpatterns of people, to make them aware of thediseases related to unhygienic practices, poor watersupply and improper sanitation. It forms an integralpart of any water and sanitation developmentprogramme.Hygiene promotion and education comprises a broadrange of activities aimed at changing attitudes andbehaviours, to break the chain of disease transmissionassociated with inadequate water supply andsanitation. It is the process of imparting knowledgeregarding the links between health, water andsanitation, and seeking to provide people withinformation that they can use to change theirbehavioural patterns so that they can improve theirhealth. It is about keeping well, about a better qualityof life and about recognising that the majority ofillnesses that kill children can be associated with poorsanitation practices and inadequate or unsafe watersupplies. It is a primary intervention that, likeimmunisation but much more cheaply, aims atpreventing illness or minimising the risk of infection.A definition of hygiene promotion and education thatemphasises activities aimed at changing attitudes andbehaviours must recognise that behavioural changecannot be effected from outside the communities. Theindividuals in the community must want to change,and only they can effect sustainable change. The roleof the external agent can be only that of a catalyst andof providing (or broadening) awareness. Furthermore,the role of women cannot be overemphasised. Womenare the latent forces for change in local communities,and their empowerment and involvement areprerequisites to the success of a community-basedhealth or hygiene education and awarenessprogramme or campaign.It is now recognised worldwide that hygienepromotion and education is an important channel tolink newly installed facilities to improved health.Improved water supply and sanitation systems willreduce the persistence and prevalence of diseases.2Chapter 9Water supply
GUIDELINES FOR <strong>HUMAN</strong> <strong>SETTLEMENT</strong> <strong>PLANNING</strong> <strong>AND</strong> DESIGN<strong>PLANNING</strong>: OVERVIEWGeneralThe provision of water to a community has to followthe same route as any other project, in that it has to gothrough a series of distinct stages between the initialconceptualisation and the time when the project iscompleted. These stages, shown in Figure 9.1, can besummarised as follows:• Identification and preparation comprise the preinvestmentplanning stages.• Approval is the stage at which decision-makers,including financiers, determine whether or not aproject will become a reality.• Implementation is the stage at which detaileddesigns are completed and the project facilities arebuilt and commissioned; supporting activities suchas staff training are also undertaken.• Operation is the stage during which the projectfacilities are integrated with the existing system toprovide improved services.• Evaluation, the final stage, determines whatlessons have been learned so that future projectscan be improved accordingly.It is important that the project be undertaken within aframework of clear objectives, aimed at ensuringmaximum operational effectiveness, as well assustainability on completion.Technical guidelines should be assessed in the contextof the operational goals set for the water supply, andadjustments made to take into account factors such aslevels of income, availability of funds and the ability ofthe community to operate and maintain the service.Sustainability of the service is the most importantcriterion that must be addressed in the planningphase.The planning process should produce reports thatdefine the purpose and objectives of the water supplyand set the broad strategy for reaching the objectives.These reports act as overall guidelines and assist in thegeneration and selection of the alternativetechnologies that could be used in the provision of thewater supply. The community to be served should beinvolved in the planning process.Where the upgrading or rehabilitation of an existingwater supply scheme is contemplated, a thoroughinvestigation of existing supply arrangements isrequired. Eliminating water theft, reducingunaccounted-for water and improving recoverymechanisms could render capital works unnecessary, orpostpone them.Figure 9.1: Development stages for water supply and sanitation projectsWater supply Chapter 93
GUIDELINES FOR <strong>HUMAN</strong> <strong>SETTLEMENT</strong> <strong>PLANNING</strong> <strong>AND</strong> DESIGNPurpose of the water supplyEstablish the purpose of the water supply. Why is thewater supply needed? Who will use the water and forwhat activities? What is the problem with the currentsituation and how will the proposed water supplyproject alleviate the problem?ObjectivesSet broad objectives, or goals, first for the operationalphase and then for the project phase. It is important tolook at operational objectives first, and use these toestablish the objectives for the project phase,otherwise there is a risk that the water supply systemwill operate inefficiently, even if the project phase wascompleted successfully.The objectives of a water supply project should includethe following:• the provision of water for domestic consumptionand personal hygiene in terms of the WaterServices Authority’s by-laws (government policyrequires that a minimum of 25 litres per person perday be provided);• the improvement of the quality of the existingsupplies (protection of the sources being the firstconsideration);• the improvement of the availability of water to thecommunity (both reliability and accessibility);• community involvement (acceptability) andcommitment;• the improvement of public health;• the improvement of the living standards of thecommunity;• the development of local technical, financial andadministrative skills; and• the improvement of the economic potential of thecommunity (e.g. small-scale agriculture andindustries).StrategiesAn overall strategy is needed to guide the projectthrough various stages into the operational phase.By-lawsNote should be taken of the by-laws of the WaterServices Authority. The following aspects are ofparticular importance where Water ServicesDevelopment Plans are incomplete or unclear:AdministrationThe community should be involved in the planning,implementation and maintenance phases of theproject (preferably through an independentcommittee of community representatives).FinanceSubsidisation of the scheme by bodies outside thecommunity is restricted to the provision of the basiclevel of service prescribed in government policydocuments. The community must also be able to bearthe operational costs involved. There are, however,exceptions to the rule, which can be found in thepolicy documents.No water supply system should be planned in theabsence of a tariff structure and expense-recoverymechanism, agreed to by the client community. Theclient community must be able to pay for its basicoperation and maintenance, with due regard to thefree basic water policy of the National Government.Development impactMaximum use should be made of local manpower andmaterials, with training given where appropriate.Where possible, local contractors and entrepreneursshould be employed. However, the technologiesemployed – including labour-based constructionmethods – should be cost-effective.HealthThe improvement of the quality of services should bedriven by increased community awareness of healthrelatedproblems and their causes. For example,improvements in living standards and public health ina community may be impossible to achieve unlesshygiene education is provided and sanitationimprovements are made concurrently with animprovement in water supply.Planning activitiesThe objectives, strategy and policies must providesound guidelines for formulating and executing theactivities, tasks and sub-tasks required to reach thegiven set of objectives.The completion of an activity should result in anobjective being met. For example, an objective couldbe the commissioning of a single element of the watersupply that is needed to achieve the overall purpose ofthe whole scheme.4Chapter 9Water supply
GUIDELINES FOR <strong>HUMAN</strong> <strong>SETTLEMENT</strong> <strong>PLANNING</strong> <strong>AND</strong> DESIGN<strong>PLANNING</strong>: REPORTSProject reportsIn the absence of other guidelines on a project report,the format and contents of the reports should followthe following format.Feasibility reportsFeasibility reports should cover any factors that couldbe relevant to the detailed planning and design of anew water supply scheme, or the upgrading of anexisting one. Some analyses that should be consideredin the feasibility study are given in the documentsreferred to in Table 9.1.Water demandFuture water demand is one of the key issues in watersupply planning. The following important pointsregarding the demographic and economic situationsdetermining future water demand should correspondwith the contents of the Water Services DevelopmentPlan.The demographic and service information requiredincludes:• the current population;• the number of households;• the number of residential consumer units;• the incomes related to these consumer units;• the number and type of non-residential consumerunits;• current levels of water service;• current consumption; and• the demand for services, in terms of willingness topay for the services desired.The information required to make proper projectionsof future requirements includes:• population growth;• economic growth;• growth in number of consumer units;• level of service provided to residential consumerunits;• changes in income levels of residential consumerunits;• changes in consumption per consumer unit;• effects of water-metering programmes; and• weather patterns and climate.Water conservation and demandmanagement (DWAF 2002)One of major impediments to the implementation ofwater conservation and demand management at alocal level is the lack of social awareness andunderstanding about these topics among bothconsumers and water service institutions/authorities. Ifnot implemented in an integrated, targeted andstrategic manner, social awareness campaigns willhave limited success in achieving the desired behaviourchange in water use patterns. Social awarenesscampaigns need time, energy and resources, and thosepromoting water demand awareness need to adopt asingle, consistent message.Attempts to implement water conservation anddemand management have generally focused onnarrow, technical solutions. However, successfulimplementation is as much about raising awareness asit is about technical interventions. As social awarenessis often implemented in conjunction with othermeasures, gauging its impact on consumer demand isnot easy, making it a less attractive option comparedto those that provide quick, clear and good results.Awareness-raising is also perceived either as difficultto implement, or simply about making posters orpamphlets. Those involved in raising awareness aboutwater issues do not approach it from the type ofmarketing perspective needed to sell a product or aconcept.Raising awareness about water demand has to beapproached in a strategic manner. Changing themindsets and behaviour of both water users andmanagers is a fundamental component of waterconservation and water demand management. It isone of the first steps that must be taken in anintegrated water demand management strategy inorder to achieve the acceptability and buy-in necessaryfor more technical measures to succeed. Water usersand consumers should not be the only targets ofeducation and awareness campaigns; rather,campaigns should be specifically targeted at allstakeholders, including water services institutions,local government, etc.Raising awareness about water conservation andwater demand management issues facilitates changesin behaviour, as knowledge about the subject increasesthrough the education of stakeholders. Theeffectiveness of any awareness campaign is ultimatelymeasured by the results of the implemented waterconservation and water demand measures.Water supply Chapter 95
GUIDELINES FOR <strong>HUMAN</strong> <strong>SETTLEMENT</strong> <strong>PLANNING</strong> <strong>AND</strong> DESIGNTo be successful, any awareness/education campaignhas to be integrated, ongoing, relevant and targeted.Preliminary research is therefore necessary to developan understanding of the characteristics, conditions anddynamics of the context/community in whichawareness raising needs to be conducted. TheKnowledge, Attitudes and Practices (KAP) survey toolprovides a model for facilitating change on anindividual basis, to incorporate new practices that arebeing introduced.GeneralSeveral methods may be used to predict the futurepopulation. It is important to note that conditions inthis country differ to a great extent from those inother countries, and population growth is influencedby a host of demographic factors, which includemigration and urbanisation. It is therefore consideredimportant to consult demographers and townplanners, as they are best equipped to deal with theissues of socio-economic planning and hence thefuture population of a given area. Designers shouldtake note of the consequences of accepting anexcessive growth rate, but cognisance should also betaken of the characteristics of the study area. Factorslike employment opportunities, available residentialarea, infrastructural services and HIV/Aids can have asignificant effect on growth rates.Water demand figures adopted for design purposesshould be based on a projected value for, say, 20 yearshence.Design periods for the integral components (i.e.purification works, reservoirs, pumps and mechanicalcomponents, electrical components and main pipelines– outside reticulation) should not exceed 10 years.Design water demand values for communities aregiven under the section “Design Criteria for WaterDistribution and Storage Systems” in this chapter.These are average daily figures and the designdemand should be based on the peak daily demand atthe end of the economic design life of the project (i.e.the point where more capital will be required toexpand the facilities).Designers should note that, in adopting water demandfigures for a specific design, cognisance should betaken of local factors such as income level, climate andwater charges, when interpolating between the upperand lower limits given in this chapter.Wastewater disposalIt should be borne in mind that increasing the quantityof water supplied to an area also increases thequantity of wastewater for disposal. It is thereforeimperative, in the planning stage, that presentwastewater disposal practices be evaluated to assesswhether these methods can cope with an increasedload arising from increased water usage. This aspect isdealt with in Chapter 10 (Sanitation). The recycling ofwastewater can reduce the demand on watersignificantly and could be implemented where feasibleand where human health will not be compromised.A broad approach to the contents of project reports isgiven in Table 9.2.Project business plansThe business plan of a project describes a strategicprogramme-based approach to water service deliveryby:• giving details of the project;• demonstrating how it will conform to nationalpolicy;• describing how it will be implemented andmanaged;• showing how progress will be measured againstgoals specified; and• discussing a funding strategy and sustainability.Business plans normally have the followingcomponents:• an introduction, describing the purpose of thebusiness plan;• a description of the management structure;• a project description, which should include thetechnical details;• the details of conformity with national policy andother guidelines of funders;• a table of cost estimates; and• time plans.The format and content of business plans is usuallyprescribed by funding agencies and governmentdepartments.WATER QUALITYGeneralWater quality refers to the presence of livingorganisms or substances suspended or dissolved inwater. Water used for domestic purposes needs to beof an acceptable quality and should have a certainamount of dissolved salts present, both for taste and6Chapter 9Water supply
GUIDELINES FOR <strong>HUMAN</strong> <strong>SETTLEMENT</strong> <strong>PLANNING</strong> <strong>AND</strong> DESIGNTable 9.2:TOPICClimateHydrologyGeologyPopulationBroad approach to contents of planning reportsPRESENT SITUATIONRainfall, evaporation, seasonal changes.Sources of uncontaminated water.Depth of water table.Recharging of groundwater.Presence of streams, rivers, dams.Prevalent rock and soil types.Likely existence of impervious and pervious layers.Geological faults.Potential for boreholes.Dam sites.Existing distribution and numbers.Horizontal and vertical distances from water sources.Migrant labour practices.Age distribution.Prevalent diseasesFinancial resourcesInstitutional structuresExisting water supplyand distributionTOPICPopulationPublic facilitiesCommercial and IndustrialFinancial prospectsTOPICWater supplySanitation facilitiesExpertise and skillsNeed prioritiesEducation and training needsWater-related (typhoid, cholera, gastro-enteritis, scabies, bilharzia, malaria).Nutrition-related (malnutrition, kwashiorkor).Average expenditure per household.Savings.Leadership (chief, councillors, government officials).Committees and clubs; household heads.Fieldworkers (agricultural, health).Responsibility for water supply, sanitation, health.Role of women and youth.Springs, pumps, water vendors, tanks, boreholes.Reliability and demand.Costs.Type and age of piping.Present consumption.FUTURE DEVELOPMENTSExpected rate of increase and controlling factors.Informal settlements (urbanisation).Age distribution.Migrant labour practices.Schools; clinics, hospitals; transport; recreation centres.Factories, shops, offices, restaurants.Improved per capita income.Savings.COMMUNITY VALUES, ATTITUDES, NEEDS <strong>AND</strong> SKILLS IN RESPECT OF:Quality; distance; quantity (expected consumption after upgrading).Toilets, disposal systems; washing hands; disease transmission.Administrative; technical; financial; leadership.Domestic water; sanitation; public facilities; commercial enterprises;industrialisation.Health; water supply schemes; maintenance.Water supply Chapter 97
GUIDELINES FOR <strong>HUMAN</strong> <strong>SETTLEMENT</strong> <strong>PLANNING</strong> <strong>AND</strong> DESIGNto minimise the corrosive potential of the water.Furthermore, it has been estimated that only one outof every 20 000 strains of bacteria is pathogenic, andthe mere presence of bacteria in drinking water is notnecessarily a cause for concern. The approach to waterquality control in water supply projects shouldtherefore include the following steps:• the protection of all components (including thesource, storage units and pipelines) againstpossible contamination by pathogenic organisms;• the improvement of the existing water quality toensure aesthetic acceptability (removal of turbidityand unpleasant taste); and• the education of consumers regarding basicprecautions for the collection, storage and use ofwater.Aspects of water quality that have a bearing on theserequirements are discussed in the following sections.Diseases associated with waterWater development projects are intended to improvethe quality of the human environment. However,unless well planned, designed and implemented, awater project may bring about a decrease in one typeof disease but cause an increase in a more severe type.This may be especially true of projects designed toimprove local agriculture.Hence, one of the chief concerns of water qualitycontrol is the spread of diseases where water acts as avehicle. The World Health Organisation (WHO)estimates that 80% of illnesses in developing countriesare related to waterborne diseases.Information on water related diseases is available invarious textbooks.In order to minimise water related diseases thefollowing should be observed:• the disinfection of domestic water supplies;• the provision of well-designed and -constructedtoilets;• an increased quantity of water for domestic use;• the provision of laundry facilities, thereby reducingcontact with open water bodies; and• the provision of adequate drainage and thedisposal of wastewater.Water qualityWater for human consumption must comply with therequirements of SABS 241. This standard provides fora Class 0 or Class 1 water – the two classes intended forlifetime consumption – and a Class 2 water, intendedfor short-term consumption, in relation to the physical,organic and chemical requirements as specified. Allclasses of water must comply with the specifiedmicrobiological requirements.Stability of water suppliesWater that is put into distribution pipelines should beneither corrosive nor scale-forming in nature.Corrosive water may lead to corrosion of the pipelines,fittings and storage tanks, resulting in costlymaintenance, and/or the presence of anti-corrosionproducts in the final water being delivered to theconsumer.WATER SOURCESWhen planning a water supply scheme for an area, thepotential sources of water should first be assessed.Consideration should be given to the quantity ofwater available to meet present and future needs inthe supply area, as well as to the quality of the water.Water that is unfit for human consumption will needto be treated before being distributed.Water for human settlements can be obtained fromone or more of the following sources:• springs;• wells and boreholes;• rainwater;• surface water – rivers and dams;• bulk-supply pipelines; and• a combination of the above.SpringsA spring is a visible outlet from a natural undergroundwater system. Management and protection of thewhole system, including the unseen underground part,is essential if the spring is to be used for water supply.The seepage area can be identified by visual inspectionof the topography, and the identification of plantspecies associated with saturated ground conditions.The area can be fenced off, surrounded by a hedge, orjust left under natural bush and marsh vegetation.Gardens and trees can be safely planted some distancedownstream of the spring, but not within the seepagearea above the eye of the spring. The conservation ofwetlands or spring seepage areas is an extremelyimportant and integral part of spring waterdevelopment and management.8Chapter 9Water supply
GUIDELINES FOR <strong>HUMAN</strong> <strong>SETTLEMENT</strong> <strong>PLANNING</strong> <strong>AND</strong> DESIGNGenerally, springs fall into three broad categories.These are:• Open springs: occurring as pools in open country.Some form of sump or central collection point fromwhich an outlet pipe can be led is all that isrequired. It may sometimes be necessary to protectthe eye of the spring.• Closed springs: the more common form of springfound in rolling or steep topography. In this case a“spring chamber” is constructed around the eye ofthe spring, completely enclosing it. Some form ofmanhole should be provided so that desilting,routine maintenance, and inspection of the pipeintake can be undertaken. It should not be thefunction of the spring chamber (cut-off wall, springbox or V-box) to store water, since a rise in thechamber’s water level above the eye of the springcan result in the underground flow of waterfinding additional outlets or eyes.The spring chamber in Figure 9.2 should bedesigned according to the principles ofunderground filters. Provide a graded filter or filtercloth between the in-situ material and the outletpipe.• Seepage field: where the spring has several eyes orseeps out over a large area. In this case, infiltrationtrenches are dug and subsoil drains constructed.The drains feed the spring water to a centralcollector pipe. Subsoil drains can be made of stone,gravel, brushwood, tiles, river sand, slotted pipes,filter material or a combination of the above.The outlet pipe from a protected spring is usually fedto a storage tank, which keeps the water available foruse. The storage tank should have an overflow pipethat is below the level of the spring outlet in the caseof gravity feed.The area immediately above and around the springoutlet or protection works (see Figure 9.3) should befenced, to prevent faecal contamination by humansand animals. A furrow and berm should be dug on theupstream side of the outlet, to prevent the directingress of surface water into the spring after rains.The reliable yield from a spring is estimated bymeasuring the outlet flow rate during the driestmonths of the year (August/September in summerrainfall areas, February/March in winter rainfall areas).The reliable yield is then calculated by multiplying thisflow rate by a factor. This factor (see Table 9.3)Figure 9.2: Details of spring chamber (Cairncross and Feachem 1978)Figure 9.3: Layout of spring protection works for multiple spring eyes ( Cairnross and Feachem 1978)Water supply Chapter 99
GUIDELINES FOR <strong>HUMAN</strong> <strong>SETTLEMENT</strong> <strong>PLANNING</strong> <strong>AND</strong> DESIGNTable 9.3:depends on a number of variables, including geology,soil types, land use, and hydrological characteristics. Asa first approximation the following factors may beused, but it is advisable to try to obtain additionalinformation where possible.Usually, the local populace can provide information onwhether the spring ever dries up, or how manycontainers can be filled in an hour for the worstdrought years.It is also reasonable to assume some level of risk,especially since during at least 90% of the year betterflow conditions than the reliable yield can beexpected.WellsFactors for obtaining reliableyield estimates of springwaterRAINFALL DURING PREVIOUSWET SEASONFACTORAbove average, extending into 0,25normally dry seasonAbove average 0,35Average 0,50Below average 0,65Below average, longer than usual 0,80dry periodthe well. For this reason, and to prevent subsidence,the space between the lining and the side of the shaftshould be backfilled and compacted. A concreteapron, sloping away from the well, should preferablybe cast around the well.It is necessary to provide some form of lining toprevent the walls of the shaft collapsing, both duringand after construction. Types of linings used include:• reinforced concrete rings (caissons);• curved concrete blocks;• masonry (bricks, blocks or stone);• cast-in-situ ferrocement;• curved galvanised iron sections; and• wicker work (saplings, reeds, bamboo, etc).The well must be sunk sufficiently deep below thefree-standing surface of the groundwater to form asump in order to provide adequate water storage, toincrease the infiltration capacity into the well, and toaccommodate seasonal fluctuations in the depth ofthe water table. The larger the diameter of the hole,the faster it will recharge, depending on thecharacteristics of the aquifer. Joints between thelinings can be sealed with mortar or bitumen abovethe water table, but left open below it.The intake section is that part of the shaft in contactwith the aquifer. Joints in this section must be leftopen. It is advisable to cover the bottom of the wellwith a gravel or stone layer to prevent silt from beingstirred up as the water percolates upwards, or as thewater is disturbed by the bucket or pump used forabstraction.The well should be covered with a slab and equippedwith a suitable pump or bucket and a liftingmechanism.Where the underground water does not emergeabove the natural surface of the ground, this watercan be accessed by digging a well in the case ofshallow depths, or drilling a borehole when the waterlevel is deep (i.e. greater than 15 m).PumpWell coverHand-dug wellsA well is a shaft that is excavated vertically to asuitable depth below the free-standing surface of theunderground water. It is usually dug with hand tools,and consists of a well head (the part visible aboveground), a shaft section and the intake (the areawhere water infiltrates).The well head’s construction will depend on localconditions but must be built in a way that contributesto hygiene and cleanliness. The well lining shouldextend above the ground surface, to preventcontaminated surface water from running down intoSuction pipeConcrete sealRock curbFigure 9.4: Hand-dug well (IRC 1980 & 1983)10Chapter 9Water supply
GUIDELINES FOR <strong>HUMAN</strong> <strong>SETTLEMENT</strong> <strong>PLANNING</strong> <strong>AND</strong> DESIGNTube wells (also called bored wells)In sandy soils, the hand-digging of wells is problematicand expensive since loose sands tend to collapse.Therefore hand-digging in sandy soils is notrecommended as cheaper, more efficient methods areavailable. These methods include jetting, hand-drillingand augering of small-diameter holes (50 to 500 mm).The holes are lined using uPVC or mild steel casings toprevent collapse. The section below the water table isfitted with some form of well screen to allow forfiltration of the groundwater while preventing theingress of silt.As with hand-dug wells, the tube well should becovered with a slab and equipped with a suitablepump and concrete apron. Specially designed bucketsthat can fit into the tubes and be winched down to thewater level are still commonly used in tube wells.Certain designs of bucket eliminate the need forhandling and, hence, the possibility of polluting thewell water with germs, etc, from unwashed hands.BoreholesGenerally, underground water is of a better quality, interms of bacteria and suspended solids, than surfacesources, and its supply is often more reliable. For thesereasons human settlements throughout history haveshown a preference for underground water, whenavailable, for domestic water supplies. In all cases,groundwater should be analysed to determine itsfitness for human consumption as well as its possibleeffect on pipe systems.When the water table occurs at a great depth and/orin rock formations that do not facilitate theconstruction of hand-dug wells, a relatively small holecan be drilled using mechanical equipment. With theproper equipment, such boreholes can be sunk todepths of 100 m or more, if required.The borehole should be drilled by a reputable drillingcontractor registered with the Borehole WaterAssociation of South Africa. The drilling should also beexecuted in terms of accepted procedures andstandards, e.g. the Association’s publication MinimumCode of Practice for Borehole Construction and PumpInstallation.The diameter of the hole should suit the size of thecasing to be installed, plus any temporary casingrequired to keep the hole open during drilling andgravel-packing. For most hand-pump installations acasing diameter of 100 to 110 mm is adequate, whilesubmersible pumps normally require a minimumdiameter of 120 mm, and preferably at least 150 mm.As with hand-dug wells and tube wells, it is importantto prevent surface water entering the borehole, and todrain any excess water from the borehole site. Ifnecessary, a concrete apron or collar should beprovided. The installation of a sanitary seal provideseffective protection against aquifer pollution via theborehole annulus. Wherever possible, a local residentshould be trained to maintain the borehole andborehole pump and to alert the appropriateauthorities when major breakdowns occur. Water levelmeasurements should be taken regularly andrecorded, to ensure the pump is submerged at alltimes and provide early warning of source depletion.Siting of wells and boreholesThe presence, amount and depth of deepunderground water cannot normally be predictedbeforehand with a high degree of accuracy. Boreholesand wells previously sunk in the area could givevaluable information as to the depth and amount ofwater available. Trained geoscientists (e.g.hydrogeologists or geophysicists) are able to establishthe most favourable sites by using techniques such asaerial photograph interpretation and geophysicalexploration – e.g. electrical resistivity, magnetic,seismic and gravimetric measurements. National andregional groundwater maps providing synoptic andvisual information on South Africa’s groundwaterresources are available from the Water ResearchCommission and the Department of Water Affairs &Forestry. These maps are not site-specific and cannotbe used for borehole siting or any site-specificgroundwater conditions, but are an aid in determiningborehole prospects and other groundwater relatedinformation such as quality.Groundwater is vulnerable to pollution. All boreholesnot correctly equipped should be properly closed. As aminimum guideline, boreholes for domestic use shouldbe at least 30-50 m away from potential pollutionsources such as on-site toilets, cattle kraals orcemeteries; however, this general rule must beconsidered against site-specific conditions andcircumstances.Determination of yieldOnce a successful borehole has been established, it isimportant to carry out tests to estimate the yield likelyfrom that borehole. The type of test and its durationmust be chosen to suit the level of reliability required.Recommendations in this regard are given in Table 9.4.These recommendations represent the minimumrequirements, and can be altered to suit the situation(extract from Test pumping standards for South Africapublished by the Ground Water Division of theGeological Society of South Africa).All the aspects addressed above are covered ina document Minimum standards and guidelinesfor groundwater resource development forthe community water supply and sanitationprogramme published by the Department ofWater supply Chapter 911
GUIDELINES FOR <strong>HUMAN</strong> <strong>SETTLEMENT</strong> <strong>PLANNING</strong> <strong>AND</strong> DESIGNTable 9.4:Recommended test and duration to estimate subsurface water yieldUSE OF WATER TEST DURATION RECOVERY TESTStock or domestic Extended step Total 6 hours Up to 3 hoursHand pump Extended step Total 6 hours Up to 3 hoursTown water supply Step 4 x 1 hour -Low-yield borehole Constant discharge 24 hours CompleteTown water supply Step 4 x 1 hour -High-yield or main borehole Constant discharge 72 hours or more CompleteWater Affairs & Forestry (1997). More recently, theSouth African Bureau of Standards embarked on thedevelopment of a set of South African Standard Codesof Practice (SABS 0299 series) for the development,maintenance and management of groundwaterresources.RainwaterRainwater can be collected and stored. The harvestingof rainwater from roof runoff can supplementdomestic supplies, even in semi-arid areas. Inparticular, rainwater can be harvested not only fordomestic use, but also to provide water at remotepublic institutions like schools and clinics, as well asresorts. Usually the limit is not the amount of rainfallthat can be collected, but the size of the storage tankthat will provide a sustained supply during periods oflittle or no rainfall. It should, however, be considered asupplementary supply for non-potable use since itcould pose a health risk.Rainwater collection from roofs constructed fromcorrugated iron, asbestos sheeting or tiles is simple.Guttering is available in asbestos cement, galvanisediron, uPVC, plastic or aluminium. The guttering anddownpipes can be attached directly to the ends ofrafters or trusses, and to fascia boards.ferrocement construction is one of the mosteconomical options at present. Ferrocementconstruction without the use of a mould is alsopossible, however.Larger quantities of rainwater may be collected fromspecially prepared ground surfaces. Surfacepreparations to make the ground less permeableinclude compaction and chemical treatment, orcovering with impermeable materials such as plastic,rubber, corrugated iron, bitumen or concrete. In thecase of ground-level rainwater harvesting, the storagetank will normally need to be located underground.The catchment area should also be protected (fencedoff) to minimise the risk of possible faecalcontamination.The average quantity of water available from arainwater catchment area is found by multiplying thearea (in plan) with the mean annual rainfall in thatarea, and adjusting by an efficiency factor (averagerainwater (litres) = catchment area (m 2 ) x mean rainfall(mm) x efficiency, where efficiency, has a value between0 and 1,0). For roofs an efficiency of 0,8 is usual.Down pipefrom roofBecause the first water to run off a roof can contain asignificant amount of debris and dirt that hasaccumulated on the roof or in the gutter, somemechanism (such as that in Figure 9.5) to discard thefirst flush is desirable. In addition, the inlet to thestorage tank should be protected with a gauze screento keep out debris, as well as mosquitoes and otherinsects or rodents.SealScreenScreenTapMaterials commonly used for rainwater tanks includecorrugated iron, glass fibre, asbestos cement, highdensitypolyethylene (all prefabricated types) orferrocement, concrete blocks, masonry, reinforcedconcrete, and precast concrete rings (tank constructedin-situ). Subject to the availability of a suitable mould,ScreenedoverflowFigure 9.5: Arrangement for diverting the“first foul flush” (IRC 1980)12Chapter 9Water supply
GUIDELINES FOR <strong>HUMAN</strong> <strong>SETTLEMENT</strong> <strong>PLANNING</strong> <strong>AND</strong> DESIGNFog harvestingFog harvesting is limited in application and confinedto particular geographical areas. A number of pilotprojects are currently being undertaken at CapeColumbine, Pampoenvlei, Lamberts Bay, Brand se Baai,Kalkbaken se Kop and Kleinsee. The publication Fogharvesting along the west coast of South Africa: afeasibility study by J. Olivier (Water SA, vol 28 no 4,October 2000) can be referred to in this regard.The technique is fairly simple – nets spanned betweenpoles. Fog condenses on the nets and runs down intoan open chute for collection in a storage facility.The findings of a number of test sites are currentlyawaited.Surface waterThe Catchment Management Agency or theDepartment of Water Affairs and Forestry’s RegionalOffice should be consulted where surface water is usedas source. Surface water sources, such as streams,rivers, lakes, pans and dams, will always containsuspended solids (turbidity) and microbiologicalpollutants. In addition, the quantity of water that canbe abstracted from these sources is dependent upondroughts and floods, unless sufficient storage isavailable or can be provided. The following aspectsshould therefore be taken into account when relyingon surface water to supply a community:• The water should be treated for the removal ordestruction of pathogenic organisms (e.g. bacteria,viruses, protozoa), as well as for turbidity.• Where deemed necessary, a back-up source (e.g. aborehole) should be provided for times of shortageand drought, to ensure a minimum supply fordomestic use.• A pump station or other water extraction facilityshould be protected from possible damage byfloods or vandalism.The water supply intake may be sited at any pointwhere the surface water can be withdrawn insufficient quantities. In some situations where thegradient is steep enough, the water to be used may bediverted directly into a canal or pipeline, without theneed for pumps.In the case of a small stream or river it may benecessary to construct a weir across the river bed toprovide enough depth for intake and to maintain thewater level within a fairly narrow range. A weir maybe constructed with concrete, cement blocks, or rockscovered with impermeable plastic sheeting. The typeof construction selected will depend on economics andon the flood conditions expected.The river or dam’s intake point should be selected toabstract the best quality of water from the source. Forexample, a float intake (see Figure 9.6b) may beselected to withdraw water just below the surface.This may be desirable as the surface water may beclearer than the water at deeper levels. Alternatively,an intake placed below the bed of a river (see Figure9.6d) would result in the water being partially filteredas it passes through the sand of the bed. While thismay appear to be the most desirable, it is important toensure that any such filtered-intake system is firmlyfixed in place because, when the river floods, the riverbed tends to become unstable.In a stationary body of water like a dam or lake, it maybe desirable to withdraw water well below the surfaceto minimise the amount of algae in the waterextracted. However, if the water is extracted from toodeep a level, the quality of this water may show amarked difference from the surface water. This isbecause of the possible thermal stratification of thelake in the warm summer months, when the oxygenlevels in the deeper waters could be depleted, causingdeterioration in quality.Bulk-supply pipelinesThe storage and distribution system, often comprisingthe major expense, must be appropriate for the area interms of cost, complexity and operationalrequirements.When a developing area is located alongside analready developed area, it may be possible to purchasewater directly from the authority supplying water tothe developed area. In many cases, the existing waterpipelines will be able to support the additionalrequirement of the developing area. If the pipeline issituated close to the developing area, this positioncould be highly cost-effective. A storage reservoir maybe required to ensure a continuous supply whereexcess water is only available during off-peak periods.If the water in the pipeline is untreated, sometreatment will be required to ensure that the water issafe for domestic use. The authority responsible forthe pipeline will require payment for the waterwithdrawn from the pipeline, and hence it will benecessary to meter the connection.WATER TREATMENTGeneralWater treatment is considered a specialised subject.This section therefore gives a broad background onlyand does not attempt to give guidance to the designengineer. Specialists should be consulted where waterpurification is considered.Water supply Chapter 913
GUIDELINES FOR <strong>HUMAN</strong> <strong>SETTLEMENT</strong> <strong>PLANNING</strong> <strong>AND</strong> DESIGNMinimumwater levelHighw/lLoww/lSubmersiblemotor andpump(a) River bank intake using infiltration drainsWell sump40 mm pipe(b) Float intake2 Guide polesHigh w/lStone pitchingLow w/lFlexible joint(rubber orplastic hose)Weldedsteel flangeSuitablesandstrateRiver bedBarrelPerforatedpipe sectionIn many cases, water obtained from a particular sourcewill require some treatment before being distributedfor domestic use. Water obtained from boreholes,protected wells, protected springs and harvestedrainfall often requires little or no treatment. However,as a precautionary measure and to minimise biologicalactivity in the storage reservoirs and pipelines, evensuch waters should be chlorinated before distribution.Most surface waters will require treatment, both toremove turbidity and for disinfection.Certain surface waters and groundwaters will requireadditional treatment for the removal of organicand/or inorganic contaminants. Many groundwaters insouthern Africa are highly saline and, unless a suitablealternative source of water can economically belocated, they will require partial desalination to makethem suitable for domestic use.Unfortunately, there is no such thing as a universal,simple and reliable water treatment process suitablefor small community water supplies. Treatment shouldbe affordable and reliably operated. Okun and Schultz(1983) suggest that under all circumstancesgroundwater is the preferred choice for communitysupplies, as it generally does not require treatment.When treatment is required, this will be determined bythe extent of contamination and by the characteristicsof the raw water.0,5 - 1,5 mFloatChainScreenFlexible hose(c) Simple water intake structurePipeA simple approach for the selection of a treatmentsystem is given by Thanh and Hettiaratchi (1982) (seeTable 9.5). The emphasis on slow sand filtration is validfor areas where skilled personnel may not bepermanently available to operate the plant, wherechemical shortages may occur, where space is availableat low cost, and where supervision may be irregular.Marx and Johannes (1988) found slow sand filtrationto be an economical and successful option for watertreatment plants in developing areas of South Africa.Water movementWaterWater surfaceWhere sufficient money and skilled operators areavailable, standard water treatment plants (e.g.chemical flocculation, radial settler, rapid sandfiltration and chlorination) have worked well undermost circumstances.Slottedseptum(d) The S.W.S. filter60 cmBottomsurfaceRiver orstream bedCoarse sandand gravelFigure 9.6: Various surface water intakeconfigurationsPackage water treatment plantsPackage water treatment plants (see glossary) for smallercommunities in rural areas have potential and could fulfilthe need for potable water. Attention should, however,be given to operation and maintenance requirements aswell as to backup from suppliers.More information can be obtained from a WaterResearch Commission (1997) publication entitledPackage water treatment plant selection.14Chapter 9Water supply
GUIDELINES FOR <strong>HUMAN</strong> <strong>SETTLEMENT</strong> <strong>PLANNING</strong> <strong>AND</strong> DESIGNTable 9.5: Treatment selection criteria (Thanh and Hettiaratchi 1982)RAW WATER QUALITYTurbidity 0-5 NTUFaecal coliform 0/100 mlGuinea worm or schistosomiasis not endemicNo treatmentTREATMENT SUGGESTEDTurbidity 0-5 NTUFaecal coliform 0/100 mlGuinea worm or schistosomiasis endemicSlow sand filtrationTurbidity 0-20 NTUFaecal coliform 1-500/100 mlSlow sand filtrationChlorination if possibleTurbidity 20-30 NTUUp to 30 NTU for a few days onlyFaecal coliform 1-500/100 mlPre-treatment advantageousSlow sand filtrationChlorination if possibleTurbidity 20-30 NTUUp to 30 NTU for several weeksFaecal coliform 1-500/100 mlPre-treatment advisableSlow sand filtrationChlorination if possibleTurbidity 20-150 NTUFaecal coliform 500-5 000/100 mlPre-treatmentSlow sand filtrationChlorination if possibleTurbidity 30-150 NTUFaecal coliform >5 000/100 mlPre-treatmentSlow sand filtrationChlorinationTurbidity >150 NTUDetailed investigation (and possible pilot-plant study)WATER SUPPLY OPTIONSSelection of water supply terminalsWater supply terminals are divided into public (orcommunal) and private installations. Public orcommunal installations are those installations to whichthe public and the community have access. Privateinstallations are those that render water to individualhouseholds.The selection of terminals for a community depends ona number of factors, the most important being• affordability of the system (by agency/users);• selected method of cost recovery;• unit cost to end-user; and• long-term maintenance requirements.With regard to water for domestic use, the relativeimportance of these factors for each terminal is givenin Table 9.6. The value judgements in this table aresubjective and a number of other factors mayinfluence the final selection, or the validity of thejudgement for a particular situation.If possible, individual connections should be providedto schools, clinics and possibly some businesses, nomatter which option is selected.Public or communal water supplyterminalsRudimentary systems fall within the category of publicor communal water supply terminals. These systemsnormally comprise a source or consumer terminalwhere water is collected in containers or buckets.Walking distance is usually between 200 and 500metres. A minimum of water is provided – between 5Water supply Chapter 915
GUIDELINES FOR <strong>HUMAN</strong> <strong>SETTLEMENT</strong> <strong>PLANNING</strong> <strong>AND</strong> DESIGNTable 9.6:Selection criteria for water supply terminalsTYPE OF SUPPLYRELATIVE CAPITALCOST OF SUPPLY SCHEMEMAINTENANCECOST RECOVERY NEEDS UNIT COSTPublic standpipes medium flat rate or per medium lowamount usedWater kiosks medium per amount used low highTanker supply to tank medium flat rate medium to high medium to highVendors low per amount used low medium to highYard tank low per amount used low lowRoof tank medium per amount used low lowMetered yard tap high per amount used low lowMetered house high per amount used low lowconnectionHandpump medium/low flat rate medium mediumSpring supply to tank low flat rate low lowand 15 l/c/d, mainly for drinking and cooking.The most basic systems are run-of-river abstraction,rainwater harvesting, unprotected springs and openwells. The systems are often augmented by handpumps, spring protection, a windmill, solar pump orsome storage tanks. All systems require hometreatment.Communal street tap: Ordinary typeThe system comprises a water reticulation system withstandpipes in open areas or in road reserves. TheDepartment of Water Affairs and Forestry’s WhitePaper of 1994 defined basic water as access to 25 litresof potable water per person (capita) per day at acommunal street tap which is within 200 metres of thedwelling, with 98% reliability and a 10 l/min flow rate.Provision is usually made in the design for upgrading.The design of the standpipe installation requirescareful planning, and special attention should begiven to drainage of excess water and avoidingwastage, in order to minimise health risks. A typicalexample is shown in Figure 9.7.In the case of communal standpipes serving dwellinghouses, the following criteria should be satisfied(payment arrangements may influence theseconsiderations):• one tap required per 25-50 dwellings;• maximum number of people served per waterpoint: 300;• maximum number of people served per tap: 150;• maximum walking distance from a dwelling to astandpipe: 200 m.An acceptable discharge capacity from a standpipe isabout 10 l/min per tap. For commonly used taps thecalculated discharge range, at an assumed efficiency of80%, is given in Table 9.7.These flow rates should be considered only as a guide;the actual flow rate depends on the type of tap used.The high discharge rates indicated for a 60 m head willnormally be reduced by the limitations of thepipework. In practice, measured flow rates to singledwelling houses seldom exceed 40 l/min.In order to reduce water wastage, and to prolong thelife of the tap washers, pressures should be limited.16Chapter 9Water supply
GUIDELINES FOR <strong>HUMAN</strong> <strong>SETTLEMENT</strong> <strong>PLANNING</strong> <strong>AND</strong> DESIGNFigure 9.7: Typical standpipe detailTable 9.7: Typical discharge rates for taps (assumed efficiency rate 80%)TAP DIAMETERDISCHARGE5 m head 10 m head 60 m head15 mm 16 l/min 23 l/min 54 l/min20 mm 22 l/min 31 l/min 70 l/minAccess for physically disabled persons:Barriers that prevent access to water andsanitation facilities for disabled people tend tofall into the following categories (WEDC, 2002):• Environmental: barriers in the physicalenvironment and infrastructure;• Individual: functional limitations of theindividual disabled person;• Social: negative attitudes and behaviour ofthe community and society; and• Institutional: discriminatory legislation,policies, and organisational practices.Involvement of disabled people at all stages ofproject planning and implementation willimprove both effectiveness and sustainability.The provision of communal street taps shouldtake cognisance of the requirements ofphysically disabled persons. Taps should besituated on smooth, even pathways, and rampsshould be provided in lieu of steps. Rampsshould be not less than 1100 mm wide with aslope not exceeding 1:12.Communal street tap: Prepaid typeThe basic (RDP) standard (25 l/c/d within 200m at 98%reliability and 10 l/min flow), with the addition ofprepaid meters at street taps.Water kiosksWater kiosks are being used in developing areas whereurbanisation has caused the rapid growth ofsettlements. The sale of water at kiosks provides aneffective means of recovering costs, which is especiallyrelevant in places where community managementstructures are not yet in place.Due to their higher cost and the relatively largenumber of users required to make individual unitscommercially viable, kiosks are usually spaced furtherapart than standpipes would normally be. For thesystem to be viable, individual kiosks should supply atleast 100 dwellings.Facilities for accurately measuring and dispensing thestandard purchase volume (usually 20 to 25 litres)should be provided. The structures should be sturdy,and have lockable facilities.Water supply Chapter 917
GUIDELINES FOR <strong>HUMAN</strong> <strong>SETTLEMENT</strong> <strong>PLANNING</strong> <strong>AND</strong> DESIGNWater tanks with tapsWater tanks with taps may be the first level of supplyimprovement before any distribution piping isinstalled. Water may be supplied by gravity flow froma spring, from a borehole equipped with an enginedrivenpump, by rainwater, or from a small treatmentplant. People may need to walk long distances to thetanks to collect this water. However, its quality isusually good, and it may often be the only source ofwater available to a community.The size and design of the tanks should be inaccordance with the design principles given elsewherein this chapter.Handpump installationsThe following criteria are considered important foreffective water supply to areas using handpumps:regulator (trickle feed), which is sized to give apredetermined volume (mostly 25 l/c/d) to thehousehold. A ball valve inside the tank prevents itfrom overflowing. Supply can be shut off ifrequired.Yard tank (or ground tank): low-pressure,manually operatedThis is similar to the Durban tank (Figure 9.8).Water is provided at full pressure into yard tanks.The volume of supply is either manually controlledby a bailiff who, on a daily basis, opens the supplyat a control node, or electronically controlled to filleach tank where the monthly flat rate has beenpaid. The supply volume can be adjusted bychanging the tank size and increasing the monthlyflat rate. A ball valve inside the tank prevents itfrom overflowing. Supply can be shut off ifrequired.• The handpump chosen should take into accountcorrosiveness of the environment, together withsuitable riser pipe material for the pumping head.• The community should be consulted in the choiceof the handpump; this selection should be madefrom a well-informed position.• The pump should be installed professionally.• The site should also be free from contamination byanimals and humans, and generally be distant fromsources of possible pollution.• The pump should be taken care of by selected,motivated community members in order tofacilitate maintenance tasks.• It should not be expected of communities to becompletely self-sufficient; adequate spares andmaintenance should be available.Private water supply terminalsYard connections and house connections fall withinthe category of private water supply terminals.Yard connectionsOrdinary typeWater is provided, at pressure, at a tap on theboundary just within the stand. No storagefacilities are provided on site and there is no supplyto the house. However, an outside toilet may besupplied with a hand-washing facility or washtub.Yard tank (or ground tank): low-pressure, tricklefeedWater is provided at full pressure up to speciallymanufactured yard tanks. The tank inlet has a flowFigure 9.8: The Durban yard tankYard tank (or ground tank): low-pressure,regulatedWater is provided at regulated pressure and flowrate into yard tanks. Volume and pressure of supplyis regulated by “equity” valves at control nodeslocated on the RDP pipe network. A ball valveinside the tank prevents it from overflowing.Bailiffs can shut off supply if required. Volume ofsupply can easily be adjusted by changing the sizeof the equity valve.Roof tank: medium-pressure, manually operatedWater is provided at full pressure into a roof tankeither in or on top of the roof of the house. Thewater supply is sometimes throttled to discourageexcessive use. Water use in the house is at roofheightpressure. A ball valve inside the tankprevents it from overflowing. The volume of supplyis unlimited and metered conventionally.18Chapter 9Water supply
GUIDELINES FOR <strong>HUMAN</strong> <strong>SETTLEMENT</strong> <strong>PLANNING</strong> <strong>AND</strong> DESIGNCustomers are regularly invoiced for waterconsumed.Roof tank: medium-pressured, regulatedWater is provided at high pressure to reticulationnodes, and at reduced pressure into a roof tankeither in or on top of the house. The water supplyis sometimes throttled to discourage excessive use.Water used in the house is at roof-height pressure.The volume of supply is regulated by the “equity”valve at the node, and can be changed to upgradeor downgrade the level of water use. The volumeof supply is unlimited and metered conventionally.Customers are regularly invoiced for waterconsumed.House connectionsFull-pressure conventional house connectionWater is provided at high pressure into the house,and all water use is at full pressure andunregulated flow. Water use is meteredconventionally. Customers are regularly invoicedfor water consumed.The communication pipes for erf connections fordwelling houses (Residential zone 1) should besized according to Tables 9.8 and 9.9.For developments other than dwelling unitsmetered individually, the communication pipeshould be sized according to the specific demand.House connection: full-pressure, prepaidWater is provided at high pressure into the house,and all water use is at full pressure, and availablewith prior payment (prepayment tokens) activatingthe prepayment meter. These tokens can bebought at central vending offices. No monthlymeter reading and billing is required.DESIGN CRITERIA FOR WATERDISTRIBUTION <strong>AND</strong> STORAGESYSTEMSGeneralWater distribution and storage are, in most instances,the most costly parts of a water supply scheme. Hencesavings in these areas through good design can oftenresult in significant savings for a whole project.The elements of a water distribution and -storagesystem include some or all of the following:• bulk water transmission systems;• bulk-storage reservoirs;• intermediate-storage reservoirs;• distribution networks; and• terminal consumer installations.This section deals with water demand and is presentedin two parts. The first part deals with water demand indeveloping areas and the second part deals withdeveloped areas. It does not therefore mean that theguidelines given are applicable only to a particulararea – the designer should always be aware of thedynamics within a community that could influence thedevelopment of an area.Table 9.8:Communication pipes across roads for house connectionsINCOMEMINIMUM ACTUAL INTERNAL DIAMETER (mm)LEVEL SERVING TWO ERVEN SERVING ONE ERFHigher 40, branching to 2 x 20 25, reducing to 20 at erfMiddle 40, branching to 2 x 20 25, reducing to 20 at erfLower 20, branching to 2 x 15 15Table 9.9:Communication pipes on near side of road for house connectionsINCOMEMINIMUM ACTUAL INTERNAL DIAMETER (mm)LEVEL SERVING TWO ERVEN SERVING ONE ERFHigher 40, branching to 2 x 20 20Middle 40, branching to 2 x 20 20Lower 20, branching to 2 x 15* 15** The communication pipe may be reduced to 15 mm nominal diameter, provided the minimum head in thereticulation main at the take-off point for the erf connection under instantaneous peak demand is not less than30 m.Water supply Chapter 919
GUIDELINES FOR <strong>HUMAN</strong> <strong>SETTLEMENT</strong> <strong>PLANNING</strong> <strong>AND</strong> DESIGNDeveloping areas are considered to be those areaswhere the level of services to be installed may besubject to future upgrading to a higher level.Developed areas are considered to be those areaswhere the services installed are already at their highestlevel and will therefore not require future upgrading.Water demandWater demand is usually based on historicalconsumption. Where water consumption records arenot available, present consumption per capita can beestimated by consulting the residents. However, oncethe supply system has been upgraded, consumption islikely to change and Tables 9.10 and 9.11 may be usedto estimate typical consumption. An improvedestimate could be obtained by studying existing watersupply systems in the same area. It has also beenshown that extensive education programmes couldhave a positive influence on water demand.Water demand (l/day)360030002400180012006000NOTE:Demand to take intoaccount climate, incomelevel, cost of waterUpper limitLower limit400 800 1200 1600 20002Erf area (m )Figure 9.9: Annual average daily water demand forerven in developed areasTable 9.10: Water demand for developing areas (IRC 1980)TYPE OF WATER SUPPLY TYPICAL CONSUMPTION RANGE( l/c/d) l/c/dCommunal water point• well or standpipe at considerable distance (>1000 m) 7 5-10• well or standpipe at medium distance (250-1000 m) 12 10-15• well nearby (
GUIDELINES FOR <strong>HUMAN</strong> <strong>SETTLEMENT</strong> <strong>PLANNING</strong> <strong>AND</strong> DESIGNNotes:• A handpump should be considered as being similarto a well, since additional effort is required toobtain the water.• A spring should be considered as being similar to astandpipe, especially when it has been protected.• A climb of more than 60 m over a short distanceshould be considered as being similar to walking adistance of about 1 000 m.Table 9.12:NON-DOMESTIC USERSNon-domestic water demandWATER DEM<strong>AND</strong>Schools: day 15-20boarding 90-140litres/pupil/dayHospitals 220-300litres/bed/dayFactors influencing water demand• The type of sanitation system and the developmentlevel affect the water consumption, particularly inthe category “House connection”.The development levels are as follows:ClinicsBus stations5 - outpatients40-60 - in-patientslitres/bed/day15 - for those personsoutside the communitylitres/user/day- Moderate: medium-sized formal housing withlimited finishing, moderate gardens.Community halls/ 65-90restaurantslitres/seat/day- Moderate to high: limited formal suburbanhousing, moderate finishing, extensive gardens.Table 9.13:Water demand for stock- High: extensive formal suburban housing, smallstands, extensive gardens, moderate-flushtoilets.- Very high: formal suburban housing, largestands, extensive gardens, fully reticulated.• Inhibiting factors like topography, water qualityand water tariff.• Metering and cost-recovery mechanisms.Non-domestic water demand indeveloping areasWater requirements for non-domestic purposes aredifficult to estimate and, where possible, fieldmeasurements should be taken. Provision must also bemade for the water demand at public open spaces.See Table 9.12 and 9.14 category 13.Water demand for stockThe water demand for stock is given in Table 9.13. Itmust be pointed out that the provision of potablewater for stock is highly undesirable and has seriouscost-recovery implications.STOCKIntensive: meat: LS 50SS 12Dairy: LS 120Extensive: LS 50SS 10WATER DEM<strong>AND</strong>litres/head/dayLS refers to large stock.SS refers to small stock.Intensive: the business of the land owner is farming.Extensive: keeping a few animals for domesticpurposes.differences between Tables 9.11 and 9.14 should notbe seen as significant and adjustments can be made tothese demand figures to take local conditions intoaccount. Attempts to base water demand on other erfrelateddata have not yet been validated.Water demand in developed areasThe water demand figures in Table 9.14 should beused for detail design where applicable. Studies onwater demand show there is usually a large degree ofvariance about the mean demand, and several factorscan cause short-term variations. Therefore, theWater supply Chapter 921
GUIDELINES FOR <strong>HUMAN</strong> <strong>SETTLEMENT</strong> <strong>PLANNING</strong> <strong>AND</strong> DESIGNTable 9.14:Water demand for developed areasCATEGORY TYPE OF DEVELOPMENT UNIT ANNUAL AVERAGE WATER DEM<strong>AND</strong>(l/day) UNLESS OTHERWISE STATED1 Dwelling houses Erf area for dwelling See Figure 9.9 for erven(Residential zone I) house not exceeding 2 000 m 2 . Forerven >2 000 m 2 , base demandon local conditions2 Low-rise multiple-dwelling Dwelling Upper limit 1 000 (a)unit buildings (ResidentialLower limit 600 (a)zones II and III)3 High-rise multiple-dwelling Dwelling Upper limit 700 (a)unit buildings (Residential zone IV)Lower limit 450 (a)4 Offices and shops 100 m 2 of gross floor 400area (b)5 Government and municipal 100 m 2 of gross floor 400area (b)6 Clinic 100 m 2 of gross floor 500area (b)7 Church Erf 2 0008 Hostels Occupant 1509 Developed parks Hectare of erf area ≤ 2 ha: 15 kl (c)(d)>2 ha ≤ 10 ha: 12,5 kl (c)(d>10 ha: 10 kl (c)(d)10 Day school / créche Hectare of erf area As per developed parks (d)11 Boarding school Hectare of erf area As per developed parks plusplus boarders150 l/boarder12 Sportsground Hectare of erf area As per developed parks13 Public open spaces (e) Hectare of erf area See note (e) below(a) Water demand includes garden watering of all common areas outside the limits of the buildings.(b) Gross floor area obtained using applicable floor space ratio from the town planning scheme.(c) Demand for developed parks to be considered as drawn over six hours on any particular day in order to obtainthe peak demand.(d) Where the designer anticipates the development of parks and sportsgrounds to be of a high standard, e.g.25 mm of water applied per week, the annual average water demand should be taken as follows:≤ 2 ha: 50 kl (c) ; >2 ha ≤ 10 ha: 40 kl (c) ; >10 ha: 30 kl (c) .(e) Refer to Chapter 5 and distinguish between “soft open space” and “semi-public open space”.22Chapter 9Water supply
GUIDELINES FOR <strong>HUMAN</strong> <strong>SETTLEMENT</strong> <strong>PLANNING</strong> <strong>AND</strong> DESIGNFigure 9.10: Factor for obtaining the peak flow in mains for low-cost housing,incorporating individual on-site storagePeak factorsFigure 9.10 could be used as a guide where yard tanksare supplied and a single 15 mm tap is fitted on theservice pipe between the consumer connection andthe storage tank (usually a 200 litre capacity).The peak factors mentioned in Table 9.15 are intendedas a guide only. The actual choice of the peak factorrequires considerable thought from the designer, anddepends on several factors that must be taken intoaccount. Recent studies have indicated that the peakfactors currently in use are conservative; however, acomprehensive review is still outstanding.The following are some of the factors that maysignificantly influence the choice of a specific peakfactor:• employment trends and practices in thecommunity;• gardening activities;• number of persons per tap;• agricultural activities;• number of dwellings (where supply to less than 200dwellings is being considered, consideration shouldbe given to a higher peak factor; Figure 9.10 couldbe used as a guideline in this case);• economic status;• extent of unauthorised connections;Table 9.15:Peak factors for developing areasPEAK FACTORS: DEVELOPING AREAS – UNRESTRICTED FLOW SYSTEMS #TYPE OF DOMESTIC SUPPLY SUMMER PEAK FACTOR DAILY PEAK FACTORINSTANTANEOUS PEAK #Low density** High density**House connection 1,5 2,4 3,6 - 4,0 4,0 minimum*Yard connection 1,35 2,6 3,5 - 4,0 4,0 minimum*Street tap / standpipe 1,2 3,0 3 - 3,6 4,0 minimum*Yard tanks - - see note see note# Unrestricted systems are those systems where no specific arrangements restrict the flow at all.The instantaneous peak factor for restricted flow systems (yard tanks) is 1,5 at all times.** Low-density areas are typically found in rural localities. High-density areas are those areas typically found inurban localities.* Increases with diminishing number of consumers. Figure 9.10 could be used as a guide.Water supply Chapter 923
GUIDELINES FOR <strong>HUMAN</strong> <strong>SETTLEMENT</strong> <strong>PLANNING</strong> <strong>AND</strong> DESIGN• “skeletonising” (see Glossary) of reticulationnetworks; in the case of low-level servicedcommunities, due consideration should be given tothe design of the network for the ultimate scenarioand the reticulation network being skeletonised tothe requirements of the immediate level of service;and• system constraints (e.g. maximum possible flowfrom a tap, or limited supply by a water bailiff).Reticulations in the developing areas may besignificantly affected by the discharge rate fromstandpipes. Table 9.7 gives guidelines on tapdischarges.It is not advisable to reduce peak factors to effect costsavings. Cognisance must be taken of the fact that thewater supply to developing areas could be upgradedat a later stage, and the long-term development of thewater supply to the community must be taken intoaccount.Peak factors for developed areasIn order to determine the instantaneous peak factorfor developed areas from the graph, the type ofdevelopment should first be converted to “equivalenterven” (ee) according to the design annual averagedaily demand, accepting as a basis for design that oneee has an annual average daily demand of 1 000 litres.Using the ee thus obtained, the instantaneous peakfactor pertaining to any point in the network shouldbe obtained from Figure 9.11.The annual average daily demand multiplied by thepeak factor gives the instantaneous peak flow.StorageThe peak factor will be reduced in the case of theprovision of terminal storage (in which case only theterminal storage volume is designed to cater for peakdemands).The provision of intermediate storage will also resultin a reduction in the peak flows in the elements priorto the intermediate storage facility.Where the installed capacity is unable to cater for thepeak demand, the demand curve will flatten out,resulting in the actual peak demand being limited tothe supply capacity of the system, extended over alonger period of time. This may be of someinconvenience to residents, but will not lead to awater shortage.Residual pressures in developing anddeveloped areasTo obtain the residual head at any point in thereticulation, the network should be balanced usinginstantaneous peak flows and fire flows.Hydraulic formulae for sizingcomponentsAny of the recognised hydraulic formulae may be usedto size pipeline components.WATER TRANSMISSIONGeneralPipelines are the most common means of transmittingwater, but canals, aqueducts and tunnels may also beused. Water transmission conduits usually requireconsiderable capital investment and therefore alltechnical options with their associated costs should becarefully evaluated when selecting the best solution ineach particular case.Figure 9.11: Factor for obtaining the peak flow in mains in developed areas24Chapter 9Water supply
GUIDELINES FOR <strong>HUMAN</strong> <strong>SETTLEMENT</strong> <strong>PLANNING</strong> <strong>AND</strong> DESIGNPipelines will usually mean minimum water losses, andalso imply the shortest transmission distance. However,pipeline costs may be considerable and the option ofcanals for the transportation of non-potable watercould be considered. Canals will result in higher losses,longer transmission distances, and the possibility ofdeterioration in water quality due to algal growth.However, the lower costs and the option of labourintensiveconstruction may make this option moreattractive. Designers should also take into account thehabits and lifestyle (keeping of livestock) of thosecommunities where canal systems for water supply areconsidered.Water can be transported either by gravity orpumping, or a combination of these. Clearly, thepreferred choice will always be a gravity supply.Aqueducts and tunnels should only be used in specialcircumstances. However, physical or economicconstraints may limit the options and necessitate apumping component.CanalsCanals may be used to transport large volumes ofwater over long distances. They should be lined(usually with concrete) and inspected regularly forcracks and leaks in the joints. The growth of algae mayneed to be addressed by shock chlorination from timeto time. Canals should only be used for transportingnon-potable water.Water tankersThe operational costs of supplying water by tanker areusually extremely high, but may serve as a temporarymeasure in an emergency situation, or for a newsettlement. However, alternative tank size and deliveryvehicle combinations should be considered whenundertaking a feasibility study. The use of multipurposevehicles (e.g. tractors with different trailercombinations) could also be considered as a means ofreducing the capital costs.PIPELINE DESIGNBasic requirements• The static pressure should be kept as low aspossible by reducing the pressure in a balancing orseparate break-pressure tank, or by means of apressure-reducing valve.• To avoid air pockets, the number of high and lowpoints should be kept to a minimum by trying tofollow the contour lines, rather than roads ortracks.• To minimise the number of air-release valves, thepipeline trench depths may be varied to avoid localhigh and low points.• The cost of a water transmission system is moresensitive to the total length of pipe installed thanthe diameter of the pipes. Therefore, it is generallyadvantageous to design a transmission system (atleast the major components) to meet the ultimatecapacity.• Velocities in pipes should be approximately 0,6 m/sand should not exceed 1,2 m/s.• Velocities in special fittings (fittings specificallymanufactured) should not exceed 6 m/s.• Air valves should be installed at summits, and scourvalves at low points between summits.• Thin-walled pipes susceptible to buckling musthave valves that automatically allow air to enterwhen the pipeline is emptied, so as to prevent avacuum that will cause the pipe to collapse.• To facilitate the location of a buried pipe duringmaintenance, curved pipe routes should beavoided. All bends should be marked with a post ora suitable beacon, and the pipeline laid in astraight line between bends.• To avoid air pockets in pipelines, the slope shouldbe greater than 0,3% (0,3 m per 100 m length), or0,2% for large-diameter pipes (>200 mm).• To avoid damage to pipelines during backfilling ofa trench, a proper pipe-laying specification shouldbe provided by the designer. Recommendedminimum trench depths are as follows:- road crossings: pipe diameter + bedding + 0,80 m;- otherwise: pipe diameter + bedding + 0,60 m.• Bedding thickness should normally be a minimumof 0,10 m or one-sixth of the pipe diameter,whichever is greater.• The likely effect of water hammer/surge pressureshould be considered in the design of a pressurepipeline system, as this may be the crucial factor inthe selection of pipe class, or may indicate the needto provide surge or accumulator tanks.The suitability of any pipe for a particular applicationis influenced by:• its availability on the market, both in respect ofdimensions and pressure classes;Water supply Chapter 925
GUIDELINES FOR <strong>HUMAN</strong> <strong>SETTLEMENT</strong> <strong>PLANNING</strong> <strong>AND</strong> DESIGN• its purchase price and associated costs of valves andfittings;• its susceptibility to corrosion, mechanical damageand material ageing, as well as any other cause ofmaterial deterioration in the particular application;• its storage costs; and• the diameter of pipeline (internal and external).Pipes laid above groundIt may happen that pipes have to be laid above grounddue to adverse conditions, such as rock. Whenconsidering laying pipes above ground, the followingfactors need to be taken into account:• Provision should be made for expansion joints (theeffects of thermal changes must be considered).• Each pipe section should be properly supported.The supports should be designed to carry the loadof the pipe as well as the water it conveys.Sufficient supports should be included in order toprevent sagging of the pipeline. The pipe shouldbe strapped to the support, leaving room formovement.• Adequate thrust blocks should be designed to caterfor hydraulic forces at bends.• Adequate anchoring should be provided, especiallyin steep slopes, and directional and elevationchanges.• The consequences of pipe failure should beevaluated.• Heavy equipment like valves should be supportedindependently.• Adequate protection should be provided to copewith external abrasion.• Vulnerability to damage from veld fires, animalsand rodents should be assessed.VALVES <strong>AND</strong> OTHER FITTINGSGeneralValves and fittings should be carefully located anddesigned to facilitate the operation of the system.Careful routing of the pipeline will minimise thenumber of costly fittings required.Isolating valvesIsolating valves should be installed at one- or twokilometreintervals on transmission mains. Wherepossible, these should be combined with air-releasevalves. Pressure-relief valves should be installed onpumping mains to avoid damage caused by pumpingagainst closed valves.In reticulation networks, isolating valves should beprovided so that not more than four valves need to beclosed to isolate a section of main. Valves should bespaced so that the total length of main included in anisolated section does not exceed a nominal 600 m. Thiswill obviously depend on circumstances.In order to facilitate identification, valves should belocated at street corners opposite erf corner boundary(splay) pegs, and intermediate valves opposite thecommon boundary peg for two erven.Where pipes intersect, isolating valves shouldgenerally be installed in the smaller-diameterbranches.Isolating valves should be installed to facilitatemaintenance of the main, and generally located to suitthe topography.To reduce cost, isolating valves in larger mains may beof lesser size than the pipeline. The design shouldensure that the cost of the smaller valve, together withreducers, is less than the cost of a full-size valve. Inaddition, care should be taken to ensure that velocitiesthrough the valve are not excessive.Depending on the size of the valve and theunbalanced pressure across the valve, devices such asthrust bearings, spur gearing and a separate bypassvalve may be required.When flanged isolating valves are used, a flangeadaptor coupling should be installed to facilitateremoval of the valve.Air valvesAir valves are required to release air from the pipelineduring the filling process and during normal operation.Whereas automatic small-orifice air-release valves aredesirable, these may be replaced with public standpipesor other suitable distribution points. As air-releasevalves require servicing from time to time, it isrecommended that a gate valve be installed with theair-release valve for easy removal and repair.Where possible, pipelines should be laid such that theneed for air valves is avoided. Fire hydrants can also beused to vent the main during charging.Air valves are a possible source of contamination, andthe air-valve installation arrangements should be suchthat contamination of the system cannot occur, whilean adequate air flow for the valve is always maintained.26Chapter 9Water supply
GUIDELINES FOR <strong>HUMAN</strong> <strong>SETTLEMENT</strong> <strong>PLANNING</strong> <strong>AND</strong> DESIGNAir valves should be provided to suit the longitudinalsection of the pipeline in relation to the hydraulicgradient.Air valves should be sized according to the air flowrate generated by the rate of inflow or outflow of thewater in the pipeline.Air valves should be installed with an isolating valveon the air valve branch to facilitate maintenance, andshould preferably be fitted with a cock tapped into thebottom of the valve body, to enable the effectiveoperation of the valve to be checked.Scour valves and outletsScour valves should be installed at low points inpipelines with a diameter of 80 mm or more. A scourvalve comprises a hand-operated valve on a drainpipeof a diameter 0,4 to 0,6 times the diameter of the pipebeing drained. There should be an open drain to leadthe washout water to a suitable watercourse.Scour outlets not connected to a stormwater drainsystem should be designed to limit the erosion causedby the escaping water.In reticulation networks, a fire hydrant should, ifpossible, be positioned so that it can be used as a scourvalve. Dead-end mains should terminate in a scourpoint.Scour outlets should be sized to permit completedraining of a section of main between isolating valveswithin two hours.Anti-vacuum valvesAnti-vacuum (or air-admission) valves should beprovided downstream of each section valve in atransmission pipeline, to prevent the build-up of avacuum when the section valve is being closed. Mostair-release valves also act as air-admission valves.Break-pressure devicesBreak-pressure devices may be either break-pressuretanks or pressure-reducing valves.Where possible, break-pressure tanks should becombined with balancing tanks.When used, pressure-reducing valves should beprovided with a pressure-relief valve on the outletside, to prevent the possible build-up of pressureresulting from failure of the pressure-reducing valve tooperate correctly. The discharge from the relief valveshould be conspicuous when it occurs.The installation should also be provided with a dirtbox upstream of, and a bypass pipe around, thepressure-reducing valve, complete with an isolatingvalve protected against accidental opening. A pressuregauge should be provided on both the upstream anddownstream sides of the dirt box.Marker postsMarker posts should be placed along the pipelines atintervals sufficient to facilitate location of the route.Marker posts should also be placed at all pipe bends,junctions, and other features.Anchorage and thrust blocksAnchorage and thrust blocks should be used wheneverthe pipeline changes vertical or horizontal direction bymore than 10º. Thrust blocks should also be usedwhere the size of the pipeline changes, at blank ends,and on steep slopes (more than 1:6).Surge controlThe likelihood of pressure surges should beinvestigated and, where necessary, provision made forsurge control.Valve chambersSufficient working space to allow a spanner to be usedon all bolts should be provided in chambers forisolating, air and other valves.Venting of air-valve chambers should allow foradequate air flow.Roof slabs should be designed to allow for removaland replacement of the valve.Valve chambers should, where possible, be finishedproud of the final ground level.Where necessary, the design should make provision forthe possibility of differential settlement between thevalve chamber and the pipeline.WATER STORAGEGeneralThe purpose of storing water is to meet balancingrequirements and cater for emergencies (e.g. firefighting)or planned shut-downs.The balancing volume is required to cater for peakoutflows while a constant (or variable) inlet flow isbeing received.Reservoir storageWhere water is obtained from a bulk water supplyWater supply Chapter 927
GUIDELINES FOR <strong>HUMAN</strong> <strong>SETTLEMENT</strong> <strong>PLANNING</strong> <strong>AND</strong> DESIGNauthority, the storage capacity provided should complywith the requirements of the authority. A storagecapacity of 48 hours of annual average daily demandis suggested, although there may be situations where24 hours will suffice.The nominal capacity for elevated storage, based onthe typical period involved in power failures, is givenin Table 9.16.The nominal capacity of the duty pump should beequivalent to the sum of the instantaneous peakdemand and the fire demand (obtained from thesection on provision of water for fire-fighting), or theinstantaneous peak demand plus an allowance of20%, whichever is the greater.All pumps should be rated for similar duties so thatthey are interchangeable.The standby power source should operateautomatically in the event of an electricity supplyfailure.Under certain limited circumstances, as an alternativeto providing elevated storage and pumps, a schemecomprising booster pumps (variable speed can also beconsidered) delivering directly into the reticulation canbe considered. The total cost, including running andmaintenance, should be taken into account. This typeof scheme is, however, not a preferred option.The capacity of the supply main to the reservoir shouldbe designed to provide an inflow rate to the reservoirof not less than 1,5 x annual average daily demand forthe area served by the reservoir.Note should be taken of existing water consumptionpatterns that can be applied to the area to be servedby the planned service reservoir. Demand patternsshould lead the design engineer at all times.It will be to the advantage of the local authority tomake use of optimal design techniques fordetermining reservoir storage, like the time-simulationand the critical-period techniques. Both these methodswere developed in the mid-1980s and make full use ofthe interrelationship between the feeder-maincapacity and the reservoir capacity. The timesimulationtechnique is based on analysing riverreservoir behaviour. The critical-period technique isbased on the relationship between the total storagerequired and the feeder-main capacity. If use is madeof the techniques mentioned, 48 hours’ storagecapacity need not be provided.Caution should be exercised when determining thecapacity of reservoirs – too large a reservoir may causeproblems associated with stagnant water.Other storage reservoirsStorage reservoirs may also be required for thefollowing primary purposes:• water collection from various sources;• to provide contact time for a certain watertreatment operation, such as chlorination; and• to provide water to a pump station (boosterreservoir).A reservoir may be either at ground level or elevated.Location of service reservoirsWhere the main storage reservoir also serves as theservice reservoir (i.e. it supplies water at the requiredpressure to the farthest point in the area), thereservoir should be located near the centre of thearea. In flat areas this may be achieved by constructingan elevated tank at the centre. In undulating areas itwill usually be more advantageous to select thehighest point for its construction. By locating the tankas close to the centre as possible, distribution pipecosts can be minimised, and a more even distributionof pressure achieved.Alternatively, the reservoir could be situated betweenTable 9.16:Elevated storage capacityPUMPING PLANT SERVING THE ELEVATED STORAGE FACILITYCAPACITY OF ELEVATED STORAGE(HOURS OF INSTANTANEOUS PEAK DEM<strong>AND</strong>)*One electrically driven duty pump, plus one identical 2electrically driven standby pump, plus standby powergeneration independent of the electricity supply.One electrically driven duty pump, plus one identical 4electrically driven standby pump* derived as described in the section above on peak factors.28Chapter 9Water supply
GUIDELINES FOR <strong>HUMAN</strong> <strong>SETTLEMENT</strong> <strong>PLANNING</strong> <strong>AND</strong> DESIGNthe distribution area and the source of supply, or atthe highest point surrounding the distribution area toobviate the need for elevated storage.It is also advisable that, if possible, the difference inelevation of the highest water level in the storagereservoir and the lowest laid pipeline should not bemore than 60-70 m. If this difference is greater it maybe necessary to provide break-pressure devices in thedistribution system.Intermediate storageThe provision of intermediate storage can have anumber of objectives, the most important of whichare:• a reduction in the sizes of the main distributionpipes, by reducing the peak-flow demand of thesemains;• a reduction in pipeline pressures;• a reduction of the impact of supply breakdowns;• a division of the supply into smaller subsectionswhich can be more easily managed by communityorganisations; and• a reduction in the size of the main storagereservoir, in terms of both balancing storage andemergency storage.The provision of intermediate storage will usually beeconomically feasible only in areas where thetopography is steep enough to obviate the need forelevated storage, or where undulating topographydictates the need for different pressure systems fordifferent sections of the community.The selection and design of intermediate storage willbe based on criteria similar to that for bulk-storagereservoirs.On-site storage is discussed in the section on “Terminalconsumer installations” elsewhere in this chapter.DISTRIBUTION NETWORKSGeneralOne of the most important requirements for aneconomic distribution system is the location of theservice reservoir as near to the distribution network aspossible. Among other advantages, peaks are evenedout and fire protection can be more easily achieved.General requirements for distributionnetwork design• The maximum head during the reticulation (understatic conditions) should not exceed 90 m.• The minimum head during the design peak flowshould be according to Table 9.17.• Minimum pipe sizes should not be less than 50 mm(internal diameter).• Major reticulation pipes should be sized to suit thedesign period.• It is advantageous to use the minimum number ofdifferent pipe sizes to reduce the holding stockrequired for maintenance and repair.• Wherever possible, pipelines should be laid in roadreserves and preferably not pass throughresidential or privately owned property.• Pipelines on private land should be protected byservitudes in favour of the service owner.• Where pipelines need to cross roads, care should betaken to ensure that the pipe is well bedded and ata sufficient depth (min 0,8 m cover). It is advisableto maintain a larger-diameter pipe for roadcrossings than may be required from designconsiderations.• Comments in the section on valves and otherfittings are also valid for distribution networks.Table 9.17:Residual pressuresTYPES OF DEVELOPMENTMINIMUM HEAD UNDERINSTANTANEOUS PEAKDEM<strong>AND</strong> (m)MAXIMUM HEADUNDER ZERO FLOWCONDITIONS (m)Dwelling houses: house connections 24* 90Dwelling houses: yard taps + yard tanks 10* 90* Plus the height difference between the main and the highest ground level at any point on the erf not exceeding50 m from the boundary adjacent to the main. A minimum head of 5 m for site-specific cases (e.g. developingon top of a hill) may be considered.Water supply Chapter 929
GUIDELINES FOR <strong>HUMAN</strong> <strong>SETTLEMENT</strong> <strong>PLANNING</strong> <strong>AND</strong> DESIGN• Where air valves and scour valves are required, tapson standpipes or at other terminals should be sitedto fulfil this function wherever possible.• Isolating valves should be located at street corners,or opposite erf corner boundary pegs.• Where pipes intersect, isolating valves should beinstalled in the smaller-diameter branches.• Pipes should not rise above the hydraulic gradeline.• Flushing points (or fire hydrants) should beprovided where dead-end mains cannot beavoided.• A developing practice, “skeletonising” of thenetwork, should be considered where developingareas’ services are subject to future upgrading.Residual pressuresThe reticulation system should be designed so that theresidual pressure in the reticulation main at any pointis within the limits given in Table 9.17 (the desirableresidual pressures applicable during fire-flowconditions are given in Table 9.20).MATERIALSConsiderations in the selection ofmaterialsMost of the materials referred to in these guidelinesare listed and described in the relevant sections of theSABS 1200 series and SABS product specifications.Refer to product specifications for details of workingpressures and dimensions of pipes made from thealternative materials. Specifications other than SABSshould also be consulted where no applicable SABSspecifications exist (e.g. ISO).The materials suitable for use on a particular projectand the internal and external corrosion-protectionsystems for the pipes, joints, fittings and specials maybe specified by the controlling authority. If not, thefollowing factors should be considered when selectingsuitable materials:• the life-cycle cost (initial capital plus maintenancecosts);• the chemical composition of the water to bedistributed or stored (for example, certain types ofpipes may not be advisable for conveying waterwith a Langelier Saturation Index of less than -0,5,and a detailed assessment of the circumstances willbe necessary in such cases); brass fittings, couplings,valves, etc, particularly if soft water is conveyed,should be especially resistant to de-zincification;• the corrosive nature of the soil and ground water, andthe possible existence of stray electric currents; and• the structural strength of the pipes and reservoirs.Circumstances requiring particular attention are heavingclay soils, dolomitic areas and high external loading.In the case of rigid pipes of small diameter, thedesigner should check for the possibility of beam-typefailure. SABS Code of Practice 0102:1987 – Part 2 givesguidelines on the external loadings that can be appliedto buried pipelines. The minimum class of pipe, from astructural consideration, should be Class 9.Materials for pipelines• Cast iron, steel and galvanised steel are thestrongest pipe materials and should be used wherehigh operating pressures are expected. The cost offittings, especially at high pressures, and thesusceptibility of these pipes to corrosion, should,however, be kept in mind. Joint types includethreaded, Viking Johnson-type flexible couplings,continuously welded, flanged or spigot and sockettypes with rubber rings.• Fibre-cement (asbestos-cement, FC) pipes cost lessthan iron and steel pipes. FC pipes shouldpreferably be bitumen-dipped. Care must beexercised to ensure good bedding of the pipeswhen they are installed, as they are susceptible tofracturing as a result of ground movements.Couplings include asbestos-cement sleeves withrubber rings, cast-iron flexible couplings, or VikingJohnson-type flexible couplings. FC bends are notrecommended.• Unplasticised polyvinyl chloride (uPVC) andmodified polyvinyl chloride (mPVC) provide easyjointingpipes and good corrosion resistance.However, PVC pipes suffer a loss in strength whenexposed to sunlight, and should therefore not bestored in the open. Pipes may be damaged bycareless handling and, as with FC pipes, must becarefully bedded, avoiding stones and hard edges.The preferred type of coupling is spigot and socketrubber ring joint.• Polyethylene (PE) pipes are supplied in rolls and arerelatively flexible. Thus the number of joints andbends is greatly reduced. PE does not deterioratesignificantly when exposed to sunlight. There aretwo types of polyethylene: low-densitypolyethylene and high-density polyethylene. Lowdensity PE is mainly used for irrigation purposes.High-density PE is suitable for small-diametermains, secondary pipelines and service pipes. Jointson larger diameter HDPE pipes are typically made30Chapter 9Water supply
GUIDELINES FOR <strong>HUMAN</strong> <strong>SETTLEMENT</strong> <strong>PLANNING</strong> <strong>AND</strong> DESIGNby butt-welding. On smaller pipe sizes,compression-type joints are used.• Reinforced and pre-stressed concrete are suitablefor long, large-diameter transmission lines. Bothtypes have considerable strength and are resistantto corrosion. Spigot and socket joints are used formost reinforced concrete pipes. Pre-stressed pipejointingsystems can vary, and depend to someextent on the pre-stressing design.• Glass-reinforced polyester pipes have been madeavailable on the market recently. Various projectshave been completed successfully using thesepipes. The pipes are also suitable for long and largetransmission lines. No corrosion control is requiredand the pipe compares favourably with the PEpipe.Materials for communication pipesMaterials generally suitable for communication pipesare:• galvanised steel with screwed and socketed jointsor Viking Johnson-type flexible couplings; and• polypropylene (PP), high-density polyethylene(HDPE) and low-density polyethylene (LDPE) withexternal compression-type joints.Where pipes are laid in aggressive soils, especiallywhere moisture is retained in the soil under a pavedsurface, metallic pipes must be well protected againstcorrosion. Plastic pipes are more suitable under theseconditions.Materials for reservoirsLarge reservoirs (>200 m 3 ) are usually constructed ofsteel or reinforced concrete. Elevated tanks of steelpanels have proved reasonably successful in areasaway from the aggressive coastal environment. Linedearth reservoirs with floating covers, or concretereservoirs with floating covers, are an economicalchoice for ground reservoirs in South Africa.For smaller (
GUIDELINES FOR <strong>HUMAN</strong> <strong>SETTLEMENT</strong> <strong>PLANNING</strong> <strong>AND</strong> DESIGNCONSTRUCTIONGeneralDesigners ought to be aware of the need for jobcreation in the provision of services and facilities, andshould take this into account. It is also important toconsider the requirements of governmentdepartments, municipalities and other serviceauthorities in this regard. The decision as to whetherspecifications are to be modified in order to promotejob creation lies with the employer and is not discussedin these guidelines.National Standardised Specifications forEngineering ConstructionThe sections of SABS 1200 listed below arerecommended for general use:SABS 1200 A:SABS 1200 AA:SABS 1200 D:SABS 1200 DA:SABS 1200 DB:SABS 1200 G:SABS 1200 GA:SABS 1200 L:SABS 1200 LB:SABS 1200 LF:SABS 1200 LK:SABS 1200 LN:Watertightness testGeneralGeneral (Small works)EarthworksEarthworks (Small works)Earthworks (Pipe trenches)Concrete (Structural)Concrete (Small works)Medium pressure pipelinesBedding (pipes)Erf connectionsValvesSteel pipe and liningsFor the requirements and tests for watertightness ofreinforced concrete reservoirs and elevated storagefacilities, refer to Clause 3.3.38 of SABS 0120:1980 –Part 2, Section G.Disinfection of reservoirs and elevatedstorage facilitiesFollowing completion of construction, the structureshould be cleared of debris and the floor swept cleanusing damp sawdust, to prevent dust from rising. Thewalls and floors should be hosed down and the waterdrained away. Water should be admitted into thestructure to a depth of approximately 300 mm anduniformly chlorinated so as to attain a minimumchlorine residual of 10 mg/l.All internal surfaces of the structure, includingpipework, should be thoroughly hosed down with thechlorine solution. After all personnel have vacated thestructure, a quantity of the chlorinated solution shouldbe poured over the internal access ladder.The chlorinated solution should be drained prior tofilling the structure with potable water.Should it be necessary for the structure to be emptiedafter the initial filling so that personnel can gain accessto the water retaining portion of the structure, thenthe disinfection process described above should berepeated.Markers for valves and hydrantsThe positions of isolating valves and hydrants shouldbe clearly indicated by means of permanent markerposts located on the verge opposite the fitting, orpainted symbols on road or kerb surfaces.Symbols on markers should be durable. Where servicespass underneath national or provincial roads, markersshould be placed on both sides of the road reserve.Similarly, markers should be placed on both sides ofservitudes of other service providers.MANAGEMENT OF WATERDISTRIBUTION SYSTEMSGeneralIt is not the purpose of this section to discuss all thefunctions of management as far as water supplysystems are concerned. This section is primarily aimedat informing the engineer of the importance of thecontrol of unaccounted-for water in supply systems,and other aspects relating to regulations in thisregard. The Water Services Act requires that a WaterServices Authority should have full control of watersupply in its area of jurisdiction, and thereforeunaccounted-for water will be an integral part ofmanagement reports.Unaccounted-for waterThe SABS 0306 Code of Practice should be followed inaccounting for potable water within distributionsystems and in the corrective action to reduce andcontrol unaccounted-for water.The code also gives guidance on the design of waterreticulation systems with water management in mind,and gives guidance on leak detection and pipelinemonitoring.MeteringThe information required for accounting andmanagement is generated by proper metering. Theimportance of metering cannot be overemphasised.The Regulations relating to Compulsory NationalStandards and Measures to Conserve Water(Government Notice R 22355 dated 8 June 2001),published in terms of the Water Services Act, is a veryimportant document that governs the relationshipbetween the local authority and the consumer.32Chapter 9Water supply
GUIDELINES FOR <strong>HUMAN</strong> <strong>SETTLEMENT</strong> <strong>PLANNING</strong> <strong>AND</strong> DESIGNThe regulations stipulate that water to any consumermust be measured by means of a water-volumemeasuringdevice, and that all water be supplied interms of an agreement between the local authorityand the consumer. Metering water districts withinwater distribution schemes is also a requirement.Those involved in water supply to communities shouldtake note of these regulations.Guidelines for metering can be found in thecatalogues of meter suppliers.It is important to note the following requirements:• all mechanical meters must comply with SABSspecifications;• all meters must be installed according to themanufacturer’s instructions;• meters must be correctly sized;• meters are to be tested (and replaced if necessary)at regular intervals;• unmetered connections should not be allowed;• regular inspection of actual flow is required toconfirm meter sizes, where larger meters areinstalled;• meter installations should at all times correspondwith financial records;• prepaid water meters should be considered if thecommunity is in favour of this option;• meters must comply with the Trade Metrology Act(Act 77 of 1973); and• consumer installations must comply with SABS0252: Water supply and Drainage for Buildings.PROVISION OF WATER FOR FIRE-FIGHTINGGeneralThe provision of water for fire-fighting should complywith the requirements as described in SABS Code ofPractice 090:1972 – Community Protection against Fire,but with deviations from and additions to the code asdescribed below.Scope of the SABS Code of Practice090:1972The code covers recommendations for theorganisation of fire services, water supplies for firefighting,and by-laws relative to fire protection. Itincludes a fire-rating schedule.It is also intended for use by designers of water supplysystems for normal industrial areas, central businessdistricts and residential settlements. Specificallyexcluded from this document are special types ofdevelopment, such as bulk oil and fuel storagefacilities and airports. For these types of development,reference must be made to specific standards orregulations governing the fire-service requirements.Fire-risk categoriesAreas to be protected by a fire service should beclassified according to the following fire-riskcategories.High-risk areasThese areas in which the risk of fire and of the spreadof fire is high, such as congested industrial areas,congested commercial areas, warehouse districts,central business districts, and general residential areaswith floor space ratio of 1,0 and greater wherebuildings are four storeys and more in height(residential zone IV).Moderate-risk areasThese are areas in which the risk of fire and of spreadof fire is moderate, such as industrial areas, areaszoned “general residential” with a floor space ratio ofless than 1,0 (residential zones II and III) wherebuildings are not more than three storeys in height,and commercial areas normally occurring in residentialdistricts where buildings are not more than threestoreys in height.Low-risk areasThese are areas in which the risk of fire and the spreadof fire is low. This category is subdivided into fourgroups as follows.• Low-risk – group 1: Residential areas (residentialzone 1) where the gross floor area of the dwellinghouse, including outbuildings, is generally likely tobe more than 200 m 2 .• Low-risk – group 2: Residential areas (residentialzone 1) where the gross floor area of the dwellinghouse, including outbuildings, is likely to varybetween 100 m 2 and 200 m 2 .• Low-risk – group 3: Residential areas (residentialzone 1) where the gross floor area of the dwellinghouse, including outbuildings, is generally likely tobe less than 100 m 2 but more than 55 m 2 . Thisgroup includes low-cost housing schemes where thegross floor area of the dwelling house, includingWater supply Chapter 933
GUIDELINES FOR <strong>HUMAN</strong> <strong>SETTLEMENT</strong> <strong>PLANNING</strong> <strong>AND</strong> DESIGNoutbuildings and allowing for extensions by theowner, would generally not exceed 100 m 2 .Restrictions in force control the height and area ofbuildings, materials used in their construction andthe distances from common erf boundaries.Attached dwelling units are separated by a fire wallwith a minimum fire-resistance rating of one hour.• Low-risk – group 4: Residential areas (residentialzone 1) where the gross floor area of the dwellinghouse, including outbuildings, is generally notmore than 55 m 2 . This group includes low-costhousing schemes. Restrictions in force control theheight and area of buildings, materials used intheir construction and the distances from commonerf boundaries. Attached dwelling units areseparated by a fire wall with a minimum fireresistancerating of one hour.Fire protection in generalIn the case of areas not yet developed, a subdivision ofthe planned layout into areas or zones according tothe relevant fire-risk category should be made, takinginto account possible planning parameters such asfloor space ratios, height restrictions and buildingmaterialrestrictions.When water reticulation systems are being designedfor industrial areas, these areas should generally beclassified as moderate-risk.Where the reticulation in an industrial area has beendesigned on the basis of a moderate-risk classification,a limited number of high fire-risk types of industry cansubsequently be permitted to be established in thearea without warranting a re-classification of the areato the high-risk category. In this case, the approvalconditions for the establishment of the industry shouldspecify the provision of the extra water for firefighting(as deemed necessary by the fire department)which is over and above that allowed for in the designof the reticulation. Such provision could take the formof an additional supply to the site, or storage of wateron the premises, and would be provided at the cost ofthe applicant.Examples of high-risk types of development are:• timber-storage yards;• timber-clad buildings;• institutional buildings and buildings in whichhazardous processes are carried out; and• areas where combustible materials are storedwhich, because of the quantity of such materials,the extent of the area covered by the materials andthe risk of fire spread, may be deemed high-risk.In the case of existing developed areas, a survey of thefire hazards of the area should be made at intervals ofnot more than three years. Such a survey should takeaccount of the height, the type of construction, theoccupancy of the buildings, the means of approach tobuildings, the water supply available and any otherfeature affecting the fire risk.Should such a survey indicate the need for reclassificationof an area into a higher risk category,then the area should be re-classified accordingly, andthe chief fire officer, in conjunction with the localauthority engineer, must prepare a report forsubmission to the controlling authority, requestingthat the fire service be upgraded according to the newclassification.Water supply for fire-fightingThe elements in a water reticulation system for thesupply of water for fire-fighting are:• trunk main: the pipeline used for bulk watersupply;• water storage: reservoir and elevated storage;• reticulation mains: the pipelines in the reticulationto which hydrants are connected; and• hydrants: these may be of the screw-down orsluice-valve type.The capacity of the above elements is determinedaccording to the category of fire risk applicable.The fire flow and hydrant flow for which the waterreticulation is designed should be available to the firefightingteam at all times. Close liaison between thewater department of the local authority and the fireservice should be maintained at all times, so that thewater department can be of assistance in times ofemergency – for example, isolating sections of thereticulation in order to increase the quantity of wateravailable from the hydrants at the scene of the fire.Note:Low-risk – Group 4 categoryNo specific provision for fire-fighting water is made intrunk mains, water storage, or reticulation mains inthese areas. Hydrants should, however, be located atconvenient points in the area on all mains of 75 mmnominal internal diameter and larger, and in thevicinity of all schools, commercial areas and publicbuildings.Fire-fighting in areas zoned Low-risk – Group 4 shouldgenerally be carried out using trailer-mounted watertanks or fire appliances that carry water, which can ifnecessary be replenished from the hydrants providedin the reticulation.34Chapter 9Water supply
GUIDELINES FOR <strong>HUMAN</strong> <strong>SETTLEMENT</strong> <strong>PLANNING</strong> <strong>AND</strong> DESIGNDevelopment within areas falling into the Low-risk –Group 4 category, and which qualify for inclusion inhigher risk categories, should be protected accordingto the relevant category as outlined in the Code ofPractice and these Guidelines.Design of trunk mainsThe mains supplying fire-risk areas should be designedso that the supply is assured at all times.Trunk mains serving fire-risk areas should be sized fora design flow equivalent to the sum of the designinstantaneous peak domestic demand for the areaserved by it, and the fire flow given in Table 9.18.Where an area served by the trunk main incorporatesmore than one risk category, then the fire flowadopted should be for the highest risk categorypertaining to the area.Water storageGround reservoirsThe storage capacity of reservoirs serving fire areasshould, over and above the allowance for domesticdemand, include for the design fire flow obtainedfrom Table 9.18 for a duration at least equal to thatgiven in Table 9.19.Where an area served incorporates more than one riskcategory, then the design fire flow and duration usedshould be for the highest risk category pertaining tothe area served by the reservoir.Elevated storageThere need be no provision for storage of water forfire-fighting when the pumping plant serving theelevated storage facility is sized to deliver the sum ofthe instantaneous peak demand and the fire flowobtained from Table 9.18, or the instantaneous peakdemand plus an allowance of 20%, whichever is thegreater. A standby pumping plant should also beprovided.Reticulation mainsReticulation mains in fire areas should be designedaccording to the design domestic demand required.The mains should, however, have sufficient capacity tosatisfy the criteria given in Table 9.20.The minimum residual head should be obtained withthe hydrant discharging at the minimum hydrant flowrate, assuming the reticulation is operating under acondition of instantaneous peak domestic demand atthe time.The water reticulation design for each reservoir supplyzone should be checked for compliance with thisparagraph on the minimum basis of the following:High-risk and moderate-risk areasThe group of hydrants (see Table 9.18) included in eachcritical area in the reticulation are in usesimultaneously. Critical areas should be checkedindividually.Low-risk areas• Areas of less than 2 000 dwelling units:assume one hydrant in use at a time; eachcritical area should be checked individually;• Areas of 2 000 and more dweling units:assume a hydrant in each critical area in usesimultaneously on the basis of one hydrantper 2 000 dwelling units or part thereof.Table 9.19:FIRE-RISK CATEGORYDuration of design fire flowDURATION OFDESIGN FIRE FLOW (h)High-risk 6Moderate-risk 4Low-risk – Group 1 2Low-risk – Group 2 1Low-risk – Group 3 1Low-risk – Group 4N/ATable 9.18:Design fire flowFIRE-RISK CATEGORYMINIMUM DESIGNFIRE FLOW(l/min)MAXIMUM NUMBER OF HYDRANTSDISCHARGING SIMULTANEOUSLYHigh-risk 12 000Moderate-risk 6 000All hydrants within a radius of 270 m of the fireLow-risk – Group 1 900 1Low-risk – Group 2 500 1Low-risk – Group 3 350 1Low-risk – Group 4 N/A N/AWater supply Chapter 935
GUIDELINES FOR <strong>HUMAN</strong> <strong>SETTLEMENT</strong> <strong>PLANNING</strong> <strong>AND</strong> DESIGNTable 9.20:Fire-flow design criteria for reticulation mainsFIRE-RISK CATEGORYMINIMUM HYDRANT FLOW RATEFOR EACH HYDRANT (l/min)MINIMUM RESIDUAL HEAD (m)High-risk 1 500* 15Moderate-risk 1 500* 15Low-risk – Group 1 900 7Low-risk – Group 2 500 6Low-risk – Group 3 350 6Low-risk – Group 4 N/A N/A*With a design maximum of 1 600 l/min per hydrantHydrantsHydrants should not be provided off mains smallerthan 75 mm diameter.Hydrants should be located in vehicular thoroughfaresand opposite erf boundary pegs, and according toTable 9.21.The hydrants for the high-risk and moderate-riskcategories should be the 75 mm diameter sluice-valvetype. For the low-risk category, the hydrant may be thescrew-down type.In the case of new developments, hydrant types shouldbe similar to those used by an adjacent metropolitanarea, if relevant.The location of hydrants should be clearly indicated.Hydrants should be serviced and the flow rate checkedfor conformity with Table 9.20 at intervals notexceeding one year.Isolating valvesIn reticulation networks, isolating valves should beprovided so that not more than four valves need to beclosed to isolate a section of main, and so that thetotal length of main included in an isolated sectiondoes not exceed a nominal 600 m.Valves should be located at street corners opposite erfcorner boundary (splay) pegs, and intermediate valvesopposite the common boundary peg between twoerven.Fire protection in developing and ruralareasFire protection in developing and rural areas needsspecial attention. Designers of water-reticulationsystems should accept that the local unavailability offire-fighting resources at the time of design will mostcertainly change during the lifetime of the scheme. Itis not suggested that the design of systems beaccording to the guidelines given for developed areas,but designers should consider the following:• Whatever fire-fighting equipment is providedshould be compatible with that of the surroundingarea; close liaison with the responsible emergencyservices agency is considered essential.• The provision of permanent equipment – like firehydrants at business sites and institutional erven –should be considered and the type and locationshould be chosen to minimise vandalism or illegaluse.• The accessibility of the area and the space requiredfor vehicles used by fire-fighting services should betaken into account.Table 9.21:Location of hydrantsFIRE-RISK CATEGORYLOCATION OF HYDRANTSHigh-riskModerate-riskLow-risk – Group 1Low-risk – Group 2Low-risk – Group 3Low-risk – Group 4distance apart: 120 m maximumdistance apart: 180 m maximumdistance apart: 240 m maximumdistance apart: 240 m maximumdistance apart: 240 m maximumConvenient points on mains 75 mm diameter and larger36Chapter 9Water supply
GUIDELINES FOR <strong>HUMAN</strong> <strong>SETTLEMENT</strong> <strong>PLANNING</strong> <strong>AND</strong> DESIGN• Dams and rivers could be utilised by placinghydrants close by for the purpose of pumpingwater from them.• Close liaison with the community is required todetermine what fire-protection arrangements existand whether these should be revised.• Where water-reticulation networks are designed,consideration should be given to their possiblefuture upgrading, and allowance should be madefor fire flow in pipelines, taking into considerationthe other factors mentioned above. Referenceshould also be made to “skeletonising” (seeGlossary).Water supply Chapter 937
GUIDELINES FOR <strong>HUMAN</strong> <strong>SETTLEMENT</strong> <strong>PLANNING</strong> <strong>AND</strong> DESIGNGLOSSARYBalancing storage refers to the volume required in astorage reservoir to cater for peak flows whilereceiving a constant inlet flow.Developing areas are considered to be those areaswhere the services to be installed are subject to futureupgrading.Developed areas are considered to be those areaswhere the services installed are not subject to futureupgrading (i.e. the services are already at the highestintended level).Fire hose: flexible pipe used for fire-fighting purposes,suitable for connection to a hydrant.Fire flow: the rate of flow of water required by thefire-fighting service for the extinguishing of fires.Hydrant: a valve-controlled outlet on the waterreticulation system to which a fire hose can beattached, either directly or with an adaptor orstandpipe.Hydrant flow: the discharge rate of water from ahydrant.Package water treatment plant: a prefabricatedpurification plant that is assembled on site. It may ormay not require small civil construction works andpiping for complete functioning.Peak factor: a dimensionless value, indicating therelationship between peak consumption and averageconsumption.Residual head: the pressure in the water main at thehydrant take-off point while the hydrant isdischarging.Skeletonising: is the practice of designing andinstalling major reticulation pipes for a future higherlevel of service (which implies that the system will havespare capacity under present conditions.)Turbidity: a measure of the resistance of water to thepassage of light through it; it is caused by suspendedor colloidal matter in the water.Water transmission: means the transport of waterfrom the source to the treatment plant (if there is one)and onward to the distribution area.BIBLIOGRAPHY <strong>AND</strong> RECOMMENDEDREADINGCollins, S (2000). Hand-dug shallow wells. SKAT.DFID (2000). A new approach for the design of watersupply systems in developing countries. DFID Water.Department for International Development.November.DWAF (1992). Guidelines for the selection of designcriteria. Revision 1. Department of Water Affairs,Bophuthatswana.DWAF (1994). White Paper on water supply andsanitation policy. Water – an indivisible national asset.Department of Water Affairs & Forestry.DWAF (1997). Minimum standards and guidelines forgroundwater resource development for thecommunity water supply and sanitation programme.Department of Water Affairs & Forestry.DWAF (2000a). Proposed regulations dealing withcontracts between water services authorities andwater service providers. Department of Water Affairsand Forestry.DWAF (2000b). Water services development plans:Unpacking the starter tables. Water Services MacroPlanning & Information Systems, Department of WaterAffairs & Forestry.DWAF (2000c). Water supply service levels: A guide forlocal authorities. Department of Water Affairs &Forestry.DWAF (1999). Draft tariff regulations for waterservices tariffs – A guideline for local government.Department. of Water Affairs & Forestry. January.DWAF (2001a). Free basic water – A summary for localauthorities. Department of Water Affairs & Forestry.DWAF (2001b). Free basic water provision – Key issuesfor local authorities. Department of Water Affairs &Forestry.DWAF (2001c). Free basic water: Case studies.Department of Water Affairs & Forestry.DWAF (2001d). Free basic water: Press releases.Department of Water Affairs & Forestry.DWAF (2001e). Guidelines for water servicesauthorities. Directorate Macro Planning andInformation Systems, Department of Water Affairs &Forestry.38Chapter 9Water supply
GUIDELINES FOR <strong>HUMAN</strong> <strong>SETTLEMENT</strong> <strong>PLANNING</strong> <strong>AND</strong> DESIGNDWAF (2001f). WSDP Preparation guide – Draft.Department of Water Affairs & Forestry.DWAF (2002). Guidelines for the implementation ofwater conservation / water demand management inthe water services sector. Department of Water Affairs& Forestry.Hazelton, D G (2000). The development of effectivecommunity water supply systems using deep andshallow well handpumps. WRC Report TT 132/00.IRC (1980). Public standpost water supplies: a designand construction manual. International ReferenceCentre for Community Water Supply and Sanitation.Technical Parer no 14. The Hague, Netherlands.IRC (1983). Hand pumps for use in drinking watersupplies in developing countries. InternationalReference Centre for Community Water Supply andSanitation. The Hague, Netherlands.Marx, C J and Johannes, W G (1988). Comparisonbetween a rapid gravity filtration and a slow sandfiltration water treatment plant. Proceedings:Quinquennial Convention of the South AfricanInstitution of Civil Engineering. University of Pretoria,Pretoria.McDonald, D and Pape, J (2002). Cost recovery is notsustainable: Mail & Guardian. Online, September.Okun, D A and Schultz, C R (1983). Practical watertreatment for communities in developing countries.Aqua, no 1.Olivier, J (2002). Fog-water harvesting along the WestCoast of South Africa: A feasibility study. Water SA, Vol28, No 4. October.RSA (2001). Water Services Act, 1997 - Regulationsrelating to compulsory national standards andmeasures to conserve water. Water Services Act, 1997.Government notice R22355. 8 June.Smit, A J (2000). Water consumption of domesticconsumers with specific reference to GermistonCouncil in Gauteng. University of Pretoria.Thanh, N C and Hettiaratchi, J P A (1982). Surfacewater filtration for rural areas: guidelines for design,construction and maintenance. EnvironmentalSanitation Information Centre, Bangkok.Van Vuuren, S J and Van Beek, J C (1997). Herevalueringvan die bestaande riglyne vir stedelike enindustriële watervoorsiening gebaseer op gemetewaterverbruike - Fase 1, Pretoria voorsieningsgebied.WRC Report 705/1/1997.Waterlines (1999). Household water treatment. Vol 17,No 3. January.Weaver, J M C (Ed) (undated). Test pumping standardsfor South Africa. Groundwater Division, GeologicalSociety of South Africa.WEDC (2002). Disability, water and sanitation. Water,Issue 15. November.WRC (1997). Package water treatment plant selection.Report no 450/1/1997. Water Research Commission,Pretoria.WRC (1998). Novel groundwater pump developed forrural areas. SA Waterbulletin. Oct/Nov.WRC (2002a). Clouds on tap. The Water Wheel. Vol 28,No 4. Nov/Dec.WRC (2002b). The location and siting of waterboreholes, SABS 0299 Series: Part 1. The Water Wheel.Vol 28, No 4. Nov/Dec.Water supply Chapter 939
GUIDELINES FOR <strong>HUMAN</strong> <strong>SETTLEMENT</strong> <strong>PLANNING</strong> <strong>AND</strong> DESIGN40Chapter 9Water supply
Chapter 10Sanitation10
GUIDELINES FOR <strong>HUMAN</strong> <strong>SETTLEMENT</strong> <strong>PLANNING</strong> <strong>AND</strong> DESIGNTABLE OF CONTENTSSCOPE . . . . . . . . . . . . . . . . . . . . . . . . . . . . . . . . . . . . . . . . . . . . . . . . . . . . . . . . . . . . . . . . . . . . . . . . . . . 1INTRODUCTION. . . . . . . . . . . . . . . . . . . . . . . . . . . . . . . . . . . . . . . . . . . . . . . . . . . . . . . . . . . . . . . . . . . . 1Sanitation improvement must be demand-responsive, and supported by an intensive health andhygiene programme . . . . . . . . . . . . . . . . . . . . . . . . . . . . . . . . . . . . . . . . . . . . . . . . . . . . . . . . . . . . . . . . 2Community participation . . . . . . . . . . . . . . . . . . . . . . . . . . . . . . . . . . . . . . . . . . . . . . . . . . . . . . . . . . . . 2Integrated planning and development . . . . . . . . . . . . . . . . . . . . . . . . . . . . . . . . . . . . . . . . . . . . . . . . . 2Sanitation is about environment and health . . . . . . . . . . . . . . . . . . . . . . . . . . . . . . . . . . . . . . . . . . . . . 2Basic sanitation is a human right . . . . . . . . . . . . . . . . . . . . . . . . . . . . . . . . . . . . . . . . . . . . . . . . . . . . . . 2The provision of access to sanitation services is a local government responsibility . . . . . . . . . . . . . . . . 2“Health for all” rather than “all for some” . . . . . . . . . . . . . . . . . . . . . . . . . . . . . . . . . . . . . . . . . . . . . . 2Equitable regional allocation of development resources. . . . . . . . . . . . . . . . . . . . . . . . . . . . . . . . . . . . 2Water has an economic value. . . . . . . . . . . . . . . . . . . . . . . . . . . . . . . . . . . . . . . . . . . . . . . . . . . . . . . . . 2The “polluter pays” principle . . . . . . . . . . . . . . . . . . . . . . . . . . . . . . . . . . . . . . . . . . . . . . . . . . . . . . . . . 2Sanitation services must be financially sustainable . . . . . . . . . . . . . . . . . . . . . . . . . . . . . . . . . . . . . . . . 2Environmental integrity . . . . . . . . . . . . . . . . . . . . . . . . . . . . . . . . . . . . . . . . . . . . . . . . . . . . . . . . . . . . . 2<strong>PLANNING</strong>. . . . . . . . . . . . . . . . . . . . . . . . . . . . . . . . . . . . . . . . . . . . . . . . . . . . . . . . . . . . . . . . . . . . . . . . 2HYGIENE IN SANITATION PROJECTS . . . . . . . . . . . . . . . . . . . . . . . . . . . . . . . . . . . . . . . . . . . . . . . . . . . . 2TECHNICAL INFORMATION . . . . . . . . . . . . . . . . . . . . . . . . . . . . . . . . . . . . . . . . . . . . . . . . . . . . . . . . . . 3Categories of sanitation systems . . . . . . . . . . . . . . . . . . . . . . . . . . . . . . . . . . . . . . . . . . . . . . . . . . . . . . 3Description of sanitation systems . . . . . . . . . . . . . . . . . . . . . . . . . . . . . . . . . . . . . . . . . . . . . . . . . . . . . . 4FACTORS AFFECTING THE CHOICE OF A SANITATION SYSTEM. . . . . . . . . . . . . . . . . . . . . . . . . . . . . . . 12General considerations . . . . . . . . . . . . . . . . . . . . . . . . . . . . . . . . . . . . . . . . . . . . . . . . . . . . . . . . . . . . . 12The cost of the system . . . . . . . . . . . . . . . . . . . . . . . . . . . . . . . . . . . . . . . . . . . . . . . . . . . . . . . . . . . . . 13Sanitation at public facilities . . . . . . . . . . . . . . . . . . . . . . . . . . . . . . . . . . . . . . . . . . . . . . . . . . . . . . . . 13DISPOSAL OF SLUDGE FROM ON-SITE SANITATION SYSTEMS . . . . . . . . . . . . . . . . . . . . . . . . . . . . . . . 13Composition of pit or vault contents . . . . . . . . . . . . . . . . . . . . . . . . . . . . . . . . . . . . . . . . . . . . . . . . . . 14Methods of emptying pits . . . . . . . . . . . . . . . . . . . . . . . . . . . . . . . . . . . . . . . . . . . . . . . . . . . . . . . . . . 14Sludge flow properties . . . . . . . . . . . . . . . . . . . . . . . . . . . . . . . . . . . . . . . . . . . . . . . . . . . . . . . . . . . . . 14Vacuum tankers . . . . . . . . . . . . . . . . . . . . . . . . . . . . . . . . . . . . . . . . . . . . . . . . . . . . . . . . . . . . . . . . . . 14Disposal of sludge. . . . . . . . . . . . . . . . . . . . . . . . . . . . . . . . . . . . . . . . . . . . . . . . . . . . . . . . . . . . . . . . . 15Sanitation Revised August 2003Chapter 10i
GUIDELINES FOR <strong>HUMAN</strong> <strong>SETTLEMENT</strong> <strong>PLANNING</strong> <strong>AND</strong> DESIGNEVALUATION OF SITES . . . . . . . . . . . . . . . . . . . . . . . . . . . . . . . . . . . . . . . . . . . . . . . . . . . . . . . . . . . . . 15Topographical evaluation . . . . . . . . . . . . . . . . . . . . . . . . . . . . . . . . . . . . . . . . . . . . . . . . . . . . . . . . . . . 15Soil profiles . . . . . . . . . . . . . . . . . . . . . . . . . . . . . . . . . . . . . . . . . . . . . . . . . . . . . . . . . . . . . . . . . . . . . . 16Percolation capacity of the site . . . . . . . . . . . . . . . . . . . . . . . . . . . . . . . . . . . . . . . . . . . . . . . . . . . . . . 16POLLUTION CAUSED BY SANITATION . . . . . . . . . . . . . . . . . . . . . . . . . . . . . . . . . . . . . . . . . . . . . . . . . . 16Surface pollution . . . . . . . . . . . . . . . . . . . . . . . . . . . . . . . . . . . . . . . . . . . . . . . . . . . . . . . . . . . . . . . . . 16Groundwater pollution. . . . . . . . . . . . . . . . . . . . . . . . . . . . . . . . . . . . . . . . . . . . . . . . . . . . . . . . . . . . . 16SULLAGE (GREYWATER) DISPOSAL . . . . . . . . . . . . . . . . . . . . . . . . . . . . . . . . . . . . . . . . . . . . . . . . . . . . 17General . . . . . . . . . . . . . . . . . . . . . . . . . . . . . . . . . . . . . . . . . . . . . . . . . . . . . . . . . . . . . . . . . . . . . . . . . 17Volumes . . . . . . . . . . . . . . . . . . . . . . . . . . . . . . . . . . . . . . . . . . . . . . . . . . . . . . . . . . . . . . . . . . . . . . . . 17Health aspects. . . . . . . . . . . . . . . . . . . . . . . . . . . . . . . . . . . . . . . . . . . . . . . . . . . . . . . . . . . . . . . . . . . . 17Disposal. . . . . . . . . . . . . . . . . . . . . . . . . . . . . . . . . . . . . . . . . . . . . . . . . . . . . . . . . . . . . . . . . . . . . . . . . 17Disposal systems . . . . . . . . . . . . . . . . . . . . . . . . . . . . . . . . . . . . . . . . . . . . . . . . . . . . . . . . . . . . . . . . . . 17Sullage treatment . . . . . . . . . . . . . . . . . . . . . . . . . . . . . . . . . . . . . . . . . . . . . . . . . . . . . . . . . . . . . . . . . 18TOILET PEDESTALS <strong>AND</strong> SQUATTING PLATES . . . . . . . . . . . . . . . . . . . . . . . . . . . . . . . . . . . . . . . . . . . . 18DESIGN OF VIP TOILETS. . . . . . . . . . . . . . . . . . . . . . . . . . . . . . . . . . . . . . . . . . . . . . . . . . . . . . . . . . . . . 18TOILET FACILITIES FOR PHYSICALLY DISABLED PERSONS . . . . . . . . . . . . . . . . . . . . . . . . . . . . . . . . . . . 18TRAINING OF MAINTENANCE WORKERS . . . . . . . . . . . . . . . . . . . . . . . . . . . . . . . . . . . . . . . . . . . . . . . 19UPGRADING OF SANITATION FACILITIES. . . . . . . . . . . . . . . . . . . . . . . . . . . . . . . . . . . . . . . . . . . . . . . . 19OFF-SITE WASTEWATER TREATMENT . . . . . . . . . . . . . . . . . . . . . . . . . . . . . . . . . . . . . . . . . . . . . . . . . . 20Pond systems. . . . . . . . . . . . . . . . . . . . . . . . . . . . . . . . . . . . . . . . . . . . . . . . . . . . . . . . . . . . . . . . . . . . . 20Package purification units . . . . . . . . . . . . . . . . . . . . . . . . . . . . . . . . . . . . . . . . . . . . . . . . . . . . . . . . . . 21APPENDIX A: INFORMATION REQUIRED FOR THE <strong>PLANNING</strong> <strong>AND</strong> DESIGN OF SANITATIONPROJECTS . . . . . . . . . . . . . . . . . . . . . . . . . . . . . . . . . . . . . . . . . . . . . . . . . . . . . . . . . . . 22COMMUNITY MANAGEMENT APPROACH . . . . . . . . . . . . . . . . . . . . . . . . . . . . . . . . . . . . . . . . . . . . . . 22Phase 1 . . . . . . . . . . . . . . . . . . . . . . . . . . . . . . . . . . . . . . . . . . . . . . . . . . . . . . . . . . . . . . . . . . . . . . . . . 23Phase 2 . . . . . . . . . . . . . . . . . . . . . . . . . . . . . . . . . . . . . . . . . . . . . . . . . . . . . . . . . . . . . . . . . . . . . . . . . 23Phase 3 . . . . . . . . . . . . . . . . . . . . . . . . . . . . . . . . . . . . . . . . . . . . . . . . . . . . . . . . . . . . . . . . . . . . . . . . . 23Phase 4 . . . . . . . . . . . . . . . . . . . . . . . . . . . . . . . . . . . . . . . . . . . . . . . . . . . . . . . . . . . . . . . . . . . . . . . . . 23Phase 5 . . . . . . . . . . . . . . . . . . . . . . . . . . . . . . . . . . . . . . . . . . . . . . . . . . . . . . . . . . . . . . . . . . . . . . . . . 23Phase 6 . . . . . . . . . . . . . . . . . . . . . . . . . . . . . . . . . . . . . . . . . . . . . . . . . . . . . . . . . . . . . . . . . . . . . . . . . 23iiChapter 10Sanitation
GUIDELINES FOR <strong>HUMAN</strong> <strong>SETTLEMENT</strong> <strong>PLANNING</strong> <strong>AND</strong> DESIGNPhase 7 . . . . . . . . . . . . . . . . . . . . . . . . . . . . . . . . . . . . . . . . . . . . . . . . . . . . . . . . . . . . . . . . . . . . . . . . . 23<strong>HUMAN</strong>-RELATED DATA . . . . . . . . . . . . . . . . . . . . . . . . . . . . . . . . . . . . . . . . . . . . . . . . . . . . . . . . . . . . 23Socio-cultural data . . . . . . . . . . . . . . . . . . . . . . . . . . . . . . . . . . . . . . . . . . . . . . . . . . . . . . . . . . . . . . . . 23Community preferences . . . . . . . . . . . . . . . . . . . . . . . . . . . . . . . . . . . . . . . . . . . . . . . . . . . . . . . . . . . . 23Economic and social conditions . . . . . . . . . . . . . . . . . . . . . . . . . . . . . . . . . . . . . . . . . . . . . . . . . . . . . . 24Health and hygiene conditions. . . . . . . . . . . . . . . . . . . . . . . . . . . . . . . . . . . . . . . . . . . . . . . . . . . . . . . 24Institutional framework . . . . . . . . . . . . . . . . . . . . . . . . . . . . . . . . . . . . . . . . . . . . . . . . . . . . . . . . . . . . 24Environmental and technical aspects . . . . . . . . . . . . . . . . . . . . . . . . . . . . . . . . . . . . . . . . . . . . . . . . . . 24INFORMATION REQUIRED FOR POST-PROJECT EVALUATION . . . . . . . . . . . . . . . . . . . . . . . . . . . . . . . . 24APPENDIX B: UPGRADING OF EXISTING SANITATION SYSTEMS . . . . . . . . . . . . . . . . . . . . . . . . . . . . . 26BASIC UPGRADING ALTERNATIVES . . . . . . . . . . . . . . . . . . . . . . . . . . . . . . . . . . . . . . . . . . . . . . . . . . . . 26Alternative 1 - Aesthetic upgrading . . . . . . . . . . . . . . . . . . . . . . . . . . . . . . . . . . . . . . . . . . . . . . . . . . . 26Alternative 2 - Introduction of a water seal. . . . . . . . . . . . . . . . . . . . . . . . . . . . . . . . . . . . . . . . . . . . . 26Alternative 3 - Removal of liquids from the site . . . . . . . . . . . . . . . . . . . . . . . . . . . . . . . . . . . . . . . . . 26UPGRADING ROUTES FOR THE VARIOUS SANITATION SYSTEMS . . . . . . . . . . . . . . . . . . . . . . . . . . . . . 26Group 1. . . . . . . . . . . . . . . . . . . . . . . . . . . . . . . . . . . . . . . . . . . . . . . . . . . . . . . . . . . . . . . . . . . . . . . . . 26Group 2. . . . . . . . . . . . . . . . . . . . . . . . . . . . . . . . . . . . . . . . . . . . . . . . . . . . . . . . . . . . . . . . . . . . . . . . . 26Group 3. . . . . . . . . . . . . . . . . . . . . . . . . . . . . . . . . . . . . . . . . . . . . . . . . . . . . . . . . . . . . . . . . . . . . . . . . 27Group 4. . . . . . . . . . . . . . . . . . . . . . . . . . . . . . . . . . . . . . . . . . . . . . . . . . . . . . . . . . . . . . . . . . . . . . . . . 27APPENDIX C: DESIGN GUIDELINES FOR WATERBORNE SANITATION SYSTEMS. . . . . . . . . . . . . . . . . . 28SCOPE . . . . . . . . . . . . . . . . . . . . . . . . . . . . . . . . . . . . . . . . . . . . . . . . . . . . . . . . . . . . . . . . . . . . . . . . . . 28DESIGN CRITERIA . . . . . . . . . . . . . . . . . . . . . . . . . . . . . . . . . . . . . . . . . . . . . . . . . . . . . . . . . . . . . . . . . 28Design flows . . . . . . . . . . . . . . . . . . . . . . . . . . . . . . . . . . . . . . . . . . . . . . . . . . . . . . . . . . . . . . . . . . . . . 28Hydraulic design . . . . . . . . . . . . . . . . . . . . . . . . . . . . . . . . . . . . . . . . . . . . . . . . . . . . . . . . . . . . . . . . . . 29Physical design . . . . . . . . . . . . . . . . . . . . . . . . . . . . . . . . . . . . . . . . . . . . . . . . . . . . . . . . . . . . . . . . . . . 30MATERIALS . . . . . . . . . . . . . . . . . . . . . . . . . . . . . . . . . . . . . . . . . . . . . . . . . . . . . . . . . . . . . . . . . . . . . . 33Pipes and joints. . . . . . . . . . . . . . . . . . . . . . . . . . . . . . . . . . . . . . . . . . . . . . . . . . . . . . . . . . . . . . . . . . . 33Manholes . . . . . . . . . . . . . . . . . . . . . . . . . . . . . . . . . . . . . . . . . . . . . . . . . . . . . . . . . . . . . . . . . . . . . . . 34Pumping installations . . . . . . . . . . . . . . . . . . . . . . . . . . . . . . . . . . . . . . . . . . . . . . . . . . . . . . . . . . . . . . 34Pipework. . . . . . . . . . . . . . . . . . . . . . . . . . . . . . . . . . . . . . . . . . . . . . . . . . . . . . . . . . . . . . . . . . . . . . . . 34Concrete . . . . . . . . . . . . . . . . . . . . . . . . . . . . . . . . . . . . . . . . . . . . . . . . . . . . . . . . . . . . . . . . . . . . . . . . 34Sanitation Chapter 10iii
GUIDELINES FOR <strong>HUMAN</strong> <strong>SETTLEMENT</strong> <strong>PLANNING</strong> <strong>AND</strong> DESIGNStructural steelwork . . . . . . . . . . . . . . . . . . . . . . . . . . . . . . . . . . . . . . . . . . . . . . . . . . . . . . . . . . . . . . . 34Electrical installations . . . . . . . . . . . . . . . . . . . . . . . . . . . . . . . . . . . . . . . . . . . . . . . . . . . . . . . . . . . . . . 34Other materials. . . . . . . . . . . . . . . . . . . . . . . . . . . . . . . . . . . . . . . . . . . . . . . . . . . . . . . . . . . . . . . . . . . 34GLOSSARY. . . . . . . . . . . . . . . . . . . . . . . . . . . . . . . . . . . . . . . . . . . . . . . . . . . . . . . . . . . . . . . . . . . . . . . 35BIBLIOGRAPHY <strong>AND</strong> RECOMMENDED READING . . . . . . . . . . . . . . . . . . . . . . . . . . . . . . . . . . . . . . . . . 35ivChapter 10Sanitation
GUIDELINES FOR <strong>HUMAN</strong> <strong>SETTLEMENT</strong> <strong>PLANNING</strong> <strong>AND</strong> DESIGNLIST OF TABLESTable 10.1 Categories of sanitation systems . . . . . . . . . . . . . . . . . . . . . . . . . . . . . . . . . . . . . . . . . . . . . . . . .4Table 10.2 Sullage generation . . . . . . . . . . . . . . . . . . . . . . . . . . . . . . . . . . . . . . . . . . . . . . . . . . . . . . . . . . .17Table C.1 Average daily flows per single-family dwelling unit (du) . . . . . . . . . . . . . . . . . . . . . . . . . . . . .28Table C.2 Minimum sewer gradients . . . . . . . . . . . . . . . . . . . . . . . . . . . . . . . . . . . . . . . . . . . . . . . . . . . . .30Table C.3 Minimum internal dimensions of manhole chambers and shafts . . . . . . . . . . . . . . . . . . . . . . .32Sanitation Chapter 10v
GUIDELINES FOR <strong>HUMAN</strong> <strong>SETTLEMENT</strong> <strong>PLANNING</strong> <strong>AND</strong> DESIGNLIST OF FIGURESFigure 10.1 Chemical toilet unit . . . . . . . . . . . . . . . . . . . . . . . . . . . . . . . . . . . . . . . . . . . . . . . . . . . . . . . . . . .5Figure 10.2 VIP toilet . . . . . . . . . . . . . . . . . . . . . . . . . . . . . . . . . . . . . . . . . . . . . . . . . . . . . . . . . . . . . . . . . . .6Figure 10.3 VIDP toilet . . . . . . . . . . . . . . . . . . . . . . . . . . . . . . . . . . . . . . . . . . . . . . . . . . . . . . . . . . . . . . . . . .6Figure 10.4 Ventilated vault toilet . . . . . . . . . . . . . . . . . . . . . . . . . . . . . . . . . . . . . . . . . . . . . . . . . . . . . . . . .7Figure 10.5 Urine-diversion toilet . . . . . . . . . . . . . . . . . . . . . . . . . . . . . . . . . . . . . . . . . . . . . . . . . . . . . . . . . .8Figure 10.6 Waterborne sewerage system . . . . . . . . . . . . . . . . . . . . . . . . . . . . . . . . . . . . . . . . . . . . . . . . . . .8Figure 10.7 Shallow sewer system . . . . . . . . . . . . . . . . . . . . . . . . . . . . . . . . . . . . . . . . . . . . . . . . . . . . . . . . .9Figure 10.8 Flushing toilet with conservancy tank . . . . . . . . . . . . . . . . . . . . . . . . . . . . . . . . . . . . . . . . . . . . .9Figure 10.9 Settled sewage system . . . . . . . . . . . . . . . . . . . . . . . . . . . . . . . . . . . . . . . . . . . . . . . . . . . . . . . .10Figure 10.10 Flushing toilet with septic tank and soakaway . . . . . . . . . . . . . . . . . . . . . . . . . . . . . . . . . . . . .11Figure 10.11 Aqua-privy toilet . . . . . . . . . . . . . . . . . . . . . . . . . . . . . . . . . . . . . . . . . . . . . . . . . . . . . . . . . . . .12Figure 10.12 Minimum dimensions of a toilet room for physically disabled persons . . . . . . . . . . . . . . . . . .19Figure C.1 Attenuation of peak flows . . . . . . . . . . . . . . . . . . . . . . . . . . . . . . . . . . . . . . . . . . . . . . . . . . . .29Figure C.2 Protection of pipes at reduced depths of cover (e.g. Class B bedding) . . . . . . . . . . . . . . . . . . .31Figure C.3 Steep drops in sewers . . . . . . . . . . . . . . . . . . . . . . . . . . . . . . . . . . . . . . . . . . . . . . . . . . . . . . . .32viChapter 10Sanitation
GUIDELINES FOR <strong>HUMAN</strong> <strong>SETTLEMENT</strong> <strong>PLANNING</strong> <strong>AND</strong> DESIGNSCOPEThe guidelines for sanitation provision cover aspectsthat need to be considered when planning andimplementing sanitation projects for existingresidential areas and developing communities. Theguidelines will also be of assistance where the WaterServices Authority compiles a Water ServicesDevelopment Plan (the latter forms part of themunicipality’s Integrated Development Plan).The guidelines will also assist in determining andsetting objectives, developing a strategy andidentifying the required planning activities forimplementing sanitation projects. Technical guidelinesare given for use in feasibility studies and the detaileddesign of sanitation provision.The guidelines form part of a planned series ofmanagement guidelines intended for use by decisionmakers. The series of guidelines is shown in Table 9.1of Chapter 9: Water Supply.INTRODUCTIONWater services (i.e. water supply and sanitation) inSouth Africa are controlled by the Water Services Act(Act 108 of 1997) and the National Water Act (Act 36of 1998). The Water Services Act deals with waterservices provision to consumers, while the NationalWater Act deals with water in its natural state.As in the case of water supply, the provision ofsanitation to a community should take place in termsof the relevant Water Services Development Plan,which is required in terms of the Water Services Act.The Water Services Development Plan (which should,of course, be compiled taking cognisance of theNational Sanitation Policy) defines the minimum levelof sanitation as well as the desired level of sanitationfor communities that must be adhered to by a WaterServices Provider in its area of jurisdiction. It describesthe arrangements for water services provision in anarea, both present and future. Water services are alsoto be provided in accordance with regulationspublished in terms of the Water Services Act.The provision of appropriate sanitation to acommunity should take place in accordance withnational policy. Among the major aims set out in theNational Sanitation Policy are the following:• to improve the health and quality of life of thewhole population;• to integrate the development of a community inthe provision of sanitation;• to protect the environment; and• to place the responsibility for household sanitationprovision with the family or household.The minimum acceptable basic level of sanitation is(Department of Water Affairs & Forestry, 2001):• appropriate health and hygiene awareness andbehaviour;• a system for disposing of human excreta,householdwastewater and refuse, which is acceptable andaffordable to the users, safe, hygienic and easilyaccessible, and which does not have anunacceptable impact on the environment; and• a toilet facility for each household.The safe disposal of human excreta alone does notnecessarily mean the creation of a healthyenvironment. Sanitation goes hand in hand with aneffective health-care programme. The importance ofeducation programmes should not be overlooked, andthe Department of Health is able to assist in this (referto the following section “Hygiene in sanitationprojects”).Sanitation education is part of the National SanitationPolicy and should embrace proper health practices,such as personal hygiene, the need for all familymembers (including the children) to use the toilet andthe necessity of keeping the toilet building clean.Education should also include the proper operation ofthe system, such as what may and may not be disposedof in the toilet, the amount of water to add ifnecessary, and what chemicals should or should not beadded to the system. The user must also be madeaware of what needs to be done if the system fails orwhat options are available when the pit or vault fillsup with sludge.Current policy is that the basic minimum facility shouldbe a ventilated improved pit (VIP) toilet, or itsequivalent. In this chapter, therefore, levels of servicelower than this will not be discussed.The use of ponds is frequently considered for dealingwith wastewater in rural areas, and hence theirinclusion in this document.The five main criteria to be considered when providinga sanitation system for a community are:• reliability;• acceptability;• appropriateness;• affordability; and• sustainability.With these criteria in mind, designers should note thefollowing principles from the White Paper on BasicSanitation Chapter 101
GUIDELINES FOR <strong>HUMAN</strong> <strong>SETTLEMENT</strong> <strong>PLANNING</strong> <strong>AND</strong> DESIGNHousehold Sanitation, September 2001:Sanitation improvement must bedemand-responsive, and supported by anintensive health and hygiene programmeHousehold sanitation is first and foremost a householdresponsibility and must be demand-responsive.Households must recognise the need for adequatetoilet facilities for them to make informed decisionsabout their sanitation options. For users to benefitmaximally, they must also understand the linkbetween their own health, good hygiene and toiletfacilities.Community participationCommunities must be fully involved in projects thatrelate to their health and well-being, and also indecisions relating to community facilities, such asschools and clinics. Communities must participate indecision-making about what should be done and how,contribute to the implementation of the decisions, andshare in the benefits of the project or programme. Inparticular, they need to understand the costimplications of each particular sanitation option.Integrated planning and developmentThe health, social, and environmental benefits ofimproved sanitation are maximised when sanitation isplanned for and provided in an integrated way withwater supply and other municipal services.The focal mechanism of achieving integrated planningand development is the municipality-driven IntegratedDevelopment Planning (IDP) process (of which theWater Services Development Plan is a component).Sanitation is about environment andhealthSanitation improvement is more than just theprovision of toilets; it is a process of sustainedenvironment and health improvement. Sanitationimprovement must be accompanied by environmental,health and hygiene promotional activities.Basic sanitation is a human rightGovernment has an obligation to create an enablingenvironment through which all South Africans cangain access to basic sanitation services.The provision of access to sanitationservices is a local governmentresponsibilityLocal government has the constitutional responsibilityto provide sanitation services.Provincial and national government bodies have aconstitutional responsibility to support localgovernment in a spirit of co-operative governance.“Health for all” rather than “all forsome”The use of scarce public funds must be prioritised, inorder to assist those who are faced with the greatestrisk to health due to inadequate sanitation services.Equitable regional allocation ofdevelopment resourcesThe limited national resources available to support theincremental improvement of sanitation services shouldbe equitably distributed throughout the country,according to population, level of development, andthe risk to health of not supporting sanitationimprovement.Water has an economic valueThe way in which sanitation services are provided musttake into account the growing scarcity of good qualitywater in South Africa.The “polluter pays” principlePolluters must pay the cost of cleaning up the impactof their pollution on the environment.Sanitation services must be financiallysustainableSanitation services must be sustainable, in terms ofboth capital and recurrent costs.Environmental integrityThe environment must be protected from thepotentially negative impacts of sanitation systems.<strong>PLANNING</strong>The various planning stages and other informationrelated to the planning of projects are fully describedin Chapter 9 (Water supply). The planning steps andapproach with respect to sanitation do not differ fromthose described in that chapter, and are not repeatedhere. The reader is thus referred to Chapter 9 forplanning information.HYGIENE IN SANITATION PROJECTSAn introductory discussion on hygiene in water andsanitation projects can be found in Chapter 9.2Chapter 10Sanitation
GUIDELINES FOR <strong>HUMAN</strong> <strong>SETTLEMENT</strong> <strong>PLANNING</strong> <strong>AND</strong> DESIGNFor people to change their cultural practices andbehaviours – some of which are developed arounddeeply seated values – a lot of motivation is required,accompanied by marketing of the new or modifiedpractices. For instance, when people are accustomedto defecating in the open (free of charge) it will takea lot of effort to motivate them to install toilets (at acost), and to use those toilets, which come in as a newpractice. Furthermore, the motivation for installingtoilets or practising a higher level of hygiene mustclearly emphasise the benefits to the individual and tothe community.The main components of a hygiene-promotion and-education strategy in a project should include thefollowing:• motivation and community mobilisation;• communication and community participation;• user education (operation and maintenance);• skills training and knowledge transfer;• development of messages;• presentation of messages; and• maintenance of good practice.Many of these components overlap, or cut across thewhole programme of implementation. For instance,motivation and community mobilisation would needto be maintained throughout the programme andafter. The same goes for communication, which isrequired at all stages of a hygiene-promotion and-education programme. In practice there is noparticular cut-off point between one component andanother.The following should be implemented during theprojects’ stages (see Appendix A) to ensure that watersupply and sanitation projects have a positive impacton the quality of life and level of hygiene incommunities:• Development and structuring of a strategic plan forthe implementation of hygiene promotion andeducation in water and sanitation projects: Thisstrategic plan should fit in and dovetail withnational and provincial strategies for health andhygiene in South Africa, and should includeadvocacy, training and capacity-building,implementation, monitoring and evaluation.• Liaison with other programmes/projects active inthe health and hygiene field: Other initiativesregarding hygiene (PHAST, etc) should beidentified and coordinated to prevent duplication,and to optimally address the needs of governmentand the communities. A number of other activitiesand programmes in schools, clinics, hospitals andthe media (TV, radio, newspapers, magazines),should be identified and coordinated for a broaderimpact of hygiene promotion and education.• Informing and training local governmentstructures, environmental health officers (EHOs),non-governmental organisations (NGOs),community-based organisations and consultants: Aprogramme should be developed to inform andtrain all local, regional and national institutionsand structures involved in water supply andsanitation, health and hygiene promotion andeducation.• Monitoring and evaluating the implementation ofhygiene in water and sanitation projects: A bodyor organisation should be established and taskedto monitor the quality and standard of hygienepromotion and education. The results of hygienepromotion and education should be evaluatedagainst key health indicators set up at the start ofa project.• Disseminating information regarding hygiene inwater and sanitation projects: The process andresults of hygiene promotion and education in aproject should be disseminated in articles,conference papers, reports, seminars andworkshops with other researchers in the field ofhealth and hygiene.TECHNICAL INFORMATIONBefore a sanitation system is selected, the availableoptions should be examined. This section describes thevarious systems and factors that could influence theselection. Detailed design information is not includedin this chapter. Instead, reference is made to variouspublications in which all the required information maybe found. Some general background information onthe different sanitation technologies is, however,included.Only sanitation systems commonly used or accepted inSouth Africa are described.Categories of sanitation systemsThere are two ways to handle human waste. It caneither be treated on site before disposal, or removedfrom the site and treated elsewhere. In either case, thewaste may be mixed with water or it may not. On thisbasis the following four groups may be distinguished:Group 1:Group 2:Group 3:Group 4:No water added – requiring conveyance.No water added – no conveyance.Water added – requiring conveyance.Water added – no conveyance.Sanitation Chapter 103
GUIDELINES FOR <strong>HUMAN</strong> <strong>SETTLEMENT</strong> <strong>PLANNING</strong> <strong>AND</strong> DESIGNTable 10.1:Categories of sanitation systemsREQUIRING CONVEYANCE(off-site treatment)NO CONVEYANCE REQUIRED(treatment, or partial treatment, on site;accumulated sludge also requires periodic removal)NO WATER GROUP 1 GROUP 2ADDED Chemical toilet (temporary use only). Ventilated improved pit toilet.Ventilated improved double-pit toilet.Ventilated vault toilet.Urine-diversion toilet.WATER GROUP 3 GROUP 4ADDED Full waterborne sanitation. Flushing toilet with septic tank and subsurface soilabsorption field.Flushing toilet with conservancy tank.Shallow sewers.Low-flow on-site sanitation systems (LOFLOs):Aqua-privy toilet.Table 10.1 illustrates the sanitation systems associatedwith each of the above groups. Note that some of thesystems fall somewhere between the four categoriesas, for example, where solids are retained on eachproperty and liquids are conveyed from site, or wherewater may be added, but only in small quantities.Since increasing the number of categories wouldcomplicate the table unnecessarily, these systems havebeen included in the categories that best describe thetreatment of the waste. The operating costs of systemsin which waste is conveyed and treated elsewhere canbe so high that these systems may in the long term bethe most expensive of all. The capital and installationcosts of any conveyance network using largequantities of clean water to convey small quantities ofwaste are very high, and a possibly inappropriatelyhigh level of training and expertise is also required toconstruct and maintain such systems.Developers should consider all the sanitationalternatives available before deciding on the mostappropriate solution for the community in question. Asolution that may be appropriate in one communitymay be a total failure in another because of cost,customs and religious beliefs, or other factors. Asolution must also not be seen as correct purelybecause developers and authorities have traditionallyimplemented it.Description of sanitation systemsThe main types of sanitation systems are describedbelow. The list is not complete and many commercialmanufacturers provide systems that may be a variantof one or more.The advantages and disadvantages of each system willdepend on its particular application. What may be adisadvantage in one situation may in fact be anadvantage in another. Thus the advantages anddisadvantages listed after each description should beseen not as absolutes, but merely as aids to selectingthe right sanitation system for a particular application.Group 1: No water added – requiringconveyance(for treatment at a central treatment works)Chemical toilets (not a preferred option)A chemical toilet stores excreta in a holding tankthat contains a chemical mixture to prevent odourscaused by bacterial action. The contents of theholding tank must be emptied periodically andconveyed to a sewage works for treatment anddisposal. Some units have a flushing mechanismusing some of the liquid in the holding tank torinse the bowl after use. The chemical mixtureusually contains a powerful perfume as well as ablue dye. Chemical toilets can range in size fromthe very small portable units used by campers tothe larger units supplied with a hut. The system canprovide an instant solution and is particularlyuseful for sports events, construction sites or othertemporary applications where the users areaccustomed to the level of service provided by awaterborne sanitation system. The system can alsobe used where emergency sanitation for refugees isrequired, in which case it can give the planners thenecessary breathing space to decide on the bestpermanent solution. It should not be considered asa permanent sanitation option.Factors to consider before choosing this option arethe following:• Chemical toilets have relatively high capital andmaintenance costs.• It is necessary to add the correct quantity ofchemicals to the holding tank.4Chapter 10Sanitation
GUIDELINES FOR <strong>HUMAN</strong> <strong>SETTLEMENT</strong> <strong>PLANNING</strong> <strong>AND</strong> DESIGN• Periodic emptying of the holding tank isessential; this requires vacuum tankers, so accessshould be possible at all times.• The system only disposes of human excreta andcannot be used to dispose of other liquid waste.• The units can be installed very quickly andeasily.• They can be moved from site to site.• They require no water connection and requirevery little water for operation.• They are hygienic and free from flies and odour,provided that they are operated andmaintained correctly.• The chemicals could have a negative effect onthe performance of wastewater treatmentworks.Phungalutho, Sanplat, etc. Those mentioned havebeen used with success and are firmly establishedin the industry.It is possible to construct the entire toilet from localmaterials, although it is more usual to usecommercial products for the vent pipe and thepedestal. Several toilet superstructures are alsocommercially available. When the pit is full, thesuperstructure, pedestal, vent pipe and slab arenormally moved to a freshly dug pit and the old pitis covered with soil. The VIP toilet can be mademore permanent by lining the pit with openjointedbrickwork or other porous lining. The pitcan then be emptied when required, using asuitable vacuum tanker, without the danger of thesides of the pit collapsing. Water (sullage) pouredinto the pit may increase the fill-up rate(depending on soil conditions) and should beavoided; this sanitation technology is therefore notrecommended where a water supply is available onthe site itself.Factors to consider before choosing this option:• If the stand is small there may be insufficientspace to allow continual relocation of the toilet;therefore arrangements should exist foremptying the toilet.• Unlined pit walls may collapse.• The excreta are visible to the user.• The system may be unable to drain all the liquidwaste if large quantities of wastewater arepoured into the pit.Figure 10.1: Chemical toilet unitGroup 2: No water added – no conveyance(treatment or partial treatment on site beforedisposal)Ventilated improved pit (VIP) toiletThe VIP toilet is a pit toilet with an externalventilation pipe. It is both hygienic and relativelyinexpensive, provided that it is properly designed,constructed, used and maintained. Detailedinformation on VIP design is available in thepublication Building VIPs by Bester and Austin(1997), which is obtainable from the Department ofWater Affairs & Forestry, Pretoria. Information ondifferent soil conditions, as they affect the buildingof VIP toilets, is also included. A SABS Code ofPractice for the construction of VIPs is currentlyunder preparation by the SABS. There are alsovariations of VIP toilets available – the Archloo,• The cost of the toilet is relatively low; itprovides one of the cheapest forms ofsanitation while maintaining acceptable healthstandards.• The toilet can be constructed by the recipients,even if they are unskilled, as very little trainingis required.• Locally available materials can be used.• If required, the components can bemanufactured commercially and erected on alarge number of plots within a short space oftime.• The system is hygienic, provided that it is usedand maintained correctly.• The system can be used in high-density areasonly if a pit-emptying service exists.Sanitation Chapter 105
GUIDELINES FOR <strong>HUMAN</strong> <strong>SETTLEMENT</strong> <strong>PLANNING</strong> <strong>AND</strong> DESIGN• The system can be upgraded at a later stage toincrease user convenience (e.g. to a urinediversiontoilet).• The system cannot ordinarily be installed insidea house.• The quantity of water supplied to the siteshould be limited.• If a pit-emptying service exists, proper access tothe pit should be provided.Detailed information on VIDP design is alsoavailable in the publication Building VIPs by Besterand Austin (1997), obtainable from theDepartment of Water Affairs & Forestry, Pretoria.Factors to consider before choosing this option aresimilar to those for the VIP, but include thefollowing:• Some training is required to ensure that the pitlining is properly constructed.• The contents of the used pit may be safely usedas compost after a period of about two years inthe closed pit.• The user may not be prepared to empty the pit,even though the contents have composted.• The superstructure can be a permanentinstallation.• The system can be regarded as a permanentsanitation solution.• The system can be used in high-density areas.• The system can be used in areas with hardground, where digging a deep pit is impractical.Figure 10.2: VIP toiletVentilated improved double-pit (VIDP) toiletThe VIDP toilet, also known as the twin-pitcomposting toilet, was developed mainly for use inurban areas where, because of limited space on thesmaller plots, it may be impossible to relocate thetoilet every time the pit becomes full. The VIDP is arelatively low-cost and simple but permanentsanitation solution for high-density areas. Twolined shallow pits, designed to be emptied, areexcavated side by side and are straddled by a singlepermanent superstructure. The pits are usedalternately: when the first pit is full it is closed andthe prefabricated pedestal is placed over thesecond pit. After a period of at least one year theclosed pit can be emptied, either manually (if this isculturally acceptable) or mechanically, and then itbecomes available for re-use when the other pit isfull. Each pit should be sized to last a family two tothree years before filling up. It is important thatthe dividing wall between the pits be sealed, toprevent liquids seeping from the pit currently inuse into the closed pit, thus contaminating it. TheVIDP toilet can be built partially above the groundin areas where there is a high water table, but thedistance between the pit floor and the highestwater table should be at least 1 m.Figure 10.3: VIDP toiletVentilated vault (VV) toiletsThe VV toilet is basically a VIP toilet with awatertight pit that prevents seepage. It can beregarded as a low-cost, permanent sanitationsolution, especially in areas with a highgroundwater table or a poor capacity for soilinfiltration, or where the consequences of possiblegroundwater pollution are unacceptable.6Chapter 10Sanitation
GUIDELINES FOR <strong>HUMAN</strong> <strong>SETTLEMENT</strong> <strong>PLANNING</strong> <strong>AND</strong> DESIGNThe amount of wastewater disposed of into thevault should be limited to avoid the need forfrequent emptying, so it is advisable not to use thistype of sanitation technology where a water supplyis available on site. Should an individual waterconnection be provided to each stand at a laterdate, as part of an upgrading scheme for theresidential area, then the vault can be utilised as asolids-retention tank (digester) and liquids can bedrained from the site using a settled-sewagesystem, also called a solids-free sewer system (seethe section on “settled-sewage systems” underGroup 3). Ventilation, odour and insect controloperate on the same basis as the VIP toilet.Factors to consider before choosing this option aresimilar to those of the VIP, but include thefollowing:• It is necessary to make use of a vacuum-tankerservice for periodic emptying of the vaults.• Builder training and special materials arerequired if a completely waterproof vault isrequired.• The system can be used in areas with a highwater table if the vault is properly constructed.• The system can be used in areas where pollutionof the groundwater is likely if a VIP toiletsystem is used.• The system can be used in high-density areas.• This system provides very good opportunitiesfor upgrading since the vault can be used as asolids-retention tank when upgrading to solidsfreesewers.• The cost of emptying equipment and theoperation of a vacuum-tanker service could beexcessive (see also the section on vacuumtankers).Urine-diversion (UD) toiletThe urine-diversion toilet, also known as the “drybox”,is a superior type of dry toilet thatcircumvents the problems sometimes encounteredwith the implementation of VIP toilets, namelyunfavourable geotechnical or hydrologicalconditions, high-density settlements with smallerven, etc. The main advantage is that a pit is notrequired, so the toilet may be installed inside thehouse, if desired by the owner. Urine is diverted atsource by a specially designed pedestal and, owingto the relatively small volumes involved, may simplybe led into a shallow soakpit. Alternatively, urinecan be easily collected in a container and re-usedfor agricultural fertiliser, as it is rich in plantnutrients such as nitrogen, phosphorus andpotassium. Faeces are deposited in a shallow vaultand covered with a sprinkling of ash or dry soil,which absorbs most of the moisture. They arefurther subjected to a dehydration process insidethe vault, which hastens pathogen die-off.Depending on the temperature and degree ofdesiccation attained in the vault, the faeces may besafe to handle after a period of six to eighteenmonths, and can then be easily removed from thevault and either disposed of or re-used as soilconditioner, depending on individual preferences.Other favourable aspects of this type of toilet arean absence of odours or flies (if it is properly used),a relatively low capital cost that may, depending onthe specific circumstances, be even less than a VIPtoilet, and a negligible operating cost. There arealso environmental advantages, due to the factthat no pit is required.Detailed guidelines on the implementation of thistechnology are contained in the publication Urinediversionecological sanitation systems in SouthAfrica by Austin and Duncker (<strong>CSIR</strong>, 2002).Factors to consider before choosing this option:• The technology is well suited to dense urbansettlements and places where environmentalconditions do not favour other types ofsanitation.• Use of the toilet requires an adherence tocertain operational requirements, and a propercommitment from owners is required. Gooduser education is therefore especiallyimportant.Figure 10.4: Ventilated vault toilet• Building materials similar to those for a VIPtoilet may be used, and the toilets can beSanitation Chapter 107
GUIDELINES FOR <strong>HUMAN</strong> <strong>SETTLEMENT</strong> <strong>PLANNING</strong> <strong>AND</strong> DESIGNconstructed by relatively unskilled persons.Components can also be manufacturedcommercially.• The system is hygienic, provided that it is usedand maintained correctly. Safe re-use of theurine and faeces is also facilitated.• The system can be installed inside a house, ifdesired.• There may be reluctance on the part of the userto empty the vault, even though the contentsare innocuous.• The system can be regarded as a permanentsanitation solution that will never needupgrading.litres. Research has indicated that the operation ofthe sewer system is not adversely affected by lowvolumeflush toilets. Flush volumes of 8-9 litres arenormally used, however. In an area where water iscostly or scarce, it may be counter-productive topurify water only to pollute it by conveying excretato a treatment and disposal facility.Factors to consider before choosing this option arethe following:• The system is expensive to install, operate andmaintain.• The system can be designed and installed onlyby trained professionals.• The treatment works must be operated andmaintained properly if pollution of waterwaysis to be avoided.• The system requires large amounts of water tooperate effectively and reliably.• The system is hygienic and free of flies andodours, provided that it is properly operatedand maintained.• A high level of user convenience is obtained.• The system should be regarded as a permanentsanitation system.• The toilet can be placed indoors.• This system can be used in high-density areas.Figure 10.5: Urine-diversion toilet• An adequate, uninterrupted supply of watermust be available.Group 3: Water added – requiring conveyance(treatment at a central works)Full waterborne sanitationThis is an expensive option and requires ongoingmaintenance of the toilet installation, the sewerreticulation and the treatment works, and therecipient community should be informedaccordingly. The system requires a water supplyconnection to each property. The water is used toflush the excreta from the toilet pan and into thesewer, as well as to maintain a water seal in thepan. The excreta are conveyed by the water, inunderground pipes, to a treatment works that maybe a considerable distance from the source. Thetreatment works must be able to handle the highvolume of liquid required to convey the excreta.The quantity of water required (usually 6-10 litresper flush) can be reduced by using low-flush pansdesigned to flush efficiently with as little as threeFigure 10.6: Waterborne sewerage system8Chapter 10Sanitation
GUIDELINES FOR <strong>HUMAN</strong> <strong>SETTLEMENT</strong> <strong>PLANNING</strong> <strong>AND</strong> DESIGNShallow sewersThe shallow sewer system is basically aconventional system where a more simpleapproach with respect to design and construction isfollowed. Basically it entails a system wheregradients are flatter, pipes are smaller and laidshallower, manholes are smaller and constructed ofbrickwork, and house connections are simpler.Where such systems are installed, communityinvolvement in management and maintenanceissues is preferred.Design of sewer networks:The professional responsibility in design remainswith the engineer, and guidelines should never beregarded as prescriptive. Most local authoritieshave their own requirements and preferences ontechnical detail, such as pipe slopes, manholedetails, materials, and so on. These are based ontheir own particular experiences and new designsshould therefore be discussed with the relevantcontrolling authority.Designers should not assume that sewer systemswill always be properly maintained, and allowanceshould be made for this.The hydraulic design of the sewers should be doneaccording to acceptable minimum and maximumvelocities in the pipeline. A number of pipemanufacturers have design charts available in theirproduct manuals and these can be used in theabsence of other guidelines.The construction of a system should be inaccordance with the relevant sections of SABS1200:1996. The depth of the sewer is normallydetermined by its position on site. Sewers in midblockpositions and on sidewalks can normally belaid at shallower depths. Should laying of sewerand water pipes in the same trench be considered,workmanship should be of a high standard.Appendix C gives design guidelines that should beuseful.Flushing toilet with conservancy tankThis system consists of a standard flushing toiletthat drains into a storage or conservancy tank onthe property; alternatively, several properties’toilets can drain into one large tank. A vacuumtanker regularly conveys the excrement to a centralsewage treatment works for purification beforethe treated effluent is discharged into awatercourse. The appropriate volume of theconservancy tank should be calculated on the basisof the planned emptying cycle and the estimatedquantity of wastes generated. Tank volumes aresometimes prescribed by the service provider.Factors to consider before choosing this option arethe following:• The system is expensive to install, operate andmaintain, although the capital cost is lowerthan the fully reticulated system.• The system can be designed and installed onlyby trained professionals.• A treatment works must be operated andmaintained properly to avoid the pollution ofwaterways.• A fleet of vacuum tankers must be maintainedby the local authority.• Regular collection is essential.• The system is hygienic and free of odours,provided that it is properly operated andmaintained.• A high level of user convenience is obtained.• The toilet can be placed indoors.• The system can be used in high-density areas.Figure 10.7: Shallow sewer systemFigure 10.8: Flushing toilet with conservancy tankSanitation Chapter 109
GUIDELINES FOR <strong>HUMAN</strong> <strong>SETTLEMENT</strong> <strong>PLANNING</strong> <strong>AND</strong> DESIGN• This system has good potential for upgradingsince the conservancy tank can be used as adigester when upgrading to a settled-sewagesystem.• An adequate, uninterrupted supply of watermust be available.Settled sewage systemIn settled sewage systems, also known as solids-freesystems or Septic Tank Effluent Drainage (STED),the solid portion of excreta (grit, grease andorganic solids) is retained on site in an interceptortank (septic tank), while the liquid portion of thewaste is drained from the site in a small-diametersewer. Such sewers do not carry solids, and havevery few manholes. Tolerances for excavation andpipe laying may be greater than for conventionalsewers, allowing lesser skilled labour to be used.Although the liquid portion of the waste must betreated in a sewage works, the biological designcapacity of the works can be greatly reducedbecause partial treatment of the sewage will takeplace in the retention tank on the site. The tankwill also result in a much lower peak factor in thedesign of both the reticulation and the treatmentworks. The retention tank should be inspectedregularly and emptied periodically, to preventsludge overflowing from the tank and entering thesewer. This system is an easy upgrading route fromseptic tanks with soakaways, conservancy tanks,and other on-site systems, as they can be connectedto a settled-sewage system with very littlemodification. Tipping-tray pedestals and watersavingdevices can also be used in settled-sewageschemes without fear of causing blockage resultingfrom the reduced quantity of water flowing in thesewers.• The system can be regarded as a permanentsanitation system.• The toilet can be placed indoors.• All household liquid waste can be disposed ofvia this sanitation system.• The sewers can be installed at flatter gradientsand can even be designed to flow underpressure.• The system provides an easy and reasonablypriced option when areas with on-sitesanitation need to be upgraded, because ofincreased water consumption and higher livingstandards.• The system can be used in high-density areas.• An adequate uninterrupted supply of watermust be available.• Regular inspection of the septic tank/digester isrequired to prevent an overflow of sludge.Technical information on the design of thesesystems may be found in the <strong>CSIR</strong>, Division ofBuilding and Construction Technology publicationSeptic tank effluent drainage systems (1997).Factors to consider before choosing this option arethe following:• The system requires a fairly large capital outlayif new interceptor tanks have to be constructed(i.e. if there are no existing septic tanks whichcan be used).• Care must be taken to ensure that only liquidwaste enters the sewers; this may mean regularinspection of the on-site retention tanks.• Vacuum tankers must be maintained by thelocal authority.• The system is hygienic and free of flies andodours, provided that it is properly operatedand maintained.• A high level of user convenience is obtained.Figure 10.9: Settled sewage systemGroup 4: Water added – no conveyance(treatment or partial treatment on site beforedisposal)These systems generally dispose of all or part of theeffluent on site. Some systems retain only the solidportion of the waste on site and the liquids areconveyed to a suitable treatment and disposal facility.10Chapter 10Sanitation
GUIDELINES FOR <strong>HUMAN</strong> <strong>SETTLEMENT</strong> <strong>PLANNING</strong> <strong>AND</strong> DESIGNSystems that dispose of the liquid fraction on siterequire a soil percolation system, and the amount ofliquid that can be disposed of will depend on thesystem’s design and the permeability of the soil.Flushing toilet with septic tank and soakawayWater is used to flush the waste from aconventional toilet pan into an underground septictank, which can be placed a considerable distancefrom the toilet. The septic tank receives the sewage(toilet water and sullage (greywater)) and thesolids digest and settle to the bottom of the tank inthe same manner as in the settled-sewage system.The septic tank therefore provides for storage ofsludge. The effluent from the tank can containpathogenic organisms and must therefore bedrained on the site in a subsoil drainage system.The scum and the sludge must be prevented fromleaving the septic tank as they could causepermanent damage to the percolation system. It istherefore advisable to inspect the tank at intervalsto ascertain the scum and sludge levels. Most tankscan be emptied by a conventional vacuum tanker.Liquid waste from the kitchen and bathroom canalso be drained to the septic tank. Septic tanksshould be regarded as providing a high level ofservice.Factors to consider before choosing this option arethe following:• It is relatively expensive and requires a waterconnection on each stand.• It requires regular inspection, and sludgeremoval every few years, depending on thedesign capacity of the septic tank.• Percolation systems may not be suitable in areasof low soil permeability or high residentialdensity.• It provides a level of service virtually equivalentto waterborne sanitation.• The system is hygienic and free of flies.• The toilet can be inside the dwelling.• This system has excellent potential forupgrading, since the septic tank outlet caneasily be connected to a settled-sewage systemat a future date.• An adequate, uninterrupted supply of watermust be available.Designers are referred to the publication Septictank systems (BOU/R9603), available from the <strong>CSIR</strong>,Division of Building and Construction Technology,for information on the design of septic tanks.Reference to the percolation capacity of soils ismade later in this chapter under the section“Evaluation of sites”.Figure 10.10: Flushing toilet with septic tank andsoakawayLow-flow on-site sanitation systems ( LOFLOs)The term LOFLOs refers to the group of on-sitesanitation systems that use low volumes of waterfor flushing (less than 2,5 litres per flush). Thesesystems include a pedestal, digestion capacity andsoakaway component. They are:• aqua-privies;• pour-flush toilets* and low-flush systems*; and• low-flow septic tanks*.*These types are not generally found in SouthAfrica.Aqua-privies:An aqua-privy is a small, single-compartment septictank directly under or slightly offset from thepedestal. The excreta drops directly into the tankthrough a chute, which extends 100 mm to 150 mmbelow the surface of the water in the tank. Thisprovides a water seal, which must be maintained atall times to prevent odour and keep insects away.The tank must be completely watertight; it maytherefore be practical to use a prefabricated tank.The tank must be topped up from time to time withwater to compensate for evaporation losses ifflushing water is not available. This can be done bymounting a wash trough on the outside wall of thesuperstructure and draining the used water into thetank. The overflow from the tank may containpathogenic organisms and should therefore run intoa soil percolation system (it can also be connected toa settled-sewage system at a later stage).Sanitation Chapter 1011
GUIDELINES FOR <strong>HUMAN</strong> <strong>SETTLEMENT</strong> <strong>PLANNING</strong> <strong>AND</strong> DESIGNFactors to consider before choosing this option arethe following:• The excreta are visible to the user.• The tanks must be completely watertight.• The user must top up the water level in theaqua-privy to compensate for evaporationlosses.• The system is hygienic, provided that it is usedand maintained correctly.• It is relatively inexpensive.• The system can be regarded as a permanentsanitation solution.• This system has excellent potential forupgrading, since the tanks work in the sameway as a septic tank and can thus be connecteddirectly to a settled-sewage system.• The tanks need regular inspection, and sludgeremoval is required from time to time.• An adequate, uninterrupted supply of watermust be available.FACTORS AFFECTING THE CHOICE OFA SANITATION SYSTEMGeneral considerationsThe primary reason for installing a sanitation system ina community is to assist in the maintenance of healthand should be seen as only one aspect of a total healthprogramme. The choice of a sanitation system by acommunity will be influenced by several factors, suchas the following:• The system should not be beyond the technologicalability of the community insofar as operation andmaintenance are concerned.• The system should not be beyond the community’sability to meet the capital as well as themaintenance costs.• The system should take into account the level ofwater supply provided, and possible problems withsullage (greywater) management.• The likelihood of future upgrading should beconsidered, particularly the level of service of thewater-supply system.• The system should operate well despite misuse byinexperienced users.• In a developing area the system should require aslittle maintenance as possible.• The system chosen should take into account thetraining that can be given to the community, froman operating and maintenance point of view.• The system should be appropriate for the soilconditions.• The community should be involved to the fullestextent possible in the choice of an appropriatesystem.• To foster a spirit of real involvement andownership, the community should be trained to doas much as possible of the development workthemselves.• Local customs should be carefully considered.• The local authority should have the institutionalstructure necessary for the operation andmaintenance of the system.Figure10.11: Aqua-privy toilet• The existing housing layout, if there is one, shouldnot make the chosen system difficult to construct,maintain or operate.12Chapter 10Sanitation
GUIDELINES FOR <strong>HUMAN</strong> <strong>SETTLEMENT</strong> <strong>PLANNING</strong> <strong>AND</strong> DESIGN• Environmental factors should be considered:surface pollution, possible groundwatercontamination, etc.The cost of the systemMany people in developing areas are not only unableto afford sophisticated sanitation systems, but thesesystems may also be technically inappropriate forthem. At the same time, the sanitation alternativewith the lowest overall cost may also be inappropriatebecause of the community’s cultural background orbecause of its unwillingness or inability to operate thesystem correctly.When the costs of different systems are compared, allrelevant factors should be taken into account.Examples of costs often ignored are the following:• A pit toilet may require relocation on the site oremptying every 4-10 years, depending on itscapacity.• Sludge from septic tanks and other on-sitesanitation systems may require treatment beforedisposal.• Training may be required for operators andmaintenance staff.• The community may have to be trained in the useof the system for it to operate effectively.• Regional installations such as treatment works maybe required.• Special vehicles and equipment may be requiredfor operation or maintenance.To keep costs to a minimum, several issues arerelevant:• Who pays what? For example, if a governmentinstitution or development agency is paying all ofthe capital costs, then the community will generallydemand the most expensive, highest level ofsanitation. If, on the other hand, the capital costsare to be recovered from the community, then itschoice of sanitation system may be quite different.The lack of income to pay for maintenance couldhave serious financial implications as well as healthrisks.• Would the community prefer lower capital costsand higher maintenance costs, or vice versa?• Will the cost comparison between options changeif all the potential benefits and costs are included?• Are any of the costs incorrectly or dishonestlyrepresented? For example, have capital grants orsoft loans been ignored? Do certain services havehidden subsidies that produce misleadingcomparisons (for example, where treatment costsare paid by regional authorities)?Where finance is limited, developers should consultthe community, determine its priorities, and seek waysto achieve the improvements desired. This may takeextra time but a motivated community will contributemore to successful project implementation and,perhaps more importantly, to the long-term operationand maintenance of the system selected.Sanitation at public facilitiesSanitation facilities are required at public buildingssuch as schools and clinics. The large number of peopleusing a concentrated facility can cause problems ifthere is inadequate on-site drainage and a lack ofgeneral maintenance, such as cleaning of the toiletand replacement of toilet paper. Most types of on-sitesanitation systems can be used, provided thatdevelopers take note of the special requirements forpublic facilities.Generally speaking, the system should use as littlewater and require as little routine maintenance aspossible. Before choosing a system that requires dailymaintenance for effective operation, one must ensurethat maintenance tasks will in fact be performed. Arural school may not be able to afford the services of ajanitor to look after routine maintenance.The number of sanitation units required at schools iscovered in the National Building Regulations (SABS0400:1990). Because of the number of users, careshould be taken to prevent pollution of thegroundwater, particularly if there is a boreholesupplying the school with water.Urinals that do not require water for flushing areavailable from commercial sources. These can be usedeffectively in sanitation facilities. However, theyrequire the weekly addition of a special oil to the trapand the application of a special deodorised cleanser tothe bowl or slab. They perform satisfactorily as long asthe weekly maintenance is carried out and shouldtherefore be used only where the necessary trainingcan be given to the cleaners and where the supply ofoil and cleanser can be assured.DISPOSAL OF SLUDGE FROM ON-SITESANITATION SYSTEMSAll forms of on-site sanitation will result in anaccumulation of sludge that, at intervals, must beremoved from the pit or tank and conveyed to sometreatment or disposal facility. If the pit or tank containsfresh sewage, the sludge must be treated or disposedof in a way that will not be harmful to theSanitation Chapter 1013
GUIDELINES FOR <strong>HUMAN</strong> <strong>SETTLEMENT</strong> <strong>PLANNING</strong> <strong>AND</strong> DESIGNenvironment or a threat to health; if the waste matterhas been allowed to decompose to the extent wherethere are no longer any pathogens present, the sludgecan be spread on the land as compost.Sludge can be disposed of only in accordance with theprescribed methods. See Water Research Commission(1997) Permissable utilisation and disposal of sewagesludge.An effective refuse-collection system should be inoperation in high-density residential areas and peopleshould be encouraged to use it. If this is not done, theresidents will probably use the toilet to dispose of tins,bottles, plastic and other forms of refuse which willresult in the pits filling very rapidly. This will presentproblems when emptying pits with a vacuum tanker.Where regular emptying will be required, it isadvisable to construct permanent pits with lined wallsto prevent damage during emptying, which could leadto the collapse of the pit walls. Note, however, that pitlinings should make allowance for percolation ofeffluent into the surrounding soil (e.g. by leaving thevertical joints of a brick lining unfilled). A regularprogramme for pit emptying in an area is better thanresponding to individual ad hoc calls for pit emptying.Composition of pit or vault contentsIn a sealed tank or vault, human excreta will usuallyseparate into three distinct layers, namely a layer offloating scum, a liquid layer and a layer of sediment.Well-drained pits may have no distinct liquid layer, andtherefore no floating scum layer. The scum layer seemsto be caused by the presence of paper, oil and greasein the tank and it is also more prominent in tanks witha large number of users. It is usually possible to breakup the scum layer without much effort. The watercontent of pits can vary between 50% and 97%,depending on the type of sanitation system, thepersonal habits of the users, the permeability of thesoil, and the height of the groundwater table.Cognisance should be taken of the fact that differentmaterials used for anal cleansing will have differentbreakdown periods. Newspaper will require more timeto break down than ordinary toilet paper, and in somecases will not break down at all. This will obviouslycause the pit to fill up more quickly.Methods of emptying pitsIt is possible to empty pits manually, using scoops andbuckets, and to dig out the thicker sludge with spades,but this poses obvious health risks to the workersinvolved. The use of ventilated improved double-pittoilets overcomes this unpleasantness by allowing theexcreta to decompose into a pathogen-free, humusrichsoil, after storage in the sealed pit for about twoyears. However, many people do not like to emptytheir pits manually.The most suitable method of emptying a pitmechanically involves the use of a vacuum tanker,where a partial vacuum is created inside a tank andatmospheric pressure is used to force the pit contentsalong a hose and into the tank. The use of a vacuum ispreferred to other pumping methods, because thecontents do not come into contact with the movingparts of the pump, where they can cause damage orblockages. Various techniques can be used to conveythis sludge along the pipe to the tank. Thin sludgewith a low viscosity can be conveyed by immersing thenozzle below the surface of the sludge, drawing aconstant flow into the tank.Thicker, more viscous sludge requires a pneumaticconveying technique, where the particles of wastematter are entrained in an air stream. This can beachieved by holding the end of the nozzle a fewcentimetres above the surface of the waste and relyingon the high velocity of the air to entrain particles andconvey them along the pipe to the holding tank. Thistechnique requires very high-capacity air pumps tooperate effectively. Devices such as an air-bleed nozzlecan be used to obtain the same effect with lessoperator skill and smaller air pumps. Pneumaticconveyance can also be achieved with a low-capacityair pump by using the plug-drag (or suck-and-gulp)technique. This method relies on submerging the hoseinlet, allowing a vacuum pump to create a vacuuminside the tank, then drawing the hose out to allow ahigh-velocity air stream to convey a plug of waste intothe tank. The plug-drag technique works best with avehicle with a fairly high-capacity pump (say10 m 3 /min) and a relatively small holding tank(1,5-2 m 3 ).Sludge flow propertiesSludge generally exhibits a yield stress, shear thinningbehaviour and thixotropy. In effect, this means thatthe hardest part of the operation is to get the sludgemoving. The addition of small quantities of water tothe sludge can assist greatly in getting it to move bycausing shearing to take place. Being thixotropic, thesludge “remembers” this and exhibits a lower shearingstress next time.Vacuum tankersMost vacuum tankers available today are designed foruse in developed countries, where roads are good andmaintenance is properly done. However, somemanufacturers are realising the special conditions thatexist in developing countries and are now adaptingtheir designs or, even better, are developingcompletely new vehicles designed to cope with theactual conditions under which these vehicles will haveto work.The size of conventional vacuum tanker vehiclesprevents their gaining easy access to toilets. They are14Chapter 10Sanitation
GUIDELINES FOR <strong>HUMAN</strong> <strong>SETTLEMENT</strong> <strong>PLANNING</strong> <strong>AND</strong> DESIGNhigh off the ground, which may limit the depth of pitthat can be emptied, and they are so heavy whenloaded that travelling over bad or non-existent roadsis extremely difficult. The equipment on the vehicle isoften complex and requires regular maintenance,which is seldom carried out by the unskilled peoplewho, in most cases, will operate the vehicles. Waterysludge from conservancy tanks and septic tanks maynot be a problem, but the tankers often cannot copewith the more viscous sludge found in pit toilets.A purpose-designed pit-toilet-emptying vehicle shouldhave the following attributes:• a low mass;• a low overall height;• high manoeuvrability;• ability to travel on extremely poor roads;• a small-capacity holding tank with a relatively highcapacitypump, to facilitate the use of plug-dragtechniques;• the ability to transfer its load to another vehicle ortrailer if there are long haul distances to thedisposal site;• both vehicle and equipment must be robust;• little skill should be required to operate the vehicleand the equipment;• capital and operating costs must be as low aspossible, to facilitate operation by emergingcontractors or entrepreneurs;• a small pressure pump and water for washingdown must be provided; and• storage compartments must be provided for thecrew’s personal effects.Disposal of sludgePit-toilet sludge can be disposed of by burial intrenches.Dehydrated faecal matter from urine-diversion toiletsmay be safely re-used as soil conditioner, or,alternatively, disposed of by burial, if preferred. It mayalso be co-composted with other organic waste.Sludge from septic tanks, aqua-privies, etc, can bedisposed of only in accordance with the prescribedmethods. See Water Research Commission (1997)Permissable utilisation and disposal of sewage sludge.Unless the sludge has been allowed to decomposeuntil no more pathogens are present, it may pose athreat to the environment, particularly where theemptying of pits is practised on a large scale. Thedesign of facilities for the disposal of sludge needscareful consideration, as the area is subject tocontinuous wet conditions and heavy vehicle loads.The type of equipment employed in the disposal effortshould be known to the designer, as discharge speedand sludge volume need to be taken into account.Cognisance should be taken of the immediateenvironment, as accidental discharge errors may causeserious pollution and health hazards.Emptying facilities at treatment works need not beelaborate, and could consist of an apron on which todischarge the contents of the vehicle and a wash-downfacility. The nature of the sludge can vary widely andthis should be taken into account when designing thesewage works. Depending on the habits of the pitowners and the effectiveness of refuse removal in thearea, there may also be a high proportion of rags,bottles and other garbage in the sludge. Generally ahigher grit load will also come from developingcommunities. Pond systems can be very effective intreating sludge from on-site sanitation systems. If theponds treat only sludge from pit latrines it may benecessary to add water to prevent the ponds fromdrying out before digestion has taken place. Sludgefrom on-site sanitation systems can also be treated bycomposting at a central works, using forced aeration.Although it is usually still necessary to treat sludgefrom on-site sanitation systems, the cost of treatmentis lower than for fully waterborne sanitation. This isbecause partial treatment has already taken place onthe site through the biological decomposition of thewaste in the pit or tank. In addition, the treatmentworks do not have to be designed to handle the largequantities of water which must be added to the wastefor the sole purpose of conveying solids along anetwork of sewer pipes to the treatment and disposalworks.EVALUATION OF SITESIt is not possible to lay down rigid criteria for thesuitability of a site for on-site sanitation, because soiland site conditions vary widely. Two basic criteriashould, however, be considered – namely, whether thesoil can effectively drain the liquids brought to the siteand whether there is any danger of pollution of thegroundwater or surface water.Topographical evaluationAll features that can affect the functioning of thesanitation system should be noted and marked on thesite plans during a visual survey of the site. Theposition of depressions, gullies, rock outcrops andSanitation Chapter 1015
GUIDELINES FOR <strong>HUMAN</strong> <strong>SETTLEMENT</strong> <strong>PLANNING</strong> <strong>AND</strong> DESIGNother features should be noted and an assessmentmade of how they are likely to affect the functioningof the system. The type and gradient of slopes shouldalso be noted as steep slopes can result in the surfacingof improperly treated effluent, especially duringperiods of high rainfall. Surface and subsurfacedrainage patterns, as well as obvious flood hazards,should be reported. The vegetation on the site willoften reflect soil-drainage characteristics.Soil profilesSampling holes should be excavated to a depth of atleast one metre below the bottom of proposed pittoilets or soakaways. Soil properties (such as texture,structure and type) should be determined. Thepresence of bedrock, gravel, groundwater or a layerwith poor permeability should be noted. Soil mottlingindicates the presence of a high seasonal groundwatertable, which can affect soil percolation.Percolation capacity of the siteIf the soil is unable to drain liquid waste effectively,swampy, unsanitary conditions can result. This canoccur in areas with very shallow water tables or withpoor permeability, or where a shallow, restrictive layersuch as bedrock occurs. On-site sanitation can be usedin low-permeability soils, but the system must becarefully selected in relation to the quantity of watersupplied to the site. If the efficient functioning of asoil-percolation system is in doubt, it is advisable tocreate an inspection point where the level of thewater in the subsoil drain can be monitored, so thatadequate warning of failure is obtained to allow thelocal authority to plan for an alternative solution toliquid drainage problems before a crisis develops. Thiswill be effective only if the recipient community fullyunderstands the need for regular inspection of thedrain, as well as the consequences of failure. On-sitesanitation can be used in areas with poor percolation,but it may be necessary to retain all the liquids on thesite in a sealed vault and provide a regular emptyingservice, or to drain the site with settled sewagesystems.The percolation test is designed to quantify themovement of liquids in the soil at a specific time of theyear. Percolation rates usually change as the soil’smoisture content changes, and it is best to conduct thetest in the rainy season. The percolation test should beregarded only as an indication of the suitability of thesoil for a specific sanitation system. The followingprocedures should be complied with:Calculation of number of test holesThe number of test holes needed is determined by thesize of the settlement and the variability of the soilconditions. Usually test holes should be spaceduniformly throughout the area, at the rate of five toten holes per hectare, if soil conditions are fairlyhomogeneous.Percolation testThe test procedure to be followed is described in SABS0400.POLLUTION CAUSED BY SANITATIONWhen there is a high density of people living in anarea, both the surface water and groundwater can beexpected to become polluted to some degree,irrespective of the type of sanitation system used inthe area. Some basic precautions will minimise the riskof serious pollution.Surface pollutionThe surfacing of partially treated effluent can create adirect health risk, and can cause pollution of surfacewaters. This type of pollution should and can usuallybe avoided. It is most likely to occur in areas where thegroundwater table is very high or in areas with steepslopes where a shallow, permeable layer of topsoilcovers an impermeable subsoil. In areas where cutand-filltechniques are used to provide platforms forhouse construction, sanitation units and soakawaysshould be carefully sited to minimise the possibility ofsurface pollution. Sanitation units and soakawaysshould also be sited in such a way that rainwateringress cannot occur, as this could cause flooding, withresultant surface pollution.Poor maintenance of reticulation systems, pumpingstations and sewage-purification works can causeserious pollution with associated health risks,especially in remote areas close to streams and rivers.Groundwater pollutionGroundwater can be contaminated by a sanitationsystem; therefore the risk should be assessed or thegroundwater periodically monitored, particularlywhere this water is intended for human consumption.The guidelines made available in the publication Aprotocol to manage the potential of groundwatercontamination from on-site sanitation by theDirectorate of Geohydrology of the Department ofWater Affairs & Forestry (1997), should be observed.The soil around the pit toilet or subsurface drainprovides a natural purification zone, and tests carriedout both in South Africa and other parts of Africaindicate that on-site sanitation does not pose a seriousthreat, provided the water is not intended for humanconsumption. Generally, the susceptibility of a watersource to pollution decreases quite sharply withincreasing distance and depth from the source ofpollution, except in areas with fissured rock, limestone,very coarse soil or other highly permeable soils.16Chapter 10Sanitation
GUIDELINES FOR <strong>HUMAN</strong> <strong>SETTLEMENT</strong> <strong>PLANNING</strong> <strong>AND</strong> DESIGNSoakaways attached to on-site sanitation systemsshould, wherever possible, be located downstream ofdrinking water supplies. The following could be usedas a guide for the location of a soakaway:• 7,5 m from the drinking-water source if the highestseasonal water table is more than 5 m below thebottom surface of the pit or soakaway;• 15 m from the water source if the highest seasonalwater table is 1-5 m below the bottom surface ofthe pit or soakaway;• 30 m from the water source if the highest seasonalwater table is less than 1 m below the bottom ofthe pit or soakaway; and• there is no safe distance from a source of drinkingwater in areas that have fissured rock, limestone orvery coarse soil.These distances are given as a guide only. Permeabilityof the soil is not the only factor. Geology, topography,the presence of trees, groundwater flow direction, etc,also influence the position of the borehole (Xu andBraune 1995).SULLAGE (GREYWATER) DISPOSALGeneralOn-site excreta-disposal technologies require thatseparate provision be made for the disposal of sullage.Sullage, also referred to as greywater, is defined as alldomestic wastewater other than toilet water. Thisrefers to wastewater from baths, sinks, laundry andkitchen waste. Although this “greywater” is supposednot to contain harmful excreted pathogens, it oftendoes: washing babies’ nappies, for example,automatically contaminates the water. Sullage,however, contains considerably fewer pathogenicmicro-organisms and has a lower nitrate content thanraw sewage. It also has a more soluble andbiodegradable organic content.Sullage is produced not only on private residentialstands but also at communal washing places and taxistands, and provision should therefore be made for itsdisposal.VolumesThe per capita volume of sullage generated dependson the water consumption. The water consumption isto a large extent dependent on the level of watersupply and the type of on-site sanitation thecontributor enjoys. It is not difficult to find localfigures of generation and one should try to obtainthese, even if it requires actual measurement in thefield. Typical figures are given in Table 10.2.Health aspectsMosquito breeding can take place where ponds arecreated by casual tipping of sullage, and conditionsfavourable for the development of parasitic wormscould also be created in this way. Infection can alsooccur in constant muddy conditions. In order to reducepotential health hazards, it is of the utmostimportance to choose the right option for sullagedisposal. See also Figure 6.31, Chapter 6.DisposalThe type of disposal system chosen by the designer willdepend on various factors such as the availability ofland, the volume of sullage generated per day, the riskof groundwater pollution, the availability of opendrains, the possibilities of ponding and thepermeability of the soil. Where water is available onthe site, a disposal facility should definitely beconsidered.Disposal systemsSullage can be used to effect flushing of certainsystems.Casual tippingCasual tipping in the yard can be tolerated, providedthe soil has good permeability and is not continuallymoist. Where casual tipping takes place under otherconditions it may result in ponding and/or muddyconditions, with adverse health effects as mentionedabove. Good soil drainage and a low populationdensity can accommodate this practice.Garden wateringThis practice can also be tolerated, provided plants andvegetables that are watered in this manner are noteaten raw, for disease transmission may occur.Table 10.2:Sullage generationAVAILABLE WATER SUPPLY <strong>AND</strong> SANITATIONSULLAGE GENERATION – LITRES PER CAPITA PER DAYStandpipes, water vendors. Pit toilets. 20 - 30On-site single-tap supply (yard connection). Pit toilets. 30 - 60Sanitation Chapter 1017
GUIDELINES FOR <strong>HUMAN</strong> <strong>SETTLEMENT</strong> <strong>PLANNING</strong> <strong>AND</strong> DESIGNSoakawaysA soakaway is probably the safest and mostconvenient way of disposing of sullage, as long as soilconditions permit this. The design of the soakaway canbe done according to the guidelines given in SABS0400. Designers should be aware that groundwaterpollution is still a possibility, though to a much lesserextent. Where simple maintenance tasks are able to becarried out, the use of grease traps should beconsidered.Piped systemsThe disposal of sullage in piped systems is hardly everan economical solution, although it may be a viableoption when dealing with communal washing pointsgenerating large amounts of sullage. Solids-free sewersystems are ideal for this purpose.Sullage treatmentThe fairly high BOD 5 value of sullage (typically 100mg/l) makes it unsuitable for discharging into riversand streams. If treatment is required, single facultativeponds could be used.TOILET PEDESTALS <strong>AND</strong> SQUATTINGPLATESVarious types of toilet pedestals and squatting platescan be used with on-site sanitation systems. Membersof some cultures are used to squatting for defecation,and cases of constipation have been recorded whenthey change to a sitting position. Some cultures alsorequire water for anal cleansing.The simplest form of appliance is a plain seat orpedestal, or a squatting plate. The hole should beapproximately 250 mm in diameter for adults, andhave a cover to restrict the access of flies and otherinsects to the pit. It is good practice to provide asecond seat with a hole size of approximately 150 mmfor young children, so that they need not fear fallinginto the pit. The plain seat found in a VIP toiletnormally has similar dimensions.Pedestals with water seals can be used in conjunctionwith most sanitation systems. Various methods can beemployed to effect a water seal in a toilet system. Theysignificantly increase user convenience by eliminatingodour and screening the contents of the pit. Somewater seal appliances require a piped water supply.These are not recommended for on-site sanitationsystems, unless the extra water can be disposed of onthe site (see the section on sullage disposal). Mostwater seal appliances can operate efficiently on a tankfilled by a bucket of household wastewater.A conventional toilet bowl is an example of a waterseal pedestal, but it can require between 6 and 12litres per flush. Special pans or bowls, so-called lowvolumeflush pans, have been developed that requireonly three litres per flush. These low-volume flushtoilets do not have any negative effects on the selfcleaningcapacity of waterborne sewerage systems.Various tipping-tray designs are also available, withflush requirements varying from 0,75 to 2 litres,depending on the design. These appliances have ashallow pan or tray that holds the water necessary forthe seal. After use the tray is cleared by tipping it,allowing the waste matter to fall into the pit below.Thus the water is used solely for maintaining the seal,not for clearing the pan.Pour-flush bowls can also be used to maintain a waterseal. These pans are flushed by hand, using a bucket,and generally require about two litres per flush. Thebiggest disadvantage of this appliance is that theeffectiveness of the flush depends on the humanelement – which varies greatly – and there is nocontrol over the amount of water used per flush.The pedestal of an aqua-privy does not have its ownwater seal. The water seal is effected by directing thepipe straight into the digester. No water is needed forflushing, but the level of liquid in the tank must bemaintained.DESIGN OF VIP TOILETSDetailed design information can be obtained from thepublication Building VIPs by Bester and Austin. A VIPCode of Practice is currently also under preparation bythe SABS.TOILET FACILITIES FOR PHYSICALLYDISABLED PERSONSSome introductory remarks on water and sanitationfacilities for disabled persons can be found under thesection “Public or communal water-supply terminals”in Chapter 9.Toilet aids help to preserve the dignity andindependence of disabled persons. Outdoor toiletsshould be situated on smooth, even pathways, andramps should be provided in lieu of steps. Rampsshould be not less than 1100 mm wide, with a slopenot exceeding 1:12. The appropriate layout anddimensions of a toilet room suitable for wheelchairusers are shown in Figure 10.12. If there is enoughspace for a person using a wheelchair, then thereshould be enough space for ambulant people usingcrutches or technical aids. Taps or washbasins, if fitted,should also be in an accessible position and at anappropriate height for use from a wheelchair.Reference should be made to Part S of SABS 0400-1990for further design information.18Chapter 10Sanitation
GUIDELINES FOR <strong>HUMAN</strong> <strong>SETTLEMENT</strong> <strong>PLANNING</strong> <strong>AND</strong> DESIGNFigure 10.12: Minimum dimensions of a toilet room for physically disabled personsTRAINING OF MAINTENANCEWORKERSThe training of local people as maintenance workersshould be seen as an integral part of capacity-buildingwithin the community. Training should not take placemerely because it is a fundamental principle or policyof the day.Members of the community should be trained toinstall and operate a system, or to act as advisers toothers who would like to install their own system. Thiscan be achieved by establishing a “sanitation centre”where the community can purchase a variety ofappliances and other necessary materials. Themanager of this centre can be trained to become thelocal sanitation expert and can advise the populationon maintenance requirements when necessary.When assessing training needs, one must expect thatsome of the people trained will move to other areaswhere greater employment opportunities areavailable.The degree of training and the amount of institutionalsupport required will increase with the level ofcomplexity of the sanitation system. On-site sanitationhas the advantage that the greater part of the systembelongs to the users. Sewer systems, on the otherhand, have long lengths of underground piping andmanholes, as well as pumping installations, which arethe property of the local authority and must beregularly maintained by properly trained people inorder for the system to work properly.UPGRADING OF SANITATIONFACILITIESPossible upgrading routes should be considered whenthe initial choice of a system is made, particularly if anappreciable increase in the water supply is expected atsome time in the future. However, it is unlikely that allthe residents of a township will be able to affordupgraded services at the same time, which will benecessary if one is upgrading to full waterbornesanitation.Sanitation Chapter 1019
GUIDELINES FOR <strong>HUMAN</strong> <strong>SETTLEMENT</strong> <strong>PLANNING</strong> <strong>AND</strong> DESIGNMost forms of pit toilet can be greatly improved byproviding a water seal between the user and theexcreta. This effectively stops odours and flies fromexiting the pit via the toilet pedestal, and removeschildren’s fears of falling into the pit. A water seal canbe provided by a tipping-tray, a pour-flush or a lowflushtoilet bowl. Designers should ensure that thequantity of water used with every cleaning operationdoes not increase the water content of the pit to apoint where it can no longer be drained by the soil.When the water supply is increased to the point atwhich the soil can no longer absorb it naturally(usually when an individual water connection isprovided to each stand), it will be necessary to makespecial arrangements to remove the wastewater fromeach site in order to maintain healthy livingconditions.This is a major step in the upgrading process and willrequire additional financial input from the residents.The most economical solution may be a settled-sewagesystem, as this would be far easier to install in anexisting settlement than a conventional sewer system.If the developer is reasonably confident that the area’swater supply will be upgraded within a few years, itmay be advantageous to install septic tanks at the timeof the original development. If this is done, then thesettled-sewage system can be connected directly to theoutlet from these systems and the soakaway can bebypassed and left inactive on the site.Some possible upgrading routes are described inAppendix B.OFF-SITE WASTEWATER TREATMENTOff-site wastewater treatment is considered aspecialised subject and, except for some generalcomments on pond systems and package purificationunits, falls outside the scope of this document. Wherethe introduction of a treatment works is considered,specialist consultants should be involved. The qualityof effluent emanating from a wastewater treatmentworks is prescribed by legislation and has to meetlicensing requirements. Water Services Providersshould be licensed in terms of the National Water Act.Pond systemsAlthough pond systems are regarded as treatmentplants, the effluent does not normally meet acceptableeffluent standards. Pond effluents have therefore tobe irrigated. A pond system is regarded as awastewater treatment works and its owner should alsoobtain a licence from the Department of Water Affairs& Forestry.Pond systems are usually used in remote or developingareas, normally where land is available and relativelycheap. Skilled operators are not required and,depending on the circumstances, electricity need notbe a requirement. Stabilisation (or oxidation) pondsare cheaper to build than conventional sewagepurification works.Although pond systems are regarded as beingcomparatively less sophisticated than otherpurification systems, they nevertheless require properplanning, application, design, construction andmaintenance. Ponds do not need daily attendance,but should never be allowed to fall into disrepair.The Water Institute of South Africa (WISA) has madeavailable a design manual based on South Africanexperience. This manual can be used as a guide to thedesign of pond systems.Stabilisation or oxidation ponds are classifiedaccording to the nature of the biological activitytaking place, as follows:• facultative-aerobic ponds (where aerobic andfacultative conditions exist) – facultative organismsuse dissolved oxygen when it is available, butconvert to anaerobic processes in its absence; and• anaerobic-aerobic ponds (where the primary pondsare completely anaerobic and the secondary pondsare mainly aerobic).The following important aspects should be consideredregarding siting and land requirements:• the cost of the land;• the minimum distance between pond systems andthe nearest habitation;• the direction of the prevailing winds – pondsshould, as far as possible, be downwind of townlimits;• possible groundwater pollution;• geotechnical conditions that will influence costs;• the land required for irrigation purposes, which isan integral part of the pond system; and• the topography of the site, which can influencecosts.Irrigation of crops may take place only as prescribed inthe publication Permissable utilisation and disposal ofsewage sludge by the Water Research Commission1997.20Chapter 10Sanitation
GUIDELINES FOR <strong>HUMAN</strong> <strong>SETTLEMENT</strong> <strong>PLANNING</strong> <strong>AND</strong> DESIGNPackage purification unitsThe use of package purification units is dependent onfactors similar to those mentioned above, but theoperational costs involved when opting for packagepurification plants should be carefully considered.It is not a preferred option.Sanitation Chapter 1021
GUIDELINES FOR <strong>HUMAN</strong> <strong>SETTLEMENT</strong> <strong>PLANNING</strong> <strong>AND</strong> DESIGNAPPENDIX AINFORMATION REQUIRED FOR THE <strong>PLANNING</strong> <strong>AND</strong> DESIGN OF SANITATIONPROJECTSThis appendix gives information regarding data thatshould be collected for the proper planning, designand implementation of a sanitation project. Note thatthe definition of sanitation in the White Paper onBasic Household Sanitation of 2001 is the following:“Sanitation refers to the principles and practicesrelating to the collection, removal or disposal ofhuman excreta, household wastewater and refuseas they impact upon people and the environment.Good sanitation includes appropriate health andhygiene awareness and behaviour, and acceptable,affordable and sustainable sanitation services.The minimum acceptable basic level of sanitationis:(a) appropriate health and hygiene awareness andbehaviour;(b) a system for disposing of human excreta,household wastewater and refuse, which isacceptable and affordable to the users, safe,hygienic and easily accessible and which doesnot have an unacceptable impact on theenvironment; and(c) a toilet facility for each household.”COMMUNITY MANAGEMENT APPROACHResearch done and projects launched in culturallydifferent communities require an openness andadaptability to the issues that are important to thecommunity. A growing awareness of the failures ofconventional development approaches in meeting theneeds of people with few resources has led to theexploration of alternative methodologies forinvestigating resource-management issues, andplanning, implementing and evaluating developmentinitiatives. There is a wide range of approaches withstrong conceptual and methodological similarities.These include:• Participatory rural appraisal (PRA);• Participatory learning methods (PALM);• Rapid rural appraisal (RRA);• Rapid assessment procedures (RAP);• Participatory action research (PAR);• Rapid rural systems analysis (RRSA);• The demand responsive approach (DRA);• The SARAR approach;and many others. The themes common to all of theseapproaches are:• the full participation of people in the processes;• the concept of learning about their needs andopportunities; and• the action required to address them.The experience gained in the past decade in particularhas pointed to the need for three key elements to besuccessful both in water-supply and in sanitationprojects, namely:• involvement of the community in all aspects of theprojects;• the use of appropriate technology; and• the need for institution-building and -trainingactivities in conjunction with the project.Community development, however, does not takeplace in a vacuum; it is always situated in a concretesocial, economic and political context. Therefore, it isof the utmost importance that a multi-disciplinaryteam be involved in community development. Becausedevelopment is development for the people, thepeople should remain central to the process. To ensurethis, it is inevitable that social engineering shouldprecede any development project, and run parallelwith it until completion of the project.Over the past few years, holistic development hasbecome a vital aspect of sustainable development. It isrecognised worldwide that projects that take humanfactors into consideration are more likely to besuccessful than those that do not. It is therefore of theutmost importance for development agencies tocollaborate closely with communities at inception andthrough all stages of infrastructural development.As distinct from community participation, communitymanagement means that beneficiaries ofinfrastructural services have the responsibility for, andauthority and control over the development of suchservices.Although the spin-offs of this approach are obvious,they are not easy to achieve within a short space oftime. It should also be noted that the mereparticipation of communities in the project is not asolution, but a necessary forerunner of successful22Chapter 10Sanitation
GUIDELINES FOR <strong>HUMAN</strong> <strong>SETTLEMENT</strong> <strong>PLANNING</strong> <strong>AND</strong> DESIGNcommunity projects. It is imperative that participationshould be coupled with capacity-building effortsthrough training.The application of scientific research methods (such asfact-finding and community surveys) is recommendedin the initial stages of community development. Thesemethods can be adapted in research forums thatpromote community participation, and which willcreate opportunities for interaction between thedeveloper and the identification of needs bycommunity members themselves. Examples includecommunity surveys, social reconnaissance and actionresearch. This emphasises a systems approach andinter-disciplinary teamwork, continued involvement ofthe community members in all decisions and activities,development as a learning process (including the needfor training), and continued monitoring andevaluation activities.Seven phases have been identified in the participatorystrategy for integrated rural development.Phase 1This phase consists of an initial reconnaissance of thecommunity among which the project is going to beimplemented by the social scientist or communityworker. Existing documentary sources about thecommunity are studied and field visits, mini-surveysand interviews with key people, etc, are undertaken.The main aim is to identify initial goals and to committhe development committee, which must includerepresentatives (male and female) from thecommunity, to these goals.Phase 2The second phase is the identification of priorities bymeans of field studies and research. Theplanner/developer performs specific investigations inorder to identify areas of priority or problems.Community members and other agents are trained inproblem identification and analysis. Insight is alsogained in the functioning of the system and itsproblems.Phase 3The third phase consists of the formulation of possiblesolutions for the identified problems. The social scientistor community worker gives direction, but communitymembers are involved fully in exercises of discoveringsolutions. Continued involvement and participation ofthe community members should be ensured.Phase 4In the fourth phase feasibility studies are performed. Itis important that objectives be compatible with eachother.Phase 5This phase is the implementation of the project. Theimplementation implies various political and planningactivities, such as official approval of the project,planning and design, formal project descriptions,communication with the authorities, liaison andlinkage with other institutional agencies, financialsupport, physical input and specific services.Phase 6This phase consists of planning the completion,termination, or continuation of the project.Community members should be trained in theoperation and maintenance of the system, andsupported in their efforts for a period of time toensure sustainability.Phase 7The seventh phase refers to project evaluation. Formalproject evaluation, preferably by an external agent, issupported by internal evaluation procedures as anongoing activity in the development process.Monitoring and auditing form part of the evaluationactivities. The main function of evaluation is toidentify weaknesses in a project, in order to avoidsimilar problems and facilitate sound planning infuture projects.<strong>HUMAN</strong>-RELATED DATAThe following data are necessary to ensuresustainability.Socio-cultural dataReligious and tribal customs, as well as cultural factorsaffecting the choice of technology (for example,traditional materials and practices for cleansing andablution), include:• the general level of literacy and education,especially hygiene education;• important watersource-related activities (such aslaundry, bathing and animal watering); and• community attitudes to the recycling and handlingof decomposed human waste.Community preferencesAfter considering costs, note preferences of thecommunity regarding the following:• the type of sanitation service;Sanitation Chapter 1023
GUIDELINES FOR <strong>HUMAN</strong> <strong>SETTLEMENT</strong> <strong>PLANNING</strong> <strong>AND</strong> DESIGN• the position of the toilet (for example, should it beinside or outside the house? If outside, should thetoilet door face the house? How far should thetoilet be from the house?);• the appearance of the toilet building and pedestal(colour, form, etc);• the size of the toilet;• the seats or squatting plates; and• the permanency of the superstructure.Economic and social conditionsThese include:• present living conditions, types of housing(including condition, layout and building materialsused) and occupancy rates;• population numbers according to income levels(present and projected), and the age and sexdistribution of the community ethnic groups, andsettlement patterns in the project area;• land-use and land-tenure patterns;• locally available skills (managerial and technical);and• major occupations, approximate distribution,unemployment and under-employment.Health and hygiene conditionsThese include:• location of toilet/defecation sites;• toilet maintenance (structure and cleanliness);• disposal of children’s faeces;• hand-washing and use of cleansing materials;• sweeping of floors and yard;• household refuse disposal;• drainage of surrounding area;• incidence and prevalence of water- and faecesrelateddiseases;• treatment of diseases; and• access to doctors/clinics/hospitals.Institutional frameworkThese include:• The identification and description (responsibility,effectiveness and weaknesses) of all institutionsand organisations, both governmental and nongovernmental,that are providing the followingservices in the project area:- water and sanitation;- education and training;- health and hygiene;- housing;- building material supplies; and- transport.• Identification of all other major local organisations(social and political), the type and number ofmembers they have and the influence they couldhave on the project.Environmental and technical aspectsImportant factors to consider are:• the position of the site in relation to existingsettlements;• existing supplementary services (type, availability,reliability, accessibility, cost, etc) such as watersupply, roads, energy sources and sanitationschemes;• environmental problems such as sullage removal,stormwater drainage, refuse removal, transportroutes;• site conditions such as topography, geology (soilstability, rockiness, permeability, etc);• groundwater data, such as availability, quality anduse;• prevailing climatic conditions such as rainfall,temperature and wind;• type and quantity of local building materials thatmay be suitable;• existing building centres supplying buildingmaterials and equipment (type of materials andequipment, availability, quality and cost); and• the need for, and existence of, appropriatebuilding regulations and by-laws.INFORMATION REQUIRED FOR POST-PROJECT EVALUATIONTo evaluate the success and sustainability of asanitation project, it is necessary to correlateenvironmental conditions in the project area with thehealth profile of the community concerned after thescheme has been in operation for some time(especially projects where the upgrading of existingservices is planned). To be able to do this, additionalinformation should be collected – for example thefollowing:24Chapter 10Sanitation
GUIDELINES FOR <strong>HUMAN</strong> <strong>SETTLEMENT</strong> <strong>PLANNING</strong> <strong>AND</strong> DESIGN• A concise description of the community’s livingconditions in general, and their existing sanitationand water supply facilities in particular.• How long have the people been living in the areaand for what period have the existing sanitationfacilities been in use?• With regard to the community’s perception of thepresent situation and sanitary practices, and theirinterest in or susceptibility to change:- Do they regard the present water supply assatisfactory, in quantity and quality?- What arrangements are there for refuseremoval – do they regard them as satisfactory?- What facilities exist for personal hygiene –where do they bathe or wash themselves?- Are they aware of any advisory service onhealth and hygiene, and do they make use of it?- What amount of money do they spend ondoctors, clinics, medicines and other healthrelatedaspects?- Do they regard the present sanitation facilitiesas adequate?• Identify all major health problems in thecommunity:- List all diseases recorded in the area that can berelated to water supply and sanitation.- Obtain figures on present morbidity andmortality rates.- Identify possible disease-contributing factors,such as possible contamination of drinkingwater.- What was the actual total cost of the project?Sanitation Chapter 1025
GUIDELINES FOR <strong>HUMAN</strong> <strong>SETTLEMENT</strong> <strong>PLANNING</strong> <strong>AND</strong> DESIGNAPPENDIX BUPGRADING OF EXISTING SANITATION SYSTEMSBASIC UPGRADING ALTERNATIVESAlternative 1 – Aesthetic upgradingThe options in this category can be implemented byindividual stand-owners, as the necessary financialresources become available. These are limited to thesuperstructure and the pedestal. An example would bewhere a functional superstructure is replaced with amore permanent or more aesthetic structure, such asone built from bricks and mortar. The property ownercan decide on factors such as the size of thesuperstructure and whether the door should openinward or outward. The door and roof materials of theoriginal superstructure could be re-used.Alternative 2 – Introduction of a watersealThis will effectively remove odours emanating fromthe pit and will ensure that the user cannot see theexcreta. This will also reduce the fear, particularlyamong children, of falling into the pit. A water sealcan be introduced by installing a tipping tray, a pourflushpan or a low-flush pan. The difference betweenthe three types of water seal lies mainly in the quantityof water required, and thus their suitability would alsodepend on the ability of the soil to drain theadditional quantity of water supplied to the site. Thistype of upgrading can be undertaken by the individualowner whenever funds are available. Depending onwhat type of water-seal appliance is used, it may ormay not be necessary to provide an individual waterconnection to each stand.Alternative 3 – Removal of liquids fromthe siteWhen individual water connections are provided toeach stand, the situation will often arise where the soilcan no longer adequately drain the additional water.This makes the removal of water necessary to maintainhealth standards. Liquids can be removed from the siteby means of sewers (either a full waterborne sanitationsystem or a settled sewage system), or they may beretained on site in a conservancy tank and thenremoved periodically by a vacuum-tanker service. Theinstallation of a sewer system will be a costly step in theupgrading process, and will require each resident tocontribute to the construction costs, or some form ofoutside subsidy will need to be found. The ability of thelocal authority to manage and maintain these sanitationsystems must be assessed when considering theintroduction of the system. Generally, the sewers wouldneed to be laid in the entire township at the same time.Upgrading should be undertaken only when thecommunity can afford to pay for the higher level ofservice. Practically, this means that upgrading in Group1 and 2 can be implemented at any time by individualproperty owners, independently of neighbours. Onthe other hand, upgrading in Group 3 will requireboth the greatest financial outlay from the propertyowners and implementation of the entiredevelopment at the same time. Note that, in the caseof a settled sewage system, the sewers will need to belaid to neighbourhoods at the same time, butindividual owners need not all connect to the systemsimultaneously, since it is not necessary to maintaincleansing velocities in sewers that convey only theliquid portion of the wastes. Thus, property ownerscould connect to the system when they have thefinancial means to construct the necessary solidsretentiontank. Note that some on-site sanitationsystems, for example septic tanks, can be used assolids-retention tanks and therefore can be connectedto the settled-sewage system with only minoralterations.UPGRADING ROUTES FOR THE VARIOUSSANITATION SYSTEMSThere are many possible upgrading routes that couldbe taken and the following should be seen as anindication of the various possibilities for the systems asdefined in Table 10.1, which categorises sanitationsystems.Group 1Upgrading chemical toiletsThe use of chemical toilets would probably be atemporary solution in a developing community.Upgrading to a more permanent system wouldtherefore take the form of total replacement with anyone of the other sanitation systems. The chemicaltoilet would be removed from the site as a unit; thusthere would not be any re-use of materials.Group 2Upgrading unventilated pit toiletsThe first and most important step in upgrading wouldbe to install a vent pipe to convert the toilet into aventilated improved pit (VIP) toilet. This upgradingshould be undertaken at the earliest possible26Chapter 10Sanitation
GUIDELINES FOR <strong>HUMAN</strong> <strong>SETTLEMENT</strong> <strong>PLANNING</strong> <strong>AND</strong> DESIGNopportunity. After the addition of a vent pipe, furtherupgrading would follow the same route as a VIP toilet.Upgrading ventilated improved pit (VIP) toiletsThe VIP toilet provides several opportunities forupgrading. A major improvement can be obtained byintroducing a water seal between the user and theexcreta, thus providing a level of convenience that ismore acceptable to users.It may thus be necessary to consider Alternative 3upgrading (removal of liquids from the site) only ifproblems arise with the drainage of excessivequantities of water, which situation can be expectedwhen individual water connections are provided toeach site. Since the pit of a VIP toilet is not watertight,it will probably be necessary to construct a new tankon the site for solids retention if upgrading to asettled-sewage system is required. The pit of the VIPtoilet will then become redundant. Thus, if at theoutset the final stage of the upgrading route is knownto be a conservancy-tank or settled-sewage system, itis preferable to begin with a sealed-tank system (suchas a vault toilet, aqua-privy or on-site digester), toavoid constructing a new tank when the upgradingtakes place.The installation of a urine-diversion pedestal will makea significant difference to a VIP toilet. The contents ofthe existing pit should be covered with a layer ofearth, and the structure may thereafter be operated asa normal urine-diversion toilet, where urine is divertedto a soakpit or collection container and faeces arecovered with ash or dry soil.Upgrading ventilated vault (VV) toiletsThis system is a variation of the VIP toilet, with theimportant distinction that it has a waterproof pit orvault. The comments on upgrading in Alternatives 1and 2, for VIP toilets, also apply to this system.Upgrading to Alternative 3 will be different from thatof the VIP toilet because the VV toilet has a lined,waterproof vault that can be used. The option ofupgrading to a conservancy tank is not mentionedbecause the ventilated vault toilet is a type ofconservancy tank. Because the VV toilet already has awaterproof tank, this system is ideal for upgrading toa settled sewage system and it is therefore highlyunlikely that this system would be upgraded to a fullywaterborne sewer system.Upgrading ventilated improved double pit(VIDP) toiletsThis system is basically a variation of the VIP toilet, sothe comments for the VIP also apply to the VIDP toilet.Group 3Upgrading full waterborne sanitationNo upgrading of this system is necessary, but the standowner can implement aesthetic improvements to thepedestal and superstructure.Upgrading conservancy tank systemsA conservancy tank provides an ideal opportunity forupgrading to a settled sewage system, since the tankcan be used to retain solids on the site.Upgrading the settled sewage systemNo upgrading of this system is necessary, but the standowner can implement aesthetic improvements to thesuperstructure.Group 4Upgrading septic tank systemsA septic tank also provides an ideal opportunity forupgrading to a reticulated system, since the outletfrom the septic tank can be connected to a settledsewage system without any further alterations beingnecessary. Solids would be retained on the site anddigested in the septic tank.Upgrading aqua-priviesThe aqua-privy has a rough water seal, but this can begreatly improved by removing the pedestal and chuteand replacing them with a device such as a tippingtray,pour-flush or low-flush pan. An aqua- privy alsoprovides an ideal opportunity for upgrading to asettled sewage system, since the outlet from the aquaprivycan be connected into the reticulation systemwithout any further alterations. Solids would then beretained on the site and digested in the aqua-privytank.Sanitation Chapter 1027
GUIDELINES FOR <strong>HUMAN</strong> <strong>SETTLEMENT</strong> <strong>PLANNING</strong> <strong>AND</strong> DESIGNAPPENDIX CDESIGN GUIDELINES FOR WATERBORNE SANITATION SYSTEMSSCOPEThese guidelines are applicable to the design andconstruction of sewerage reticulation for undevelopedresidential areas, where the future houses are to beprovided with full waterborne sanitation. They do notapply to on-site drainage, and do not cover any formof on-site disposal such as septic tanks and soilpercolationsystems. They also do not apply to settledsewage systems.Certain basic guidelines applicable to non-gravitysystems (i.e. pump stations and rising mains) areincluded, but detailed design criteria for these systemsare not included, as they are regarded as bulk services.Except in cases where illustrations are provided, thereader is referred to various figures in the relevantsections of SABS 1200.DESIGN CRITERIADesign flowsFlow-rate unitsThe unit of flow rate used in these guidelines is litresper second (l/s).Depth of flow and infiltrationSewers should be designed to flow full at the peakdesign flow. An allowance of 15 per cent forstormwater infiltration and other contingenciesshould be incorporated in the design figures used forsingle-family dwelling units.General residentialFor erven zoned as “general residential”, includingblocks of flats and hotels, an average daily flow of600 litres per day for every 100 m 2 of erf size shouldbe used.Notes:(i) The above figure is based on a dwelling unitwith a floor area of 100 m 2 and a floor spaceratio (FSR) of 0,6. If a FSR other than 0,6 isprescribed, the flow figure above should beadjusted accordingly.(ii) Maximum density allowable under the schemeis the overriding factor.Church sitesA church site should be treated as a “specialresidential” erf.Schools and business sitesThe discharge from day schools and business sitesneed not be taken into account, since these arerelatively minor flows that do not peak at the sametime as the main residential flow.Peak design flowsIn these guidelines the following factors apply tosingle-family dwelling units:Peak Factor (PF) = 2,5Percentage allowed for extraneous flow = 15 %To calculate the unit design flow rate:Average daily flow (l/du/d) = AAverage daily flow (A)The average daily flow per single-family dwelling unitis given in Table C.1.Average daily flow rate (l/s) ==A24 x 60 x 60A86 400Table C.1:Average daily flows per single-family dwelling unit (du)INCOME GROUP LOWER MIDDLE HIGHERLitres per dwelling unit per day 500 750 1 000Based on average total personsper dwelling unit 7 6 528Chapter 10Sanitation
GUIDELINES FOR <strong>HUMAN</strong> <strong>SETTLEMENT</strong> <strong>PLANNING</strong> <strong>AND</strong> DESIGNPeak flow rate = Average daily flow rate x peak factorA x 2,5 = B86 400Design flow rate = Peak flow rate + % of peak flowrate for extraneous flowsB x 1,15 =A x 2,5 x 1,1586 400= 0,000 033 A= CThus, for a population up to 1 500,Thus, from Table C.1:C =A (l/s/du)30 000C = 0,0167 l/s/du for lower income group= 0,0250 l/s/du for middle income group= 0,0333 l/s/du for higher income groupIf unit design flows are, instead, obtained from actualflow-gauging of adjacent settlements of similarnature, these unit design flows should not exceedthose given above.AttenuationTo take advantage of the attenuation of peak flows ingravity sewer systems as the contributor area andpopulation increases, design peak factors may bereduced in accordance with the graph in Figure C.1 forsizing any sewer receiving the flow from a populationgreater than 1 500. If actual local attenuation factorsare available, however, these should be used instead.Hydraulic designFlow formulaeThe following flow formulae are acceptable for thecalculation of velocity and discharge in sewers:Manning (n = 0,012)Crimp and Bruges (n = 0,012)Colebrook-White (Ks = 0,600)Kutter (n = 0,012)Any formula can be used as long as it produces valuesapproximately the same as the equivalent Colebrook-White formula using Ks = 0,6.Minimum size of sewersThe minimum diameter of pipe in sewer reticulationshould be 100 mm.Limiting gradientsSewers may follow the general slope of the ground,provided that a minimum full-bore velocity of 0,7 m/sis maintained.Table C.2 shows the minimum grades required toachieve this minimum full-bore velocity for variouspipe sizes up to 300 mm in diameter.If flatter grades and lower velocities than those inFigure C.1: Attenuation of peak flowsSanitation Chapter 1029
GUIDELINES FOR <strong>HUMAN</strong> <strong>SETTLEMENT</strong> <strong>PLANNING</strong> <strong>AND</strong> DESIGNTable C.2: Minimum sewer gradientsSEWER DIAMETER (MM)Table C.2 are contemplated, it is essential that adetailed cost-benefit study be carried out. This shouldtake into account the cost of the regular systematicmaintenance and silt/sand removal that will berequired when flatter grades and lower velocities areused, instead of the additional first cost required tomaintain the above minimum grades and full-borevelocity of 0,7 m/s.Non-gravity systemsMINIMUM GRADIENTS100 1 : 120150 1 : 200200 1 : 300225 1 : 350250 1 : 400300 1 : 500Rising mainsVelocities:The minimum velocity of flow in a rising mainshould be 0,7 m/s.The maximum velocity of flow in a rising mainshould be 2,5 m/s.Minimum diameter:The minimum diameter of a rising main should be100 mm, except where a macerator system is used,in which case the diameter can be reduced to 75mm.Gradient:Wherever practicable, rising mains should begraded so as to avoid the use of air and scourvalves.Stilling chambers:Stilling chambers should be provided at the headsof all rising mains, and should be so designed thatthe liquid level always remains above the soffitlevel of the rising main where it enters thechamber. Stilling chambers should preferably beventilated.Sumps for pump stationsEmergency storage:A minimum emergency storage capacityrepresenting a capacity equivalent to four hoursflow at the average flow rate should be provided,over and above the capacity available in the sumpat normal top-water level (i.e. the level at whichthe duty pump cuts in). This provision applies onlyto pump stations serving not more than 250dwelling units. For pump stations serving largernumbers of dwelling units, the sump capacityshould be subject to special consideration inconsultation with the local authority concerned.Emergency storage may be provided inside oroutside the pump station.Sizing:In all pump stations, sumps should be sized andpump operating controls placed so as to restrictpump starts to a maximum of six per hour.Flooding:Care should be taken in the design of pumpstations in order to avoid flooding of the dry welland/or electrical installations by stormwater orinfiltration.Screens:Adequate protection, where necessary, in the formof screens or metal baskets, should be provided atthe inlets to pump stations for the protection ofthe pumping equipment.PumpsStandby:All pump stations should be provided with at leastone standby pump of a capacity at least equal tothe capacity of the largest duty pump. The standbypump should come into operation automatically ifa duty pump or its driving motor fails due tomechanical failure.Safety precautionsSafety precautions in accordance with the relevantlegislation should be incorporated into the designof all pump stations and, in particular:• all sumps and dry wells should be adequatelyventilated;• handrails should be provided to all landingsand staircases and to the sides of open sumpsand dry wells;• skid-proof surfaces should be provided to allfloors and steps; and• the layout of the pumps, pipework andequipment should allow easy access toindividual items of equipment withoutobstruction by pipework.Physical designMinimum depth and coverExcept under circumstances discussed in the followingparagraph, the following are the recommendedminimum values of cover to the outside of the pipebarrel for sewers other than connecting sewers:30Chapter 10Sanitation
GUIDELINES FOR <strong>HUMAN</strong> <strong>SETTLEMENT</strong> <strong>PLANNING</strong> <strong>AND</strong> DESIGN• in servitudes 600 mm• in sidewalks 1,4 m below final kerb level• in road carriageways 1,4 m below finalconstructed road levelLesser depths of cover may be permitted, subject tointegrated design of all services including trunkservices allowed for in development plans, providedthat, where the depth of cover in roads or sidewalks isless than 600 mm, or in servitudes less than 300 mm,the pipe should be protected from damage by:• The placement of cast-in-situ or precast concreteslab(s) over the pipe, isolated from the pipe crownby a soil cushion of 100 mm minimum thickness.The protecting slab(s) should be wide enough anddesigned so as to prevent excessive superimposedloads being transferred directly to the pipes (seeFigure C.2); or225 mm diameter. Standard rigid pipes are laid oneither Class D or Class C beds, as depicted in DrawingLB-1 of SABS 1200 LB, while flexible pipes (plastic orpitch fibre) are laid according to Drawing LB-2 of SABS1200 LB.Structural design of the pipe/bedding should bechecked where trenches are:• located under roads;• deeper than 3 metres; and• other than those classified as “narrow” (i.e. whereoverall trench width is greater than nominal pipediameter d + 450 mm for pipes up to 300 mmdiameter).Figure C.2: Protection of pipes at reduced depths of cover (e.g. Class B bedding)• The use of structurally stronger pipes able towithstand superimposed loads at the depthconcerned; or• The placement of additional earth filling over theexisting ground level in isolated cases where this ispossible.Except in very special circumstances, the encasementof pipes in concrete is not recommended. Whereencasement is unavoidable, it should be madediscontinuous at pipe joints, so as to maintain jointflexibility (see Figure LD-6 of SABS 1200 LD).Trenching, bedding and backfillingThe trenching, bedding and backfilling for all sewersshould be in accordance with the requirements ofSABS 1200 LB and the supporting Specifications.Under normal ground conditions, structural designconsiderations for pipe strength and increasedbedding factors do not come into play for sewers up toWhere grades steeper than 1 in 10 are required, 15MPa concrete anchor blocks should be provided thatare at least 300 mm wide and embedded into the sidesand bottom of the trench for at least 150 mm, asshown on Drawing LD-1 of SABS 1200 LD.Curved alignmentA straight alignment between manholes shouldnormally be used, but curvilinear, horizontal or verticalalignment may be used where the economiccircumstances warrant it, subject to the followinglimitations:• the minimum radius of curvature is 30 m;• curvilinear alignment may be used only whenapproved flexible joints or pipes are used;• in the construction of a steep drop, bend fittingsmay be used at the top and bottom of the steepshort length of pipe, thus providing a curvedalignment between the flat and steep gradients.Sanitation Chapter 1031
GUIDELINES FOR <strong>HUMAN</strong> <strong>SETTLEMENT</strong> <strong>PLANNING</strong> <strong>AND</strong> DESIGNSitingSewers should be sited so that they provide the mosteconomical design, taking the topography intoaccount (i.e. in road reserves, servitudes, parks, openspaces, etc). When the sewer is to be located in atrench by itself, the minimum clear width to beallocated to it in the road reserve should be 1,5 m.ManholesLocation and spacingManholes should be placed at all junctions and,except in the case of curved alignment and at thetop of shallow drops, at all changes of grade and/ordirection.The maximum distance between manholes oneither straight or curved alignment should be:• 150 m where the local authority concerned haspower rodding machines and other equipmentcapable of cleaning the longer lengths betweenmanholes;• 100 m where the local authority concerned hasonly hand-operated rodding equipment.Note:The economics of acquiring power cleaningequipment in order to permit a greater manholespacing should be demonstrated to localauthorities.Where manholes have to be constructed within anyarea that would be inundated by a flood of 50-years recurrence interval, they should, whereverpracticable, be raised so that the covers are abovethis flood level.SizesThe minimum internal dimensions of manholechambers and shafts should be as shown in TableC.3. The minimum height from the soffit of themain through pipe to the soffit of the manholechamber roof slab, before any reduction in size ispermitted, should be 2 m.Manhole benching should have a grade not steeperthan 1 in 5 nor flatter than 1 in 25, and should bebattered back equally from each side of themanhole channels such that the opening at thelevel of the pipe soffits has a width of 1,2 d, whered is the nominal pipe diameter.DesignAll manholes, including the connection betweenmanhole and sewer, should be designed inaccordance with the requirements of SABS 1200 LDand, where manholes are of cast-in-situ concrete,chambers, slabs and shafts should be structurallydesigned to have a strength equivalent to a brickor precast concrete manhole.For manholes located in road reserves, spacer ringsor a few courses of brickwork should be allowedfor between the manhole roof slab and the coverframe, in order to facilitate minor adjustments inthe level of the manhole cover. Adjustablemanhole frames may also be used.Steep dropsSteep drops should be avoided wherever possible,but where this is unavoidable (e.g. to connect twosewers at different levels), use should be made of asteep, short length of pipe connected to the highersewer by one or more 1/16 bends and to a manholeon the lower sewer also by one or more 1/16 bends,as shown in Figure C.3.Sewer connectionsSize and sitingEach erf, excepting those listed below, should beprovided with a 100 mm (minimum) diameterconnecting sewer, terminating with a suitablewatertight stopper on the boundary of the erf orthe boundary of the sewer servitude, whichever isapplicable. The connecting sewer should be locateddeep enough to drain the full area of the erfportion on which building construction ispermitted.BenchingAn area of benching should be provided in eachmanhole so that a man can stand easily,comfortably, and without danger to himself, onsuch benching while working in the manhole.Table C.3: Minimum internaldimensions of manholechambers and shaftsSHAPE CHAMBER SHAFTCircular 1 000 mm 750 mmRectangular 910 mm 610 mmFigure C3: Steep drops in sewers32Chapter 10Sanitation
GUIDELINES FOR <strong>HUMAN</strong> <strong>SETTLEMENT</strong> <strong>PLANNING</strong> <strong>AND</strong> DESIGNExceptions• In special residential areas, where an erfextends for a distance of more than 50 m fromthe boundary to which the connecting sewer islaid, provision need only be made to drain thearea of the erf within 50 m of this boundary.• School sites should be given specialconsideration with regard to the position,diameter and depth of the connection(s)provided.• Where detailed development proposals aresubmitted for subdivided erven as groupschemes, one connecting sewer may beprovided to serve such group of erven.Note:Where erven have to be connected to a sewer onthe opposite side of a street, consideration shouldbe given to the economics of providing 100 mmdiameter sewer branches across the road to servethe connecting sewers from two or more erven.The sewer connection should be provided at thelowest suitable point on the erf. On streetboundaries the connection should be locatedeither at a distance of 1,15 m or at a distance of5 m or more from a common boundary with anadjacent erf, unless a local authority has already anaccepted standard location.Depth and coverExcept under the circumstances described in thefollowing paragraph, recommended minimumvalues of cover to the outside of the pipe barrel forconnecting sewers are:• in servitudes• in road reserves600 mm1 000 mmWhere lesser depths of cover are permitted, thisshould be subject to the same conditions discussedpreviously in this appendix, and the sameprotection should be provided.When designing the invert depth of the mainsewer in order to ensure that all the erven candrain to it, the fall required from ground level atthe head of the house drain to the invert of themain sewer at the point where the connectingsewer joins the main sewer should be taken as thesum of the following components:• 450 mm to allow for a minimum cover, at thehead of the house drain, of 300 mm, plus150 mm for the diameter and thickness of thehouse drain;• the fall required to accommodate the lengthof the house drain and the connecting sewer,assuming a minimum grade of 1 in 60 andtaking into account the configuration of the erfand the probable route and location of thehouse drains; and• the diameter of the main sewer (see FigureLD-7 of SABS 1200LD).Note:In the case of very flat terrain, and where the housedrains may be laid as an integral part of theengineering services, flatter minimum grades than1 in 60 for the house drains may be considered. Thisrelaxation could also be applied to isolated ervendifficult to connect, or the ground in such ervencould be filled to provide minimum cover to thedrains.Junction with main sewerA plain 45º junction should be used at the pointwhere the connecting sewer joins the main sewer.Saddles should not be permitted during initialconstruction.Type detailsDetails of the connecting sewer should be inaccordance with one of the types shown in FiguresLD-7 and LD-8 of SABS 1200LD.Invert levelsThe invert levels indicated at a manhole locationshould be the levels projected at the theoretical centreof the manhole by the invert grade lines of the pipesentering and leaving such manhole. In cases wherebranch lines with smaller diameters enter a manhole,the soffit levels of these branch lines should matchthose of the main branch line. However, in areaswhere pipes are laid to minimum grades, this practicemay need to be relaxed.The slope of the manhole channel should be asrequired to join the invert levels of the pipes enteringand leaving the manhole, without allowing anyadditional fall through the manhole chamber.MATERIALSPipes and jointsPipes suitable for the conveyance of sewage, under theparticular working and installation conditions towhich they will be subjected, should be in accordancewith Sections 3.1 and 3.2 of SABS 1200 LD.All joints for rigid pipes should be of a flexible type,and rigid joints should only be used where the pipesthemselves are flexible.Sanitation Chapter 1033
GUIDELINES FOR <strong>HUMAN</strong> <strong>SETTLEMENT</strong> <strong>PLANNING</strong> <strong>AND</strong> DESIGNManholesAll materials used for manholes should be inaccordance with Section 3.5 of SABS 1200 LD.Pumping installationsIn general, all materials should be durable and suitablefor use under the conditions of varying degrees ofcorrosion to which they will be exposed.PipeworkThe relevant requirements for materials given in SABS1200 L and 1200 LK should apply if a rising main formspart of the sewerage system.ConcreteStructural reinforced concrete and plain concretebelow ground level and/or in contact with sewageshould be designed and constructed in accordancewith SABS 1200 G or 1200 GA, whichever is applicable.Structural steelworkAll exposed steelwork should be adequately protectedagainst corrosion with a suitable approved paintsystem, and should otherwise be designed andconstructed in accordance with SABS 1200 H or 1200HA, whichever is applicable.Electrical installationsAll electrical installations should comply with theFactories Act and with the relevant local authorityelectricity supply by-laws/regulations.Other materialsOther materials used should comply with therequirements of SABS 1200 LD where relevant.34Chapter 10Sanitation
GUIDELINES FOR <strong>HUMAN</strong> <strong>SETTLEMENT</strong> <strong>PLANNING</strong> <strong>AND</strong> DESIGNGLOSSARYBOD 5 : The oxygen used for bacterial oxidation oforganic pollutants or ammonia, determined understandard conditions of incubation at 20º C over 5 days.Sullage: Wastewater emanating from baths, kitchensinks, laundries and showers (toilet water is excluded).Thermophilic bacteria: A kind of bacteria functioningbest at a certain temperature range.Thixotropic: Refers to the property of becomingtemporarily liquid when disturbed and returning to itsoriginal state when stationary.BIBLIOGRAPHY <strong>AND</strong> RECOMMENDEDREADINGAustin, L M and Van Vuuren, S J (2001) Sanitation,public health and the environment: Looking beyondcurrent technologies. Journal of the South AfricanInstitution of Civil Engineering, 43 (1).Austin, A and Duncker, L (2002). Urine-diversionecological sanitation systems in South Africa. BoutekReport no BOU/E0201, <strong>CSIR</strong>.Bakalian, A, Wright, A, Otis, R and Deazevedo, N J(1994). Simplified sewerage: Design guideline. UNDPWorld Bank Water & Sanitation Programme.Bester, J W and Austin, L M (1997). Building VIPs:Guidelines for the design and construction of domesticVentilated Improved Pit Toilets. Division of BuildingTechnology, <strong>CSIR</strong>. Issued by the Department of WaterAffairs & Forestry.<strong>CSIR</strong>, Division of Building Technology (1987). Septictank systems. Report no BOU/R9603.<strong>CSIR</strong>, Division of Building Technology (1997). Septictank effluent drainage systems. Report no BOU/R9706.DWAF (1997). A protocol to manage the potential ofgroundwater contamination from on-site sanitation.Edition 1. Directorate Geohydrology, Department ofWater Affairs & Forestry.DWAF (2001). White Paper on Basic HouseholdSanitation. Department of Water Affairs & Forestry,September.DWAF (2002). Sanitation for a healthy nation:Summary of the White Paper on Basic HouseholdSanitation 2001. Department of Water Affairs &Forestry, September.Kolsky, P (1997). Engineers and urban malaria: Part ofthe solution, or part of the problem? Waterlines. Vol16, October.Lines, J (2002). How not to grow mosquitoes in Africantowns. Waterlines. Vol 20, October.Mvula Trust and <strong>CSIR</strong> Building and ConstructionTechnology (2001). Study report on management offaecal waste from on-site sanitation systems in SouthAfrica. Report No BOU/C356, November. Departmentof Water Affairs & Forestry.Palmer Development Group (1999). The applicabilityof shallow sewer systems to dense settlements in SouthAfrica. WRC Report TT113/99.Parkinson, J (2002). Urban drainage in developingcountries: Challenges and opportunities. Waterlines.Vol 20, April.SABS 0365-1, nd. Code of Practice: On-site sanitationsystems. Part 1: Ventilated improved pit toilets. SouthAfrican Bureau of Standards Unpublished Edition.Wright, A (1999). Groundwater contamination as aresult of developing urban settlements. WRC Report514/1/99.WRC (1997). Permissable utilisation and disposal ofsewage sludge. Water Research Commission, Pretoria.Xu, Y and Braune, E (1995). A guideline forgroundwater protection for the community watersupply and sanitation programme. Department ofWater Affairs & Forestry, Pretoria.Sanitation Chapter 1035
GUIDELINES FOR <strong>HUMAN</strong> <strong>SETTLEMENT</strong> <strong>PLANNING</strong> <strong>AND</strong> DESIGNSanitation Chapter 1036
Chapter 11Solid waste management11
GUIDELINES FOR <strong>HUMAN</strong> <strong>SETTLEMENT</strong> <strong>PLANNING</strong> <strong>AND</strong> DESIGNTABLE OF CONTENTSINTRODUCTION. . . . . . . . . . . . . . . . . . . . . . . . . . . . . . . . . . . . . . . . . . . . . . . . . . . . . . . . . . . . . . . . . . . . 1Aim of the guidelines . . . . . . . . . . . . . . . . . . . . . . . . . . . . . . . . . . . . . . . . . . . . . . . . . . . . . . . . . . . . . . . 1The waste cycle. . . . . . . . . . . . . . . . . . . . . . . . . . . . . . . . . . . . . . . . . . . . . . . . . . . . . . . . . . . . . . . . . . . . 1Basic components . . . . . . . . . . . . . . . . . . . . . . . . . . . . . . . . . . . . . . . . . . . . . . . . . . . . . . . . . . . . . . . . . . 1SOUTH AFRICAN SCENARIO . . . . . . . . . . . . . . . . . . . . . . . . . . . . . . . . . . . . . . . . . . . . . . . . . . . . . . . . . . 2History. . . . . . . . . . . . . . . . . . . . . . . . . . . . . . . . . . . . . . . . . . . . . . . . . . . . . . . . . . . . . . . . . . . . . . . . . . . 2Social revolution . . . . . . . . . . . . . . . . . . . . . . . . . . . . . . . . . . . . . . . . . . . . . . . . . . . . . . . . . . . . . . . . . . . 2Mix of well-developed and poorly-developed areas . . . . . . . . . . . . . . . . . . . . . . . . . . . . . . . . . . . . . . . 2Demand for land . . . . . . . . . . . . . . . . . . . . . . . . . . . . . . . . . . . . . . . . . . . . . . . . . . . . . . . . . . . . . . . . . . 2Social upliftment and empowerment in underprivileged areas. . . . . . . . . . . . . . . . . . . . . . . . . . . . . . . 2Public perceptions. . . . . . . . . . . . . . . . . . . . . . . . . . . . . . . . . . . . . . . . . . . . . . . . . . . . . . . . . . . . . . . . . . 3Legislation. . . . . . . . . . . . . . . . . . . . . . . . . . . . . . . . . . . . . . . . . . . . . . . . . . . . . . . . . . . . . . . . . . . . . . . . 3WASTE CATEGORIES . . . . . . . . . . . . . . . . . . . . . . . . . . . . . . . . . . . . . . . . . . . . . . . . . . . . . . . . . . . . . . . . 4Domestic and household waste . . . . . . . . . . . . . . . . . . . . . . . . . . . . . . . . . . . . . . . . . . . . . . . . . . . . . . . 4Business and commercial waste . . . . . . . . . . . . . . . . . . . . . . . . . . . . . . . . . . . . . . . . . . . . . . . . . . . . . . . 4Sanitary waste. . . . . . . . . . . . . . . . . . . . . . . . . . . . . . . . . . . . . . . . . . . . . . . . . . . . . . . . . . . . . . . . . . . . . 4Non-hazardous industrial waste . . . . . . . . . . . . . . . . . . . . . . . . . . . . . . . . . . . . . . . . . . . . . . . . . . . . . . . 4Construction waste . . . . . . . . . . . . . . . . . . . . . . . . . . . . . . . . . . . . . . . . . . . . . . . . . . . . . . . . . . . . . . . . . 4Hospital and medical waste . . . . . . . . . . . . . . . . . . . . . . . . . . . . . . . . . . . . . . . . . . . . . . . . . . . . . . . . . . 4Hazardous and toxic waste. . . . . . . . . . . . . . . . . . . . . . . . . . . . . . . . . . . . . . . . . . . . . . . . . . . . . . . . . . . 4ON-SITE STORAGE. . . . . . . . . . . . . . . . . . . . . . . . . . . . . . . . . . . . . . . . . . . . . . . . . . . . . . . . . . . . . . . . . . 4WASTE COLLECTION . . . . . . . . . . . . . . . . . . . . . . . . . . . . . . . . . . . . . . . . . . . . . . . . . . . . . . . . . . . . . . . . 6Collection systems. . . . . . . . . . . . . . . . . . . . . . . . . . . . . . . . . . . . . . . . . . . . . . . . . . . . . . . . . . . . . . . . . . 6Collection vehicles . . . . . . . . . . . . . . . . . . . . . . . . . . . . . . . . . . . . . . . . . . . . . . . . . . . . . . . . . . . . . . . . . 6STREET CLEANING. . . . . . . . . . . . . . . . . . . . . . . . . . . . . . . . . . . . . . . . . . . . . . . . . . . . . . . . . . . . . . . . . 10TRANSFER STATIONS/SYSTEMS . . . . . . . . . . . . . . . . . . . . . . . . . . . . . . . . . . . . . . . . . . . . . . . . . . . . . . . 10Location . . . . . . . . . . . . . . . . . . . . . . . . . . . . . . . . . . . . . . . . . . . . . . . . . . . . . . . . . . . . . . . . . . . . . . . . 11Solid waste management Chapter 11i
GUIDELINES FOR <strong>HUMAN</strong> <strong>SETTLEMENT</strong> <strong>PLANNING</strong> <strong>AND</strong> DESIGNRECYCLING . . . . . . . . . . . . . . . . . . . . . . . . . . . . . . . . . . . . . . . . . . . . . . . . . . . . . . . . . . . . . . . . . . . . . . 11Aim . . . . . . . . . . . . . . . . . . . . . . . . . . . . . . . . . . . . . . . . . . . . . . . . . . . . . . . . . . . . . . . . . . . . . . . . . . . . 11History. . . . . . . . . . . . . . . . . . . . . . . . . . . . . . . . . . . . . . . . . . . . . . . . . . . . . . . . . . . . . . . . . . . . . . . . . . 11Markets . . . . . . . . . . . . . . . . . . . . . . . . . . . . . . . . . . . . . . . . . . . . . . . . . . . . . . . . . . . . . . . . . . . . . . . . . 11Education . . . . . . . . . . . . . . . . . . . . . . . . . . . . . . . . . . . . . . . . . . . . . . . . . . . . . . . . . . . . . . . . . . . . . . . 11DISPOSAL . . . . . . . . . . . . . . . . . . . . . . . . . . . . . . . . . . . . . . . . . . . . . . . . . . . . . . . . . . . . . . . . . . . . . . . 11Landfill site classification . . . . . . . . . . . . . . . . . . . . . . . . . . . . . . . . . . . . . . . . . . . . . . . . . . . . . . . . . . . 11INCINERATION. . . . . . . . . . . . . . . . . . . . . . . . . . . . . . . . . . . . . . . . . . . . . . . . . . . . . . . . . . . . . . . . . . . . 12LEVELS OF SERVICE . . . . . . . . . . . . . . . . . . . . . . . . . . . . . . . . . . . . . . . . . . . . . . . . . . . . . . . . . . . . . . . . 15Level 1. . . . . . . . . . . . . . . . . . . . . . . . . . . . . . . . . . . . . . . . . . . . . . . . . . . . . . . . . . . . . . . . . . . . . . . . . . 15Level 2. . . . . . . . . . . . . . . . . . . . . . . . . . . . . . . . . . . . . . . . . . . . . . . . . . . . . . . . . . . . . . . . . . . . . . . . . . 15Level 3. . . . . . . . . . . . . . . . . . . . . . . . . . . . . . . . . . . . . . . . . . . . . . . . . . . . . . . . . . . . . . . . . . . . . . . . . . 16Level 4. . . . . . . . . . . . . . . . . . . . . . . . . . . . . . . . . . . . . . . . . . . . . . . . . . . . . . . . . . . . . . . . . . . . . . . . . . 16Level 5. . . . . . . . . . . . . . . . . . . . . . . . . . . . . . . . . . . . . . . . . . . . . . . . . . . . . . . . . . . . . . . . . . . . . . . . . . 16GUIDELINES FOR IMPLEMENTATION OF LEVELS OF SERVICE . . . . . . . . . . . . . . . . . . . . . . . . . . . . . . . . 16Quantity and composition . . . . . . . . . . . . . . . . . . . . . . . . . . . . . . . . . . . . . . . . . . . . . . . . . . . . . . . . . . 16Collection-route balancing and planning. . . . . . . . . . . . . . . . . . . . . . . . . . . . . . . . . . . . . . . . . . . . . . . 16CONCLUSION. . . . . . . . . . . . . . . . . . . . . . . . . . . . . . . . . . . . . . . . . . . . . . . . . . . . . . . . . . . . . . . . . . . . . 18BIBLIOGRAPHY . . . . . . . . . . . . . . . . . . . . . . . . . . . . . . . . . . . . . . . . . . . . . . . . . . . . . . . . . . . . . . . . . . . 18iiChapter 11Solid waste management
GUIDELINES FOR <strong>HUMAN</strong> <strong>SETTLEMENT</strong> <strong>PLANNING</strong> <strong>AND</strong> DESIGNLIST OF TABLESTable 11.1 Current South African legislation . . . . . . . . . . . . . . . . . . . . . . . . . . . . . . . . . . . . . . . . . . . . . . . .3Table 11.2 Capital cost of transport and collection options (1996) . . . . . . . . . . . . . . . . . . . . . . . . . . . . . . .9Table 11.3 Landfill classification . . . . . . . . . . . . . . . . . . . . . . . . . . . . . . . . . . . . . . . . . . . . . . . . . . . . . . . . .11Table 11.4 Minimum requirements for landfill sites . . . . . . . . . . . . . . . . . . . . . . . . . . . . . . . . . . . . . . . . . .13Table 11.5 Minimum requirements for permitting a landfill site . . . . . . . . . . . . . . . . . . . . . . . . . . . . . . . .14Table 11.6 Guide to responsibilities and conditions . . . . . . . . . . . . . . . . . . . . . . . . . . . . . . . . . . . . . . . . . .17LIST OF FIGURESFigure 11.1 The waste cycle . . . . . . . . . . . . . . . . . . . . . . . . . . . . . . . . . . . . . . . . . . . . . . . . . . . . . . . . . . . . . .1Figure 11.2 Major urban development areas . . . . . . . . . . . . . . . . . . . . . . . . . . . . . . . . . . . . . . . . . . . . . . . . .2Figure 11.3 On-site storage options . . . . . . . . . . . . . . . . . . . . . . . . . . . . . . . . . . . . . . . . . . . . . . . . . . . . . . . .5Figure 11.4 Refuse collection and transport options . . . . . . . . . . . . . . . . . . . . . . . . . . . . . . . . . . . . . . . . . . .7Figure 11.5 Graphs of vehicle requirements . . . . . . . . . . . . . . . . . . . . . . . . . . . . . . . . . . . . . . . . . . . . . . . . . .8Figure 11.6 Levels of service . . . . . . . . . . . . . . . . . . . . . . . . . . . . . . . . . . . . . . . . . . . . . . . . . . . . . . . . . . . . .15Figure 11.7 Route collection alternatives . . . . . . . . . . . . . . . . . . . . . . . . . . . . . . . . . . . . . . . . . . . . . . . . . . .18Solid waste management Chapter 11iii
GUIDELINES FOR <strong>HUMAN</strong> <strong>SETTLEMENT</strong> <strong>PLANNING</strong> <strong>AND</strong> DESIGNivChapter 11Solid waste management
GUIDELINES FOR <strong>HUMAN</strong> <strong>SETTLEMENT</strong> <strong>PLANNING</strong> <strong>AND</strong> DESIGNINTRODUCTIONAim of the guidelinesThis chapter discusses waste management fordeveloping urban areas. The aim of the guidelines is toassist such areas in implementing a wastemanagementplan that will enable them to deal withwaste as economically and safely as possible. Wasteproduced by any urban community may, if leftuncontrolled, not only be an aesthetic problem, butalso pose serious health risks. This can be aggravated ifhazardous material is present in the waste. It istherefore important that waste is collected from allsources as efficiently as possible, and disposed of incontrolled disposal facilities. In the context of urbandevelopment, waste management at landfill sites isconsidered a bulk service and will not be discussed inany detail. As there are a number of existing disposalfacilities in operation, it is necessary to understand theimportance of proper disposal and the influence oflandfill sites on the service provided and thecommunity as a whole. The level of service isdependent on financial inputs and can therefore vary.There is, however, a basic level of waste managementthat needs to be provided to all communities. Theseguidelines should assist authorities to achieve thisbasic level and also provide some information toenable standards to be upgraded.The waste cycleRECYCLEDPRODUCTSSOURCESEPARATIONWASTEGENERATEDBasic componentsGenerationShould any changes at this level - such as sourceseparation - be effected, consideration must begiven to• appropriate type and capacity of on-site storagerequired;• changes to collection procedures;• reduction in landfill volumes; and• sustainable markets for recyclable products.On-site storageAny changes to on-site storage options mean thatconsideration must be given to• waste volumes;• waste types; and• collection vehicles.CollectionAny changes in collection vehicles will have animpact on• the number of working crews required andtherefore job opportunities;• the capital and operational costs;• the location of landfill and/or transfer stations;and• the type of on-site storage.Transfer stations/systemsRECYCLINGPROCESSON SITESTORAGECOLLECTIONRegardless of their degree of sophistication,transfer stations can• assist in the reduction of haulage costs;• reduce the congestion of traffic at the landfill;and• provide opportunities for recycling.TRANSFERSTATIONDIRECTTRANSPORTIncinerationLarge-scale incineration is capital-intensive, but hasthe advantage ofRECOVERYPLANTINCINERATIONFigure 11.1 The waste cycleDISPOSAL SITEAs waste management comprises many variable andinterrelated components, it is important to understandthe waste cycle and that when one component of thesystem changes, it invariably affects other parts of thesystem.• reducing the volume of waste needing finaldisposal, with a resultant reduction in land use;• combating the spread of disease; and• providing a potential energy source.RecyclingBefore considering a recycling programme it isnecessary to consider• the involvement of the general public;Solid waste management Chapter 111
GUIDELINES FOR <strong>HUMAN</strong> <strong>SETTLEMENT</strong> <strong>PLANNING</strong> <strong>AND</strong> DESIGN• recycling agencies;• entrepreneurial development;• education of the community;• secure markets; and• economic viability.DisposalWith landfilling being the final step in the wastemanagement cycle, consideration should be giventhe method used (i.e. baling) which would• reduce cover material requirements;• reduce both wind-blown litter and vermin;• reduce leachate production; and• influence the type of landfill equipment neededon the site.It is therefore important to consider theimplications prior to implementation, ifsustainability of the service is to be achieved.SOUTH AFRICAN SCENARIOHistoryNorthern Provincecollection have had to be rethought to adapt to thechanging times. Rapid urbanisation, populationgrowth and the ability of people to pay for the serviceare major influencing factors. Improvements incommunity health and demands for a better service,coupled with environmental concerns, are factors thatsignificantly impact on waste management.Mix of well-developed and poorlydevelopedareasPopulation influx has created many informal andcongested pedestrian-only settlements in open spacesand on the peripheries of towns and cities. This hasprovided the authorities responsible for wastemanagement in South Africa with new challenges.To integrate well-developed and poorly-developedareas, engineers and town planners need to provideinnovative and cost-effective methods of wastecollection, while maintaining a standard acceptable toboth the community and the environment. Thisintegration has created a new platform where theinvolvement of the communities in planning wastemanagement systems is crucial, if sustainability andacceptance of the system are to be achieved.Demand for landCape TownPietersburgPretoriaMpumalanga NelspruitNorth Western Province GautengJohannesburgSWAZIL<strong>AND</strong>VryburgMbabaneFree StateKwa-Zulu NatalKimberleyBloemfonteinRichards BayMaputu LESOTHONorthern CapePietermaritzburgDurbanEastern CapeEast LondonWestern CapePort ElizabethInflux and rapid urbanisation, plus social and politicalpressures, have put land at a premium in the city andtown areas. A city landfill once thought of as being anacceptable distance from suburban housing now sitscheek by jowl with generally low-income - butpolitically vocal and influential - communities. Thesearch for acceptable disposal sites within aneconomically viable radius of collection operations,becomes more and more problematic. Publicparticipation and consultation is therefore of theutmost importance.Figure 11.2: Major urban development areasA formal waste collection service was firstimplemented in the Cape Colony in 1786, and by the1820s a regular waste collection service on specificdays of the week, using animal-drawn carts, wasestablished.It was only in the 1920s, with the advent of motorvehicles in South Africa, that the advantages ofmechanical transport could be tested. The first trucksused for refuse collection were able to replace anumber of carts with a significant cost saving and theadvantage of easier supervision.Social revolutionThe rapidly changing socio-political situation hasmeant that traditional mechanised methods ofSocial upliftment and empowerment inunderprivileged areasWith about half the potentially economically activepopulation unemployed, there is increased pressure onauthorities to couple the delivery of social serviceswith increasing elements of job creation. Labourintensive- rather than mechanised - methods arepositively encouraged by central government and thisform of collection is rapidly becoming the norm ratherthan the exception, as it provides entrepreneurialopportunities and job creation in an activity wherethere are no serious technical or financial barriers toentry. The government’s privatisation policy furtherencourages this pattern, but the demand for higherwages and career opportunities must mean that “oldtechnology” must incorporate modern methods of costcontrol, efficiency and planning in order to provide acost-effective service.2Chapter 11Solid waste management
GUIDELINES FOR <strong>HUMAN</strong> <strong>SETTLEMENT</strong> <strong>PLANNING</strong> <strong>AND</strong> DESIGNPublic perceptionsThe concept of waste management is generallyunderstood by most citizens of South Africa.Discussions with residents in both formal and informalsettlements from Slovoville west of Johannesburg toMandela Village east of Pretoria, and as far afield asEmondlo in northern KwaZulu-Natal andPhuthaditjhaba in the Free State, highlighted the needfor a regular collection service and adequate on-sitestorage facilities. There is also a huge plea for helpfrom most communities to educate and assist them inunderstanding the fundamental principles of wastemanagement.LegislationIt is vital that the local authority, including itsrepresentatives and community leaders as well as theservice provider or contractor, be familiar with alllegislation regarding waste management. This isnecessary to ensure that, regardless of the level ofservice implemented, an affordable andenvironmentally acceptable standard is achieved.Table 11.1: Current South African legislationACT MAIN REQUIREMENTS CONTROLLING AUTHORITYEnvironment Conservation Act 73 of 1989Sections 19, 20,21, 22, 24, 25These sections cover definitions,prohibitions, regulations, procedures forpermit applications, regulatory powers,offences and penalties, forfeiture anddelegatory powersDepartment of Environment AffairsWater Act 54 of 1956 (certain sections still in effect at time of writing)Sections 21(1),22, 23, 26These sections cover the prevention ofpollution by effluent, stormwater control,location of waste sites, offences andpenalties, policies and strategiesDepartment of Water Affairs & ForestryHealth Act 63 of 1977Sections 1, 20(1),38, 39, 40, 57These sections cover definitions, preventionof pollution of water for humanconsumption, regulations regardingcommunicable disease and relating torubbish, nightsoil, nuisances, offences andpenaltiesDepartment of National Health &Population DevelopmentAtmospheric Pollution Prevention Act of 1965Sections 1, 17,18, 19, 20, 27, 28,33These sections cover definitions, preventionof burning, smoke control, smoke and dustcontrol areas and regulationsDepartment of National Health &Population Development, in conjunctionwith Local AuthoritiesOccupational Health and Safety Act 85 of 1993Sections 1, 3, 4,10, 11, 12, 13, 14,15, 16With particular reference to hazardouschemical substances these sections coverdefinitions, general duty of care, control ofexposure, protection and maintenance ofequipment, prohibitions, transport andstorage, disposal, offences and penalties.Department of LabourSolid waste management Chapter 113
GUIDELINES FOR <strong>HUMAN</strong> <strong>SETTLEMENT</strong> <strong>PLANNING</strong> <strong>AND</strong> DESIGNWASTE CATEGORIESWaste by definition can be described as any matter -whether gaseous, liquid or solid - originating from anyresidential, commercial or industrial area, which issuperfluous to requirements and has no furtherintrinsic or commercial value.Domestic and household wasteDomestic and household waste comes mainly fromresidential areas and may include foodstuffs, gardenwaste, old clothing, packaging materials such as glass,paper and cardboard, plastics, and, in certain cases,ash.Business and commercial wasteBusiness and commercial waste from offices, stores,and schools consists mainly of packaging materialssuch as glass, paper and plastics, cans, etc, with alimited quantity of foodstuffs emanating from hotelsand restaurants. Where smaller industries aredispersed among normal commercial operations,regular monitoring is necessary to identify the needfor special collection and disposal procedures.Sanitary wasteAlthough not considered part of the general wastestream, if no proper sanitation system existsarrangements for the controlled removal and disposalof sanitary waste must be provided for (see Chapter 10on Sanitation).body tissue, discarded syringes, swabs andcontaminated material, is normally incinerated on siteor collected by specialist private concerns. With smallerclinics and doctors’ rooms, where the risk of accidentsis no less, special arrangements for the collection anddisposal of contaminated waste is essential. Miniincineratorsare also commercially available.Hazardous and toxic wasteDue to the complexity of identifying the properhandling and disposal procedures, hazardous and toxicwaste is generally the domain of specialist operators. Itis, however, important that industries producinghazardous and toxic substances are identified andmonitored to ensure that proper procedures arefollowed.ON-SITE STORAGEInadequate on-site storage and collection systemsaccount for the bulk of illegally dumped refuse in alarge percentage of developing communities. Themethod of on-site storage thus has a significant effecton the collection system to be implemented (seeFigure 11.3). It is important to plan and decide on theappropriate means of on-site storage in conjunctionwith transport options before implementing anysystem.Non-hazardous industrial wasteNon-hazardous industrial waste (excluding miningwaste) generally consists of a combination ofcommercial waste and discarded metal, timber, plasticand textile offcuts. With the majority of industriesplaced within municipal boundaries, carefulidentification of these wastes to ensure that properdisposal procedures are followed is important,particularly where chemical processing is apparent.Construction wasteConstruction waste generally consists of inertmaterials such as rubble and bulky construction debris.If mixed with household waste it attracts rodents,which can constitute a health risk, but it is generallyconsidered more of an aesthetic problem. Removal ofthis material can in some instances require specialisedequipment.Hospital and medical wasteWaste from hospitals is generally separated at source.The general component is collected with normaldomestic refuse. The medical component, consisting of4Chapter 11Solid waste management
GUIDELINES FOR <strong>HUMAN</strong> <strong>SETTLEMENT</strong> <strong>PLANNING</strong> <strong>AND</strong> DESIGNDESCRIPTIONCOMMON USAGECOLLECTIONMETHODS85 litre plastic binlinersDomestic/householdSmall business &industryGeneral public amenitiesBy hand on-site or onsidewalkLiners deposited directlyinto collection vehicle85 litrerubber/galvanisedsteel binsDomestic/householdSmall business &industryGeneral public amenitiesBy hand on-site or onsidewalkBins emptied directly intocollection vehicle120/240 litre mobilerefuse binsDomestic/householdSmall business &industryGeneral public amenitiesRear-end loadingcompactors with speciallifting equipment1,0 and 1,2 m 3 mobilerefuse containersSmall business andindustryRear-end loadingcompactors with speciallifting equipment4,5, 5,5, 6, 9 &11,0 m 3 bulkcontainersLarge business &industry, garden refuse,building rubble, generalpublic amenities & bulkwastes and communalcollection systemsLoad luggersRear-end loadingcompactors with speciallifting equipment15 to 30 m 3 open bulkcontainersLarge business &industry, garden refuse,building rubble & bulkwastes and communalcollection systemsRoll-on roll-off vehicles11, 15 & 35 m 3closed ontainersLarge shopping centres,transfer stations &selected industriesRoll-on roll-off vehiclesFigure 11.3: On-site storage optionsSolid waste management Chapter 115
GUIDELINES FOR <strong>HUMAN</strong> <strong>SETTLEMENT</strong> <strong>PLANNING</strong> <strong>AND</strong> DESIGNWASTE COLLECTIONLocal authorities are responsible for ensuring that aservice is provided to the communities they serve.Collection can be done by the local authority, aconventional contractor, or an emerging entrepreneur.Several factors therefore need to be considered whenselecting the appropriate waste managementapproach for a particular community, all of which willinfluence the waste handling and disposal options.These factors include:1. Affordability• capital and operational costs;• level of income within the community; and• grants or subsidies available.2. Accessibility• road infrastructure and conditions.3. Level of education• literacy and awareness of the community tounderstand the principles of wastemanagement.4. On-site storage facilities• availability and suitability; and• composition and volume of the waste.5. Potential benefits• clean and healthy environment; and• job creation and upliftment.6. Available facilities and infrastructure• appropriate vehicles; and• available expertise.7. Distance to disposal site• transfer facility requirements.8. Pollution potential• blocked sewers and stormwater canals; and• illegal dumping and littering.Collection systemsMany innovative or alternative collection systems havebeen attempted in South Africa, where collectedwaste is exchanged for food, or financial reward ismade for bags collected. These have, in the main, beenfinanced through grants or sponsored by variousagencies and can therefore not be regarded assustainable services, but rather as a process ofeducation which should be supplemented by aneffective collection system.Communal collectionCommunal collection is generally considered anoption in poorly developed areas where thehouseholders or entrepreneurial contractors arerequired to place the waste in strategicallypositioned containers for collection and disposal bylarge motorised refuse vehicles.Door-to-door collectionDoor-to-door collection can be carried out in twoways:(a) the collection crew removes the wastecontainer from the premises and returns it afterit is emptied into the collection vehicle; and(b) the householder places his or her refusecontainers on the sidewalk, ready for collectionby the collection crew, and retrieves them aftercollection.It is important to understand that flexibility ofrefuse collection is an important factor in today’surban development. Although it is understandableand logical that an efficient mechanical system ofcollection can evolve in a conventional suburbanenvironment, this method may be totallyinappropriate for highly dense, congestedsettlements that have mushroomed on the fringesof local authority areas. Now, more than ever,administrators and engineers are faced with adilemma: capital-intensive solutions that were welljustified a few short years ago, are becomingobsolete and inappropriate less than halfwaythrough their amortisation period. The norm, forthe next decade at least, will be to have a mix ofold and new technology and the ability tointegrate both systems to maximise economicadvantage.Collection vehiclesThere are several options available for transportingcollected waste for disposal, ranging from the basichand cart to the technically sophisticated andmotorised front- and rear-loading compactionvehicles. All options have a place in providing aneffective collection service in the varied and mixeddevelopment areas currently faced by engineers andadministrators. Careful consideration of the localroad conditions, accessibility and topography - inconjunction with town planners - of the area to beserviced is needed before selecting any one of theoptions (see Chapters 5 and 7).6Chapter 11Solid waste management
GUIDELINES FOR <strong>HUMAN</strong> <strong>SETTLEMENT</strong> <strong>PLANNING</strong> <strong>AND</strong> DESIGNPush cartTip truckAnimal-drawn cartLoad lugger (skip loader)Tractor-trailerRear-end loaderFlat-bed truckRoll-on roll-offFigure 11.4: Refuse collection and transport optionsSolid waste management Chapter 117
GUIDELINES FOR <strong>HUMAN</strong> <strong>SETTLEMENT</strong> <strong>PLANNING</strong> <strong>AND</strong> DESIGNThe graphs below give an indication of vehicle requirements based on the relationshipbetween distance to landfill / transfer station and number of households12,00LOAD LUGGERVehicles required10,008,006,004,002,001000 households5000 households12000 households20000 households0,005km 10km 15km 20kmDistance to landfill2,5010,5m 3 REAR END LOADERVehicles required2,001,501,000,500,005km 10km 15km 20kmDistance to landfill1000 households5000 households12000 households20000 householdsVehicles required3,503,002,502,001,501,000,5021,5m 3 REAR END LOADER0,005km 10km 15km 20kmDistance to landfill1000 households5000 households12000 households20000 householdsAssumed1. 0,12m 3 of waste per household per week2. Average speed 40km/hFigure 11.5: Graphs of vehicle requirements8Chapter 11Solid waste management
GUIDELINES FOR <strong>HUMAN</strong> <strong>SETTLEMENT</strong> <strong>PLANNING</strong> <strong>AND</strong> DESIGNShould more than one option be considered, it isequally important to identify how they willcomplement each other to eliminate the need forradical changes as the development progresses. Thetype of vehicle selected will also depend on the wastecomposition, as high-density waste (high ash content)will not require compaction. The relationship betweenpayload and distance to the landfill or transfer stationmust also be considered. Table 11.2 gives someindication of the capital cost of the various options.The options for transport are the following:Hand cartHand carts, although not commonly used in SouthAfrica, can be designed for specific applications.These may include small informal communitieswith no planned or designed road infrastructure,and even planned developments during the earlystages where occupancy does not warrantsophisticated equipment, particularly in what canbe considered the lower income groups. Althoughlimited in carrying capacity, hand carts can beeffectively employed where job creation andlimited capital expenditure are the mainconsiderations.The use of hand carts has the advantage of notonly providing more employment opportunitieswithin the community due to the relatively smallareas of responsibility of the operator, but also ofcombining street cleaning with normal refusecollection. The main disadvantage is that theywould need to be supplemented with a communalbin system and the appropriate vehicle for finaldisposal.Animal-drawn cartAnimal-drawn carts are also not commonly used inSouth Africa, yet have similar applications to thehand cart. The only significant difference is that thearea of responsibility can be increased due to arelatively larger carrying capacity. A disadvantageis that animal-drawn carts can only be used if acommunity-based waste collection system isimplemented and the “contractor” has his ownchoice of transport. Should the disposal facility bewithin a practically attainable distance, the needfor support facilities could also be eliminated,provided access via freeways is not required.Tractor and trailerThe tractor and trailer, although not the first, wasprobably the most common means of mechanicaltransport for waste collection prior to theintroduction of compaction units, and can still beeffectively utilised in most developed andundeveloped areas. The variations andcombinations available are numerous and must becarefully assessed prior to implementation. Thetractor-trailer combination can be operatedwhere road conditions are not suitable for trucks,but is limited to a maximum 10 kilometre distanceto the disposal facility, provided access viafreeways is not required.Flat-bed truckThe flat- or open-bed truck is not commonly usedin South Africa. It has the disadvantage of a highloading height, particularly for use in developingareas where the high ash content of the collectedwaste results in increased mass of the container.Table 11.2: Capital cost of transport and collection options (1996)DESCRIPTION UNIT TRACTOR TOTAL19 m 3 half pack fel 348 500 400 000 748 50019 m 3 F5000 rel 207 000 400 000 607 00020,6 m 3 HC250 rel 175 600 400 000 575 60012 ton roll-on roll-off 111 000 400 000 511 0008 ton roll-on roll-off 85 000 400 000 485 00012 ton skip 66 700 400 000 466 7008 ton skip 64 700 340 000 404 70010,5 m 3 M160 rel 110 000 250 000 360 00020 m 3 gravity pack 68 200 250 000 318 20013 m 3 gravity pack 33 400 250 000 283 400aim refutip 20 m 3 145 000 100 000 245 000dome trailer 12 - 15 m 3 60 000 100 000 160 000power system 40 000 100 000 140 000motorised tricycle 40 000hand cart max 1,2 m 3 750Solid waste management Chapter 119
GUIDELINES FOR <strong>HUMAN</strong> <strong>SETTLEMENT</strong> <strong>PLANNING</strong> <strong>AND</strong> DESIGNWaste must also be covered during transport toprevent further environmental nuisance.Tip-packThe tip-pack is the forerunner of the rear-endloader. With the tip-pack, the weight of the refuseis used for compaction and normally has a capacitynot exceeding 10 m 3 . Trailers with similarapplications have since been developed for usewith tractors.Rear-end loadersRear-end loaders are available in sizes varying from10 m 3 to 21 m 3 , and have a relatively advancedcompaction system allowing a compaction ratio ofup to 4:1. This high compaction ratio and carryingcapacity, with the versatility of being capable ofhandling containers up to 6 m 3 , has made the rearendloader the most popular and commonly usedcollection vehicle in developed areas. This isparticularly so where volumes are high anddistances to disposal facilities are in excess of 10 km.The main disadvantages of using the rear-endloader are relatively high maintenance costs, andthat they can only be effectively used where goodroad infrastructures are in place. Legal payloadsneed to be monitored in the event of high-densitywastes, to prevent a negative impact on the roadinfrastructure.Load luggersThe load lugger is a special application vehicle andlimited to container applications. The mostcommon application is the handling of bulkcontainers from industries and large businesses,communal collection systems and the removal ofbuilders rubble from construction sites.Roll-on roll-offRoll-on roll-off vehicles are specially designedvehicles with very specific applications. They aremainly used for the transportation of largecapacityopen or closed compacted containersranging from 18 m 3 to 30 m 3 .RailRail has only recently become an option in wastemanagement, particularly where the pressures ofurban development have dictated that landfillsneed to be positioned further from the source ofwaste generation.STREET CLEANINGWind-blown litter and illegal dumping of uncollectedwaste are probably the most visible aspects of poorwaste management within any community and onethat unfortunately receives the least attention,particularly in newly developed communities. If notcontrolled, these become major contributors toblocked stormwater drains and sewers, often the maincause of complaints within communities. Streetcleaning is unfortunately an unrecoverable cost but anecessary component of the waste collection servicethat needs to be provided, and should be budgetedand planned for in any collection system (see also thesection on street cleaning in Chapter 6: StormwaterManagement).TRANSFER STATIONS/SYSTEMSA transfer station is a facility for transferring wastefrom the collection vehicle to a more appropriatevehicle where longer haul distances are necessary forfinal disposal. The purpose is to reduce not only thetransport unit cost of collection vehicles, and obtainmore cost-effective payloads, but also to allow quickerturnaround times and therefore increased productivity.The need for a transfer station and the degree ofsophistication required will be determined by thevolume of waste generated, the collection systemimplemented, and the distance to the disposal site.A transfer station can be designed to operate atvarious levels of sophistication:• depositing the waste into containers of variouscapacities for specially designed vehicles,commonly used in communal waste-collectionsystems and garden-refuse sites;• depositing the waste onto a suitably designedplatform for either mechanical or manual loadinginto the long-haul vehicle;• depositing directly into the long-haul vehicle; and• depositing the waste into large compacting unitsfor transporting by specially designed vehicles.Transfer stations can be considered the final disposalpoint by the community, particularly where communalcollection services are in operation. Communaldisposal facilities, where open bulk containers areutilised, therefore need to be managed and controlledwith the same care and responsibility as that requiredfor a landfill site.10Chapter 11Solid waste management
GUIDELINES FOR <strong>HUMAN</strong> <strong>SETTLEMENT</strong> <strong>PLANNING</strong> <strong>AND</strong> DESIGNLocationThe location of communal disposal points must beselected with sensitivity and careful planning to ensureaccessibility and acceptance by the community, andnot to interfere with pedestrian movement, or createan eyesore, or a public nuisance of dust and odour.Refer also to Chapter 5.The larger or more sophisticated transfer stationsystems should be located with equally carefulplanning. Easy access to trunk routes and minimalconflict with future development are some of themore important considerations.Other aspects often not considered in locating transferstations and landfill sites, particularly in largeoperations, are traffic densities and road design. It isimportant that the requirements of both the local andprovincial authorities are complied with, particularly inrespect of paving design as well as visibility and trafficflow at intersections and access roads. Refer also toChapters 7 and 8.RECYCLINGRecycling means the remanufacturing of recoveredmaterials, as opposed to re-use where the recoveredproduct is simply re-used for similar purposes, e.g.beverage bottles.The increasing pace of life in South Africa’s developedcommercial and industrial areas, particularly in thelarger cities, reflects an increasing demand on theindividual’s time - both in work and leisure activities.These demands have changed consumption needs,which in turn have led to an increase in discardedgoods and packaging.MarketsThe success of recycling is largely dependent on themarket availability of both the raw product and theremanufactured product, and unfortunately they havea direct effect on each other. As waste cannot beconsidered recycled until it is reprocessed, thesemarkets have achieved little more than providingsubsistence levels for the individual entrepreneurs.EducationEducation in the principles and effect of wasteminimisation and recycling is a critical part of thewaste management process. The process of educationwill no doubt be slower in developed communities,where new attitudes need to be cultivated. Theopportunities for success are far greater in newlydeveloped communities if proper planning andeducational programmes are an integral part of thecollection system.DISPOSALAll communities, regardless of size and location, willneed to make provision for the final disposal ofcollected refuse. To ensure environmentalacceptability the Department of Water Affairs &Forestry (1994) has produced the document MinimumRequirements for Waste Disposal by Landfill. It isimportant to understand that, should no registeredlandfill site be available, a permit for disposal based onthe “minimum requirements” will be enforced asrequired under Section 21 of the Environment andConservation Act (Act 73 of 1989).Table 11.3: Landfill classificationAimL<strong>AND</strong>FILL SIZEMAX. RATE OF DEPOSITION(tons per day)The ultimate aim of recycling is the protection of theenvironment and public health by reducing the everincreasingvolumes of waste being generated bydeveloping societies, as well as reducing the amountof natural resources necessary for the manufacture ofany product.HistoryDespite several million rands having been spent onsophisticated recycling plants, the history of recyclingon a large scale in South Africa has not beenparticularly successful. There has been reasonablesuccess in certain regions, with organisations such asCollect-a-Can, Nampac, Sappi, Mondi and Consol Glassconcentrating mainly on beverage cans, paper, plasticsand glass. Voluntary recycling and small buy-backcentres have met with some success, which is generallydependent on the user-friendliness of the scheme.Communal Less than 1Small Greater than 1; less than 25Medium Greater than 25; less than 500Large Greater than 500Landfill site classificationThe volume and content of the waste to be disposedof will dictate the size and classification of the landfill,and necessary requirements for licensing purposes.There are generally only two distinct types of landfill:• general waste landfills (G) for waste normallyproduced within residential and businesscommunities, with the exception of hazardous ortoxic wastes; andSolid waste management Chapter 1111
GUIDELINES FOR <strong>HUMAN</strong> <strong>SETTLEMENT</strong> <strong>PLANNING</strong> <strong>AND</strong> DESIGN• hazardous waste landfills (H) for waste which hasthe potential to have adverse effects on bothpublic health and the environment, even in smallquantities, due to it’s inherent chemical andphysical qualities.The process of developing any landfill site requires thelocal authority or private concern to conduct aninvestigation as to whether it complies with theminimum requirements under Section 4 (Site selection)of the above document provided by the Departmentof Water Affairs & Forestry. Should the results of theseinvestigations meet with the Department’s approval, itwill be necessary for the developer to obtain a permitto develop and operate the landfill facility, based onfurther requirements outlined in Section 5 (Permitting)of the same document.INCINERATIONWith large open tracts of land still available and thehigh capital cost of this option, waste incineration ona large scale has not yet been considered a viablealternative in South Africa. The demand for land,however, and the need to protect our limitedgroundwater resources, suggests that alternativesolutions to landfilling need to be investigated.As a possible alternative energy resource, with jobcreatingpotential for developing communities, theoption of incineration as an alternative to landfillingmust be given consideration in any future wastemanagement planning strategies, with due regard toprevailing air-quality standards.12Chapter 11Solid waste management
GUIDELINES FOR <strong>HUMAN</strong> <strong>SETTLEMENT</strong> <strong>PLANNING</strong> <strong>AND</strong> DESIGNTable 11.4: Minimum requirements for landfill sitesLEGENDGGENERAL WASTEB - No significant leachate producedB + Significant leachate producedR RequirementN Non-requirementF Special consideration to be given by departmental representativeCCommunallandfillSSmalllandfillMMediumlandfillLLargelandfillMINIMUM REQUIREMENTS / CATEGORY B - B + B - B + B - B + B - B +Appoint responsible person R R R R R R R RClassify proposed landfill site R R R R R R R REliminate areas with fatal flaws R R R R R R R RIdentify candidate landfill sites R R R R R R R RBuffer zone 200m 200m 500m500m F F F FMinimum unsaturated zone 2m 2m 2m F F F F FRank sites as indicated N N N N R R R RSite feasibility study N N R R R R R RSite description R R R R R R R RComplete permit application form R R R R R R R RPreliminary geohydrological investigation N N R R R R R RPreliminary environmental impact assessment N N R R R R R RIdentify critical factors N N R R R R R RAssess critical factors N N R R R R R RConfirm no fatal flaws R R R R R R R RConsult interested and affected parties R R R R R R R RConfirm best site N N N N R R R RCompile and submit feasibility report (including maps) N N R R R R R RDepartment of Water Affairs & Forestry confirmation N N R R R R R Rof feasibilitySolid waste management Chapter 1113
GUIDELINES FOR <strong>HUMAN</strong> <strong>SETTLEMENT</strong> <strong>PLANNING</strong> <strong>AND</strong> DESIGNTable 11.5: Minimum requirements for permitting a landfill siteLEGENDGGENERAL WASTEB - No significant leachate producedB + Significant leachate producedR RequirementN Non-requirementF Special consideration to be given by departmental representativeCCommunallandfillSSmalllandfillMMediumlandfillLLargelandfillMINIMUM REQUIREMENTS / CATEGORY B - B + B - B + B - B + B - B +Appoint responsible person R R R R R R R RConfirm site classification R R R R R R R RLandfill permit R R R R R R R RDeal with department’s regional office R R R R R R R RDeal with department’s head office N N N N N N N NPermit application form R R R R R R R RSite demarcated on a map R R R R R R R RSite visit by state departments F F F F R R R RFull permit application report N N N F R R R RFeasibility study report N N N R R R R RGeohydrological investigation report N N R R R R R RGeological investigation report N N R R R R R REnvironmental impact assessment N N N R R R R REnvironmental impact control report N N N R R R R RLandfill conceptual design R R R R R R R RLandfill technical design N N N R R R R RApproval of technical design by department N N N R R R R RDevelopment plan R R R R R R R ROperation and maintenance plan R R R R R R R RClosure/rehabilitation plan R R R R R R R REnd-use plan N N R R R R R RWater quality monitoring plan N N R R R R R RAmend title deed to prevent building development N N R R R R R Ron closed landfillReport change of ownership R R R R R R R RSite inspection prior to commissioning N N N N R R R R14Chapter 11Solid waste management
GUIDELINES FOR <strong>HUMAN</strong> <strong>SETTLEMENT</strong> <strong>PLANNING</strong> <strong>AND</strong> DESIGNLEVELS OF SERVICEFor any collection service to be truly effective all wastemust be removed completely from all storage andcollection points. This, however, has many practicaland cost implications. It is therefore important toestablish a minimum standard that is acceptable andaffordable by the community, based on the on-sitestorage facilities provided, the frequency of collectionand the effectiveness of the service provided. All levelsof service are therefore based on the premise that thelocal authority provides the necessary guidance and aminimum collection/removal service at least once aweek rendering an acceptable level of cleanlinesswithin the community.There are many permutations in providing a wastecollection service within the current South Africanscenario. Particular thought and attention should begiven to the mix of levels of service and cost-effectiveoptions of servicing the Phase 1 disposal points (seeFigure 11.6).Level 1This first level of service can be considered theminimum, where the residents are required todeliver their waste to specifically allocated communaldisposal points (Phase 1 disposal). These disposalpoints could be specially designed masonry structureswith embankments, or ready-made containersstrategically placed. Should the option of fixedstructures be selected, these would need to be clearedeither by manual labour or mechanical means and thewaste transferred to suitable vehicles for transport tothe disposal site. The container option allows the useof either rear-end loader or special application vehiclesthat have the capability of lifting and transporting thecontainers in use.Level 2This level of service requires the local authority toprovide for the collection of refuse from eachhousehold by the cheapest possible means (i.e.LEVELS OF SERVICEWASTE COLLECTIONLOCAL AUTHORITY RESPONSIBILITYPHASE 1 DISPOSALLEVEḺ1ResidentsDesigned platformContainerLEVEḺ2Hand cartDesigned platformTRANSFERContainerSTATIONLEVEḺ3SOURCEAnimal-drawn cartDesigned platformContainerLEVEḺ4Tractor-trailerDesigned platformL<strong>AND</strong>FILLContainerLEVEḺ5Rear-end loaderFigure 11.6: Levels of serviceSolid waste management Chapter 1115
GUIDELINES FOR <strong>HUMAN</strong> <strong>SETTLEMENT</strong> <strong>PLANNING</strong> <strong>AND</strong> DESIGNwheelbarrow or handcart). Refuse is collected fromsite or from the kerbside and transported to thenearest or designated communal disposal point.Level 3This level of service can be considered a naturalprogression from Level 2. The collection agent has theoption of making use of animal-drawn carts ormotorised tricycles, allowing for a larger area ofresponsibility. Where the landfill is considered to be aneconomically viable distance from the collection area,the need for Phase 1 disposal points may beeliminated, provided access via freeways is notrequired.Level 4This level of service can be considered a progressionfrom Level 3, where the collection agent has theoption of using mechanical means for transporting thecollected refuse; depending on the terrain, this couldbe in the form of tractor-trailer or suitable lightdelivery vehicle. Again, should the landfill beconsidered an economically viable distance from thecollection area, the need for Phase 1 disposal can beeliminated.Level 5This level of service can be considered the optimummeans of collection in the majority of developedcommunities. The waste is collected from site or thekerbside by means of specially designed collectioncompactor vehicles and transported directly or viatransfer station to point of final disposal.GUIDELINES FOR IMPLEMENTATIONOF LEVELS OF SERVICELevels of service 1 through 4 would as a rule only beimplemented in conjunction with community-basedprogrammes, or entrepreneurial developmentprogrammes in relatively small and developingcommunities. This, however, does not preclude theirapplication in developed communities and elsewhere,or in combination with Level 5.Table 11.6 provides some indication of the application,responsibility and conditions that need to beidentified prior to implementation.Quantity and compositionThe standard method of reporting waste generation isin terms of mass - this is necessary for proper vehicleselection. However, weight data are of limited value indesigning landfills and selecting storage containers,which are identified by volumetric measurement.Volumetric measurement of the waste does, however,depend on how much the waste has been compactedand it’s density.There are two methods for determining wastegenerationrates:Load count analysis or weight volumeanalysis• A specific area of collection is selected and thenumber of individual loads, correspondingvehicle volumes and characteristics, and theweight of each load are recorded over aspecified period of time.Materials balance analysis• Identify a system boundary.• Record all activities that cross and occur withinthe boundary, which affect the wastegeneration rate.• Identify and record the rate of generationassociated with these activities.• Identify and record the composition of thewaste generated within the boundary.Collection-route balancing and planningOnce the quantity of waste needing collection isdetermined, it is important to plan collection routes toensure a productive and economical service. This canbe done by obtaining a map or plan of the area inorder to identify the following:• all service points;• all one way streets;• any culs-de-sac; and• areas that do not require a service.Areas of daily collection should be compact and notfragmented and, where possible, natural boundariesshould be used. Collection routes should be planned tomaximise vehicle capacities. For the convenience ofhouseholders it is preferable to maintain a regularroutine, to ensure their waste is ready for collection.Proper and accurate estimation of the quantities andcomposition of the waste stream is an importantaspect of the waste management system, as over- orunder-estimation can result in either incorrect vehicleselection, shortened landfill life or increased costs.16Chapter 11Solid waste management
GUIDELINES FOR <strong>HUMAN</strong> <strong>SETTLEMENT</strong> <strong>PLANNING</strong> <strong>AND</strong> DESIGNTable 11.6: Guide to responsibilities and conditionsLEVEL OFLOCAL AUTHORITYSERVICE COMMUNITY(and/or appointed agent)CONDITIONSREQUIREMENTSDESCRIPTION QUANTITY & TYPELevel 1 Litter prevention Community liaison No formal road infrastructure Containers (minimum 1 per ±50 households) Dependent on waste volumesResidents Litter collection Collect waste from disposal point Maximum distance to disposal point ±200 m Dependendent on frequency of service (Phase 1 disposal)Delivery of waste to disposal point Maintenance of disposal pointEnvironmental awareness programmes Transport vehicles Dependent on distance to landfill (see graphs)Level 2 Place waste for collection on kerb-side Community liaison No formal road infrastructure Hand carts Dependent on community-based programmeHand carts Collect waste from site (where Collect waste from kerbside Maximum distance to disposal point ± 1 000 mnecessary) No formal road infrastructure Containers (minimum 1 per ±50 households) Dependent on waste volumesLitter prevention Collect waste from disposal point Dependent on frequency of service (Phase 1 disposal)Maintenance of disposal pointLitter collection Transport vehicles Dependent on distance to landfill (see graphs)Environmental awareness programmes Dependent on frequency of serviceLevel 3 Place waste for collection on kerbside Community liaison No formal road infrastructure Animal-drawn carts/Motorised tricycles Dependent on community-based programmeAnimal- Litter prevention Collect waste from kerbside Limited road infrastructure Dependent on waste volumesdrawn carts; Collect waste from site (where necessary) Maximum distance to disposal point 3 000 m Dependent on frequency of servicemotorised Collect waste from disposal point Allowable road ordinance conditions Dependent on access to landfill/transfer stationtricycles Maintenance of disposal pointLitter collection Containers (minimum 1 per ±50 households) Dependent on waste volumesEnvironmental awareness programmes Dependent on frequency of service (Phase 1 disposal)Transport vehicles Dependent on distance to landfill (see graphs)Level 4 Place waste for collection on kerbside Community liaison Limited road infra-structure Tractor-trailer combos/LDVs Dependent on community-based programmeTractor-trailer Litter prevention Collect waste from kerbside Maximum distance to disposal point ±10 km Dependent on waste volumescombinations; Collect waste from site (where necessary) Allowable road ordinance conditions Dependent on frequency of servicelight delivery Collect waste from disposal point Dependent on access to landfill/transfer stationvehicles Maintenance of disposal pointLitter collection Containers (minimum 1 per ±50 households) Dependent on waste volumesEnvironmental awareness programmes Dependent on frequency of service (Phase 1 disposal)Transport vehicles Dependent on distance to landfill (see graphs)Level 5 Place waste for collection on kerbside Collect waste from kerb-side Allowable road ordinance conditions Transport vehicles Dependent on waste volumesRear-end Litter prevention Collect waste from site (where necessary) Proper road infra-structure Dependent on frequency of serviceloaders Litter collection Dependent on distance to landfill (see graphs)Environmental awareness programmesSolid waste management Chapter 1117
GUIDELINES FOR <strong>HUMAN</strong> <strong>SETTLEMENT</strong> <strong>PLANNING</strong> <strong>AND</strong> DESIGNDetailed routing of collection vehicles can be plannedfor collection from both sides of the street or from oneside only. Collection from one side only is preferable inbusiness areas and areas with high traffic densities, toavoid conflict with traffic patterns and the safety ofthe workers. Figure 11.7 provides examples ofcollection-route alternatives.CONCLUSIONWaste management in the changing societies in SouthAfrica is a dynamic process, in terms of both collectionand disposal. It is the responsibility of the localauthority to ensure the service is provided to itscommunities. Town and city engineers therefore needto be vigilant in identifying changes, and beinnovative in making the service affordable, whilemeeting the standards expected by thesecommunities.BIBLIOGRAPHYDepartment of Water Affairs & Forestry (1994). WasteManagement Series. Minimum Requirements forWaste Disposal by Landfill.ROUTE COLLECTION FROM TWO SIDES OF THE ROADROUTE COLLECTION FROM ONE SIDE OF THE ROADFigure 11.7: Route collection alternatives18Chapter 11Solid waste management
Chapter 12Energy12.1 Grid electricity12.2 Other forms of energy12
Chapter 12.1Grid electricity12.1
GUIDELINES FOR <strong>HUMAN</strong> <strong>SETTLEMENT</strong> <strong>PLANNING</strong> <strong>AND</strong> DESIGNTABLE OF CONTENTSSCOPE . . . . . . . . . . . . . . . . . . . . . . . . . . . . . . . . . . . . . . . . . . . . . . . . . . . . . . . . . . . . . . . . . . . . . . . . . . . 1INTRODUCTION. . . . . . . . . . . . . . . . . . . . . . . . . . . . . . . . . . . . . . . . . . . . . . . . . . . . . . . . . . . . . . . . . . . . 1<strong>PLANNING</strong> OVERVIEW . . . . . . . . . . . . . . . . . . . . . . . . . . . . . . . . . . . . . . . . . . . . . . . . . . . . . . . . . . . . . . 1Role of planning . . . . . . . . . . . . . . . . . . . . . . . . . . . . . . . . . . . . . . . . . . . . . . . . . . . . . . . . . . . . . . . . . . . 1Initial plan. . . . . . . . . . . . . . . . . . . . . . . . . . . . . . . . . . . . . . . . . . . . . . . . . . . . . . . . . . . . . . . . . . . . . . . . 1Master plan. . . . . . . . . . . . . . . . . . . . . . . . . . . . . . . . . . . . . . . . . . . . . . . . . . . . . . . . . . . . . . . . . . . . . . . 1TERMS <strong>AND</strong> DEFINITIONS . . . . . . . . . . . . . . . . . . . . . . . . . . . . . . . . . . . . . . . . . . . . . . . . . . . . . . . . . . . . 1After diversity maximum demand (ADMD) . . . . . . . . . . . . . . . . . . . . . . . . . . . . . . . . . . . . . . . . . . . . . . 1DSP . . . . . . . . . . . . . . . . . . . . . . . . . . . . . . . . . . . . . . . . . . . . . . . . . . . . . . . . . . . . . . . . . . . . . . . . . . . . . 2Intermediate voltage (IV) . . . . . . . . . . . . . . . . . . . . . . . . . . . . . . . . . . . . . . . . . . . . . . . . . . . . . . . . . . . . 2Intermediate voltage distribution . . . . . . . . . . . . . . . . . . . . . . . . . . . . . . . . . . . . . . . . . . . . . . . . . . . . . 2Load factor (LF). . . . . . . . . . . . . . . . . . . . . . . . . . . . . . . . . . . . . . . . . . . . . . . . . . . . . . . . . . . . . . . . . . . . 2Low voltage (LV) . . . . . . . . . . . . . . . . . . . . . . . . . . . . . . . . . . . . . . . . . . . . . . . . . . . . . . . . . . . . . . . . . . . 2Maximum demand (MD). . . . . . . . . . . . . . . . . . . . . . . . . . . . . . . . . . . . . . . . . . . . . . . . . . . . . . . . . . . . . 2Medium voltage (MV). . . . . . . . . . . . . . . . . . . . . . . . . . . . . . . . . . . . . . . . . . . . . . . . . . . . . . . . . . . . . . . 2STATUTORY VOLTAGE LIMITS . . . . . . . . . . . . . . . . . . . . . . . . . . . . . . . . . . . . . . . . . . . . . . . . . . . . . . . . . 2ANALYSIS SOFTWARE . . . . . . . . . . . . . . . . . . . . . . . . . . . . . . . . . . . . . . . . . . . . . . . . . . . . . . . . . . . . . . . 3ADMD modelling . . . . . . . . . . . . . . . . . . . . . . . . . . . . . . . . . . . . . . . . . . . . . . . . . . . . . . . . . . . . . . . . . . 3Low voltage simulation packages. . . . . . . . . . . . . . . . . . . . . . . . . . . . . . . . . . . . . . . . . . . . . . . . . . . . . . 3Electricity loss modelling . . . . . . . . . . . . . . . . . . . . . . . . . . . . . . . . . . . . . . . . . . . . . . . . . . . . . . . . . . . . 3LOAD FORECASTING . . . . . . . . . . . . . . . . . . . . . . . . . . . . . . . . . . . . . . . . . . . . . . . . . . . . . . . . . . . . . . . . 3Final vs initial ADMD . . . . . . . . . . . . . . . . . . . . . . . . . . . . . . . . . . . . . . . . . . . . . . . . . . . . . . . . . . . . . . . 3How to estimate ADMD . . . . . . . . . . . . . . . . . . . . . . . . . . . . . . . . . . . . . . . . . . . . . . . . . . . . . . . . . . . . . 3CONSUMER CLASSIFICATION . . . . . . . . . . . . . . . . . . . . . . . . . . . . . . . . . . . . . . . . . . . . . . . . . . . . . . . . . 4Consumption classification . . . . . . . . . . . . . . . . . . . . . . . . . . . . . . . . . . . . . . . . . . . . . . . . . . . . . . . . . . . 4Load density classification . . . . . . . . . . . . . . . . . . . . . . . . . . . . . . . . . . . . . . . . . . . . . . . . . . . . . . . . . . . 4Grid electricity Chapter 12.1i
GUIDELINES FOR <strong>HUMAN</strong> <strong>SETTLEMENT</strong> <strong>PLANNING</strong> <strong>AND</strong> DESIGN<strong>PLANNING</strong> PROCEDURE . . . . . . . . . . . . . . . . . . . . . . . . . . . . . . . . . . . . . . . . . . . . . . . . . . . . . . . . . . . . . 5Available technologies . . . . . . . . . . . . . . . . . . . . . . . . . . . . . . . . . . . . . . . . . . . . . . . . . . . . . . . . . . . . . . 5Planning steps. . . . . . . . . . . . . . . . . . . . . . . . . . . . . . . . . . . . . . . . . . . . . . . . . . . . . . . . . . . . . . . . . . . . . 5Area load densities . . . . . . . . . . . . . . . . . . . . . . . . . . . . . . . . . . . . . . . . . . . . . . . . . . . . . . . . . . . . . . . . . 6Transformer supply areas . . . . . . . . . . . . . . . . . . . . . . . . . . . . . . . . . . . . . . . . . . . . . . . . . . . . . . . . . . . . 6Master plan layout . . . . . . . . . . . . . . . . . . . . . . . . . . . . . . . . . . . . . . . . . . . . . . . . . . . . . . . . . . . . . . . . . 7Practical considerations . . . . . . . . . . . . . . . . . . . . . . . . . . . . . . . . . . . . . . . . . . . . . . . . . . . . . . . . . . . . . 7Optimisation for urban application . . . . . . . . . . . . . . . . . . . . . . . . . . . . . . . . . . . . . . . . . . . . . . . . . . . . 7Areas of cost saving . . . . . . . . . . . . . . . . . . . . . . . . . . . . . . . . . . . . . . . . . . . . . . . . . . . . . . . . . . . . . . . . 8Pre-payment systems . . . . . . . . . . . . . . . . . . . . . . . . . . . . . . . . . . . . . . . . . . . . . . . . . . . . . . . . . . . . . . . 8LV VOLTAGE DROP CALCULATIONS . . . . . . . . . . . . . . . . . . . . . . . . . . . . . . . . . . . . . . . . . . . . . . . . . . . . 8Recommended method for voltage drop calculation. . . . . . . . . . . . . . . . . . . . . . . . . . . . . . . . . . . . . . . 8Alternative method for voltage drop calculation . . . . . . . . . . . . . . . . . . . . . . . . . . . . . . . . . . . . . . . . . 8Measurement of consumer currents. . . . . . . . . . . . . . . . . . . . . . . . . . . . . . . . . . . . . . . . . . . . . . . . . . . . 8SERVICE CABLE CONNECTION STRATEGIES . . . . . . . . . . . . . . . . . . . . . . . . . . . . . . . . . . . . . . . . . . . . . . . 9Oscillating vs non-oscillating connections . . . . . . . . . . . . . . . . . . . . . . . . . . . . . . . . . . . . . . . . . . . . . . . 9AREA LOSS MODEL . . . . . . . . . . . . . . . . . . . . . . . . . . . . . . . . . . . . . . . . . . . . . . . . . . . . . . . . . . . . . . . . 10DOCUMENTATION REQUIREMENTS . . . . . . . . . . . . . . . . . . . . . . . . . . . . . . . . . . . . . . . . . . . . . . . . . . . 10FINANCIAL CALCULATIONS . . . . . . . . . . . . . . . . . . . . . . . . . . . . . . . . . . . . . . . . . . . . . . . . . . . . . . . . . . 11APPENDIX A: REFERENCE ST<strong>AND</strong>ARDS, SPECIFICATIONS <strong>AND</strong> GUIDELINES . . . . . . . . . . . . . . . . . . . . 12A.1 The NRS rationalised user specifications . . . . . . . . . . . . . . . . . . . . . . . . . . . . . . . . . . . . . . . . . . . 12A.2 SABS standards . . . . . . . . . . . . . . . . . . . . . . . . . . . . . . . . . . . . . . . . . . . . . . . . . . . . . . . . . . . . . . 14iiChapter 12.1Grid electricity
GUIDELINES FOR <strong>HUMAN</strong> <strong>SETTLEMENT</strong> <strong>PLANNING</strong> <strong>AND</strong> DESIGNLIST OF TABLESTable 12.1.1 Consumption class . . . . . . . . . . . . . . . . . . . . . . . . . . . . . . . . . . . . . . . . . . . . . . . . . . . . . . . . . . . .4Table 12.1.2 Domestic density classification . . . . . . . . . . . . . . . . . . . . . . . . . . . . . . . . . . . . . . . . . . . . . . . . . .5Table 12.1.3 High level preliminary technology selection . . . . . . . . . . . . . . . . . . . . . . . . . . . . . . . . . . . . . . . .5Table 12.1.4 Summary of documentation required and examples . . . . . . . . . . . . . . . . . . . . . . . . . . . . . . . .11LIST OF FIGURESFigure 12.1.1 Typical daily demand curve . . . . . . . . . . . . . . . . . . . . . . . . . . . . . . . . . . . . . . . . . . . . . . . . . . . . .2Figure 12.1.2 Economic trade-off . . . . . . . . . . . . . . . . . . . . . . . . . . . . . . . . . . . . . . . . . . . . . . . . . . . . . . . . . . .6Grid electricity Chapter 12.1iii
GUIDELINES FOR <strong>HUMAN</strong> <strong>SETTLEMENT</strong> <strong>PLANNING</strong> <strong>AND</strong> DESIGNivChapter 12.1Grid electricity
GUIDELINES FOR <strong>HUMAN</strong> <strong>SETTLEMENT</strong> <strong>PLANNING</strong> <strong>AND</strong> DESIGNSCOPEThese guidelines cover aspects that need to beconsidered for the optimum planning and designingof electricity supply systems for residential townships,including developing communities.INTRODUCTIONThis section provides electricity layout planners withthe required background to effectively follow thecorrect steps to achieve optimal design. It describes theapproach to “greenfield” projects with reference tothe information, resources and documentationavailable to assist the planner/designer. Originalcontent is kept to a minimum and there is effectivereferencing to established documents withexplanatory notes where necessary. The guidelines arewritten with low technical content to maximise ease ofreading and practical application.NOTE: Reference materials are continually beingupdated to match developments in technology.The use of typical analytical software tools is describedand substantiated with practical examples.Special attention is given to the methods that can beused to estimate After Diversity Maximum Demand(ADMD) figures and the ADMD vs consumerclassification relationships.Details regarding the method that should be followedwhen optimising an electrical layout and technologyselection are given. Practical tips on service connectionstrategies and recommendations on the voltage dropcalculation method are given.(See Appendix A for lists of reference documents).<strong>PLANNING</strong> OVERVIEWRole of planningPlanning is vitally important to ensure the optimalapplication of technology and to achieve the requiredquality of supply. Planners have to consolidate andvalidate the information received from marketing surveys.Using the information at hand, a selection of technology(voltages and ratings) and its application (layout andconfiguration of network) must be decided upon. Astrong feedback system is required to ensure that the asbuiltstatus of the network is in accordance with the plan.The planner is responsible for ensuring that futureupgrades are properly planned and optimised.Experience has shown that it is best to plan thedevelopment of an area in phases. The area will havean initial plan and a future envisaged masterplan.The implementation of the masterplan in phases isknown as a “phased implementation plan”. The terms“master plan”, “initial plan” and “phasedimplementation plan” are used in the text.Initial planIt is unlikely to be economically feasible to implementthe master plan immediately, and an initial plan thatcaters for expected network loading after five to sevenyears must be implemented first. The objective is todelay capital expenditure for as long as possible toreduce life cycle costs, while maintaining anacceptable quality of supply.Master planThe master plan layout refers to the long-range planfor the area (based on the expected loading after 20years), using the optimised technology. The objectiveof master planning is to ensure upgradability andoptimised long-term infrastructure development.TERMS <strong>AND</strong> DEFINITIONSA glossary of terms used in the planning and design ofelectrical distribution systems is given in the NationalRationalised Specifications NRS 034-Part 0. A few termshave been extracted and adapted for ease of readingin the context of this chapter. Definitions are listedbelow in alphabetical order.After diversity maximum demand(ADMD)The simultaneous maximum demand of a group ofhomogeneous consumers, divided by the number ofconsumers, normally expressed in kVA.Thus the ADMD of N consumers is:ADMD (N) = MD(N)NThis value generally decreases to an approximatelyconstant value for 1 000 or more consumers and hastherefore been chosen as a convenient referencevalue. (Practically no difference in ADMD existsbetween 100 and 1 000 consumers.)ADMD with no mention of the number of consumers(N) is defined as that representing the ADMD of 1 000consumers, i.e.ADMD = ADMD(1 000)For customers who have the potential to have a high orvery high demand, an individual customer’s maximumdemand is generally approximately two to three timesthe ADMD for a group of similar customers. Forcustomers with a limited potential demand, in the veryGrid electricity Chapter 12.11
GUIDELINES FOR <strong>HUMAN</strong> <strong>SETTLEMENT</strong> <strong>PLANNING</strong> <strong>AND</strong> DESIGNlow, low, or moderate consumption range, anindividual customer’s consumption is typically four tofive times the ADMD for a group of similar customers.10080Maximum demandDSPA domestic supply point (consumer metering point).Demand (kW)6040AIntermediate voltage (IV)20BAn AC medium voltage in the range 1 000 V to 3 300 Vphase-to-phase.Intermediate voltage distributionTypically a distribution system operating at a nominalAC voltage of 1,9 kV phase-to-neutral, or 3,3 kVphase-to-phase.AB00 2 4 6 8 10 12 14 16 18 20 22 24Time (hours)Additional potential energyif the load is constant at MDActual energy used per dayLF =BA + BFigure 12.1.1: Typical daily demand curveLoad factor (LF)A ratio of the actual energy supplied (in kWh) over aperiod divided by the maximum demand in kW overthat period, multiplied by the time period selected(i.e. actual energy supplied divided by potentialenergy supplied). It is always less or equal to unity.LF =MD(kW) =Actual EnergyMD (kVA) x PF x tMD (kVA) x PFwhere PF is the power factor.(See Figure 12.1.1.)Low voltage (LV)≤ 1.0The range of AC voltages up to and including 1 000 Vr.m.s. (see SABS 1019:1985 for a full definition).Maximum demand (MD)The highest averaged electrical demand for aspecified period. Typically, 5 to 60 min and 30 min arenormally used as these are close to the thermalconstant of transformers and lines. (See Figure12.1.1.)Medium voltage (MV)The range of AC voltages exceeding low voltage, upto and including 44 kV. (See SABS 1019:1985 for a fulldefinition.)STATUTORY VOLTAGE LIMITSThe South African statutory voltage limits for thesupply voltage to residential consumers have beensummarised from Government Notice No R103 of 26January 1996, which amended Regulation 9 of theElectricity Act (No 41 of 1987).This notice stipulates that:a) for nominal system voltages lower than 500 V, thesupply voltage shall be the standard voltage;b) in the case of a distribution system with a nominalsystem voltage lower than 500 V, the supplyvoltage shall not deviate from the standardvoltage by more than 10%; andc) the Board (i.e. The National Electricity Regulator)may on application permit other deviations fromthe stipulated supply voltage and frequency.The statutory voltage limits imply that all newnetworks must conform to the standard voltage of230 V ± 10% or 253 V maximum and 207 V minimumat the point of supply.Typically, economic studies indicate the economicapportionment of voltage drop, to meet thestatutory limits of 230 V ± 10%, is to aim for anapproximately 8% voltage drop on the LV distributor,including service connections. This figure can beincreased to 9% or even a bit higher, provided thatthe regulated busbar is electrically close to theelectrification area and steps can be taken to makethe LDC (load density classification) of thetransformer respond only to the electrification areafeeder’s loading.2Chapter 12.1Grid electricity
GUIDELINES FOR <strong>HUMAN</strong> <strong>SETTLEMENT</strong> <strong>PLANNING</strong> <strong>AND</strong> DESIGNNOTES• A further 5% voltage drop is permissible within thecustomer’s premises (see SABS 0142).• The assessment method for calculating the voltagefrom sample measurements is described in NRS 048-part 2.• The regulated MV busbar must be controlled viaLDC setting and electrification area distributiontransformer tap positions (if fitted), to maintain atleast 230 V during heavy load periods and notexceed 230 V + 10% during light load periods atthe MV transformer’s LV output.• Care should be taken to limit the voltage drop in LVservice cables near the end of LV distributors to lessthan 2% (using the appropriate undiversifiedADMD), especially where long looped servicessupply a number of consumers.ANALYSIS SOFTWAREThe availability of personal computers has led to thedevelopment of programs to assist with the analysis ofnetworks. These packages are in some cases availablefrom the market, but also from consultants and thenetwork planning departments of electricity suppliers.Three types of systems are available: ADMD modelling,low voltage simulation and electricity loss modelling.ADMD modellingAn After Diversity Maximum Demand modellingapproach is based on appliance usage information tocalculate the ADMD, maximum demand, energyconsumption and monthly electricity costs for anydomestic community.NOTE: This method should be used with extremecaution, because to obtain valid data on applianceavailability and usage requires specialist marketresearch.Low voltage simulation packagesThese are low voltage network simulation packagesthat integrate MV/LV transformer, LV distributor andservice cables using per-phase analysis techniques.ADMD figures obtained from other systems are used asinput.Electricity loss modellingThis involves electrification loss-management systemsthat may be used to monitor system losses forimplemented projects, or as design tools during theplanning stage to help with network optimisation.LOAD FORECASTINGLoad forecasting impacts on the whole network plan,as well as capital expenditure. Residential townshipload forecasts focus on ADMD forecasting over a 15- to20-year period, which reflects the economic life of theplant. ADMD is used for MV/LV transformer sizing andto calculate voltage drop over the LV feeders, servicecables and MV/LV transformers.Final vs initial ADMDTwo ADMD figures should be determined prior to anyother analysis work or technology decisions:• a seven-year (initial) ADMD figure is required todetermine the first phase of the future masterplan; and• a master plan ADMD (final) for loads in 15 to 20years’ time is the major influencing parameter thatdetermines the masterplan settlement layout.Essential to the viability of the project is the use of aphased upgraded plan that progresses from the initialplan towards the master plan, using the respectiveADMD values.How to estimate ADMDThree acceptable methods of determining the ADMDfigures can be used:Appliance modelThis has an approach or design basis that modelsdomestic appliance behaviour over the peak hourto estimate the appliance’s contribution to theADMD and the expected energy consumption perappliance per month.This technique gives the planner the informationrequired to forecast individual energy and demandrequirement forecasting for the electrificationarea, and is the preferred method for ADMDdetermination.NOTE: Recent experience with this methodindicates that, for customers in the high and veryhigh consumption classes, the consumption can beseverely underestimated using this method.Direct measurementThe ADMD may be determined by measuring themaximum demand of a representative existingsuburb over the peak month (typically winter forJohannesburg). The suburb in question must ideallyhave been electrified for many years to yield thecorrect ADMD figure. If that suburb was providedwith electricity only five years previously then aGrid electricity Chapter 12.13
GUIDELINES FOR <strong>HUMAN</strong> <strong>SETTLEMENT</strong> <strong>PLANNING</strong> <strong>AND</strong> DESIGNfive-year ADMD figure will be determined,whereas the aim should be to establish a 20-yearADMD figure.This method may therefore prove inappropriate forrecently electrified suburbs.Non-residential loads (such as for schools, hospitalsand small industries) must be excluded from thismeasurement exercise to ensure homogeneity(only the peak time contribution of these loadsmust be subtracted from the overall measuredADMD, to take non-residential diversity intoaccount).Therefore,MD residential = MD total - MD non-residentialEnergy load factor methodA further approach is that used where energy salesforecasts are available. The ADMD can bedetermined by estimating a load factor at suburblevel, which is typically between 25% and 45% (ifthe individual DSP-level load factor is used then theADMD will be undiversified, i.e. the demand forone DSP would be determined).Example:For a suburb the expected 20-year horizon forenergy sales is estimated to be 2 400 units perannum, with expected sales of 1 440 units perannum after seven years.The annual load factor for the township isestimated to be 26% for both time horizons.NOTE: The calculations are more appropriatelydone over annual periods than monthly periods,because there are significant differences in bothconsumption and load factor in different months.CONSUMER CLASSIFICATIONConsumption classificationConsumers can be divided into classes according toannual consumption and appliance utilisation. NRS034-1, Table 2, provides guidance for ADMD figuresaccording to broad categories of consumption class.This table is given in Table 12.1.1 below, with annualload factors at suburb level (full diversity) added.These load factors have been derived from the NRSLoad Research Project.The results of investigations to correlate the annualenergy consumption of consumers, the majorclassification characteristics of the consumers and theexpected ADMD have been recorded in a report on theNRS Load Research Project, which is continuing. Theresults have been used to derive the planningparameters set out in the second edition of NRS 034-1.Consumption classification can be derived fromappropriate market research programmes andeconomic studies for each area to be electrified. Thistype of work is usually undertaken by consultants withthe necessary marketing and engineering background.ADMD (N) = MD residentialDSPsprovided that DSPs > 100, to allow for full diversity.Therefore,ADMD final = kWh 2 400=LF x h 0,26 x 8 760ADMD seven = kWh 1 400=LF x h 0,26 x 8 760= 1,1 kVA= 0,6 kVAIf DSPs < 100 then adjust the ADMD as shown inTable 12.1.1.Load density classificationLoad density (kW/ km 2 ), which is a function of ADMDand stand size, is a very useful aid when selectingtechnology and calculating voltage drop. Table 12.1.2Table 12.1.1:Consumption classCONSUMPTION CLASS APPROX. FINAL LOADING APPROX. ANNUAL APPROX. kWh PER(SEE 4.3.3.2 OF NRS 034-1) <strong>AND</strong> DESIGN ADMD (kVA) LOAD FACTOR (%) ANNUMVery high > 6 > 42* > 22 000High 3 to 6 35 to 42 9 200 to 22 000Medium 1,5 to 3 31 to 35 4 100 to 9 200Low 0,5 to 1,5 29 to 31 1 200 to 4 100Very low ≤ 0,5 28 to 29 < 1 300* In the very high consumption class, there might be demand-side management techniques, such as the application of ripple control that wouldinfluence the load factor.4Chapter 12.1Grid electricity
GUIDELINES FOR <strong>HUMAN</strong> <strong>SETTLEMENT</strong> <strong>PLANNING</strong> <strong>AND</strong> DESIGNTable 12.1.2:Domestic density classificationDOMESTIC DENSITY CLASSIFICATION ST<strong>AND</strong> SIZE (m 2 ) AVERAGE LOAD DENSITY (kW/km 2 )URBAN:(ADMD min = 0,5 kVAADMD max = 4,5 kVA)High density (HD) 20 000 0,5 to 250can be used to select a settlement’s domestic densityclassification.<strong>PLANNING</strong> PROCEDUREA planning procedure based on an approach agreedupon between municipal engineers and Eskom is setout in NRS 034-1.The recommended method for calculating voltagedrops on LV distributors is to use the Herman betaalgorithm described in NRS 034-1. The basis isstatistical, and it can be conveniently implementedusing spreadsheet software.Available technologiesCurrently available technologies for South Africanresidential areas are:• Conventional three-phase system withtransformation from three-phase medium voltageto three-phase low voltage (e.g. 22/0,4 kV).• Conventional single-phase system withtransformation from medium voltage usingtwo phases to single-phase low voltage (e.g.22/0,23 kV).• Intermediate voltage system using three-phasemedium voltage source, stepping through twovoltage transformations, first to an intermediatevoltage and then to low voltage using eithersingle- or three-phase alternatives (e.g. 22/3 kV,3/0 kV, 4 kV for the three-phase option or 22/1 kV,9/0 kV, 23 kV for the single-phase option).• MV/LV maypole system for rural areas. This systemusually employs smaller transformer sizes and thelow voltage network consists only of service cables(e.g. 22/0,23 kV).• Single wire earth return (SWER) system for very lowloads and remote areas where the earth is used asa return load current path. The SWER line could,for example, be designed to be 22 kV between theground and the single overhead wire (e.g. 22/0 kV,23 kV).Table 12.1.3 indicates the applications of thesetechnologies for various domestic density classifications.For high-density urban applications the conventionalthree-phase system is the only appropriate one to use.For rural networks any system may be appropriatedepending on the local conditions - even conventionalthree-phase systems may be used on a small scale wherehigh-density pocket load areas are present. Economicswill govern the decision-making process.Table 12.1.3:DOMESTIC CLASSIFICATIONURBAN high density (HD)Medium density (MD)Low density (LD)RURALPlanning stepsHigh level preliminarytechnology selectionTECHNOLOGYii, iii, ii, iiii, ii, iii, iv, vThe following are the recommended steps for each ofthe selected technologies and their alternatives (testagainst a single representative sub-area to minimiseoptimisation time):1. Select the domestic load density classification fromTable 12.1.2.2. The expected ADMD of the community can bedetermined for the five- to seven-year initialinvestment period and the final ADMD for themaster plan using appropriate software and theinformation obtained from marketing surveys.3. Do a high-level preliminary technology selectionfrom Table 12.1.3. Various technologies wouldgenerally apply at this point.Grid electricity Chapter 12.15
GUIDELINES FOR <strong>HUMAN</strong> <strong>SETTLEMENT</strong> <strong>PLANNING</strong> <strong>AND</strong> DESIGN4. Each selected technology constitutes a range ofalternatives that must be tested to obtain theoptimum arrangement of that specific technology.Therefore, choose the various conductors andtransformer sizes to be evaluated to establishalternatives for each technology.5. Determine the maximum feeder distance(intermediate voltage feeder, LV feeder or serviceconnection, depending on the technology).6. Determine the maximum number of feeders foreach transformer size (intermediate voltagefeeders, LV feeders or service connections,depending on the service cables - e.g. 22/0,23 kV).7. Determine the total loss (kW) per configuration.8. Determine the maximum number of DSPs perconfiguration.9. Determine the cost for each configuration,including the cost of losses, plot these costs foreach technology and choose a few of the lowestcostoptions, keeping flexibility in mind for themasterplan.The various arrangements for each technology willproduce an economic comparison or trade-offbetween transformer sizes and cable size. A typicalresult using this method is illustrated in Figure12.1.2, which in this case produced an optimum LVfeeder length of approximately 6.5X m. The graphis non-linear because, in general, larger cable sizeswill be used for longer distances. The transformerand cable sizes that satisfy this minimum pointshould be used as the selected alternative for thetechnology.Cost/DSP (PU)4030201000X 2X 4X 6X 8X 10XMax LV distance (m)Cable cost/DSPTrfr cost/DSPTotal costFigure 12.1.2: Economic trade-off10. With the above information, identify thetransformer supply areas from the layout for thechosen options, while maintaining flexibility forphased implementation.11. Route the maximum number of LV feeders fromthe transformer positions, considering theinformation obtained from Step 6 for each option.12. Calculate the voltage drop in a few typical andworst-case transformer supply areas. Change thefeeder routes or lengths, if necessary, to meetvoltage drop and conductor thermal constraints.13. Complete the various design layouts to generate abill of structures.14. Use standard material costs to determine themasterplan cost and add the cost of losses using theguidelines in NRS 034-1.15. Select the phased upgrade plan that defers thelargest amount of the five- to seven-year capitalcost, but will enable easy and inexpensiveupgrading when the load materialises.16. Life-cycle loss modelling forms an essential part ofoptimisation. It is therefore important that asimplified electrical layout model be subjected to losscalculations, to ensure optimal system loading. Doan energy-loss calculation, using appropriatesoftware, and ensure close to equal load vs no-loadtransformer losses.Area load densitiesIt is necessary to determine the load densities inkW/km 2 for the area under consideration. This valuecan be used to help with the preliminary selection oftechnology and sizing of transformers.The first step is to determine the total load for thearea by multiplying the final ADMD by the totalnumber of DSPs.Area load = ADMD x DSPs (kW)Second, determine the total area to be supplied,excluding open spaces such as parks etc (in km 2 ).Example:ADMD = 1,2 kVA, DSPs = 1 500, Area = 1 km 2Total load = 1,2 x 1 500 = 1 800 kWLoad density = 1 800 kW/km 2Transformer supply areasA maximum LV distributor length can be calculatedusing the stand size and ADMD. The area to be servedby a single transformer is roughly described by a circlewith radius equal to the distributor length.Transformer supply area = π R 2If R = 300 m then trfr. sup. area = 0,28 km 2For a load density of 1 800 kW/km 26Chapter 12.1Grid electricity
GUIDELINES FOR <strong>HUMAN</strong> <strong>SETTLEMENT</strong> <strong>PLANNING</strong> <strong>AND</strong> DESIGNTransformer load = 0,28 x 1 800 = 500 kWA suitably rated transformer, taking account of itsoverload capability and the cyclic nature of the load,can be selected from the preferred sizes in the relevantspecification (SABS 780:1979). For this example atransformer rated at 315 kVA would typically besuitable.Master plan layoutThe planner may start by drawing transformer supplycircles on a site plan of the area. These circles haveradii equal to the maximum LV distance that isallowed. Some overlap in the circles will naturallyoccur. Transformers may be positioned approximatelyin the centre of the circles. The entire LV layout can beestablished by working systematically from one end ofthe site to the other, making use of appropriatesoftware to simulate voltage drop in the conductors.MV conductors may be modelled using load-flowsoftware.Practical considerationsAfter selecting the best technology option andarrangement for a particular settlement, the plannerneeds to do a complete electrical layout design andthe following practical considerations are useful:Initial layoutAs discussed earlier, the initial phase is usuallydetermined using the expected ADMD after sevenyears.Installing only every second transformer planned forthe master plan can reduce the number oftransformers installed. The worst-case LV layoutshould be modelled to ensure acceptable voltagecriteria, using the longer LV distributors (to thepositions of those transformers removed). Analternative approach is to have reduced cabledimensions or single-phase arrangements for theinitial layout, but then upgrading will be more costly.MV operating criteriaThe planner can determine the best MV systemoperation by specifying the location of normallyopen points, etc. MV voltage drop calculations areusually straightforward since, for the most part,only balanced three-phase alternatives areconsidered, with diversity allowed for as a scalingfactor in repeated calculations.for future masterplan loading conditions.Optimisation for urban applicationOptimisation studies carried out in the electricitysupply industry (ESI) used models that calculate, forhigh-density urban electrification application, thefollowing information for various technologies:• maximum distance per feeder;• number of feeders to be supplied from atransformer;• maximum transformer load;• maximum number of consumers in transformerzone; and• system losses.From these results the total costs of all theconfigurations were determined and compared.It was found that a three-phase LV design is optimalfor high-density urban environments.For stand sizes below 400 m 2 , the use of three-phase LV315 kVA transformers and a 35 mm 2 aerial bundledconductor (ABC) was in general the most cost-effective.For stand sizes between 400 m 2 and 1 000 m 2 the use ofthree-phase LV 200 kVA transformers and 70 mm 2 ABCwas the most cost-effective alternative. In a mediumdensity urban environment the best three-phase LValternative was also found to be a 200 kVA transformerand 70 mm 2 ABC combination.Single-phase LV and centre-tap LV designs were notonly more expensive for this application, but exhibitedthe following disadvantages:• limited reach;• low efficiency;• the centre-tap LV system will have imbalances inthe primary system, although the secondary systemis balanced; and• the centre-tap LV transformer can only be loadedto 86% of its capacity.Nevertheless, single-phase, dual-phase and SWERsystems may often be more cost-effective alternativesfor rural/low density applications.It is important not to under-design the MVnetwork, since this could be costly to replace at afuture date. Use the maximum MV/LV transformerloads as point loads and do not diversify further.This will ensure sufficient MV line capacity to caterGrid electricity Chapter 12.17
GUIDELINES FOR <strong>HUMAN</strong> <strong>SETTLEMENT</strong> <strong>PLANNING</strong> <strong>AND</strong> DESIGNAreas of cost savingAlthough every system might potentially benefit frombeing uniquely designed, there is often a penalty inboth design cost and time, and the cost of using nonstandarditems. Given resource constraints, the use ofa limited selection of preferred sizes of standardiseditems should lead to overall cost savings. Most of theitems that are used in electrification projects are thesubject of NRS specifications that specify preferredsizes/types/ratings as agreed by electricity suppliers,through the Electricity Suppliers Liaison Committee(see Appendix A).Practical examples:• Depending on the ADMD, a first-time capitalcost saving of between 5% and 25% can beachieved using 315 kVA transformers and35 mm 2 ABC compared to designs using 100kVA transformers and 35 mm 2 ABC.• In low and very low consumption areas the useof 4 mm 2 service conductor rather than 10 mm 2can result in further incremental savings.Pre-payment systemsIt was evident from the studies that the electricitydispenser (ED) and ready board (RB) are the twocomponents that have a significant influence onelectrification costs.A clear strategic direction for domestic metering needsto be developed to optimise business functionalityrequirements, technology standardisation, and cost,especially for rural areas.It is also clear that a phased-implementation approachwill result in considerable savings due to the initial costreduction and delay in capital expenditure.For low and very low consumption areas, analternative is the use of an “electricity control unit”(ECU) that combines the functions of a prepaymentmeter and a ready board into one housing. Typicallythis option will be suitable for consumers with amaximum supply requirement of 8 A.LV VOLTAGE DROP CALCULATIONSVoltage drop calculations seem straightforward andeasy until phenomena such as diversity betweenconsumer currents and unbalanced network loadingbecome important facts to consider.Recent research in South Africa has shown that thedeterministic method used to calculate voltage drop,which was derived empirically and adapted frommethods used in the UK, frequently overestimated theconsumption and did not take account of allinfluencing factors. It also assumed a Gaussiandistribution of customer loads, and the research hasshown that the distributions are skewed, being bettermodelled as beta distributions.Recommended method for voltage dropcalculationHerman beta methodologyThe technique described in the second edition(1997) of NRS 034-1 takes account of importantresearch that gave rise to the Herman betamethodology, which takes account of the statisticalnature of residential loads and is sensitive to allinfluencing parameters. This is the recommendedmethod for voltage drop calculations. It is intendedthat the factors applied will be reviewed and - ifnecessary - amended, as additional information isderived using data from the NRS load researchproject (see the section on “consumptionclassification” above).Alternative method for voltage dropcalculationMonte Carlo simulationA full Monte Carlo simulation implementationprocedure can be used to simulate the actualnetwork behaviour during peak periods. It isnecessary to model the consumer loadcharacteristics around domestic peak consumptionperiods to provide a load model for the simulationsoftware.However, the method is generally impractical foruse in electrification project design, as it is timeconsumingowing to the large number ofsimulations required. Its use is normally confined toapplications in research.Two methods of allocating consumer loads may beused: direct measurement of consumer currentsand the use of statistical distribution functions.Measurement of consumer currentsMetering equipment can be installed at randomlyselected customer installations within a homogeneousgroup of customers. It is essential that the total grouphas the same classification to ensure similar energyusagebehaviour patterns. Current measurements ateach installation, averaged over five-minute intervals,provide adequate resolution to capture the dynamicbehaviour of individual customer currents.Summation of all the customers’ currents will producea diversified profile over the selected measurementperiod. The peak day and peak five-minute period can8Chapter 12.1Grid electricity
GUIDELINES FOR <strong>HUMAN</strong> <strong>SETTLEMENT</strong> <strong>PLANNING</strong> <strong>AND</strong> DESIGNthen be selected. This summated current, divided bythe number of DSPs gives a diversified maximumcurrent per DSP. A kW value for ADMD is used, whichis simply:ADMD = I x V nomwith I the ADMD current value at time of peak, andV nom the nominal LV phase voltage = 230 V.SERVICE CABLE CONNECTIONSTRATEGIESService cable phase connections may have variousconfigurations, and decisions regarding how manyphases to take from each node or pole and how toarrange subsequent connections to minimise voltagedrop must be made. One of the largest contributingfactors to voltage drop in LV networks is the presenceof neutral currents due to unbalanced loadingconditions. Not much can be done about thebehaviour of consumers and technical imbalanceminimisation techniques must be provided.Oscillating vs non-oscillating connectionsIt can be shown that an oscillating phase connectionstrategy is the best solution. The following explainsthe application of oscillating and non-oscillating phaseconnections. All examples use four service connectionsper node (pole or kiosk).One phase per nodePlanners often design electrification projects tocater for single-phase service cable take-off pointsvia pole-top boxes or the equivalent. This is thesimplest method of servicing individualhouseholds.One phase per node, non-oscillating (RWB-RWB):NODE RED WHITE BLUE1 4 0 02 0 4 03 0 0 44 4 0 05 0 4 06 0 0 4One phase per node, oscillating (RWB-BWR):NODE RED WHITE BLUE1 4 0 02 0 4 03 0 0 44 0 0 45 0 4 06 4 0 0This connection strategy results in much improvedbalanced loading conditions and a significantreduction in neutral voltage drop.Two phases per nodeOscillating phase connection taking two phases outper node produces the following connectionarrangement:RR-WWBB-BBWW-RRRR-WWBB-BBWW-RR, etc.Three phases per nodeOscillating phase connection taking three phasesout per node produces the following connectionarrangement:RWBBWRRWBBWRRWBBWRRWBBWR, etc.NODE RED WHITE BLUE1 1 1 22 2 2 03 1 1 24 1 1 25 2 2 06 1 1 2Using three phases per node decreases the voltagedropped as a result of the unbalanced condition by 10-20% over the two-phase per node case. Owing to thisrelatively small difference it is recommended that twophases be taken out per node and, in addition, thatthe oscillating phase connection strategy be used.Grid electricity Chapter 12.19
GUIDELINES FOR <strong>HUMAN</strong> <strong>SETTLEMENT</strong> <strong>PLANNING</strong> <strong>AND</strong> DESIGNAREA LOSS MODELPlanning proposals should include a full technical lossmodel with analysis results using forecasted energyusagepatterns and associated expected demands. Lossmanagement should be incorporated as a basicrequirement for all implemented electrificationprojects.DOCUMENTATION REQUIREMENTSElectrification projects should have a minimum set ofdocuments, which include a planning proposal withthe following:• Maps of the area.• List of evaluated technology options withtechnology cost comparisons as described in thisdocument.• Master plan layout and assumptions.• Phased-implementation plan.• MV loadflow calculation results showing systemloading, losses and high/low voltages.• MV/LV transformer and LV distributor plus serviceconnection voltage-drop calculation results, usingvoltage profiles, LV distributor and MV/LVtransformer loading. Results must include themaster plan and the phased-implementation planresults.• Loss evaluation of the system.• Complete consultants brief if applicable.See also Table 12.1.4.10Chapter 12.1Grid electricity
GUIDELINES FOR <strong>HUMAN</strong> <strong>SETTLEMENT</strong> <strong>PLANNING</strong> <strong>AND</strong> DESIGNTable 12.1.4:Summary of documentation required and examplesMINIMUM INFORMATIONEXAMPLE1. MASTER <strong>PLANNING</strong>1.1 Geographical load forecast1.1.1 Domestic final energy consumption ( kWh/month) 480 kWh/ month per consumer1.1.2 Domestic final ADMD (kVA) 2,7 kVA1.1.3 Domestic load factor (% for 1 000 consumers) 25%1.1.4 Final number of households 7 0001.1.5 Bulk loads and notified max demand (no and kW) 2 x 130 kVA and 6 x 70 kVA and 13 x 18 kVA1.1.6 Bulk loads contributions to peak (no and kW) 2 x 70 kVA and 6 x 20 kVA and 13 x 6 kVA1.1.7 Electrification area bulk supply demand (kW) 20 600 kW ( assumed 7% peak demand losses)1.1.8 Electrification area supply energy (kWh) 3 700 000 kWh/month (estimated)1.1.9 Electrification size (km 2 ) 4,7 km 21.1.10 Average domestic sand size (m 2 ) 400 m 21.1.11 Load density of total area (kVA/km 2 ) 4 1001.1.12 Load density of pocketed areas (kVA/km 2 ) 4 100 (no pocket loads in urban areas)1.2 Optimised technology selectionTechnology typeGeneral LV conductor choice (ABC 35 etc.)Average LV conductor lengthMax LV conductor length (m)Generally used transformer (kVA)Reason for choiceConventional MV/LV35 mm 2 ABC220 m100/160 kVA ANSI CSPMost economical for high density urbanapplication1.3 Optimised voltage drop allocationRegulated % MV voltage during peak 103,5%% MV voltage at MV/LV transformer at peak 101% (lowest MV voltage)2. PHASED-IMPLEMENTATION PLAN(in 5 to 7 years’ time)2.1 Domestic energy consumption ( kWh/month) 260 kWh/month per consumer2.2 Domestic ADMD (kVA) 1,8 kVA2.3 Domestic load factor (% for 1 000 consumers ) 20%2.4 Number of households connected 4 0002.5 Bulk loads and notified max demand (no and kW) 1 x 130 kVA and 2 x 70 kVA and 9 x 18 kVA2.6 Bulk loads contributions to peak (no and kW) 1 x 40 kVA and 2 x 10 kVA and 9 x 4 kVA2.7 Electrification area bulk supply demand (kW) 7 700 kW ( assumed 5% peak demand losses)2.8 Electrification area supply energy (kWh) 1 100 000 kWh/month (estimated)2.9 Electrification size (km 2 ) 3,3 km 22.10 Load density of total area (kVA/km 2 ) 2 2002.11 Load density of pocketed areas (kVA/km 2 ) 2 200 (no pocket loads)FINANCIAL CALCULATIONSRefer to NRS 034 part 1 for details on financialcalculation methods.Grid electricity Chapter 12.111
GUIDELINES FOR <strong>HUMAN</strong> <strong>SETTLEMENT</strong> <strong>PLANNING</strong> <strong>AND</strong> DESIGNAPPENDIX AREFERENCE ST<strong>AND</strong>ARDS, SPECIFICATIONS <strong>AND</strong> GUIDELINESA.1 The NRS rationalised user specificationsThe NRS specifications for application in the electricity supply industry are approved for use by the ElectricitySuppliers Liaison Committee which comprises, inter alia, representation from the Association of MunicipalElectricity Undertakings (AMEU) and Eskom. The committee provides considered choices of planning techniques,codes of practice, recommended practices and preferred equipment, as well as material types, sizes, and ratings,the widespread use of which should lead to overall cost benefits in the electrification drive.NRSTITLE002:1990 Graphical symbols for electrical diagramsAmendment 1 - Index, architectural and reticulation symbols003-1:1994 Metal-clad switchgear, Part 1: 1 kV to 24 kV - Requirements for application in the ESI003-2:1993 Part 2: Standardised panels004:1991 Mini-substations, Part 1: up to 12 kV - Requirements for application in the ESI005:1990 Distribution transformers: Preferred requirements for application in the ESI006:1991 Switchgear - Metal-encl. ring main units, 1 kV to 24 kV008:1991 Enclosures for cable terminations in air - Clearances for 7,2 kV to 36 kV009 Series Electricity sales systems009-2-2:1995 Part 2: Functional and performance requirements; Section 2: Credit dispensing units009-2-4:1997 Section 4: Standard token translatorPart 4: National electricity meter cards and associated numbering standards009-4-1:1995 Section 1: National electricity meter cards009-4-2:1993 Section 2: National electricity meter numbersPart 6: Interface standards; Section 1: Interface Credit Distribution Unit009-6-1:1996 (CDU) to Standard Token Translator (STT)013:1991 Electric power cables form 1 kV to 36 kV016:1995 Code of Practice for earthing of low-voltage distribution systems017 Series Single-phase cable for aerial service connectionsPart 1:1997Split concentric cablePart 2:1997Concentric cable018 Series Fittings and connectors for LV overhead powerlines using aerial bundled conductors018-1:1995 Part 1: Strain and suspension fittings for self-supporting conductors018-2:1995 Part 2: Strain and suspension fittings for insulated supporting conductors018-3:1995 Part 3: Strain and suspension fittings for bare supporting conductors018-4:1996 Part 4: Strain and suspension fittings for service cables018-5:1995 Part 5: Current-carrying connectors and joints12Chapter 12.1Grid electricity
GUIDELINES FOR <strong>HUMAN</strong> <strong>SETTLEMENT</strong> <strong>PLANNING</strong> <strong>AND</strong> DESIGNNRSTITLE020:1991 Aerial bundled conductor - Cable ties022:1996 Stays and associated components (second edition)025:1991 Photo-electric control units (PECUs) for lighting027:1994 Electricity distribution - Distribution transformers - Completely self-protecting type028:1993 Cable lugs and ferrules029:1993 Outdoor-type current transformer030:1993 Electromagnetic voltage transformers031:1993 Alternating current disconnectors and earthing switches (above 1 000 V)032:1993 Electricity distribution - Service distribution boxes - Pole-mounted (at 230 V)033:1996 Guidelines for the application design, planning and construction of MV woodenpole overhead power lines above 1 kV and up to and including 22 kV034 series Guidelines for the provision of electrical distribution networks in residential areas034-0:1998 Part 0:1998: Glossary of terms (in course of publication)034-1:1997 Part 1: Planning and design of distribution systems034-2-3:1997 Part 2-3: Preferred methods and materials for overhead lines034-3:1995 Part 3: O/h distribution in low and moderate consumption areas035:1994 Outdoor distribution cut-outs (drop-out fuses) - Pole-mounted type up to 22 kV036 series Auto-reclosers and sectionalisers - Pole-mounted types936-1:1994 Part 1: Programmable protection and remote control036-2:1997 Part 2: Auto-reclosers with programmable protection036-3:1997 Part 3: Sectionalisers038-1:1997 Concrete poles, Part 1: Concrete poles for o/h distribution and reticulation systems039:1995 Surge arresters - Application guide for distribution systems040-1:1995 HV operating regulations, Part 1: Definitions of terms040-2:1994 Part 2: Voltage colour coding040-3:1995 Part 3: Model regulations041:1995 Code of practice for overhead power lines for RSA042:1996 Guide for the protection of electronic equipment against damaging transientsGrid electricity Chapter 12.113
GUIDELINES FOR <strong>HUMAN</strong> <strong>SETTLEMENT</strong> <strong>PLANNING</strong> <strong>AND</strong> DESIGNNRSTITLE043:1997 Code of practice for the joint use of a pole route for power and telecommunication lines045:1997 Account card for electricity consumers046:1997 Pole-mounted load switch disconnectors048 series Quality of supply048-1:1996 Part 1: Overview of implementation of standards and procedures048-2:1996 Part 2: Minimum standards048-3:1998 Part 3: Procedures for measurement and reportingA.2 SABS standardsThe following South African Bureau of Standards documents may assist in the planning, design and constructionof electrical networks in residential areas.SABS ST<strong>AND</strong>ARDTITLE97:1991 Electric cables - Impregnated-paper-insulated metal-sheathed cables for rated voltagesfrom 3,3/3,3 kV up to 19/33 kV152:1997 Low-voltage air-break switches, air-break disconnectors, air-break switch-disconnectors,and fuse-combination units156:1977 Moulded-case circuit-breakers171:1986 Surge arresters for low-voltage distribution systems172:1994 Low-voltage fuses177 (in 3 parts) Insulators for overhead lines of nominal voltage exceeding 1 000 V178:1970 Non-current-carrying line fittings for overhead power lines753:1994 Pine poles, cross-arms and spacers for power distribution and telephone systems754:1994 Eucalyptus poles, cross-arms and spacers for power distribution and telephone systems780:1998 Distribution transformers1029:1975 Miniature substations1030:1975 Standard longitudinal miniature substations of ratings not exceeding 315 kVA1180 (in 3 parts) Electrical distribution boards1268:1979 Polymeric or rubber-insulated, combined neutral/earth (CNE) cables with solid aluminiumphase conductors and a concentric copper wire waveform combined neutral/earthconductor14Chapter 12.1Grid electricity
GUIDELINES FOR <strong>HUMAN</strong> <strong>SETTLEMENT</strong> <strong>PLANNING</strong> <strong>AND</strong> DESIGNSABS ST<strong>AND</strong>ARDTITLE1339:1992 Electric cables - Cross-linked polyethylene (XLPE)-insulated cables for voltages from3,8/6,6 kV to 19/33 kV1411 Materials of insulated electric cables and flexible cords1418 (in 2 parts) Aerial bundled conductor systems1473 Low-voltage switchgear and controlgear assemblies1507:1990 Electric cables with extruded solid dielectric insulation for fixed installations (300/500 V to1 900/3 300 V)1608:1994 Portable earthing gear for busbar systems and overhead lines1619:1995 Small power distribution units (ready boards) for single-phase 230 V service connectionsIEC 60076 (in 5 parts)Power transformersIEC 60099-1:1991Surge arresters Part 1: Non-linear resistor type gapped surge arresters for AC systemsIEC 60099-4:1991Surge arresters Part 4: Metal-oxide surge arresters without gaps for AC systemsIEC 60129:1984Alternating current disconnectors and earthing switchesIEC 60265-1High-voltage switches Part 1: High-voltage switches for rated voltages above 1 kV andless than 52 kVIEC 60269-1 (in 6parts and sections)Low-voltage fusesIEC 60282-1:1994High-voltage fuses Part 1: Current-limiting fusesGrid electricity Chapter 12.115
GUIDELINES FOR <strong>HUMAN</strong> <strong>SETTLEMENT</strong> <strong>PLANNING</strong> <strong>AND</strong> DESIGN16Chapter 12.1Grid electricity
Chapter 12.2Other forms of energy12.2
GUIDELINES FOR <strong>HUMAN</strong> <strong>SETTLEMENT</strong> <strong>PLANNING</strong> <strong>AND</strong> DESIGNTABLE OF CONTENTSSCOPE . . . . . . . . . . . . . . . . . . . . . . . . . . . . . . . . . . . . . . . . . . . . . . . . . . . . . . . . . . . . . . . . . . . . . . . . . . . 1INTRODUCTION. . . . . . . . . . . . . . . . . . . . . . . . . . . . . . . . . . . . . . . . . . . . . . . . . . . . . . . . . . . . . . . . . . . . 1<strong>PLANNING</strong> CONSIDERATIONS . . . . . . . . . . . . . . . . . . . . . . . . . . . . . . . . . . . . . . . . . . . . . . . . . . . . . . . . . 1ENERGY CONDITIONS IN SOUTH AFRICA . . . . . . . . . . . . . . . . . . . . . . . . . . . . . . . . . . . . . . . . . . . . . . . . 2Energy consumption patterns in South Africa . . . . . . . . . . . . . . . . . . . . . . . . . . . . . . . . . . . . . . . . . . . . 2Comparative energy costs. . . . . . . . . . . . . . . . . . . . . . . . . . . . . . . . . . . . . . . . . . . . . . . . . . . . . . . . . . . . 2THE DISTRIBUTION OF RENEWABLE ENERGY RESOURCES IN SOUTH AFRICA . . . . . . . . . . . . . . . . . . . . 4Solar energy resources . . . . . . . . . . . . . . . . . . . . . . . . . . . . . . . . . . . . . . . . . . . . . . . . . . . . . . . . . . . . . . 4Wind energy resources . . . . . . . . . . . . . . . . . . . . . . . . . . . . . . . . . . . . . . . . . . . . . . . . . . . . . . . . . . . . . . 5Hydropower resources . . . . . . . . . . . . . . . . . . . . . . . . . . . . . . . . . . . . . . . . . . . . . . . . . . . . . . . . . . . . . . 5ENERGY-EFFICIENT BUILDING DESIGN . . . . . . . . . . . . . . . . . . . . . . . . . . . . . . . . . . . . . . . . . . . . . . . . . . 5Benefits of energy-efficient buildings . . . . . . . . . . . . . . . . . . . . . . . . . . . . . . . . . . . . . . . . . . . . . . . . . . 5Guidelines for energy-conscious design . . . . . . . . . . . . . . . . . . . . . . . . . . . . . . . . . . . . . . . . . . . . . . . . . 6Principal elements in managing indoor environments. . . . . . . . . . . . . . . . . . . . . . . . . . . . . . . . . . . . . . 6Economics and implementation . . . . . . . . . . . . . . . . . . . . . . . . . . . . . . . . . . . . . . . . . . . . . . . . . . . . . . 10HYDROCARBON FUELS . . . . . . . . . . . . . . . . . . . . . . . . . . . . . . . . . . . . . . . . . . . . . . . . . . . . . . . . . . . . . 11Paraffin . . . . . . . . . . . . . . . . . . . . . . . . . . . . . . . . . . . . . . . . . . . . . . . . . . . . . . . . . . . . . . . . . . . . . . . . . 11Liquid petroleum gas (LPG) . . . . . . . . . . . . . . . . . . . . . . . . . . . . . . . . . . . . . . . . . . . . . . . . . . . . . . . . . 12Coal. . . . . . . . . . . . . . . . . . . . . . . . . . . . . . . . . . . . . . . . . . . . . . . . . . . . . . . . . . . . . . . . . . . . . . . . . . . . 14Biomass . . . . . . . . . . . . . . . . . . . . . . . . . . . . . . . . . . . . . . . . . . . . . . . . . . . . . . . . . . . . . . . . . . . . . . . . . 16Town gas. . . . . . . . . . . . . . . . . . . . . . . . . . . . . . . . . . . . . . . . . . . . . . . . . . . . . . . . . . . . . . . . . . . . . . . . 17SOLAR ENERGY APPLICATIONS IN SOUTH AFRICA . . . . . . . . . . . . . . . . . . . . . . . . . . . . . . . . . . . . . . . . 17Solar photovoltaic electricity supply. . . . . . . . . . . . . . . . . . . . . . . . . . . . . . . . . . . . . . . . . . . . . . . . . . . 17Solar water pumping . . . . . . . . . . . . . . . . . . . . . . . . . . . . . . . . . . . . . . . . . . . . . . . . . . . . . . . . . . . . . . 23Solar water heating . . . . . . . . . . . . . . . . . . . . . . . . . . . . . . . . . . . . . . . . . . . . . . . . . . . . . . . . . . . . . . . 25Other solar energy applications in South Africa. . . . . . . . . . . . . . . . . . . . . . . . . . . . . . . . . . . . . . . . . . 31OTHER RENEWABLE ENERGY SOURCES . . . . . . . . . . . . . . . . . . . . . . . . . . . . . . . . . . . . . . . . . . . . . . . . 31Wind power . . . . . . . . . . . . . . . . . . . . . . . . . . . . . . . . . . . . . . . . . . . . . . . . . . . . . . . . . . . . . . . . . . . . . 31Other forms of energy Chapter 12.2i
GUIDELINES FOR <strong>HUMAN</strong> <strong>SETTLEMENT</strong> <strong>PLANNING</strong> <strong>AND</strong> DESIGNSmall hydropower. . . . . . . . . . . . . . . . . . . . . . . . . . . . . . . . . . . . . . . . . . . . . . . . . . . . . . . . . . . . . . . . . 35BIOGAS <strong>AND</strong> L<strong>AND</strong>FILLS . . . . . . . . . . . . . . . . . . . . . . . . . . . . . . . . . . . . . . . . . . . . . . . . . . . . . . . . . . . . 38Solar-thermal electricity generation . . . . . . . . . . . . . . . . . . . . . . . . . . . . . . . . . . . . . . . . . . . . . . . . . . . 38BIBLIOGRAPHY . . . . . . . . . . . . . . . . . . . . . . . . . . . . . . . . . . . . . . . . . . . . . . . . . . . . . . . . . . . . . . . . . . . 40iiChapter 12.2Other forms of energy
GUIDELINES FOR <strong>HUMAN</strong> <strong>SETTLEMENT</strong> <strong>PLANNING</strong> <strong>AND</strong> DESIGNLIST OF TABLESTable 12.2.1Comparative consumer costs of different fuels for domestic cooking and heating(1997 prices) . . . . . . . . . . . . . . . . . . . . . . . . . . . . . . . . . . . . . . . . . . . . . . . . . . . . . . . . . . . . . . . . .3Table 12.2.2 Comparative energy costs for 1 000 lumen-hours of lighting . . . . . . . . . . . . . . . . . . . . . . . . . . .3Table 12.2.3 Solar irradiation values, from long-term measurements . . . . . . . . . . . . . . . . . . . . . . . . . . . . . . .4Table 12.2.4 Solar irradiation on vertical north-facing surfaces . . . . . . . . . . . . . . . . . . . . . . . . . . . . . . . . . . .4Table 12.2.5 Standardised sizes of gas cylinders . . . . . . . . . . . . . . . . . . . . . . . . . . . . . . . . . . . . . . . . . . . . . .13Table 12.2.6 Typical PV applications and associated capital costs . . . . . . . . . . . . . . . . . . . . . . . . . . . . . . . . .19Table 12.2.7 Criteria for grid versus off-grid electrification . . . . . . . . . . . . . . . . . . . . . . . . . . . . . . . . . . . . . .21Table 12.2.8 Comparative characteristics of different community water pumping options . . . . . . . . . . . . .24Table 12.2.9Typical initial costs and associated operating costs for different pumping systems(in 1997 rands) . . . . . . . . . . . . . . . . . . . . . . . . . . . . . . . . . . . . . . . . . . . . . . . . . . . . . . . . . . . . . .24Table 12.2.10 Typical pumping costs for solar pumps, based on 15-year life-cycle costs . . . . . . . . . . . . . . . . .25Table 12.2.11 Estimated solar water-heater capacity installed in South Africa . . . . . . . . . . . . . . . . . . . . . . . .27Table 12.2.12 Comparative water-heating costs . . . . . . . . . . . . . . . . . . . . . . . . . . . . . . . . . . . . . . . . . . . . . . .27Table 12.2.13 Typical hot water requirements for domestic and institutional purposes . . . . . . . . . . . . . . . . .30Table 12.2.14 Guidelines for sizing domestic SWH systems . . . . . . . . . . . . . . . . . . . . . . . . . . . . . . . . . . . . . . .30Table 12.2.15 Maximum wind-power flux (Wm -2 ) for different wind speeds . . . . . . . . . . . . . . . . . . . . . . . . .32Table 12.2.16 Examples of micro-hydropower capital cost proportions . . . . . . . . . . . . . . . . . . . . . . . . . . . . .37Table 12.2.17Typical supply costs of micro-hydroelectric power (1992 estimates, excludingreticulation) . . . . . . . . . . . . . . . . . . . . . . . . . . . . . . . . . . . . . . . . . . . . . . . . . . . . . . . . . . . . . . . .37Other forms of energy Chapter 12.2iii
GUIDELINES FOR <strong>HUMAN</strong> <strong>SETTLEMENT</strong> <strong>PLANNING</strong> <strong>AND</strong> DESIGNLIST OF FIGURESFigure 12.2.1Figure 12.2.2Percentage of households using different energy carriers, in four metropolitanareas . . . . . . . . . . . . . . . . . . . . . . . . . . . . . . . . . . . . . . . . . . . . . . . . . . . . . . . . . . . . . . . . . . . . . .2Annual mean solar irradiation on a horizontal surface (in Wh per square metreper day) . . . . . . . . . . . . . . . . . . . . . . . . . . . . . . . . . . . . . . . . . . . . . . . . . . . . . . . . . . . . . . . . . . . .4Figure 12.2.3 Annual mean wind speeds (normalised to 10 m height above ground, in ms -1 ) . . . . . . . . . . . .5Figure 12.2.4 Principal energy flows in a home . . . . . . . . . . . . . . . . . . . . . . . . . . . . . . . . . . . . . . . . . . . . . . . .7Figure 12.2.5 Shadow angles for north-facing windows . . . . . . . . . . . . . . . . . . . . . . . . . . . . . . . . . . . . . . . . . .8Figure 12.2.6 Principal components of a stand-alone photovoltaic system . . . . . . . . . . . . . . . . . . . . . . . . . .18Figure 12.2.7 Comparative unit energy costs for single installations (1997 rands) . . . . . . . . . . . . . . . . . . . . .19Figure 12.2.8 Volume and head relationship for the pumping criterion of 2 000 m 4 /day . . . . . . . . . . . . . . .24Figure 12.2.9 Operating principles of solar water-pumping systems . . . . . . . . . . . . . . . . . . . . . . . . . . . . . . .25Figure 12.2.10 Three typical configurations for solar water-pumping systems . . . . . . . . . . . . . . . . . . . . . . . . .26Figure 12.2.11Cumulative costs and payback characteristics of SWH, electrical storage heatersand instantaneous water heaters . . . . . . . . . . . . . . . . . . . . . . . . . . . . . . . . . . . . . . . . . . . . . . .28Figure 12.2.12 Integral solar water-heating system . . . . . . . . . . . . . . . . . . . . . . . . . . . . . . . . . . . . . . . . . . . . .29Figure 12.2.13 A close-coupled solar water-heating system . . . . . . . . . . . . . . . . . . . . . . . . . . . . . . . . . . . . . . .29Figure 12.2.14 A split collector/storage solar water-heating system . . . . . . . . . . . . . . . . . . . . . . . . . . . . . . . . .30Figure 12.2.15 Schematic of typical micro-hydropower layout . . . . . . . . . . . . . . . . . . . . . . . . . . . . . . . . . . . . .36Figure 12.2.16 Approximate net electrical power as a function of flow rates and gross head . . . . . . . . . . . .36ivChapter 12.2Other forms of energy
GUIDELINES FOR <strong>HUMAN</strong> <strong>SETTLEMENT</strong> <strong>PLANNING</strong> <strong>AND</strong> DESIGNSCOPEThis section is intended to provide engineers,settlement planners and developers with informationabout energy sources and applications other than gridelectricity. The scope of application includes bothurban and rural settlements.Important energy sources and applications in thiscontext include• energy efficient building design;• the supply and use of hydrocarbon fuels (paraffin,LPG, coal, wood); and• solar energy applications (in particular, solar waterheating and the use of solar photovoltaic systemsfor off-grid electricity supply).Guidelines are provided on the costs, applications,environmental and safety aspects, and relevantplanning considerations associated with these energysources and technologies.Background information and references are alsoprovided for other renewable energy technologieswhich are less widely used in South Africa, but whichmight be considered by planners in specificcircumstances: wind turbines for electricitygeneration, small-scale hydropower, biogas digesters,extraction of landfill gas and solar-thermal electricitygeneration.Some of the practices addressed in this section are stillunder development in South Africa and not yet wellstandardised. These topics are therefore addressed ina more descriptive and lengthy way. Improved conciseguidelines should be possible in future revisions, as thepractices become more widely established.INTRODUCTIONThe supply of grid electricity is the foremost energyinfrastructure concern for planners, engineers anddevelopers in South African urban settlements.However, in lower-income urban communities - whichinclude the majority of South Africa’s urbanpopulation - grid electricity is only one part of energysupply and use. In practice, low-income householdscontinue to use a variety of other energy sources, evenwhen grid electricity is available. It is therefore usefulfor planners to consider these wider energy needs.decentralised “off-grid” sources of electricity may bepreferable. These are nearly always more costly thana normal urban electricity supply, but nonetheless maybe cheaper than grid extension and reticulation overlong distances with low load densities. Again,electricity is only a part of the energy supply/useequation in such areas, and other fuel use must also betaken into account.A third reason for examining energy alternatives arisesfrom environmental concerns. Global environmentalconcerns about reducing pollution and greenhousegas emissions have led to a greater awareness of thebenefits of energy conservation and energy efficiency,as well as to a preference for using renewable energysources where possible rather than fossil fuels whichpollute the environment. Local environmental issuesinclude serious concerns about• the impact of smoky local indoor/outdoorenvironments on health;• fires;• contamination and poisoning; and• land degradation caused by pollution from powerstations and the over-exploitation of naturalvegetation for energy purposes.<strong>PLANNING</strong> CONSIDERATIONSMost of the energy sources and applications treated inthis section do not involve the provision of extensivephysical infrastructure within settlements. Many ofthem involve economic and behavioural choices byindividual consumers or households. Physical planningissues do arise, but other important consumer-orientedconsiderations include• mechanisms to encourage the integration ofthermally efficient design in low-cost housingdevelopments;• suitable distribution channels for commercial fuels,energy-related equipment, and appliances;• finance and repayment mechanisms;• social planning, consultation, education andawareness-building; and• the application of technical, safety andenvironmental standards.A second reason for considering energy alternatives togrid electricity is that, in dispersed or remotesettlements (generally rural), grid electrification canbe highly uneconomical. In this situation,Relevant planning issues will be noted in each of thesub-sections below. In general, the following broadrecommendations could be considered by planners:Other forms of energy Chapter 12.21
GUIDELINES FOR <strong>HUMAN</strong> <strong>SETTLEMENT</strong> <strong>PLANNING</strong> <strong>AND</strong> DESIGN• Understand local energy needs, consumptionpatterns and supply options.• Recognise that electricity does not address all theenergy needs of lower-income communities, andmake provision for the optimal use of other energysources.• Ensure consumers are able to make well-informedchoices about their energy options, throughawareness and education campaigns. Includeinformation about costs, health and safety.• In physical planning, take account of theorientation and spacing of buildings for good useof passive solar design principles (alongside otherfactors affecting layout choices, such as security,variety, etc).similar developing countries would progressivelyswitch from traditional fuels (e.g. wood) throughtransitional fuels (e.g. paraffin), then towards thepartial use of electricity and finally to almost completereliance on electricity. This may turn out to be a validlong-term trend, but in the medium term fuelswitchingoccurs in both directions, depending largelyon economic circumstances and changes in prices.Multiple fuel use is likely to continue to be the normfor lower-income households in South Africa, bothurban and rural, electrified and non-electrified.The proportions of different fuels used tends to vary indifferent parts of the country, reflecting climaticdifferences (e.g. cold winters in the interior highveld)and local differences in prices (e.g. cheap coal inproximity to coalfields). Figure 12.2.1 illustrates thisvariation for households in four metropolitan centres.• Promote the energy-efficient and cost-savingdesign of buildings.• Take account of the environmental impacts ofdifferent energy options.ENERGY CONDITIONS IN SOUTHAFRICAThis section provides a brief overview of householdenergy consumption patterns in South Africa, the costsand availability of non-electric fuels and renewableenergy options, and the distribution of renewableenergy resources in South Africa.Energy consumption patterns in SouthAfricaOverall, the residential sector accounts forapproximately 20% of the energy consumption in SA.The percentage of households with access to gridelectricity stood at about 66% in 1997-98 and issteadily increasing. However, in lower-income newlyelectrified settlements the average levels of electricityconsumption per household are quite low - typically 50to 150 kWh/month in the first few years afterelectrification (Davis 1995).There are several reasons for this. Income constraintscan make it difficult to afford higher electricity bills,and also difficult to acquire the more expensiveenergy-intensive electric appliances, such as stoves.Such households may therefore continue usingexisting cheaper appliances (such as primus stoves),cheaper fuels (such as coal for heating in winter) andnon-commercial fuels like fuelwood and dung.Households without any electricity have, of course, torely on such non-electric fuels and appliances.“Fuel-switching” is a common phenomenon. It used tobe thought that households in Southern Africa andFigure 12.2.1: Percentage of households usingdifferent energy carriers, in four metropolitan areasNote: Percentages total more than 100 %, indicatingmultiple fuel use by households.Source: Williams 1993Rural households make extensive use of wood andother biomass (crop residues, dung, etc) for cookingand heating. However, the use of wood also occurs inurban and peri-urban settlements. When wood can becollected “free” - although often involvingconsiderable labour - it may be the most economicallyattractive or indeed the only energy option for lowincomehouseholds. However, wood is alsoincreasingly a commercial fuel, especially in areas offuelwood scarcity.Comparative energy costsIt is difficult to give accurate costs for the “useful”energy obtained from different fuel-appliancecombinations, because the efficiency of the energyutilisation can vary. Table 12.2.1 provides estimatedcomparative costs for (a) the energy content and (b)2Chapter 12.2Other forms of energy
GUIDELINES FOR <strong>HUMAN</strong> <strong>SETTLEMENT</strong> <strong>PLANNING</strong> <strong>AND</strong> DESIGNTable 12.2.1: Comparative consumer costs of different fuels for domestic cooking andheating (1997 prices)UNIT COST OF COST OF ENERGY ASSUMED COST OF USEFULFUEL CONTENT EFFICIENCY OF ENERGY(UNITS AS SHOWN) (CENTS/kWh) UTILISATION (CENTS/kWh)GAUTENG CAPE TOWN GAUTENG CAPE TOWN GAUTENG CAPE TOWNCOOKINGGrid 20 c/kWh 25 c/kWh 20 25 65% 31 38electricityCoal 26 c/kg 55 c/kg 4 8 15% 25 53Paraffin 220 c/litre 168 c/litre 21 16 35% 61 47LP gas 395 c/kg 321 c/kg 29 24 45% 64 52Wood 21 c/kg 45 c/kg 4 9 15% 28 60(commercial)COMBINED COOKING <strong>AND</strong> SPACE-HEAINGGrid 20 c/kWh 25 c/kWh 20 25 95% 21 26electricityCoal 26 c/kg 55 c/kg 4 8 45% 8 18WATER HEATINGGrid 20 c/kWh 25 c/kWh 20 25 70% 29 36electricityLP gas 395 c/kg 321 c/kg 29 24 90% 32 26Sources: Prices from Graham (1997). Efficiencies adapted from Fecher (1998), Gentles (1993), Lawrence et al (1993),Thorne 1995. Fuel prices can be higher from small traders and in rural areas.the useful energy derived from different fuels,assuming the efficiencies shown, and based on typical1997 prices for Gauteng and Cape Town.Thermal energy services (cooking, heating, cooling)consume the largest amounts of household energyand are therefore a major concern for householdchoices about which fuels and appliances to use. Asmentioned, the cost of the appliances themselves canbe a deciding factor as well.In general, poorer households spend a largerproportion of their income on energy services thanmore affluent households. They may also use lessefficient appliances and pay more for the fuels theyuse, for example, by buying fuels like paraffin in smallquantities. The use of candles for lighting iswidespread in non-electrified households, but also inlow-income electrified households. Householdswithout an electricity supply often spend a largeportion (e.g. one-third) of their overall energy budgetson dry-cell batteries for radios, etc (Hofmeyr 1994).For lighting and media appliances (radio, TV, etc)small solar photovoltaic systems can provide a costeffectivealternative to paraffin lamps, candles anddry-cell or rechargeable batteries. The capital cost ishigher, but life-cycle costs are lower for equivalentservices. Table 12.2.2 gives examples of comparativelighting costs (using 1992 relative prices) forequivalent lighting levels.Table 12.2.2: Comparative energy costsfor 1 000 lumen-hours oflightingCandles R2,50Paraffin lamp (wick) R0,40Pressurised paraffin lamp R0,10LP gas R0,20Solar home system R0,05Grid electricity R0,002Source: Cowan et al (1992)For more detailed comparisons of fuel and appliancecosts, variations in different parts of the country, lifecyclecosts of fuel-appliance combinations andcomparative costs of off-grid electricity options, seeEnergy & Development Group (1997), Graham (1997)and Cowan et al (1992).Other forms of energy Chapter 12.23
GUIDELINES FOR <strong>HUMAN</strong> <strong>SETTLEMENT</strong> <strong>PLANNING</strong> <strong>AND</strong> DESIGNTHE DISTRIBUTION OF RENEWABLEENERGY RESOURCES IN SOUTHAFRICASolar energy resourcesSolar energy is generally abundant in South Africa,with a daily average of between 4 500 Wh (Durban)and 6 400 Wh (Upington) per square metre per day.These are values for solar irradiation measured on ahorizontal surface (see Figure 12.2.2). For purposes ofcollecting solar energy, the solar collector is usuallytilted to receive more energy throughout the year.Table 12.2.3 includes solar irradiation values for tiltedsurfaces. For many solar energy applications, a fixedtiltangle is chosen which maximises the solarirradiation received during the “worst” solar month ofthe year, as shown in Table 12.2.3.Table 12.2.4: Solar irradiation on verticalnorth-facing surfacesMONTHLY MEAN IRRADIATION, IN Wh PER SQUAREMETRE PER DAYLocation Maximum month Minimum monthBloemfontein 6 115 (Jul) 2 045 (Dec)Cape Town 4 929 (Apr) 2 387 (Dec)Durban 4 972 (Jun) 1 837 (Dec)Pretoria 5 696 (Jun) 1 697 (Dec)Source: Cowan et al (1992)Solar radiation data for approximately 100 weatherstations, and detailed data for the ten major SouthAfrican measuring sites shown in Table 12.2.3, can beobtained in Eberhard (1990) and Cowan et al (1992);the latter source also includes software for calculatingsolar irradiation on north-facing tilted surfaces atdifferent times of year, hour by hour.For some purposes (e.g. in building design) it is usefulto know the solar irradiation on vertical surfaces.Examples are provided in Table 12.2.4. Monthly valuesfor all major weather stations are obtainable in Cowanet al (1992) and Eberhard (1990).Figure 12.2.2: Annual mean solar irradiation on ahorizontal surface (in Wh per square metre per day)Source: Eberhard (1990)Table 12.2.3: Solar irradiation values, from long-term measurementsMONTHLY MEAN SOLAR IRRADIATION, IN WH PER SQUARE METRE PER DAYLOCATIONON A HORIZONTAL SURFACE ON A TILTED SURFACE (SEE NOTE) TILT ANGLEBEST MONTH WORST MONTH BEST MONTH WORST MONTH (DEGREES)Alexander Bay 8 364 3 555 6 732 6 164 45Bloemfontein 8 096 3 747 7 031 6 318 35Cape Town 7 956 2 390 6 275 4 702 60Durban 5 740 3 033 5 488 4 759 35Grootfontein 8 238 3 403 6 917 6 278 45Nelspruit 6 045 3 919 5 765 5 108 20Port Elizabeth 7 216 2 655 5 856 5 260 50Pretoria 6 908 3 908 6 668 5 652 30Roodeplaat 6 963 3 884 6 552 5 896 30Upington 8 390 3 824 7 370 6 466 40Source: Cowan et al (1992)Note: A fixed north-facing tilt, in degrees from horizontal, which maximises solar irradiation for the worst monthof the year.4Chapter 12.2Other forms of energy
GUIDELINES FOR <strong>HUMAN</strong> <strong>SETTLEMENT</strong> <strong>PLANNING</strong> <strong>AND</strong> DESIGNWind energy resourcesWind-speed measurements for South Africa areavailable from a large number of measuring stationsacross the country. However, the majority areagricultural stations and these wind measurements(usually at a height of 2 m and often in shelteredlocations) are not always useful for judging windenergyresources. Wind speeds can vary greatly overshort distances in complex terrain. Wind-energypotential is highly sensitive to wind speeds, sincedoubling the wind speed increases the available powerby a factor of eight. Average wind speeds of 6 ms -1 ormore are favourable for electricity generation fromwind, and wind speeds below 4,5 ms -1 are usually notviable, except for water pumping. Figure 12.2.3provides an indication of wind-energy potential indifferent parts of South Africa. However, accurate sitespecificwind assessments are essential to establish theviability of wind generation in a particular location.The most comprehensive source of analysed winddata, including frequency distributions and monthlyvariations, is Diab (1995).> 5,0 to 5,5 ms -1 Gordons Bay> 5,5 to 6,0 ms -1 Buffeljagsbaai,Danger PointDie Gruis, Gansbaai> 6,0 to 6,5 m s-1 —> 6,5 to 7,0 ms -1 WaenhuiskransOther measurements of promising wind speeds, whicheither come from shorter periods of data or come fromstations which were excluded from Diab’s winddistribution statistics (and may not be fully reliable),are:> 6,0 to 6,5 ms -1 Bird Island, Klippepunt,Saldanha, Thyspunt> 6,5 to 7,0 ms -1 Cape Infanta, Hluhluwe> 7,0 to 7,5 ms-1 Cape Recife, Hangklip> 7,5 to 8,0 ms -1 Seal IslandHydropower resourcesHydro-power resources in South Africa are even moresite-specific than wind. In general, the eastern slopesof the country from the Drakensberg down to thecoast are more likely to offer the combination ofsufficient water flow and gradient usually needed forviable small-scale hydro-electric installations (see latersection on Small Hydropower).ENERGY-EFFICIENT BUILDING DESIGNEnergy-efficient building design can help to reduce:• excessive consumption of electricity or other fuelsto maintain comfortable working, leisure orsleeping spaces;Figure 12.2.3: Annual mean wind speeds (normalisedto 10 m height above ground, in ms -1 )Source: Adapted from Diab (1995)Diab (1995) presents wind distribution statistics for 79stations with hourly wind data. Of these, the followinghave wind data for at least two years, measured at aheight greater than 2 m, and show annual mean windspeeds greater than 4 ms -1 (normalised to 10 m aboveground level):> 4,0 to 4,5 ms -1 Alexander Bay, Beaufort West,Cape Town Airport,East London, Hermanus,Port Elizabeth, Stilbaai,Struisbaai, Vrede> 4,5 to 5,0 ms -1 Berg River, Wingfield• indoor/outdoor pollution; and• health risks from a polluted or thermallyuncomfortable environment.This section discusses principles of building design,layout and user behaviour which can save energy,reduce costs and contribute to improved livingenvironments. The focus is on information of interestto planners, designers, builders and buildingowners/occupants in residential areas.Benefits of energy-efficient buildingsThe energy consumption and expenditure required tomaintain a comfortable (or in some cases simplybearable) indoor environment can be very significant,across all classes of housing and commercial buildingOther forms of energy Chapter 12.25
GUIDELINES FOR <strong>HUMAN</strong> <strong>SETTLEMENT</strong> <strong>PLANNING</strong> <strong>AND</strong> DESIGNtypes. The potential for energy savings throughimproved energy-conscious building design can be asmuch as 70% in some cases. The “passive design” or“solar passive design” of buildings refers toconstruction/design techniques which• make better use of natural energy flows (e.g. solarheating in the day, cooling at night);• use building elements to insulate, capture, store orotherwise control energy flows; and• reduce the need for “active” energyconsumption/management.Such techniques can be low-cost, long-lasting andoffer the following potential benefits:• lower energy bills for owners/occupants (especiallyin winter, when the energy bills of poorerhouseholds can rise significantly);• reduced total electricity consumption - winterconsumption levels are about 1 600 GWh/monthhigher than summer (Eskom, 1996);• reduced electricity peak demand, associated with“cold snaps” (with resultant economic benefitsboth for electricity generation and the peaknational/local distribution capacity required);• less pollution (and lower health costs); and• generally, a more pleasant and healthyenvironment in the home or workplace.A particular South African health problem is respiratorydisease caused by use of coal and wood for indoorcooking and space-heating (Terblanche et al 1993; VanHoren et al 1996). This could be partially alleviated bythermally efficient building design in low-incomecommunities reliant on these fuels for heating.Guidelines for energy-conscious designFor specific climate zones and building types, it ispossible to state relatively concise guidelines.However, the field is complex, and as Holm (1996)warns, over-simplification can lead to inappropriateapplication.The approach adopted here is to discuss the principalelements of energy-conscious building design, and togive some indication of possible strategies. For moredetailed information, Holm and Viljoen (1996) andHolm (1996) are useful resources. There are alsonumerous international texts in this field.The Directorate: Settlement Policy of the Departmentof Housing (in association with other governmentdepartments) is in the process of drafting a set ofguidelines for “environmentally sound low-costhousing”.Principal elements in managing indoorenvironmentsOccupational comfort is related to temperature, airflow, lighting, humidity, the level of activity andclothing. The last two parameters are primarily underthe control of occupants, and thus not discussed here.The other parameters are often actively managed inlarge commercial buildings, and to a lesser or greaterextent in other buildings such as houses.Energy-efficient or “passive” building design aims toreduce the active use of energy, and to achievemoderate variations around comfortable meantemperature (and other) conditions, using moreeconomical means.Figure 12.2.4 illustrates a cross-section through tworooms in a house, to show the main energy flows andparameters that influence the indoor environment.Both the national electrification programme and thenational housing programme present importantdrivers for improved thermal efficiency in housing:• As the number of electrified houses increases,electric space-heating has an increasing impact onelectricity consumption and winter peak demand(which will lead to more peaked and expensivegeneration, transmission and distribution).• The national housing programme represents aunique opportunity to include low-cost thermalimprovements which will reduce energyconsumption for space-heating; if this opportunityis missed, it could result in long-term cost increasesfor residents, service providers and society at large(Simmonds 1997).6Chapter 12.2Other forms of energy
GUIDELINES FOR <strong>HUMAN</strong> <strong>SETTLEMENT</strong> <strong>PLANNING</strong> <strong>AND</strong> DESIGNthermal properties of common building materials arereadily available (Wentzel et al 1981; Everett 1970;Burberry 1983; Quick II 1998).Each of the principal building elements is discussedbelow, with attention given to opportunities forimprovement.RoofFigure 12.2.4: Principal energy flows in a homeImportant elements of the energy flow diagram are:• energy source elements - the sun shining throughwindows or heating external surfaces, humanactivity, appliances, heaters etc. in the home;• elements that remove energy from a home -cooler air either flowing through a house orcooling external walls and roof, dark sky acting asa radiation sink at night, an air conditioner; and• energy stores within a home - walls, floors, bodiesof water within the home which can either absorbheat energy (helping to keep space temperatureslower) or give energy out (helping to warm a space).Heat transfer is always from regions of highertemperature to regions of lower temperature. Threeheat-transfer mechanisms are important:• conduction through solid structures such as wallsand roofing materials, which is highly dependenton the composition and thickness of the material(e.g. the conductivity of steel is a thousand timesthe conductivity of insulators like glass-fibre quilt);• convective heat transfer, strongly related to airmovement (which is enhanced by ventilation, orreduced through the use of multiple barriers orsealed cavities, as in a cavity wall); and• radiation, proportional to the fourth power of theabsolute temperature (Kelvin), and thus highlysignificant at elevated temperatures. Absorption ofradiant energy also depends on the reflectivity ofsurfaces (highly polished surfaces and thosepainted with light colour paints are able to reflectmost solar radiation while dark, rougher surfacesmay absorb 95% or more).Most heat transfer processes (e.g. from the air inside aroom, through the wall to the outside) involve allthree mechanisms. Tables listing heat transfer andFifty to seventy percent of the heat loss from ahome in winter can be through an uninsulated roof(Simmonds 1997). Furthermore an uninsulated roofwill allow excessive heat gain during the day insummer. The addition of a ceiling can reduce spaceheatingenergy bills by more than half and, evenfor homes with ceilings, the proper use of ceilinginsulation can be a further cost-effectiveintervention in most climatic regions of SouthAfrica (Temm International 1997; Van Wyk andMathews 1996).The following points need to be considered:• Ceiling and insulation materials should bechosen with due consideration of other aspectsof the building. There is little sense in addingthick, high-quality insulation to the ceiling of adraughty, thin-walled home. Cardboard orother low-cost insulators will achieve most ofthe benefits, at a fraction of the cost.• Where buildings are otherwise thermallyefficient, proper installation of thickerinsulation with greater resistance to heattransfer is to be preferred.• A gap of at least a few centimetres should beallowed between the top of the ceiling and theroof, as this will increase the insulation of theentire structure significantly, and allowventilation.• Materials of high reflectance and low emissivity(e.g. reflective aluminium-foil products) canalso act as useful insulators, where radiationcauses significant heat loss or unwanted gain(as in roof spaces).• Where high thermal gradients occur acrossrelatively thin insulation (e.g. cardboardceilings) it is important to place a vapour barrieron the warm side of the insulation, to preventcondensation as warm, moist air comes intocontact with cold exterior surfaces. Plasticsheeting or reflective aluminium foil iseffective, if properly applied and sealed.• Light colours tend to reflect more light. Heatgain from a roof is difficult to control in summer,so it is sensible to paint roofs a light colour.Other forms of energy Chapter 12.27
GUIDELINES FOR <strong>HUMAN</strong> <strong>SETTLEMENT</strong> <strong>PLANNING</strong> <strong>AND</strong> DESIGNWindowsWindows can be significant sources of both heatgain and loss in a home. Thermal performance willdepend on size, orientation, shading, air tightness,material used for glazing, the use or absence ofmoveable insulation such as shutters or curtains,and on whether or not double glazing is used. Heatloss is primarily the result of convection,conduction and longwave radiation, all of whichare significantly reduced by glass. Thus, providedthe sun is shining, a window can cause heat gaineven on a cold day.• Windows that face east or west are moredifficult to shade in summer (with greaterpotential for overheating). They should thus bekept relatively small, unless the user regulatesthe shading using moveable shades or othermeans discussed below.• South-facing windows will tend to lose moreenergy than they gain; they are useful if theintention is to cool a space in summer, but willmake it cold during winter. They can also beuseful to collect diffuse light for work spaces.<strong>CSIR</strong> (1997) provides an excellent paper-basedmethod for calculating shadow angles at differentorientations and times of the year, and provideshelpful hints for controlling sunlight entry intobuildings.Building occupants should manage windows,either opening or closing them to allowventilation, or drawing curtains at night or in coldweather to minimise heat loss. To retain heat,curtains should be heavy, and/or windows shouldhave close-fitting shutters. On the other hand,interior drapes will tend to absorb heat energy andrelease much of it into the building. Heat gain canmost effectively be reduced using external shutters,louvres or highly reflective interior blinds. Moreexpensive control measures, which are worthwhilein extreme climatic conditions, include doubleglazing,adhesive films (which can be retrofitted)and low-emissivity glass.WallsConductivity/insulation: Exterior walls shouldgenerally have good thermal insulation properties,to help keep heat out in summer and in duringwinter. Standard brick or block walls havereasonable thermal properties, especially if a cavityconstruction is used. Thin (single) brick, fibreboardand especially corrugated iron external walls areinefficient and cold in winter (or hot in summer)and should be insulated (but avoid usingdangerously flammable materials).Even low-cost insulation can reduce winter heat lossin corrugated iron dwellings by 50% (Weggelaarand Mathews 1998). If applied to 700 000 suchdwellings in Gauteng, these authors estimatepotential energy savings valued at R275-R450million per year.Thermal mass High thermal mass (the specific heatcapacity x mass of an element) can have amoderating effect on the temperature inside abuilding. High thermal mass walls exposed to thesun or warm air during the day will warm up slowly(without overheating) and then re-radiate heatinto the house overnight, helping to keep thehome warm. This is particularly relevant in climateswhere day-night temperature variations are high(e.g. the highveld and interior regions of thecountry).As with windows, north-facing massive uninsulatedwalls under eaves can be shaded in summer, butexposed to the sun in winter, providing a naturallymoderated energy input to the home.Figure 12.2.5: Shadow angles for north-facingwindowsNote: These angles are for maximising winter gain( W ≥ 66.25˚ - latitude), but avoiding overheating insummer ( E ≤ 90˚ - latitude). Eaves for orientationseast or west of north will have to be longer, and it isdifficult to avoid excessive solar gain.Wall colour: Light colours help to reflect heat. Thiscan reduce overheating of thin, poorly insulatedwalls exposed to the summer sun.The Trombe wall is a well-known specialised passivedesign technology which can be effectively used towarm a house in winter. An external glass paneshields the wall from wind, and significantlyreduces convective and long-wave radiation losses,8Chapter 12.2Other forms of energy
GUIDELINES FOR <strong>HUMAN</strong> <strong>SETTLEMENT</strong> <strong>PLANNING</strong> <strong>AND</strong> DESIGNwhile allowing short-wave radiation from the sunto enter and warm the wall. These walls can alsobe used to enhance ventilation and facilitatecooling during hot weather, by placing vents thatopen to the outside near the top of the wall, andfitting temporary insulation on the inner surface.Air heated by the sun rises in the gap between walland glass and leaves the house, drawing fresh,cooler air into the dwelling.Other elements with high thermal massFloors, massive roof structures (earth or concrete)and specially designed elements such as waterfilledstructures all have high thermal capacity, andcan be used to moderate indoor temperatures. Insummer, a house can be fully opened at night, tolose as much heat as possible to the dark sky, andthen closed during the day in an effort to keep theheat out and derive the benefit of the pre-cooledwalls and floors.On the other hand, if a building or room is usedonly for short periods, it may be appropriate tocarpet the floors and use insulated walls of a lowthermal mass, so that air-conditioning or heatingwill quickly get the room to the desiredtemperature without undue energy transfer towalls or floor.In well-designed buildings, attention should begiven to the balance of floor area, effective(exposed) thermal mass and north-facing windowarea. If window areas are too great for the house’sthermal mass, then overheating can occur - evenduring winter days - and the house will cool downtoo rapidly at night. Windows that are too smallwill provide insufficient heat gain. Basic designguidelines are not given here, as appropriate ratioscan vary significantly, depending on the thermalproperties of different construction materials.Suffice it to say that optimum north-facing windowareas are of the order of 10% or more of buildingfloor area (Holm et al nd).VentilationAdequate ventilation is essential to avoidoverheating in summer, to avoid damp interiorsand, perhaps most importantly, to removepollutants released by indoor fires and coal stoves,where these are used. It is, however, important thatsuch ventilation be controlled, and to a certainextent directed.In hot weather, good cross-ventilation can befacilitated by windows or vents on both theleeward and the windward side of buildings. Exitwindows should be high, to avoid warmer (lighter)air being trapped above them. Ceiling fans, andespecially smaller fans directed as required, cansignificantly enhance user comfort in hot weather,at a much lower cost than air-conditioning.Many South African households, however, are overventilatedin winter, with poorly fitted doors,windows and ceilings. Again, potential savings aresignificant - in the order of 25% in somesimulations performed by Van Wyk and Mathews(1996) on shack-type dwellings. “Weatherisation” -using caulking, weather strips, or even old clothsand cardboard - is a useful strategy.Where smoky stoves or braziers are used, a directchimney is better than extensive generalventilation to remove asphyxiating smoke andcarbon monoxide. Space-heating efficiency isimproved if there is also a specific air-supply ventfor the stove/fire - otherwise the combustion drawscold air into the building.LightingDaylight is cheap, provides good colour definition,and tends to have positive effects on people(compared to artificial lighting). Windows andskylights are well known, and work well. Whereglare or direct sunlight is not welcome, diffusers orexternal shading devices can be advantageous. Thesuccess of shading devices is strongly dependent onorientation (see above). Excessive summer-heatgain from skylights can be a problem, as externalshading is difficult to arrange. More specialisedtechnologies such as solar tubes, and white ortranslucent reflectors/diffusers placed inside northfacingvertical glazed openings are sometimesuseful and should be more widely used.HumidityThe most important heat loss mechanism forhumans is through the evaporation of sweat fromthe skin. If humidity levels are high, thisevaporation is severely impaired, leading todiscomfort at high ambient temperatures. Very lowhumidity leads to excessive dryness and is alsoundesirable. Reduced humidity levels are difficultto achieve using low-cost passive design features.Mechanical air-conditioning systems are generallyused. However, in hot dry climates, air flow overponds or through screens of wet porous materialcan be a highly effective method to increasehumidity and cool the air.The external environmentThe texture and composition of surface materialused around a building can have an importantimpact:• Deciduous trees and vines on the sunny sides ofa building will naturally adjust to the seasons,Other forms of energy Chapter 12.29
GUIDELINES FOR <strong>HUMAN</strong> <strong>SETTLEMENT</strong> <strong>PLANNING</strong> <strong>AND</strong> DESIGNproviding needed shade in summer, andallowing sunshine to reach the walls andwindows in winter.• Evergreen shrubs and bushes around the southwesternto south-eastern borders can help toshelter houses from high winds (e.g. WesternCape) and provide a measure of insulation fromcold winter skies in the highveld or interior.• Low shrubs could be a disadvantage in humid,mild to hot climates, such as in coastal KwaZulu-Natal, where they will tend to obstruct thewelcome movement of air. Trees with a highcanopy are more desirable.• Paving, especially on a northern or westernaspect will reflect heat against walls andwindows, and can add to heat build-up. If thepaving is shaded by deciduous plants on apergola in summer, however, the potential forenhanced heating can be turned to advantagein winter. Grassed areas will tend to be cooler.• Pergolas and verandas can provide animportant buffer zone around a building,especially with potted plants (their highthermal mass and active transpiration tend tocool the environment).Site and building orientationBuildings with a longer axis should preferably beorientated within 15˚of an east-west line. This willtend to allow more windows, other openings suchas doors, and increased wall area on the northernside to gain maximum benefit from the winter sun,while avoiding overheating in summer (seecomments above regarding shade angles).Designers should locate living spaces on thisnorthern side. Westerly orientations, in particular,should be avoided in hotter regions, as a bakingafternoon sun can be very difficult to keep out.Northerly orientation can also facilitate theinstallation of solar water heaters (depending onroof design).However, the effect of orientation is marginal forsmall, square structures that have small windowareas. It should be stressed that other factors - suchas access, security, variety, privacy/conviviality, slopeand prevailing wind - should play a role in sitelayout and planning. Careful planning can stillharness the benefits of passive solar design for arange of building orientations.Solar accessOptions for passive solar design can be severelyrestricted by adjacent buildings, especially on thenorthern side of a property. Site planners anddesigners should take careful cognisance ofexisting buildings, and future building possibilities,from the point of view of the current project aswell as the needs of future developers on thesouthern side. In some countries solar rights arelegislated, with shading of sites by adjacentbuildings between 9 am and 3 pm prohibited(Holm and Viljoen 1996). Shared walls on theeastern and western sides can be an advantage, asthey provide excellent insulation.Site layout and development planning should becarried out with the above concerns regardingshading borne in mind. Road and stand plansshould maximise the northern aspects, and avoiddense packing on south-facing slopes (whereshading by adjacent buildings will be more severe).Different climatic conditionsMost of the suggestions discussed above can beused to good effect to reduce the cost of energyservices and enhance the built environment in allparts of South Africa. However, cost-effectivenessand appropriateness of different interventions ishighly dependent on climate. The interior of thecountry generally has colder night-time and wintertemperatures, and in some parts higher daytimesummer temperatures. Thus insulation, winter solargain and thermal mass are important. The WesternCape coastal regions tend to have a moretemperate climate, and savings from passive designinvestments will not be as significant. In hot, humidareas such as coastal KwaZulu-Natal, summerventilation and avoidance of heat gain (shadedwalls, reflective insulation in roofs) are moreimportant. Holm (1996) provides a detaileddescription of 13 climatic zones in Southern Africa,and provides design guidelines for each.Economics and implementationChanges to standard designs that bear relatively littlecost - such as orientation of buildings towards thenorth, proper placement of windows for ventilation andsummer shading - should be implemented whereverpossible. Poor airtightness is frequently a result of poorquality control in construction, and can be improved bybetter training and quality control. Post-constructionweatherisation can also be done low cost.Cost-benefit estimates for more expensive options(installation of ceilings, insulation, etc) should considerthree perspectives, namely those of:• the householder;• society at large; and• the energy utility (especially the electricity-supplyauthorities).Sometimes, the savings accruing to building owners10Chapter 12.2Other forms of energy
GUIDELINES FOR <strong>HUMAN</strong> <strong>SETTLEMENT</strong> <strong>PLANNING</strong> <strong>AND</strong> DESIGNmay be insufficient to justify extra expense but, if thepotential savings to the electricity-supply agency orsociety at large are also considered, a strongermotivation for an intervention can be made.In general, ceilings and ceiling insulation will be costeffectivefor all three parties in most parts of thecountry. The addition of low-cost insulation to singleskincorrugated-iron structures can also yield positivenet benefits to householders. However, especially incoastal regions where ambient temperatures tend tobe more stable, it may not be worthwhile from thehouseholder’s perspective to invest in ceilinginsulation, or even a ceiling.Estimates of the energy savings that can result fromspecific changes in design in specific climate zones canbe derived from simulations or manual calculations -for example the CR method (Wentzel et al 1981).Computer programs are useful, some of which havebeen validated in South Africa (e.g. QUICK II 1998).Internationally developed and marketed programssuch as DOE-2E, BLAST, and TRNSYS are also useful,provided that appropriate weather data are used.Such software can be sourced through enquiriesaddressed to the USA National Renewable EnergyLaboratory, or similar institutions.The viability of different interventions is also affectedby the unit energy cost of the fuel being saved.Households using lower-cost heating fuels such as coalor wood will realise smaller financial savings thanthose using electricity. On the other hand, their healthbenefits may be greater.Depending on a household’s ability to set aside moneyfor longer-term benefits (the effective “householddiscount rate” which balances capital investmentagainst current demands on income), fuel savings fromimproved building design may not pay back the cost ofthe investment sufficiently quickly to be attractive.Poor people, in particular, can generally ill-affordcapital expenditure, even if payback times are short.Nevertheless, from the perspective of an electricitysupplyutility (seeking to reduce peak demand), or theperspective of local or international society at large(seeking to reduce the impact of excessive energyconsumption for space heating on health and theenvironment), it may be worthwhile to support suchinvestments. This support can be in the form of• direct subsidies;• incentives offered for residential demand-sideenergy management; and• careful structuring of finance packages (especiallyfor new homes) to encourage people to choosebetter building designs which will save themmoney in the longer term.A particular opportunity to support such investments,which is becoming more readily available, is access tointernational sources of finance, motivated by globalenvironmental concerns.Frequently, the pressure on housing developers is todeliver the maximum number of units possible, withminimum capital cost. In the absence of prescriptivelegislation in South Africa to enforce constructionmethods that are more thermally efficient, this tendsto result in householders and energy utilities being leftwith the long-term burden of high energy costs, anduncomfortable living environments. The developmentof social compacts between prospective homeowners,NGOs, planners and developers (and possibly withinternational funders) is an important element ofbuilding community-wide strategies to rationaliselonger-term energy consumption.HYDROCARBON FUELSParaffinParaffin is a liquid hydrocarbon fuel, which isproduced by refining crude oil. It is very widely used inSouth Africa as a household fuel in non-electrified orrecently electrified settlements.Paraffin has a calorific value of 37,5 MJ/litre or46 MJ/kg.Utilisation and availabilityParaffin is mainly used in domestic applications for• space heating;• cooking;• water heating;• lighting; and• refrigeration (less common).Unlike liquified petroleum gas (LPG), paraffin is notsuited to piped reticulation in buildings and isconsequently not used in institutions or commercialenterprises.Approximately 850 million litres of paraffin areused annually in South Africa (DME 1996).Paraffin is widely available from small traders,garages and supermarkets in quantitiesdetermined by the customer’s container size. Thestandard form of distribution is in 220 litre drumsor 20-25 litre tins.AppliancesA wide range of paraffin appliances is available.These may be pressurised (as in the case of a Primusstove or hurricane lamp) or non-pressurised, as inOther forms of energy Chapter 12.211
GUIDELINES FOR <strong>HUMAN</strong> <strong>SETTLEMENT</strong> <strong>PLANNING</strong> <strong>AND</strong> DESIGNthe case of a wick lamp. Pressurised appliances aremore efficient and provide higher levels of outputthan non-pressurised units. Paraffin appliancestend to be portable and operate from a dedicated(or integral) fuel tank, which requires periodicrefilling from a storage container.Typical appliances include• stoves - usually single-pot stoves;• heaters - wick or pressurised;• lamps - wick or pressurised hurricane-type; and• fridges and freezers - usually wick-type units.Appliances are widely available from generaldealers, supermarkets and hardware stores.Comparative costsThe retail price of paraffin is highly variable, due tothe diversity in the distribution chain.Consequently, the retail price ranges fromR2,50/litre upwards (October 1997 prices).HazardsThe hazards associated with the use of paraffininclude household fires, burns, asphyxiation and,most significantly, poisoning. Paraffin is poisonousin both liquid form and as a vapour. Up to 10 % ofchildren in lower-income households sufferaccidental poisoning (PASASA 1997). Children inthe age group 1-4 years are most at risk.Asphyxiation may occur as a result of theinhalation of poisonous paraffin fumes or due tothe production of carbon dioxide and monoxide inconfined or sealed rooms.Safety measuresThe high social costs of healthcare for paraffinrelatedinjuries or poisoning have resulted in aconcerted effort to provide practical measures andgreater public awareness of safety in the use ofparaffin.The basic concerns include• safe packaging and storage - dedicatedcontainers with labels, safety caps, and a lockedand ventilated storage area;• safe utilisation - care of and correct use ofappliances, safe handling by using a funnel,avoiding and cleaning spills, adequateventilation of rooms; and• health and safety awareness - informationpamphlets, poison treatment cards, poisoninformation centres.The Paraffin Safety Association of South Africa,PASASA (tel: 0800 22 44 22) has developed a childproofparaffin safety cap for commonly usedcontainers. In addition, PASASA has developedparaffin safety labels for containers, safety postersand training packs for free distribution.Planning considerationsAs in the case of LPG (see below), the planningconsiderations for paraffin relate to thedistribution of paraffin through a network ofdepots (or wholesalers) and small traders, and togeneral household fire and safety concerns.Liquid petroleum gas (LPG)Liquified petroleum gas (LPG) is a mixture of butaneand propane gas stored under pressure, usually in steelcylinders. It is heavier than air, non-toxic andodourless. A smelling agent is added to aid users todetect leaks.LPG is convenient as it has a high calorific value(energy content per kg) and is hence very portable,provides instantaneous heat, and is easy to ignite andclean-burning.It is the most environmentally friendly of thecommonly used fossil fuels because it is usuallyefficiently used and has low levels of harmfulcombustion products.LPG has a calorific value of 49,7 MJ/kg or 13,8 kWh/kg,which is equivalent to 13,8 units of electricity.Utilisation and availabilityApproximately 280 million kilograms of LPG areconsumed annually in South Africa (DME 1996).Typical uses include• space heating;• cooking;• water heating;• refrigeration;• lighting;• workshop uses: brazing, soldering, welding;and• school/technical laboratoriesfor use in• domestic households;• restaurants;• hospitals;• schools;• small businesses; and• recreation/leisure.12Chapter 12.2Other forms of energy
GUIDELINES FOR <strong>HUMAN</strong> <strong>SETTLEMENT</strong> <strong>PLANNING</strong> <strong>AND</strong> DESIGNAppliancesLPG appliances include most of the commonly usedelectrical appliances other than electronic and/ormotorised equipment. These include• stoves/ovens;• grills/braais;• heaters (portable and fixed);• instantaneous water heaters;• lamps (portable and fixed);• irons;• refrigeration;• welding plant; and• bunsen burners.The most commonly used LPG appliances arecooking, space heating and lighting appliances.Appliances are designed to operate at anunregulated high pressure, such as in the CADAC(or similar) type of camping appliances, or at alower pressure controlled by a regulator mountedon - or adjacent to - the gas storage cylinder. Highpressureand low-pressure appliances are notinterchangeable.Most households use gas appliances which operateoff a small dedicated gas cylinder, rather than off areticulated system of gas piping and fixed storagecylinders. Commonly used cylinder sizes are No 3 toNo 10, and 9 kg cylinders (see Table 12.2.5).Gas appliances must comply with SABS 1539:1991.Comparative costsThe 1998 retail cost of LPG was R4,20 per kg (i.e. aunit energy cost of 8 c/MJ or 30 c/kWh).The comparative effective costs per energy serviceare presented in Table 12.2.1.HazardsTypical hazards with LPG include:• burns - common;• explosions - quite uncommon; and• asphyxiation due to displacement of air (byunburnt LPG in basements or on tanked floorsor, more often, by carbon monoxide build-up inclosed rooms).Installation practicesLPG storage cylinders are supplied in a range ofstandard sizes in two categories: camping/hobbytypeand household/industrial type.The larger (9-48 kg) cylinders are designed tooperate at 7 bar and are tested to 30 bar.SABS 087:1975, Part 1, Code of practice forconsumer LPG cylinder installation, is applicable tothe storage of cylinders and gas piping in all caseswhen more than one cylinder, or a cylinder greaterthan 19 kg, is used on household premises.In practice, it is recommended to use two cylinders,a duty and a standby cylinder, to ensure continuousservice when the duty cylinder runs empty. It is alsomore convenient for households to manage twoNo 10 cylinders (4,5 kg) rather than one 9 kgcylinder.Fixed gas installations must be installed by aregistered gas installer (accredited installers can bechecked with the LP Gas Association - refer tocontact details below).Guidelines for installationThe most important installation consideration isTable 12.2.5: Standardised sizes of gas cylindersCAMPING/ HOBBY HOUSEHOLD/INDUSTRIALDIMENSIONSENERGY CONTENTHIGH PRESSURELOW-PRESSUREMJ DIAM. HEIGHTAPPLIANCES APPLIANCES mm mm100 g 5200 g 10No 3 70No 7 160No 10 2309 kg 450 305 40619 kg 950 305 76248 kg 2 400 381 1 143Other forms of energy Chapter 12.213
GUIDELINES FOR <strong>HUMAN</strong> <strong>SETTLEMENT</strong> <strong>PLANNING</strong> <strong>AND</strong> DESIGNCoalthe provision of good ventilation, preferablynatural ventilation, in the storage area and theappliance area. Two airbricks or 150 x 150 mmweather louvres at ground level and high up on anexterior wall are recommended.Storage of cylinders: outdoors, in a lockable andprotected area, in an upright position.Pipework: 10 mm Class 2 copper with brasscompression fittings.Regulators should comply with SABS 1237:1990.Safety measuresThe LP Gas Association (tel 011 886 9702 or 021 5315785, PO Box 456, Pinegowrie, 2123) has developeda range of safety-information material andprovides training courses for gas suppliers.The basic safety issues include:• Safe storage - safe handling and storage ofcylinders.• Safe utilisation - care of and correct use ofappliances.• Health and safety awareness - informationpamphlets and training courses for suppliers.Planning considerationsLPG distribution is provided via depots, whichsupply small traders or dealers such as generaldealers or hardware stores.Small traders typically supply approximately 2 000kg/month which corresponds to settlements ofbetween 500-1 000 households or 2 000-10 000people, depending on the average monthlyconsumption and household sizes.An average coverage per small trader could be3 000 people.An LPG depot is capable of distributing cylinders to10-15 small traders.Household use of coalCoal (bituminous or ordinary coal) is one of thelowest-cost fuels available to households for spaceheating, and ranks on a par with most other fuelswhen used for cooking and water-heating (seeTable 12.2.1). As a result it is widely used inGauteng, parts of KwaZulu-Natal and in rural andurban settlements close to coal mining districts(refer to Figure 12.2.1). About one millionhouseholds use coal in these areas (5 to 6 millionpeople). Coal use is less common in other areas,partly because of higher prices due totransportation costs.Typical appliances include• cast iron “coal stoves” with closed combustionchambers exiting to a chimney (such as theDover stove); and• open and closed braziers, with the Mbaulabeing a common example; these do not have achimney and are normally ignited outside,before being brought into the home.Environmental and health issuesThe coal generally used by householders is ofrelatively low quality (C or D grade), as this issignificantly cheaper than higher grade coals. It hasan energy content greater than 21 MJ/kg, an ashcontent of 15% to 50%, and releases noxiousvolatiles on combustion. The sulphur content isrelatively low (1-2%). When burnt relativelyinefficiently (as in a stove or Mbaula), thedangerous pollutants include particulates andnoxious gases such as sulphur dioxide. Aside fromgeneral concerns regarding unpleasant smog andgrime on buildings, the indoor and outdoorpollution levels in communities that use coal arehigh enough to markedly increase the risks ofrespiratory tract illnesses, with the use of coal inthe home increasing risk by a factor of nine in onestudy (Van Horen et al 1996). If homes are underventilated,there is also a risk of asphyxiation fromcarbon monoxide poisoning. The direct health risksattached to household coal combustion thus havehigh personal and societal costs.Efforts to reduce pollutionStrategies to reduce indoor and outdoor pollutionfrom residential coal consumption include• encouraging the substitution of coal use byother fuels which are cleaner, but requiredifferent appliances (LPG, paraffin, electricity);• the provision of other fuels which can replacecoal in existing coal-burning appliances (lowsmokecoal, wood, briquettes);• legislation to reduce allowable smoke emissionsand/or prohibit coal use;• improvement of stove combustion efficiency;• education on the need to ignite Mbaulasoutside the home, only bringing them inside14Chapter 12.2Other forms of energy
GUIDELINES FOR <strong>HUMAN</strong> <strong>SETTLEMENT</strong> <strong>PLANNING</strong> <strong>AND</strong> DESIGNonce smoke production has reduced;• education regarding proper lighting methods(starting a fire on top of a pile of coal ratherthan underneath can reduce the amount ofsmoke produced);• education regarding proper ventilation;• substitution of open braziers and Mbaulas bystoves with chimneys (to remove smoke fromindoor environment); and• improving the thermal performance of housesto reduce the requirement for space heating(refer to the energy-efficient building designsection above).Although many of the interventions listed abovefall primarily within the responsibility of coal usersthemselves, the effects of pollution affect society asa whole, and it is therefore important for planners,local authorities and national agencies to bedirectly involved. Some of the above strategies arediscussed briefly below.Substitution of coal with different “clean” fuels(e.g. electricity, gas). Both electrification and theprovision of gas have the potential to reduce coalcombustion in homes, reducing local pollutioneffects to a minimum. Experience to date, however,indicates that coal stoves continue to be used evenafter settlement electrification (Van Horen et al1996). Costs to the householder remain animportant barrier to fuel substitution. Coal can bethe cheapest fuel for thermal applications(especially space heating - Table 12.2.1).Furthermore, replacement of the multi-purposecoal stove can require the purchase of threeappliances: a stove, a water heater and one ormore space heaters. Strategies to increase the rateof transition to electricity include• the subsidisation of new-appliance costs (orimproving access to credit for appliancepurchase); and• the subsidisation of electricity tariffs for lowincomehouseholds (currently being mooted bythe National Electricity Regulator).Similar strategies can be used to promote gas use.Substitution of coal with low-smoke coal or othersimilar solid fuels. A number of “low-smoke coal”fuels have been developed. These offer thepotential of easier substitution in the market place:householders would not have to purchase newappliances or change their cooking and spaceheatingsocial/behavioural practices. These fuelscan also be marketed through existing coal dealernetworks, reducing disruptive effects onemployment, etc.However, low-smoke coals are more expensive thanordinary coal, with production costs three or moretimes the pithead price of bituminous (ordinary)coal. Even if one assumes savings in distributioncosts for locally produced fuels, low-smoke fuelsretail prices are from 1,7 to 10 times the retail priceof coal (on a per-unit energy basis). Since they haverelatively few advantages to the customer (apartfrom low smoke emission), it is clear that someform of market intervention would be necessary toachieve more widespread use. For a discussion offuel types and market intervention options see VanHoren et al (1995).Three products have recently been tested in alarge-scale experiment:• Two brands of devolatilised discard coal(produced by heating discard coal undercontrolled conditions).• Compressed paper with a binder. User andmerchant reaction was mixed. The devolatilisedcoal fuels, in particular, were difficult to light,initially blocked grates because they had toohigh a percentage of fines, and did not havegood heat retention. The paper-based fuel wasmuch easier to use, although it also did nothave good heat-retention properties. There arethus a number of problems still to be overcome,before it will be possible to actively market aproduct that can compete directly with coal(Asamoah et al 1998).Legislation of smoke-control zonesPart III of the Atmospheric Pollution Prevention Act(No 45 of 1965) makes provision for smoke controlzones in which the sale or combustion of coal fordomestic use can be controlled. Enforcement isusually through an education process, withwarnings or “abatement” notices being servedprior to prosecution for an offence in terms of theAct. Although effective in wealthier communities,where alternatives to coal are affordable, the Actcannot be expected to be observed in poorercommunities where there is little economicalternative to coal. It is thus necessary to developand implement other viable strategies beforeconsidering enforcing the observance of alegislated smoke-control zone.Education and awarenessNational or regional strategies can be effectiveonly in as much as they are taken on board bycommunities and individuals. It is thereforeimportant to engage in debate and educationOther forms of energy Chapter 12.215
GUIDELINES FOR <strong>HUMAN</strong> <strong>SETTLEMENT</strong> <strong>PLANNING</strong> <strong>AND</strong> DESIGNprogrammes, and generally raise awarenessaround coal pollution and abatement strategies.BiomassBiomass is extensively used for cooking in South Africa,with an estimated 16 million people relyingpredominantly on wood for space heating and cookingneeds (Van Horen et al 1996). People tend to use openor sheltered fires, usually with a few stones or bricks tosupport pots or a grid. Varieties of “improved woodstoves” are available, but have not been extensivelyused or marketed in South Africa. Mean annual percapita consumption of biomass varies depending onthe availability of wood, and the degree of substitutionwith other fuels such as paraffin, gas or even electricity.Typical values are from 350-700 kg per capita per year.Wood is usually collected at low or zero direct financialcost to the household. However, collection times arelong (often three or more hours per trip), with multipletrips required per week. Commercialisation of thefuelwood market in rural areas is increasing. Prices areof the order of 20c to 50c per kg (1997-98), dependingon availability and quantities purchased.Concerns regarding fuelwood useWood is in many ways an attractive fuel forresidential energy supply, as it is low cost (see Table12.2.1), popular, familiar to people, and theresource is generally well distributed. If harvestedon a sustainable basis the net greenhouse gasemissions are zero, and the resource is renewable.However, there are health and broaderenvironmental concerns which should be addressed.Health related concerns include the following:• Burning wood brings increased risk ofrespiratory tract infection and eye diseases as aresult of exposure to smoke in poorly ventilatedhouses. Studies have recorded exposures tototal suspended particles from two to eighttimes recognised international standards (VanHoren et al 1996).• Even if ventilation is provided, cooks may be soclose to the fire that smoke exposure is stillhigh.• In denser settlements, outdoor air pollutionfrom woodsmoke may also be a problem.• The risk of burns, especially to children aroundopen fires, is increased.• Spinal injury and other personal-safety risks areassociated with wood-collection trips.Supply sustainability concerns include thedecreasing availability of wood fuel as a result of• unsustainable harvesting pressure and practices(environmental denudation); and• competing land use claims for agriculture andhousing development.Biomass strategiesKey strategies for improvement of health andsafety in the household environment include thefollowing:• Substitution of fuelwood with cleaner fuels(electricity, gas, paraffin). However, wherewood remains significantly cheaper thanalternative fuels, such strategies are expectedto have limited impact.• Greater use of improved stoves with chimneys.Such stoves should remove all smoke from theimmediate cooking environment and also havegood combustion efficiency to reduce totalemissions. “Cooking efficiency”, which isrelated to combustion efficiency, heat transferefficiency, and the ability to control the rate ofcombustion are also important. A key difficultyis the establishment of a sustainable marketthat can deliver products of adequatestandard.Concerns regarding sustainability of supply can bepartly addressed by reducing consumption.However, what is more important is theachievement of an integrated development andresource utilisation framework which takes intoaccount land-use priorities, institutional andprivate ownership constraints, and biomass energyrequirements. Measures directly related to biomasssupply include the following:• Redistribution of wood from areas of surplus toareas of need, preferably using commerciallysustainable mechanisms. Sources of potentialsurplus include commercial farms, commercialforests, water-catchment areas infested withalien vegetation, and farm and gamemanagement areas suffering from bushencroachment.• Encouragement of sustainable harvestingpractices. These are often already practised bycommunities and include collection of deadwood only, cutting of selected branches to allowcoppicing to occur, and careful selection of treesto be felled on the basis of size, position andspecies. Where coppicing does occur it is oftenuseful to prune new shoots selectively to achievemore rapid re-growth of the remaining shoots.• Development of tree planting andmanagement strategies can enhance the supply16Chapter 12.2Other forms of energy
GUIDELINES FOR <strong>HUMAN</strong> <strong>SETTLEMENT</strong> <strong>PLANNING</strong> <strong>AND</strong> DESIGNof wood for fuel and other purposes(construction, fencing, carving, etc). Optionsinclude woodlots, agroforestry and socialforestry.Woodlots require the establishment andmanagement of small- to medium-sizedplantations to produce fuel and other forestproducts. They have met with mixed success, asmanagement and ownership structures are difficultto establish and maintain in the long term.However, where suitable local authoritymanagement structures are in place, they can beeffective.Agroforestry involves the planting of trees inassociation with crops. This can have benefits forcrop production (shade, windbreaks, nitrogenenrichment).Social forestry is a broad term, referring tocommunity-based resource management involvingthe planting and management of trees inwoodlots, as part of agroforestry, as part of landreclamationprocesses, or in greening projects.Greening projects are perhaps most important interms of settlement development and planning, asthey can result in more pleasing and comfortableliving spaces and greater access to fruit, wood andother products, depending on species and plantingpractice (Gandar 1994).The Directorate of Forestry (Department of WaterAffairs & Forestry) is the national entity responsiblefor overseeing many of the above strategies.Town gasTown gas, also called “producer gas”, is the term usedto describe reticulated gas, which is supplied in olderparts of South African cities, such as Woodstock andObservatory in Cape Town, Melville in Johannesburgand parts of Durban and Port Elizabeth.The gas is usually produced from coal, using a coalgasifier, or as a by-product of the chemical industry. Itscalorific value varies, depending on the source,method of manufacture and supply pressure, rangingfrom 13,3 to 34,0 MJ/m 3 .The gas is reticulated in pipes (or gas mains) in thestreets and supplied onto each erf via a gas meter, asfor water or electricity.Town gas is currently not considered for any newsettlements, although this may change if the Pandenatural gas reserves in Mozambique are developedand marketed in Mpumalanga and Gauteng.AppliancesBuilt-in appliances such as instantaneous waterheaters, cooking stoves and “gas fires” (spaceheaters) are commonly supplied by town gas.In general, town-gas appliances operate at a lowerpressure than bottled LPG appliances.Consequently, although most gas appliances canoperate off either type of supply, they wouldrequire modifications to the jets or burners toadapt to the difference in pressure.SafetyThe safety considerations for LPG appliances applyequally to town gas appliances. However, theprotection and marking of underground gas pipesalso requires attention, to avoid accidental damageand leaks.Planning considerationsNo planning for town gas is required until towngas becomes an available option for newsettlements.SOLAR ENERGY APPLICATIONS INSOUTH AFRICAProvision of energy to sites and buildings usuallyrequires the development of infrastructure to deliverthe energy carrier (electricity, town gas, LPG, paraffin,etc) to properties. Solar energy is, however, generallyavailable to householders. The following sectionsdiscuss the methods and mechanisms to facilitate theuse of freely available solar energy for services such aswater heating and electricity provision.The Solar Energy Society of Southern Africa (SESSA)may be contacted for information at PO Box 152, LaMontagne 0184, tel (012) 804 3435, fax (012) 804 5691.Solar photovoltaic electricity supplyPhotovoltaic (PV) modules are semiconductor devicesthat convert the radiant energy of the sun into a directcurrent (DC) electrical source. These can be coupledwith energy storage devices such as batteries andpower management equipment, to form anintegrated system capable of delivering electricity forwide range of application. Simple systems usuallyhave DC outputs to DC appliances such as lights,television, radio or hi-fi. Larger systems oftenincorporate a DC-AC inverter to power AC loads. PVsystems are modular, have low enviromental impact,are quiet and have a long life (15 year warranties onthe PV modules are common). Unit costs of energy arerelatively high (R3,60 to R5,00 per kWh, in 1997 rands).However, PV systems can be installed at the point ofOther forms of energy Chapter 12.217
GUIDELINES FOR <strong>HUMAN</strong> <strong>SETTLEMENT</strong> <strong>PLANNING</strong> <strong>AND</strong> DESIGNneed, thus significantly reducing the capitalexpenditure required for grid extension and even localdistribution.Typical applications of PV systemsTypical applications are listed below, with someindication of the number of installations in SouthAfrica as at September 1998. 1• power for telecommunications (between 60 000and 100 000 systems, or more than 2 MW pinstalled);• rural health-centre service provision(communications, vaccine refrigeration,lighting), with more than 180 such systemsinstalled;• school lighting and educational equipmentpower supply (more than 1 200 systems installed);• domestic lighting, media and other high-qualityenergy supply needs:- individual household systems, often calledSolar Home Systems (SHS), with anestimated 50 000 to 60 000 systems installed- battery-charging systems (shared by anumber of users), a few pilot projects inoperation- mini-grid reticulation systems (very little SAexperience to date);• water pumping (thousands of systems havebeen installed - see solar water pumping sectionbelow); and• galvanic protection of structures againstcorrosion.Potentially important applications of PV systemswhich have not yet been implemented on asignificant scale in South Africa include• street lighting in unelectrified communities oralong roads not served by nearby sub-stations;• grid-connected distributed generation systems -for example to provide reinforcement fordaytime peak loads at the end of a long linewhich has insufficient capacity, or for back-uppower; and• building-integrated systems in which the PVmodules also serve as facade or roof covering(these offer considerable potential in thefuture, as the dual purpose renders theproducts more economically viable).The use of large PV power plants to generateelectricity for the grid is not yet cost-effective.Hybrid energy supply systemsSometimes the reliability and cost-effectiveness ofa renewable energy system can be improved byconnecting two or more energy sources to thesystem, creating a hybrid energy system. A dieselgenerator in combination with PV modules willincrease the ability of the system to cope with anuneven load demand profile or periods of adverseFigure 12.2.6: Principal components of a stand-alone photovoltaic system1 The power of PV modules and system is rated in peak watts, or W p , corresponding to the instantaneous outputunder standard irradiation conditions, similar to clear sun at midday.18Chapter 12.2Other forms of energy
GUIDELINES FOR <strong>HUMAN</strong> <strong>SETTLEMENT</strong> <strong>PLANNING</strong> <strong>AND</strong> DESIGNweather conditions. Wind turbines can alsocomplement PV systems effectively, especially inregions where periods of cloudy weather tend tobe accompanied by windy weather. Hybrid systemsare by nature more complex, and are thus usuallyjustified only for larger systems (5 kWh per day andabove). Design guidelines and general referencematerial on hybrid potential in South Africa may befound in Seeling-Hochmuth (1998). An applicationreceiving considerable attention at present is thatof remote-settlement household electrificationusing mini-grid reticulation systems powered byhybrid energy systems.CostsThe modular nature of PV systems tends to maketheir costs per unit of energy available (kWh/day)relatively independent of system size. Most otherenergy systems show significant economies ofscale, with diesel systems tending to be moreeconomical where the daily power demand isgreater than 2 kWh/day. PV thus tends to be mosteconomical for smaller-scale applications. Figure12.2.7 shows generic life-cycle cost estimates(including battery replacement, but excluding atechnician’s travelling time), while Table 12.2.6indicates the range of capital costs for somecommon applications (including the cost of systemspecificappliances).Figure 12.2.7: Comparative unit energy costs forsingle installations (1997 rands)Selection of the most appropriatetechnologyIndependent isolated applicationsCapital and running costs are among the mostimportant factors in deciding whether PV, hybridsystems, diesel, extension of the grid or othertechnologies are most suitable for a particularapplication. Costs of energy supply technologiescan often be estimated reasonably accurately, anddiscounted life-cycle cost analyses provide animportant tool to aid investment decisions. Figure12.2.7 gives the approximate unit energy costs forPV, diesel and grid for individual applications (e.g.provision of power to a remote household orTable 12.2.6: Typical PV applications and associated capital costsSYSTEM DESCRIPTIONSYSTEM SIZE (PEAK WATTS PV ARRAYPOWER) <strong>AND</strong> APPROXIMATE DESIGNLOAD (Wh/DAY)CAPITAL COST (INCLUDINGINSTALLATION)Solar home system (medium): 50 W p R2 500 to R4 000 depending3 DC lights, socket for B&W TV. 110 - 150 Wh/day on supplier and quantity (1997)School system (as installedduring 1996 Eskom 500 W p R55 000programme):1 100 - 1 500 Wh/dayLighting for a few classrooms,inverter to provide power for 900 W p R61 000audio-visual equipment, etc. 2 000 - 2 600 Wh/day (Borchers and Hofmeyr 1997)Health Centre:Lighting, vaccine refrigeration 450 W p R62 000(high availability required), 900 - 1 200 Wh/dayexamination lighting,communications; 600 W p R76 000staff quarters lighting and 1 200 - 1 600 Wh/day (Borchers and Hofmeyr 1997)entertainment.Other forms of energy Chapter 12.219
GUIDELINES FOR <strong>HUMAN</strong> <strong>SETTLEMENT</strong> <strong>PLANNING</strong> <strong>AND</strong> DESIGNhealth centre). From this figure it is clear that PVsystems tend to be the most cost-effective forrelatively small loads, remote from the grid.Additional factors which may increase thedesirability of PV systems - even for higher loadapplications - include• concerns regarding maintenance costs,reliability and security of fuel supply of dieselsystems (particularly for systems where highreliability is important, such astelecommunications); and• a requirement for low noise and/or pollutionlevels (particularly in environmentally sensitiveareas, such as nature reserves or tourist areas).When comparing costs of systems, it is important toconsider the load devices that will be used. As willbe discussed in more detail below, it is frequentlyworthwhile to use different appliances (and abroader range of energy carriers) than would bethe case if grid electricity were available.Settlement electrification - when to extend the gridor use off-grid technologyWhere technology selection may affect an entirecommunity, the decision is more complex. TheSouth African electricity-supply industry is currentlyengaged in a large, heavily subsidised programmeto extend grid access to millions of households. Therapid pace of development, and the changeablenature of planning structures, means that there islittle long-term certainty regarding the futurereach of the grid. Furthermore, even remotecommunities usually have high expectations ofgaining access to the grid in the near future. As aresult there is considerable reluctance on the partof communities and many institutions to invest inPV, as subsidised grid access is a far more preferablepower supply option, if it can be obtained. Thearrival of grid to a settlement will significantlyreduce the value of any prior investment in PV orother off-grid technology. Every effort shouldtherefore be made to determine the probability ofgrid electrification. Grid-planning uncertaintyremains one of the most important barriers towider-scale use of PV technology for ruralelectrification.From a financial (and economic) point of view, theprincipal factors affecting technology choice forcommunity electrification are listed in Table 12.2.7However, electrification planning decisions arefraught with political, economic and socialramifications. It is thus essential that decisionmakersconsult appropriately, both with authoritiesand proposed target communities.PV system design:The principal components of a typical stand-alonePV system are the PV array (comprising one or morePV modules), charge controller and a lead-acidbattery (see Figure 12.2.6). In some cases aninverter will be used to deliver AC power. Largersystems may incorporate a maximum power-pointtracker. Both the wiring used and the specificappliances used are crucial to successful operationof a PV system. It is therefore advisable to considerthe entire system from module to load applianceswhen conceiving and implementing a PV systemapplication. The following aspects are importantconsiderations for PV system design. For moredetailed information on technical design elementsrefer to Cowan et al (1992) or Hankins (1995).Polycrystalline, monocrystalline and amorphous(thin film) modules are available. While the latterhave lower costs, they tend to suffer gradualdegradation of output power over time, andshould thus be used with caution in situationswhere long life is important.Physical tracking of the sun can lead to gains of 25to 35% in PV array output. However, the addedcomplexity and reduced reliability means that thisis usually not economical.Given the high capital cost of PV systems, it isimportant to specify load accurately, and to avoidoverdesign of capacity.Appliance efficiency is more important for PVsystems than for grid or diesel systems, due to thehigh marginal costs of energy.An energy-service approach should be adopted inpreference to an electricity-service approach. Thisrequires consideration of the most appropriateenergy source for each appliance/service required.For most applications involving heating PV will notbe the most appropriate, as gas or other clean fuelsprovide a convenient and cheaper service.Refrigeration is also cheaper using gas, providedthat supply availability can be assured.The cost increases significantly if the system isrequired to store enough energy in the battery todeliver the full load, even under prolonged adverseweather conditions. Prioritisation of loads can beconsidered. Very high availability levels (requiringover-sizing) are normally only specified whereessential (e.g. for vaccine refrigeration ortelecommunications).Careful matching of PV array size, storage capacityand load for local solar radiation conditions isimportant to reduce overall costs. Paper-basedmethods and a computer program (POWACOST)20Chapter 12.2Other forms of energy
GUIDELINES FOR <strong>HUMAN</strong> <strong>SETTLEMENT</strong> <strong>PLANNING</strong> <strong>AND</strong> DESIGNTable 12.2.7: Criteria for grid versus off-grid electrification<strong>SETTLEMENT</strong> CHARACTERISTIC EFFECT ON GRID ELECTRIFICATION EFFECT ON OFF-GRIDVIABILITY VIABILITY ELECTRIFICATION VIABILITYProximity to existing or planned Grid extension costs are of the Off-grid technology costs aregrid infrastructure of suitable order of R20 000 to R55 000 little affected by distance fromcapacity and voltage rating. per km for low and medium the grid and comparativevoltage extensions (1998).viability thus increases withdistance.Settlement size (number of Costs of grid extension per Costs per household relativelyhouseholds). household reduce for large independent of settlement size.settlements.Proximity of households to Costs increase for more SHS costs independent ofeach other (hh/km 2 ). scattered communities. settlement layout but mini-gridsystems costs are affectedin the same way as grid costs.Proximity of settlement to other Clusters of settlements may be Will have little effect on off-gridsimilar settlements. able to share bulk-electricity electrification viability.supply costs.Expected load, especially for Higher load can improve the Large loads may be most costbusinesses,institutions and viability of extending the grid. effectively served by hybrid orwater supply.diesel systems.Presence or otherwise of Scarcity of biomass may result Exceptional local wind, microexceptionalrenewable energy in greater demand for electricity hydro or biomass resources canresources. (for cooking and space heating). offer lower cost options formini-grid hybrid systems.Existence in settlements of The economic and social Off-grid options can stillcommunity services such as benefits of electrification can be contribute to social andschools, health centre, significantly enhanced. economic benefits for suchcommunity centre, police,services, but not to quite thewater pumps, etc.same extent as for grid.are included in Cowan et al (1992).The charge controller (or regulator) is the heart ofa PV system. It is very important to match its controlcharacteristics to those required by the particulartype of battery used.Battery technology selection is important, asincorrect matching of battery to charge controllerand system load profile can lead to high batteryreplacementcosts. For larger systems, the use ofspecialist deep-cycle batteries is advised. Cowan etal (1992) provide a detailed description of batterytechnologies and implications for PV systems. IEC61427-1 is a draft standard for secondary cells andbatteries for PV systems.Current flows in DC systems tend to be quite high(a 100 W load will draw 8,3 A at 12 V). Voltage dropin cables should be kept below 8%.Both DC and AC output systems can be used.Selection of appropriate voltage will depend onthe requirements of available appliances and loadduty profiles. For simple systems DC is usuallysatisfactory. DC refrigerators are also usually moreefficient. For larger systems, some appliancesrequire AC (audio-visual equipment, workshoptools). However, the choice of DC or AC lighting onlarge systems is not simple. Careful analysis of thecost, efficiency and reliability implications ofdifferent options is required.Installation of PV systems with a system voltage lessthan 50 V currently does not fall under the SABS0142:1993 code of practice on the wiring ofpremises. However, there are indications that thiswill become a requirement. Cowan (1996) providesa detailed code of practice for installations.Other forms of energy Chapter 12.221
GUIDELINES FOR <strong>HUMAN</strong> <strong>SETTLEMENT</strong> <strong>PLANNING</strong> <strong>AND</strong> DESIGNImportant applications of PV in ruralsettlementsFour major programmes using PV technology todeliver services in rural settlements have beeninitiated in South Africa. Considerable technicalexpertise has been built up, and although nationalstandards are not yet available, potential users areencouraged to contact the organisations below toobtain information on standards andspecifications:• Health centre electrification: principallythrough the Independent Development Trust(Cape Town), with technical support primarilythrough the Energy & Development Group(Noordhoek).• School electrification: Eskom (Megawatt Parkand Non-Grid Electrification), withinternational and government support throughthe Department of Minerals and Energy.• Solar Home System projects: a variety of roleplayersincluding government, Eskom and theprivate sector. Detailed specifications are beingdrafted by Eskom NRS (NRS 052, draft 1998).• Rural telecommunications service delivery:primarily managed by Telkom.Maintenance and user trainingPV systems are generally regarded as being lowmaintenanceitems. However, the remote locationof most installations means that scheduled orunscheduled maintenance costs can be very high.Unfortunately, experience in rural communityhousehold-electrification programmes (in SouthAfrica and internationally), and in manyinstitutional settings such as schools and watersupplyprojects, indicates that provision formaintenance (financial, institutional, training, usereducation) is frequently insufficient. Three areasare critical:Cost of componentsBattery replacements, in particular, represent anongoing cost, particularly in low-cost householdapplications, where average lifetimes are about 3,5years. Lights also have a finite life (1 000 to 10 000hours) and will need to be replaced.Availability of technical resourcesAlthough most small systems are not complex, theaverage user will not be able to carry out all themaintenance. Given the high cost of travelling andspecialised staff, it is important to establish andsupport local technicians, equipped to service thesystems in a given area.End-user/customer trainingPV systems serving loads that are under usercontrol (households, schools, clinics, etc) need to beproperly operated to obtain maximum benefit, andto reduce the probability of premature batteryfailure. It is thus important to provide informativeuser education, and to ensure that systems areequipped with indicators to inform the userregarding battery status.Quality assurance and specificationsAlthough the PV industry has been active in SouthAfrica for close on twenty years, the market sizehas been inadequate to develop recognisedquality-assurance standards, training certification,and standard specifications for PV systems andcomponents (other than the modules). As a result,it is sometimes difficult for the purchaser to ensurethat components used are efficient and of goodquality, and to ensure that design and installationare properly carried out. Changes are, however,taking place rapidly, both within the country andinternationally. Standard specifications forparticular system configurations and for specificbalance of system components are beingdeveloped. A number of codes of practice forinstallation have also been developed, and may beincorporated into national standards documents.Although there has been some development oftraining courses, certified PV training courses arenot yet well established. The following documents(or the latest drafts) are useful:• Code of practice for installing low-voltage PVpower systems (draft). Prepared for Departmentof Minerals & Energy, Pretoria, by the Energyand Development Research Centre (1996).• Code of Practice: Southern African SolarModule Suppliers Association (1994).• NRS 052:1998 (draft), Technical specification forPV systems for use in individual homes.Finance and dissemination modelsPV systems require large capital investments upfront (as does grid electrification). However, thedispersed location of customers and the autonomyof installations mean that they are not normallyconsidered part of utility business. As a result,consumers do not gain access to the low-interest -and often subsidised - long-term finance soessential to grid development, or to the projectmanagement and consumer support programmesthat are crucial to normal grid-electrificationproject development and long-term operation.22Chapter 12.2Other forms of energy
GUIDELINES FOR <strong>HUMAN</strong> <strong>SETTLEMENT</strong> <strong>PLANNING</strong> <strong>AND</strong> DESIGNFor institutional clients such as schools, healthcentres and water authorities, access to finance forcapital expenditure and project management canusually be resolved. Longer-term maintenance isoften more difficult, as discussed above.For households, the problems are far moreintractable. Finance services geared to remote ruralareas are expensive to administer, particularly forthe small- to medium-scale loans required for PVsystems. Incomes are often uncertain and securitymay be a problem. Customers require assurancethat systems will work for extended periods, andthere are also concerns regarding the sustainedprovision of maintenance services. Despite thesebarriers, numerous householders (numbered in thetens of thousands) have already purchased PVsystems. Various strategies have been proposed ortested to enhance dissemination potential.Hire purchase or loan schemes involve theestablishment of specialised credit facilities thatcan be used either by individuals or, in some cases,by groups or co-operatives, to purchase PV systems.In parallel with the credit facility, NGOs,government, industry or perhaps the grid utilityprovide project-management services to facilitatebulk purchasing, customer education, localtechnician training, and efficient installation of PVsystems within a community. A variation of thissystem is to establish a local service point near thetargeted communities. This owner/franchisee/agentcan then act as a liaison for loan applications,system supply and technical support. Althoughcustomers will need to make provision in the longterm for ongoing maintenance costs, purchasecosts are for a finite period (typically three or fouryears) and, once the system is paid off, monthlycosts will be significantly reduced.An alternative is to maintain more of a utilityapproach to PV electrification. In this case financial,technical and administrative infrastructure isestablished in a region to enable long-term leasingof PV systems by customers for a monthly fee.Essentially, the customer pays for an energy service,not a product. The approach is potentially moreattractive to customers, as the risks involved are farlower, and monthly payments should be lower thanfor a loan-based system. Maintenance will remainthe responsibility of the service provider (except forlights and possibly house wiring). Should the gridarrive at some future date, customers can simplystop their lease and return the systems to theservice provider, with relatively little loss ofinvestment.An important technical development which makesboth “service-based” and loan-based disseminationstrategies simpler to administer, is the introductionof pre-payment meter technology to PV systems.This allows the user to have greater control overmonthly expenditure, and provides a reasonablyefficient way to eliminate bad debts. The additionof active security chips to controller, array andbattery makes it possible to reduce the potentialfor tampering and theft.Solar water pumpingSolar water-pumping systems use the sun’s energy toproduce electricity which, in turn, drives a submersibleor line-shaft pump.Solar water pumping is increasingly attractive as areplacement for hand pumps, wind pumps and dieselpumps. Between 10 000 and 20 000 systems are alreadyin operation internationally, roughly 3 000 of whichhave been installed in southern Africa. Some solarpumps have been in operation for more than 10 yearsin South Africa.Comparison of different pumping optionsGrid electricity pumpsThese are the cheapest option if grid electricity isavailable at the water source. However, extensionsof MV powerlines typically cost from R40 000 toR60 000 per km and consequently non-grid optionsare often cheaper if grid supply is not available.Diesel water pumpsThis option is widely used for off-grid applications.Although the initial costs are low there aresignificant disadvantages to diesel systems. Theseinclude very high operating costs, high levels ofmaintenance and supervision, noise and dirt, and adependence on a reliable fuel supply.Solar water pumpsThis option is applicable for off-grid applicationsand is more widely used now that farmers andauthorities are becoming more familiar with thebenefits of minimal maintenance, low operatingcosts and quiet and reliable operation.Disadvantages include the high initial costs (two orthree times the costs of diesel) and the risk of theftof solar panels.Wind pumpsThis option has been widely used on farms and inrural areas. Approximately 300 000 wind pumpshave been supplied in South Africa. Disadvantagesinclude the relatively high levels of maintenancerequired and the unreliability of the wind.Other forms of energy Chapter 12.223
GUIDELINES FOR <strong>HUMAN</strong> <strong>SETTLEMENT</strong> <strong>PLANNING</strong> <strong>AND</strong> DESIGNHand pumpsThis option is suitable for very small waterdemands (1500* Low High High MediumSolar
GUIDELINES FOR <strong>HUMAN</strong> <strong>SETTLEMENT</strong> <strong>PLANNING</strong> <strong>AND</strong> DESIGNCostsTypical comparative initial costs and operatingcosts for the different pumping options are shownin Table 12.2.9.Principles of operationSolar (photovoltaic) panels convert solar lightenergy directly into direct current (DC) electricity,which is conditioned in a controller, to an electricaloutput suitable for a DC or AC pump motor. Wateris generally pumped into a storage reservoir andreticulated to households or communitystandpipes. Figure 12.2.9 Illustrates the principlesof operation.Three of these are illustrated in Figure 12.2.10.Life-cycle costs of different pump typesTypical unit water-pumping costs (1998) fordifferent solar pump options based on 15-year lifecyclecosts are shown in Table 12.2.10.Table 12.2.10: Typical pumping costs forPUMP TYPEsolar pumps, based on15-year life-cycle costsTYPICAL PUMPINGCAPACITYUNIT COSTFOR WATERSubmersiblediaphragm / piston 0 - 400 m 4 >1,2 c/m 4pumpsSurface-mountedline shaft pumps 0 - 1 200 m 4 1,5 - 5 c/m 4Submersible multistagepumps 0 - 4 500 m 4 > 20 c/m 4Source: Borchers (1998)Planning and installation considerationsThe planning and installation considerations forsolar water pumps are generally similar to otherwater-pumping systems, except that special careneeds to be taken to minimise the risk of theft ofthe PV modules.Figure 12.2.9: Operating principles of solar waterpumpingsystemsDescription of typical solar pumpingsystemsThere are five typical configurations of solar waterpumpingsystems. They are• surface-mounted centrifugal or diaphragmsuction pumps;• floating pumps;• submersible diaphragm or piston pumps;• line-shaft-driven positive displacement pumps;and• submersible multi-stage centrifugal pumps.The risk of theft of the modules may be reducedthrough community participation and ownership,and the location of solar pumps out of sight ofopportunistic thieves (i.e not near main roads).Solar water heatingWater heating accounts for up to 40% of householdenergy consumption. Solar water heating (SWH)systems can provide water at temperatures of up to85˚C on sunny days, independently of other energysources, for a wide range of uses in urban and ruralareas. SWH systems generally have some form ofauxiliary (or backup) heating for periods of overcastweather and for short-term peak demands whichexceed the average daily output of solar-heated water.SWH systems are an attractive alternative to moreconventional water-heating systems because they havefewer negative effects on the environment and can bemore cost-effective within comparatively shortpayback periods - as little as 3-5 years (depending onthe exact application).Other forms of energy Chapter 12.225
GUIDELINES FOR <strong>HUMAN</strong> <strong>SETTLEMENT</strong> <strong>PLANNING</strong> <strong>AND</strong> DESIGNFigure 12.2.10: Three typical configurations for solar water-pumping systemsTypical applications include• domestic water heating;• hot water for public bath houses;• underfloor heating;• old age homes;• swimming pools;• horticulture / aquaculture;• small businesses: laundries; hairdressers;undertakers; caterers/restaurants;• hospitals;• school hostels.Advantages• the ability to provide 40-100% of hot waterneeds;• the use of renewable energy (avoidance ofenvironmental costs of electricity generationand transmission);• the reliability of the energy source;• the fact that it is financially cheaper (after aperiod of between 3-5 years); and• the reduction of uncertainty of monthly cashflows.• clinics; and26Chapter 12.2Other forms of energy
GUIDELINES FOR <strong>HUMAN</strong> <strong>SETTLEMENT</strong> <strong>PLANNING</strong> <strong>AND</strong> DESIGNDisadvantages• the high initial cost (twice as much as aconventional electrical “geyser”);• the need for some form of backup heating forovercast weather; and• the lack of confidence in quality assurance.This section focuses on domestic and institutional(i.e. hostels, public bath houses, hospitals andclinics’) hot-water systems.Current use of SWH systems in SASWH systems have been available commercially formany years. The supply and installation of SWHsystems experienced a significant peak in the mid-1970s as a result of the energy crisis andsubsequent focus on alternatives to fossil-fuelbasedenergy systems.SWH systems are relatively simple devices which arewell suited to local manufacture. Consequently,SWH systems offer opportunities for job creation, inaddition to electricity and energy savings. However,the relative ease of production requires carefulconsideration of quality assurance measures, toprevent poor performance and premature failure.Current estimates suggest that, by 1994, over 70 000domestic SWH systems had been installed in SouthAfrica (Energy and Development Group 1997a). SeeTable 12.2.11.When is SWH appropriate?SWH systems produce hot water whenever the sunshines, regardless of whether the hot water is used.SWH systems are therefore most suited toapplications which require consistent quantities ofhot water on a daily basis throughout the year.Solar water heating is generally not suited toapplications which require variable andunpredictable hot water demands.In the case of households, SWH should immediatelybe considered if grid electricity is not available (i.e.for use in conjunction with non-grid electricitysystems such as PV, wind or diesel units).In cases where grid electricity is available, SWHsystems may become cost-effective in 18 months toa few years (depending on the circumstances) fornew houses and new institutional applications.Although SWH systems operate well anywhere inSouth Africa, they are more appropriate in thesunny inland regions of the country.Comparative costsThe comparative (1998) costs of SWH, electricalstorage heating systems and instantaneous waterheating for a typical family of four to five personsare presented in Table 12.2.12 in terms of overalllife-cycle costs over 10 years.The cumulative costs and payback characteristicsare shown in Figure 12.2.11.Table 12.2.11:Estimated solar water-heater capacity installed in South AfricaAPPLICATION INSTALLED COLLECTOR AREA (m 2 ) COMMENTSDomestic 220 000 Approx 70 000 systemsCommercial and industrial 34 000 e.g. Milnerton Girls’ SchoolAgriculture/horticulture 2 600Swimming pools 227 000 Approx 8 000 systemsPublic bathhouses - e.g. Durban Metro, LangaSource: Borchers (1998).Table 12.2.12:Comparative water-heating costsSWH SYSTEM ELECTRICAL GEYSER ELECTRICAL INSTANTANEOUS HEATERInitial cost R3 750 R2 000 R2 400Annual operating cost R375 R950 R750Life-cycle costs R5 800 R7 100 R6 600Note: The life-cycle costs are highly sensitive to the particular application and should be established for eachspecific case. The key sensitivities are initial cost, real discount rate, operating lifetime, and utilisation of the solarheated water (or solar fraction).Other forms of energy Chapter 12.227
GUIDELINES FOR <strong>HUMAN</strong> <strong>SETTLEMENT</strong> <strong>PLANNING</strong> <strong>AND</strong> DESIGNLifecycle cost (Rand)1200010000800060004000200000Figure 12.2.11: Cumulative costs and paybackcharacteristics of SWH, electrical storage heaters andinstantaneous water heatersTypical considerations in planning for SWHsystemsWater supplyReticulated water supply, for a continuous/pressurised supply, or standpipe in the yard, for abatch-heating type of supply.Water pressure2 4 6 8 10YearsGenerally best at
GUIDELINES FOR <strong>HUMAN</strong> <strong>SETTLEMENT</strong> <strong>PLANNING</strong> <strong>AND</strong> DESIGNDirect batch heaterA small (10-50 litre) directly heated, portable SWHsystem which is filled and drawn off by hand andmanually placed in the sun.Application: Suitable for households which do nothave piped water (i.e. non-pressurised) and whichmay not be able to afford bigger or more complexsystems.Auxiliary backup heating: None.Typical cost: R100-R800 (1998).Typical output: 30-120 litres/day at 55˚C formultiple draw-offs.Suitable for freezing and non-freezing areas.adjacent to one another as a packaged, closecoupledunit. It may be pressurised
GUIDELINES FOR <strong>HUMAN</strong> <strong>SETTLEMENT</strong> <strong>PLANNING</strong> <strong>AND</strong> DESIGNsolar heating at a later stage.Upgradability requires minimal extra expense (asolar-adaptable storage tank), consideration ofsolar access (for the future collectors), and thelocation of the storage tank in a position whichallows short and inclining collector loop piping.System sizingTables 12.2.13 and 12.2.14 provide guidelineinformation for sizing SWH systems in typical SouthAfrican conditions.Figure 12.2.14: A split collector/storage solar waterheatingsystemLarge commercial or institutional systemsThese are all-purpose designed split collector/storage-type systems. They are generally forcedcirculationsystems, although thermosiphonsystems are possible if the storage tanks can belocated sufficiently high above the collector bank.As in the case of domestic SWH systems, indirectheating is required in freezing areas.Typical examples of larger systems are those at theMilnerton Girls School (Maclean 1982) and an oldage home in Durban (Forbes and Dobson 1982).Design for upgradabilitySystem designSystem design should focus on functionality andreliability. Although thermal efficiency isimportant, the utilisation of SWH systems is directlydependent on reliable operation over the fulldesign life of the system.In the case of domestic hot water systems, there aretwo applicable SABS standards:• SABS 1307:1992. Specification for domestic solarwater heaters (and two associated standard testmethods for physical durability testing andthermal performance testing).• SABS 0106:1985. Draft Code of Practice for theinstallation of domestic solar water heaters.In cases where the user/client is reluctant to spendthe full initial cost of the SWH system, it isrecommended that the (electrical) water-heatingsystem be designed so that it can be upgraded forTable 12.2.13: Typical hot water requirements for domestic and institutional purposesHOT WATER SERVICEHOT WATER SUPPLY WATER TEMPERATURE <strong>VOLUME</strong> PER DAYTEMPERATURE (DEG C) REQUIRED (DEG C) (LITRES/PERSON)Domestic 55 43 50 - 75Hospitals 65 43 120Old age homes 65 43 100Per shower 55 43 25 - 35Per bath 55 43 80 - 120Table 12.2.14: Guidelines for sizing domestic SWH systemsNUMBER OF PEOPLE LITRES OF HOT WATER SOLAR STORAGE COLLECTOR AREA (m 2 ) DUEPER HOUSEHOLD REQUIRED AT 43°C TANK SIZE (LITRES) NORTH AT LATITUDE +10°2 - 3 100 100 1,4 - 1,64 - 6 200 200 2,8 - 3,26 - 8 300 300 3,8 - 4,230Chapter 12.2Other forms of energy
GUIDELINES FOR <strong>HUMAN</strong> <strong>SETTLEMENT</strong> <strong>PLANNING</strong> <strong>AND</strong> DESIGNOther solar energy applications in SouthAfricaSolar water heaters, solar photovoltaic units and thepassive solar design of buildings remain the mostsignificant solar energy applications in South Africa atpresent.Solar energy can also be used for process heat inindustry and agriculture, but this is generally not ofrelevance to settlement-planning.In the future it is possible that other means ofgenerating electricity from solar energy will becomemore widespread. Brief details on solar thermalelectricity generation are provided in the section“Other renewable energy sources” below.Solar cookersSolar stoves and solar ovens would have greatrelevance in South Africa if they were popularlyadopted on a wide scale. They are mostly consideredas a supplementary cooking option in areas of fuelscarcity, in addition to LPG, paraffin, fuelwood andcrop residues. In particular, they could benefithouseholds struggling to collect fuelwood, cropresidues or dung for their cooking needs, and mighthelp to conserve the environment.Solar cookers generally use reflectors toconcentrate radiant solar energy either directlyonto a pot or into a glazed and insulated box(called a “box cooker” or “solar oven”). They arecapable of cooking the typical meals of rural andlow-income households. A variety of designs areavailable locally and internationally, includingsimple solar ovens, reflector-type cookers and heatpipe cookers.Experience with the promotion of solar cookers inSouthern Africa in the 1980s was disappointing.Cooking customs are deeply rooted and slow tochange (except in extreme conditions - for examplein refugee camps). However, a recent one-year,field testing project (Palmer Development Group1998) undertaken on behalf of GTZ and theDepartment of Minerals & Energy has shown highlevels of satisfaction (93%) and good utilisation(38% of all meals cooked) of a range of solarcookers.Typical costs of the cookers in this study rangedfrom R180 (Sunstove) to R4 600 (SCHW1). The studyfound clear user preference for certain cookertypes, based on utility and cost, and many of theparticipating households opted to buy a solarcooker.Solar cookers are safer than fuelstoves or fires, dueto the absence of a flame and greater stability.OTHER RENEWABLE ENERGYSOURCESThis section provides a brief description of otherrenewable energy sources which are not widely usedin South Africa at present (with the exception of windpumps), but which may be considered in specificcircumstances. The topics covered in this section are• wind power;• small hydropower;• biogas and exploitation of landfill gas; and• solar-thermal electricity generation.Wind powerWind power is usually employed either directly(mechanically) for water pumping, or for electricitygeneration.Wind pumpsWater-pumping by windmill is a well-establishedtechnology that has long been widely used inSouth Africa, mainly in rural areas but also in smalltowns. The familiar “American farm windpump”design (with a large number of blades) is wellproven, efficient for water pumping, and locallyavailable from a number of manufacturers. Morethan 300 000 windpumps of this type have beeninstalled in the country (Cowan 1992) although notall would still be in operation. These types ofwindpump are particularly suited to pumpingrelatively small quantities of water from deepboreholes, using positive-displacement pumpmechanisms (e.g. for livestock watering) and can beused in areas with quite low average wind speeds(e.g. 3 ms -1 ) but are more likely to be a costcompetitiveoption if wind-speeds average 4 ms -1or more. Regular basic maintenance is required fortrouble-free operation, and partly for this reasonthere has been a trend in countries such as SouthAfrica and the United States to move towards solarPV pumps for typical ranch and game parkapplications (in areas without grid electricity).The use of wind pumps for community watersupplies in rural areas has so far not had a verygood record in South Africa. The main problemsappear to have been unreliable maintenance, lackof community involvement and ownership(Wiseman 1992), and sometimes unreliablesupply/storage of water due to variations in windenergy at different times of the year, and from yearto year. Any decision to use wind pumps for acommunity’s water supply, and the design ofsuitable installations, should take account of• community water needs (quantities, quality,reliability);Other forms of energy Chapter 12.231
GUIDELINES FOR <strong>HUMAN</strong> <strong>SETTLEMENT</strong> <strong>PLANNING</strong> <strong>AND</strong> DESIGN• the nature and reliability of the water-supplysource;• the availability of reliable wind-speed data;• the adequacy of the local wind resource,especially in the calmest months;• linked to this, the amount of windmilloversizing and water storage required toprovide a reliable supply (or else the availabilityof back-up water supplies);• water-treatment facilities;• reliable provisions for routine maintenance andspeedy repair; and• the comparative costs and advantages/disadvantages of alternative water-pumpingoptions.A good guide to wind pump sizing, design andeconomics is Van Meel and Smulders (1989). SouthAfrican wind pump suppliers have considerableexperience and can provide practicalrecommendations, sizings, costings, etc.Wind-powered electricity generationThe use of wind energy for electricity generation isone of the fastest-growing developments in theworld energy industry at present. Electric windturbine generators have been used for decades foroff-grid electricity (e.g. on farms) but large-scalewind farms feeding power into national grids aremore recent. In areas of the world where there arefavourable wind resources for electricitygeneration (greater than 6,5 ms -1 mean windspeeds,preferably higher) and where other sourcesfor electricity generation are expensive orinadequate, grid-connected wind farms arefinancially viable.Grid-connected wind generationLarge, efficient and reliable wind turbines involvehigh-technology design and manufacture. Themost cost-efficient machines used to be in the rangeof a few hundred kilowatts (rated power) but,through technical advances, now generate 1-1,5MW. In the competitive world market for such windturbines, there are a number of internationalmarket leaders. This leading-edge technology isconsidered mature and reliable, but still advancing.Typical costsTypical international capital costs and electricitygeneration costs for large-scale wind farms in 1997were in the region of 4-5 US cents per kWhgenerated, in locations with very good windresources.The costs per kWh are highly dependent on windspeeds, because available wind power isproportional to the cube of the wind velocity.Locations for viable wind farms typically haveannual wind speeds in the range 6,5-10 ms -1 .Dependence on wind speedsThe total power of a wind, moving through an areaof A m 2 with velocity V ms -1 , is given by 0,5 AV 3 ,where is the density of the air in kg.m -3 (typically1,2 kg.m -3 at sea-level, 1,0 kg.m -3 at 1 500 maltitude). Not all this kinetic energy can becaptured by a wind turbine. There is a theoreticalmaximum which can be captured - about 59% ofthe total power, known as the Betz maximum; theactual power captured is always less than this.Table 12.2.15 shows the dependence of maximumpower on wind velocities.Table 12.2.15:2 4 24 35 216 119 708 282 16610 550 32512 950 56114 1 509 890Note: For air density 1,1 kg.m -3.Maximum wind-powerflux (Wm -2 ) for differentwind speedsWIND SPEED TOTAL WIND MAXIMUM USABLE(ms -1 ) POWER (Wm -2 ) WIND POWER (BETZMAXIMUM, Wm -2 )Wind turbines can be designed to obtain their peakefficiency at lower or higher wind speeds.However, this does not alter the fact that much lessusable power is available from lower-speed winds.The rated power of a wind turbine is specified for aparticular wind speed (often 10 ms -1 or more). If a1 MW machine is rated for a windspeed of 10 ms -1it may deliver only 200 kW at a windspeed of 6 ms -1 ,or 600 W at 4 ms -1 .This strong dependence on wind speeds illustratesthe vital importance of having (a) sufficiently good32Chapter 12.2Other forms of energy
GUIDELINES FOR <strong>HUMAN</strong> <strong>SETTLEMENT</strong> <strong>PLANNING</strong> <strong>AND</strong> DESIGNwind resources, and (b) reliable wind data whenassessing and approving the feasibility of windgenerationschemes. A 10% error in estimating thewind resource could lead to a 30% error inestimating the costs of generating electricity.Energy “storage” through grid connectionAvailable wind power at a particular site variesfrom hour to hour, day to day and year to year.Connection to the national grid can provide a“storage” buffer. For example, a wind farm canprovide for a local municipality’s needs whensufficient wind power is available, and export tothe national grid when there is a surplus. Whenthere is a deficit, power from the national grid isimported. South African wind regimes tend to behighly variable, particularly in higher-wind areasaffected by cyclic weather patterns.Financial and regulatory issues include the tariffs atwhich surplus wind-generated electricity will bepurchased by the grid utility, the obligation on theutility to purchase surplus generation (ifapplicable) and the licensing conditions for theindependent power producer (IPP), if applicable.None of these has yet been fully established inSouth Africa, but policies are on the table to pavethe way for fair access to the national transmissionnetwork by IPPs.Applicability of grid-connected windgeneration in South AfricaIt seems unlikely that the South African nationalgrid, or the Southern African Power Pool, willincorporate significant wind-generation sources inthe next ten years. The main reason is thatelectricity-generation costs from South Africancoal-fired power stations and from regionalhydropower are less than half the best-case costsfor wind generation. In the longer term, increasesin the cost of coal-fired electricity generation, andpressures to rely increasingly on renewable formsof energy, may encourage more extensive use ofwind energy. Pilot wind farms could be justifiedpartly on the grounds of establishing experiencefor such longer-term developments.In the short term, such pilot projects would usuallyrequire an element of subsidisation orconcessionary loan finance in order to beeconomically sustainable. In specific situations therequired subsidy element may be small - forexample where:• a municipality cannot obtain an adequatenational-grid supply for less than say 25-30cents/kWh, and/or is willing to pay acomparable amount for wind-generatedelectricity;• existing transmission lines are adequate formaximum imports/exports;• local wind-speeds average more than 7 ms -1 (atthe hub-height of the wind turbines); and• there is sufficient local demand for windgeneratedelectricity to allow for wind projectslarge enough to achieve economies of scale, tojustify the maintenance infrastructure, etc (e.g.several MW) .In such a situation, a detailed feasibility assessmentfor localised wind-farm electricity generationwould be warranted. To date, no wind farms havebeen established in South Africa, although apromising scheme in Darling (Western Cape) is atan advanced feasibility stage.International interests in promotingenvironmentally sustainable energy are favourablefor obtaining “green” concessionary finance forsuch wind schemes. In many parts of the worldwhere wind generation is already financially viablewithout any subsidy, commercial and developmentbanks are widely engaged in wind finance.Preliminary steps for feasibility assessmentsThere are two primary questions in any SouthAfrican feasibility assessment for a potential gridconnectedwind generation scheme:• Are the wind resources in the identified localitysufficiently good for cost-effective windgeneration?• If so, can wind generation be cost-competitivewith other electricity-supply options in thislocality (taking into account any environmentalsubsidies for wind generation, if applicable)?In South African conditions, it is very unlikely thatgrid-connected wind schemes could deliverelectricity for less than the international best costsof 4-5 US cents/kWh. Therefore, if this cost is out ofrange for consideration, a detailed feasibilityassessment is probably not warranted.Assessing wind resources accurately is expensiveand a detailed assessment for wind-farm costingand siting should preferably be undertaken byexperts. Before one proceeds to this stage,however, an initial rough assessment of windenergy potential in the proposed locality can beundertaken:• Check published wind data (e.g. Diab 1995). Isthere evidence to suggest promising windspeeds in the region (e.g. an annual meanaround 6 ms -1 or more)? Is there insufficientOther forms of energy Chapter 12.233
GUIDELINES FOR <strong>HUMAN</strong> <strong>SETTLEMENT</strong> <strong>PLANNING</strong> <strong>AND</strong> DESIGNevidence to judge? Or is there evidence thatannual mean wind speeds are generally toolow?• Check available sources of wind data for thearea. How close are the nearest measuringstations? Are the measuring instrumentsaccurate, well maintained and well exposed? Isthe data sufficiently long-term to be reliable?• Consider topography. Are there localitieswhere wind enhancement is expected (e.g. longsmooth slopes, “necks”, etc)? Is the terrain toocomplex to make valid use of existing availabledata? Is turbulence a potential problem (e.g. inmountainous terrain)?• Consider environmental acceptability (distancefrom dwellings, visibility impacts) and land-use.Suitable wind data for initial cost estimates shouldconsist at least of frequency distributions of hourlywind speeds, per month, covering a period of twoyears or more. These can be multiplied by the“power curves” of suitably sized wind-turbinegenerators, to estimate the expected electricitygeneration per year, leading to an initial costestimate, and a decision whether to proceed tomore detailed site-specific wind monitoring. Windturbine manufacturers/suppliers would normally bepleased to assist.If available wind data is not adequate for an initialassessment, preliminary site-specific monitoringcan be considered, for example by installing asuitably located mast with accurate anemometersat two heights (to measure wind shear) andreliable data-logging. However, given the timeimplications (at least a year of data collection forpreliminary assessment and more than this fordetailed assessment) it is advisable to have astrategy for combining these, and expert advicewould be useful. The basic techniques for initialassessment are covered well in Lysen (1982).The broader steps in planning and implementing awind-energy plant are covered well in the“European best practice guidelines for wind energydevelopment”, which is produced by and obtainablefrom The European Wind Energy Association, e-mailaddress 10175.1101@compuserve.com.Off-grid wind generationWind power can be used for electricity supply inoff-grid areas, either in the form of windcharger/batterysystems or more complex hybridpower systems (where several types of electricitygeneratingsources are combined - e.g. wind,diesel, solar).In localities with average annual windspeeds above4 m/s, even small wind turbines can generateelectricity at a lower R/kWh cost than solar PVsystems (Cowan et al 1992), but the problem is thatthe electricity supply from a wind turbine can bevery variable in South African climatic conditions.In periods of high wind, much more energy isgenerated than in periods of low wind. Therefore,if the high-wind periods are interspersed with lowwindperiods, a large amount of energy storage isneeded to cover the lulls and profit from the peaksin electricity generation, in an optimal way.In a stand-alone wind/battery system, batterystorage/cycling of energy is expensive, adding atleast R1-2/kWh to the electricity-generating cost. Itis not cost-effective to install sufficient batterycapacity to store the full amounts of electricitygenerated during high-wind periods, and thispushes up the average generating costs of usableenergy. As a result, the net costs of off-gridelectricity from wind/battery systems are expectedto be higher than for PV/battery systems, accordingto computer modelling for the wind regimes inCape Town, Port Elizabeth, Alexander Bay and allother major weather data stations in South Africa(Cowan et al 1992).There is a different situation, however, if windgenerators are used in a “hybrid system”configuration for off-grid power supply. Bycombining different sources of electricity it ispossible to level out the electricity supply. To someextent, the combination of wind and solar PVgenerators can be complementary (especially inareas where higher winds occur during “bad”weather) but the strongest advantages occur whena controllable electricity source such as a diesel (orother engine) generator forms part of the hybridsystem. This can reduce the amount of energystorage required, thus reducing costs, and providea versatile power system for covering peaky andvariable loads.Such hybrid systems are worth considering• for medium-load demands (e.g. 5-100 kWh/day,although there is no fixed upper limit - that willdepend on the cost-competitiveness of otheroptions, in the local circumstances);• where the load profile is too irregular to permitthe use of diesel generators at consistently highcapacity factors (this pushes up the operatingand maintenance costs of a simple gensetpower supply); and• where skilled maintenance and diesel fuel canbe provided on a regular basis.34Chapter 12.2Other forms of energy
GUIDELINES FOR <strong>HUMAN</strong> <strong>SETTLEMENT</strong> <strong>PLANNING</strong> <strong>AND</strong> DESIGNBefore including a wind generator in such a system,reasonably accurate wind-speed data should be tohand. It is likely that a partial contribution fromwind generation could be technically economical ifmean wind speeds are above 4-4,5 m/s. However,the extra complexity of a hybrid system (includingthe maintenance tasks, and the more complexsystem control gear required for optimalperformance) should be taken into account. Formore detailed information on hybrid-system designand applications, a manual and software designtool is available from the Department of Mineralsand Energy in Pretoria (Seeling-Hochmuth 1998).Applications in South AfricaStand-alone wind-battery systems have been usedin applications such as off-grid coastal holidayhomes (usually less than 1 kW), and occasionally inlarger applications, such as at remote schools. Forlarger applications, however, it is more common tocombine wind generators with diesel or some otherform of power back-up.Hybrid wind-PV systems are being employed at asmall number of rural clinics. Hybrid wind-dieseland wind-diesel-PV systems have been used quiteextensively on off-grid commercial farms, forexample in the Northern Cape.There is considerable interest in exploring thepotential of such hybrid systems to supply powerfor local mini-grids, in communities far from thegrid. This would provide a higher level ofelectricity service than individual solar homesystems, and may therefore be more attractive toconsumers. However, the comparative costs havenot yet been fully investigated. The viability islikely to depend on government policy decisionsabout rural electrification subsidies as well as localconditions (load density, energy resources, capacityfor maintenance, etc). Hybrid systems for remoteareapower supply have been particularly welldeveloped in Australia, but are not yet common forcommunity electricity supply in South Africa.Small hydropowerWorldwide, hydropower is the largest application ofrenewable energy, producing more than 20% of theworld’s electricity. Within South Africa’s borders thepotential for large-scale hydropower is limited, due towater shortage, but the broader Southern/CentralAfrican region has great potential. It is likely thatelectricity from hydropower will play an increasinglyimportant role in the Southern African Power Pool.This section, however, is concerned with small-scaleapplications of hydropower as an alternative toelectricity from the national grid. Under suitableconditions, small hydropower plants can supplyelectricity at a lower cost than other off-gridelectricity-supply options such as PV, wind or dieselgenerators.Definitions of “small”, “mini” and “micro” hydropowervary. Typical definitions (Fraenkel 1996) are• small-scale hydropower: < 10 MW;• mini-hydropower: < 500 kW; and• microhydropower: < 100 kW.Off-grid hydro plants in South African conditions aremost likely to occur in the “micro” range. Eskom, forexample, has focused on the development and testingof < 15 kW turbines for off-grid remote applications(Beggs 1996).Applications in South AfricaOff-grid hydropower plants have been used forfarm power and water pumping, for institutionaluse (e.g. electricity for boarding schools) and, to alimited extent, for local-area grids providingcommunity electricity supply. It is estimated thatseveral hundred micro-hydropower systems havebeen installed in the country. The main limitingfactors are• the availability of suitable hydrologicalconditions (see below);• the ability to match the hydropower supply tolocal electricity demand; and• thecomparative costs of grid electricity.Typical configurationsMicro-hydropower configurations are usually “runof river”, that is, they make use of the flow of ariver and natural gradients, rather than the head ofdams.Figure 12.2.15 shows typical elements of a microhydropowerinstallation. A penstock delivers waterat pressure to a turbine. The penstock is often asignificant cost element, requiring piping ofsufficient strength and diameter to handle thewater pressure, flow and shock forces. For thisreason, depending on the physical characteristics ofthe site, it is common to construct a graduallysloping canal (gradient 1:500 to 1:1 000) from thewater intake to the penstock forebay, in order toreduce the length and cost of the penstock piping.However, in some site conditions, a canal may beunnecessary or impractical.Other forms of energy Chapter 12.235
GUIDELINES FOR <strong>HUMAN</strong> <strong>SETTLEMENT</strong> <strong>PLANNING</strong> <strong>AND</strong> DESIGN2,5CanalForebayPenstockPowerhouse and turbineIntakeRiverCubic metres/second21,510,550 kW20 kW10 kWTailrace0010 20 30Gross head (metres)Figure 12.2.15: Schematic of typical microhydropowerlayoutThe design of micro-hydropower installations iscovered well in many texts (e.g. Harvey 1993;Inversin 1986).Requirements for cost-effective applicationsThe cost-effectiveness of off-grid hydropower ishighly site-specific. It depends mainly on thehydraulic power available (water flow rate andhead), the civil construction required, the size andload profile of electricity demand in the locality,and (where applicable) the cost of distributing theelectricity.Hydraulic powerThe gross hydraulic power P gross (kW) availablefrom a vertical head of h gross (m) and volume flowrate Q (m 3 s -1 ), is given byP gross = 9,8 x Q x h grossAfter frictional losses, transmission losses, etc, thenet electrical power P net (kW) which can bedelivered is usually about 40-60% of the grosshydraulic power (Harvey 1993), leading to theapproximationP net ≈ 5 x Q x h gross(kW).Figure 12.2.16 shows approximate net electricalpower for a range of flow rates and heads.Flow rates can be measured by a variety oftechniques, including• installing a notched weir across the river - thewater level above the notch indicates flow rate;and• the “salt gulp” method - where salt water ispoured into the river upstream and aconductivity meter is employed downstream torecord the rate at which the salt cloud passes(Harvey 1993).Figure 12.2.16: Approximate net electrical power as afunction of flow rates and gross headsAccount must be taken of variations in flow rate,requiring measurements at different times of year.Estimates of year-to-year variations can be made bylooking for correlations between suchmeasurements and longer-term records (e.g.records of water flow for gauged rivers in thesame/nearby catchment area) or more detailedhydrological assessments.Civil constructionThis can include a weir for intakeprotection/regulation, the intake itself, a floodspillway, silt basin, canal, forebay tank with siltbasin and spillway, penstock (and anchors),powerhouse and tailrace. Costs (and optimumdesign choices) are affected by labour costs,accessibility and cost of materials.The proportion of total capital costs attributable tocivil works will therefore vary (averaging perhaps40% in Nepal and Sri Lanka - see Table 12.2.16) andwill strongly affect viability.Electricity demand characteristicsTotal demandMicro-hydropower schemes can show economies ofscale. Assuming that sufficient hydraulic power isavailable throughout the year, the costeffectivenessis increased for higher load demands.Conversely, if the available hydraulic power isinsufficient/unreliable, more expensive back-upsmay be required to meet energy needs, raising theoverall cost.Load factor and capacity factorHydropower plants have relatively high capital costsand low operating and maintenance costs. Run-ofriverhydropower plants do not have significantenergy storage, and are therefore most economicalwhen the electricity generated can be fully utilised.If the combined loads are very peaky (e.g. electricityconsumption mainly for domestic cooking and36Chapter 12.2Other forms of energy
GUIDELINES FOR <strong>HUMAN</strong> <strong>SETTLEMENT</strong> <strong>PLANNING</strong> <strong>AND</strong> DESIGNTable 12.2.16:Examples of microhydropowercapital costproportionsNEPALSRI LANKA• distance from the hydropower station and spatialdensity of consumers; and• consumption levels and load factor perconnection.Penstock 12 % 21 %Other civil works 19 % 13 %Electro-mechanical 27 % 48 %Engineering cost 14 % 12 %Distribution 28 % 6 %Total 100 % 100 %Source: Harvey (1993)lighting) the load factor will be low (average kWconsumed ÷ maximum kW consumed) and thehydropower plant is likely to operate at a lowannual capacity factor (kWh/year useful output ÷maximum kWh/year that could be generated).Oversizing the hydropower plant will also result inlow capacity factors. Low capacity factors meanhigher unit energy costs, because less benefit isderived from the initial investment. Microhydropowerviability is therefore improved if• combined load demand is not too peaky(preferably with peaky loads smoothed out bysteadier base loads);• load demand can adjust to any seasonalvariations in hydropower generation capacity;and• plant capacity factors are high.Electricity distributionLarge distances between consumers, with lowconsumption levels and low load factors, willadversely affect the economics of a hydropoweredmini-grid.In situations where a number of isolated loadcentres are to be connected (e.g. a number ofscattered schools in a district) the use of lower-costtransmission by SWER (single wire earth return)may be indicated. Such a scheme, undertaken byEskom Non-Grid Electrification, is reported inDooge (1996).Typical costsIt is difficult to give general cost guidelines formicro-hydropower electricity supply, because thecosts are site-specific. Capital costs for theturbine/generator can be in the region of R3 000/kW(1998 estimate). An indication of the breakdown ofthe total capital costs (based on figures from Nepaland Sri Lanka) is given in Table 12.2.16.In 1992, typical South African micro-hydropowerunit electricity costs, levelised over a 20-year systemlife, were estimated as given in Table 12.2.17.These figures should be inflated by 60-100% togive comparable 1998 estimates. They still showthat micro-hydropower can be the cheapest offgridelectricity source, in suitable conditions.In cases where hydropower is used for a local grid,supplying many consumers, the electricitydistribution costs are likely to be similar toconventional grid distribution. Average electricitycosts per consumer, including distribution costs, willbe affected byTable 12.2.17:Typical supply costs of micro-hydroelectric power (1992 estimates,excluding reticulation)HEAD/SLOPEDAILY DEM<strong>AND</strong>CAPACITY FACTORS0,25 0,4Head 10 m 5 kWh 74 c/kWh 68 c/kWhSlope 1:10 25 kWh 30 c/kWh 23 c/kWhHead 10 m 5 kWh 95 c/kWh 84 c/kWhSlope 1:50 25 kWh 39 c/kWh 32 c/kWhSource: Cowan et al (1992)Other forms of energy Chapter 12.237
GUIDELINES FOR <strong>HUMAN</strong> <strong>SETTLEMENT</strong> <strong>PLANNING</strong> <strong>AND</strong> DESIGNBIOGAS <strong>AND</strong> L<strong>AND</strong>FILLSBiogas and landfill gas are both potential sources ofenergy for heating and lighting applications in SouthAfrica. In both cases, methane gas (also known asmarsh gas) is produced from a process of digestion oforganic waste material. This methane gas can becollected, stored and reticulated for use in householdsand small businesses. The gas may be used directly insuitably adjusted appliances or indirectly in gensets forelectricity generation.Biogas is highly dependent on a reliable and suitablesupply of organic waste (animal manure and plantmaterial) and water. Landfill gas is available only fromlandfill sites.Consequently, neither option is generally applicablebut there are a number of successful applicationswhich could be replicated. Many municipal sewageworks produce biogas as a by-product of thetreatment process. This biogas is usually used on site,and not supplied to the surrounding communities.Interestingly, communal household biogas digestershave been widely used in China to handle thedigestion of human waste (primarily) and to producebiogas for heating and cooking.In the case of landfill gas, there are at least two SouthAfrican applications of note. These include theGrahamstown landfill project, which supplies anadjacent brick kiln, and one of the Johannesburglandfills which provides methane to the chemicalindustry.Biogas productionBiogas is produced in a purpose-built biogasdigester. The digester comprises an airtightcontainer into which raw waste can be poured,together with water, as a slurry and from whichmethane gas can be collected under some pressure.There are many configurations of digester,including the underground “Chinese”, or fixeddomedigester, and the “Indian” or floating-dome,digester.The methane is produced by anaerobic digestion oforganic matter. The production of methane ishighly sensitive to temperature and increasesdramatically at higher than ambient airtemperatures. The added complexity of auxiliaryheating of the digester cannot always be justifiedby the extra production obtained.Landfill gas productionLandfill gas is automatically produced in landfills asa result of decomposition of the organic content ofmunicipal refuse collections. This gas is a potentialexplosion hazard if it is not managed properly andcan be utilised productively by creating sealedlandfill compartments and extraction wells (similarto boreholes)Solar-thermal electricity generationPhotovoltaic panels provide a simple, lowmaintenanceoption for generation of electricity fromthe sun. However, as discussed in the section on solarphotovoltaic electricity supply, the per-unit energycosts are relatively high, and there is little size-relatedreduction in cost as plant size increases. A potentiallylower-cost alternative for both small- and large-scalegrid-connected plants is to use concentrators to focussunlight to heat a working fluid, which is then used todrive a conventional thermodynamic power cycle.Thermal-energy storage and/or supplementation withgas-fired burners can be used to deliver power overextended periods. Given the high levels of solarradiation available in parts of South Africa, there hasbeen considerable interest in the possibledevelopment of such large-scale grid-connectedplants. At present, however, the generation costswould be higher than for South African coal-firedpower stations.Four main technology options are potentially suitablefor grid connection. Parabolic dish systems also havethe potential to be used in smaller-scale applications (5kW or larger), either as part of a grid-connecteddistributed generation system, or for mini-grid orstand-alone applications.Parabolic trough-based systemsThese systems focus sunlight energy onto heaterpipes contained within evacuated tubes locatedalong the focal axes of parabolic troughs. Insulatedpiping connects a field of troughs to a steamgenerator (with natural gas backup), used to drivea conventional Rankine Cycle turbine-generator.This technology is well established, with a numberof plants having been installed. A series of eightplants with a total output of 354 MW has beenoperating since the late 1980s in California.Demonstrated peak efficiencies of 20% have beenachieved.Power-tower systemsThese systems use an array of heliostats (large,individually tracking mirrors) to focus sunlight ontoa receiver located at the top of a tower. Here theenergy can be used either to generate steam todrive a Rankine Cycle, or to heat air to drive a38Chapter 12.2Other forms of energy
GUIDELINES FOR <strong>HUMAN</strong> <strong>SETTLEMENT</strong> <strong>PLANNING</strong> <strong>AND</strong> DESIGNBrayton Cycle machine. Several power-tower plantshave been established, with the recentlycommissioned (1996) “Solar Two” projectdemonstrating integration of molten-salt thermalstorage technology.Dish-Stirling or Dish-Brayton cycle machinesThese systems are generally much smaller (of theorder of 5-50 kW) per machine. A Stirling orBrayton (gas turbine) machine is mounted at thefocal point of a parabolic dish. A large power plantwould require a field of such engines to beinstalled. They are, however, potentially well suitedto distributed generation or even stand-aloneapplications, such as for a mini-grid or for specifichigher load applications in rural areas. Dish-Stirlingsystems currently hold the record for system solarto-electricityconversion efficiency at 29,4% andcan generate AC power directly. The Stirlingenginegenerator unit also has the potential to bepowered by gas or biomass. This allows greaterproductivity of the capital invested and thepotential for night-time or weather-independentpower, without relying on expensive batterystorage.Solar chimneyThis somewhat unusual approach involvesconstruction of an enormous glass-coveredexpanse, with the exterior perimeter open andsurrounding a tall chimney (perhaps 750 to 1500 mhigh in current conceptual designs beingconsidered in South Africa). Solar radiation wouldheat the air trapped under the glass, lowering itsdensity. As a result it would then rise up in thechimney, generating wind speeds in the chimney ofthe order of 15 ms -1 . Wind turbine technology canthen be used to generate power. Unlike thetechnologies described above, solar chimney plantsare expected to have low efficiencies (of the orderof 1%).None of the above technologies is currently at astage where commercial utilisation in South Africacould be justified on financial or economicgrounds. However, given the excellent solarresource in parts of the country, the potentialreductions in cost that are expected for some ofthese technologies, and increasing environmentalconcerns regarding fossil-fuel utilisation, the futureprospects for solar thermal power generation maybe good. Particular niche markets include regionsremote from the grid, or sites where transmissioncosts result in added cost for conventionallygenerated power. EPRI & DOE (1997) provide anexcellent review of the technical and economicstatus of solar thermal technologies, from whichmuch of the above material has been drawn.Other forms of energy Chapter 12.239
GUIDELINES FOR <strong>HUMAN</strong> <strong>SETTLEMENT</strong> <strong>PLANNING</strong> <strong>AND</strong> DESIGNBIBLIOGRAPHYAsamoah, J K, Surridge, A D and Grobbelaar, C J (1998).Low-smoke fuel programme: preliminary results of themacro-scale experiment. Department of Minerals andEnergy, Pretoria.Beggs, S L (1996). Fulfilling small hydro’s worldwidepotential. In Cross, B (ed): World Directory ofRenewable Energy, pp 102-105. James & James,London.Borchers, M L (1998). Solar water pumping forcommunities. Draft guidelines for Department ofWater Affairs & Forestry. Energy & DevelopmentGroup, Noordhoek.Borchers, M and Hofmeyr, I-M (1997). Ruralelectrification supply options to support health,education and SMME development. Energy &Development Research Centre, University of CapeTown.Burberry, P (1983). Practical thermal design inbuildings. Batsford Academic and Educational,London.Cowan, W D, Borchers, M L, Eberhard, A A, Morris, G Jand Purcell, C J de V (1992). Remote Area PowerSupply design manual. Energy & DevelopmentResearch Centre, University of Cape Town, andDepartment of Minerals & Energy, Pretoria.Cowan, W D (1996). Code of practice for installing lowvoltagePV power systems. Energy & DevelopmentResearch Centre, University of Cape Town.<strong>CSIR</strong>, Division of Building Technology (1997). Solarcharts for the design of and sunlight and shade forbuildings in South Africa. BOU/E9701. <strong>CSIR</strong>, Pretoria.Davis, M (1995). Electricity consumption growth innewly electrified settlements. EDRC Report series,Energy & Development Research Centre, University ofCape Town.Diab, R (1995). Wind energy atlas of South Africa.Department of Minerals & Energy, Pretoria.DME (1996). Energy in South Africa: informationbooklet, Revision 1. Department of Minerals & Energy,Pretoria.Dooge, G R (1996). Implementation of a micro-hydropower supply scheme in the KwaZulu-NatalDrakensberg. Report No. TRR/NGE96/022, EskomTechnology Group, Cleveland.Eberhard, A A (1990). A solar radiation datahandbook for Southern Africa. Elan Press, Cape Town.Eberhard, A A and Van Horen, C (1995). Poverty andpower: energy and the South African state. Pluto Press,London, and UCT Press, Cape Town.Energy & Development Group (1997). HouseholdEnergy Action Training. Energy & Development Group,Noordhoek.Energy & Development Group (1997a). FINESSE SouthAfrica country study. UNDP and SADC TAU, Luanda.EPRI & DOE (1997). Renewable Energy TechnologyCharacterisations, TR-109496. Energy Efficiency andRenewable Energy. US Department of Energy andElectric Power Research Institute.Eskom (1996). Eskom Statistical Yearbook. Eskom,Megawatt Park, Sandton.Everett, A (1970). Mitchell’s building construction:materials. Batsford Limited, London.Fecher, R (1998). The real cost of conserving energy:Energy efficiency in low-income urban households.EDRC Report series, Energy and Development ResearchCentre, University of Cape Town.Forbes, J A and Dobson, D E (1982). A case study of alarge SWH system in an old age home in Durban.Report R/BOU 1040, <strong>CSIR</strong>, Pretoria.Fraenkel, P (1996). Future development potential forsmall scale hydropower. In Cross, B (ed): WorldDirectory of Renewable Energy, pp 98-101. James &James, London.Gandar, M (1994). Afforestation and woodlandmanagement in South Africa, Paper No. 9, SouthAfrican Energy Policy Research and Training Project,Energy for Development Research Centre, Universityof Cape Town.Gentles, G A (1993). The development of a means ofcomparing the relative usefulness of various energycarriers in the domestic environment. Report No.TRR/P93/103/mw, Eskom Technology Group, Cleveland.Graham, J A N (1997). The determination of emissions,efficiencies and the cost-effectiveness of variousdomestic appliances used for cooking and heating inSouth Africa. Journal of Energy in Southern Africa, Vol8, No 4, November, pp 105-112.Hankins, M (1995). Solar electric systems for Africa.Commonwealth. Science Council and Agrotec, Harare.Harvey, A (1993). Micro-hydro design manual: A guideto small-scale water power schemes. IntermediateTechnology Publications, London.40Chapter 12.2Other forms of energy
GUIDELINES FOR <strong>HUMAN</strong> <strong>SETTLEMENT</strong> <strong>PLANNING</strong> <strong>AND</strong> DESIGNHofmeyr, I-M (1994). Farmworker families: Towardsequitable and adequate energy provision. EPRET,Paper No 8, Energy for Development Research Centre,University of Cape Town.Holm, D et al (nd). Passive thermal design in housing.National Energy Council, Pretoria.Holm, D (1996). Manual for energy conscious design.Department of Minerals & Energy, Pretoria.Holm, D and Viljoen, R (1996). Primer for energyconscious design. Department of Minerals & Energy,Pretoria.IEC 61427-1 (1998). Secondary cells and batteries forsolar photovoltaic energy systems: B. Part 1: Generalrequirements and methods of test. InternationalElectrotechnical Commission, Geneva.Inversin, A R (1986). Micro-hydropower source book: Apractical guide to design and implementation indeveloping countries. NRECA InternationalFoundation, Washington.Lawrence, V, Buttle, R and Van Rensburg, H (1993).Domestic water heating: Requirements for dwellingsin the developing sector. NELF Synthesis ReportWGEU01, Eskom Technology Group, Cleveland.Lysen, E H (1982). Introduction to wind energy.Consultancy Services Wind Energy DevelopingCountries, Amersfoort, Netherlands.Maclean, D I (1982). The performance of the SWHsystem at the girls hostels at Milnerton School. R/BOU1045, <strong>CSIR</strong>, Pretoria.NRS 052:1998 (draft). Technical specification for PVsystems for use in individual homes. NRS Project forthe rationalisation of user specifications, EskomMegawatt Park, Sandton.Palmer Development Group (1998). Solar cooker fieldtest: Phase 1. Department of Minerals & Energy,Pretoria.PASASA (1997). Proceedings of the Safe PackagingConference, Paraffin Safety Association of SouthernAfrica, 24-27 February, Cape Town.QUICK II, (1998). Temm International Pty Ltd., Arcadia,Pretoria.SABS 087:1975. Code of practice for consumerliquefied petroleum gas cylinder installations. Part 1.South African Bureau of Standards, Pretoria.SABS 1539:1991. Code of practice for appliancesoperating on liquefied petroleum gas. South AfricanBureau of Standards, Pretoria.SABS 0142:1993. South African Standard Code ofPractice for the wiring of premises. South AfricanBureau of Standards, Pretoria.Seeling-Hochmuth, G (1998). Hybrid systems design asapplied to RDP projects in rural areas. Energy &Development Research Centre, University of CapeTown.Shackleton, C M (1994). Growing more trees forfuelwood in the Northern Transvaal or redistributionafter sustainable harvesting? Development SouthAfrica, Vol 11, No 4. November.Simmonds, G (1997). Financial and economicimplications of thermal improvements. Energy &Development Research Centre, University of CapeTown.Temm International (1997). Strategic Planning for DSMthrough thermal efficiency in houses. TemmInternational, Pretoria.Terblanche, A P S, Danford, I R and Nel, C M E (1993).Household energy use in South Africa, air pollutionand human health. Journal of Energy in SouthernAfrica, Vol 4, No 2.Thom, C (1994). The application of biogas technologyin South Africa for small-scale energy production. MScdissertation, Energy and Development ResearchCentre, University of Cape Town.Thorne, S (1995). Energy efficiency and conservationpolicy: policy options for low-income households inSouth Africa. Msc (Eng) dissertation, Energy andDevelopment Research Centre, University of CapeTown.Van Horen, C, Dickson, B and Simmonds, G (1995).Market interventions to promote low-smoke fuels.Department of Mineral & Energy Affairs, Pretoria.Van Horen, C, Nel, R and Terblanche, P (1996). Indoorair pollution from coal and wood use in South Africa:an overview. Energy for Sustainable Development,Volume III, No 1, May, pp 38-40.Van Meel, J and Smulders, P (1989). Wind pumping: Ahandbook. World Bank Technical Paper number 101.World Bank, Washington..Van Wyk, S L and Mathews, E H (1996). Technical note:Improvements to the energy efficiency of shacks. R&DJournal, Vol 12, pp 108-112.Weggelaar, S and Mathews, E H (1998). Reducingenergy consumption in shacks by the use of low-costinsulation. Proceedings: Domestic use of ElectricalEnergy Conference, Cape Town.Other forms of energy Chapter 12.241
GUIDELINES FOR <strong>HUMAN</strong> <strong>SETTLEMENT</strong> <strong>PLANNING</strong> <strong>AND</strong> DESIGNWentzel, J D, Page-Shipp, R J and Venter, J A (1981).The prediction of the thermal performance ofbuildings by the CR-method. <strong>CSIR</strong>, Pretoria.Williams, A (1993). Energy supply options for lowincomeurban households. EPRET, Paper No 11, Energyand Development Research Centre, University of CapeTown.Wiseman, K (1992). Technology, community and watersupply: Case studies in Kwazulu and Transkei. ReportNo 4, Energy Research Institute, University of CapeTown.42Chapter 12.2Other forms of energy