White Paper - DWS Investments
White Paper - DWS Investments
White Paper - DWS Investments

Create successful ePaper yourself
Turn your PDF publications into a flip-book with our unique Google optimized e-Paper software.
The Euro Crisis<br />
and Its Implications<br />
Your entry<br />
to in-depth<br />
knowledge in<br />
finance:<br />
www.DGFI.com<br />
<strong>DWS</strong> | GLOBAL FINANCIAL INSTITUTE<br />
July 2012 Dr. Bodo Herzog
2<br />
AUTHOR <strong>DWS</strong> | GLOBAL FINANCIAL INSTITUTE<br />
DR. BODO HERZOG<br />
Professor of Economics<br />
ESB Business School<br />
Reutlingen University<br />
Email:<br />
Bodo.Herzog@Reutlingen-University.de<br />
Web Page:<br />
Click here<br />
Dr. Herzog is professor of economics at ESB Business<br />
School, Reutlingen University. Moreover, he is Direc-<br />
tor of the Institute of Finance and Economics and a<br />
research professor at Reutlingen Research Institute<br />
(RRI).<br />
He has worked as a senior economist for the German<br />
Council of Economic Experts and as Chief Economist<br />
and Head of the Economics Department at Konrad<br />
Adenauer Foundation in Berlin. Professor Herzog<br />
studied mathematics and economics at the University<br />
Konstanz. He holds a PhD in economics with a disser-<br />
tation on fiscal-monetary interaction in the European<br />
Monetary Union. He was a research fellow at Massa-<br />
chusetts Institute of Technology. In addition, Professor<br />
Herzog is a regular visiting professor at Portland State<br />
University and Zeppelin University. Since 2008, Dr.<br />
Herzog is member of several political advisory coun-<br />
cils in Germany.<br />
Dr. Herzog’s research focuses mainly on macroeco-<br />
nomics, monetary economics, financial econom-<br />
ics, and neuro-economics. He has published many<br />
articles in professional journals and several academic<br />
books. He is a frequent columnist for “The European”<br />
magazine.
3<br />
TABLE OF CONTENTS <strong>DWS</strong> | GLOBAL FINANCIAL INSTITUTE<br />
TABLE OF CONTENTS<br />
Abstract .......................................................... 04<br />
1. Euro Crisis: What Are the Hidden Issues? ...... 0 5<br />
1.1. Current Account Imbalance: A Divergence<br />
of Competitiveness? ......................................... 0 5<br />
1.2. EMU’s Unique Institutional Rules: Friend<br />
or Foe? .............................................................. 08<br />
1.3. Re-Financing of Sovereign Debt: Merely<br />
Challenging in the EMU? .................................. 09<br />
2. Current Challenge in EMU: Contagious<br />
Sovereign Debt ............................................... 12<br />
2.1. Size of Government Debt .................................. 12<br />
2.2. Composition of Government Debt .................... 16<br />
3. Impact on the Real and Financial Economy ... 18<br />
3.1. Economic Effects of Debt Crises ...................... 18<br />
3.2. Economic Effects of Sovereign Spreads ........... 20<br />
3.2. Economic Effects of Austerity Measures .......... 23<br />
3.3. Public Debt Sustainability: Evaluation of<br />
Investors’ Decision-Making .............................. 24<br />
4. Policy Conclusions & Outlook ........................ 25<br />
References ..................................................... 27<br />
INTRODUCTION TO <strong>DWS</strong> GLOBAL FINANCIAL INSTITUTE<br />
Launched in November 2011, <strong>DWS</strong> Global Financial<br />
Institute (DGFI) is a new-concept think-tank that seeks<br />
to foster a unique category of thought leadership for<br />
asset management professionals in the global mutual<br />
fund investment community by effectively and taste-<br />
fully combining the perspectives of two worlds - the<br />
world of asset management and the world of aca-<br />
demia - concerning the economic, political, financial,<br />
and social issues facing the world.<br />
DGFI’s publications combine the views of <strong>DWS</strong>’ asset<br />
management experts with that of leading academic<br />
institutions in Europe, the United States, and Asia.<br />
The publications span a wide variety of academic fields<br />
from Macroeconomics and Finance to even Sociology<br />
in the form of research papers, interviews, debates,<br />
and more.<br />
Appendix .................................................... 28<br />
Endnotes .................................................... 31<br />
5. Investor´s Corner ........................................ 32
4<br />
THE EURO CRISIS AND ITS IMPLICATIONS <strong>DWS</strong> | GLOBAL FINANCIAL INSTITUTE<br />
The Euro Crisis and Its Implications<br />
Dr. Bodo Herzog 1<br />
July 2012<br />
<strong>White</strong> <strong>Paper</strong> in Cooperation with <strong>DWS</strong> <strong>Investments</strong><br />
ABSTRACT<br />
In this white paper, we explain the key forces behind<br />
the euro crisis and analyse its impact on government<br />
and investor decision-making. We argue that as long<br />
as existing macro dynamics, especially current account<br />
imbalances and high levels of debt, are not reversed,<br />
the euro area will remain in crisis mode. Furthermore,<br />
contagion has the potential to create an immediate<br />
crisis of confidence and amplify existing challenges.<br />
We find that, with a few exceptions, euro area govern-<br />
ment debt is similar in size and composition to pub-<br />
lic debt of countries outside the euro. However, the<br />
market reaction has been exaggerated in Europe due<br />
to the continent’s unique institutional framework. The<br />
United States, United Kingdom, and Japan are by no<br />
means in a better position in the long run. We con-<br />
firm the hypothesis that Greece is an exceptional case.<br />
In addition, we argue that it is almost unmanageable<br />
for Greece to regain competitiveness by more than<br />
20% within the straitjacket of the European Monetary<br />
Union. Our empirical analysis of debt crises demon-<br />
strates a long-lasting negative impact on economic<br />
output and loan policies. Thus, the economic outlook<br />
for the indebted countries is gloomy. Tackling the roots<br />
of the euro crisis should therefore be the top priority<br />
on the policy agenda. We provide a novel toolbox for<br />
investors’ assessment of sustainable public finances<br />
that will enhance their decision-making in sovereign<br />
bond markets.<br />
Key words: EMU, Sovereign Debt, Sustainability,<br />
Macroeconomic Implications<br />
1 Dr. Herzog is Professor of Economics at ESB Business School. He is also research professor at RRI Reutlingen Research Institute and Director of the Institute of Finance and Economics at ESB Business School<br />
and KFRU Reutlingen University. Contact address: Alteburgstr. 150, 72762 Reutlingen, Germany. Email: Bodo.Herzog@Reutlingen-University.de<br />
Acknowledgement: I am grateful for very helpful comments from Henning Stein, Johannes Müller, and Jun Shiomitsu. Moreover, special thanks to both Katja Hengstermann and Cristina Debora Manea for<br />
outstanding editing. I am responsible for all remaining errors.
5 THE EURO CRISIS AND ITS IMPLICATIONS<br />
EURO CRISIS: WHAT ARE THE HIDDEN ISSUES?<br />
The European Monetary Union (EMU) is in crisis. With-<br />
out a doubt, the rescue packages of the past several<br />
years were necessary to stabilize the euro area and the<br />
financial markets in the short term. However, it is ques-<br />
tionable whether this rescue path will lead to a sustain-<br />
able framework of economic governance. There is a<br />
danger that policymakers will follow the wrong path,<br />
leading to a future break-up of the euro area. The cur-<br />
rent rescue philosophy of helping the indebted coun-<br />
tries with guarantees on the one hand and demand-<br />
ing austerity on the other hand is appropriate only as<br />
a short-run stabilization tool and does not solve the<br />
structural problems in the medium and long term (Her-<br />
zog 2011, 2012). An effective solution requires a pro-<br />
found analysis of the structural and hidden issues of<br />
the so-called euro crisis. In addition, we address the<br />
question: What will be the impact on investors?<br />
The euro faces a crisis with multi-dimensional roots.<br />
One facet is the sovereign debt crisis, which started in<br />
the spring of 2010 and has now turned into a crisis of<br />
confidence that continues to spread and has already<br />
affected five euro member states – Greece, Portugal,<br />
Ireland, Spain, and Italy – that together account for<br />
one-third of the EMU’s economic output. The pres-<br />
ent uncertainty has triggered an additional decrease in<br />
consumer and investor confidence, further weakening<br />
<strong>DWS</strong> | GLOBAL FINANCIAL INSTITUTE<br />
the economic outlook. The typical self-reinforcing and<br />
contagious processes now threaten the very existence<br />
of the monetary union. Given that regulators continue<br />
to classify bonds as absolutely secure assets, it is cru-<br />
cial to ensure that current liquidity problems do not<br />
culminate in an overall solvency crisis.<br />
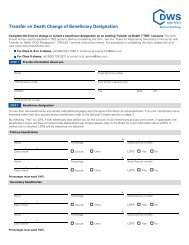
Investors’ distrust in the solvency of the euro area<br />
can be inferred from the development of default risk<br />
premiums on European sovereign bonds and CDS<br />
spreads. Remarkably, the current state of financial<br />
turmoil has impaired the creditworthiness of mainly<br />
euro area banks. Figure 1 shows that CDS spreads of<br />
euro area banks are now higher than they were fol-<br />
lowing the collapse of Lehman Brothers in September<br />
2008, while CDS spreads for U.S. banks remain below<br />
that level (Figure 1). Hence, this chart demonstrates<br />
the effect of “contagion” in the euro area. The next<br />
subsections provide a rigorous diagnosis of the root<br />
causes and hidden issues of the euro crisis.<br />
1.1 Current Account Imbalance: A Divergence of<br />
Competitiveness?<br />
For more than two decades, economists have dis-<br />
cussed the threat posed by uncontrolled reversals<br />
Figure 1: CDS Spreads For Monetary Financial Institutions in the Euro Area and United States<br />
Source: Thomson Financial Datastream (2011,2012).
6 THE EURO CRISIS AND ITS IMPLICATIONS<br />
of global imbalances to individual countries and the<br />
global economy. Not surprisingly, global imbalances<br />
expanded massively leading up to the financial crisis<br />
of 2007 and thereafter declined significantly (Figure<br />
1A-Appendix; IMF 2010). A similar pattern, though to<br />
a smaller degree, is observable within the euro area<br />
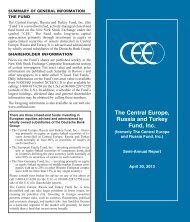
(Figure 2).<br />
A closer look at Figure 2 reveals that Spain, Italy,<br />
Greece, and Portugal were the biggest deficit coun-<br />
tries, while Germany and the Netherlands were the<br />
major surplus countries. The current accounts of the<br />
other deficit or surplus countries are negligible. If we<br />
calculate the current account relative to GDP, however,<br />
we immediately identify Greece, Portugal, Spain, and<br />
Ireland as the biggest deficit countries. Ireland and<br />
Spain are two particularly special cases because both<br />
featured sound public finances before the onset of the<br />
financial crisis. The problem in Spain and Ireland was<br />
the relatively high level of private debt, i.e. household<br />
and corporate debt. The debt accumulation was trig-<br />
gered by historically low (real) interest rates since the<br />
beginning of the EMU in 1999. Consequently, both<br />
economies experienced an unsustainable investment<br />
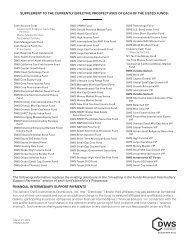
and housing boom. Figure 3 shows that high private<br />
deficit-to-GDP is not just prevalent in the troubling<br />
<strong>DWS</strong> | GLOBAL FINANCIAL INSTITUTE<br />
Figure 2: Current Account in Billions of USD of Selected Euro Area Countries in 2010<br />
euro area countries, but also in the U.S. and Iceland<br />
(not reported).<br />
Source: IMF (2011,2012).<br />
The current account imbalances and high private defi-<br />
cit and debt levels are closely linked to the euro cri-<br />
sis. Financial institutions relocated the high savings of<br />
surplus countries – Germany, for instance – to deficit<br />
countries in order to finance household and corporate<br />
loans. Due to the typical home bias in investment, the<br />
lion’s share of savings simply moved from core Euro-<br />
pean surplus countries to periphery deficit countries.<br />
The irrationality of this process is reflected in the fact<br />
that mortgage interest rates in Spain and Ireland were<br />
lower than in Germany even though Spain and Ireland<br />
had higher private debt levels and, consequently, car-<br />
ried higher default risks. In addition to private debt<br />
accumulation, countries such as Greece, Portugal, and<br />
Italy accumulated huge public debt in the run-up to the<br />
financial crisis. There is evidence that the major deficit<br />
countries avoided sufficient budget consolidation dur-<br />
ing the economically good years. Furthermore, with<br />
the onset of the financial crisis, governments around<br />
the globe implemented substantial stimulus measures<br />
and financial guarantees in order to stabilize the finan-<br />
cial sector and real economy. These policy measures
7 THE EURO CRISIS AND ITS IMPLICATIONS<br />
increased public debt even further in a relatively short<br />
period of time. As a result, markets questioned the<br />
sustainability of public finances in the heavily indebted<br />
countries, leading to a widening of sovereign bond<br />
spreads and CDS spreads since 2010.<br />
Ireland slipped into sovereign debt problems for differ-<br />
ent reasons from those of Greece and Portugal. Greece<br />
and Portugal are victims of inherently high public debt<br />
<strong>DWS</strong> | GLOBAL FINANCIAL INSTITUTE<br />
Figure 3: Private Sector Deficit-to-GDP 1 for Selected Countries in 2007<br />
Source: IMF and own calculations (2011,2012).<br />
levels, while Ireland’s problems were caused by high<br />
private debt levels and extensive public support for the<br />
banking sector during the financial crisis. Euro area<br />
contagion in turn affected the other countries, like<br />
Spain and Italy, soon thereafter. Thus, the overlap of<br />
both trends – massive private and public debt accu-<br />
mulation as well as public support to the financial sys-<br />
tem – is the major force behind the euro crisis.<br />
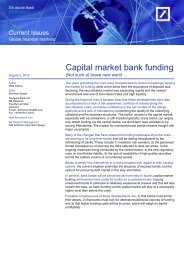
Figure 4: Unit Labour Costs of Selected Euro Area Countries (Index 2000 = 100)<br />
Source: Eurostat (2011,2012).
8 THE EURO CRISIS AND ITS IMPLICATIONS<br />
Figure 5: Productivity and Labour Costs<br />
(annual average between 2000 and 2010 in %)<br />
In addition to these problems, the five troubled coun-<br />
tries – Greece, Portugal, Spain, Italy, and Ireland –<br />
declined substantially in competitiveness over the<br />
past decade. Wages rose faster than productivity for<br />
years, meaning that their unit labour costs, relative to<br />
their major rivals, were about 20% higher than in 2000<br />
(Figure 4 on previous page). Given that none of the<br />
countries is able to make adjustments via a nominal<br />
devaluation, the only way out is via painful nominal<br />
wage cuts. This does improve competitiveness, but it<br />
also exacerbates the debt problems of private house-<br />
holds. While the current unit labour costs for the five<br />
countries is insufficient to regain an average level,<br />
there have been some positive signs. Since 2008, Ire-<br />
land has been making significant corrections to regain<br />
competitiveness. The picture for Italy is a bit more<br />
controversial. The trend in unit labour costs is still<br />
upwards despite some positive political reform steps<br />
since 2011. Nevertheless, there remains a divergence<br />
between these countries’ unit labour costs and those<br />
of the surplus countries.<br />
It turns out that the divergence of the unit labour costs<br />
is not caused by insufficient productivity growth in<br />
the five troubling countries, but rather by the wrong<br />
adjustment of nominal wages according to productiv-<br />
ity (Figure 5). There is empirical evidence that deficit<br />
countries increased wages more than surplus coun-<br />
tries. Almost all Southern European states still have<br />
<strong>DWS</strong> | GLOBAL FINANCIAL INSTITUTE<br />
Source: Eurostat and own calculations (2011,2012).<br />
so-called wage-indexation rules. The nominal wage is<br />
thus not linked to productivity growth but to inflation.<br />
In short, the key macroeconomic forces behind the<br />
euro crisis are the current account imbalances and<br />
declining competitiveness of countries in the euro<br />
area. Historically low interest rates also triggered pri-<br />
vate and public debt accumulation before the onset of<br />
the financial crisis. These reckless market conditions<br />
caused an artificial economic and wage boom that<br />
eroded the competitiveness of some countries during<br />
the period from 2000 to 2008. Finally, fiscal measures<br />
to stabilize the financial sector and real economy raised<br />
concerns about the sustainability of public finances in<br />
these euro area countries.<br />
1.2 EMU’s Unique Institutional Rules: Friend or<br />
Foe?<br />
Another special characteristic of the euro crisis is the<br />
institutional straitjacket of the monetary union. A com-<br />
parison with highly indebted G-7 member states, such<br />
as Japan, the United Kingdom, and the United States,<br />
shows that the euro area has less flexibility with cen-<br />
tral bank bond-buying programs and state support (cf.<br />
section 2). In addition, the U.S. is in a unique position<br />
due to the safe-haven status of the dollar.<br />
The EMU fundamentally changed the framework of
9 THE EURO CRISIS AND ITS IMPLICATIONS<br />
European governance and monetary policy. Member<br />
states issue debt denominated in euros, but lack their<br />
own central banks to create the means to repay their<br />
debts. European member states assumed that the<br />
spill-over risk of default was eliminated by institutional<br />
rules, such as the no-bailout clause and the Stability<br />
and Growth Pact implemented in 1997. These rules<br />
were meant to guarantee that unsound fiscal policy<br />
and thus default were solely national, rather than Euro-<br />
pean, issues. However, as early as the 1990s, many<br />
experts realized that the no-bailout clause lacked cred-<br />
ibility. When faced with severe turmoil it was expected<br />
that the rules would be abandoned. This was the case<br />
in 2005, when the Stability and Growth Pact was<br />
revised, as well as in 2010, when the no-bailout clause<br />
was abolished at the onset of the sovereign debt crisis<br />
in Greece.<br />
The existing shortcomings of economic governance<br />
within the EMU have been discussed since 2003.<br />
From the beginning, the enforcement mechanism of<br />
the stability pact was identified as too weak and the<br />
sanction scheme as too inconsistent. Accordingly, the<br />
institutional framework established little discipline.<br />
Although Greece consistently ran deficits in excess<br />
of 3% of GDP and maintained debt levels above 60%<br />
of GDP, European policymakers failed to demand the<br />
obligatory austerity measures. Now, more than 10<br />
years later and in the heat of crisis, policymakers are<br />
demanding such austerity. There is no doubt that these<br />
measures are necessary, but the implementation came<br />
far too late. EMU’s institutions and policymakers failed<br />
to create strong disciplinary incentives.<br />
Furthermore, during normal times financial markets –<br />
banks, insurance companies, and rating agencies, in<br />
particular – failed to sufficiently differentiate the cred-<br />
itworthiness of euro area countries. This is astonish-<br />
ing since the legal and institutional framework of the<br />
EMU, including the assigning of responsibility for the<br />
soundness of fiscal policy to national governments,<br />
has been clear since the beginning of the monetary<br />
union. The reasons for this partly “irrational” market<br />
opinion on creditworthiness, aside from the clear lack<br />
of credibility of the no-bailout clause, are still unclear.<br />
It could be due to misunderstandings on the part of<br />
<strong>DWS</strong> | GLOBAL FINANCIAL INSTITUTE<br />
financial investors or the lack of credibility and disci-<br />
plinary incentives in the institutional setup of the EMU.<br />
Fortunately, since 2010, financial markets have<br />
responded with a differentiated assessment of the<br />
creditworthiness of sovereign bonds. However, the<br />
relatively abrupt reversal of sovereign yields has pro-<br />
duced a situation similar to a bank run in the euro<br />
area. These self-reinforcing and systemic effects have<br />
been highly “contagious” – that is, they have cre-<br />
ated temporary liquidity problems that have evolved<br />
into enduring solvency crises in some countries. This<br />
can be attributed to the fact that a country’s solvency<br />
depends firstly on the interest rate it has to pay for<br />
its debt and secondly on its expected economic out-<br />
look, both of which have deteriorated in the problem<br />
countries.<br />
The unique institutional setup of the EMU, combined<br />
with ongoing uncertainty and self-reinforcing pro-<br />
cesses, has the euro area facing a crisis of confidence.<br />
This is nicely illustrated by Standard & Poor’s justifi-<br />
cation for downgrading Italy in September 2011, in<br />
which the agency noted that Italy is expected to pay<br />
higher interest and that the country’s austerity pro-<br />
gram has weakened output. Both factors – lower GDP<br />
and higher interest rates – increase debt levels. This<br />
leads to a vicious cycle in which higher debt leads to<br />
even higher interest payments and slower growth.<br />
Simply put, this assessment is always true and justifies<br />
a downgrade at all times. Surprisingly, this argument<br />
was not applied to, and the market reactions were<br />
subdued for, countries with similar debt levels such as<br />
the U.K., U.S., and Japan. Consequently, the unique<br />
institutional framework of the European Monetary<br />
Union triggered substantial downgrades and snowball<br />
effects that led to a surge in bond yields in the heavily<br />
indebted countries. In summary, specific institutional<br />
issues explain why the EMU faces unusually tough<br />
challenges compared to other countries with similar<br />
debt levels.<br />
1.3 Re-Financing of Sovereign Debt: Merely Chal-<br />
lenging in the EMU?<br />
Finally, we discuss the sovereign debt dimension
10 THE EURO CRISIS AND ITS IMPLICATIONS<br />
Figure 6: 10-Year Bond Rates in Selected Countries, in %<br />
and the currency perspective of the euro crisis. High<br />
sovereign debt levels triggered an extraordinary yield<br />
dynamic, signalling a crisis of confidence in the euro<br />
area. Judging the solvency and sustainability of a<br />
country’s public finances, however, requires a general<br />
equilibrium assessment of the debt-to-GDP ratio over<br />
time. This issue is studied in subsection 3.4 based on<br />
new estimates.<br />
Despite considerable efforts to consolidate budgets<br />
in Greece, Portugal, Ireland, and Spain, the impact on<br />
bond rates was negligible in 2011 (Figure 6). These<br />
countries reduced their primary balance – public<br />
deficits excluding interest payments on government<br />
liabilities – in the years 2009 to 2011 by 7.6 percent-<br />
age points. Highly indebted G-7 countries, such as<br />
Japan, the United States, and the United Kingdom,<br />
are far behind this. Nevertheless, bond rates in these<br />
countries dropped 1 percent, while rates for the five<br />
indebted euro area countries climbed even further.<br />
This dynamic is a bit surprising. For instance, Japan<br />
has a very high debt-to-GDP ratio of 213% and has<br />
a quickly ageing population. Nevertheless, Japan, as<br />
well as the U.S. and the U.K., is still able to finance itself<br />
in the capital market at interest rates similar to the low<br />
rates paid by Germany, which features much sounder<br />
public finances. This market paradox can be explained<br />
by the EMU straitjacket. The EMU’s one-size-fits-all<br />
<strong>DWS</strong> | GLOBAL FINANCIAL INSTITUTE<br />
Source: Thomson Financial Datastream (2011,2012).<br />
monetary policy and the lack of exchange-rate depre-<br />
ciation for euro area countries are both major prob-<br />
lems helping to fuel the crisis.<br />
The markets are by no means impressed by the tough<br />
austerity programs of EMU countries. Financial mar-<br />
kets even perceived higher default risks for the five<br />
euro area countries, which triggered contagious<br />
effects. Markets are strongly disappointed with struc-<br />
tural debt problems in the euro area. One aspect is that<br />
the government’s accumulation of debt was not fully<br />
offset during economic good times in past decades.<br />
Moreover, the government’s indebtedness will soon<br />
become even more difficult to manage due to Europe’s<br />
ageing population. 2<br />
Given the risk of self-reinforcing spirals, and the fact<br />
that the European Central Bank (ECB) is the only<br />
institution capable of acting in the short run, the<br />
unique institutional problems in the euro area are still<br />
unsolved. Only with a time delay did policymakers<br />
agree to implement the European Financial Stability<br />
Facility (EFSF), with about €440 billion. The EFSF will<br />
be converted to the European Stability Mechanism<br />
(ESM) after a transitory overlap of both rescue facili-<br />
ties. The ESM is another step forward; however, there<br />
are several flawed incentives within the ESM proce-<br />
dure. This rescue umbrella might be too low compared<br />
to the Italian and Spanish refinancing requirements of
11 THE EURO CRISIS AND ITS IMPLICATIONS<br />
approximately €1.1 trillion in the years 2012 and 2013<br />
(Table 1). Table 1 shows the refinancing requirements<br />
of selected euro area countries. These amounts indi-<br />
cate an urgent need to tackle the roots of the euro<br />
crisis. Nonetheless, the crisis with respect to Greece,<br />
Portugal, and Ireland is manageable. As markets calm<br />
down and eventually return to normal, refinancing via<br />
capital markets might be achievable.<br />
Indeed, the period of the so-called “Great Modera-<br />
tion” – which was characterized by relatively low inter-<br />
est rates and low volatility – contributed to today’s<br />
problem. First, it triggered excessive risk taking and<br />
maturity transformations. Second, there is empirical<br />
evidence that the more integrated and liberalized the<br />
financial system, the higher the co-dependence of<br />
the default risk of publicly traded banks (Anginer and<br />
Demirguc-Kunt 2011). Consequently, the generous<br />
global liquidity conditions and lack of global supervi-<br />
sion created a hidden instability in the financial and<br />
macroeconomic environment. Research provides sig-<br />
nificant evidence that both factors are key drivers of<br />
booms in credit markets (Elekdag and Wu, 2011).<br />
In summary, the so-called euro crisis is definitely not<br />
a crisis of the euro currency. Despite the weaker euro-<br />
dollar exchange rate in recent months 3 , the euro is<br />
<strong>DWS</strong> | GLOBAL FINANCIAL INSTITUTE<br />
Table 1: Refinancing Requirements of Selected Euro Area Countries in 2012 and 2013<br />
Source: IMF and own calculations (2011,2012).<br />
still the second-largest reserve currency according<br />
to recently published data by the IMF. From 1999 to<br />
2011, the share of U.S. dollar reserves has declined<br />
from 71.0% to 61.7%, while euro reserves increased<br />
from 17.9% to 25.7%. This trend demonstartes the<br />
increasing demand for the euro currency. In fact,<br />
according to interest-rate parity, the recent drop of the<br />
euro can easily be explained as a temporary phenome-<br />
non. Moreover, since December 2010, there has been<br />
explicit political willingness and action to tackle the<br />
roots of the European sovereign debt crisis. It is not<br />
just talking, as it was in the previous years; now there<br />
is bold and decisive action. Policymakers agreed to<br />
implement constitutionallly alike national debt rules in<br />
25 euro area countries (though not in the United King-<br />
dom or Czech Republic). In March 2012, they ratified<br />
the fiscal compact, which is all in all another positive<br />
sign. 4 In addition, European policymakers reformed the<br />
existing economic governance of the euro area by the<br />
so-called six-pack reform. Altogether, this is certainly a<br />
step in the right direction, but it is not a quantum leap.<br />
There are two options in the long-run:<br />
• Option A (centralization): This is a fundamental<br />
change in the existing policy framework toward a<br />
transfer union with Eurobonds and a European finance<br />
minister, budget, and taxes. This option would insist
12 THE EURO CRISIS AND ITS IMPLICATIONS<br />
that EMU member states abandon a substantial part of<br />
their national sovereignty over fiscal policy. This would<br />
require immediate and fundamental legal changes at<br />
both the European and national level. The recent judg-<br />
ment by the constitutional court in Germany has partly<br />
eliminated this option for the near future.<br />
• Option B (decentralization): This is an effective,<br />
de-politicized, rules-based framework aligned with<br />
market forces and consistent institutional incentives.<br />
This would strengthen the fiscal and market incentives<br />
<strong>DWS</strong> | GLOBAL FINANCIAL INSTITUTE<br />
for sound finances in the long run and enhance the<br />
consistency of the institutional setup. Thus, Option B<br />
requires a return to and enhancement of the funda-<br />
mental principles of the existing monetary union.<br />
Either option would be effective as a solution from an<br />
economic point of view. However, a combination of<br />
options A and B – that is, sharing the costs of unsound<br />
fiscal policy while retaining national sovereignty over<br />
fiscal policy – is likely to fail.<br />
2. CURRENT CHALLENGE IN EMU: CONTAGIOUS SOVEREIGN DEBT<br />
This section explains the challenges of public debt<br />
accumulation in Europe and its policy implications.<br />
We argue that the total amount of government debt<br />
consists of explicit and implicit debt. Market partici-<br />
pants and rating agencies often overlook the “hidden<br />
debt” in the form of implicit and contingent liabilities.<br />
In addition, the composition of public debt provides<br />
valuable information about the maturity and holder<br />
of sovereign debt. Consequently, the debt’s composi-<br />
tion plays a key role when evaluating the solvency and<br />
vulnerability of public finances. Policy conclusions are<br />
that: (i) Debt ratios must be stabilised to re-establish<br />
market confidence; (ii) implicit or off-balance-sheet<br />
Table 2: Government Debt-to-GDP in the Euro Area (2007-2012)<br />
government debt must be monitored carefully and<br />
taken into account for a more comprehensive analy-<br />
sis of sustainable public finances; and (iii) deficit and<br />
gross debt should remain the basis for the “Excessive<br />
Deficit Procedure” within the Stability and Growth<br />
Pact. However, these should be analysed with the ulti-<br />
mate goal of a balanced budget in the medium term.<br />
2.1 Size of Government Debt 5<br />
The financial, economic, and sovereign debt crises<br />
of the past few years have imposed a substantial fis-<br />
cal burden on governments. In all countries, stimulus<br />
Percentage of GDP 2007 2008 2009 2010 2011 2012<br />
1 Gross Debt 66.2 69.9 79.3 85.2 87.7 88.5<br />
2 Change in Debt Ratio (2 = -3+4+5) -2.3 3.6 9.5 6.0 2.4 0.8<br />
3 Nominal GDP growth -3.5 -1.6 2.3 -2.0 -2.5 -2.9<br />
4 Deficit 0.7 2.0 6.3 6.0 4.3 3.5<br />
Automatic stabilisers -1.0 -0.5 2.0 1.6 1.3 1.0<br />
Other expenditures 1.7 2.5 4.3 4.4 3.0 2.5<br />
5 Deficit-debt adjustment 0.5 3.2 0.9 1.9 0.6 0.2<br />
Support of financial sector 0.0 1.9 0.5 2.5 - -<br />
Ohter expenditures 0.5 1.3 0.4 -0.6 - -<br />
Source: ECB and European Commission (2011,2012).
13 THE EURO CRISIS AND ITS IMPLICATIONS<br />
Table 3: Debt-to-GDP for Euro Area Countries<br />
Year 1999 2007 2010<br />
Austria 58 58 70<br />
Belgium 110 84 96<br />
Cyprus 43 45 61<br />
Germany 61 65 82<br />
Estonia 2 1 1<br />
Spain 61 36 61<br />
Finland 37 34 47<br />
France 59 64 82<br />
Greece 70 107 142<br />
Italy 109 103 118<br />
Luxembourg 6 7 19<br />
Malta 45 59 69<br />
Netherlands 61 45 60<br />
Slovenia 11 23 39<br />
Slovakia 31 21 41<br />
Portugal 50 68 93<br />
Ireland 48 25 96<br />
Source: ECB and European Commission (2011,2012).<br />
spending during recession years has led to sharp<br />
increases in debt-to-GDP and deficit-to-GDP ratios.<br />
This has had adverse consequences on sovereign<br />
bond yields, private investments due to crowding<br />
out, and potential output. Moreover, these increases<br />
affected markets’ confidence in government liquidity<br />
and solvency.<br />
A government is called solvent in a given period if the<br />
discounted value of its current and future budget bal-<br />
ance surpluses is higher than the sum of the initial<br />
stock of debt. In the European context, we define the<br />
60% debt-to-GDP limit as a threshold. A government<br />
is called liquid if the available government’s liquid<br />
assets in a given currency are in line with its maturing<br />
liabilities. Hence, the maturity profile of government<br />
debt, including the refinancing needs of outstanding<br />
short-term debt, is relevant for analysing liquidity.<br />
The euro area’s gross public debt-to-GDP ratio<br />
increased over the period of 2007 to 2012, from<br />
<strong>DWS</strong> | GLOBAL FINANCIAL INSTITUTE<br />
66.2% to 88.5%. The level of government debt in 2012<br />
is expected to increase by almost €2.7 trillion from a<br />
stock of about €6 trillion in 2007. The volume of gov-<br />
ernment bonds in the euro area is estimated to be as<br />
high as €7.822 trillion euro in 2010. The major sover-<br />
eign debt holders are the monetary financial institutes<br />
(MFIs) with 35% or €2.746 trillion, insurance compa-<br />
nies and pension funds with 16% or €1.215 trillion,<br />
and investment funds with 9% or €692 billion. The<br />
remaining 40%, or €3.17 trillion, is held by others,<br />
including foreign investors and hedge funds. Auto-<br />
matic stabilisers, expansionary counter-cyclical fiscal<br />
policies, and government support to the financial sec-<br />
tor during the financial crisis of 2007 to 2009 drove the<br />
recent public debt accumulation (Table 2). However,<br />
stabilization expenditures have been somewhat erratic<br />
across countries, particularly in Germany, the Nether-<br />
lands, Portugal, and Ireland.<br />
In 2009, the severe recession and resulting negative<br />
output gap added to debt accumulation by 2.3 per-<br />
centage points. In all other years, GDP growth has<br />
slightly reduced future debt levels (cf. row 3), even if<br />
the net contribution to debt was mostly positive, as<br />
shown in row 2 in Table 2. Line 5 in Table 2 justifies the<br />
hypothesis that the recent debt accumulation in the<br />
euro area is also caused by deficit deterioration due<br />
to public stimulus and support to the financial sector.<br />
Consequently, debt-to-GDP ratios increased in almost<br />
all countries. Let us compare the debt levels of 2007<br />
and 2010: Ireland’s debt increased by roughly 71<br />
percentage points, Greece’s by about 35 percentage<br />
points, and Portugal’s and Spain’s by around 25 per-<br />
centage points (Table 3). In addition, Table 3 illustrates<br />
that more countries breached the 60% debt-to-GDP<br />
threshold in 2010. The variety of deficit-to-GDP levels –<br />
not explicitly reported here – is also remarkable, rang-<br />
ing from double-digit deficits in Ireland and Greece to<br />
deficits below 3% of GDP in Luxembourg and Finland,<br />
and even a small surplus in Estonia.<br />
By the end of 2011, debt ratios in most euro area<br />
countries exceeded the 60% threshold with only a few<br />
exceptions. Interestingly, there is also a split in short-<br />
term and long-term outsanding debt in the euro area.
14 THE EURO CRISIS AND ITS IMPLICATIONS<br />
For almost all countries, with the exception of Estonia<br />
and Luxembourg, long-term debt securities are well<br />
above 60% of GDP. Nevertheless, those dynamics and<br />
high debt levels are not hopeless. The Netherlands,<br />
for example, was able to reduce its debt by around<br />
138% of GDP in just ten years from 1946 to 1956. This<br />
gigantic consolidation effort was mainly accomplished<br />
with sustained economic growth and double-digit sur-<br />
pluses during this time period.<br />
A comprehensive evaluation of the euro area’s situ-<br />
ation requires a comparison with its competitors,<br />
including the U.S., the U.K., and Japan. A trivial direct<br />
comparison of public finances is not possible with-<br />
out some careful adjustments due to methodological<br />
and statistical differences across countries. In Japan,<br />
for instance, debt and deficit statistics are compiled<br />
according to System of National Accounts 2008, while<br />
in the U.S. it is based on the National Income and<br />
Product Accounts (NIPA) methodology. All account-<br />
ing frameworks are slightly different and comparison<br />
requires careful adjustment and interpretation.<br />
We apply the European definition of government debt<br />
and calculate the debt levels for the U.S., Japan, and<br />
Europe in Figure 7. 6 The graph shows an increasing<br />
debt-to-GDP ratio between 2007 and 2010 of approxi-<br />
mately 19 and 29 percentage points in the euro area<br />
and U.S., respectively. In Japan, the debt ratio was at<br />
180.4% in 2009 and rose about 60 percentage points<br />
in the last 10 years, due to high deficits and low GDP<br />
<strong>DWS</strong> | GLOBAL FINANCIAL INSTITUTE<br />
Figure 7: Debt-to-GDP from 1997 to 2010 (left) and Deficit-to-GDP in 2010 (right)<br />
growth. According to our calculations, U.S. net debt 7<br />
has a similar magnitude to that of the euro area. Even<br />
more striking is a comparison of government deficits.<br />
In 2010, the euro area deficit situation was relatively<br />
modest compared to those of Japan, the United King-<br />
dom, and the United States (Figure 7).<br />
Next, we give a detailed analysis of the indirect debt<br />
burden and contingent liabilities, such as guarantee<br />
schemes provided to secure the financial sector and<br />
special-purpose vehicles, also known as “bad banks.”<br />
Table 4 shows the cumulative amount of contingent<br />
liabilities as a result of the stabilisation operations car-<br />
ried out in the financial sector during the years from<br />
2008 to 2010. The first column in Table 4 depicts the<br />
total impact on government debt in percentage of<br />
GDP due to financial sector stabilization (i.e. acquisi-<br />
tion of shares, loans, asset purchases, and other mea-<br />
sures). The second column represents the total impact<br />
on government-contingent liabilities. On top of these<br />
implicit state guarantees we have to add explicit state<br />
guarantees of the EFSF today or the ESM in the future<br />
(columns 4 and 5).<br />
Source: ECB (2011,2012).<br />
The average grant guarantee of the euro area is 6.5% of<br />
GDP (bottom line in column 2). Most notably, the Irish<br />
government has provided vast guarantees of 125%<br />
of GDP. The fiscal risks of these guarantees depend<br />
on the probability of default, so there is no immediate<br />
impact on public deficit and debt. The financial trans-<br />
actions tax currently being discussed as a means to
15 THE EURO CRISIS AND ITS IMPLICATIONS<br />
Table 4: Cumulative Financial and Public Sector Stabilisation<br />
finance future default costs is therefore questionable<br />
if not implemented globally or in Europe at all. Unfor-<br />
tunately, this tax unencumbers mainly public but not<br />
private debt. In the end, the transaction tax is paid by<br />
consumers, not by the financial sector. Moreover, as<br />
long as this tax is not introduced internationally, it may<br />
just slow market processes or reduce volatility trig-<br />
gered by traders in the euro area.<br />
For the current discussion about the sovereign debt<br />
crisis and high debt levels, the fact that the current<br />
EFSF guarantees have not yet had an impact on debt<br />
is of great importance. Even the paid-in capital of<br />
€80 billion to the ESM will not increase government<br />
debt because the paid-in capital will be treated as<br />
direct loans from an international organisation, such<br />
as the IMF. According to the definition of the public<br />
<strong>DWS</strong> | GLOBAL FINANCIAL INSTITUTE<br />
Financial Stabilization 2008-2010 ESM (European Stability Mechansim)<br />
Total Impact Total impact on ESM Subscribed Paid-in Capital<br />
on Debt contingent liabilites Capital in bn € in bn €<br />
in % of GDP in % of GDP<br />
Belgium 5.8 15.8 24.3 2.8<br />
Germany 13.5 2.8 190.0 21.7<br />
Estonia 0.0 0.0 1.3 0.1<br />
Ireland 23.2 125.2 11.1 1.3<br />
Greece 2.3 25.1 19.7 2.3<br />
Spain 2.4 5.6 83.3 9.5<br />
France 0.2 4.7 142.7 16.3<br />
Italy 0.3 0.0 125.4 14.3<br />
Cyprus 0.0 17.2 1.4 0.2<br />
Luxembourg 6.1 3.2 1.7 0.2<br />
Malta 0.0 0.0 0.5 0.1<br />
Netherlands 9.0 6.8 40.0 4.6<br />
Austria 2.6 7.8 19.5 2.2<br />
Portugal 3.6 3.1 17.6 2.0<br />
Slovenia 4.0 6.1 3.0 0.3<br />
Slovakia 0.0 0.0 5.8 0.7<br />
Finland 0.0 0.0 12.6 1.4<br />
Euro Area 5.5 6.5 700.0 80.0<br />
accounting standards, this does not affect the explicit<br />
debt-to-GDP ratio; however, it will raise implicit debt<br />
levels.<br />
Source: ECB and EU Commission (2011,2012).<br />
This issue of implicit debt leads to a very important<br />
point: Explicit public debt levels are often biased sig-<br />
nificantly and do not give valid information about the<br />
sustainability of fiscal policy. Thus, the evaluation of<br />
the size of government debt requires the measurement<br />
of explicit and more importantly implicit government<br />
debt, namely, future debt from current government-<br />
managed pension schemes unrecorded in official sta-<br />
tistics. Table 5 provides a rough overview of implicit<br />
government liabilities for selected euro area countries.<br />
The total (explicit and implicit) debt stock in the euro<br />
area is estimated to be 330% of GDP (Mink et al. 2008).
16 THE EURO CRISIS AND ITS IMPLICATIONS<br />
Table 5: Implicit and Explicit Debt (2008)<br />
( % of GDP)<br />
Social Defined-Benefit<br />
Security schemes<br />
Germany 275 47<br />
France 292 60<br />
Italy 322 1<br />
Euro Area 278 52<br />
Source: Eurostat and ECB (2011,2012).<br />
Germany stands out with the lowest ratio, due to past<br />
reforms in the social security and pension systems.<br />
Nevertheless, accurate interpretation is tricky because<br />
these numbers are based on estimations and rely on<br />
long-term assumptions about future economic perfor-<br />
mance. In addition, we must take into consideration<br />
increasing government costs due to an ageing pop-<br />
ulation. The increase of ageing-related government<br />
expenditure relative to GDP over the period of 2007<br />
to 2060 is estimated to be 5.2 percentage points for<br />
the euro area. The highest demographic cost share in<br />
the euro area is expected in countries such as Greece,<br />
Cyprus, Luxembourg, Malta, and Slovenia, rang-<br />
ing from 10% to 18%. The lowest share is expected<br />
in Estonia, 0.4%. Germany’s expenditures related to<br />
demographic challenges are expected to be around<br />
<strong>DWS</strong> | GLOBAL FINANCIAL INSTITUTE<br />
4.8% of GDP, close to the euro area average. The main<br />
message from these projections is that future primary<br />
budget deficits, and therefore debt-to-GDP ratios, will<br />
rise even further if reforms and credible budget con-<br />
solidations are neglected. Achieving public and private<br />
sustainability requires a more progressive attitude in<br />
public policy and business. These are the real future<br />
challenges of high sovereign debt in Europe and the<br />
G-20 member states.<br />
Figure 8: Euro Area Debt by Holders and Maturity in 2010<br />
2.2 Composition of Government Debt<br />
The composition of government debt in terms of<br />
maturity and currency influences both governments’<br />
and investors’ costs and risks related to the rollover of<br />
outstanding government debt. Private and public debt<br />
management seeks to minimize costs and focuses<br />
on certain targets with respect to the sovereign bond<br />
market. There are several macroeconomic implications<br />
related to the composition of government debt:<br />
a) The government bond yield curve commonly<br />
serves as a benchmark for pricing private sector<br />
bonds. Higher sovereign yields distort the information<br />
signal and crowd out private sector borrowing;<br />
b) A high share of short-term debt increases the<br />
government’s dependence on short-term monetary<br />
policy rates and thus creates an incentive to increase<br />
Source: ECB (2011,2012).
17 THE EURO CRISIS AND ITS IMPLICATIONS<br />
pressure on the central bank;<br />
c) A high share of debt denominated in domestic<br />
currency protects the debt level and currency against<br />
exchange rate risks.<br />
Figure 8 depicts the composition of euro area debt<br />
by debt holders and residual maturity. In 2010, non-<br />
residents held 52% of debt in the euro area, while resi-<br />
dents held the remaining 48%, out of which 38% was<br />
held by monetary and financial institutions and the rest<br />
by central banks, non-financial corporations, and indi-<br />
viduals. The majority of euro area government debt,<br />
73.9%, has a maturity over one year.<br />
The average maturity of euro area government debt<br />
securities has been around six to seven years since<br />
2007, showing a slightly declining trend. The financial<br />
crisis shifted the debt maturity structure in some euro<br />
area countries due to governments’ liquidity risks.<br />
<strong>DWS</strong> | GLOBAL FINANCIAL INSTITUTE<br />
Table 6: Holder and Currency Denomination of Government Debt, 2010<br />
Resident Creditors Non- Currency<br />
Central Other Resident Denomination<br />
Bank MFIs Corporations Residents Creditors Euro Other<br />
Belgium 1.4 23.5 14.7 4.1 56.3 100.0 0.0<br />
Germany 0.2 31.5 9.2 10.1 49.0 98.9 1.1<br />
Estonia 0.0 57.0 1.1 4.4 37.9 100.0 0.0<br />
Ireland - - - - - - -<br />
Greece 3.2 23.9 0.3 3.1 69.6 98.2 1.8<br />
Spain 3.4 28.4 7.9 18.8 41.5 99.4 0.6<br />
France - - - - - 99.9 0.1<br />
Italy 3.6 27.0 15.6 9.1 44.6 99.8 0.2<br />
Cyprus 14.2 22.3 6.6 7.2 49.7 99.7 0.3<br />
Luxembourg 0.0 47.5 - - 30.1 100.0 0.0<br />
Malta 5.9 40.2 19.6 28.7 5.6 100.0 0.0<br />
Netherlands 0.3 18.2 10.6 2.6 68.3 92.4 7.6<br />
Austria 0.4 12.0 6.9 4.2 76.4 97.3 2.7<br />
Portugal 0.8 22.4 5.8 7.8 63.3 98.5 1.5<br />
Slovenia 1.0 27.7 10.1 3.5 57.7 99.8 0.2<br />
Slovakia 0.0 62.4 0.0 0.6 37.0 99.7 0.3<br />
Finland 0.0 12.5 1.2 15.2 71.1 100.0 0.0<br />
Euro Area 1.7 26.5 11.9 7.8 52.1 99.1 0.9<br />
The most visible changes were recorded in Cyprus,<br />
Greece, and Spain, where the share of short-term debt<br />
declined massively between 1995 and 2010. This sig-<br />
nals a reduction in rollover risk. In the first years of<br />
the EMU, by contrast, these countries used short-term<br />
debt due to easy access to the capital markets to sat-<br />
isfy their refinancing needs (BIS 2011).<br />
Finally, we discuss the holders and residual maturity of<br />
government debt as well as the currency denomina-<br />
tion by euro area countries. Table 6 summarizes the<br />
holders and currency denomination of government<br />
debt. The table with the maturities of government debt<br />
is relegated to the appendix (Table A1).<br />
Source: ECB (2011,2012).<br />
The analysis of the numbers in Table 6 reveals inter-<br />
esting patterns for certain euro area countries and<br />
provides valuable conclusions for investors. A com-<br />
parison of the five highly indebted countries reveals<br />
that Greece and Portugal are far more exposed to
18 THE EURO CRISIS AND ITS IMPLICATIONS<br />
non-resident creditors than Spain and Italy are. Greece<br />
has a foreign debt exposure of 69.6% and Portugal of<br />
63.3%. Both countries are in the top group of non-res-<br />
ident creditor holders in the euro area.<br />
Additionally, Greece and Portugal have relatively<br />
high shares of foreign currency debt in comparison<br />
to the euro area average. Admittedly, the level is not<br />
as high as in some other G-20 countries. However,<br />
both Greece and Portugal are more exposed to mar-<br />
ket dynamics and financial risks than other euro area<br />
3. IMPACT ON THE REAL AND FINANCIAL ECONOMY<br />
This section provides a policy-oriented analysis of the<br />
impact of the euro crisis on the economy. First, we anal-<br />
yse the economic impact of debt crises in subsection<br />
3.1. In subsection 3.2, we study the effect of sovereign<br />
yield spreads on the financial and real economy. The<br />
analysis is based on our own estimates and is related<br />
to recent research studies. Subsection 3.3 provides<br />
a brief discussion of tough austerity programs and<br />
their impact on the economy. Finally, subsection 3.4 is<br />
devoted to a new approach for the assessment of the<br />
sustainability of public finances. We demonstrate the<br />
usefulness of this approach for investors who consider<br />
investments in sovereign bond markets. This relatively<br />
simple but scientifically rigorous approach provides an<br />
overall evaluation of the sustainability of a country’s<br />
public finances.<br />
3.1 Economic Effects of Debt Crises<br />
There is a great deal of empirical evidence that high<br />
government debt hampers economic growth and dis-<br />
courages capital accumulation. The theoretical argu-<br />
ment is that high debt levels erode public finances and<br />
lead to expected future increases in distortionary taxa-<br />
tion. In addition, high and still growing public debt may<br />
increase nominal and real interest rates. Higher inter-<br />
est rates crowd out private investment, generating a<br />
snowball effect in which slower growth leads to even<br />
higher debt and higher interest expenditures, which<br />
are then financed by additional debt. The end result<br />
is a vicious cycle detrimental to economic growth and<br />
the sustainability of public finances. Accordingly, this<br />
<strong>DWS</strong> | GLOBAL FINANCIAL INSTITUTE<br />
countries. On top of this, Greece possesses one of the<br />
highest shares of short-term and variable interest rate<br />
debt with maturity over one year (Table A1), which<br />
greatly exposes the Greek economy to future interest<br />
rate decisions. Altogether, the risk exposure for Greece<br />
is dramatic. These patterns explain the extraordinary<br />
role of Greece, and illustrate that its economy is a spe-<br />
cial case and an exception in Europe. This statement<br />
does not mean that the euro crisis, including the Greek<br />
tragedy, is unmanageable. Instead, it means that all<br />
options have to be considered – and soon.<br />
triggers capital outflows and, in some occasions, a<br />
banking or exchange-rate crisis.<br />
Recently, several studies have offered evidence that<br />
debt-to-GDP levels above 80-90% impair economic<br />
growth (Reinhart and Rogoff, 2010; Cecchetti et al.,<br />
2011). An analysis of Italy illustrates this for a debt-to-<br />
GDP level of 100%. The combination of these studies<br />
has led to the conclusion that, at low levels, debt is<br />
good. But when does debt go from good to bad? Is<br />
there an optimal level of government debt?<br />
First, it is important to note that debt is not inherently<br />
evil. Borrowing allows for the smoothing of consump-<br />
tion and income over the course of the business cycle,<br />
which is welfare enhancing. This improves the effi-<br />
ciency of capital allocation across the economy and<br />
across generations. Theoretically, there is the poten-<br />
tial in normal times for a society’s welfare to rise with<br />
modest debt levels. Nevertheless, the literature pro-<br />
vides three main channels through which sovereign<br />
debt affects output negatively: (1) exclusion from inter-<br />
national capital markets; (2) an increase in borrowing<br />
costs; and (3) international trade. The balance between<br />
positive and negative effects is merely an empirical<br />
question.<br />
The following part is an empirical investigation of this<br />
problem. A data sample of 24 OECD countries over the<br />
period of 2000 to 2010 is used. The novelty of the data-<br />
set is the inclusion and distinction of domestic and for-<br />
eign debt. With this approach we are able to analyse
19 THE EURO CRISIS AND ITS IMPLICATIONS<br />
the impact of foreign and domestic debt holders on<br />
the economy. We begin by looking at the relationship<br />
between debt and economic growth. Calculation of<br />
time-series correlation coefficients shows a statisti-<br />
cally significant negative relationship. Our first model<br />
shows that total debt-to-GDP reduces output growth<br />
by -0.25. The disaggregated approach allows us to<br />
disentagle the overall impact: Residential debt-to-GDP<br />
reduces output growth by -0.26, and foreign debt-to-<br />
GDP reduces output growth by -0.27. It is striking to<br />
see that a one percentage-point increase in foreign<br />
<strong>DWS</strong> | GLOBAL FINANCIAL INSTITUTE<br />
Figure 9: Bivariate Panel Regressions of GDP Growth and Debt Holders (in %)<br />
Table 7: Panel Regression of GDP Growth<br />
and Debt Holding<br />
Variable Coefficient<br />
Constant 4.126255***<br />
(1.058854)<br />
FOREIGN_DEBT -0.046944***<br />
(0.015499)<br />
RESIDENT_DEBT -0.043454*<br />
(0.025079)<br />
TOTAL_DEBT -0.003886<br />
(0.019561)<br />
Dependent: GDP growth. Panel regression. Std. errors in<br />
parentheses and * / ** / *** indicate statistical significants at<br />
10% / 5% / 1% level.<br />
Source: Own estimation.<br />
debt is associated with the largest reduction in output<br />
growth. This supports the hypothesis that a country<br />
with a high share of foreign debt holders faces more<br />
challenges than a country with high domestic debt<br />
holders. Consequently, the Greek and Portuguese debt<br />
problem is far more difficult to solve than the situation<br />
in Spain or Italy, where a relatively high proportion of<br />
the debt is held by residents.<br />
Recent evidence from the ECB’s bank-lending survey<br />
suggests that credit rationing increased in 2011, espe-<br />
cially towards non-financial corporations and house-<br />
holds. There are several reasons for this, including the<br />
higher risk of an economic downturn in the euro area,<br />
higher capital requirements, and further deleveraging<br />
needs. Interestingly, there has also been a decline in<br />
the demand for credit, which has been partly offset<br />
with more market-based financing via issuing corpo-<br />
rate bonds. Therefore, to evaluate the impact of this<br />
dynamic we estimate a regression of annual output<br />
growth on foreign debt-to-GDP, residential debt-to-<br />
GDP, and total debt-to-GDP. Figure 9 displays the<br />
graphical result. Statistically, all three regression mod-<br />
els show a significant negative relation between out-<br />
put growth and debt holding. This suggests that high<br />
debt levels are linked to lower output growth. It turns<br />
out that foreign debt holding has the largest negative<br />
impact on domestic growth (left panel).<br />
The second step of this empirical approach is the esti-<br />
mation of a multivariate time-series regression model.
20 THE EURO CRISIS AND ITS IMPLICATIONS<br />
The dependent variable is output growth and the inde-<br />
pendent variables are, once again, foreign debt-to-<br />
GDP, residential debt-to-GDP, and total debt-to-GDP,<br />
plus several control variables. By specifying time and<br />
cross-section fixed effects, an applicable equation was<br />
estimated. The results are reported in Table 7. Statis-<br />
tically, all coefficients display a significant negative<br />
effect.<br />
The multivariate regression confirms that foreign debt<br />
holding is a major obstacle to future growth. The neg-<br />
ative coefficient for foreign debt holding is the only<br />
one statistically significant at the 1% level. The other<br />
coefficients are significant at the 10% level or, in the<br />
case of total debt-to-GDP, statistically insignificant. We<br />
interpret the result as follows: A one percentage-point<br />
increase in foreign debt holding is associated with a<br />
reduction in subsequent output growth of 4-5% (Table<br />
7). Although this is quite high, we have not controlled<br />
for all growth factors in our regression model. There-<br />
fore, a suggestion for further research is an estimation<br />
of this effect within a comprehensive growth model<br />
according to Barro and Sala-i-Martin (2004). A sec-<br />
ond suggestion is to perform a threshold regression<br />
in order to identify the optimal debt level – the point at<br />
which debt turns from good to bad.<br />
It is important to note that our results are in line with<br />
preliminary literature in this field. Cecchetti et al.<br />
(2011) find that private, corporate, and household debt<br />
are negatively correlated with growth. Surprisingly,<br />
they first discover that government debt is positively<br />
related to growth. Admittedly, after testing all growth<br />
factors and crises they conclude that government debt<br />
is always negatively related to growth. The threshold<br />
for government debt is estimated to be around 85% of<br />
GDP, for corporate debt around 90% of GDP, and for<br />
household debt roughly 85% of GDP. Given the future<br />
challenges of demographic ageing and already-high<br />
tax levels in Europe, it will be difficult to stabilize or<br />
reduce current debt limits. Trabandt and Uhlig (2010)<br />
find that some European countries are already on the<br />
wrong side of the Laffer curve. This implies that they<br />
cannot generate additional revenue by further increas-<br />
ing capital income taxes. Consequently, fiscal policy<br />
will be more constrained in the future.<br />
<strong>DWS</strong> | GLOBAL FINANCIAL INSTITUTE<br />
There are other studies that confirm that debt crises<br />
may lead to significant contractions in output. For<br />
instance, Furceri and Zdzienicka (2011) conducted a<br />
study based on 154 countries from 1970 to 2008. They<br />
find that debt crises produce significant and long-last-<br />
ing output losses. On average, a debt crisis reduces<br />
output by about 10% after eight years. Moreover, it<br />
turns out that debt crises tend to be more detrimental<br />
than banking and currency crises. This result is similar<br />
to Reinhart and Rogoff (2010), who find that output is<br />
reduced by 1.8 percentage points when the debt-to-<br />
GDP ratio exceeds 70% and by more than 2.0 percent-<br />
age points when the debt-to-GDP ratio exceeds 90%.<br />
In summary, debt crises have a long-lasting and sig-<br />
nificant negative impact on output. Our analysis illus-<br />
trates that this impact is even more significant when<br />
foreign debt holding is high relative to residential debt<br />
holding.<br />
3.2 Economic Effects of Sovereign Spreads<br />
The financial and economic crisis, as well as the fail-<br />
ure to reverse global imbalances in a controlled way,<br />
have put significant pressure on public finances. On<br />
average, OECD countries’ deficits increased from 1%<br />
of GDP to 8% of GDP, while debt rose from 73% of<br />
GDP to 97% of GDP, between 2007 and 2010. The<br />
sovereign debt turmoil has been particularly severe in<br />
Greece, Portugal, Ireland, Spain, and Italy. In this sub-<br />
section we explore the major channels through which<br />
increasing sovereign spreads impact future output.<br />
A characteristic crisis of confidence in sovereigns is<br />
triggered by investors’ concerns about the sustain-<br />
ability of public finances. If the concerns are justified,<br />
the result is a decrease in sovereign creditworthiness<br />
and increase in sovereign spreads. Both effects drive<br />
up banks’ funding costs and impair funding and loan<br />
policies. Consequently, what are the triggering pro-<br />
cesses investors must look at to understand this tricky<br />
relationship?<br />
In theory, there are four channels through which sov-<br />
ereign risk affects bank funding conditions and the<br />
economy as a whole:<br />
1) Losses on sovereign holdings: Higher sovereign
21 THE EURO CRISIS AND ITS IMPLICATIONS<br />
yields mean losses on banks’ government bond hold-<br />
ings. This weakens the balance sheet, decreases cred-<br />
itworthiness, and affects over-the-counter derivative<br />
positions, the effects of which, according to anecdotal<br />
evidence, are sizeable (Davies 2011).<br />
2) Downgrading of banks: Sovereign downgrades<br />
often affect domestic bank ratings, raising their fund-<br />
ing costs and weakening their international market<br />
position. Only 2% of the domestic banks across seven<br />
euro area countries had a credit rating higher than that<br />
of their respective sovereign in 2010.<br />
3) Rescission of explicit and implicit state guaran-<br />
tees: The deterioration of sovereign debt reduces the<br />
funding benefits that banks derive from investments<br />
in public debt. Moreover, the political willingness of<br />
explicit and implicit support for banks has slightly<br />
changed this view. Nevertheless, more and more<br />
countries would like to have the banking system pay<br />
a fair contribution of stabilization costs via a (trans-<br />
action) tax. Others demand stricter financial regula-<br />
tion and supervision – higher core capital buffers, for<br />
instance – especially for systemic banks.<br />
4) Straitjacket of the euro area versus domestic mar-<br />
ket forces: There is evidence for the hypothesis that<br />
short-term government bond yields are related to the<br />
domestic deposit rates even if the ECB sets the mini-<br />
mum bid rate for all euro area countries. This relation-<br />
ship could have an impact on bank funding in certain<br />
countries and therefore affect the overall economy.<br />
<strong>DWS</strong> | GLOBAL FINANCIAL INSTITUTE<br />
Figure 10: Difference Between Short-Term and Taylor Interest Rate (in %)<br />
Source: own calculation with EU and ECB Data (2011,2012).<br />
5) Lower collateral values and higher needs for<br />
central bank funding: The significant downgrades of<br />
government bonds exclude papers from the pool of<br />
eligible collaterals. This affects the operations of the<br />
central bank, which uses sovereign debt as collateral,<br />
and impairs funding costs of private banks. The ECB<br />
has increased liquidity provisions – recently by two<br />
tenders of about €500 billion over three years – and<br />
collateralised this funding with the help of government<br />
bonds. This policy measure, which was meant to avoid<br />
a credit crunch, has reduced the funding pressure on<br />
private banks, but has transferred higher credit risks<br />
and exit costs to the ECB.<br />
Next, we study – using our own estimates – the impact<br />
of the liquidity provisions by the European Central Bank<br />
on sovereign debt and loan policies. The ECB plays a<br />
special role in the euro area because it faces a one-<br />
size-fits-all problem. Figure 10 shows that monetary<br />
policy was too accommodative from 2004 to 2008.<br />
Moreover, Figure 10 shows a sizeable heterogene-<br />
ity in the stance of monetary policy across countries<br />
in the euro area. This heterogeneity is a result of the<br />
fact that the interest rate differential – the difference<br />
between the key ECB interest rate and the theoreti-<br />
cally appropriate Taylor interest rate for each country<br />
– is dependent on the domestic market environment.<br />
A negative gap in Figure 10 illustrates that monetary<br />
policy is too expansive given economic conditions.<br />
Simply put, European monetary policy was too expan-<br />
sive – especially for the five problem countries of
22 THE EURO CRISIS AND ITS IMPLICATIONS<br />
Greece, Portugal, Ireland, Italy, and Spain – during the<br />
last decade.<br />
Since 2008, the situation – with the exception of<br />
Greece – has calmed down. However, macroeconomic<br />
stabilization has required ultra-low interest rates since<br />
2008. This has led to the so-called “zero lower bound”<br />
problem, in which interest rates fall nearly to zero and<br />
conventional monetary policy measures are rendered<br />
largely ineffective. Only unconventional measures,<br />
such as quantitative easing or other bond-purchasing<br />
programs, are effective in stimulating the economy<br />
and stabilizing the financial system. In theory, both<br />
conventional and unconventional policy measures<br />
increase the money supply and provide additional<br />
liquidity to markets. However, there is still a contro-<br />
versial debate in economics about the effectiveness of<br />
unconventional policy measures.<br />
The tactics vary. The Bank of Japan (BOJ) applied these<br />
extraordinary measures first in March 2001 because of<br />
the banking crisis of the 1990s. The BOJ purchased<br />
about ¥63 trillion of government and corporate bonds<br />
in 2005 to overcome deflation. Analysis of this policy<br />
has largely been negative because of its failure to<br />
accelerate recovery or significantly stimulate growth.<br />
After the collapse of Lehman Brothers in 2008, the<br />
Federal Reserve System in the United States adopted<br />
the same policy, causing its balance sheet to swell to<br />
$2.2 trillion. The Fed’s quantitative easing programs<br />
have mostly involved long-term government bonds<br />
and mortgage-backed securities. In March 2009, the<br />
Bank of England followed a similar policy and pur-<br />
chased about £198 billion of safe government bonds –<br />
one-sixth of the debt of the United Kingdom. The BOE<br />
<strong>DWS</strong> | GLOBAL FINANCIAL INSTITUTE<br />
Table 8: Comparison of Size of Quantitative Easing/Bond Purchasing Programs)<br />
Japan United States United Kingdom Euro Area<br />
2000 - 2004 2008 - 2010 2009 - 2010 2010<br />
In Relation to GDP (%) 4.0 10.8 13.5 0.7<br />
In Relation to Debt (%) 2.3 11.6 17.7 0.8<br />
Source: BoE, BoJ, EU, ECB, Fed, IMF (2011,2012).<br />
has been the most aggressive in the sheer expansion<br />
of its balance sheet.<br />
By contrast, the unconventional policy measures of<br />
the ECB have been less significant (Table 8). In May<br />
2010, during the initial stages of the sovereign debt<br />
crisis, the ECB initiated a bond-purchasing program in<br />
which it purchased about €63.5 billion of assets and<br />
extended long-term refinancing operations directly to<br />
banks. Both unconventional measures constitute a<br />
de facto euro zone version of quantitative easing. In<br />
addition, the ECB primarily bought risky government<br />
bonds of the troubled countries. The total volume is<br />
now estimated at €220 billion. Table 8 demonstrates<br />
that the size of liquidity provisions by the ECB was<br />
modest by international comparison until 2010. Thus,<br />
the ECB’s exit strategy – that is, the unwinding of its<br />
unconventional measures and shrinking of its balance<br />
sheet back to more normal levels – is less costly than<br />
for other central banks.<br />
Critics contend that these unconventional actions<br />
could fuel higher inflation and weaken the respective<br />
domestic currency. Whether these policy measures<br />
really do accelerate inflation remains unresolved.<br />
More dangerous in terms of inflation is the announce-<br />
ment by the Fed of its intention to keep its benchmark<br />
interest rate near zero until late 2014. This approach is<br />
linked to discussion of “financial repression” and con-<br />
stitutes an artificial manipulation of the yield curve by<br />
pulling down long-term bond yields. But what if the<br />
Fed gets it wrong? It would certainly not be the first<br />
time a central bank got it wrong (Barnett 2012).<br />
Next, we estimate the impact of sovereign yields on
23 THE EURO CRISIS AND ITS IMPLICATIONS<br />
Figure 11: Sovereign Risk Prima (in basis<br />
points) Versus Debt-to-GDP (in %) in<br />
Selected Euro Area Countries (2008 to<br />
2010)<br />
loan policy while controlling for monetary policy. Con-<br />
sistent with the literature, we find nonlinearities in<br />
the relationship between sovereign risk and govern-<br />
ment debt (Figure 11). In addition, our result confirms<br />
the hypothesis that loan policy is more constrained<br />
towards both non-financial and financial corporations.<br />
The impact on households is similar, but insignificant<br />
(Figure 2A – Appendix).<br />
Moreover, a comprehensive time-series regression<br />
confirms the negative impact on output of high sov-<br />
ereign spreads. By estimating a VAR model with inno-<br />
vatively gathered flow-of-funds statistics for the euro<br />
area, we find evidence that an unexpected policy tight-<br />
ening significantly cuts firm and household demand<br />
for bank loans. However, firms partially replace a<br />
monetary contraction with inter-company loans, while<br />
households increase precautionary savings. In the end,<br />
both effects slow economic activity and credit dynam-<br />
ics while worsening budget deficits. We find that loan<br />
policy matters most to the corporate sector due to the<br />
pivotal role of business firms in the economy.<br />
There are numerous avenues for further research. We<br />
suggest a panel data set for all euro area countries in<br />
order to identify existing differences in loan policies<br />
across euro area member states. Furthermore, the<br />
<strong>DWS</strong> | GLOBAL FINANCIAL INSTITUTE<br />
inclusion of more control variables, such as open mar-<br />
ket operations by the ECB, changes in the minimum<br />
bid rate, or downgrades, might improve the robust-<br />
ness of the results.<br />
3.3 Economic Effects of Austerity Measures<br />
The austerity hypothesis that slashing budget deficits<br />
will stimulate economic growth is currently in vogue<br />
in Europe. As a result, the last several years have seen<br />
considerable research in this field. Alesina and Perotti<br />
(1996) argue that fiscal consolidation is expansionary<br />
if implemented through spending cuts. This sounds<br />
contrary to conventional wisdom but is based on rig-<br />
orous empirical research. The following subsection<br />
briefly summarizes some stylized facts of austerity<br />
programs and their impact on the economy. There are<br />
three conclusions:<br />
* Fiscal adjustments on the spending side are more<br />
likely to lead to a permanent stabilisation of the budget<br />
than revenue increases;<br />
* Adjustments on the spending side have lower costs<br />
in terms of lost output;<br />
* Fiscal adjustments on the spending side are not fol-<br />
lowed by an economic downturn due to the so-called<br />
confidence effect on consumers and investors. Cred-<br />
ible spending-side consolidation does work.<br />
The quantitative impact of fiscal consolidation via<br />
higher revenues (i.e. higher taxes) is estimated by<br />
Romer and Romer (2007). They find that a 1% higher<br />
tax rate reduces output by about 3% in the follow-<br />
ing three years. On the other side of the ledger, the<br />
seminal paper by Blanchard and Perotti (2002) finds<br />
that spending-side consolidation increases output and<br />
consumption. For OECD countries, the authors also<br />
show that the effect of revenue-side consolidation is<br />
to reduce output in the first three quarters by an aver-<br />
age of 0.6 percentage points.<br />
It is important to understand that raising taxes has neg-<br />
ative supply-side effects on labour costs and invest-<br />
ments. On the contrary, these supply side-effects do
24 THE EURO CRISIS AND ITS IMPLICATIONS<br />
Table 9: Sustainability Regulation for Germany<br />
and United States (US)<br />
Variable Germany US<br />
Constant -3.7505* 0.0509***<br />
not apply to spending cuts, which imply lower future<br />
taxes. Almost all successful supply-side consolida-<br />
tion episodes led to lower interest rates and were<br />
supported by wage moderation, which played a key<br />
role in ensuring competitiveness. There is also evi-<br />
dence that countries that depreciate their currencies<br />
to regain competitiveness are unable to do so without<br />
wage restraints. In conclusion, whether a country is<br />
inside or outside a monetary union, wage moderation<br />
is always needed in order to regain competitiveness<br />
and to consolidate the public budget. The combina-<br />
tion of currency depreciation and wage restraint is the<br />
most efficient and fastest way to get back on track.<br />
3.4 Public Debt Sustainability: Evaluation of Inves-<br />
tors’ Decision-Making<br />
(1.9409) (0.0151)<br />
Debt-to-GDP 0.0610** -0.0017***<br />
(0.0265) (0.0002)<br />
GVAR -1.3354*** -0.01433**<br />
(0.0793) (0.0049)<br />
YVAR -22.4822*** -0.0530<br />
(4.2545) (0.2181)<br />
Adj. R-squared 0.8921 0.9298<br />
F-statistic 42.3587 71.6486<br />
Dependent: GDP growth. Primary deficit. Regression, Newy-<br />
West t-values controlled for autocorrelation and heteroskedasty.<br />
Std. errors in parentheses and * / ** / *** indicate statistical<br />
significants at 10% / 5% / 1% level.<br />
Source: Own estimation.<br />
Both liquidity and solvency aspects are linked to the<br />
analysis of the sustainability of public finances. Debt<br />
sustainability generally refers to the ability of the gov-<br />
ernment to manage its public finances by servicing its<br />
debt obligations while meeting the provisions of goods<br />
and services for society, both now and in the future.<br />
<strong>DWS</strong> | GLOBAL FINANCIAL INSTITUTE<br />
A simple starting point for the assessment of sustain-<br />
ability is the evolution of the government debt-to-GDP<br />
ratio. More in-depth studies also consider implicit gov-<br />
ernment debt and liquidity dimensions, i.e. whether the<br />
government is able to rollover its maturing debt obliga-<br />
tions in an orderly manner. This subsection exemplifies<br />
the assessment of sustainability for the United States<br />
and Germany. We argue that this approach is helpful in<br />
evaluating the sustainability of sovereign debt. More-<br />
over, it is easily applicable to investors’ decision-mak-<br />
ing. The scientific underpinning and technical detail of<br />
this method is based on a paper by Herzog (2010). 8 In<br />
this case we use data from 1980 to 2010 for govern-<br />
ment expenditures, deficits, primary deficits, debt, and<br />
output.<br />
The most effective test of sustainability of public<br />
finances is a positive response of primary surpluses<br />
to the debt-to-GDP ratio while controlling for govern-<br />
ment spending (GVAR) and the business cycle (YVAR).<br />
The regression results are reported in Table 9. Our<br />
estimates are robust for all regressions. 9 We find that<br />
German public finances are sustainable with a posi-<br />
tive debt-to-GDP coefficient of 0.061. This coefficient<br />
is statistically significant at the 5% level. In contrast,<br />
U.S. public finances are currently unsustainable with a<br />
negative debt-to-GDP coefficient of -0.001. This num-<br />
ber is statistically significant at the 1% level.<br />
Why is a positive response of primary surpluses to<br />
the debt-to-GDP ratio an indicator of sustainability?<br />
The positive relationship can be derived from a rigor-<br />
ous general equilibrium model, beyond the scope of<br />
this white paper. Here we explain this issue by a more<br />
intuitive approach. A necessary and sufficient condi-<br />
tion for unsustainable finances is the following empiri-<br />
cal relationship: Increasing primary deficits (negative<br />
number) triggers higher debt accumulation (positive<br />
number). In other words, this is a negative relation<br />
because the deficit becomes more negative and the<br />
debt becomes more positive. Thus, a negative relation<br />
indicates unsustainable finances. On the contrary, sus-<br />
tainable finances require a positive relationship, i.e. the<br />
higher the debt, the higher the primary surpluses or<br />
the lower the primary deficits.
25 THE EURO CRISIS AND ITS IMPLICATIONS<br />
For Germany we see this positive relationship in the<br />
debt-to-GDP coefficient in our regression. For the<br />
United States we find a significant negative relation-<br />
ship. This finding points to an unsound fiscal policy<br />
in the U.S. Our calculation has immediate and very<br />
valuable implications, because it provides a simple but<br />
useful assessment of the soundness of public finances<br />
across countries. Investors now have a relatively fast<br />
and applicable procedure for evaluating the sustain-<br />
ability of sovereign debt.<br />
The unsustainable situation in the United States is a<br />
huge policy challenge going forward. This challenge<br />
is amplified by the widening deficit and massive debt<br />
accumulation of the last several years, the weak eco-<br />
nomic outlook, accelerating health-care spending,<br />
and persistently elevated unemployment rates. Given<br />
that the U.S. also faces a large current account deficit<br />
4. POLICY CONCLUSIONS & OUTLOOK<br />
This white paper addresses the question of whether<br />
we face a pure euro crisis or a sovereign debt crisis<br />
and what the implications for the macroeconomy are.<br />
Fortunately, the euro has not lost confidence despite<br />
the challenging structural problems in the EMU. But<br />
how can a currency gain or lose confidence? Keep in<br />
mind that a currency is a confidence trick: Its value<br />
depends entirely on the belief that it has value. This<br />
belief, in turn, strongly depends on the monetary and<br />
fiscal fundamentals of a country or a group of countries<br />
in a monetary union. Since the European Central Bank<br />
is entirely independent, the euro crisis was mainly trig-<br />
gered by European and national policies. Thus, the<br />
euro crisis was caused by unsound fiscal policies and<br />
an unsuitable institutional setup within the EMU. The<br />
resulting crisis of confidence can be attributed to this<br />
unique setup.<br />
The re-design of this institutional framework requires<br />
both the strengthening of rules and increased eco-<br />
nomic integration. As discussed above, there are two<br />
long-run options: either more centralization or more<br />
decentralization. To date, the monetary union has<br />
<strong>DWS</strong> | GLOBAL FINANCIAL INSTITUTE<br />
and an ageing population, the debt problem could<br />
exacerbate in the future. By comparison, Germany is<br />
in a sound position. At the moment, the U.S. has the<br />
advantage that the dollar is still the world’s reserve<br />
currency, which allows it to borrow at reduces rates,<br />
and the demographic changes it faces are slower than<br />
in Europe.<br />
An interesting question for further research is the<br />
assessment of sustainability in all European coun-<br />
tries or the G-20. A second research hypothesis for<br />
the future is the question of nonlinear effects of the<br />
debt-to-GDP ratio and the impact of the 60% thresh-<br />
old. Resolution of these issues would offer important<br />
insights for investors. We recommend – as a lesson of<br />
the sovereign debt crisis – more research in this field<br />
to support the decision-making process of long-run<br />
financial investments in sovereign bond markets.<br />
been based on a decentralized market approach, but<br />
with a no-bailout clause that lacked credibility and a<br />
weak enforcement mechanism within the Stability and<br />
Growth Pact. Interestingly, the treaty also contains<br />
an implicit “no exit clause,” which creates the wrong<br />
incentives in such an environment. This arrangement<br />
led market participants to believe that all countries in<br />
the EMU are indistinguishable and that the project is<br />
irrevocable. However, this claim is wrong in an effec-<br />
tive decentralized approach. EMU fiscal policy was and<br />
still is made at the national level and therefore exposed<br />
to different domestic shocks and risks. Investors might<br />
learn that, despite a common currency, sovereign risks<br />
vary from country to country. There exist two options<br />
for circumventing this perception in the long run. The<br />
centralization approach establishes a transfer union via<br />
a permanent transfer of sovereignty from the national<br />
to the European level and a joint financing of public<br />
debt. The decentralized approach, on the other hand,<br />
is based on effective rules, market forces, and either a<br />
systematic exit clause or a temporary transfer of sov-<br />
ereignty in the case of unsound policy. Political com-<br />
mitment to one of the long-run options is needed to
26 THE EURO CRISIS AND ITS IMPLICATIONS<br />
stabilize the monetary union now and in the future.<br />
There is no doubt that the new fiscal compact is a step<br />
in the right direction, though past experience casts a<br />
skeptical eye on this approach. Nonetheless, it might<br />
be sufficient to buy time and bring back investors’ con-<br />
fidence in the euro area. Yet the long run remains chal-<br />
lenging, especially when reform pressures decline as<br />
market conditions improve. The litmus test will be the<br />
ongoing enhancement and rigorous implementation<br />
<strong>DWS</strong> | GLOBAL FINANCIAL INSTITUTE<br />
of the fiscal compact. Tackling the root causes is of<br />
particular interest in case of a crisis of confidence.<br />
A simple treatment with Keynesian stimulus policy,<br />
which is reasonable and appropriate in the face of<br />
demand shocks, will trigger the wrong incentives dur-<br />
ing such crises. Certainly there is no simple solution to<br />
the euro crisis, but muddling through without a clear<br />
direction is fraught with growing dangers – and ulti-<br />
mately doomed to fail.
27 THE EURO CRISIS AND ITS IMPLICATIONS<br />
References<br />
Alesina, A. and R. Perotti (1996), “Fiscal Discipline and<br />
the Budget Process”, American Economic Review,<br />
Vol. 86, No. 2, pp. 401-407.<br />
Anginer, D. and A. Demirguc-Kunt (2011), Has the<br />
Global Banking System Become More Fragile over<br />
Time?, Policy Research Working <strong>Paper</strong>, No. 5849,<br />
World Bank.<br />
Attinasi, M.G. et al. (2009), What Explains the Surge<br />
in Euro Area Sovereign Spreads during the Financial<br />
Crisis of 2007-08?, ECB Working <strong>Paper</strong>, No. 1131,<br />
Frankfurt.<br />
Barnett, W.A. (2012), Getting It Wrong – How Faulty<br />
Monetary Statistics Undermine the Fed, the Financial<br />
System, and the Economy, MIT Press.<br />
Barro, R. and X. Sala-i-Martin (2004), Economic<br />
Growth, MIT Press.<br />
BIS (2011), Interactions of sovereign debt manage-<br />
ment with monetary conditions and financial stability,<br />
Report, No. 42.<br />
Blanchard, O. and R. Perotti (2002), “An Empirical<br />
Characterization of the Dynamic Effects of Changes in<br />
Government Spending and Taxes on Output”, Quar-<br />
terly Journal of Economics, Vol. 11, pp. 1329-1368.<br />
Cecchetti, S. et al. (2011), The Future of Public Debt,<br />
in S. Gokarn (ed.), Challenges to central banking in the<br />
context of the financial crisis, pp. 183-217.<br />
Davies, M. (2011), “The rise of sovereign credit risk:<br />
implications for financial stability”, BIS Quarterly<br />
Review, No. 09, pp. 59-70.<br />
Elekdag, S. and Y. Wu (2011), Rapid Credit Growth:<br />
Boon or Boom-Bust?, IMF Working <strong>Paper</strong>, No. 241,<br />
Washington.<br />
Furceri, D. and A. Zdzienicka, (2011), How Costly<br />
Are Debt Crises?, IMF Working <strong>Paper</strong>, No. 280,<br />
Washington.<br />
<strong>DWS</strong> | GLOBAL FINANCIAL INSTITUTE<br />
Herzog, B. (2010), “Anwendung des Nachhaltigkeit-<br />
sansatzes von Bohn zur Etablierung eines Frühindika-<br />
tors in den öffentlichen Haushalten“, Kredit und Kapi-<br />
tal, Vol. 43, No. 2, pp. 183-206.<br />
Herzog, B. (2011), “Wohin steuert die europäische<br />
Wirtschafts- und Währungsunion?“, Zeitschrift<br />
Positionen, Vol. 19, pp. 7-24, Berlin, ISBN<br />
978-3-942775-40-3.<br />
Herzog, B. (2012), “EMU at Crossroads”, Quarterly<br />
Journal on European Issues, CESifo Forum, No.<br />
4/2011, pp. 23–29.<br />
Mink, R. et al. (2008), Reflecting Pensions in National<br />
Accounts Work of the Eurostat/ECB Task Force, NBER<br />
Working <strong>Paper</strong>, No. 15815.<br />
Reinhart, C.M. and K. Rogoff (2010), “Growth in time<br />
of debt”, American Economic Review, No. 100, pp.<br />
573-578.<br />
Romer, C. and D. Romer (2010), “The Macroeco-<br />
nomic Effects of Tax Changes: Estimates Based on a<br />
New Measure of Fiscal Shocks”, American Economic<br />
Review, Vol. 100, No. 3, pp. 763-801.<br />
Trabandt. M. and H. Uhlig (2010), How far are we from<br />
the slippery slope?, The Laffer curve revisited, ECB<br />
Working <strong>Paper</strong> Series, No. 1174.
28 THE EURO CRISIS AND ITS IMPLICATIONS<br />
Appendix<br />
Source: IMF (2011,2012).<br />
<strong>DWS</strong> | GLOBAL FINANCIAL INSTITUTE<br />
(Positive numbers for surplus countries and negative for deficit countries)<br />
Figure 1A: Current Account in Billions of USD of Major Countries in 2010
29 THE EURO CRISIS AND ITS IMPLICATIONS<br />
<strong>DWS</strong> | GLOBAL FINANCIAL INSTITUTE<br />
Figure 2A: Spreads on Sector-Specific Loan Policies, in log (y-axes)
30 THE EURO CRISIS AND ITS IMPLICATIONS<br />
Table A1: Residual Maturity of Government Debt, 2010<br />
Up to 1 year Over 1 and up to 5 years Over 5 years<br />
<strong>DWS</strong> | GLOBAL FINANCIAL INSTITUTE<br />
variable variable<br />
interest rates interest rates<br />
Belgium 24.0 35.5 0.0 40.5 0.0<br />
Germany 28.1 35.5 - 36.5 -<br />
Estonia 8.3 32.9 0.0 58.8 0.0<br />
Ireland - - - - -<br />
Greece 10.2 41.5 13.8 48.3 15.3<br />
Spain 21.5 35.9 0.0 42.6 0.0<br />
France 33.3 31.7 0.2 35.0 0.1<br />
Italy 25.2 30.4 5.4 44.5 4.2<br />
Cyprus 10.6 44.9 0.0 44.5 10.2<br />
Luxembourg 9.0 - - - -<br />
Malta 13.7 45.1 1.6 41.2 0.0<br />
Netherlands 29.6 31.7 0.0 38.7 0.0<br />
Austria 8.8 34.2 0.7 57.0 0.6<br />
Portugal 29.5 28.5 1.3 41.9 0.2<br />
Slovenia 8.8 34.1 3.8 57.1 0.8<br />
Slovakia 13.8 43.0 7.8 43.3 0.1<br />
Finland 24.0 34.9 12.8 41.1 13.7<br />
Euro Area 26.1 33.6 2.9 40.3 2.9<br />
Source: ECB (2011,2012).
31 THE EURO CRISIS AND ITS IMPLICATIONS<br />
Endnotes<br />
1. Private deficits are calculated as the current account<br />
minus the public balance. Thus, the number reports<br />
the private deficit holdings of the selected countries.<br />
2. I am preparing another <strong>DWS</strong> white paper about<br />
demographic challenges and their impact on the real<br />
and financial economy. This study contains a more<br />
detailed analysis of those implications and will be<br />
forthcoming in the second half of 2012.<br />
3. Cf Beise (2012). He is arguing that the crisis of con-<br />
fidence diffuses slowly towards the heart of Europe –<br />
the euro currency. Source: Süddeutsche Zeitung, 10<br />
January 2012.<br />
4. Cf Szalay (2012). She is arguing that the euro cur-<br />
rency is more prepared for the future challenges than<br />
the U.S. Europe is tackling the structural problems<br />
now, while the U.S. is shifting its problems into the<br />
future.<br />
5. Definition of government debt is always based<br />
on ESA debt (ESA stands for European System of<br />
Accounts 2010). ESA defines government debt as<br />
a stock variable which covers all explicit liabilities at<br />
market value, excluding equity. Therefore, the level of<br />
ESA debt is affected by changes in market yields.<br />
6. For our debt comparison we apply the “EDP debt”<br />
definition used in Europe. EDP stands for Excessive<br />
Debt Procedure. This definition covers government<br />
liabilities such as currency and deposits, securities<br />
other than shares (excluding financial derivatives), and<br />
loans.<br />
7. Net debt takes into account prices and marketability<br />
of government assets. However, this leads to potential<br />
biases in periods of market turbulences and compli-<br />
cates the compilation, whereas gross debt remains<br />
a more robust indicator and is better used for simple<br />
comparisons without the necessary adjustment we<br />
have to do under the net debt definition.<br />
8. Our data displays severe heteroskedasticity which is<br />
why we use Newy-West adjusted standard errors and<br />
tackle the stationarity problem by calculating the gaps<br />
<strong>DWS</strong> | GLOBAL FINANCIAL INSTITUTE<br />
of current to long-run trends. The long-run trends are<br />
estimated with a Hodrick-Prescott (HP) filter.<br />
9. We also estimated time-series regressions from<br />
1919 to 2011 and 1960 to 2011 for the U.S. We<br />
find a robust negative relationship between primary<br />
deficit and debt-to-GDP while controlling for govern-<br />
ment spending and the business cycle according to<br />
the Bohn approach. All results point to unsustainable<br />
public finances in the U.S. For Germany we have data<br />
restrictions until 1995 due to the re-unification process<br />
in 1990 and the new public finance budget rules in<br />
1995.
32<br />
DISCLAIMER <strong>DWS</strong> | GLOBAL FINANCIAL INSTITUTE<br />
<strong>DWS</strong> <strong>Investments</strong> is the global mutual fund business of the Asset Management division of Deutsche Bank Group, collectively<br />
referred to as “Deutsche Bank”. In the US, <strong>DWS</strong> <strong>Investments</strong> is the brand name for the US retail asset management and<br />
financial institutions group, a division of Deutsche Asset Management.<br />
This material was prepared without regard to the specific objectives, financial situation or needs of any particular person who<br />
may receive it. It is intended for informational purposes only and it is not intended that it be relied on to make any investment<br />
decision. It does not constitute investment advice or a recommendation or an offer or solicitation and is not the basis for any<br />
contract to purchase or sell any security or other instrument, or for Deutsche Bank AG and its affiliates to enter into or arrange<br />
any type of transaction as a consequence of any information contained herein. Neither Deutsche Bank AG nor any of its<br />
affiliates, gives any warranty as to the accuracy, reliability or completeness of information which is contained in this document.<br />
Except insofar as liability under any statute cannot be excluded, no member of the Deutsche Bank Group, the Issuer or any<br />
officer, employee or associate of them accepts any liability (whether arising in contract, in tort or negligence or otherwise) for<br />
any error or omission in this document or for any resulting loss or damage whether direct, indirect, consequential or otherwise<br />
suffered by the recipient of this document or any other person.<br />
The opinions and views presented in this document are solely the views of the author and may differ from those of <strong>DWS</strong><br />
<strong>Investments</strong> and the other business units of Deutsche Bank. The views expressed in this document constitute Deutsche Bank AG<br />
or its affiliates’ judgment at the time of issue and are subject to change. The value of shares/units and their derived income<br />
may fall as well as rise. Past performance or any prediction or forecast is not indicative of future results.<br />
Any forecasts provided herein are based upon our opinion of the market as at this date and are subject to change, dependent<br />
on future changes in the market. Any prediction, projection or forecast on the economy, stock market, bond market or the<br />
economic trends of the markets is not necessarily indicative of the future or likely performance. <strong>Investments</strong> are subject to<br />
risks, including possible loss of principal amount invested.<br />
Publication and distribution of this document may be subject to restrictions in certain jurisdictions.<br />
© <strong>DWS</strong> <strong>Investments</strong> · July 2012<br />
R-28416-1 (7/12)