biomethane-status-2014
biomethane-status-2014
biomethane-status-2014

You also want an ePaper? Increase the reach of your titles
YUMPU automatically turns print PDFs into web optimized ePapers that Google loves.
BiomethaneThis publication focusses on the <strong>status</strong>of <strong>biomethane</strong> (which includesupgraded biogas and bio-SNG)production, grid injection and use indifferent IEA countries. It also illustratesthe options and needs for thedevelopment of <strong>biomethane</strong> supplystrategies with the focus on improvedtrade. Further, an overview of expectedfuture development of the <strong>biomethane</strong>sector is given.Status and Factors AffectingMarket Development andTradeAs part of the study, results from adedicated questionnaire were assessedto get an insight into the opportunitiesand barriers for biogas and <strong>biomethane</strong>in the market in a number of countries.This study has been compiled as a jointeffort by experts from the Task 37 and40 of the IEA Bioenergy ImplementingAgreement.A Joint Study by IEA Bioenergy Task 40 and Task 37September <strong>2014</strong>1photo by © DBFZ, 2010
Biomethane – <strong>status</strong> and factors affecting marketdevelopment and tradeAuthors:Daniela Thrän (UFZ/DBFZ), Eric Billig (DBFZ)Tobias Persson, Mattias Svensson (SGC),Jaqueline Daniel-Gromke, Jens Ponitka, Michael Seiffert (DBFZ)John Baldwin (CNG Services)Lukas Kranzl, Fabian Schipfer, Julian Matzenberger (TU Wien)Nathalie Devriendt (VITO)Mathieu Dumont (RVO)Jonas Dahl (DTI)Günther Bochmann (BOKU, University of Natural Resources and Life Science, Vienna)EditorsMartin Junginger, chairman of IEA Bioenergy Task 40David Baxter, chairman of IEA Bioenergy Task 37,Of a Joint Study on behalf of IEA Bioenergy Task 40 and Task 37Copyright © <strong>2014</strong> IEA Bioenergy. All rights reserved.AcknowledgementThe authors and editors would kindly like to thank Attila Kovács and Arthur Wellinger fromEuropean Biogas Association (EBA) for review of this study.September <strong>2014</strong>2
GlossaryBiogas: Biogas, sometimes called raw biogas, is the combustible product of the anaerobicdigestion of different biomass substrates. It contains mainly methane (CH 4 ) (typically 50 –70%) and carbon dioxide (CO 2 ).Biomethane from biogas upgrading: Biomethane from upgraded biogas describes theproduction of <strong>biomethane</strong> by microbiological processes. The initial product is raw biogaswhich must be cleaned (normally called upgrading) to reach the high methane contentBiomethane: Biomethane is defined as methane produced from biomass (source: ISO DIS15669, in preparation), with properties close to natural gas. It can be produced bythermochemical conversion (see bio-SNG) or biochemical conversion (see <strong>biomethane</strong> frombiogas upgrading).Bio-SNG: Bio-SNG stands for biological synthetic natural gas and is a methane rich gas. It isproduced via gasification of lignin rich feedstock like wood followed by methanation.Gasification: Gasification, as a part of the bio-SNG production, describes the conversion ofwoody, lignin-rich materials into a synthetic gas by using of a gasification medium e.g. steamor oxygen. The produced synthetic gas consists mainly of carbon monoxide, carbon dioxide,methane, hydrogen and vapor in different proportions.H-gas: Natural gas quality specified by the Wobbe index. In these cases the gas is divided bythe Wobbe index. H-gas stands for high-gas. The range (in Germany) for the Wobbe index is12.8 to 15.7 kWh/m³. (DVGW 2000)L-gas: Natural gas quality specified by the Wobbe index. L-gas stands for low-gas. The range(in Germany) for the Wobbe index is 10.5 to 13 kWh/m³. (DVGW 2000)Methanation: Methanation is the conversion of the synthetic gas, which is produced duringgasification, into a methane rich gas. Generally a catalyst, often nickel, is used for reaction.The product is a gas, which consist mainly of methane and carbon dioxide, similar to biogas.Siloxanes: Are functional groups where two silicon atoms are connected via an oxygen atom.Depending on the substrate used to produce biogas and the process used for purification,<strong>biomethane</strong> can contain siloxanes. During combustion, siloxanes can be oxidized to silicondioxide, an abrasive compound harmful for mechanical moving parts in e.g. engines andturbines.SNG: SNG stands for synthetic natural gas and describes a methane rich gas. It is producedvia gasification followed by methanation of carbon-rich feedstock such as coal.Wobbe index: This index is an indicator of the quality of a fuel gas, measured from the heatproduced by burning through a defined orifice under standard temperature and pressureconditions.7
Executive summaryIn most IEA member countries, natural gas (NG) plays an import and particular increasingrole in energy provision to meet the demand for heat, electricity and transport fuels. Hence,natural gas is an important all-round energy carrier with an already well-developedinfrastructure in some countries such as gas grids, filling stations, road transport via heavyduty vehicles or marine transport via tanker in the form of compressed natural gas orliquefied natural gas. Nevertheless natural gas is a fossil based fuel and various countrieshave initiated the stepwise transition from a fossil resource base towards renewables due toconcerns regarding greenhouse gas emissions, energy security and conservation of finiteresources.Biomethane, defined as methane produced from biomass with properties close to naturalgas, is an interesting fuel to support the transition from fossil fuels to renewables and toachieve the greenhouse gas emission reduction targets in different ways. In principal,<strong>biomethane</strong> can be used for exactly the same applications as natural gas, if the finalcomposition is in line with the different natural gas qualities on the market. Therefore, it canbe used as a substitute for transport fuels, to produce combined heat and power (CHP), heatalone or serve as feedstock for the chemical sector. It can be transported and stored in thefacilities and infrastructure available for natural gas. Biomethane can be produced byupgrading biogas or as so called bio-SNG from thermo-chemical conversion of lignocellulosicbiomass or other forms of biomass.The aim of this study is to provide an up-to-date overview of the <strong>status</strong> of <strong>biomethane</strong>(which includes upgraded biogas and bio-SNG in this report) production, grid injection anduse in different countries, and to illustrate the options and needs for the development oflarger <strong>biomethane</strong> supply strategies. The focus is on technical, economic and managementrelatedhurdles to inject <strong>biomethane</strong> into the natural gas grid and to trade it transnationally.The study provides insights into the current <strong>status</strong> of technologies, technical requirementsand sustainability indicators as well as cost of <strong>biomethane</strong> production and use in general andespecially in selected countries. The study also assesses implementation strategies, marketsituations and market expectations in selected countries. Based on the findings in this report,proposals are given for actions to be taken to reduce barriers and to develop the marketstep by step.The technical feasibility to produce <strong>biomethane</strong> from biogas on a large scale has beendemonstrated over the last decade. Table 4-1 gives an overview of the <strong>biomethane</strong>production in selected IEA member countries. At the time of writing this report about 280biogas upgrading plants were running in several countries with an overall productioncapacity of some 100.000 Nm³/h. To inject biogas in the natural gas grid or to use it as avehicle fuel, the raw biogas has to be upgraded and pressurised. Biogas upgrading includesincreasing the energy density by separating carbon dioxide from methane. Furthermore,water, hydrogen sulphide and other contaminants are removed, sometimes before theupgrading process to avoid corrosion or other problems in downstream applications. Today,a range of technologies for CO 2 -separation are on the market. It is difficult to specify theexact characteristics for an upgrading technology, since the design and operating conditions8
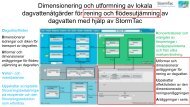
Today, the <strong>biomethane</strong> market is still at the very beginning. Different strategies, investmentprogrammes, support schemes and utilisation concepts have been adopted in differentcountries and there are different stakeholder expectations. Due to the complex supply chain,see Figure E-1, there are different environmental, economic and administrative hurdles forthe market introduction of <strong>biomethane</strong>. On the other hand, a survey of market expectationsin five selected focus countries of IEA Tasks 37 and 40 showed that many stakeholders havequite strong expectations for market growth. Even if the response to the survey per countryis not sufficient for a statistically sound analysis, it gave an insight in the trends andperceptions in the countries (Austria, Belgium, Germany, The Netherlands and Sweden).Regarding the policy for <strong>biomethane</strong>, it can be concluded that a good framework is necessaryto push <strong>biomethane</strong> development forward. Because of the challenging conditions of thepost-economic crisis of 2008, <strong>biomethane</strong> needs political support and as a result of that financialsupport. This conclusion is the same for all the countries surveyed. Even in countrieslike Germany and Sweden that have strongly promoted <strong>biomethane</strong>, financial support is stillan important factor. When asked if international trade should be developing, experts fromBelgium, Germany and Sweden answered positively. Respondents from the Netherlands andAustria were more sceptical whether international trade could or should be established inthe future. The main reason for doubt is that demand for <strong>biomethane</strong> in these countries ishigher than the production, so there will be nothing left for export. The Swedish respondentsreported that they hope to import <strong>biomethane</strong> to satisfy the increasing demand.Market introduction strategies have to consider the complex provision chain (Figure E-1),which has to include the very different stakeholders.Figure E-1. Framework of the <strong>biomethane</strong> value chainPromising markets are seen in those countries with dedicated <strong>biomethane</strong> strategies,targets and support schemes. Today there is a wide range of approaches, instruments and11
certificates established which can differ in technical demands on grid injection and end use,sustainability demands, support schemes and monitoring of the <strong>biomethane</strong> flows.Given the political strategies and the presence of an extensive natural gas grid, a number ofEU countries are becoming more active in the development of a <strong>biomethane</strong> market. Thereare on-going actions in the field of technical standardisation and sustainability certification,including mass balancing and tracing. Both are complex issues, but should provideinstruments in the next one or two years to improve the situation with <strong>biomethane</strong>application and cross border trade. Several European countries have established national<strong>biomethane</strong> registers, which provide information on the amount and origin of the available<strong>biomethane</strong> qualities to support the market implementation. Furthermore, there is already aplanned close cooperation between the national <strong>biomethane</strong> registers for better tradebetween six countries with the option of including more countries, see chapter 3.3.3.Relevant next steps for those registers are the development of a common terminology,tracing system and the definition of interfaces between the country specific quality demandswhile also enabling accounting and monitoring of the market. Additional problems fortransnational trade arise from the different support schemes developed in the differentcountries. Two aspects are relevant here:(i) The part of the supply chain to which the financial policy support is applied:Currently in the different countries different products are supported (<strong>biomethane</strong>feed into the grid, electricity provided from biogas, <strong>biomethane</strong> provided at fillingstations, etc.). From a national perspective this is reasonable due to different targetsand strategies for <strong>biomethane</strong>, but for international cooperation there is the risk ofconfusion. For international trade a very clear tracking of flows is necessary in order toavoid double support or marketing (e.g. at the injection point in one country and atthe delivery point in another country).(ii) Level of support: Today the specific level of support differs over a wide range (e.g.the feed-in-tariff for <strong>biomethane</strong> injected into the grid). If framework conditions forinternational trade are implemented it will be very easy to transport the <strong>biomethane</strong>via the gas grid to those countries giving the higher support or otherwise veryfavourable framework conditions, which may on the one hand accelerate marketdevelopment, but on the other hand may also cause some national support systemsto collapse. 1This has led to the conclusion that a more coherent EU-wide support structure betweencountries could make market development easier and reduce the complexity of the registrysystems. To ensure a successful regulated and sustainable market, stable frameworkconditions are needed. Therefore, the following recommendations can be given for such afuture <strong>biomethane</strong> market:• Technical standards regarding for <strong>biomethane</strong> injection to the natural gas grid,which aims for standardised <strong>biomethane</strong> quality (in a defined range) regarding e.g.calorific value and purity.1 Comparable experiences were made when single European countries implemented renewableelectricity certificates at the beginning of the 21 st . century, i.e. in the Netherlands large amounts ofrenewable electricity were imported as certificates to get a tax exemption. Within two years theDutch government had to significantly change the tax exemption scheme and ultimately switch to adifferent support scheme altogether.12
• Sustainability standards for all <strong>biomethane</strong> applications, but also with the possibilityto trade sustainable <strong>biomethane</strong> between the countries.• Certification and registries for a transparent national and international market of<strong>biomethane</strong> (e.g. no double support).• Equal treatment of domestic and imported <strong>biomethane</strong> (certification,support/incentive, etc.).• Support schemes need to be stable over the long term. From today’s perspective,uniform regulation for regions connected by a single natural gas grid (e.g. Europe)seems to be an important pre-requisite for the development of internationalmarkets; this study did not investigate in detail what such an instrument couldcontain (e.g. a uniform <strong>biomethane</strong> grid injection tariff, a quote, etc.).• Roadmaps for middle and long term <strong>biomethane</strong> targets in order to provide a guidefor incentives and support schemes.With regard to the complex provision chain of <strong>biomethane</strong>, different stakeholders in thefield and the transnational natural gas grid (especially in Europe) it is easy to understandthat framework conditions are difficult to achieve. Implementing the aboverecommendations should provide a good base for building a sustainable, fair, futureorientatedand stable <strong>biomethane</strong> market. An overarching international framework ofsustainability information (e.g. feedstock, origin, GHG emission from production andtransport, etc.) for fossil and renewable energy carrier could also support the <strong>biomethane</strong>market, but goes beyond the scope of this study.Outside the EU, only minor activities were observed, such as in the USA and South Korea,with less restriction than in the EU.13
1. Introduction1.1. BackgroundIn most IEA member countries natural gas (NG) is an important resource for meeting thedemand of heat, electricity and fuel. Natural gas is an important all-round energy carrierwith an already well-developed infrastructure in some countries such as pipelines (naturalgas grid, see the example of Europe in Figure 1-1) and filling stations as well as newdeveloping infrastructure like road transport via heavy duty vehicles or marine transport viatanker in the form of compressed natural gas (CNG) or liquefied natural gas (LNG). Wherethere are existing pipelines NG is easy to transport and has comparably low environmentalimpacts (low-emission combustion, see chapter 3.2.2). Further expansion in usage isexpected (IEA 2012).Figure 1-1. IEA, gas trade flows in Europe (OECD/IEA <strong>2014</strong>). LNG: liquefied natural gas; H-gasand L-gas stand for certain natural gas qualities specified by the Wobbe index (see alsoglossary)Over the past few decades, natural gas has become more important in different parts of theworld. For example, most EU countries with limited own production (except for Denmark,the United Kingdom and the Netherlands) have been forced to increase their imports.14
Overall, the OECD Europe 2 imported 265 billion cubic meters in 2010 and this is estimated toincrease to 335 billion cubic meters by 2020 (IEA 2012). Other countries are expanding useof natural gas to fill the gaps for future energy demand (e.g. Japan, China) (IEA 2013a). Themost important suppliers are Russia, the Middle East, Canada, Norway and North Africa.However, the United States of America are currently changing from a natural gas importer toa natural gas exporter because of the increasing shale gas recovery (IEA 2012). Variouscountries that have implemented or are currently implementing policy strategies (based onthe Kyoto Protocol) on greenhouse gas emission reduction, energy security and protectionof finite resources have initiated the stepwise transition from a fossil resource base towardsrenewables, such as the member states of the EU (European Union 2009a) and the USA (EPA2013a). Some countries have set concrete targets for the substitution of natural gas (e.g.Germany and Luxemburg).Biomethane is defined as methane produced from biomass (ISO 16559:<strong>2014</strong>), withproperties close to natural gas. When produced by thermal conversion (e.g. gasification andmethanation), the methane-rich product gas is normally referred to as biobased syntheticnatural gas (bio-SNG), whereas when it is produced by biological processes, includinglandfills and waste water treatment, the initial product is raw biogas which must be cleaned(normally called upgrading) to reach the high methane content that is referred to as<strong>biomethane</strong> from biogas upgrading. Bio-SNG and <strong>biomethane</strong> from upgraded biogas areessentially chemically identical and must meet the same technical specification to beinjected into natural gas pipelines.Biomethane in principal can be used for exactly the same applications as natural gas, if thefinal composition is in line with the different natural gas qualities on the market (i.e. H-gasand L-gas). Therefore, it can be used as a substitute for liquid transport fuels, to producecombined heat and power (CHP), heat alone and serve as feedstock for the chemical sector.In contrast to liquid biofuels such as biodiesel and bioethanol, <strong>biomethane</strong> and natural gasare fully interchangeable from an end-user perspective. Biomethane can also play asignificant role in future power-to-gas concepts by combination of renewable methane fromexcess electrical energy, e.g. by providing the renewable carbon source (separated CO 2 ), sothat hydrogen from excess energy conversion can be used to increase the methane outputof biogas process.Due to the close relationship with the natural gas market, energy units for <strong>biomethane</strong> areusually given in Nm³ or kWh (1 Nm³ of <strong>biomethane</strong> typically contains 10 kWh primary energy,equivalent to 36 MJ).1.2. Aim, scope and data sources of this studyThe aim of this study is to provide an up-to-date overview of the <strong>status</strong> of <strong>biomethane</strong>(which includes <strong>biomethane</strong> obtained from biogas and bio-SNG from gasification-of biomass)production, grid injection and use in different countries, and to illustrate the options andneeds for the development of <strong>biomethane</strong> supply strategies. The focus is on technical,economic and management-related hurdles to inject <strong>biomethane</strong> into the natural gas gridand to trade it transnationally. Therefore, the study provides insights on the current <strong>status</strong>2 OECD Europe: Austria, Belgium, Czech Republic, Denmark, Estonia, Finland, France, Germany,Greece, Hungary, Iceland, Ireland, Italy, Luxembourg, Netherlands, Norway, Poland, Portugal, SlovakRepublic, Slovenia, Spain, Sweden, Switzerland, Turkey and United Kingdom. For statistical reasons,this region also includes Israel.15
of technologies, technical requirements and sustainability indicators as well as cost of<strong>biomethane</strong> production and use in general and especially in selected countries. The studyalso assesses implementation strategies, market situations and market expectations inselected countries. Based on the findings in this report, proposals are given for actions to betaken to reduce barriers and to develop the market step by step.The study provides an overview on the technical demands on the provision of <strong>biomethane</strong>usable as a substitute for natural gas (chapter 2), the non-technical barriers andopportunities (chapter 3), market situation and expectation for <strong>biomethane</strong> in selectedcountries (chapter 4) and stepping stones towards market deployment and trade (chapter 5).Finally, conclusions are drawn with regard to necessary steps for the implementation ofinternational markets.This report was written for IEA Bioenergy Task 37 and Task 40. The sole responsibility for thecontent of the publication lies with the authors. It does not necessarily reflect the opinion ofthe IEA or the members of the IEA Bioenergy Implementing Agreement. IEA Bioenergy Task37 and Task 40 have reviewed and approved this report, but are not responsible for any usethat may be made of the information or opinions contained therein.The study is based on open literature. Also, data have been collected from membercountries of Task 37 and Task 40 3 . Given the large amount of biogas production in a numberof EU countries, the study focusses on Europe, with detailed investigation of some countries(Austria, Belgium, the Netherlands, Sweden and Germany). However, it is evident that anumber of countries in Asia and the Americas are rapidly increasing interest in <strong>biomethane</strong>production. An important source of information for this study was the EBA Biogas report2013 and the “Overview of Biomethane markets …” reports of the green gas grid project aswell as the Task 37 and Task 40 country reports. (EBA 2013), (GGG 2012)2. Production technologies for <strong>biomethane</strong>2.1. Overview on production pathwaysBiomethane can be generated from various sources of biomass using two differentprocesses: anaerobic fermentation and thermochemical gasification (Figure 2-1). They arecharacterised by using different feedstocks, technologies and different scales for conversion,while the energy yield, e.g. from energy crops per hectare arable land is similar. Biomethanecan be produced from a wide range of feedstocks, so in general, the technical <strong>biomethane</strong>potential could be very high (source (Thrän et al. 2007)).Anaerobic digestion and biogas upgrading has been successfully demonstrated. On a globallevel, about 277 biogas upgrading plants, connected to anaerobic digesters, were inoperation in the end of 2012. Their geographical location can be seen in Figure 2-2.Biomethane can be transported and stored in the facilities and infrastructure available fornatural gas. Some degree of pressurisation is needed for injection into NG pipelines.Table 2-1 gives a general overview of the range of the components of biogas compared tonatural gas.3 Austria, Belgium, The Netherlands, Sweden, Germany, France, Switzerland, United Kingdom, Italy,Denmark, Ireland, Finland, Norway, United States of America, Canada, Brazil, Korea16
Gasification and methanation of biomass to bio-SNG is still in the research anddemonstration stage. Production of bio-SNG was demonstrated for the first time on a 2 MWscalein Güssing/Austria using a fluidised bed gasifier and forest residues. The next step inthe scale-up process (to 20 MW) is taking place in Sweden.Anaerobic Digestion and UpgradingGasification and MethanationMedium to high capacities, 20 to 340 MW CH4Figure 2-1. Provision routes of <strong>biomethane</strong>, adapted from (Thrän 2012)Denmark 1Italy 1China 1Hungary 1 Spain 1Canada 2France 3Luxenburg 3UK 3 Norway 5Finland 5South Korea 5Japan 6Austria 10Germany120Switzerland 16The Netherlands16USA 25Sweden 53Figure 2-2. Location of 277 biogas upgrading plants, connected to anaerobic digesters,in operation at the end of 2012.17
Biomethane can be transported and stored in the facilities and infrastructure available fornatural gas. Some degree of pressurisation is needed for injection into NG pipelines.Table 2-1. Properties of natural gas and raw biogas (DVGW 2000), (DVGW 2004), (Beilet al. 2011)SubstanceBiogas from anaerobic Natural gas (H-gas quality)fermentationmethane 50 – 85 % 83 – 98 %carbon dioxide 15 – 50 % 0 – 1,4 %nitrogen 0 – 1 % 0,6 – 2,7 %oxygen 0,01 – 1 % -hydrogen traces -hydrogen sulfide up to 4,000 ppmv -ammonia traces -ethane - up to 11 %propane - up to 3 %siloxane 0 – 5 mg/m³ -Wobbe Index 4.6 – 9.1 11.3 – 15.42.2. Technical options for biogas upgradingTo inject biogas in the NG grid or to use it as a vehicle fuel, the raw biogas has to beupgraded and pressurised. Biogas upgrading means that the carbon dioxide in the biogas isremoved to increase the energy density. Furthermore, water, hydrogen sulphide and othercontaminants are also removed (this step is commonly called gas cleaning), sometimesbefore the upgrading process to avoid corrosion or other problems in downstreamapplications.There are different methods used for carbon dioxide removal. Absorptive and adsorptiveprocesses can be distinguished as well as processes based on membrane filtration orcryogenic separation. The different technologies are described below and someperformance information is summarised in Table 2-2.In the water and the organic physical scrubber the biogas is pressurized (5-10 bar) and thecarbon dioxide is dissolved in the water or a selective organic solvent. The biogas isupgraded and the dissolved carbon dioxide is released from the solvent in a desorptionvessel at atmospheric pressure during air stripping.In a chemical scrubber, the in water dissolved carbon dioxide (carbon acid) reacts with anadded amine and thus can be separated from the gas stream. This process can be carried outat atmospheric pressure since it is a chemical reaction that drives the process. Heat isneeded to reverse the reaction and release the carbon dioxide in a stripper vessel andrestore the amine.In a pressure swing adsorption (PSA) system, the raw biogas is pressurized (3-10 bar) andfed into an adsorption column filled with an adsorbent, such as carbon molecular sieves.Carbon dioxide is adsorbed by the bed material and the <strong>biomethane</strong> passes through. The18
carbon dioxide is desorbed from the adsorbent by reducing the pressure and using a purgegas (commonly <strong>biomethane</strong>).In membrane separation the biogas is pressurized (5 – 20 bar) and fed into the membraneunit. The carbon dioxide, as well as other gas components, permeates through themembrane, whereas the methane is retained. The performance varies widely depending onthe settings (e.g. pressure stages, loops) and the unique design adopted by eachmanufacturer.Cryogenic separation is a developing technology with so far only one plant in operationaccording to the knowledge of the authors. Methane and carbon dioxide are separated bygradually cooling down the raw biogas. All compounds with higher condensationtemperature than methane, such as water, hydrogen sulphide, siloxanes and nitrogen, canbe separated in this process. Since this is still a developing technology it is not included inTable 2-2. In case of an increasing share of LNG in the market, e.g. for transport, cryogenicseparation might be of growing importance because of the benefits to be gained byintegration of CH 4 separation with liquefaction units for the CH 4 .In a water scrubber, hydrogen sulphide is commonly separated together with carbon dioxide.For the other technologies, an external H 2 S removal device is needed. Commonly, this is anactivated carbon filter, but other technologies also exist on the market (Petersson 2013).Regarding siloxanes (derived from waste consumer products and especially prevalent inlandfill gas), preliminary results suggest that they are effectively separated by mostupgrading technologies (Arrhenius et al. 2011). However, more detailed research is neededfor verification. More detailed information about the different technologies used for biogasupgrading can be found in the literature (Bauer et al. 2013a).Table 2-2. Overview of the properties and the performance of the mature biogas upgradingtechnologies (Bauer et al. 2013a)ParameterWaterscrubberPSA Membrane(2-4stages)Chemicalscrubber(amine)OrganicphysicalscrubberCH 4 in product gas 96 – 98 % 96 – 98 % 96 – 98 % 96 - 99 % 96 – 98 %Availability 95 - 98% 95 – 98 % 95 - 98% 95 - 98% 95 – 98 %Annual maintenance 2 - 3% 2 – 3 % 3 – 4 % 2 – 3 % 2 – 3 %cost(% of investment cost)H 2S removal Yes External External External/Yes ExternalH 2O removal External Yes Yes External ExternalN 2and O 2separation No No/partly Partly (O 2 ) No NoElectricityconsumption(product gas > 4bar(g))(kWh/Nm³ raw biogas)Heat(kWh/Nm³ raw biogas)0.2 – 0.3 0.2 – 0.3 0.2 – 0.3 0.10 – 0.15 0.2 – 0.3None None None 0.5 – 0.6 InternalPure CO 2No Yes Yes Yes No19
The first biogas upgrading plants were built in the 1980´s and a few more in the 1990´s, butit was not until 2006 that development really took off, especially in Germany. From thenuntil today, more than 200 biogas upgrading plants have been built and taken into operation.Pressure swing adsorption (PSA) and water scrubber have had major parts of the marketsince the beginning. From 2009, chemical scrubbers (e.g. amine scrubber) have increasedtheir market share. The latest developments indicate that the membrane technology willgain a larger market share in the coming years. The existing market share between thedifferent technologies is shown in Figure 2-3.Methane loss (normally called methane slip) from biogas upgrading is intensively discussedin some countries. Larger manufacturers guarantee methane losses below 0.5 - 2% in a newplant, and 0.1% for amine scrubbers. Some type of off-gas treatment is needed for alltechnologies, except for the amine scrubber, in markets such as Germany where only 0.2%of the methane is allowed to be released from the upgrading plant. However in othercountries, such as Sweden, off-gas treatment is commonly not needed since larger methaneemissions are allowed from the upgrading plant.The electricity consumption for the different technologies is quite similar, usually between0.2 and 0.3 kWh/Nm 3 raw biogas, except for the amine scrubber, which has electricityconsumption around 0.10-0.15 kWh/Nm 3 . The exact electricity consumption will depend onseveral parameters such as the size of the unit, the pressure in the system, the specificdesign and in some cases on the outdoor temperature (mainly physical scrubbers) and themethane concentration in the raw biogas (mainly PSA). The amine scrubber has anadditional heat demand around 0.5-0.6 kWh/Nm 3 to facilitate the desorption of the carbondioxide from the reagent (Bauer et al. 2013b). Specific investment costs for upgradingfacilities significantly decrease up to a capacity of 500 Nm 3 raw biogas/h for all the differenttechnologies (Bauer et al 2013a). For units above 500 Nm³ raw biogas/h a cost range of1.000 – 3.000 €/Nm³ is found. Further development of the technology will decrease thatlevel (GGG 2013).Cryogenicseparation 0,4%Organic physicalscrubber 6%Membrane 10%Water scrubber41%PSA 21%Chemicalscrubber 22%Figure 2-3. The market share 2012 of the different technologies used for biogas upgradingtoday according to the information collected by IEA Bioenergy Task 37.20
The pressure of the <strong>biomethane</strong> after the biogas upgrading should be considered as well asthe heat recovery potential when evaluating the overall economy of a biogas injection plant.The energy needed for possible additional pressurisation before injection into the grid willbe higher if the operating pressure of the biogas upgrading unit is low. Annual service costsare commonly between 2 and 4% of the investment cost.2.3. Technical options for raw SNG upgradingThe thermo-chemical production pathway of synthetic natural gas aims to convert solidbiomass into gas with high methane content (approx. 95%). The conversion pathway frombiomass to SNG can be subdivided into five process steps: (i) biomass pre-treatment, (ii)biomass gasification, (iii) raw gas cleaning, (iv) methanation and (v) raw-SNG upgrading. Inthe following, the technology of the raw-SNG upgrading will be described.To feed Bio-SNG into the natural gas grid, it has to meet the quality requirements of the grid.Therefore, a final raw-SNG upgrading is necessary after methane formation (methanation)from the raw gas. Raw gas upgrading includes the separation of carbon dioxide, water anddepending on the raw gas quality, other gas components (e.g. hydrogen). Therefore, besidesthe SNG composition and purity, the Wobbe index is of particular interest.For all raw gas upgrading steps, several technologies are currently available on the marketand in operation for coal gas treatment processes, natural gas treatment processes andbiogas upgrading processes (see chapter 2.2). A relevant adsorption process for Bio-SNGproduction systems is pressure swing adsorption (PSA) for the adsorption of carbon dioxide,e.g. on an active carbon bed. However, due to specific aspects of their technical operation,different technologies may be more appropriate for small scale and large scale applications.Depending on the upgrading technology, further drying could be necessary. In general, toachieve this, the gas is cooled down below the water dew point. For further drying,adsorptive and absorptive methods can be applied (Seiffert and Rönsch 2012).2.4. Application of <strong>biomethane</strong>The possible end-uses of <strong>biomethane</strong> do not differ from those for natural gas. Biomethane ischemically similar to a lean natural gas with lower levels of higher hydrocarbons. Thereforethe Wobbe Index of <strong>biomethane</strong> injected to the NG pipeline may need to be adjusted byaddition of liquefied petroleum gas (LPG). Biomethane is fully miscible in all proportions withits fossil counterpart, and fully interchangeable from an end-user perspective. This is not thecase for liquid biofuels, such as biodiesel and bioethanol.The preferred end-use of <strong>biomethane</strong> depends heavily on the framework conditions of thecountry where it is produced.If electricity generation is favoured, the raw biogas is only upgraded to <strong>biomethane</strong> if thedirect production of power and heat from biogas is not possible. In comparison to on-siteconversion of biogas into electricity, the upgrading of biogas to <strong>biomethane</strong> affords muchmore flexible use of <strong>biomethane</strong> so that better utilisation of heat can be achieved. A recenttrend has been for countries to provide subsidies to promote biogas upgrading for NGpipeline injection in cases where heat recovered after electricity generation is wasted due tolack of available market.21
In this way, <strong>biomethane</strong> becomes similar to natural gas regarding its distribution andavailability for all types of electricity generation end-uses. Examples of European countrieswhere electricity generation from biogas dominates are: Germany, Spain and Austria.Examples of countries where grid injection schemes are becoming increasingly common arethe Netherlands, Switzerland, Austria, United Kingdom and Germany.Biomethane can also be used directly as automotive fuel, in which case it can be producedto the same compositional standard as pipeline NG, or it can be made to a higher specificationfor higher performance vehicles. Biomethane as a fuel was first applied for trucks duringand after World War II in a number of European cities. It was relaunched as an automotivefuel in the early 1990’s in Switzerland and Sweden and this kind of end-use has now spreadall over the world, predominantly in Europe and the USA. By the end of 2013, <strong>biomethane</strong>was available as an automotive fuel in 13 European countries (Green Gas Grids). Policiessuch as tax reductions on clean vehicles and renewable fuel quota systems are important forthe emergence and growth of this form of use. Sweden is the country in Europe where thisutilisation route is dominating, due to the significantly lower tariff for green electricity(tenfold lower than Germany; quota system with market controlled pricing). Hard factsabout <strong>biomethane</strong> utilisation as transport fuel are sparse. Three countries dominate in termsof volumes used: USA (600-1,000 GWh/a (2013), fourfold increase projected for <strong>2014</strong>)Germany (150-500 GWh/a, (2013)), and finally Sweden, the only country, besides Iceland,where the <strong>biomethane</strong> utilisation for automotive purposes is larger than the one for naturalgas (869 GWh/a <strong>biomethane</strong> out of a total 1,493 GWh/a (2013)). Other countries with statistics(2013) for <strong>biomethane</strong> are The Netherlands (ca 240 GWh/a), Switzerland (90-180 GWh/a), Austria (35 GWh/a), Norway (30 GWh/a), France (20 GWh/a), Iceland(20 GWh/a), Italy (15 GWh/a) and Finland (10 GWh/a). The United Kingdom is also using <strong>biomethane</strong>for automotive purposes, but no statistics are available. A very rough world estimatewould be 2-3 TWh/a, rising rapidly up to 6 TWh/a if the projections for the US holds true.As an automotive fuel, <strong>biomethane</strong> clearly outranks petrol with its motor octane number(MON) of 130, but only in a fully dedicated internal combustion engine (ICE) can this be fullyexploited. In most cases, the gas is used in bi-fuel mode, so the spark ignited ICE is acompromise design, based upon the combustion constraints of both petrol and methane. Inheavy duty applications, compression ignited diesel ICE’s are still better compared todedicated methane powered spark ignited ICE’s. This is however gradually changing, in partthrough the application of advanced control strategies and exhaust gas recirculation (EGR).New research into fuel fed pre-chamber ignition is showing great promise. Emissionsperformance from heavy duty methane engines has recently been reviewed by IEA-AMF(Olofsson et al. <strong>2014</strong>).Compared to <strong>biomethane</strong>, natural gas has a wider range of fuel qualities. With the presenceof higher hydrocarbons in the gaseous fuel the knocking propensity in ICE’s increases. This ismeasured by the methane number (MN), where pure methane has an MN of 100, and purehydrogen is given the MN of 0 4 . Lean natural gas and <strong>biomethane</strong> has MN’s around 100,richer natural gas qualities, with high levels of higher hydrocarbons, decrease the MN downto levels around or below 70.4 MN is by definition dimensionless. It is calculated by comparing the composition of the actual fuelused with data from testing of different ternary mixes of reference fuels made by AVL back in the 70’s.There’s no analytical solution, so dedicated software is needed to estimate the MN, with severalcommercial alternatives available on the market. See section 2.5 for further information.22
In comparison to stationary electricity generating ICE’s working at steady-state, the tracecomponents in <strong>biomethane</strong> used as automotive fuel need to be controlled even further, dueto the transient operation and stricter emission regulations of ICE’s in automotiveapplications. Please refer to chapter 2.5 for more information.Finally, <strong>biomethane</strong> can be used as a feedstock for the production of many differentproducts (paints, plastics, detergents, etc.) in the specialty chemicals industry. There is akeenness to increase the renewable share in the products, provided costs are justified.However, to the best knowledge of the authors, no significant sales of <strong>biomethane</strong> as afeedstock to this sector are taking place today. The price levels are still too high, howevercustomer expectations and increased availability of sustainably manufactured goods mayincrease the price tolerance of the industry in the future.2.5. Technical standards for the use of <strong>biomethane</strong> as vehicle fuel,for grid injection and as LNGVehicle manufacturers, having identified natural gas as a major future alternative fuel, aredeveloping more efficient gas engines, aiming for diesel-like performance in the heavy-dutysegment. Together with the introduction of more strict emission regulations in the U.S. andEurope, the OEM’s (Original Equipment Manufacturer) have therefore become moreproactive in the standardization arena, since tighter specifications would facilitate theirengine development work.Simultaneously, <strong>biomethane</strong>, used directly as automotive fuel or being injected into thenatural gas grid, has been identified by the European Commission as an importantrenewable fuel where missing standards hamper its market development. A mandate(M/475) was issued in 2010 “…for standards for <strong>biomethane</strong> for use in transport andinjection in natural gas pipelines”, the starting point for the current standardization work on<strong>biomethane</strong> within CEN (Comité Européen de Normalisation).2.5.1. Current standardsThe current international standard for CNG, issued in 2006 ”ISO 15403 Natural gas – Naturalgas for use as a compressed fuel for vehicles” is based largely on the American SAE J1616from 1994. It is divided in two parts, where the first one is normative, but with noquantitative limits. Part 2, an informative technical report, was issued on request from theOEM’s, which wanted more information published on suggestions for suitable limits for thedifferent parameters.The German national standard for CNG, ”DIN 51624:2008-02 Kraftstoffe für Kraftfahrzeuge –Erdgas – Anforderungen und Prüfverfahren (Automotive fuels – Compressed natural gas –Requirements and test methods)” is one of the most strict standards issued to date, withlimits of total sulfur, methane content and methane number that has the effect of excludinga large number of the European grid gas qualities. Outside Europe, the standard issued bythe state of California (California Code of Regulations, 13 CCR § 2292.5 Specifications forCompressed Natural Gas) is used by several states in the US.Regarding <strong>biomethane</strong>, there is a range of national standards in Europe for the injection ofupgraded and purified biogas into the natural gas grid. An overview was published by23
Marcogaz 2006 5 . A number of other countries have since then introduced standards, e.g.Belgium and the Czech Republic. Outside Europe there is the ”Rule 30“ standard issued bySouthern California Gas Company. The Swedish standard SS 155438 ”Motor fuels - Biogas asfuel for high-speed Otto engines” (1999) is to date the only standard regulating the directutilisation of <strong>biomethane</strong> as an automotive fuel. Another alternative outside the EU can befound in South Korea with similar conditions as in Sweden (Kang 2013).2.5.2. On-going standardization work within CENWork on the international standardization of <strong>biomethane</strong> injection into the natural gassystem has been ongoing since the Marcogaz report was issued. In Europe, work is organisedby CEN in a joint technical committee (TC408) ”…for transport applications and injection innatural gas pipelines”. The work started late 2011. In addition to <strong>biomethane</strong>, natural gasused as an automotive fuel has also been included to the scope of the work. Working draftsof the standard, divided into two parts, where issued early <strong>2014</strong> (as seen in Figure 2-4). Theone for injection of <strong>biomethane</strong> into the grid, prEN 16723-1, relies heavily upon the parallelstandardization work in CEN/TC234/WG11 on natural gas quality (prEN 16726 Gasinfrastructure — Quality of gas - Group H). Mandate M/475 from the European Commissionstipulates that the parameters and limits adopted by prEN 16726 should be taken over andreferred to by TC408. In contrast, the second part for automotive fuel, prEN 16723-2, is astand-alone document.As seen in Figure 2-4, for prEN 16723-2, there will be two gaseous fuel qualities defined,reflecting the current market situation with non-grid based sourcing solutions of CNG andLNG complementing the one of the grid, both renewable and fossil. The only differingparameter is methane number (MN), as defined by the MWM 6 method (similar to theoriginal AVL 7 method). In local dedicated infrastructures, a more stringent minimum limit ofMN 80 is adopted, while in the grid the limit implemented by prEN 16726 is adopted, MN 65.The majority of natural gas grids carry gas with a minimum of MN 70. If the current scheduleholds, the two new standards prEN 16726, and prEN 16723 part 1 and 2, will be approvedand published by the end of 2015.5 Marcogaz (2006). “Injection of Gases from Non-Conventional Sources into Gas Networks”6 The MWM is an alternative method for the calculation of methane number. The raw data is thesame as for the AVL method, but MWM developed its own algorithms. The company MWM hasdecided to make their algorithms public and free to use, through publication in the upcomingprEN 16726 on natural gas quality.7 The AVL is the original method for calculating the methane number. The raw data come from runswith different fuel compositions on a test engine back in the 1970’s. A description can be found in DIN51624, Appendix B, “Berechnung der Methanzahl (MZ)”. Additional information also available in ISO15403-1.24
Figure 2-4. Schematic of the <strong>biomethane</strong> and natural gas transport system, showing in whichpoints of the gas network the different standards of CEN/TC408 will apply; the point of entryfor injection, and the point of use as automotive fuel. Source: CEN/TC408 working group.2.5.3. Parameters of interestThe most discussed parameter in the two standard documents is sulfur. The automotiveindustry has a need for very low levels of sulfur in order to achieve durability in their exhaustafter-treatment systems (EATS). The most prevalent source of sulfur is added for safetyreasons; most of the odorization compounds used contains sulfur. In some countries, theodorant is added well above the wished for 10 ppmM sulfur level. The prEN 16726 puts amaximum limit of 20 mg/m 3 , odorization excluded since it is a national issue. With refuellingstation-based conditioning costs being prohibitive, it was impossible to implement a strictersulfur level in the automotive fuel standard. However, it is stated that <strong>biomethane</strong> and LNGin most cases readily meet the 10 ppmV requirement.The origin of silicon containing siloxanes in biogas is man-made silicon products andadditives. Landfill gas and sewage gas thus have the highest silicon levels, with raw biogaslevels of 10-20 mg/m 3 , and peak levels above 100 mg/m 3 reported. The effect of siloxaneson appliances is cumulative, hinging on its precipitation during combustion as silica (silicondioxide). The silica builds up on valves, cylinder walls and liners, causing abrasion andblockages. Downstream of the engine, switch-type oxygen sensors may withstand less than0.1 mg Si/m 3 if wanting to avoid replacement during the lifetime of the car. Silica build-up inthe EATS catalysts lead to cumulative and irreversible loss of degrading activity.Unfortunately, neither of the TC 408 parts of the standard include a limit because of thecurrent lack of standardization of test methods.25
For the injection standard, health risk is the most important criterion when choosing thelimits. A special deterministic exposure model, devised by the French safety authorityAFFSET (Agence française de sécurité sanitaire de l'environnement et du travail), was usedto find the compounds that need to be limited. It models the kitchen use of a cooker and/orhob without dedicated exhaust gas extraction. Work is ongoing, with the parameters ofPAHs, HCN and chlorinated and fluorinated compounds identified as being of interest.Carbon monoxide, CO, is already included in the working draft, with a suggested limit of0.1 %. It is based on a worst case scenario with an unventilated room having a leaking pipe inclose proximity to a sleeping person.After health, the second most important criteria is the integrity of the pipelines. Besideslevels for water, hydrogen sulphide, ammonia and oxygen, which are set to avoid corrosion,there is also a special need for stringent levels of oxygen and hydrogen if the gas is notconveyed in a dry system and if the gas is conveyed in proximity to underground storagesystems. In prEN16726, oxygen is therefore stated with two levels, 0.0001 % and 1 %. Thelatter figure is also stipulated by the automotive fuel standard. Hydrogen, on the other hand,is not regulated in prEN 16726, because of the difficulty to find one or even two valueswhich satisfy the large array of possible limits for different parts of the European gas grid.The automotive fuel standard has stipulated a maximum limit of 2 %, in order to protect thehigh-pressure storage cylinders from corrosion.Avoiding liquid water at all temperatures and pressures gives protection from corrosion. The-8°C limit on the water dew temperature at maximum operating pressure stipulated by prEN16726 is in most cases more than satisfactory. However, when decompression chilling takesplace in natural gas vehicles, there is a risk for hydrocarbon hydrate formation in the fuelsystem, impairing drivability. Therefore, in the automotive fuel standard there are threeclasses of water dew points, -10°C, -20°C and -30°C at 200-bars, in order to allow forclimate dependent adoption at national level. The risk of precipitation of higherhydrocarbons has been regulated by setting a hydrocarbon dew temperature limit ofmaximum -2°C for all pressures.Drivability is also affected by entrained compressor oil, mostly originating from the refuellingstation compressors. Just like with water, complete engine failure is not the result, butrather different degrees of reduced drivability, including engine stalling, and increasedmaintenance costs. Also, combustion of the oil in the engine leads to more particleformation, which invariably increases the carcinogenicity of the emissions. Presently, there isno standardized test method available for measuring compressor oil, but a method hasrecently been developed by SP Technical Research Institute of Sweden.The issue of microbial content in biogas is not directly addressed in the TC408 standarddrafts, but is mentioned in the comment for dust impurities. The use of a filter with anominal mesh size of less than 1 µm is stated to remove most of the biogenic material. ASwedish study showed that levels of microorganisms are as high in natural gas as it is in<strong>biomethane</strong>, and that even if a potent pathogen would be present, the risk of suffocationsurpasses the risk of contamination (Vinnerås et al. 2006). The standard drafts quote a Dutchstudy (Vlap and de Haan 2013) that showed that filters with an efficiency of at least 99.95 %(0.2 - 10 µm) are efficient enough to reduce the risks of microbiological contamination of thegas.26
3. Frame condition, barriers and opportunities for <strong>biomethane</strong>production and useThis chapter considers framework conditions, barriers and opportunities for <strong>biomethane</strong>.Only <strong>biomethane</strong> via upgrading of biogas is considered because of the lack ofimplementation of the thermochemical path. Nevertheless, the majority of the conclusionsshould apply equally to <strong>biomethane</strong> produced from both biological and thermochemicalpathways.In section 3.1, the possibilities for <strong>biomethane</strong> transport are described and three practicalexamples are given (from Germany, Sweden, Brazil) how transport on a small scale can berealized. Further, an overview of storage possibilities, which can be implemented below- orabove-ground, is included. In section 3.2, a detailed overview of the environmental demandsfor <strong>biomethane</strong> is provided. In section 3.3, sustainability standards are described, coveringgreenhouse gas emissions, value chains, important policy developments as well as themonitoring and reporting of sustainability issues. Finally, in section 3.4, overviews of the<strong>biomethane</strong> costs in comparison to natural gas as well as two practical examples for national<strong>biomethane</strong> markets are given3.1. Gas distributionTypically, natural gas grids have been designed to transport gas from large point sources todensely populated regions mainly in developed countries. The small-scale production of<strong>biomethane</strong> at many different locations is a new phenomenon, and requires additionalefforts to adapt the regional infrastructure and to find transport modes outside the naturalgas grid.This section describes possible and necessary developments of a growing <strong>biomethane</strong>market:• Road transport, local grids and joint upgrading facilities for small scale biogasproduction (for improved transportation)• Storage systems for <strong>biomethane</strong> (for use according to demand)Because of the different requirements in various countries, the following sub-chaptersprovide examples for Sweden, Germany and Brazil, but the main conclusions can beconsidered valid also for other countries with comparable condition.3.1.1. Biomethane transport on the road and in local grids – some examplesBiomethane transportation outside the grid – the Swedish caseIn Sweden, the gas grid coverage is limited and restricted to only one part of the country andgrid expansion is limited by the low population density. For the use of <strong>biomethane</strong> asautomotive fuel other solutions have to be used. Biomethane is mainly transported incompressed state in mobile storage units (see Figure 3-1) but also in liquefied state and inlocal gas grids. Sweden is today world-leading in both using <strong>biomethane</strong> as automotive fueland in transporting it outside the gas grid.Road transport: Under Swedish conditions for road transport, the best option for allvolumes is transport in the compressed state up to distances of 200 km, while transport inthe liquefied state can be an option for longer distances (Benjaminsson and Nilsson 2009).When trying to handle larger volumes of compressed vehicle gas by road transport, therecan be logistical challenges that offset the economic advantage compared to transport in the27
liquefied state or by way of a local gas grid. This is one of the drivers behind the building ofthe first liquefied <strong>biomethane</strong> plant (LBG) in Sweden in Lidköping, where LBG is producedand packed for road transport.Figure 3-1. Container used for transportation of compressed vehicle gas in Sweden. Thecontainer is filled with high pressure gas cylindersLocal gas grids (micro grids): There are a number of smaller local gas grids in severalSwedish cities, and indeed in other countries like Brazil (see also in-practice example Cbelow). These are commonly used to connect digesters situated a few kilometers apart fromeach other, typically at a waste water treatment plant and a food waste handling facility. Theraw biogas is transported from one of the plants to the other and thereafter upgraded to<strong>biomethane</strong> in a joint facility. The produced <strong>biomethane</strong> is transported to the refuelingstations through another gas pipe or by road. Rather large-scale local or even regional gridsare being planned in Sweden, aiming to connect several larger industries with <strong>biomethane</strong>production plants and an LNG/LBG terminal at the coast. This may constitute both a risk andan opportunity: on the one hand, this could enable the import of (shale) gas, and thus lowerthe price of fossil natural gas, whereas on the other hand it may trigger new investments inthe existing gas infrastructure (e.g. an extension of the distribution network) which may alsobe beneficial for <strong>biomethane</strong>.Centralized upgrading of biogas from small scale plants – some experiencesThe cost of upgrading biogas to <strong>biomethane</strong> basically depends on the size of the plant.Economics calculations show that the upgrading of biogas to <strong>biomethane</strong> can be profitablewhen at least 500 Nm³ raw gas per hour can be used. However, from the economic point ofview, even larger plants are of more interest. Currently, biogas plants with upgradingcapacity of 1,400 m³ raw gas per hour have been realized in Germany. Hence, under specificframework conditions the refitting of existing biogas plant by adding upgrading systemscould be an option for larger facilities.As the profitability of upgrading systems especially depends on the size, it would appearsensible to collect and upgrade raw gas from several biogas plant facilities at one large(<strong>biomethane</strong>) upgrading plant. A small number of such projects are already realized. Forreasonable profitability on the one hand the amount of raw biogas has to be a significantamount, while on the other hand geographical conditions and local infrastructure are ofimportance. So biogas plants should be located close to each other, see the practiceexamples below.28
maturity, capacities as well as the future market potential. Against this background therelevant technologies today with significant storage volumes will be described briefly below.Below ground storage technologies for natural gas (so called geological pore storagereservoirs) can be divided into (i) salt caverns, (ii) aquifers and (iii) depleted natural gasreservoirs. In the following table an overview of the typical characteristics of below groundgas storage technologies is given based on German conditions.Figure 3-2. Energy storage technologies (Newton et al. 2013)Table 3-1. Characteristics of geological pore storage reservoirs in Germany (Stronzik et al.2008)salt cavern Aquifer depleted gasreservoiraverage volume in 431 350 1,381Germany (mil. m³)feed-in and removal High Low lowturnover ratio (peryear)4.5 1 1While depleted gas reservoirs are characterised by a high non-process gas volume, whichlowers the turnover rate, aquifers have a high exploration demand to guarantee tightness ofthe storage system. Against this background, salt caverns have today the greatest potentialto serve as below ground gas storages. Typical parameters within Germany are process gasvolumes of more the 400,000 Nm³. A challenging aspect is that these types of storageconcepts require a relatively long planning and construction phase in comparison to otherconcepts (from five up to ten years) (Acht 2012). Below-ground storage under thoseconditions for <strong>biomethane</strong> might be realised jointly with existing storage systems for NG.30
Above-ground technologies for the storage of natural gas and <strong>biomethane</strong> can be dividedinto (i) spherical gas tanks and (ii) pipe concepts or pipe tanks. While spherical gas tanks areoperated with a pressure of 8 bar, pipe tanks can be operated up to 100 bar. In terms ofcapacities spherical gas tanks, for instance in Germany, have a process gas volume (useableshare of gas storage volume) of approx. 50,000 Nm³. Similar is the capacity for pipe gas tankswithout a compressing unit. With the integration of compressor the process gas volume canbe increased up to 140,000 Nm³ (on average) (Langner et al. 2013). Those volumes areinteresting for the development of dedicated <strong>biomethane</strong> storage systems.Besides the storage of natural gas or <strong>biomethane</strong> as gaseous fuel, currently several storageconcepts for liquefied natural gas (LNG) are in development or use. LNG is generated bycooling natural gas to about -162°C (NaturalGas.org 2013). LNG can be stored for instanceduring long distance transport on vessels within tanks that have insulated walls. Nowadays,the direct liquefaction of <strong>biomethane</strong> in small units has been achieved in Sweden, Norway,the USA and the United Kingdom.3.2. Environmental demands3.2.1. IntroductionThe production and use of <strong>biomethane</strong> has to support the overall goals for Greenhouse Gas(GHG) emission reduction, resource saving and be in line with the specific environmentaldemands in the different countries. As the carbon from <strong>biomethane</strong> is captured from theatmosphere during the growth of the plants, in principle this is a closed cycle, and thus whencombusting <strong>biomethane</strong>, there is no net increase of GHG emissions. To ensure that GHGemissions are reduced by <strong>biomethane</strong> production, it is important that the GHG balance ofproduction and delivery is favorable (Black et al. 2011). The life cycle assessment approachhas been established for those assessments, considering direct and indirect effects fromfeedstock provision until the final utilisation of the <strong>biomethane</strong> (see chapter 3.2.3).There are additional environmental aspects, like eutrophication, acidification, human healthand ecotoxicology, which are also relevant, and can also be assessed through LCA, but notdiscussed in detail in this report. Especially the biomass feedstock production (when usingdedicated crops) can result in problems such as pressure on biodiversity, use of scarce waterresources, risks to food security or land degradation. Hence it is important that bioenergyproduction is managed sustainably (GBEP 2011).3.2.2. Greenhouse Gas Emissions and the Value Chain of BiomethaneThe generation of <strong>biomethane</strong> is a complex multi-stage process. At each stage of the supplychain GHG emissions arise from agricultural processes, energy consumption, fugitiveemissions and other minor sources. Net GHG emissions can depend upon a number offactors as explained in detail in the biogas handbook (Wellinger et al. 2013).Figure 3-3 displays the main process stages in the <strong>biomethane</strong> value chain with potentialGHG emissions sources, main system inputs, energy and carbon flows.Biomass Production (Feedstock Supply)Biomass feedstocks used to produce biogas are diverse. Feedstocks can come from farms inthe form of energy crops, by-products of industrial and agricultural processes such as animalslurries and manures, or waste materials such as sewage sludge and food waste. GHGemissions arising from biomass production therefore depend primarily on the biomass31
source, its location, and the cultivation/collection method used. Effects of land use changethrough energy crop cultivation (for <strong>biomethane</strong> from biogas) and carbon accounting forforest biomass (for <strong>biomethane</strong> from SNG) are currently discussed on scientific and politicallevels (Council of the European Union, <strong>2014</strong>), (Agostini et al., 2013). The findings might yetinfluence the assumption for GHG emissions from feedstock supply significantly.Figure 3-3. Flow chart for the calculation of GHG emissions for <strong>biomethane</strong> production(Adams et al., <strong>2014</strong>)Transportation and Distribution of BiomassGHG emissions from transport and distribution are relatively minor in local arable systems(AEA, 2010). GHG emissions from transport arise primarily from the combustion of diesel,however the total contribution is usually less than 10% of the total supply chain GHGemissions (GGG, 2013a).32
Fugitive emissionsMethane is a potent greenhouse gas (IPCC, 2007) with a global warming potential (GWP100)34 times larger than carbon dioxide. For this reason, all reasonable precautions must betaken to minimize losses to the atmosphere. Emissions (‘methane slip’) from methaneproduction installations occur if gas escapes into the atmosphere, either inadvertently dueto poor design or operation, or intentionally for safety reasons. Emissions can potentiallyoccur at all steps in the production and gas handling process as well as when handlingresidues. The case of biogas production has been widely assessed (e.g. GGG, 2013a),however, there is no published information for bio-SNG production.Biogas UpgradingAlthough a number of different technologies are available to fulfil the task of producing a<strong>biomethane</strong> stream of sufficient quality, a small percentage of methane is lost during theupgrade stage (Starr et al. 2012). This can vary considerably between the upgradingtechnologies chosen, although all equipment suppliers can provide off-gas treatment to dealwith methane losses. Methane slip from upgrading biogas to <strong>biomethane</strong> can make asignificant contribution towards the overall lifecycle greenhouse gas emissions. Biomethaneis a greenhouse gas 36 times more potent than carbon dioxide. Therefore already smallleakages can cause substantial reductions in the climate change mitigation potential.Biomethane feed-inFeeding <strong>biomethane</strong> into the natural gas grid is an efficient energy solution, even if the sitesin which the gas is to be used are far away from the sites at which it is produced(Biogaspartner, 2011). For the purposes of injection, the gas must meet the qualityspecifications of the relevant legal provisions and may only deviate within the range of thesequality standards (Biogaspartner, 2011), see chapter 2.5. When the gas grid does not havecapacity or is not close, the <strong>biomethane</strong> can be transported on road via CNG tube trailers.This happens in Sweden (with limited gas grid), see chapter 3.1.1.End-useFor conventional fossil fuels, the emissions arising from use are significant and contributesignificantly to Global Warming Potential (GWP). In contrast, the combustion of <strong>biomethane</strong>will result in predominantly biogenic CO 2 and therefore contributes to more stableatmospheric carbon.Despite potentially high GHG emissions by following best practice, it is possible to achieveGHG savings by <strong>biomethane</strong> of over 80% when compared to the fossil fuel alternative. Figure3-4 shows that sources of GHG emissions vary depending on the process stage in the<strong>biomethane</strong> production. Key sources of GHG emissions include biomass feedstockcultivation (where purposely-grown energy crops are used) and biogas upgrading. Emissionsmay be significantly reduced with the application of BAT (Best Available Technology).Substantial emission savings can also be made through the recycling of organic nutrients (indigestate use) and following sustainable farming practices.3.2.3. Life Cycle Assessment of Biomethane applicationLCA MethodologyLife Cycle Assessment (LCA) is a methodology for assessing environmental impacts andresource consumption of goods and services. This method allows every component of<strong>biomethane</strong> production to be assessed in terms of GHG emissions, emissions to air, water &soil, and resource depletion, therefore helping to evaluate the sustainability of the entire33
process from feedstock production to <strong>biomethane</strong> injection, i.e. over the ‘life-cycle of theproduction of 1MJ (~0,278 kWh) of <strong>biomethane</strong>’. LCA is structured, comprehensive andinternationally standardised which follows a systematic and phased approach (ISO, 2006). Inthe case of <strong>biomethane</strong> production a full LCA needs to include both direct and indirectemissions. Many of these emissions are indirect to the biogas production and use phase. Amethodology to calculate the GHG emissions has been developed by the EuropeanCommission (EC) in the Fuels Quality Directive (FQD)) and in the Renewable Energy Directive(RED) for biofuels and bioliquids for transport, electricity, heating as well as cooling. The aimis to provide numbers for GHG savings as one sustainability criterion (see chapter 3.3). TheRED methodology does not incorporate the emissions associated with the manufacture ofthe machinery and equipment used in bioenergy production and supply. Also, it does notincorporate the CO 2 emission credit resulting from substituting the recycled nutrientscontained in the digestate for commercial fertilizers. However the RED gives a preciseguideline. Regarding life cycle assessment with a focus on Europe, it is much morepracticable to use the RED instead of the ISO 14040.Default values for <strong>biomethane</strong> application as a transport fuelThe RED Annex V presents typical and default values for the GHG emissions savings for arange of biofuels compared to fossil diesel and gasoline, see chapter 3.3.2. The RED Annex Vshows that in the field of transport fuels <strong>biomethane</strong> offers some of the highest GHG savingswhen compared to other liquid biofuel options. Biomethane from municipal organic wastehas a default value for GHG saving compared to the fossil fuel comparator of 73% and 82%when produced from dry manure (Directive 2009/28/EC). In comparison, rape seed biodieselhas 38% and sunflower biodiesel 51% (Directive 2009/28/EC).In the UK, the Government has developed a tool which calculates GHG emissions fordifferent bioenergy systems. The ‘Biomass Carbon Calculator’ follows the RED methodologyand has a range of default values for commonly used feedstocks for <strong>biomethane</strong> production(GGG, 2013). These include silage grass, whole crop maize, organic whole crop maize, wholecrop wheat, sugar beet, wet manure, and dry manure. Using these default values it ispossible to compare GHG emissions from each of the <strong>biomethane</strong> production pathways byassessing each life cycle stage. Figure 3-4 shows the percentage contribution for each of thefive main stages of the <strong>biomethane</strong> value chain (i.e. cultivation & harvesting, transport &distribution, production of biogas, <strong>biomethane</strong> upgrade, and <strong>biomethane</strong> injection). It canbe seen that crop growth account for at least 50% of GHG emissions for each pathway usingcrops for <strong>biomethane</strong>. However this does not account for the use of digestate and thereforeassumes high inorganic fertiliser input. Biomethane upgrading is also an important stage foreach pathway due to the assumptions made around methane slip and electricity consumed.34
Figure 3-4. Percentage Lifecycle Emissions by Feedstock, calculated by using the UK BiomassCarbon Calculator Model (GGG, 2013a)3.2.4. Policy DevelopmentsEuropean Directives currently include criteria on GHG saving thresholds. Emissionsassociated with indirect land use change (iLUC) do not yet have to be reported. While bothDirectives (RED and FQD) did include an obligation to review the impact of indirect land usechange on greenhouse gas emissions associated with biofuels no formal changes have beenadopted so far. Proposals for amendment to the Fuel Quality Directive (FQD) 98/70/EC aredemanding at least a 60% saving against the GHG threshold for biofuels productionprocesses starting operation after 1 st January 2018. It is also proposed that members willnow also be obliged to include indirect land use change (iLUC) factors in reporting by fuelsuppliers. The US and Canadian markets are moving, driven in particular by transport useand Green Gas Certificates mode.3.2.5. Concluding RemarksThis chapter has described the main possible sources of GHG emissions associated with the<strong>biomethane</strong> production value chain. Significant variations are possible which arise from boththe plant design and operation, and the GHG accounting methodology. By following bestpractice it is possible to achieve GHG savings of over 80% when compared to the fossil fuelalternative (GGG, 2013). Sources of GHG emissions respective savings vary depending on theprocess stage in <strong>biomethane</strong> production as well as the reference system regarding the enduse.Biomethane may directly or indirectly substitute different fossil fuels, depending on itsend-use, and environmental benefits in general will probably be largest if <strong>biomethane</strong>substitutes coal (at least in terms of avoided GHG emissions). Nevertheless, high GHGsavings can also be achieved by substitution of NG or oil in the heat and CHP sector as wellas a substitute liquid and gaseous fuels in the transportation sector.Key sources of GHG emissions include biomass feedstock cultivation (where purposelygrown energy crops are used) and biogas upgrading. Emissions may be significantly reducedwith the application of BAT (Best Available Technology).35
3.3. Sustainability standards for <strong>biomethane</strong>Sustainability standards for biomass have been discussed and developed in different arenaover recent years. The most important approaches are the indicators from the GlobalBioenergy Partnership (GBEP) and the demands from the European Directives on RenewableEnergy and Fuel Quality. Outside Europe biofuel sustainability criteria are established (e.g.USA (U.S. Congress 2005)) but do not refer to specifically <strong>biomethane</strong>, so there are notconsidered in the following.3.3.1. GBEP criteriaThe Global Bioenergy Partnership (GBEP) developed 24 sustainability indicators which can besubdivided into environmental, social and economic indicators. The indicators shouldguarantee sustainable production and use of biomass independently from biomass type andorigin. Although a high sustainable standard in biomass production and usage is required, inmost cases the indicators (Table 3-2) are not directly, or not all of them, implemented. TheEU and the member states are anxious to strengthen the sustainable standards for biomassin Europe which leads among other to the EU 2009/28/EC directive and the resultingapplicable law in the member states.Table 3-2. Sustainability indicators by GBEP (GBEP 2011)Environment Social Economiclife-cycle GHG emissionssoil qualityharvest levels of woodresourcesemissions of non-GHG airpollutants, including airtoxicswater use and efficiencywater qualitybiological diversity in thelandscapeland use and land-usechange related to bioenergyfeedstock productionallocation and tenure of landfor new bioenergyproductionprice and supply of anational food basketchange in incomejobs in the bioenergy sectorchange in unpaid time spentby women and childrencollecting biomassbioenergy used to expandaccess to modern energyserviceschange in mortality andburden of diseaseattributable to indoor smokeincidence of occupationalinjury, illness and fatalitiesproductivitynet energy balancegross value addedchange in consumption offossil fuels and traditionaluse of biomasstraining and re-qualificationof the workforceenergy diversityinfrastructure and logisticsfor distribution of bioenergycapacity and flexibility of useof bioenergy36
3.3.2. Criteria from the EU directivesThe Renewable Energy Directive, RED (Directive 2009/28/EC) establishes in Article 17, 18, 19and Annex V sustainability criteria for biofuels and bioliquids 8 (EC, 2009). The sustainabilitycriteria aim to promote <strong>biomethane</strong> production in a sustainable form. According to the EUdirective respective the national law, the <strong>biomethane</strong> sustainable criteria can besummarised as follows (European Union 2009a):• No biomass from biodiverse areas, nature protection or similar areas for<strong>biomethane</strong> as fuel is allowed, including primary forest and highly biodiversegrassland. Exception can be made in case of evidence is provided that theproduction of raw material did not interfere with those nature protecting purposes.• Biofuels, like <strong>biomethane</strong>, should be promoted in a way to encourage greateragricultural productivity and the use of degraded land.• The greenhouse gas emission saving shall be at least 35% compared to fossilreference. From the beginning of 2017 they shall be at least 50% and from thebeginning of 2018 they shall achieve at least 60% greenhouse gas emission saving.• Biofuels shall not made from raw materials from land with high carbon stock 9 .Further, biofuels shall not be made from raw materials from peatland unless nonegative harm is provided regarding drainage.• Agricultural raw materials for biofuel production have to fulfil requirements in part Aand point 9 of Annex II in Council Regulation (EC) No. 73/2009.The requirements in Council Regulation (EC) No. 73/2009 consider the relationship betweenagriculture and the environment. These include e.g. the conservation of natural habitat andof flora and fauna, protection of groundwater and soil against pollution and soil. (EuropeanUnion 2009b)The EU sustainable criteria are only obligatory for <strong>biomethane</strong> when it is used as fuel fortransport. It is so far not obligatory for <strong>biomethane</strong> when it is used in other fields like forCHP.As solid biomass is not mentioned in the EU directives, it is not subjected to any sustainablestandard yet. However, in some countries, like the Netherlands, more detailed sustainablestandards are implemented or in planning, including solid biomass. Other national ambitionsfor sustainability are for example the Renewable Fuel Standard program (RFS) in the USA orthe government response for sustainability criteria for biomass in the U.K., which also dealswith solid biomass as feedstock (DECC 2013).The sustainability standards affect the production and use of <strong>biomethane</strong> in the differentcountries as well as the trade between these countries.8 In this context Biofuels means ‘liquid or gaseous fuel for transport produced from biomass’ andBioliquids means ‘liquids fuel for energy purposes other than for transport, including electricity andheating and cooling, produced from biomass’.9 In case of converting land with high stocks of carbon in its soil for cultivating of biomass, theresulting negative greenhouse gas impact should therefore be accounted for calculation ofgreenhouse gas emission saving.37
3.3.3. Monitoring and reporting of sustainability issuesThe European Commission (EC) can assess existing voluntary schemes for monitoringsustainability in order to facilitate the biofuel market. To secure a sustainable provision, theEC already recognised 17 sustainability schemes for biofuels. Additionally the member statesare also able to use their own voluntary schemes if proofs of the EC’s requirements are given.(EC 2011), (GGG 2013a)Therefore, the common biofuels (bio diesel and bio ethanol) are already constantlymonitored and registered. Biomethane as a comparable new fuel is still in the marketpenetration stage (depending on country). To secure the correct mass/energy trade as wellas sustainable standards for <strong>biomethane</strong>, the relevant data (substrate, plant size,technology …) has to be submitted to monitoring institutions and respective registers. Notevery EU member has already implemented a registration institute. So far, the followingregisters are implemented in Europe:• Germany: Nabisy (sustainable biomass system) and Biogasregister• The Netherlands: Vertogas• Denmark: Energinet.dk• France: Gaz Réseau Distribution France (GrdF)• Switzerland: Verband der Schweizerischen Gasindustrie (VSG)• U.K.: Green Gas certification scheme• Austria: AGC Biomethan Register Austria• Sweden: <strong>biomethane</strong> is registered due to the tax exemption, additionally statisticshas started to keep track of CNG (<strong>biomethane</strong> and natural gas)• Italy: GSE S.p.A. (registration for <strong>biomethane</strong> planed)At present, six European biogas registers (DE, A, DK, U.K., F, CH) are planning closecooperation for improved reporting of sustainability parameters and particularly for a bettertrade between these countries. The aim is compatibility between the registers andrecognition of guarantees of origin for <strong>biomethane</strong>. Further registers are likely to follow(DENA 2013b). In addition to the issue of sustainability of <strong>biomethane</strong>, the collaborationaims at better traceability. The use of different mass balance systems during cross boardertrades lead to a difficult mass determination or lead to possible uncertainties.One of the problems to be solved is, that according to the RED (European Union 2009a), amass balance system has to be implemented in the member states to guarantee compliancewith the sustainability criteria. This includes traceability on a mass balance level, whereconsignments and their sustainability information remain intact. Currently, it is not clear iftransport of <strong>biomethane</strong> via the NG grid is suitable or not because of the blending of<strong>biomethane</strong> with natural gas. So, for example in Sweden, the conclusion is that the transporthas to be done by truck, vessel or train to meet the RED requirements. This hinders Swedenin their attempt to play a major rule in the emerging European <strong>biomethane</strong> trade, as a<strong>biomethane</strong> importer (Jozsa <strong>2014</strong>).In addition to the already existing sustainability criteria and regulations, a further directivefor deploying of alternative fuels infrastructure in the European Union is in progress. Thedirective aims to standardize the interface of refuelling of alternative fuels (such as<strong>biomethane</strong>) to promote sustainable fuels in the EU. (European Union 2013).38
3.4. Cost of <strong>biomethane</strong> production3.4.1. Biomethane via upgraded biogasTo assess the costs of the production and injection of <strong>biomethane</strong>, a clear understanding ofthe constellation of these costs in terms of their components is necessary. In summary, thefinal cost can be distinguished between the biogas production cost, the upgrading cost andthe cost for distribution (e.g. grid injection).Costs for the production of biogas and therefore also for the <strong>biomethane</strong> are influenced byhighly varying prices for feedstocks. Urban (Urban et al. 2009) discusses two different basecases: a feedstock mixture of 90% manure and 10% maize silage and a feedstock mixture of10% manure and 90% maize silage. While manure can be a freely available resource,especially for smaller systems up to 500 Nm 3 /h a feedstock price for maize silage of 35 €/twas identified by Urban (Urban et al. 2009). Based on a market assessment in the years of2007 and 2008, Urban estimate the specific feedstock costs for two cases with 1.8 and3.6 €cent/kWh for Germany, the Netherlands, Sweden and Canada regarding the netcalorific value of the produced gas 10 . In Hornbacher (HEI 2006), the production of raw biogasusing maize silage and a small content of manure was considered using a feedstock price of25 €/t for maize silage. This results in specific feedstock deployment costs of 2.2 €cent/kWhfor the produced biogas in the mentioned study. All values are illustrated in Figure 3-5 andtransferred to € 2013 cent/kWh to provide comparability.The actual production costs of raw biogas mainly depend on economic parameters e.g.investment-, operation- and maintenance including storage of raw materials and raw biogas.Upgrading costs can be computed with the Biomethane Calculator from Mitner (Mitner et al.2012) which was developed in the IEE project BioMethane Regions to address the costs fromvarious upgrading technologies under different conditions. In this tool, upgrading costs forgas-permeation, pressurised swing adsorption, pressurised water scrubbing and aminescrubbing under different conditions are included. Depending on the raw biogascomposition and the volumetric flow, upgrading costs between 1.5 and 2.0 € 2013 cent/kWhcan be observed, including desulphurisation, water and CO 2 separation. Urban (Urban et al.2009) give average upgrading costs of 1.7 €cent/kWh for comparable cases. These valuesconsider technology specific methane losses as well as higher sulphur content in raw biogasproduced from the manure based feedstock mix. Figure 3-5 compares the total specificbiogas upgrading costs stated in this paragraph with the higher value (5.2 € 2013 cent/kWh dueto economy of scale and technological learning effects) from Hornbacher (HEI 2006) andoutlines the composition of these costs for the values computed with the BiomethaneCalculator from Mitner (Mitner et al. 2012).For the injection of <strong>biomethane</strong> into the natural gas grid the following cost components exist:• Transportation from the upgrading unit to the gas grid is calculated to be performedin a low pressure pipe,• pressurisation,• odorisation,• conditioning and necessary measurements are typically done in the gas transferstation located at the transfer point.10 All cost values in this chapter specified for the net calorific value of produced gas39
Injection costs of four different settings proposed in Urban (Urban et al. 2009) have beenrecalculated and compared with the original values from literature. The 500 Nm 3 /h-case 11investigates a <strong>biomethane</strong> production plant located directly next to a pipeline system at16 bar pressure; the second doubles the volumetric flow used in the first case and includes alow pressure pipeline with the length of 1 km to inject the product into a system at apressure of 45 bar; and the third case doubles the volumetric flow of case 2 including a lowpressure pipeline with the length of 5 km to inject the product into a system at a pressure of70 bar. By calculating the four upgrading technologies mentioned in the previous paragraph,an average total specific <strong>biomethane</strong> injection cost of 0.6 € 2013 cent/kWh can be computed.For the same cases Urban (Urban et al. 2009) states injection costs averaged to 0.2€ 2013 cent/kWh supposing that 100 % of the costs for pressurisation and 50 % of the costs forthe transportation are provided by the grid operator. Depending on the local gas quality,conditioning by adding liquid gas (propane and/or butane) could be necessary. The additionof 1 % propane related to the <strong>biomethane</strong> flow increases the injection costs by an average of1.0 €cent/kWh. Total specific injection costs from literature and specific costs for thedifferent injection steps computed with the Biomethane Calculator from Mitner (Mitner et al.2012) can be found in Figure 3-5.Upgrading and injection costs computed with the Biomethane Calculator from Mitner(Mitner et al. 2012) were extended with specific raw biogas production costs from Urban(Urban et al. 2009). The resulting specific <strong>biomethane</strong> costs are illustrated in Figure 3-5 andcompared with values from Urban (Urban et al. 2009) and Hornbacher (HEI 2006). Anaverage specific <strong>biomethane</strong> deployment cost of 8.7 € 2013 cent/kWh can be observed for 18different constellations based on a maize silage dominating mixture. An average specific<strong>biomethane</strong> deployment cost of 7.0 € 2013 cent/kWh was calculated for four differentconstellations based on a manure dominating. Deviations from this value for differenttechnologies are small and also the gap between the computed values for the maize silageoptions for the 500 Nm 3 /h-case and the 2,000 Nm 3 /h-case is of minor importance 12 inrelation to the entire <strong>biomethane</strong> deployment costs.An average natural gas price of 3.7 €cent/kWh for industrial 13 use for the year 2012 wasplotted (Eurostat Database 2013) as a red vertical line. This illustration highlights that theexamined <strong>biomethane</strong> deployment options are far away from being economically viable onthis market if no use from support schemes is made. The green shading indicates the rangebetween 4 and 6 € 2013 cent/kWh and shows the natural gas price increase of 20% and 60%between 2010 and 2030 for the ambitious climate scenario and the reference scenario fromSebi (Sebi et al. 2013). An average value of 3.4 € 2013 cent/kWh for industrial use for the year2010 was used for this estimation (Eurostat Database 2013). In order to be able to deriveconclusions about the future competitiveness of <strong>biomethane</strong> against natural gas, scenariocalculations for the production, upgrading and grid injection would be necessary. Amongothers, such a calculation would have to include feedstock price development, energy supplycost scenarios and technological learning curves which is out of scope of this chapter.11 With regards to the volumetric flow of raw biogas12 Average value of 8.5 and 7.8 €cent/kWh for different upgrading technologies for the 500 Nm 3 /hcaseand the 2,000 Nm 3 /h-case based on maize silage dominating feedstock mixture13 Group I3: 10.000GJ
Figure 3-5. Averaged specific <strong>biomethane</strong> deployment costs acquired from literature ((HEI2006), (Urban et al. 2009)) and own calculations (Mitner et al. 2012) broken down intocomponents: The vertical red line shows the reference European average natural gas price of2012 (Eurostat Database 2013) and the green shaded part gives a natural gas price range for2030 (Sebi et al. 2013)). The tick marks indicate the respective literature, feedstock and sizeof the <strong>biomethane</strong> production.41
Specific <strong>biomethane</strong> deployment costs were obtained from literature and own calculations.Raw biogas production was found to be the largest component of the total cost for 22 of the23 cases investigated. For all cases specific injection costs vary between 0.1 and0.7 € 2013 cent/kWh and represent the lowest cost component. Specific biogas upgrading costsare averaged to 1.7 € 2013 cent/kWh for 22 of 23 cases (excluding the numbers of Hornbacher(HEI 2006)). Specific raw biogas production costs based on a feedstock mixture dominatedby maize silage result with an average value of 6.5 € 2013 cent/kWh. The manure dominatedfeedstock mixture results in an average value of 4.6 €cent/kWh. Hornbacher (HEI 2006)shows another cost structure because of the relatively low feedstock costs but negativeeffects of economies of scale and technological learning compared to the other cases. Onthe one hand the stated natural gas price of 3.7 €cent/kWh for industrial use shows theneed for support schemes if <strong>biomethane</strong> injection is to be economically attractive. Thisposition can be strengthened by natural gas price increments stated by Sebi (Sebi et al. 2013)for the period 2010-2030 of about 20% and 60% for the “ambitious climate” and thereference scenarios, respectively (compare Figure 3-5). On the other hand, the possibleadvantage of the utilisation of waste is outlined with the example of a manure dominatedfeedstock mixture. Any more thorough assessment of <strong>biomethane</strong> deployment costs wouldhave to include a much wider range of feedstocks, incuding waste and residues and takinginto account any additional costs due to necessary pre-treatment of the feedstocks as wellas costs associated with separation and disposal or utilisation of the digestate.3.4.2. Biomethane via gasification and methanationAt the time of writing this report, <strong>biomethane</strong> via gasification and methanation was still underdevelopment and no commercial plant was in existence (see chapter 2.3). As a consequenceno validated cost data were available. So far, all costs are based on simulations andforecasts of the technology. One exception is the planed GoBiGas plant in Gothenburg, Swedenwhich was in the commissioning phase in mid-<strong>2014</strong>. If <strong>biomethane</strong> is produced via thethermochemical path different process steps are required than via the upgrading of biogas.In general, investment costs for thermochemical <strong>biomethane</strong> installations will be higher dueto the much bigger capacities in comparison to the <strong>biomethane</strong> from digestion and upgrading,see Figure 2-1. For example the investment cost for the GoBiGas plant (20 MW bio-SNG )are 168 million € (Held 2013), the cost for four other simulated plants (22 - 500 MW bio-SNG )range between 42 and 550 million € (Müller-Langer 2011), (Carbo et al. 2011). According tovarious publications the resulting specific production costs lie between 4.8 –12.7 €cent/kWh bio-SNG (Müller-Langer 2011), (Simell et al. <strong>2014</strong>), (Heyne 2013), (Carbo et al.2011).The cost data seem to suggest similar costs <strong>biomethane</strong> production via the biogas and upgradingroute and via the gasification and methanation (Figure 3-5). Once the thermochemicalgasification and methanation process has matured, real costs should emerge andthen an objective comparison of the costs of the respective processes should be possible.3.5. A practical example of a <strong>biomethane</strong> market - GermanyDue to the novelty of <strong>biomethane</strong> and large number of stakeholders involved, the<strong>biomethane</strong> value chain is a complex system of feedstock provision, biogas production andupgrading, natural gas grid feed-in, trade of <strong>biomethane</strong> and numerous end use options.42
Relevant groups of stakeholders involved in the <strong>biomethane</strong> process chain include biogasfeedstock providers (farmers, waste management), plant operators/ owners, professionalassociations and business consultancy, investors, plant manufacturers and maintenancecompanies, network operators, energy supply companies, <strong>biomethane</strong> traders and finalconsumers (or consumer associations) ((dena 2011a) (Schuck et al. 2009; Thrän et al. 2012)).Other important stakeholders are land owners, construction companies, approvalauthorities and the general public (residents, public administrations, local politics).Multiple barriers and risks for stakeholders are expected that hinder investments, building ofplants and <strong>biomethane</strong> production and use. Germany therefore set ambitious targets. Asurvey was conducted within the project “Climate effects of <strong>biomethane</strong>” to identify themost common barriers and risks.A large number (270) of stakeholders (manufacturers, planning, investors, certification, endusers, politicians, environmental agencies) were identified and asked to participate in aquestionnaire (n=56, response rate 21 %) to evaluate the multiple barriers and risks fromtheir point of view (see (Ponitka 2013)) and to provide their ideas and possible solutions.Potential limiting factors for <strong>biomethane</strong>There are numerous projects, studies and further activities 14 describing and analysingopportunities, potential barriers, limiting factors and risks of <strong>biomethane</strong>. The broad range 15of limiting factors influence specific sections of the <strong>biomethane</strong> value chain. These includecontrollable risks for the business segment or the specific location or not manageable risks(external risks, market development, weather conditions, regulations or laws) for the entireindustry (Berenz et al. 2008; Schmuderer 2008).In the field of ‘agriculture and feedstock provision’ questions are often asked concerning theacceptance of energetic use of feedstocks (Brohmann et al. 2008) (BMELV 2009). Long termagricultural feedstock provision because of an incentivized demand is susceptible toavailability of land in general (Hermeling and Wölfing 2011). Biogas plants are commonlylocated on farms where there is little economic advantages to invest in biogas upgrading(Urban 2010). Relatively large <strong>biomethane</strong> plants expose themselves to the risks of securityof feedstock supply. A limiting factor can also be limitations of digestate recycling back tothe farmland (Reinhold 2011).From the German perspective, the planning and operation of <strong>biomethane</strong> projects includesmajor uncertainties and higher costs because of:14 (e.g. „Bio-methane Regions“ (EU); GreenGasGrids (EU); BMBF-Verbundprojekt„Biogaseinspeisung“ (Fraunhofer UMSICHT 2009); Biogaseinspeisung (dena 2011b), „BIOMON“,Biogaspartner (www.biogaspartner.de), Biogasregister (http://www.biogasregister.de), Biogasmonitoring of the Federal Network Agency (BNetzA 2011); BMK – Biomethankuratorium;Memorandum „Initiative Erdgasmobilität“ (dena 2011c))15 (Hooper and Li 1996; Stachowitz 2005; Madlener and Zweifel 2006; UBA 2006; Brohmann 2007;Mez 2007; McCormick and Kåberger 2007; Altrock et al. 2008; Berenz et al. 2008; BMU 2008;Brohmann et al. 2008; Keil et al. 2008; Markard 2008; Schmuderer 2008; BMELV 2009; FraunhoferUMSICHT 2009; Kommission für Anlagensicherheit 2009; Postel et al. 2009; Schiffers et al. 2009;Schuck et al. 2009; Urban et al. 2009; Petersson and Wellinger 2009; dena 2010; Urban 2010; BauGB2011; Bundesnetzagentur 2011; DBFZ 2011; dena 2011a; European Commission 2011; FNR e.V. 2011;Hermeling and Wölfing 2011; Reinhold 2011; dena 2011c; dena 2011d; Berger 2011)43
• uncertain feedstock procurement and feedstock prices• delays in approval procedures from licensing authorities• delays due to protests by residents (Schuck et al. 2009), (Brohmann et al. 2008; DBFZ2011)• extensive planning needs (clarification of gas grid access, security of <strong>biomethane</strong>marketing)• large <strong>biomethane</strong> plants are not privileged in approval procedures according toGerman laws (§35 (BauGB 2011))• no direct feed-in tariffs 16 for <strong>biomethane</strong> (indirect market attractiveness in Germanyby incentives in the electricity provision (Renewable Energies Act - EEG), quotaassessment in the biofuel sector and the eligibility of <strong>biomethane</strong> in the heatmarket)A ‘lack of information’, especially for the costs and chances of biogas upgrading as an optionfor the future of biogas, can be stated (Madlener and Zweifel 2006; Brohmann et al. 2008;Schuck et al. 2009), (Urban et al. 2009).In addition to insufficient capacity or capacity bottlenecks of the gas pipelines (Urban 2010)there are complicated regulations for ‘<strong>biomethane</strong> feed-in’. Potentially there is a risk of arefusal of gas grid connection or of <strong>biomethane</strong> feed-in for a range of technical reasons (§17(EnWG 2012), §33 (GasNZV 2010)).In terms of physical <strong>biomethane</strong> trading (as opposed to virtual trading) at an internationallevel, one key barrier is gas quality requirements with subsequent risk of refusal (Schiffers etal. 2009) in case of non-compliance with e.g. EASEE-gas obligations. Another risk for theoperation of gas grids could be increasing gas grid utilisation fees due to allocation of<strong>biomethane</strong> feed-in costs (Urban 2010).Nevertheless, there is increasing demand for <strong>biomethane</strong> production. Especially the currentlow sales respective poor markets in Germany for <strong>biomethane</strong> (dena 2010; DBFZ 2011) leadsto increasing economic risks for producers and trading companies. In the transport sector alow user comfort of natural gas and <strong>biomethane</strong> (few vehicles and limited infrastructure)have an inhibitory effect (dena 2011d). Another constraint in the fuel sector in the EuropeanUnion is the higher expenditure due to necessary certification verification (Biokraft-NachV2009) to be able to count for the biofuel quota (§ 37a (BImSchG 2011).For the field of ‘environmental concerns’ negative impacts like intensification of agriculture,risks of hazardous incidents (Stachowitz 2005) (UBA 2006) (FNR e.V. 2011) are expected.In general the ‘low level of profitability’ and uncertainty about the ‘economic efficiency’ of<strong>biomethane</strong> in relation to established sources of income influence decision-making. Also,limiting factor in decision-making are existing ‘knowledge deficits’ (Schmuderer 2008) or‘lack of information’ (Brohmann et al. 2008; Schmuderer 2008) and the ‘complexity’ of thetechnology and the market (Fraunhofer UMSICHT 2009). The uncertain ‘legal framework’and changes to the underlying political conditions e.g. amendments of the RenewableEnergy Act during the planning process or changes in tax advantages for <strong>biomethane</strong> asmotor fuel (DBFZ 2011) are also limiting factors (Hermeling and Wölfing 2011).16 For comparison, some countries (e. g. Netherlands “Stimulering Duurzame Energie Scheme”)provide a feed-in tariff for <strong>biomethane</strong>.44
Limiting factors from a stakeholder point of viewThese potential limiting factors were evaluated by German actors and stakeholders via aquestionnaire in 2012 (Ponitka 2013). The analyses of the results (n=56) showed that:• the majority of the respondents see an opportunity for <strong>biomethane</strong> in the future(2020) energy system,• the future competitiveness of <strong>biomethane</strong> is judged to be high/very high, especiallyfor fuel production and electricity generation.In contrast to the good future prospects for <strong>biomethane</strong> the main problems for the majorityof the respondents are due to (from higher to lower importance):• low economic efficiency,• lack of consistent and changing political support,• problems of increasing cost of feedstock,• the complexity of <strong>biomethane</strong> and especially of <strong>biomethane</strong> trade,• low demand for <strong>biomethane</strong> especially as fuel,• low acceptance and fear of intensification of agriculture and• limited benefits of <strong>biomethane</strong> for the end user.In the case of the German <strong>biomethane</strong> market, based on the questionnaire, it can besummarised that questions of the ‘economic viability‘ of <strong>biomethane</strong> projects in connectionwith stable ‘political framework‘ conditions are the most relevant factors for individualdecision-making. The importance of a ‘reliable framework‘, for example through clear legalrequirements and adequate regulation and ‘support measures’, both for <strong>biomethane</strong>provision and end use markets, cannot be overemphasized.4. Expectations of future development4.1. Current capacities of <strong>biomethane</strong> productionIn the IEA Bioenergy member countries, the development of <strong>biomethane</strong> production anduse is at varying stages. Depending on e.g. infrastructure, national supporting systems andenergy prices, different levels of production and use of <strong>biomethane</strong> have been achieved. InGermany and Sweden, the number of plant and production capacity of biogas upgradingplants is high. In countries like e.g. Ireland or Italy, no biogas upgrading to <strong>biomethane</strong> isimplemented yet. Although no <strong>biomethane</strong> production in Italy is implemented, it possessesa high potential. Brazil and Italy are by far the countries with the most natural gas fuelledcars in the IEA member countries, with together over 2.4 million cars (Álamo 2013). Thereare also a lot of gas-fuelled cars in the USA, Germany and Sweden. However, the ratio of gasfuelled cars to gas filling station is not consistent. For example, in Italy and Germany roughlythe same number of filling stations exist, but there are 8 times more NGVs in Italy than inGermany, see also Table 4-1. So, a limited number of filling stations cannot be the onlyfactor for the development of a gas driven fleet. Hence, the transport sector can be seen asan excellent entry market for <strong>biomethane</strong> and with huge potential.Table 4-1 gives an overview of the <strong>biomethane</strong> production in selected IEA member states, inthis study named focus and overview countries.45
Table 4-1. Biomethane development in selected IEA Bioenergy member countries in 2012(Daniel-Gromke et al. 2013),(Dumont <strong>2014</strong>), (Álamo 2013), (Strauch 2012), (Lampinen 2013),(Govasmark 2012), (Kang 2013), (Paulsson and Steinwig 2012), (Persson and Baxter <strong>2014</strong>),(EBA 2013), (EBA 2012), (Grossen and Schmid 2012), (EPA 2013b), (biogas data 2013),(Thorson 2013), (Ministry of Environment 2012), (Rasmussen 2011), (Danish EnergyAuthority 2013), (DGC 2013), (NNFCC Biocentre 2013) (Note: excluding landfill gas plants)CountryBiogasPlants 1Biogas UpgradingPlants (Fed In)UpgradingCapacity 2 InNm³/hGas FillingStations 3Gas DrivenVehicles 4Austria 421 10 (7) 2,000 203 7,065Belgium 119 0 0 15 355Brazil 16 7 n.d. n.d. 1,790 1,719,198Canada ~ 50 5 2 (n.d.) 400 83 14,205Denmark 137 1 (1) 180 6 4 81Finland 34 5 (2) 959 18 1,300France 256 3 (2) 540 6 149 13,300Germany 9,066 120 (118) 72,000 904 95,162Ireland 22 0 0 0 3Italy 1264 1 (0) 540 6 903 746,470Luxembourg 31 3 (3) 894 6 7 261Norway 44 5 (n.d) n.d. 23 353South Korea 57 5 (n.d.) 1,200 4 184 39,000Sweden 187 53 (11) 16,800 6 190 44,000Switzerland 600 16 (16) n.d. 136 11,500The211 16 (16) 6.540 6 150 5,201NetherlandsU.K. 265 3 (3) 1,260 6 40 520USA ~ 440 25 (n.d.) n.d. 1,035 112,000Total >13,000 260 (>=179) >100,000 >5,800 >2,800,000n.d. – no data1 including waste water treatment plants, no landfill plants included2 referring to <strong>biomethane</strong>3 total (public and private)4 motorcar, public transport, truck; NGVs5 only biogas plants, no data for waste water treatment plants available6 assuming 60% CH 4 in the raw biogas7 no waste water treatment plants and no landfill plants included4.2. Support schemes and voluntary targetsNot all IEA Bioenergy member countries have support schemes or incentive programmes for<strong>biomethane</strong>. The countries which have already implemented, or are planning to implementsuch programmes use different approaches. The following paragraphs provide a shortoverview of the possibilities. Further detailed information can be found in the literature(GGG 2013b), (EBA 2013), (GGG 2012).Tax exemptionBiomethane can be exempted from a tax or be subject to a reduced tax rate compared tofossil fuels (e.g. natural gas). This is one of the most common support schemes, and isapplied e.g. in Austria, Germany, Sweden, Switzerland and Slovakia.46
Feed-in tariff for electricityIf <strong>biomethane</strong> is used for electricity or CHP production, a feed-in tariff and partially also anadditional <strong>biomethane</strong> bonus for biogas upgrading is granted. This is applied e.g. in Germany,Italy, Denmark, Slovakia and U.K.Direct feed-in tariff for <strong>biomethane</strong>Similar to the feed-in tariff for electricity, injection in the natural gas grid or direct delivery toa fuel station can be supported by a feed-in tariff for <strong>biomethane</strong>. This is applied in France,Denmark and the U.K. as well as in the Netherlands, where a feed-in subsidy covering thedifference between production costs and income is implemented (biogaspartner <strong>2014</strong>).Feed-in tariff for heatSimilar to the feed-in tariff for electricity, the provision of <strong>biomethane</strong> for heat can besupported with a feed-in tariff on top of the gas price. This support scheme is applied in theU.K. and Denmark. The Danish support scheme is, however, still waiting for approval fromthe EC.Investment incentiveA biogas or <strong>biomethane</strong> plant can be supported by a reduced interest rate for a loan or afixed share of the investment cost. This is applied e.g. in Austria, Sweden, Denmark, Hungary,Slovakia and Poland.Fee for avoided network tariffsIf <strong>biomethane</strong> is injected directly into the gas grid, it is assumed that this leads to lower coststhan the use of natural gas, which typically has to be transported over significantly longerdistances to the end-user, causing e.g. more costs for the operation of the pressure stages.These cost savings can lead to a direct incentive for <strong>biomethane</strong>. So far, this is applied inGermany with 0.7 €cent/kWh for the first 10 years of operation.Biofuel quotaCountries can set fixed targets or quotas for a certain amount of biofuels in the vehiclepetrol and diesel as well as gas, if used for transport. To achieve these quotas, <strong>biomethane</strong>can be traded virtually, and therefore may benefit from a high demand. This is applied e.g. inGermany, the Netherlands and U.K.Renewable energy quota (Trade of certificates of origin)A country can set an obligatory share of electricity production by renewable energies for thesuppliers of electricity. These shares can be met by own renewable energy plants or bypurchase of certificates for example from <strong>biomethane</strong>. Poland, Sweden, Norway and U.K.are some of the countries which implemented such a system.To push the market deployment of <strong>biomethane</strong>, and therefore substitution of natural gas bya sustainable alternative, some countries have set (additionally to support schemes)voluntary targets for a <strong>biomethane</strong> share in the energy sector. This is especially common inthe European Union countries, due to their general targets for renewable energies. Some ofthose voluntary targets and commitments are shortly described in the following:- France: Biomethane is recognised as an attractive new renewable form of energy,and stimulated e.g. by feed-in tariff and a national working group. So far targets forbiogas are defined in the French National Renewable Energy Action Plan (NREAP)(2010) but not yet for <strong>biomethane</strong>. (GGG 2013b)47
- Germany: In Germany, targets of 6 billion m³ <strong>biomethane</strong> production by 2020 and10 billion m³ by 2030 injection in the national gas grid have been set. (GasNZV 2012)- Hungary: Hungary set targets for <strong>biomethane</strong> for the years 2016 – 2020 in theirNREAP. Compared to other measures, these targets are quite low. (GGG 2013b)- Luxembourg: At the end of 2011, Luxembourg passed a law which guarantees afixed compensation for 10 million cubic meters <strong>biomethane</strong> per year. Within thislimit, 3 – 4 standard upgrading plants with a capacity of 350 m³/h could besupported. (Recueil de Legislation Luxembourg 2011), (Koop and Morris 2012)- The Netherlands: The ambitions of the Netherlands to increase the amount ofrenewable energy are expressed in the NREAP. It is planned that the amount ofenergy from the feed-in of <strong>biomethane</strong> into the natural gas grid should increase to6.7 TWh in 2020, from around 1 TWh today, to meet the required share ofrenewable energy (Koppejan et al. 2009).- Denmark: With the Danish energy agreement of 12 March 2012, a new supportmodel and new subsidiary schemes for production and use of biogas were adoptedin Denmark. One objective in this agreement is the deployment of biogas for otherareas than production of CHP and thereby the facilitation of feeding, distributingand selling upgraded biogas (BNG) in the existing natural gas grid system has explicitfocus. The agreement is supported by subsidy schemes for the upgrading as well asfor the use of the gas for CHP, transport and industrial purposes. The currentproduction of biogas in Denmark is 4 PJ, compared to an estimated total potential of40 PJ. There are currently no explicit targets on how much of this should beupgraded and fed to the grid. However, in case the market will not show “significantgrowth” in <strong>2014</strong>, there are political thoughts on issuing purchase of obligation forthe Danish CHP plants (Energinet.dk, <strong>2014</strong>).- Slovakia: Targets for <strong>biomethane</strong> are implemented, but the financial incentives arenot sufficient to stimulate rapid deployment. (GGG 2013b)- United Kingdom: The UK is forecasting 1.5 TWh of <strong>biomethane</strong> in 2015, rising to 7TWh in 2020 and 15 TWh in 2030. This is a significant contribution, but there is still along way to go since the total demand for natural gas is estimated to be over 600TWh in 2030. By 2015 <strong>biomethane</strong> will be recognised for support if it is used forrenewable heating. (GGG 2013b).In other countries, voluntary targets are under discussion, e.g.:- in Austria, the Energy Strategy Austria envisages biogas to contribute to therenewable energy targets by delivering electricity or biofuel. The focus lies onupgrading biogas to <strong>biomethane</strong> with two options. The first option is the addition of20% of <strong>biomethane</strong> to natural gas to reach 200,000 cars by 2020. The second optionis increasing the amount of biogas produced to 10% of the gas demand, whichcorresponds to 8 TWh in Austria. Concrete targets have not yet been set.- in Belgium, the research organisation VITO calculated the theoretical potential of<strong>biomethane</strong> production in the region Flanders to be ca. 330 mio m³, the equivalentof ca. 2% of the yearly non-industrial consumption of natural gas. This could betaken to deliver a part of the extra biofuels needed by 2020. In 2013, a system withboth obligations for blending in gasoline and diesel and tax reduction was prolongedtill 2019. Biomethane is not (yet) included in the current policy on biofuels fortransport.- Sweden has the governmental aim to have a fossil-independent transportationsector by 2030. A public inquiry is currently open (August <strong>2014</strong>) to show how fossilfree transportation can be reached in 2050 and the results are expected to beimportant for the future governmental support for <strong>biomethane</strong> production in48
Sweden. The potential to produce <strong>biomethane</strong> from both biogas from anaerobicdigestion and gasification until 2030 is estimated to be 10-20 TWh of <strong>biomethane</strong> ifthe conditions are right (Dahlgren et al. 2013).From this, it is evident that <strong>biomethane</strong> markets are currently established in a number of EUcountries with significant growth in the period 2010 – 2020. Between countries, there aredifferences in the quality of the targets and also in the intended main markets for<strong>biomethane</strong>:• heating (UK)• electricity with district heating (Germany)• vehicle fuel (Sweden, Germany, Austria)In conclusion, the country-specific situation is determined by the national politicalframework conditions which differ significantly between the countries. Nevertheless, theremay be similar expectations of the stakeholders in different countries for the long termdevelopment of biogas and <strong>biomethane</strong>. Therefore a specific questionnaire has beendeveloped and sent out to IEA Bioenergy Task 37 and 40 members (see chapter 5).5. Stepping stones towards market deployment for <strong>biomethane</strong>Parallel to the analysis and collection of available information for this study, a specificquestionnaire was developed and distributed in the focus countries to get deeper insightsinto the chances and barriers for biogas and <strong>biomethane</strong> as perceived by the differentstakeholders. The detailed results are provided in the annex, the key findings are describedin the following section.5.1. Aim and response of the questionnaireIn 2013, a questionnaire was sent out relevant stakeholders through the different membersof IEA Bioenergy Task 37 and Task 40. The questionnaire contained 23 questions dividedover the following topics:• market & trade• policy• certification & standards• barriers:- economic barriers- policy barriers- operational barriers- trade barriers- social and environmental barriers99 responses to the questionnaire, which was sent out in November 2013, were received.Figure 5-1 shows the distribution of the respondents over countries, Figure 5-2 shows theshare of responses received for the different stakeholder categories.49
45%40%35%30%25%20%15%10%5%0%Austria Belgium Germany TheNetherlandsFigure 5-1. Country respondents to the surveySwedenOtherFrom Austria, 11 questionnaires were received from the different stakeholders, mainlypolicy makers, researchers and others (Energy Agency, Association, Biogas Register). In thesurvey, this needs to be taken into account when interpreting the results of Austria.There were 18 Belgian respondents for the survey, with some respondents having multipleroles. All stakeholders are represented in the survey, with a strong representation ofresearchers.10 completed surveys were received from Germany. The identification of the respondents isgiven in the Fig. 5-2 below. As can be seen, the different stakeholders in the value chain arerepresented but, as for Belgium, there is also a strong representation of the researchcommunity.13 completed surveys were received from the Netherlands. All stakeholders are represented,the constructors are strongly represented and in the category ‘other’, consultants, projectdevelopers, policy related and public private partnerships respondents answered.50
Policy maker2%Other25%Investor11%Certification body0% End-user: industry1%Constructor12%End-user: transport6%End-user: residentialbuilding1%Researcher31%Trader5%Grid Owner6%Figure 5-2. Identification of the respondents of the surveyThe highest feedback came from Sweden with 40 responses. Also here, the researchcommunity was strongly represented. In the category ‘other’, consultants were stronglyrepresented, but also farmers, producers of <strong>biomethane</strong>, sales and distribution partners andassociations.7 surveys from countries other than the focus countries were received: 1 from Norway, 1from Denmark, 1 from UK, 3 from the USA and 1 from the European Commission.5.2. Summary on stepping stones towards a <strong>biomethane</strong> marketThe response to the survey per country is not enough for a scientific statistical analysis, butdue to the fact that it was well-targeted towards experts on <strong>biomethane</strong>, it is considered togive a good insight into the trends and perceptions of each focus country.Regarding the policy for <strong>biomethane</strong>, it can be concluded that a good framework isnecessary to push the <strong>biomethane</strong> development forward. It is apparent that even incountries like Germany and Sweden that have already pushed <strong>biomethane</strong> forward, this isstill an important point of attention.As shown in appendix A 1 in more detail, four out of five countries focus on <strong>biomethane</strong> withthe intended end-use for electricity and heat; only Sweden focusses on transport use. Whenasked for additional policy, the German and Austrian respondents would like to follow theSwedish example and ask for more support in the transport sector. Sweden itself would seesome help for the facilities, the same for the Dutch respondents. Belgium (at the beginningof the development) is still focussed on injection into the gas grid.Because of the (lack of) economic feasibility in the current market, <strong>biomethane</strong> needspolitical support and of course associated financial support. This conclusion was the samefor all the countries.51
The countries studied are in different phases of the development of the market: Belgium isstanding at the start of the development. Austrian respondents perceive themselves as apremature market. The development to a mature market is for the Austrian respondentsdepending on the political support for <strong>biomethane</strong>. Germany, The Netherlands and Swedenhave already a more developed and mature market. Despite this, respondents of those threecountries still believe that there is still room for growth.Next to a good policy framework, another important stepping stone for the development ofa <strong>biomethane</strong> market is good information flow to the stakeholders and to the public. Thispossible barrier is evident in all the of the five focus countries. Another European barrierthat can be seen in the responses was the shortage of feedstock and volatile feedstockprices. For the German and Austrian stakeholders, also the fear for environmental harmsfrom agricultural intensification caused by increased demand of biogas crops was a possiblebarrier, this is not perceived in the other three countries.When asked if international trade could occur in the future, respondents from Belgium,Germany and Sweden answered positively. Respondents from the Netherlands and Austriawere less certain if international trade could be a fact in the future. The main argument fordoubt is that the demand for <strong>biomethane</strong> in these countries is higher than the production,so there will be nothing left for international trade. The Swedish respondents describe thedesire to import <strong>biomethane</strong> to satisfy the increasing demand.6. Conclusions and RecommendationBiomethane is an attractive fuel to support the transition of the fossil resource base and theclimate protection targets in different ways. While the technical availability was shown for<strong>biomethane</strong> from biogas, the provision of <strong>biomethane</strong> via thermochemical conversion is stillat the demonstration stage. The thermochemical conversion process is a highly complexprocess with no market penetration so far. In contrast to the biochemical conversion process,it is has to be implemented on a much larger scale with the resulting hurdles of logistic andtechnology.In regions with good natural gas infrastructure, the great opportunity of <strong>biomethane</strong> is therelatively easy integration into the existing energy system (e.g. use for heat, electricity or asa transport fuel). Also, by injecting <strong>biomethane</strong> into the grid, production and consumptioncan be spatially decoupled. This logistical option is in principle available today, but cleardemands for the <strong>biomethane</strong> quality (transnational) to be fed into the gas grid are necessary.Technical standards for <strong>biomethane</strong> from biogas are currently under development on aEuropean level. The specific challenge is to define standards which are attractive for thedifferent potential end-user (gas grid owner, automotive industry, etc.) to enter the newmarket.The use of <strong>biomethane</strong> to replace natural gas can lead to significant reduction of greenhousegases. It has been shown that significant variations are possible which arise from both theplant design and operation, and the GHG accounting methodology. By following bestpractice, it is possible to achieve GHG savings of over 80% when compared to the fossil fuelalternative. Sources of GHG emissions savings vary, depending on the process for<strong>biomethane</strong> production. The assumption on the fossil fuel replaced (e.g. coal, oil or NG inthe heat and CHP sector or liquid and gaseous fuels in the transport sector) is important,because the GHG saving potential depends strongly on this choice. Key sources of GHG52
emissions include biomass feedstock cultivation (where purposely grown energy crops areused) and biogas upgrading. Emissions may be significantly reduced with the application ofBAT (Best Available Technology). On the other hand, the <strong>biomethane</strong> provision is linked tohigher costs compared to natural gas in the short- and mid-term. Therefore, standards arenecessary which ensure sustainable feedstock production as well as a proper andtransparent methodology to determine the mass balance for <strong>biomethane</strong> transported andtraded via the natural gas grid.Market introduction strategies have to consider the complex provision chain (Figure 6-1),which has to include widely different stakeholders. Promising markets are seen in thosecountries with dedicated <strong>biomethane</strong> strategies, targets and support schemes. Today, thereis a wide range of approaches, instruments and certificates established which can differ in:• sustainability demands of the <strong>biomethane</strong> provision (feedstock information andtechnical information on the conversion unit)• technical demands of grid injection (gas quality information)• technical demands for end use (gas quality information)• support schemes (what kind of support and where in the chain)• monitoring of the <strong>biomethane</strong> flows (registration in the relevant countries)With regard to political strategies and access of the natural gas grid, Europe is becomingmore active in the development of a <strong>biomethane</strong> market. Some countries have drawn up a<strong>biomethane</strong> strategy and implemented support schemes (e.g. Sweden, Switzerland,Germany, Denmark, United Kingdom, Italy), see chapter 4.2. Ongoing actions are in the fieldof technical standardisation and sustainability certification. Both are complex issues, butmight provide instruments in the next one or two years to improve the situation with regardto <strong>biomethane</strong> use and cross border trade:• Technical standards need to be implemented on an international level, especially for<strong>biomethane</strong> use in cars. The major problem here is that those standards have notbeen agreed yet for NG due to different interest of the stakeholder in this sector.With <strong>biomethane</strong> as an additional fuel, it currently seems that the opportunities toagree on a common standard have been increased.• On European level, sustainability demands for <strong>biomethane</strong> need to be madecompatible with the specific supply chains and transport options. This increases thedemand to provide default values and appropriate reference systems for different<strong>biomethane</strong> applications, but also calculation methods to make sure that – even in amass balance system – <strong>biomethane</strong> can be transported via the natural gas grid,similar to sustainably certified palm oil for biodiesel, which can be transported in atank vessel together with conventional palm oil without violating the mass balancesystem.53
Figure 6-1. Framework of the <strong>biomethane</strong> value chainSo far, biogas upgrading is mainly undertaken in Europe. Outside the EU, only minoractivities in e.g. the USA and South Korea are observed.In the investigated focus countries, there is a strong expectation for a growing market. Onereason can be seen in the financial support, which has been implemented in those countries,and which is seen as a major driver for the market implementation. National <strong>biomethane</strong>markets are also seen as the promising starting point for an expanding international<strong>biomethane</strong> trade. Furthermore, there is already a planned close cooperation between thenational <strong>biomethane</strong> registers for better trade between the participating countries, with theoption of including more countries. Relevant next steps for those registers are thedevelopment of a common terminology, tracing system and the definition of interfacesbetween the country-specific quality demands but also accounting and monitoring of themarket. In the case of the German <strong>biomethane</strong> market, based on the questionnaire, it canbe summarised that questions of the economic viability of <strong>biomethane</strong> projects inconnection with stable political framework conditions are the most relevant factors forindividual decision-making. The importance of a reliable framework, for example throughclear legal requirements and adequate regulation and support measures, both for<strong>biomethane</strong> provision and end use markets, cannot be overemphasised.Additional problems for transnational trade arise from the different support schemesdeveloped in the different countries. Two aspects are relevant here:(i) To which point of the supply chain is the support connected: Currently, in thecountries investigated, different products are supported (<strong>biomethane</strong> fed intothe grid, electricity provided from biogas, <strong>biomethane</strong> provided at fillingstations…). From a national perspective, this is reasonable due to differenttargets and strategies how <strong>biomethane</strong> is included, but for internationalcooperation, there is risk of confusion. For international trade, a strong and cleartracking of flows is necessary, to avoid double support or marketing (e.g. at theinjection point in one country and at the delivery point in another country).(ii) Level of support: Today, the specific level of support differs widely (i.e. the feedin-tarifffor <strong>biomethane</strong> injected into the grid). If a framework for internationaltrade is implemented, it will be relatively easy to transport <strong>biomethane</strong> via the54
gas grid to those countries where higher support is given, or otherwise veryfavourable conditions exist. This could on the one hand accelerate marketdevelopment, but on the other hand may also cause the national supportsystem to collapse. 17This leads to the conclusion that more coherent support conditions between countries couldmake the market development of <strong>biomethane</strong> easier and reduce the complexity of theregistry systems.Recommendations:Summing up the current <strong>status</strong> on <strong>biomethane</strong>, this report shows that in some countriesthere are clear trends for <strong>biomethane</strong> market growth. To ensure a regulated and sustainablemarket, stable framework conditions are needed. Therefore, the followingrecommendations can be given for a future <strong>biomethane</strong> market:• Development and implementation of widely-accepted technical standards regardinguniform <strong>biomethane</strong> injection to the natural gas grid, which aims to a standardised<strong>biomethane</strong> quality (in a given range) with respect to e.g. calorific value and degreeof purity.• Sustainability standards for all kinds of <strong>biomethane</strong> application, but also with thepossibility to trade sustainable <strong>biomethane</strong> between countries.• Certification and registries for a transparent national and international market of<strong>biomethane</strong> (e.g. no double support).• Equal treatment of domestic and imported <strong>biomethane</strong> (certification,support/incentive, …)• Support schemes with regard of reliable and long term conditions. From today’sperspective a single, uniform regulation region connected by one natural gas grid (i.e.Europe) seems to be an important milestone for the development of internationalmarkets; this study did not investigate in detail how such an instrument could looklike (e.g. a uniform <strong>biomethane</strong> grid injection tariff. A quota, etc.).• Roadmaps for mid- and long-terms targets in order to clearly define the incentive.With regard to the complex provision chain of <strong>biomethane</strong>, different stakeholder in the fieldand the transnational natural gas grid (especially in Europe) it is easy to understand thatthose framework conditions are difficult to achieve. Implementing these recommendationsshould provide a good base for sustainable, fair, future-orientated and stable <strong>biomethane</strong>market development. An overarching international framework of sustainability information(e.g. feedstock, origin, GHG emission from production and transport, etc.) for fossil andrenewable energy carriers could support the <strong>biomethane</strong> market too, but goes beyond thescope of this study.17 Comparable experiences were made when single European countries implemented renewableelectricity certificates at the beginning of the 21.century, e.g. in the Netherlands large amounts ofrenewable electricity were imported as certificates to get a tax exemption. Within two years, theDutch government had to significantly change the tax exemption scheme, and ultimately switch to adifferent support scheme altogether.55
ReferencesAcht A (2012) Gasspeichertechnologie und -herausforderungen. Leuphana Energieforum2012, LüneburgAdams, P., Mezzullo, W. & McManus, M., <strong>2014</strong>. Environmental life cycle assessment of<strong>biomethane</strong> production from annual energy crops, International BioenergyConference <strong>2014</strong>, Manchester, UK (in press).ADBA, 2013. Voluntary guidelines on best practice for the use of crop feedstocks inAnaerobic Digestion, the Anaerobic Digestion and Biogas Association (ADBA),London, UK (in press).AEA 2010. BEAT2 (Biomass Environmental Assessment Tool) v2.1, AEA Technology & NorthEnergy, Oxford, UK.Agostini, A., Giuntoli, J., Boulamanti, A. (2013) Carbon accounting of forest bioenergy. JRCTechnical Reports. European Commission. Report EUR 25354 EN, 2013.Álamo J (2013) NGVs & refuelling stations worldwide. In: NGVA Eur. - Worldw. NGV Stat.http://www.ngvaeurope.eu/european-ngv-statistics. Accessed 22 Jul 2013Altrock M, Eichelbrönner M, Klima J (2008) Energiewirtschaftliche, konzeptionelle undrechtliche Rahmenbedingungen der Erzeugung, Einspeisung und Nutzung vonBiomethan.Arrhenius K, Magnusson B, Sahlin E (2011) Föroreningar I biogas: Validering avanalysmetodik för siloxaner. MalmöBauer F, Persson T, Hulteberg C, Tamm D (2013a) Biogas upgrading – Review of commercialtechnologies. Swedisch Gas Technology Centre (SGC), MalmöBauer F, Persson T, Hulteberg C, Tamm D (2013b) Biogas upgrading – technology overview,comparison and perspectives for the future. Biofuels Bioprod Biorefining 1423. doi:10.1002BauGB (2011) Baugesetzbuch in der Fassung der Bekanntmachung vom 23. September 2004(BGBl. I S. 2414), das zuletzt durch Artikel 1 des Gesetzes vom 22. Juli 2011 (BGBl. I S.1509) geändert worden ist.Baur L (<strong>2014</strong>) Landwärme GmbH, interview at the Biogas Exhibition Nürnberg.Beil M, Beyrich W (2013) Chapter “BBiogas upgrading to <strong>biomethane</strong>”, in “The biogashandbook: science, production and applications.”Woodhead PublishingBeil M, Heetkamp J, Klaas U, et al. (2011) Aufbereitung von Biogas - Merkblatt DWA-M 361.Deutsche Vereinigung für Wasserwirtschaft, Abwasser und Abfälle e.V., HennefBenjaminsson J, Nilsson R (2009) Distributionsformer för biogas och naturgas i Sverige.Swedisch Gas AssociationBerenz S, Bochmann G, Heißenhuber A (2008) Strategien zur Risikominimierung beimBetrieb von Biogasanlagen. Risikomanagement Landwirtsch. pp 185–223Berger A (2011) Risikomanagement bei internationalen Projekten im Bereich derErneuerbaren Energien.BImSchG (2011) Bundes-Immissionsschutzgesetz in der Fassung der Bekanntmachung vom26.09.2002 (BGBl. I S. 3830), zuletzt geändert am 03.11.2011.biogas data (2013) Data to inform and inspire sustainable biosolids management.http://www.biogasdata.org/home.biogaspartner (<strong>2014</strong>) Market Development - The Netherlands.Biogaspartner, 2011. Biogas Grid Injection in Germany and Europe – Market, Technology andPlayers,biogaspartner – a joint initiative, article no. 5010, Deutsche Energie-Agentur GmbH (dena),Berlin, Germany.56
Biokraft-NachV (2009) Verordnung über Anforderungen an eine nachhaltige Herstellung vonBiokraftstoffen (Biokraftstoff-Nachhaltigkeitsverordnung - Biokraft-NachV) vom 30.September 2009 (BGBl. I S. 3182).Black, M.J., Whittaker, C., Hosseini, S.A., Diaz-Chavez, R., Woods, J., Murphy, R.J., 2011. LifeCycle Assessment and sustainability methodologies for assessing industrial crops,processes and end products. Industrial Crops and Products, vol. 34, pp. 1332–1339.BMELV (2009) Aktionsplan der Bundesregierung zur stofflichen Nutzung nachwachsenderRohstoffe.BMU (2008) Biogas und Umwelt - Ein Überblick.BNetzA (2011) Biogas-Monitotringbericht 2011. Bericht der Bundesnetzagentur über dieAuwirkungen der Sonderregelungen für die Einspeisung von Biogas in dasErdgasnetz.Brohmann B (2007) Nichttechnische Hemmnisse der Biogasnutzung: Beiträge zur weiterenVerbreitung der Biogastechnologie. Thesen zum Workshop.Brohmann B, Hennenberg K, Hünecke K (2008) Hemmnisanalyse Biogasausbau. Optim. FürEinen Nachhalt. Ausbau Biogaserzeugung -Nutz. Dtschl. Heidelberg, Leipzig, Berlin,Darmstadt, pp 305 – 354Bundesnetzagentur (2011) Biogas-Monitotringbericht 2011. Bericht der Bundesnetzagenturüber die Auwirkungen der Sonderregelungen für die Einspeisung von Biogas in dasErdgasnetz.Carbo, M., Smit, R., Drift, B.v.d, Jansen, D. (2011) Bio Energy with CCS (BECCS): Largepotential for BioSNG at low CO 2 avoidance cost. Energy Procedia, 4, 2011, pp 2950-2954.Council of the European Union (<strong>2014</strong>) Proposal on indirect land-use change: Council reachesagreement. Press release 7550/14.Dahlgren S, Liljeblad A, Cerruto J, et al. (2013) Realiserbar biogaspotential I Sverige 2030genom rötning och förgasning. Avfall Sverige utveckling, MalmöDaniel-Gromke J, Denysenko V, Sauter P, et al. (2013) Stromerzeugung aus Biomasse. BMU,Leipzig, Berlin, Halle, KasselDanish Energy Authority (2013) Anvendelse af bioenergiressurcerne og gasstrategi herfor.Notat om biogas til Klimakomissionen 2010.http://www.ens.dk/sites/ens.dk/files/undergrund-forsyning/vedvarendeenergi/bioenergi/biogas/Biogasnotat%20til%20Klimakommissionen%20maj%202010.pdf.DBFZ (2011) Ergebnisse der Workshops vom 7.6.2010 und 7.4.2011 im Rahmen desProjektes “BIOMON” (unveröffentlicht).DBFZ (2013) Monitoring zur Wirkung des Erneuerbare- Energien-Gesetz (EEG) auf dieEntwicklung der Stromerzeugung aus Biomasse. Bundesministerium für Umwelt,Naturschutz und Reaktorsicherheit (BMU), LeipzigDECC (2013) Government Response to the consultation on proposals to enhance thesustainability criteria for the use of biomass feedstocks under the RenewablesObligation (RO). Department of Energy & Climate Change, UKdena (2011a) biogaspartner – gemeinsam einspeisen. Biogaseinspeisung in Deutschland undEuropa – Markt, Technik und Akteure.dena (2011b) Biogaseinspeisung – die intelligente Lösung für die Zukunft.dena (2011c) Absichtserklärung-Initiative Erdgasmobilität. CNG und Biomethan alsKraftstoffe.dena (2010) Biomethan im KWK- und Wärmemarkt. Status Quo, Potenziale undHandlungsempfehlungen für eine beschleunigte Marktdurchdringung.dena (2011d) Erdgas und Biomethan im künftigen Kraftstoffmix. Handlungsbedarf undLösungen für eine beschleunigte Etablierung im Verkehr.57
GGG (2013a) Greening Your Biomethane Production Chain – A best practice guide forreducing greenhouse gas emissions, Intelligent Energy Europe (IEE).GGG (2013b) Biomethane Market Matrix. Green Gas GridsGovasmark E (2012) Country Report Norway. IEA Task 37 Meeting, ViennaGrossen A, Schmid M (2012) Gas geben beim Biogas. Verband der SchweizerischenGasindustrie (VSG), ZürichHEI (2006) Biogas Netzeinspeisung; Modellanlage. Hornbachner Energie Innovation, WienHeld, J. (2013) Small and medium scale technologies for bio-SNG production. SGC Rapport2013:281, Malmö, Sweden.Heyne, S. (2013) Bio-SNG from the Thermal Gasification – Process Synthesis, Integration andPerformance. Thesis, 2013, Chalmers University of Technology, Göteborg.Hermeling C, Wölfing N (2011) Energiepolitische Aspekte der Bioenergienutzung:Nutzungskonkurrenz, Klimaschutz, politische Förderung.Hooper RJ, Li J (1996) Summary of the factors critical to the commercial application ofbioenergy technologies. Biomass Bioenergy 11:469–474. doi: 10.1016/S0961-9534(96)00054-2IEA (2012) World Energy Outlook 2012. International Energy Agency, ParisIEA (2013a) Oil & Gas Security – emergency Response of IEA Countries – Japan. InternationalEnergy Agency, ParisIEA (2013b) Bio-Energy in family framing – a new sustainable perspective for the rural sectorin brazil. IEA Bioenergy Task 37.ISO (2006) Environmental management - life cycle assessment - principles and framework.International Standards Organisation (ISO), Second Edition, EN ISO 14040.ISO 16559:<strong>2014</strong>, Solid biofuels –- Terminology, definitions and descriptions. In preparation.(Abstract ISO 16559:<strong>2014</strong>)Jozsa E (<strong>2014</strong>) Frame condistion for <strong>biomethane</strong> in Sweden.Kaltschmitt M, Hartmann H, Hofbauer H (2009) Energie aus Biomasse: Grundlagen,Techniken und Verfahren, 2. Aufl. Springer, BerlinKang H (2013) South Korea Country Report. IEA Tasl 37 Meeting, BernKeil R, Günther T, Kilpert S (2008) Das Ausfallrisiko von Biogasanlagen und derenVersicherbarkeit. DVGW Energiewasser-Prax.Knoef H (2012) Handbook Biomass Gasification Second Edition, 2. ed. BTG BiomassTechnology Group BV, Enschede, NetherlandsKommission für Anlagensicherheit (2009) Merkblatt Sicherheit bei Biogasanlagen-KAS 12.Koop D, Morris C (2012) Biogas in Luxembourg’s natgas network. Renew. Int.Koppejan J, Elbersen W, Meeusen M, Prem B (2009) Beschikbaarheid van Nederlandsebiomassa voor elektriciteit en warmte in 2020. SenterNovem, NetherlandsKWKG (2011) Kraft-Wärme-Kopplungsgesetz (KWKG) vom 19. März 2002, zuletzt geändertam 28. Juli 2011.Lampinen A (2013) Biomethane upgrading in Finland. 10. International Conference onBiofuels, BerlinLangner T, Küster M, Müller-Kirchenbauer J (2013) Lokale Erdgasspeicheranlagen inDeutschland - Teil 1. Energ Wasser-Prax 54–58.LBEG (2013) Untertage-Gasspeicherung in Deutschland; Erdöl, Erdgas, Kohle. Landesamt fürBergbau, Energie und Geologie, HannoverMadlener R, Zweifel P (2006) Investitionen in neue Energietechnologien: HemmnisfaktorFinanzierung. Wirtschaftsdienst. doi: 10.1007/s10273-006-0520-1Markard J (2008) Biogasnutzung in der Schweiz. Hemmnisse, Förderfaktoren undzukunftsorientierte Analysen.59
McCormick K, Kåberger T (2007) Key barriers for bioenergy in Europe: Economic conditions,know-how and institutional capacity, and supply chain co-ordination. BiomassBioenergy 31:443–452. doi: 10.1016/j.biombioe.2007.01.008Mez L (2007) Zukünftiger Ausbau erneuerbarer Energieträger unter besondererBerücksichtigung der Bundesländer. Endbericht der Forschungsstelle fürUmweltpolitik (Freie Universität Berlin) für das Bundesministerium für Umwelt,Naturschutz und Reaktorsicherheit.Ministry of Environment (2012)Ministry of Environment, Republic of KoreaMitner M, Makaruk A, Harasek M (2012) Biomethane Calculator Version 2.0. ViennaUniversity of TechnologyMüller-Langer, F. (2011) Analyse und Bewertung ausgewählter zukünftigerBiokraftstoffoptionen auf der Basis fester Biomasse. Thesis, 2011, TechnischeUniversität Hamburg-Harburg, Hamburg.NaturalGas.org (2013)www.naturalgas.org.Newton J, Bourne SJ, Cooley GC, Newborough M (2013) Energy Storage. 3rd ICEPE. 2013,Frankfurt.NNFCC Biocentre (2013) Offical Biogas Plant Map. http://www.biogasinfo.co.uk/index.php/ad-map.html.OECD/IEA (2013): IEA - Gas Trade Flows in Europe. International Energy Agency.http://www.iea.org/gtf/index.aspOlofsson, M, Erlandsson (<strong>2014</strong>) Enhanced emission performance and fuel efficiency for HDmethane engines. AVL MTC Report OMT 1032 for IEA – AMFPaulsson J, Steinwig C (2012) Produktion och användning av biogas år 2012.Energimyndighet, SwedenPersson T, Baxter D (<strong>2014</strong>) Task 37 Biogas Country Overview. IEA BIOENERGY Task 37Petersson A (2013) Chapter “Biogas cleaning”, in “The biogas handbook: science, productionand applications.”Woodhead PublishingPetersson A, Wellinger A (2009) Biogas upgrading technologies – developments andinnovations.Ponitka J (2013) Presentation: Hemmnis- und Risikoanalyse Biomethan. DBFZ-WorkshopBiomethan – Hemmnisse, Risiken, Lösungen, LeipzigPostel J, Jung U, Fischer E, Scholwin F (2009) Stand der Technik beim Bau und Betrieb vonBiogasanlagen-Bestandsaufnahme 2008.Rasmussen FL (2011) Opgradering af biogas sat på skinner i Fredericia. DenmarkRecueil de Legislation Luxembourg (2011) Production, la rémunération et lacommercialisation de biogaz.Reinhold G (2011) Soll der Landwirt Biomethan einspeisen?- Wirtschaftlichkeitsaspekte.Schiffers J, Vogel A, Meyer-Prescher B (2009) Technische, rechtliche und ökonomischeHemmnisse und Lösungen bei der Einspeisung von Biomethan in das Erdgasnetz ausSicht eines Gasunternehmens. BMBF-Verbundprojekt Beseit. Tech. Rechtl. Ökon.Hemmnisse Bei Einspeisung Biog. Gase Erdgasnetz Zur Reduzierung KlimarelevanterEmiss. Durch Aufbau Anwend. Einer Georeferenzierten Datenbank – Strateg. ZurPolit. Techno-Ökon. Umsetzung 5:Schmitz S (2012) Gasspeicherung – Voraussetzung für die Energiewende. FrankfurtSchmuderer M (2008) Blockseminar Biogas 2. Teil (Rahmenbedingungen, Wirtschaftlichkeit,Ethik).Scholwin F (2013) Personal conclusion from the running project “Perspectives for biogasfeed in and advances for the incentives framework” financed by the German FederalMinistry for the Environment, Nature Conservation and Nuclear Safety.60
Schuck O, Seidel O, Scholwin F, et al. (2009) Entwicklung und Anwendung einer GIS-Applikation zur Standortfindung und Potenzialanalyse der Biomethanerzeugung.BMBF-Verbundprojekt Beseit. Tech. Rechtl. Ökon. Hemmnisse Bei Einspeisung Biog.Gase Erdgasnetz Zur Reduzierung Klimarelevanter Emiss. Durch Aufbau Anwend.Einer Georeferenzierten Datenbank – Strateg. Zur Polit. Techno-Ökon. Umsetzung 6:Sebi C, Mairet N, Lapillone B (2013) Energy price scenarios and side conditions for modelingenergy demand in buildings. Internal working paper for the project ENTRANZE.www.entranze.eu.Seiffert M, Rönsch S (2012) Bio-Synthetic Natural gas (SNG) – concepts and their assessment,encyclopedia of sustainablity science and technology. Encycl. Sustain. Sci. Technol.Simell, P., Hannula, I., Tuomi, S., Kurkela, E., Hiltunen, I., Kaisalo, N., Kihlman, J. (<strong>2014</strong>):Techno-economic study on bio-SNG and hydrogen production and recent advancesin high temperature gas cleaning. In: Regatec <strong>2014</strong>, Conference Proceedings; pp 39;Held J (editor)Stachowitz WH (2005) Gedanken und Fakten im Rahmen einer Gefahrenanalyse zumExplosionsschutzdokument gemäß Betriebssicherheitsverordnung „ATEX“ –Auswirkungen auf den Gasbetrieb Biogasanlagen: Was ist normal?Starr, K., Gabarrell, X., Villalba, G., Talens, L., Lombardi, L. 2012. Life cycle assessment ofbiogas upgrading technologies, Waste Management, vol. 32, pp. 991–999.Strauch S (2012) Biogas upgrading technologies - technical and financial aspects.GreenGasGrids study tour 2012. June 2012, Asten (A).Stronzik M, Rammerstorfer M, Neumann A (2008) Wettbewerb im Markt für Erdgasspeicher.Bad HonnefThorson S (2013) Biomethane upgrading plants in Canada. http://www.biogasassociation.caThrän, D. (2012) European <strong>biomethane</strong> potentials. Workshop on Biomethane Trade.21.02.2012, Brussels.Thrän, D., Grope, J., Rönsch, S., et al. (2012) FOCUS ON Biomethane - Biomass for Energy.Thrän, D., Seiffert, M., Müller-Langer, F., et al. (2007) Möglichkeiten einer europäischenBiogaseinspeisungsstrategie. Bundestagsfraktion Bündnis 90 / Die GrünenU.S. Congress (2005) Energy Policy Act of 2005.UBA (2006) Informationspapier: Zur Sicherheit von Biogasanlagen.Urban, W. (2010) Gasnetze der Zukunft. Studie zu den Auswirkungen der Biogaseinspeisungin das Erdgasnetz auf den Netzbetrieb und Endverbraucher.Urban, W., Lohmann, H., Girod, K. (2009) Technologien und Kosten der Biogasaufbereitungund Einspeisung in das Erdgasnetz. Ergebnisse der Markterhebung 2007-2008.BMBF-Verbundprojekt Beseit. Tech. Rechtl. Ökon. Hemmnisse Bei Einspeisung Biog.Gase Erdgasnetz Zur Reduzierung Klimarelevanter Emiss. Durch Aufbau Anwend.Einer Georeferenzierten Datenbank – Strateg. Zur Polit. Techno-Ökon. Umsetzung 5:Vinnerås B, Schönning C, Nordin A (2006) Identification of the microbiological community inbiogas systems and evaluation of microbial risks from gas usage. Sci Total Environ367:605–615. doi: 10.1016/j.scitotenv.2006.02.008Vlap, Harm; de Haan, Ria Bos (2013) Greensafe - Risico-inventarisatie van microbiologischecomponenten in groengas. KEMA Rapport GCS.13.R.23728-A. August 2013,Groningen.Wellinger, A., Murphy, J., Baxter, D. (2013) The biogas Handbook – Science, production andapplications. IEA Bioenergy. Woodhead Publishing. ISBN 9780857094988.61
APPENDIXDetailed questionnaire resultsNathalie DevriendtA 1 Policy for <strong>biomethane</strong>A 1.1 AustriaThe respondents were asked if there is a policy in place in their country. For Austria 63%answered positive, 37% answered negative. The Austrian respondents indicate that financialsupport for electricity and heat is the focus at the moment, but with the comment that thesupport is mostly for electricity and not for heat. Also financial support for injection is given.It is important to see in the figure below that also some respondents feel that there is aframework but no financial support in place.This last indication relates also to the fact that the Austrian respondents feel that thecurrent policies do not stimulate the market (83%), only 17% thinks there is enough policy tosupport the market.45%40%35%30%25%20%15%10%5%0%Current policyAdditional policy requestedFigure A-1. Current and additional policy requested for <strong>biomethane</strong> following AustrianrespondentsSuggestions for additional policy measures are also given in Figure A-1. Important to noticeis that almost 30% of the respondents feel that there is greater need for a framework for<strong>biomethane</strong>, this can be seen as the starting point for a <strong>biomethane</strong> policy framework, notsufficiently present in Austria.62
Additional support is also asked for the use as transport fuel and for injection. Othersuggestions for policies are to go for a national obligation in fuel sources e.g. natural gas.Political barriers perceived by the Austrian respondents can be seen in the following figure.All 3 barriers given by the survey for all countries are agreed on by the Austrian respondents:• Too many barriers in regulatory approval• Need for more political support for developing the market• Uncertainties of <strong>biomethane</strong> within the national policy framework.The need for more political support received the highest score.60%50%40%30%20%10%0%Figure A-2. Possible policy barriers following the Austrian respondents.A 1.2 BelgiumToo many barriers inregulatory approvalStrongly agreeNeither agree nor disagreeI can not judgePolitical support necessary fordeveloping the marketAgreeDisagreeUncertainties of <strong>biomethane</strong>within the national policyframework61% of the Belgian respondents answered that there is no policy in place, 39% say that thereis a policy in place. The reason for the different views expressed could be the fact thatpolicies differ according to the region. All respondents agree on the fact that the policy inplace does not stimulate the market.The policy in place in Belgian comprises a framework for <strong>biomethane</strong>, support for electricityand heat and for injection.As seen for Austria, Belgian respondents still feel that many barriers exist in regulatoryapproval, that (more) political support is necessary to stimulate the market and that thereare still many uncertainties in the current framework.Additional policy requested by the Belgian respondents is first of all support for injection,followed by support for upgrading and support for transport and for facilities. Here again, itis clearly evident that Belgian respondents are asking for a better framework for <strong>biomethane</strong>.63
70%60%50%40%30%20%10%0%Current policy focusAdditional policy requestedFigure A-3. Current focus <strong>biomethane</strong> policy following Belgian respondents70%60%50%40%30%20%10%0%Figure A-4. Possible policy barriers following Belgian respondentsA 1.3 GermanyToo many barriers inregulatory approvalStrongly agreeNeither agree nor disagreeI can not judgePolitical support necessary fordeveloping the marketAgreeDisagreeUncertainties of <strong>biomethane</strong>within the national policyframeworkFor Germany the respondents give a clear view on their policy <strong>status</strong>: all respondents agreethat there is at the moment a policy in place in Germany and 90% agrees that this issufficient to stimulate the market. Their current focus for <strong>biomethane</strong> is on the electricityand heat markets.64
80%70%60%50%40%30%20%10%0%Current policyAdditional policy requestedFigure A-5. Biomethane policy following German respondents70%60%50%40%30%20%10%0%Too many barriers inregulatory approvalStrongly agreeNeither agree nor disagreeI can not judgePolitical support necessary fordeveloping the marketAgreeDisagreeUncertainties of <strong>biomethane</strong>within the national policyframeworkFigure A-6. Possible policy barriers following German respondents65
The German respondents also stress that political support is a key factor for stimulating a<strong>biomethane</strong> market. A more scattered response is given to the question if there are still toomany regulatory barriers and to the question if there are still uncertainties in the policyframework, see Figure A-6. Possible policy barriers following German respondentsIn spite of a mature policy for <strong>biomethane</strong>, there is still a request for additional policy inGermany. 30% of the respondents would like to see some support for the use of <strong>biomethane</strong>for transport. Also the political framework can still be improved, combined with thecomments that are given in the survey this could be related to long term stability that isasked for in a sustainable way. One suggestion also takes <strong>biomethane</strong> a step beyond theenergy market and it is suggested to give support for the chemical industry for using<strong>biomethane</strong>.A 1.4 The Netherlands69% of the Dutch respondents state that there is a <strong>biomethane</strong> policy in place, 31 % do notagree with that. Of the 69%, 61% think this policy stimulates the <strong>biomethane</strong> market.The focus of the current Dutch <strong>biomethane</strong> policy is on the injection of the <strong>biomethane</strong> andthe financial support for heat and electricity. According to the other respondents there is nospecific <strong>biomethane</strong> policy in place, but the <strong>biomethane</strong> is embedded in the generalrenewable energy policy.50%45%40%35%30%25%20%15%10%5%0%Current policy focusAdditional policy requestedFigure A-7. Biomethane policy following the Dutch respondentsWhen asked to identify policy barriers, a mixed view is given by the stakeholders. Followingthe answers, regulatory barriers are not a main problem in the Netherlands. Political supportis necessary for the majority but there is some disagreement with that statement. Also,uncertainties within the national policy framework are for some still a barrier but not for all.66
70%60%50%40%30%20%10%0%Too many barriers inregulatory approvalPolitical support necessary fordeveloping the marketUncertainties of <strong>biomethane</strong>within the national policyframeworkAgreeNeither agree nor disagreeDisagreeI can not judgeFigure A-8. Possible policy barriers following the Dutch respondentsWhen asked for additional policy in the Netherlands, the following suggestion was made:financial support for the facilities itself. Other needs proposed by the respondents are asfollows:- Conflicting rules and regulations e.g. government permit policies, hamper thedevelopment of <strong>biomethane</strong>, solutions are needed.- Smart combination of the suggested policies- Stable political framework- Financial hedging to stimulate financing by banksA 1.5 Sweden64% Of the Swedish respondents answers that there is a <strong>biomethane</strong> policy in place but only56% of them think this is sufficient to stimulate the <strong>biomethane</strong> market.The current focus of the <strong>biomethane</strong> policy in Sweden is on financial support for transportuse. The financial support is not in the format of a subsidy, but given as a tax exemption.Other policy in place related to <strong>biomethane</strong> is financial support for farm scale installations,on waste treatment and on substrate production.Also for the Swedish market it is clear that political support is necessary for developing the<strong>biomethane</strong> market. For most of the respondents uncertainties in the framework act still asa barrier. On barriers of derived from regulatory approval, more respondents agree thandisagree.Additional policy is requested by the respondents for financing the facilities, followed byfinancial support for transport. This is a bit surprising because the current focus is already ontransport.67
70%60%50%40%30%20%10%0%Current focus policyAdditional policy requestedFigure A-9. Biomethane policy following Swedish respondents50%45%40%35%30%25%20%15%10%5%0%Too many barriers inregulatory approvalStrongly agreeNeither agree nor disagreeI can not judgePolitical support necessary fordeveloping the marketAgreeDisagreeUncertainties of <strong>biomethane</strong>within the national policyframeworkFigure A-10. Possible policy barriers following Swedish respondents68
A 2 Stakeholder expectations for <strong>biomethane</strong> marketsA 2.1 AustriaFor Austria all respondents agreed that a premature market is established in their country.When asked about progress of the market 30% expressed the opinion that the market willgrow in the future, 60% expects a stabilisation of the market and 10% expects a decrease ofthe market. The most used argument that could influence the market in either direction isthe political will/policy in Austria. According to respondents the current incentive given bythe government is not enough to push the <strong>biomethane</strong> market into the direction of, forexample, transport.The respondents were asked to give the main drivers for <strong>biomethane</strong>, multiple answerswere possible. In Figure A-11 it can be seen that the main driver for <strong>biomethane</strong> is the widerange of possible end-uses (60%), followed by the fact that <strong>biomethane</strong> is ideal for injectionto the gas grid. Other drivers pointed out by some respondents include the fact that greenelectricity tariffs may be exhausted for biogas installations and they might be encouraged toswitch to subsidised <strong>biomethane</strong> production. Another driver given was that <strong>biomethane</strong>stimulates the utilisation of residues.70%60%50%40%30%20%10%0%Ideal astransport fuelIdeal as a‘renewablealternative’ tonatural gasIdeal forinjection intothe gridIdeal becauseof the widerange ofpossible enduseIdeal becausethere is asupport systemin placeOtherFigure A-11. Drivers <strong>biomethane</strong> following Austrian respondentsAccording to Austrian respondents high investment costs and increasing feedstock prices arethe main economic barriers. The statement that <strong>biomethane</strong> projects have low profitabilityprompted diverse opinions. The fact that CNG-CHP’s are more profitable than <strong>biomethane</strong>received a neutral reaction.For the operational barriers a mixed impression is given by the Austrian stakeholders. On thefact that uncertain feedstock availability is a barrier, more people (strongly) agree (60%) but30% also do not agree that this as a barrier. The planning process is for some people still abarrier but not for the majority. Similar impressions are formed for uncertainties inefficiencies and availabilities for the operating plant and for possible problems withfermentation residues.69
70%60%50%40%30%20%10%0%High investments for<strong>biomethane</strong> plants area relevant barrierStrongly agreeIncreasing feedstockcosts pose a risk toeconomic viabilityAgreeBiomethane projectshave a low profitabilityCNG-CHPs are moreviable than<strong>biomethane</strong> CHPsNeither agree nor disagreeDisagreeI can not judgeFigure A-12. Possible economic barriers following Austrian respondents60%50%40%30%20%10%0%UncertainfeedstockavailabilityStrongly agreeNeither agree nor disagreeI can not judgeUncertainties inthe planningprocessAgreeDisagreeLow availabilityof trained andexperiencedpersonelUncertainefficiency andavailability of theoperating plantFigure A-13. Possible operational barriers following Austria respondentsProblems(technical,regulatory,economic) withfermentationresidues70
80%70%60%50%40%30%20%10%0%Strongly agreeAgreeNeither agree nordisagreeDisagreeFigure A-14. Possible social and environmental barriers following Austrian respondentsThe statement concerning the stakeholders, tells us that a lack of information is seen as abarrier. Regarding the public opinion, prejudgement against <strong>biomethane</strong> is apparentfollowing some respondents but most do not agree or have no strong opinion. Acceptanceof building the installations is by most respondents not considered a barrier, although 20%do see it as a strong barrier and 10% agree on this statement. There is more agreement onthe fact that <strong>biomethane</strong> is also suffering from public scepticism concerning the use ofrenewables in general. The fear of intensification of agriculture is a huge concern followingthe Austrian respondents (70% agrees). Enough scientific evidence and practical experienceis available according to respondents. Most respondents disagreed or were neutralconcerning possible unclear environmental impacts.A 2.2 BelgiumIn Belgium 69% of the respondents believe that a growing <strong>biomethane</strong> market will beestablished. 89% of the respondents say that there is no <strong>biomethane</strong> market in Belgium atthe moment. Surprisingly 31% of the respondents answered that the market will stay at his71
current level, meaning no <strong>biomethane</strong> market will be developed. 11% says that there is apremature market in Belgium.60%50%40%30%20%10%0%Ideal astransport fuelIdeal as a‘renewablealternative’ tonatural gasIdeal forinjection intothe gridIdeal becauseof the widerange ofpossible enduseIdeal becausethere is asupport systemin placeOtherFigure A-15. Drivers <strong>biomethane</strong> following Belgian respondentsThe Belgian respondents see <strong>biomethane</strong> mostly as a renewable alternative to natural gasand ideal for injection into the gas grid, followed by the driver that <strong>biomethane</strong> is idealbecause the wide range of possible end-uses. Biomethane as transport fuel is perceived as adriver but only by 20% of respondents.60%50%40%30%Strongly agree20%Agree10%Neither agree nor disagreeDisagree0%Highinvestmentsfor<strong>biomethane</strong>plants are arelevantbarrierIncreasingfeedstockcosts pose arisk toeconomicviabilityBiomethaneprojects havea lowprofitabilityCNG-CHPs aremore viablethan<strong>biomethane</strong>CHPsI can not judgeFigure A-16. Possible economic barriers following Belgian respondentsThere is strong agreement from the Belgian respondents that the high investment cost,increasing feedstock price and low profitability are important economic barriers in the72
country. A scattered response was received on the statement that CNG-CHP’s are moreviable than <strong>biomethane</strong> CHPs.60%50%40%30%20%10%0%Strongly agreeAgreeNeither agree nor disagreeDisagreeI can not judgeFigure A-17. Possible operational barriers following the Belgian respondentsFor the operational barriers more scattered answers are given by the Belgian respondents.Most agree or are neutral on the statement that feedstock availability is an issue. Regardingthe planning process some see it as a barrier, others disagree with this statement. Theavailability of trained and experienced personnel is not perceived as a barrier by mostrespondents. Also the efficiency and the availability of the operating plant are not perceivedas barriers. Problems with fermentation residues on the other hand could be a barrier.73
80%70%60%50%40%30%20%10%0%Strongly agreeAgreeNeither agree nordisagreeDisagreeFigure A-18. Possible social and environmental barriers following Belgian respondentsThe results for the social and environmental barriers tells us that informing the public is notyet done and is necessary, this is reflected in the high agreement on the statement thatthere is lack of knowledge and information for stakeholders and that there is a lowacceptance by residents for building production installations. The fact that renewable energyis suffering from public scepticism received a mixed response. In Belgium there is no big fearof the intensification of agriculture in comparison with Austria. The scientific evidence andpractical experience is not perceived as a big barrier. Strong disagreement was expressed forthe statement that the environmental effects are unclear for <strong>biomethane</strong>.A 2.3 Germany80% of the German respondents perceive <strong>biomethane</strong> production as mature, 20% aspremature. In relation to that, 45% of the German respondents think that the <strong>biomethane</strong>market will grow in the future. 55% expects stabilisation of the market.74
70%60%50%40%30%20%10%0%Ideal astransport fuelIdeal as a‘renewablealternative’ tonatural gasIdeal forinjection intothe gridIdeal becauseof the widerange ofpossible enduseIdeal becausethere is asupport systemin placeOtherFigure A-19. Driver for <strong>biomethane</strong> following German respondentsBiomethane receives the highest score for the driver that <strong>biomethane</strong> is ideal for injectionon the grid, followed by the driver that it is ideal for a wide range of possible end-uses andthe fact that there is a support system in place. Transport fuel is perceived a driver butreceived the lowest score.60%50%40%30%Strongly agree20%Agree10%Neither agree nor disagreeDisagree0%Highinvestmentsfor<strong>biomethane</strong>plants are arelevantbarrierIncreasingfeedstockcosts pose arisk toeconomicviabilityBiomethaneprojects havea lowprofitabilityCNG-CHPs aremore viablethan<strong>biomethane</strong>CHPsI can not judgeFigure A-20. Possible economic barriers following German respondentsHigh feedstock price is an economic barrier that also for Germany is perceived as a barrier,as for Austria and Belgium. The high investment cost received mixed opinions, from stronglyagree to disagree. The statement concerning low profitability also received a mixed response.This was also the case for the comparison with CNG-CHPs. A possible reason for this75
scattered view is that in Germany support mechanisms are in place which influences theeconomic situation of <strong>biomethane</strong> installations.80%70%60%50%40%30%20%10%0%Strongly agreeAgreeNeither agree nor disagreeDisagreeI can not judgeFigure A-21. Possible operational barriers following German respondentsRegarding the results of the operational barriers, it is evident that for the Germanrespondents there is no issue concerning trained and experienced personnel, on efficiencyand availability of the plants and on possible problems with residues. Uncertainties in theplanning process is for some still an issue, but most disagree. As could be expected from theeconomic barriers, the feedstock availability is a big issue.76
70%60%50%40%30%20%10%0%Strongly agreeAgreeNeither agree nordisagreeDisagreeFigure A-22. Possible social and environmental barriers following German respondentsEven in a market that is perceived as mature, lack of information is still an important barrieraccording to the German respondents. Also the public scepticism is perceived as a barrier. Asin Austria there is also a significant of the consequences of intensification of agriculture.Practical experience is on the other hand not an issue. No clear opinion is expressed on theunclear environmental effects of <strong>biomethane</strong>.A 2.4 The Netherlands62% of the Dutch respondents state that there <strong>biomethane</strong> market is mature, 38% state thatit is still premature. 58% of the Dutch respondents expect market growth for <strong>biomethane</strong>, 42%considers the market is in a stabilising phase. These results are more or less in line with onefrom Germany.77
90%80%70%60%50%40%30%20%10%0%Ideal astransport fuelIdeal as a‘renewablealternative’ tonatural gasIdeal forinjection intothe gridIdeal becauseof the widerange ofpossible enduseIdeal becausethere is asupport systemin placeOtherFigure A-23. Drivers <strong>biomethane</strong> following Dutch respondentsThe main driver for <strong>biomethane</strong> in the Netherlands is the fact that it is renewable alternativeto natural gas, followed by the driver that it is ideal as transport fuel and ideal for injectioninto the grid. Compared with Austria, Belgium and Germany, the Netherlands considerstransport as a prominent driver for <strong>biomethane</strong> market growth.70%60%50%40%30%20%10%0%High investments for<strong>biomethane</strong> plants area relevant barrierIncreasing feedstockcosts pose a risk toeconomic viabilityBiomethane projectshave a low profitabilityCNG-CHPs are moreviable than<strong>biomethane</strong> CHPsStrongly agreeNeither agree nor disagreeI can not judgeAgreeDisagreeFigure A-24. Possible economic barriers following Dutch respondentsIn line with the results from Belgium, the high investment costs and the feedstock price arethe main economic barriers following the Dutch respondents. The low profitability is not anissue for every respondent. The statement that CNG-CHPs are more viable than <strong>biomethane</strong>CHPs is not agreed on by the respondents.78
50%45%40%35%30%25%20%15%10%5%0%Strongly agreeAgreeNeither agree nor disagreeDisagreeI can not judgeFigure A-25. Possible operational barriers following Dutch respondents.As seen for the other countries, the feedstock availability is an important barrier.Uncertainties in the planning process received a split response from the Dutch respondents.Skilled personnel and availability of the installation are not perceived as important barriers.Problems with fermentation residues on the other hand is a barrier according to therespondents.79
70%60%50%40%30%20%10%0%Strongly agreeAgreeNeither agree nordisagreeDisagreeFigure A-26. Possible social and environmental barriers following Dutch respondentsLack of information for the stakeholders and low acceptance of the residents is perceived asa barrier. The fear for intensification of agriculture is present but not so explicitly evident asin Germany and Austria. Scientific evidence and practical experience and unclear effects of<strong>biomethane</strong> are not perceived as barriers in the Netherlands.A 2.5 Sweden60% of the Swedish respondents state that the market is mature, 40% consider it premature.In relation to the high level of maturity, the respondents have a strong belief that the<strong>biomethane</strong> market will grow further in the future (83%) and only 13% thinks the market willstabilise.80
80%70%60%50%40%30%20%10%0%Ideal astransport fuelIdeal as a‘renewablealternative’ tonatural gasIdeal forinjection intothe gridIdeal becauseof the widerange ofpossible enduseIdeal becausethere is asupport systemin placeOtherFigure A-27. Driver <strong>biomethane</strong> following Swedish respondentsThe main driver in Sweden is that <strong>biomethane</strong> is ideal as transport fuel (70%), the seconddriver is that it is an alternative to natural gas. This differs significantly from the driversperceived in the other countries (Austria, Belgium, Germany, the Netherlands). A possiblereason is the more limited use of natural gas and the smaller gas grid present in Sweden.50%45%40%35%30%25%20%15%10%5%0%High investments for<strong>biomethane</strong> plants area relevant barrierStrongly agreeNeither agree nor disagreeI can not judgeIncreasing feedstockcosts pose a risk toeconomic viabilityAgreeDisagreeBiomethane projectshave a low profitabilityCNG-CHPs are moreviable than<strong>biomethane</strong> CHPsFigure A-28. Possible economic barriers following Swedish respondentsHigh investment cost, increasing feedstock price and low profitability are also economicbarriers according to Swedish respondents.81
60%50%40%30%20%10%0%Strongly agreeAgreeNeither agree nor disagreeDisagreeI can not judgeFigure A-29. Possible operational barriers following Swedish respondentsThe general trend of the other countries can also be found for Sweden. The feedstockavailability is a problem. The planning process is perceived as a barrier and problems withfermentation residues. On the availability of experienced personnel and the availability ofthe plant a mixed response was given.82
90%80%70%60%50%40%30%20%10%0%Strongly agreeAgreeNeither agree nordisagreeDisagreeFigure A-30. Possible social and environmental barriers following Swedish respondentsFor the societal and environmental possible barriers, most respondents disagreed with thestatements, so no big barriers are perceived. In line with the results of the other Europeancountries, there is still a need for information and also the acceptance of buildinginstallations suffers from the public opinion.A 3 Possibilities for transnational bio-methane tradeIf an international market will eventually emerge the majority of the respondents see it as anopportunity to create new markets, not as a threat creating additional risks.A 3.1 AustriaThe Austrian respondents consider it as unlikely (almost 50%) that international trade of<strong>biomethane</strong> will be achieved. Arguments for agreement and disagreement on this statementare the following:+ EU harmonisation can enable trade83
+ gas grids without renewable <strong>biomethane</strong> will lose market share for countriesstriving for 100% renewable energy.0 <strong>biomethane</strong> trade will depend on the type and size of players0 <strong>biomethane</strong> trade will depend on national legislation0 <strong>biomethane</strong> trade will change nothing in the current market- Biomethane trade will be technically possible, and the amounts of <strong>biomethane</strong> arenot enough for exporting- Biomethane is too expensive in comparison to the direct use of biogasIn case of international trade it could open new markets is the opinion of 70% of therespondents.60%50%40%30%20%10%0%Very likely Likely Unlikely Very unlikely Hard to sayFigure A-31. Expectations international trade <strong>biomethane</strong> following Austrian respondents60%50%40%30%20%Strongly agreeAgreeNeither agree nor disagreeDisagreeI can not judge10%0%High invests for certificationprocessTrade of <strong>biomethane</strong>currently hardly possibleFigure A-32. Possible trade barriers following Austrian respondents84
The certification process is not perceived as a trade barrier. The fact that trade it notpossible at the moment is also not perceived as a barrier for developing a market for<strong>biomethane</strong>.A 3.2 BelgiumBelgian respondents believe more than Austrian respondents in the international trade of<strong>biomethane</strong> (40%). Belgian respondents believe/hope that it will open new markets. Onecritical remark of a respondent is that when international trade happens attention should bepaid to subsidy migration, in the worst case leading to fraud.50%45%40%35%30%25%20%15%10%5%0%Very likely Likely Unlikely Very unlikely Hard to sayFigure A-33. Expectations international trade <strong>biomethane</strong> following Belgian respondents45%40%35%30%25%20%15%10%Strongly agreeAgreeNeither agree nor disagreeDisagreeI can not judge5%0%High invests for certificationprocessTrade of <strong>biomethane</strong>currently hardly possibleFigure A-34. Possible trade barriers following Belgian respondents85
Certification cost could be an extra barrier for trade. The fact that trade of <strong>biomethane</strong> iscurrently not in place is not helping the internal <strong>biomethane</strong> market in Belgium moveforward. This can be related to the fact that international trade for a country like Belgiumwithout a fully developed policy and market, could look for opportunities (and willingness topay) in other European countries.A 3.3 Germany40% of the German respondents believe that international trade of <strong>biomethane</strong> will bepossible. The major expectation is that it will open new markets. A critical respondent seesinternational trade as an additional risk.50%45%40%35%30%25%20%15%10%5%0%Very likely Likely Unlikely Very unlikely Hard to sayFigure A-35. Expectations international trade <strong>biomethane</strong> following German respondentsThe additional cost for a certification process is according to most respondents notperceived as a trade barrier. The fact that currently trade is not possible is for 40% of therespondents a barrier, for almost 25% it is not.86
45%40%35%30%25%20%15%10%Strongly agreeAgreeNeither agree nor disagreeDisagreeI can not judge5%0%High invests for certificationprocessTrade of <strong>biomethane</strong>currently hardly possibleFigure A-36. Possible trade barriers following German respondentsA 3.4 The Netherlands45% of the Dutch respondents believe in international trade, 30% think it is unlikely that itwill break through. Arguments for and against international trade are given below:+ it will open new markets+ international trade of natural gas is already happening, the international trade of<strong>biomethane</strong> would be a logical next step and become a commodity as well.+ international trade of <strong>biomethane</strong> could create a level playing field- When international trade will happen, attention should be paid tosubsidy migration. Biomethane trade is attracted by generous subsidyschemes.- The demand is higher than the production at national level sointernational trade might not happen.87
35%30%25%20%15%10%5%0%Very likely Likely Unlikely Very unlikely Hard to sayFigure A-37. Expectations international trade following Dutch respondents70%60%50%40%30%20%Strongly agreeAgreeNeither agree nor disagreeDisagreeI can not judge10%0%High invests for certificationprocessTrade of <strong>biomethane</strong>currently hardly possibleFigure A-38. Possible trade barriers following Dutch respondentsThe cost of the certification process is not perceived as a possible trade barrier. Onecomment submitted suggests that the system should be organised in a better way than forgreen electricity.The fact that international trade of <strong>biomethane</strong> is not happening at the moment is notperceived as a barrier for the development of the national <strong>biomethane</strong> market.A 3.5 SwedenThe expectations of the Swedish respondents (60%) is that international trade of<strong>biomethane</strong> could be possible, some disagree with that statement (12%). Positive andnegative arguments for international trade are given here:88
+ It will create new markets: especially new suppliers could be attracted. Although acritical remark was made that in the first place it will create new opportunities forexisting suppliers and only afterward for new ones. This is related to the fact thataccording to respondents the demand for <strong>biomethane</strong> is higher than the production.+ If the LBG (liquefied <strong>biomethane</strong>) market would be established in EU than thiswould enhance the international trade of <strong>biomethane</strong>.0 The possibility of international trade will depend on the (inter)national policyinstruments.60%50%40%30%20%10%0%Very likely Likely Unlikely Very unlikely Hard to sayFigure A-39. Expectations international trade <strong>biomethane</strong> following Swedish respondents.A number of the Swedish respondents (17%) see the certification process as a possible tradebarrier, 19% disagree with this and 24% is neutral.The fact that currently no international <strong>biomethane</strong> trade possible is not perceived as abarrier for the national <strong>biomethane</strong> market.35%30%25%20%15%10%5%Strongly agreeAgreeNeither agree nor disagreeDisagreeI can not judge0%High invests for certificationprocessTrade of <strong>biomethane</strong>currently hardly possibleFigure A-40. Possible trade barriers following Swedish respondents.89
AuthorsDaniela ThränUFZ & DBFZ, GermanyEric BilligJaqueline Daniel-GromkeJens PonitkaMichael SeiffertDBFZ, Germanywww.dbfz.deTobias PerssonMattias Svenssonwww.sgc.seJohn BaldwinCNG Serviceswww.cngservices.co.ukLukas KranzlFabian SchipferJulian MatzenbergerTU Wienwww.tuwien.ac.atNathalie DevriendtVITOwww.vito.beMathieu DumontRVOwww.rvo.nlJonas DahlDTIwww.dti.dkGünther BochmannUniversity of Natural Resources andApplied Life Sciences Vienna (BOKU)www.boku.ac.at90
ISBN 978-1-910154-10-692