no. 140 - Banka Qendrore e Republikës së Kosovës
no. 140 - Banka Qendrore e Republikës së Kosovës no. 140 - Banka Qendrore e Republikës së Kosovës
Monthly Statistics BulletinApril 2013Table 14.2. ODC effective interest rate - loan interest rates(New contracts, unless otherwise indicated)DescriptionLoanratesNon financial corporationsInvestment business loansUp to 1yearOver 1year upto 5 yearsOver 5yearsOther business loans(non-investing)Up to 1yearOver 1year upto 5 yearsOverdraf t sCreditlinesLoans withfavourableconditionsLoans Othercovered loansbydepositsHouseholdsConsumer loans2005 December 14.47 17.34 13.29 13.29 15.18 14.38 15.11 11.51 … * * … * 11.51 * * *2006 December 14.70 * 14.50 14.50 13.60 15.18 15.72 12.36 … * * … * 12.36 * 13.36 *2007 December 14.06 * 13.76 13.76 * 14.64 15.09 13.72 … * * … * 13.72 12.92 12.36 *2008 December 13.79 * 13.92 13.92 14.20 13.45 15.03 13.50 … * 19.48 … … 13.50 9.81 10.82 8.132009 December 14.09 * 14.34 14.34 * * * … * 17.83 … … 13.31 * 10.67 *2010 December 14.31 16.13 13.95 * 18.66 14.44 12.65 13.27 7.69 * 22.57 6.55 8.56 14.56 * 11.67 10.26M ar ch 14 .19 18 .2 3 13 .8 1 12 .4 9 18 .4 9 14 .9 3 11.8 8 13 .13 7.0 2 9 .0 9 2 0 .2 7 5.3 1 8 .3 6 13 .76 * 12 .2 2 9 .8 3April 14.38 * 15.23 11.59 17.65 15.47 12.69 11.98 6.50 4.43 21.24 5.68 8.06 13.51 * 11.59 10.51M ay 13 .2 5 17.2 8 13 .9 8 12 .0 0 17.72 15.4 0 12 .70 13 .3 2 6 .6 6 6 .56 2 1.2 3 7.2 3 8 .79 11.4 7 * 11.8 5 11.52June 14.13 18.69 13.83 12.56 19.02 15.42 11.85 12.77 3.64 7.06 19.03 6.25 8.16 13.91 * 11.88 11.00July 14.28 17.58 14.16 * 16.92 15.54 12.43 12.69 5.83 8.72 18.42 5.39 8.55 14.04 * 11.95 11.00A ug ust 14 .0 2 15.11 13 .78 13 .0 2 18 .72 14 .8 3 12 .2 6 14 .16 5.8 7 8 .73 17.8 8 6 .2 6 8 .4 1 13 .73 * 11.9 7 10 .10September 14.22 12.87 14.67 11.07 21.57 15.08 11.74 13.37 7.50 8.39 17.28 7.25 8.36 13.66 * 11.88 9.45Oct o b er 13 .9 3 14 .2 4 13 .53 * 16 .76 14 .6 4 11.9 2 13 .3 9 5.4 9 10 .0 5 17.3 5 6 .8 7 8 .9 0 13 .71 15.72 11.75 11.58No vemb er 13 .6 2 14 .4 7 13 .0 2 13 .53 15.0 6 14 .19 11.4 6 13 .9 2 6 .4 3 10 .2 0 14 .2 0 7.2 8 9 .0 8 13 .9 7 * 11.4 8 10 .9 42 0 11 Decemb er 13 .6 9 15.8 9 13 .55 11.6 8 16 .4 0 13 .8 0 11.78 12 .12 6 .10 9 .8 8 16 .4 4 6 .0 1 8 .58 14 .0 2 14 .3 1 11.9 9 10 .8 3January 14.53 17.85 14.01 * 17.96 15.56 12.25 13.69 6.16 8.80 18.31 6.99 9.22 14.25 12.38 11.34 9.62February 13.33 15.84 12.68 10.90 16.83 14.23 10.90 12.96 6.33 * 16.79 6.81 8.47 13.83 9.73 11.71 10.39M ar ch 13 .8 1 14 .2 5 13 .4 6 12 .8 0 17.6 5 14 .8 6 11.19 11.70 7.2 9 * 16 .8 3 6 .3 3 8 .18 13 .4 1 * 11.8 9 10 .4 0A p r il 13 .4 5 15.73 13 .4 8 10 .13 18 .2 1 14 .59 10 .8 1 11.9 4 6 .56 * 16 .6 2 7.11 8 .3 1 13 .10 * 11.15 11.11M ay 13 .4 0 14 .13 13 .0 3 10 .8 0 15.6 5 15.52 11.2 0 12 .0 7 5.3 7 * 16 .8 0 7.0 1 8 .3 6 13 .15 * 11.3 3 10 .12June 13.50 15.51 13.05 10.94 19.83 14.16 10.72 10.92 7.21 9.61 16.23 7.05 8.08 13.47 7.72 11.67 10.50July 13 .0 6 8 .6 8 12 .2 2 11.9 0 14 .54 14 .9 7 11.18 11.9 4 7.6 8 * 16 .50 6 .2 6 8 .74 13 .54 14 .16 11.4 8 10 .3 0A ug ust 13 .3 8 15.9 2 12 .4 3 * 16 .3 4 14 .78 10 .75 11.72 6 .78 * 15.9 6 6 .74 7.9 5 13 .72 * 11.4 5 10 .0 9September 13.80 16.53 13.51 * 14.51 15.76 10.82 11.44 6.35 9.90 16.54 7.17 6.80 13.44 12.12 11.61 9.69Oct o b er 13 .18 14 .2 1 12 .9 4 10 .79 14 .75 13 .9 6 11.2 0 13 .76 6 .6 3 9 .9 6 16 .12 6 .58 6 .75 13 .3 0 * 11.4 3 10 .3 4November 12.72 14.64 12.16 9.67 14.05 14.40 10.43 10.83 7.06 * 16.08 7.21 8.16 13.30 * 10.39 8.972012 December 12.86 15.37 12.03 10.19 15.29 13.66 10.70 11.90 5.92 * 12.46 6.11 7.97 13.06 * 10.78 9.79Januar y 13 .57 12 .70 13 .72 * 15.52 15.3 8 10 .73 12 .6 4 5.6 0 * 16 .3 9 6 .4 6 4 .78 12 .6 3 11.9 5 11.2 2 10 .2 9February 13.49 14.10 14.05 * 16.71 14.15 * 11.56 * * 14.98 6.48 6.71 12.81 * 11.02 9.83March 12.63 15.24 12.30 11.00 15.95 13.79 * 12.85 7.31 9.94 15.84 6.22 6.74 12.10 * 11.03 9.452013 April 12.59 12.86 12.45 10.48 16.10 14.12 * 13.37 6.98 10.35 16.91 6.58 5.75 12.03 13.43 11.34 9.73OverdraftsLoans withfavourableconditionsLoanscoveredbydepositsOtherloansUp to 5yearsMortgage loansOver 5years upto 10yearsOver 10years| 55
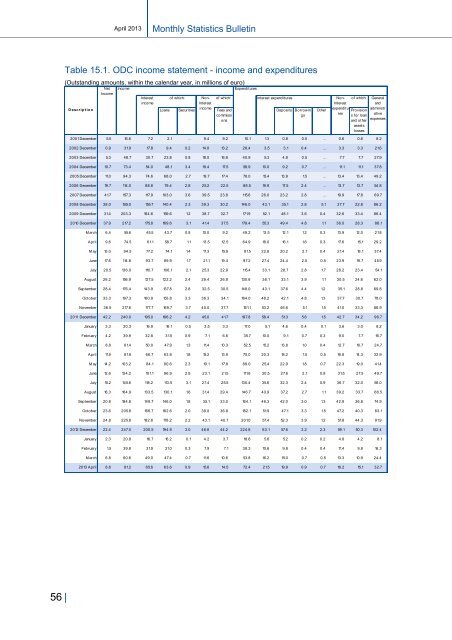
April 2013Monthly Statistics BulletinTable 15.1. ODC income statement - income and expenditures(Outstanding amounts, within the calendar year, in millions of euro)DescriptionNetIncomeIncomeInterestincomeof which: Non- of which:InterestLoans Securit iesincomeFees andcommissionsExpendituresInt erest expendit uresDeposits BorrowingsOtherNon-Interestexpendituresof which:Provisions for loanand ot herassetslossesGeneralandadminist rat iveexpenses2001 December 5.5 16.6 7.2 2.1 … 9.4 9.2 10.1 1.3 0.8 0.5 … 0.6 0.6 8.22002 December 0.9 31.9 17.8 9.4 0.2 14.0 13.2 28.4 3.5 3.1 0.4 … 3.3 3.3 21.62003 December 5.3 48.7 30.7 23.8 0.8 18.0 16.8 40.9 5.3 4.8 0.5 … 7.7 7.7 27.92004 December 10.7 73.4 54.0 48.1 3.4 19.4 17.5 58.9 10.0 9.2 0.7 … 11.1 11.1 37.82005 December 11.0 94.3 74.6 68.0 2.7 19.7 17.4 78.0 15.4 13.9 1.5 … 13.4 13.4 49.22006 December 19.7 114.0 88.8 79.4 2.8 25.2 22.5 88.5 19.9 17.5 2.4 … 13.7 13.7 54.82007 December 41.7 157.3 117.9 103.0 3.6 39.5 23.8 115.6 26.0 23.2 2.8 … 19.9 17.8 69.72008 December 38.0 195.0 155.7 140.4 2.3 39.3 30.2 146.0 43.1 35.1 2.8 5.1 27.7 22.8 86.22009 December 31.4 203.3 164.6 159.6 1.2 38.7 32.7 171.9 52.1 48.1 3.6 0.4 32.6 33.4 86.42010 December 37.9 217.2 175.8 169.6 3.1 41.4 37.5 179.4 55.3 49.4 4.8 1.1 36.0 28.3 88.1March 6.4 55.6 45.5 43.7 0.8 10.0 9.2 49.2 13.5 12.1 1.2 0.3 13.9 12.0 21.8April 9.6 74.5 61.1 58.7 1.1 13.5 12.5 64.9 18.0 16.1 1.6 0.3 17.6 15.1 29.2May 13.0 94.5 77.2 74.1 1.4 17.3 15.9 81.5 22.8 20.2 2.1 0.4 21.4 18.1 37.4June 17.6 114.8 93.7 89.9 1.7 21.1 19.4 97.2 27.4 24.4 2.5 0.5 23.9 19.7 45.9July 20.5 136.0 110.7 106.1 2.1 25.3 22.9 115.4 33.1 28.7 2.8 1.7 28.2 23.4 54.1August 26.2 156.9 127.5 122.2 2.4 29.4 26.8 130.6 38.1 33.1 3.9 1.1 30.5 24.6 62.0September 28.4 176.4 143.9 137.8 2.8 32.5 30.5 148.0 43.1 37.6 4.4 1.2 35.1 28.8 69.8October 33.3 197.3 160.9 153.8 3.3 36.3 34.1 164.0 48.2 42.1 4.8 1.3 37.7 30.7 78.0November 36.5 217.6 177.7 169.7 3.7 40.0 37.7 181.1 53.2 46.6 5.1 1.5 41.0 33.3 86.92011 December 42.2 240.0 195.0 186.2 4.2 45.0 41.7 197.8 58.4 51.3 5.6 1.5 42.7 34.2 96.7January 3.3 20.3 16.9 16.1 0.5 3.5 3.3 17.0 5.1 4.6 0.4 0.1 3.6 3.0 8.2February 4.2 39.9 32.8 31.5 0.9 7.1 6.6 35.7 10.0 9.1 0.7 0.3 9.0 7.7 16.7March 8.8 61.4 50.0 47.9 1.3 11.4 10.3 52.5 15.2 13.8 1.0 0.4 12.7 10.7 24.7April 11.9 81.9 66.7 63.9 1.8 15.2 13.9 70.0 20.3 18.2 1.5 0.5 16.8 14.3 32.9May 14.2 103.2 84.1 80.6 2.3 19.1 17.8 89.0 25.4 22.9 1.8 0.7 22.3 19.0 41.4June 12 .6 12 4 .2 10 1.1 9 6 .9 2 .8 2 3 .1 2 1.5 111.6 3 0 .5 2 7.6 2 .1 0 .8 3 1.5 2 7.5 4 9 .7July 15.2 145.6 118.2 113.5 3.1 27.4 25.5 130.4 35.6 32.3 2.4 0.9 36.7 32.0 58.0August 18.3 164.9 133.5 130.1 1.6 31.4 29.4 146.7 40.9 37.2 2.7 1.1 39.2 33.7 66.5September 20.8 184.8 149.7 146.0 1.8 35.1 33.0 164.1 46.3 42.0 3.0 1.3 42.9 36.8 74.9October 23.6 205.8 166.7 162.6 2.0 39.0 36.8 182.1 51.9 47.1 3.3 1.5 47.2 40.3 83.1November 24.8 225.8 182.8 178.2 2.2 43.1 40.7 201.0 57.4 52.3 3.9 1.2 51.8 44.3 91.92012 December 22.4 247.0 200.5 194.9 3.0 46.6 44.2 224.6 63.1 57.6 3.2 2.3 59.1 50.3 102.4January 2.3 20.8 16.7 16.2 0.1 4.2 3.7 18.6 5.6 5.2 0.2 0.2 4.8 4.2 8.1Feb r uar y 1.5 3 9 .8 3 1.9 3 1.0 0 .3 7.9 7.1 3 8 .3 10 .6 9 .8 0 .4 0 .4 11.4 9 .8 16 .3March 6.8 60.6 49.0 47.4 0.7 11.6 10.6 53.8 16.2 15.0 0.7 0.5 13.3 10.9 24.42013 April 8.8 81.2 65.6 63.6 0.9 15.6 14.5 72.4 21.5 19.9 0.9 0.7 18.2 15.1 32.756 |
- Page 6 and 7: Monthly Statistics BulletinApril 20
- Page 8 and 9: Monthly Statistics BulletinApril 20
- Page 10 and 11: Monthly Statistics BulletinApril 20
- Page 12 and 13: Monthly Statistics BulletinApril 20
- Page 14 and 15: Monthly Statistics BulletinApril 20
- Page 16 and 17: Monthly Statistics BulletinApril 20
- Page 18 and 19: Monthly Statistics BulletinApril 20
- Page 20 and 21: Monthly Statistics BulletinApril 20
- Page 22 and 23: Monthly Statistics Buulletin April
- Page 24 and 25: Monthly Statistics Buulletin April
- Page 26 and 27: Monthly Statistics BulletinApril 20
- Page 28 and 29: Monthly Statistics BulletinApril 20
- Page 30 and 31: Monthly Statistics BulletinApril 20
- Page 32 and 33: Monthly Statistics BulletinApril 20
- Page 34 and 35: Monthly Statistics BulletinApril 20
- Page 36 and 37: Monthly Statistics BulletinApril 20
- Page 38 and 39: Monthly Statistics BulletinApril 20
- Page 40 and 41: Monthly Statistics BulletinApril 20
- Page 42 and 43: Monthly Statistics BulletinApril 20
- Page 44 and 45: Monthly Statistics BulletinApril 20
- Page 46 and 47: Monthly Statistics BulletinApril 20
- Page 48 and 49: Monthly Statistics BulletinApril 20
- Page 50 and 51: Monthly Statistics BulletinApril 20
- Page 52 and 53: Monthly Statistics BulletinApril 20
- Page 54 and 55: Monthly Statistics BulletinApril 20
- Page 58 and 59: Monthly Statistics BulletinApril 20
- Page 60 and 61: Monthly Statistics BulletinApril 20
- Page 62 and 63: Monthly Statistics BulletinApril 20
- Page 64 and 65: Monthly Statistics BulletinApril 20
- Page 66 and 67: Monthly Statistics BulletinApril 20
- Page 68 and 69: Monthly Statistics BulletinApril 20
- Page 70 and 71: Monthly Statistics BulletinApril 20
- Page 72 and 73: Monthly Statistics BulletinApril 20
- Page 74 and 75: Monthly Statistics BulletinApril 20
- Page 76 and 77: Monthly Statistics BulletinApril 20
- Page 78 and 79: Monthly Statistics BulletinApril 20
- Page 80 and 81: Monthly Statistics BulletinApril 20
- Page 82 and 83: Monthly Statistics BulletinApril 20
- Page 84 and 85: Monthly Statistics BulletinApril 20
- Page 86 and 87: Monthly Statistics BulletinApril 20
- Page 88 and 89: Monthly Statistics BulletinApril 20
- Page 90 and 91: Monthly Statistics BulletinApril 20
- Page 92 and 93: Monthly Statistics BulletinApril 20
- Page 94 and 95: Monthly Statistics BulletinApril 20
- Page 96 and 97: Monthly Statistics BulletinApril 20
- Page 98 and 99: Monthly Statistics BulletinApril 20
- Page 100 and 101: Monthly Statistics BulletinApril 20
- Page 102 and 103: Monthly Statistics BulletinApril 20
- Page 104 and 105: Monthly Statistics BulletinApril 20
April 2013Monthly Statistics BulletinTable 15.1. ODC income statement - income and expenditures(Outstanding amounts, within the calendar year, in millions of euro)DescriptionNetIncomeIncomeInterestincomeof which: Non- of which:InterestLoans Securit iesincomeFees andcommissionsExpendituresInt erest expendit uresDeposits BorrowingsOtherNon-Interestexpendituresof which:Provisions for loanand ot herassetslossesGeneralandadminist rat iveexpenses2001 December 5.5 16.6 7.2 2.1 … 9.4 9.2 10.1 1.3 0.8 0.5 … 0.6 0.6 8.22002 December 0.9 31.9 17.8 9.4 0.2 14.0 13.2 28.4 3.5 3.1 0.4 … 3.3 3.3 21.62003 December 5.3 48.7 30.7 23.8 0.8 18.0 16.8 40.9 5.3 4.8 0.5 … 7.7 7.7 27.92004 December 10.7 73.4 54.0 48.1 3.4 19.4 17.5 58.9 10.0 9.2 0.7 … 11.1 11.1 37.82005 December 11.0 94.3 74.6 68.0 2.7 19.7 17.4 78.0 15.4 13.9 1.5 … 13.4 13.4 49.22006 December 19.7 114.0 88.8 79.4 2.8 25.2 22.5 88.5 19.9 17.5 2.4 … 13.7 13.7 54.82007 December 41.7 157.3 117.9 103.0 3.6 39.5 23.8 115.6 26.0 23.2 2.8 … 19.9 17.8 69.72008 December 38.0 195.0 155.7 <strong>140</strong>.4 2.3 39.3 30.2 146.0 43.1 35.1 2.8 5.1 27.7 22.8 86.22009 December 31.4 203.3 164.6 159.6 1.2 38.7 32.7 171.9 52.1 48.1 3.6 0.4 32.6 33.4 86.42010 December 37.9 217.2 175.8 169.6 3.1 41.4 37.5 179.4 55.3 49.4 4.8 1.1 36.0 28.3 88.1March 6.4 55.6 45.5 43.7 0.8 10.0 9.2 49.2 13.5 12.1 1.2 0.3 13.9 12.0 21.8April 9.6 74.5 61.1 58.7 1.1 13.5 12.5 64.9 18.0 16.1 1.6 0.3 17.6 15.1 29.2May 13.0 94.5 77.2 74.1 1.4 17.3 15.9 81.5 22.8 20.2 2.1 0.4 21.4 18.1 37.4June 17.6 114.8 93.7 89.9 1.7 21.1 19.4 97.2 27.4 24.4 2.5 0.5 23.9 19.7 45.9July 20.5 136.0 110.7 106.1 2.1 25.3 22.9 115.4 33.1 28.7 2.8 1.7 28.2 23.4 54.1August 26.2 156.9 127.5 122.2 2.4 29.4 26.8 130.6 38.1 33.1 3.9 1.1 30.5 24.6 62.0September 28.4 176.4 143.9 137.8 2.8 32.5 30.5 148.0 43.1 37.6 4.4 1.2 35.1 28.8 69.8October 33.3 197.3 160.9 153.8 3.3 36.3 34.1 164.0 48.2 42.1 4.8 1.3 37.7 30.7 78.0November 36.5 217.6 177.7 169.7 3.7 40.0 37.7 181.1 53.2 46.6 5.1 1.5 41.0 33.3 86.92011 December 42.2 240.0 195.0 186.2 4.2 45.0 41.7 197.8 58.4 51.3 5.6 1.5 42.7 34.2 96.7January 3.3 20.3 16.9 16.1 0.5 3.5 3.3 17.0 5.1 4.6 0.4 0.1 3.6 3.0 8.2February 4.2 39.9 32.8 31.5 0.9 7.1 6.6 35.7 10.0 9.1 0.7 0.3 9.0 7.7 16.7March 8.8 61.4 50.0 47.9 1.3 11.4 10.3 52.5 15.2 13.8 1.0 0.4 12.7 10.7 24.7April 11.9 81.9 66.7 63.9 1.8 15.2 13.9 70.0 20.3 18.2 1.5 0.5 16.8 14.3 32.9May 14.2 103.2 84.1 80.6 2.3 19.1 17.8 89.0 25.4 22.9 1.8 0.7 22.3 19.0 41.4June 12 .6 12 4 .2 10 1.1 9 6 .9 2 .8 2 3 .1 2 1.5 111.6 3 0 .5 2 7.6 2 .1 0 .8 3 1.5 2 7.5 4 9 .7July 15.2 145.6 118.2 113.5 3.1 27.4 25.5 130.4 35.6 32.3 2.4 0.9 36.7 32.0 58.0August 18.3 164.9 133.5 130.1 1.6 31.4 29.4 146.7 40.9 37.2 2.7 1.1 39.2 33.7 66.5September 20.8 184.8 149.7 146.0 1.8 35.1 33.0 164.1 46.3 42.0 3.0 1.3 42.9 36.8 74.9October 23.6 205.8 166.7 162.6 2.0 39.0 36.8 182.1 51.9 47.1 3.3 1.5 47.2 40.3 83.1November 24.8 225.8 182.8 178.2 2.2 43.1 40.7 201.0 57.4 52.3 3.9 1.2 51.8 44.3 91.92012 December 22.4 247.0 200.5 194.9 3.0 46.6 44.2 224.6 63.1 57.6 3.2 2.3 59.1 50.3 102.4January 2.3 20.8 16.7 16.2 0.1 4.2 3.7 18.6 5.6 5.2 0.2 0.2 4.8 4.2 8.1Feb r uar y 1.5 3 9 .8 3 1.9 3 1.0 0 .3 7.9 7.1 3 8 .3 10 .6 9 .8 0 .4 0 .4 11.4 9 .8 16 .3March 6.8 60.6 49.0 47.4 0.7 11.6 10.6 53.8 16.2 15.0 0.7 0.5 13.3 10.9 24.42013 April 8.8 81.2 65.6 63.6 0.9 15.6 14.5 72.4 21.5 19.9 0.9 0.7 18.2 15.1 32.756 |


