no. 140 - Banka Qendrore e Republikës së Kosovës
no. 140 - Banka Qendrore e Republikës së Kosovës
no. 140 - Banka Qendrore e Republikës së Kosovës

You also want an ePaper? Increase the reach of your titles
YUMPU automatically turns print PDFs into web optimized ePapers that Google loves.
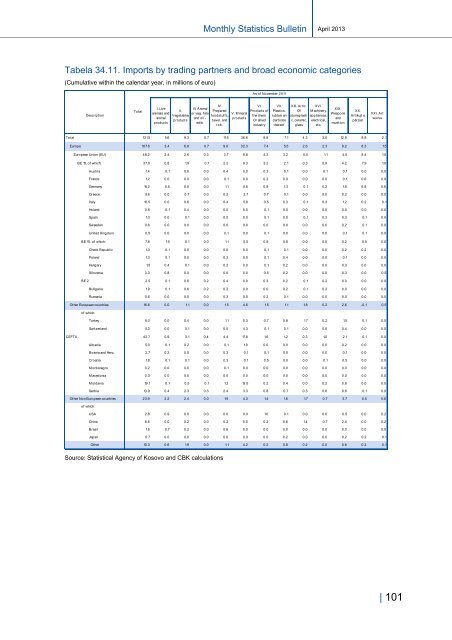
Monthly Statistics BulletinApril 2013Tabela 34.11. Imports by trading partners and broad eco<strong>no</strong>mic categories(Cumulative within the calendar year, in millions of euro)As of November 2011DescriptionTotalI. Liveanimals andanimalproductsII.VegetabkeproductsIII. Animalor veg. fatsand oil -edib.IV.PreparedV. Mineralfoodstuffs,productsbever. andtob.VI.Products ofthe chem.Or alliedindustryVII.Plastics,rubber andarticlesthereofXIII. Artic.Ofstoneplastic, ceramic,glassXVI.Machinery,appliances,elect rical,et c.XIX.Weaponsandmunit ionXX.Artikujt epërzierXXI. ArtworksTotal 131.5 5.6 9.3 0.7 11.5 36.6 8.8 7.1 4.3 3.0 12.9 8.8 2.1Europe 107.6 3.4 6.8 0.7 9.6 32.3 7.4 5.5 2.6 2.3 9.2 8.3 1.5European Union (EU) 48.2 2.4 2.6 0.3 3.7 9.8 4.3 3.2 0.5 1.1 4.5 8.4 1.0BE 15, of which: 37.9 0.8 1.9 0.1 2.2 9.3 3.2 2.1 0.3 0.9 4.2 7.9 1.0Austria 1.4 0.1 0.0 0.0 0.4 0.0 0.3 0.1 0.0 0.1 0.1 0.0 0.0France 1.2 0.0 0.0 0.0 0.1 0.0 0.2 0.0 0.0 0.0 0.1 0.6 0.0Germany 15.2 0.5 0.0 0.0 1.1 0.6 0.9 1.3 0.1 0.2 1.8 6.8 0.6Greece 5.6 0.0 0.7 0.0 0.2 2.7 0.7 0.1 0.0 0.0 0.2 0.0 0.0Italy 10.5 0.0 0.6 0.0 0.4 5.8 0.5 0.3 0.1 0.3 1.2 0.2 0.1Holand 0.8 0.1 0.4 0.0 0.0 0.0 0.1 0.0 0.0 0.0 0.0 0.0 0.0Spain 1.0 0.0 0.1 0.0 0.0 0.0 0.1 0.0 0.1 0.3 0.3 0.1 0.0Sweeden 0.6 0.0 0.0 0.0 0.0 0.0 0.0 0.0 0.0 0.0 0.2 0.1 0.0United Kingdom 0.5 0.0 0.0 0.0 0.1 0.0 0.1 0.0 0.0 0.0 0.1 0.1 0.0BE 10, of which: 7.8 1.5 0.1 0.0 1.1 0.5 0.9 0.8 0.0 0.0 0.2 0.5 0.0Check Republic 1.0 0.1 0.0 0.0 0.0 0.0 0.1 0.1 0.0 0.0 0.2 0.2 0.0Poland 1.3 0.1 0.0 0.0 0.3 0.0 0.1 0.4 0.0 0.0 0.1 0.0 0.0Hungary 1.5 0.4 0.1 0.0 0.2 0.0 0.1 0.2 0.0 0.0 0.3 0.0 0.0Sllovenia 3.3 0.8 0.0 0.0 0.6 0.0 0.5 0.2 0.0 0.0 0.3 0.0 0.5BE 2 2.5 0.1 0.6 0.2 0.4 0.0 0.3 0.2 0.1 0.2 0.0 0.0 0.0Bullgaria 1.9 0.1 0.6 0.2 0.2 0.0 0.0 0.2 0.1 0.2 0.0 0.0 0.0Rumania 0.6 0.0 0.0 0.0 0.3 0.0 0.2 0.1 0.0 0.0 0.0 0.0 0.0Other European countries 16.6 0.0 1.1 0.0 1.5 4.6 1.5 1.1 1.8 0.2 2.6 -0.1 0.5of which:Turkey 9.0 0.0 0.4 0.0 1.1 0.3 0.7 0.9 1.7 0.2 1.5 0.1 0.0Switzerland 5.3 0.0 0.1 0.0 0.0 4.3 0.1 0.1 0.0 0.0 0.4 0.0 0.0CEFTA 42.7 0.9 3.1 0.4 4.4 17.8 1.6 1.2 0.3 1.0 2.1 0.1 0.0Albania 5.0 0.1 0.2 0.0 0.1 1.0 0.0 0.0 0.0 0.0 0.2 0.0 0.0Bosnia and Herz. 2.7 0.2 0.0 0.0 0.3 0.1 0.1 0.0 0.0 0.0 0.1 0.0 0.0Croatia 1.8 0.1 0.1 0.0 0.3 0.1 0.5 0.0 0.0 0.1 0.5 0.0 0.0Montenegro 0.2 0.0 0.0 0.0 0.1 0.0 0.0 0.0 0.0 0.0 0.0 0.0 0.0Macedonia 0.0 0.0 0.0 0.0 0.0 0.0 0.0 0.0 0.0 0.0 0.0 0.0 0.0M oldavia 19.1 0.1 0.5 0.1 1.2 13.5 0.2 0.4 0.0 0.2 0.8 0.0 0.0Serbia 13.9 0.4 2.3 0.3 2.4 3.3 0.8 0.7 0.3 0.6 0.6 0.1 0.0Other Non European countries 23.9 2.2 2.4 0.0 1.9 4.3 1.4 1.6 1.7 0.7 3.7 0.5 0.6of which:USA 2.8 0.9 0.0 0.0 0.0 0.0 1.0 0.1 0.0 0.0 0.5 0.0 0.2China 8.6 0.0 0.2 0.0 0.2 0.0 0.2 0.6 1.4 0.7 2.4 0.0 0.2Brasil 1.6 0.7 0.2 0.0 0.6 0.0 0.0 0.0 0.0 0.0 0.0 0.0 0.0Japan 0.7 0.0 0.0 0.0 0.0 0.0 0.0 0.2 0.0 0.0 0.2 0.2 0.1Other 10.3 0.6 1.9 0.0 1.1 4.2 0.2 0.8 0.2 0.0 0.6 0.2 0.1Source: Statistical Agency of Kosovo and CBK calculations| 101